town of collingwood asset management plan asset management plan.pdf · town of collingwood asset...
TRANSCRIPT

TOWN OF COLLINGWOOD
ASSET MANAGEMENT PLAN
JUNE 24, 2014


Watson & Associates Economists Ltd. H:\Collingwood\2013 Asset Management\Collingwood AM Plan Report FINAL.docx
CONTENTS Page
EXECUTIVE SUMMARY (i)
1. INTRODUCTION 1.1 Overview 1-1 1.2 Plan Development 1-1 1.3 Maintaining the Asset Management Plan 1-2 1.4 Plan Integration 1-3
2. STATE OF LOCAL INFRASTRUCTURE 2.1 Scope and Process 2-1 2.2 Capital Asset Overview 2-1 2.3 Asset Age Analysis 2-5 2.4 Asset Condition 2-6 2.5 Data Accuracy and Completeness 2-8
3. EXPECTED LEVELS OF SERVICE 3.1 Scope and Process 3-1 3.2 Current Levels of Service vs. Expected Levels of Service 3-1 3.3 Level of Service Performance Measures 3-4
4. ASSET MANAGEMENT STRATEGY 4.1 Scope and Process 4-1 4.2 Risk Assessment 4-1 4.3 Priority Identification 4-3 4.4 Long-Term Forecast 4-5 4.5 Procurement Methods 4-9
5. FINANCING STRATEGY 5.1 Scope and Process 5-1 5.2 Historical Results 5-2 5.3 Financing Strategy 5-4 5.4 Funding Shortfall 5-9
6. RECOMMENDATIONS 6-1

Watson & Associates Economists Ltd. H:\Collingwood\2013 Asset Management\Collingwood AM Plan Report FINAL.docx
CONTENTS Page
APPENDICES A DETAILED ASSET INVENTORY A-1 B ASSET MANAGEMENT ASSUMPTIONS B-1 C DATA VERIFICATION AND CONDITION ASSESSMENT POLICY C-1 D LEVEL OF SERVICE IMPACT ANALYSIS D-1 E SCENARIO ANALYSIS – CAPITAL FORECASTS E-1 F TAX SUPPORTED ASSET MANAGEMENT STRATEGY & FINANCING STRATEGY F-1 G WATER ASSET MANAGEMENT STRATEGY & FINANCING STRATEGY G-1 H WASTEWATER ASSET MANAGEMENT STRATEGY & FINANCING STRATEGY H-1

Watson & Associates Economists Ltd. H:\Collingwood\2013 Asset Management\Collingwood AM Plan Report FINAL.docx
EXECUTIVE SUMMARY


(i)
Watson & Associates Economists Ltd. H:\Collingwood\2013 Asset Management\Collingwood AM Plan Report FINAL.docx
EXECUTIVE SUMMARY
This report contains the Asset Management Plan for the Town of Collingwood (Town) and has
been organized as follows:
Chapter 1: Introduction;
Chapter 2: State of Local Infrastructure;
Chapter 3: Expected Levels of Service;
Chapter 4: Asset Management Strategy;
Chapter 5: Financing Strategy; and
Chapter 6: Recommendations.
The “state of local infrastructure” chapter provides an overview of the capital assets owned by the
Town. This includes detailed information on the Town’s asset inventory, including asset
attributes, accounting valuations, replacement costs, useful life, age and asset condition. This
information provides the foundation for other sections of the asset management plan.
“Expected levels of service” compares the current level of service provided by the Town to the
level of service determined to be expected in each area. This analysis combines both
descriptions/comments as well as performance measures in establishing service levels.
The “asset management strategy” provides a long term operating and capital forecast for asset
related costs, indicating the requirements for maintaining, rehabilitating, replacing/disposing and
expanding the Town’s assets, while moving towards the specified expected levels of service
identified above. The goal of the asset management strategy is to have the Town in (or moving
towards) a sustainable asset management position over the forecast period.
The “financing strategy” identifies a funding plan for the asset management strategy, including a
review of historical results and recommendations with respect to the required amounts and types
of funding (revenue) annually. Also, any infrastructure funding deficits/shortfalls are identified and
recommendations are made regarding potential approaches to reduce and mitigate the shortfall
over the forecast period.
Overall, this asset management plan is a tool to be used by Town staff for capital and financial
decision making. It can be tied to various existing reports (such as the Town’s budget, official
plan and strategic planning reports) to ensure the asset management plan can be updated to
reflect any changes in Town priorities.

Watson & Associates Economists Ltd. H:\Collingwood\2013 Asset Management\Collingwood AM Plan Report FINAL.docx
1. INTRODUCTION


1-1
Watson & Associates Economists Ltd. H:\Collingwood\2013 Asset Management\Collingwood AM Plan Report FINAL.docx
1. INTRODUCTION
1.1 Overview
The main objective of an asset management plan is to use a Town’s best available information to
develop a comprehensive long term plan for capital assets. In addition, the plan should provide
sound methodologies and support in order to improve the accuracy of the plan on a go forward
basis.
Watson & Associates Economists Ltd. (Watson) was retained by the Town to prepare an asset
management plan. This plan is intended to be a tool for Town staff to use during various decision
making processes, including the annual budgeting process and capital grant application
processes. This plan will serve as a road map for sustainable infrastructure planning going
forward.
The following assets are included in this asset management plan:
Road related (roads, bridges, sidewalks, traffic signals and street lights)
Stormwater mains;
Buildings;
Land Improvements;
Fleet;
Machinery and Equipment; and
Water and Wastewater Infrastructure (mains and facilities).
The Town’s goals and objectives with respect to their capital assets relate to the level of service
being provided to Town residents. Services should be provided at expected levels, as defined
within this asset management plan. Town infrastructure and other capital assets should be
maintained at condition levels that provides a safe and functional environment for its residents.
Therefore, the asset management plan and its implementation will be evaluated based on the
Town’s ability to meet these goals and objectives.
1.2 Plan Development
The asset management plan process developed a program that leverages the Town’s asset
database information, staff input and asset management principles.

1-2
Watson & Associates Economists Ltd. H:\Collingwood\2013 Asset Management\Collingwood AM Plan Report FINAL.docx
The development of the Town’s asset management plan was based on the steps summarized
below:
1) Develop a complete listing of capital assets to be included in the plan, including attributes
such as size/material type, useful life, age, accounting valuation and current valuation.
Update current valuation, where required, using applicable inflationary indices.
2) Assess current condition of the assets, based on a combination of existing Town reports
and an age analysis.
3) Assess the risk of asset failure for each asset, based on determining the probability of
each asset failing, as well as the consequence of the asset failing. This risk analysis
identifies priority projects for inclusion in the asset management plan, as well as asset risk
levels that require mitigation.
4) Determine and document current levels of service, as well as expected levels of service,
based on discussions with Town staff.
5) Prepare an asset management strategy (i.e. operating and capital forecast) based on the
asset inventory, identified priorities, forecast scenarios, and level of service analysis
discussed above.
6) Determine a financing strategy to support asset management strategy, thus determining
how the operating and capital related expenditure forecast will be funded over the period.
7) Prepare a comprehensive Asset Management Plan final report.
1.3 Maintaining the Asset Management Plan
The asset management plan should be updated as the capital needs and priorities of the Town
change. This can be accomplished in conjunction with the Town’s budget process. Town staff
will have the tools available to perform updates to the plan when needed.
When updating the asset management plan, note that the state of local infrastructure, expected
levels of service, asset management strategy and financing strategy are integrated and impact
each other. Looking at these components in reverse order, the financing strategy outlines how
the asset management strategy will be funded. The asset management strategy illustrates the
costs required to maintain expected levels of service at a sustainable level. The expected levels
of service component summarizes and links each service area to specific assets contained in the
state of local infrastructure section and thus determines how these assets will be used to provide
expected service levels.
While this report covers a forecast period of 20 years, for tax supported assets, the full lifecycle
of the Town’s assets was considered in the calculations. It is suggested that more focus and
attention be put on the first 5 years of the asset management plan, to ensure accurate capital
planning in the short term.

1-3
Watson & Associates Economists Ltd. H:\Collingwood\2013 Asset Management\Collingwood AM Plan Report FINAL.docx
1.4 Plan Integration
The municipal environment is a continually changing and demanding environment when it comes
to legislation and other responsibilities. Integrating the asset management plan with the Town’s
budget process as well as Public Sector Accounting Board Section 3150 (PSAB 3150)
requirements can make updates in all three areas more efficient.
With respect to integrating the Town’s budget process with asset management planning, both
require a projection of capital and operating costs of a future period. The budget outlines total
operating and capital requirements of the Town, while the asset management plan focuses in on
specific asset related requirements. With this link to the annual budget, the budget update
process can become an asset management plan update process.
Both asset management and PSAB 3150 require a complete and accurate asset inventory. The
significant difference between the two lies in valuation approaches; PSAB 3150 requires historical
cost valuation, while asset management requires future replacement cost valuation. Using a
single asset inventory containing both valuation methods is an effective approach to maintaining
the Town’s asset data.
Further integration into other Town financial/planning documents would assist in ensuring the
ongoing accuracy of the asset management plan, as well as the integrated financial/planning
documents. The asset management plan has been developed to allow linkages to documents
such as:
Development Charge Background Study;
Official Plan;
Water and Wastewater Rate Study;
Strategic Planning Reports;
Fiscal Impact/Operating Studies; and
Insurance valuations and records.


Watson & Associates Economists Ltd. H:\Collingwood\2013 Asset Management\Collingwood AM Plan Report FINAL.docx
2. STATE OF LOCAL INFRASTRUCTURE


2-1
Watson & Associates Economists Ltd. H:\Collingwood\2013 Asset Management\Collingwood AM Plan Report FINAL.docx
2. STATE OF LOCAL INFRASTRUCTURE
2.1 Scope and Process
This section of the plan provides an opportunity to develop a greater understanding of the capital
assets owned by the Town. The state of local infrastructure analysis includes:
An asset database documenting asset types, sub-types including quantities, materials and
other similar asset attributes;
Financial accounting valuation (where available);
Replacement cost valuation;
Asset age distribution analysis and asset age as a proportion of expected useful life;
Asset condition information;
Data Verification and Asset Condition policies; and
Documentation of assumptions made in creating the asset inventory.
The Town has a detailed inventory listing, created for both capital planning and PSAB 3150
purposes. This asset inventory is updated annually and was used as a starting point in fulfilling
the requirements of this report. This inventory provides current financial account valuations (i.e.
historical cost, accumulated amortization and net book value) as well as attributes such as useful
life, age, and replacement cost.
The following data and reports were used to supplement the Town’s asset inventory during this
process:
a) 2014 Water and Wastewater Rate Study (2014 Rate Study);
b) 2009 Development Charge Study Final Report;
c) Road Condition Data; and
d) Discussions with Town staff.
2.2 Capital Asset Overview
The Town presently owns and manages tax supported capital assets with a 2013 replacement
value of approximately $246.4 million (excluding land assets as they are not included in this plan).
Table 2-1 outlines the breakdown of these totals and Figure 2-1 illustrates the breakdown.

2-2
Watson & Associates Economists Ltd. H:\Collingwood\2013 Asset Management\Collingwood AM Plan Report FINAL.docx
Table 2-1
2013 Tax Supported Assets
Figure 2-1
2013 Tax Supported Assets Distribution
Based on Replacement Cost
Land Improvements 16,217,954 7,555,663 8,662,291 10,644,574 Buildings 39,761,718 5,954,942 33,806,776 45,475,477 Equipment 4,958,121 2,742,878 2,215,243 2,192,465 Fleet 9,517,049 5,366,043 4,151,006 6,575,827 Transportation Assets 64,060,997 24,834,841 39,226,156 153,548,304 Environmental Services - Storm 13,063,285 3,586,740 9,476,545 25,147,844 Other Infrastructure 3,992,058 1,375,577 2,616,481 2,815,984
Total Capital Assets (Tax) 151,571,183$ 51,416,685$ 100,154,498$ 246,400,475$
Asset TypeHistorical Cost
12/31/2012
Accumulated Amortization
13/31/2012
Net Book Value
12/31/2012
Replacement Cost
2013$
2-3
Watson & Associates Economists Ltd. H:\Collingwood\2013 Asset Management\Collingwood AM Plan Report FINAL.docx
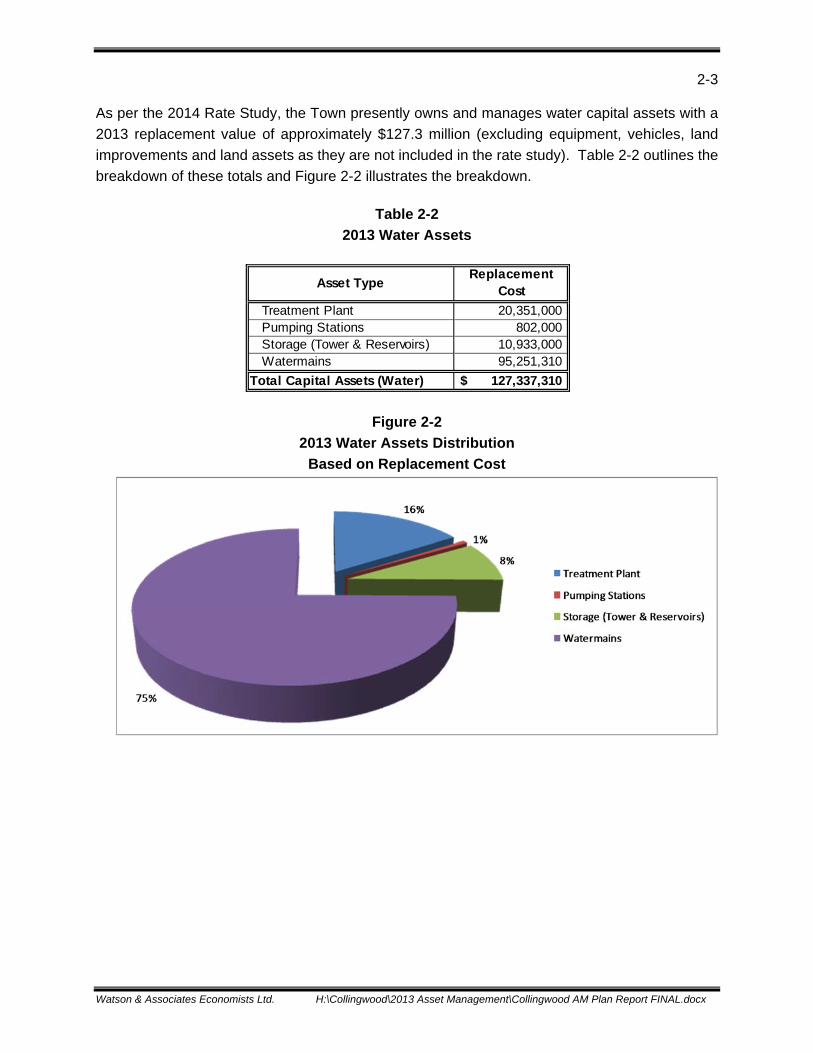
As per the 2014 Rate Study, the Town presently owns and manages water capital assets with a
2013 replacement value of approximately $127.3 million (excluding equipment, vehicles, land
improvements and land assets as they are not included in the rate study). Table 2-2 outlines the
breakdown of these totals and Figure 2-2 illustrates the breakdown.
Table 2-2
2013 Water Assets
Figure 2-2
2013 Water Assets Distribution
Based on Replacement Cost
Treatment Plant 20,351,000 Pumping Stations 802,000 Storage (Tower & Reservoirs) 10,933,000 Watermains 95,251,310
Total Capital Assets (Water) 127,337,310$
Replacement Cost
Asset Type

2-4
Watson & Associates Economists Ltd. H:\Collingwood\2013 Asset Management\Collingwood AM Plan Report FINAL.docx
As per the 2014 Rate Study, the Town presently owns and manages wastewater capital assets
with a 2013 replacement value of approximately $200.2 million (excluding equipment, vehicles,
land improvements and land assets as they are not included in the rate study). Table 2-3 outlines
the breakdown of these totals and Figure 2-3 illustrates the breakdown.
Table 2-3
2013 Wastewater Assets
Figure 2-3
2013 Wastewater Assets Distribution
Based on Replacement Cost
Table 2-1 also shows the Town’s financial accounting valuation summary by tax supported asset
type. Since 2009, the Town has been required under PSAB 3150 to maintain asset listings
complete with historical cost (i.e. the original cost to purchase or construct an asset), accumulated
amotization and net book value. These values are reported on the Town’s audited financial
statements each year.
The detailed capital asset inventory is contained in Appendix A. Assumptions pertaining to the
asset inventory were documented as part of the asset management process are shown in
Appendix B.
Treatment Plant 68,800,000 Pumping Stations 6,544,000 Sanitary Sewers 124,854,793
Total Capital Assets (Wastewater) 200,198,793$
Asset TypeReplacement
Cost

2-5
Watson & Associates Economists Ltd. H:\Collingwood\2013 Asset Management\Collingwood AM Plan Report FINAL.docx
2.3 Asset Age Analysis
Each asset is tracked based on estimated total useful life and remaining service life. Using this
information, an age analysis of the Town’s assets can assist in identifying potential areas of focus
for the asset management plan.
Table 2-4 provides an age analysis summary, including the weighted (based on replacement cost)
average useful life and weighted average remaining useful life for all of the tax supported assets
included in this plan. This analysis can assist in identifying potential short-term priorities within
specific asset areas.
Table 2-4
Asset Age Analysis
Infrastructure - Transportation and Environmental
AM Useful LifeAM Remaining
Life% AM Useful
Life Remaining
TransportationRoad Base 69 22 32.2%Road Surface 31 13 42.5%Bridges 56 19 34.1%Sidewalks 75 48 63.6%Traffic Signals 25 15 58.9%Streetlights 75 62 83.0%
EnvironmentalStorm Sewer 75 51 68.1%
OtherOther Infrastructure 20 12 59.8%
Buildings and Land Improvements
AM Useful LifeAM Remaining
Life% AM Useful
Life Remaining
BuildingsGeneral Government 64 42 65.9%Protection of Persons and Property 41 36 87.3%Recreation and Culture 70 60 85.9%Transportation 71 59 83.1%
Land ImprovementsRecreation & Culture 29 20 68.2%Transportation 20 7 33.0%Protective Services 20 0 0.0%
Asset Type
Weighted Average (rounded)
Weighted Average (rounded)
Asset Type

2-6
Watson & Associates Economists Ltd. H:\Collingwood\2013 Asset Management\Collingwood AM Plan Report FINAL.docx
Total useful life and remaining service life for each capital asset is documented in Appendix A.
While this analysis can be useful in looking at the overall age characteristics of specific asset
areas, asset condition (see below) will assist in providing a more accurate assessment of assets
reaching the end of their useful life.
2.4 Asset Condition
Including condition assessments in the asset management plan provides for a higher level of
accuracy than simply relying on useful life assumptions, especially when it comes to older, highly
used or more financially significant assets. Condition assessments can provide more realistic
estimates of remaining service life, which can then be used to establish rehabilitation or
replacement schedules.
Condition ratings were derived from a combination of available studies (listed in section 2.1), data
provided by staff and an age analysis (where condition information was unavailable). A numerical
rating was determined from “0” to “5”, (with “5” being considered in very good condition). A high
level summary of the weighted average condition in each tax supported asset category is as
follows:
Fleet and Equipment
AM Useful LifeAM Remaining
Life% AM Useful
Life Remaining
FleetGeneral Government 8 8 100.0%Protection 13 8 62.6%Recreation & Culture 9 2 27.9%Transportation 11 7 64.2%
EquipmentGeneral Government 10 4 42.8%Planning & Development 5 0 0.0%Protection of Property and Persons 10 7 65.7%Recreation & Culture 12 8 66.0%Transportation 10 4 40.0%
Asset Type
Weighted Average (rounded)

2-7
Watson & Associates Economists Ltd. H:\Collingwood\2013 Asset Management\Collingwood AM Plan Report FINAL.docx
Table 2-5
Weighted Average Condition by Asset Category
Infrastructure - Transportation and Environmental
TransportationRoad Base 2Road Surface 5Bridges 1Sidewalks 3Traffic Signals 3Streetlights 4
EnvironmentalStorm Sewer 3
OtherOther Infrastructure 3
Buildings and Land Improvements
BuildingsGeneral Government 2Protection of Persons and Property 4Recreation and Culture 4Transportation 4
Land ImprovementsRecreation & Culture 3Transportation 2Protective Services 0
Fleet and Equipment
FleetGeneral Government 5Protection 3Recreation & Culture 1Transportation 4
EquipmentGeneral Government 2Planning & Development 0Protection of Property and Persons 3Recreation & Culture 3Transportation 2
Asset TypeWeighted Condition
Weighted Condition
Asset Type
Asset TypeWeighted Condition

2-8
Watson & Associates Economists Ltd. H:\Collingwood\2013 Asset Management\Collingwood AM Plan Report FINAL.docx
Further discussion of condition assessments will take place in Chapter 4 when assessing asset
risk and identifying asset priorities. Furthermore, detailed asset conditions are documented in
Appendix A to this report. It is recommended that these condition assessments be updated as
new information becomes available. Please see section 2.5 for further details.
2.5 Data Accuracy and Completeness
An important element of this asset management plan is ensuring that tools and procedures are in
place to maintain accuracy and completeness of the asset data and calculations moving forward.
As time passes, assets are used, maintained, improved, disposed of, and replaced. All of these
lifecycle events can trigger changes to the asset database used within the asset management
plan. Therefore, tools and procedures are essential to ensure the asset data remains accurate
and complete. Please refer to Appendix C to this report for the “Data Verification and Condition
Assessment Policy” for the Town. This policy illustrates how the asset data will be updated and
verified going forward. This includes the timing of condition assessments for each asset area, as
well as what should be included within the condition assessment procedures.

Watson & Associates Economists Ltd. H:\Collingwood\2013 Asset Management\Collingwood AM Plan Report FINAL.docx
3. EXPECTED LEVELS OF SERVICE


3-1
Watson & Associates Economists Ltd. H:\Collingwood\2013 Asset Management\Collingwood AM Plan Report FINAL.docx
3. EXPECTED LEVELS OF SERVICE
3.1 Scope and Process
A level of service (LOS) analysis gives the Town an opportunity to document the level of service
that is currently being provided and compare it to the level of service that is expected. This can
be done through a review of current practices and procedures, an examination of trends or issues
facing the Town, or through an analysis of performance measures and targets that staff can use
to measure performance.
Expected LOS can be impacted by a number of factors, including:
Legislative requirements;
Strategic planning goals and objectives;
Resident expectations;
Council or Town staff expectations; and
Financial or resource constraints.
The previous task of determining the state of the Town’s local infrastructure establishes the asset
inventory and condition, as well as asset management policies and principles to guide the
refinement and upkeep of asset infrastructure. The LOS analysis will utilize this information and
factors in the impact of asset service level targets. It is important to document an expected LOS
that is realistic to the Town. It is common to strive for the highest LOS, however these service
levels usually come at a cost. It is also helpful to consider the risk associated with a certain LOS.
Therefore, expected LOS should be determined in a way that balances both level of investment
and associated risk to the Town.
3.2 Current Levels of Service versus Expected Levels of Service
The Town’s current LOS has resulted in the current state of infrastructure discussed in chapter 2.
The current LOS also relates to the risk assessment discussed in later report sections. Regarding
the cost of the current LOS, the Town has established an operating and capital budget for the
current year that includes the cost of providing this LOS to residents.
Therefore in moving from the current LOS to an expected LOS, consideration has to be made for
the associated cost (or impact on the Town’s current budget). The table below outlines broad
LOS descriptions (both current and expected LOS). This analysis was documented through
discussions with Town staff.

3-2
Watson & Associates Economists Ltd. H:\Collingwood\2013 Asset Management\Collingwood AM Plan Report FINAL.docx
Table 3-1
Level of Service Analysis
Roads & Bridges
Current Expected
Public WorksMeet "Minimum Maintenance Standards" as defined by Ontario Regulation 239/02.
Meet "Minimum Maintenance Standards" as defined by Ontario Regulation 239/02.
Public Works Reactive storm sewer maintenance. Proactive storm sewer maintenance.
Public WorksBridge inspections (i.e. using OSIM reports) required every 2 years.
Bridge inspections (i.e. using OSIM reports) required every 2 years. Implement recommended maintenance and rehab from inspection reports.
Public Works Ad hoc road resurfacing program.Roads condition rating: If below 80, include resurface in short to med capital plan.
Public Works Ad hoc crack sealing program.Implement road programs: crack sealing, microsurfacing programs.
Public WorksDetailed roads condition assessments every 5 years. Staff assessments annually.
Detailed roads condition assessments every 5 years. Staff assessments annually.
Public Works N/A Implement LED technology (streetlights).
Buildings
Current Expected
BuildingsBuildings - Meet Legislative requirements (fire code, building code, etc.)
Buildings - Meet Legislative requirements (fire code, building code, etc.)
BuildingsAccessibilitly requirements met in some buildings.
Meet all accessibility requirements (based on a priority basis).
BuildingsBuildings - Provide safe and functional buildings for community use.
Buildings - Provide safe and functional buildings for community use.
Buildings Maintenance: 30% predictive, 70% reactive.Maintenance: 60% predictive, 40% reactive. Potentially consolidate building maintenance accounts, where feasible.
BuildingsCondition assessments: Some completed, as needed. Minor inspections by Town staff.
Condition assessments: Complete assessment of major/complex buildings every 5 years. Annual (minor) inspections by Town staff.
BuildingsArena: HVAC and electrical assessment annually. Staff inspection and fire prevention monthly.
Arena: HVAC and electrical assessment annually. Staff inspection and fire prevention monthly.
BuildingsCreate a business plan to determine capital needs.
Library
Current Expected
LibraryMaintain an updated collections based on Board policies.
Maintain an updated collections based on Board policies.
Library Meet Ontario Public Library Guidelines. Meet Ontario Public Library Guidelines.
LibraryKeep up with technology expectations (i.e. online collections, tablets, etc.).
Keep up with technology expectations (i.e. online collections, tablets, etc.).
Library N/AImplement a public computer replacement program.
Library N/AUpdate the Library Strategic Plan (includes a review of level of service).
Department
Level of Service Description
Department
Level of Service Description
Department
Level of Service Description

3-3
Watson & Associates Economists Ltd. H:\Collingwood\2013 Asset Management\Collingwood AM Plan Report FINAL.docx
Please refer to Appendix D of this report for a table summarizing the estimated budget impacts
associated with implementing the expected LOS over the 20 year forecast period. This impact
analysis will be factored into the asset management strategy discussed in chapter 4 of this report.
Parks & Recreation
Current Expected
Parks & Recreation Meet all legislative requirements. Meet all legislative requirements.
Parks & Recreation Provide responsible park maintenance standards.Provide responsible park maintenance standards, including proactive park maintenance.
Parks & Recreation N/ACondition assessments on major/complex assets as needed.
Parks & Recreation N/AParks Management Strategy, Park Land Acqusition Strategy, Improve Development Standard (i.e. Parks Master Plan).
Parks & RecreationTrails - Provide safe/accessible/maintained trails for the community based on Town standards. Linkages to neighbourhoods and destinations.
Trails - Provide safe/accessible/maintained trails for the community based on Town standards. Linkages to neighbourhoods and destinations. Improve Linkages with other external
iti
Parks & RecreationPedestrian Bridges: Inspection every 2 years. Complete maintenance/rehabilitation on a priority basis.
Pedestrian Bridges: Inspection every 2 years. Follow recommended maintenance/rehabilitation.
Parks & Recreation N/A Fleet - Replace based on useful life estimates.
Parks & RecreationPermanent washrooms in most "community" level parks.
Permanent washrooms in all "community" level parks.
Parks & Recreation N/ATrack utilization percentages for arenas, harbour and sports fields.
Fleet
Current Expected
FleetMaintenance: Predictive approach. Inspections done as part of routine service appointments.
Implement a Fleet Management System. Standardize fleet maintenance.
Fire
Current Expected
Fire Level B medical response. Level A medical response (6 min response).
FireMinimum fire prevention public eduction (mostly enforcement & inspection).
Increased fire prevention public education, continue enforcement & inspection.
Fire Meet all legislative requirements. Meet all legislative requirements.
Fire N/A Complete a Fire Master Plan.
FireProactive asset maintenance procedures (95 % in house).
Proactive asset maintenance procedures (95 % in house).
Fire Maintain records on all fire related activities. Maintain records on all fire related activities.
Department
Level of Service Description
Department
Level of Service Description
Department
Level of Service Description

3-4
Watson & Associates Economists Ltd. H:\Collingwood\2013 Asset Management\Collingwood AM Plan Report FINAL.docx
3.3 Level of Service Performance Measures
As mentioned above, using performance measures in the LOS review can also be helpful in
measuring the Town’s goals and objectives when it comes to asset management. The Town
currently tracks specific performance measures as part of the Municipal Performance
Measurement Program (MPMP) which the province has in place as part of the annual Financial
Information Return (FIR) submission. The FIR provides the annual financial results of the Town,
while the MPMP provides an evaluation of the Town’s “performance”. The following table
provides a summary of the specific MPMPs relating to capital asset effectiveness.
Table 3-2
Performance Measures Analysis
The Town will continue to calculate and monitor these performance measures, both for MPMP
and asset management purposes. As the Town’s asset management plan evolves over time,
new performance measures can be introduced to further measure the LOS being provided in each
service area.
2011 2012 2013 Goal
FireBuildings, Equipment,
VehiclesResidential fire civilian injuries
per 1,000 persons0.0520 - Not yet available Minimize
FireBuildings, Equipment,
VehiclesResidential fire civilian fatalities
per 1,000 persons0.1040 - Not yet available Minimize
FireBuildings, Equipment,
VehiclesNumber of residential structural
fires per 1,000 households1.7770 1.0230 Not yet available Minimize
PoliceBuildings, Equipment,
VehiclesTotal crime rate per 1,000
persons60.1320 59.3000 Not yet available Minimize
Transportation RoadsPercentage of paved lane Km where condition is rated as
good to very good89.20% 93.60% Not yet available Maximize
Transportation Bridges & CulvertsPercentage of bridges &
culverts where condition is rated as good to very good
100.00% 70.80% Not yet available Maximize
Transportation RoadsPercentage of winter events
where response met or exceeded local service levels
100.00% 100.00% Not yet available Maximize
Wastewater Wastewater MainsNumber of wastewater main
backups per 100 KM of mains4.9020 7.6923 Not yet available Minimize
Wastewater BuildingsPercentage of wastewater
estimated to have by-passed treatment
0.00% 0.00% Not yet available Minimize
Water Water mainsWeighted # days when a boil
water advisory was issued- - Not yet available Minimize
Water Water mainsNumber of water main breaks
per 100 KM of pipe3.8462 5.6604 Not yet available Minimize
Recreation & Culture BuildingsParticipant hours for recreation
programs per 1,000 persons10.9140 78.2700 Not yet available
Maintain or Increase
Library Buildings Total library uses per person 40.5030 30.9730 Not yet availableMaintain or
Increase
Department AssetsPerformance Measure
Description
Historical Performance

Watson & Associates Economists Ltd. H:\Collingwood\2013 Asset Management\Collingwood AM Plan Report FINAL.docx
4. ASSET MANAGEMENT STRATEGY

4-1
Watson & Associates Economists Ltd. H:\Collingwood\2013 Asset Management\Collingwood AM Plan Report FINAL.docx
4. ASSET MANAGEMENT STRATEGY
4.1 Scope and Process
The asset management strategy provides the recommended course of actions required to
maintain (or move towards) a sustainable asset funding position while delivering the expected
levels of service discussed in the previous chapter. The course of actions, when combined
together, form a long-term operating and capital forecast that includes:
a) Non-infrastructure solutions: reduce costs and/or extend expected useful life estimates;
b) Maintenance activities: regularly scheduled activities to maintain existing useful life levels,
or repairs needed due to unplanned events;
c) Renewal/Rehabilitation: significant repairs or maintenance planned to increase the useful
life of assets;
d) Replacement/Disposal: complete disposal and replacement of assets, when renewal or
rehabilitation is no longer an option; and
e) Expansion: given planned growth as outlined in the Town’s Development Charge
Background Study, other expansion or due to the introduction of new services.
Priority identification becomes a critical process during the asset management strategy
development. Priorities have been determined based on assessment of the overall risk of asset
failure, which is determined by looking at both the probability of an asset failing, as well as the
consequences of failure. The consequences of the Town not meeting desired levels of service
must also be considered in determining risk. As discussed in chapter 3, moving to expected levels
of service results in both operating and capital budget impacts over the 20 year forecast period.
This has to be taken into consideration, with the overall objective of reaching sustainable levels
while mitigating risk.
4.2 Risk Assessment
The risk of an asset failing is defined by the following calculation:
Probability of failure has been linked to the condition assessment for each of the assets, assuming
that an asset with a condition rating of “5” would have a “rare” probability of failure. The following
table outlines the probability factor tied to each condition rating:
Risk of Asset Failure = Probability of Failure X Consequence of Failure

4-2
Watson & Associates Economists Ltd. H:\Collingwood\2013 Asset Management\Collingwood AM Plan Report FINAL.docx
Table 4-1
Probability of Failure Matrix
Consequence of failure has been determined by examining each asset type separately.
Consequence refers to the impact on the Town if a particular asset were to fail. Types of impacts
include the following:
Cost Impacts: the cost of failure to the Town (i.e. capital replacement, rehabilitation, fines
& penalties, damages, etc);
Social impacts: potential injury or death to residents or Town staff;
Environmental impacts: the impact of the asset failure on the environment;
Service delivery impacts: the impact of the asset failure on the Town’s ability to provide
services at desired levels; and
Location impacts: the varying impact of asset failure based on the asset’s location within
the Town.
Each type of impact was discussed with Town staff. Consequence of failure was determined by
using the information contained in Table 4-2 for each asset type with the exception of the
following, road surface where condition was provided by Town staff.
Levels of impact were numerically calculated, for the assets noted above, then converted to a
criticality rating ranging from “catastrophic” to “insignificant”.
With both probability of failure and consequence of failure documented, total risk of asset failure
was determined using the matrix contained in Table 4-3. Total risk has been classified under the
following categories:
Extreme Risk (E): risk well beyond acceptable levels;
High Risk (H): risk beyond acceptable levels;
Medium Risk (M): risk at acceptable levels, monitoring required to ensure risk does not
become high; and
Low Risk (L): risk at or below acceptable levels.
Condition Rating
Probability of Failure
5 Rare4 Unlikely3 Possible2 Possible1 Likely
0 Almost Certain

4-3
Watson & Associates Economists Ltd. H:\Collingwood\2013 Asset Management\Collingwood AM Plan Report FINAL.docx
Table 4-2
Consequence of Failure Matrix
Table 4-3
Total Risk of Asset Failure Matrix
Risk levels can be reduced or mitigated through planned maintenance, rehabilitation and/or
replacement. An objective of this asset management plan is to reduce risk levels where they are
deemed to be too high, as well as ensure assets are maintained in a way that maintains risk at
acceptable levels.
Please refer to Appendix A for the detailed risk assessment for each of the Town’s capital assets.
It is recommended that this risk assessment be refined further by Town staff in the future.
4.3 Priority Identification
Through discussions with Town staff and review of the asset risk of failure assessment, the
following assets/categories were identified as being priorities of the Town:
Consequence of Failure
Cost Social Environmental Service Delivery
InsignificantNegligible or
Insignificant Cost No injury No Impact No Interruptions
MinorSmall/Minor Cost -
within Budget Allocations.
Minor Injury Short-term/Minor Impact - Fixable
Minor Interruptions
ModerateConsiderable Cost -
Requires Revisions to Budget
Moderate Injury Medium-term Impact -
Fixable Moderate
Interruptions
MajorSubstantial Cost - Multi-year Budget
Impacts Major Injury
Long-term Impact - Fixable
Significant Interruptions
CatastrophicSignificant Cost -
Difficult to Recover Death, Serious Injury
Long-term Impact - Permanent
Major Interruptions
Insignificant Minor Moderate Major Catastrophic
Rare L L M M HUnlikely L M M M HPossible L M M H E
Likely M M H H E
Almost Certain M H H E E
Probability of FailureConsequence of Failure

4-4
Watson & Associates Economists Ltd. H:\Collingwood\2013 Asset Management\Collingwood AM Plan Report FINAL.docx
Table 4-4
Priorities Based on Asset Risk
Area / Category Description Total Risk Planned Action
Buildings Backup Generator (Town Hall) HighIncluded in
short-term capital
Buildings Backup Generator (Public Works) HighIncluded in
short-term capital
BuildingsTown Hall - Roof Replacement and Refurbishment
HighIncluded in
short-term capital
Buildings Annex - Roof Replacement HighIncluded in
short-term capital
Buildings Police - Cell Upgrade HighIncluded in
short-term capital
BuildingsCurling Club - Brick and Drain Rehabilitation
HighIncluded in
short-term capital
Equipment IT - Workstation Replacement HighIncluded in
short-term capital
Equipment Playground Replacements (Various) HighIncluded in
short-term capital
Equipment"Pay and Park" Machine Replacements (Multiple)
HighIncluded in
short-term capital
FleetParks and Recreation - Truck Replacement
HighIncluded in
short-term capital
Fleet Utility Terrain Vehicle Replacement HighIncluded in
short-term capital
FleetPublic Works Vehicle Replacement (multiple)
HighIncluded in
short-term capital
Fleet Bus Replacement HighIncluded in
short-term capital
Land Improvements Fisher Field Improvements HighIncluded in
short-term capital
Land Improvements Heritage Park Improvements HighIncluded in
short-term capital
Roads Asphalt Resurfacing (Various) HighIncluded in
short-term capital
Roads Hume St Widening HighIncluded in
short-term capital
Roads Huron/First/Huronontario Intersection HighIncluded in
short-term capital
Roads High St Widening HighIncluded in
short-term capital
Roads Hwy 26 West - Paving HighIncluded in
short-term capital
Roads Highway 26 E Widening HighIncluded in
short-term capital
Roads Mountain Road Upgrade HighIncluded in
short-term capital
Roads 10th Line Urbanization HighIncluded in
short-term capital

4-5
Watson & Associates Economists Ltd. H:\Collingwood\2013 Asset Management\Collingwood AM Plan Report FINAL.docx
4.4 Long-term Forecast
For many years, lifecycle costing has been used in the field of maintenance engineering and to
evaluate the advantages of using alternative materials in construction or production design. The
method has gained wider acceptance and use recently in the management of capital assets. By
definition, lifecycle costs are all the costs which are incurred during the lifecycle of a capital asset,
from the time it is purchased or constructed, to the time it is taken out of service for disposal. The
stages which an asset goes through in its lifecycle are as follows:
Area / Category Description Total Risk Planned Action
Sidewalks Sidewalk Repairs (Various) HighIncluded in
short-term capital
Bridges Fourth and Fifth Street Bridges HighIncluded in
short-term capital
Stormwater Industrial Pond Retrofit HighIncluded in
short-term capital
Wastewater Sewer main Renewal (Various) HighIncluded in
short-term capital
WastewaterSewer Grouting and Manhole Repairs
HighIncluded in
short-term capital
Wastewater Digester Gas Boiler Replacement HighIncluded in
short-term capital
Wastewater Replace Brick at WWTP HighIncluded in
short-term capital
Water Valve Replacements (Multiple) HighIncluded in
short-term capital
Water In Ground Reservoir Rehabilitation HighIncluded in
short-term capital
Water Water Treatment Plant Rehabilitation HighIncluded in
short-term capital

4-6
Watson & Associates Economists Ltd. H:\Collingwood\2013 Asset Management\Collingwood AM Plan Report FINAL.docx
Figure 4-1
Asset Lifecycle Diagram
In defining the long-term forecast for the Town’s asset management strategy, costs incurred
through an asset’s lifecycle were considered and documented.
Asset Replacement Analysis
In forecasting the Town’s asset replacement needs (excluding growth related needs),
comparisons were made between the following scenarios:
Scenario 1: Replacement forecast based on “PSAB 3150 Asset Data”
o Utilizing the PSAB 3150 inventory, year of installation and estimated service life, the
replacement of each asset was projected.
Scenario 2: Replacement forecast based on “Adjusted PSAB 3150 Asset Data”;
o Adjustments were made to the asset data (i.e. assets that are not to be replaced were
removed from the calculations) and estimated useful lives were refined, based on
information provided by Town staff, to better predict the amount and timing of
replacement.
Scenario 3: Replacement forecast based on “Phased-in Replacement”;
o The results of Scenario 2 were refined to allow for a gradual increase in capital over
the forecast period, resulting in a smoothed impact scenario.
Scenario 1: Replacement forecast based on “PSAB 3150 Asset Data”
The replacement forecast based on the PSAB 3150 asset data provides a snapshot of assets at
or nearing the end of their useful lives from a purely financial accounting perspective.
Figure 4-2 below shows the forecast over a 10 year period, where approximately $69.97 million
(replacement cost) in tax supported capital assets are showing as “immediate needs”. For this
scenario, this simply means that these assets have reached the end of their accounting useful
4-7
Watson & Associates Economists Ltd. H:\Collingwood\2013 Asset Management\Collingwood AM Plan Report FINAL.docx
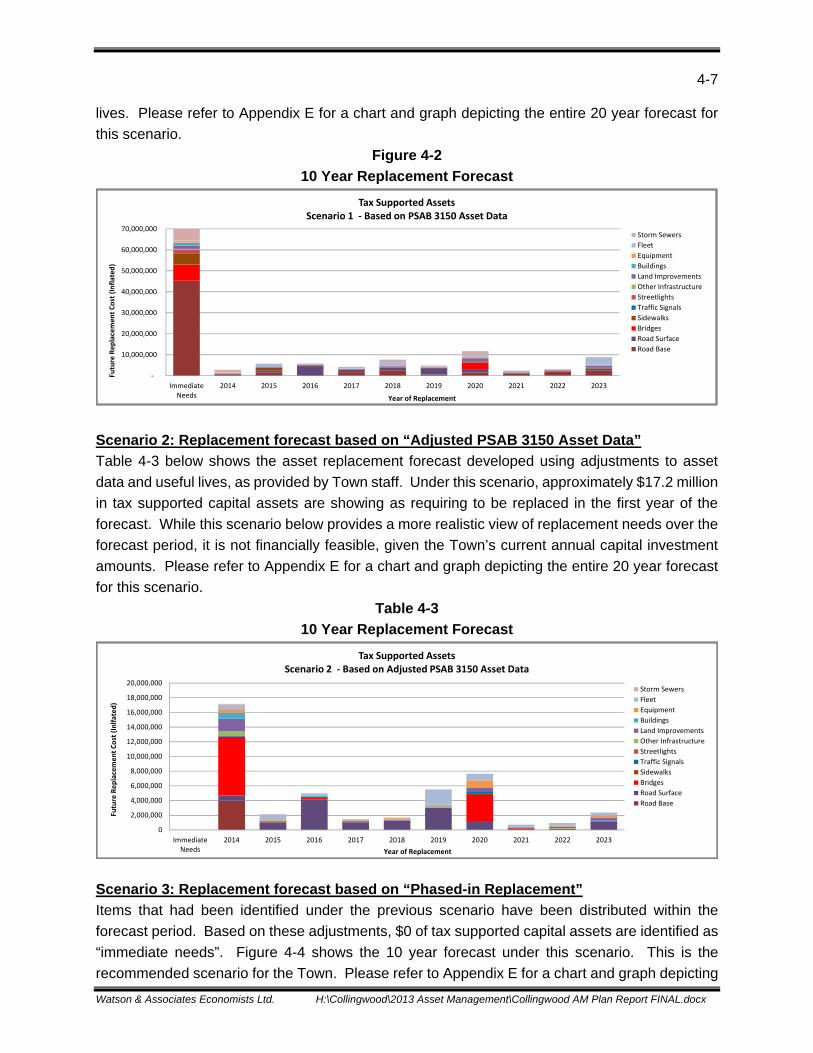
lives. Please refer to Appendix E for a chart and graph depicting the entire 20 year forecast for
this scenario.
Figure 4-2
10 Year Replacement Forecast
Scenario 2: Replacement forecast based on “Adjusted PSAB 3150 Asset Data”
Table 4-3 below shows the asset replacement forecast developed using adjustments to asset
data and useful lives, as provided by Town staff. Under this scenario, approximately $17.2 million
in tax supported capital assets are showing as requiring to be replaced in the first year of the
forecast. While this scenario below provides a more realistic view of replacement needs over the
forecast period, it is not financially feasible, given the Town’s current annual capital investment
amounts. Please refer to Appendix E for a chart and graph depicting the entire 20 year forecast
for this scenario.
Table 4-3
10 Year Replacement Forecast
Scenario 3: Replacement forecast based on “Phased-in Replacement”
Items that had been identified under the previous scenario have been distributed within the
forecast period. Based on these adjustments, $0 of tax supported capital assets are identified as
“immediate needs”. Figure 4-4 shows the 10 year forecast under this scenario. This is the
recommended scenario for the Town. Please refer to Appendix E for a chart and graph depicting
‐
10,000,000
20,000,000
30,000,000
40,000,000
50,000,000
60,000,000
70,000,000
ImmediateNeeds
2014 2015 2016 2017 2018 2019 2020 2021 2022 2023
Future Replacement Cost (Inflated)
Year of Replacement
Tax Supported AssetsScenario 1 ‐ Based on PSAB 3150 Asset Data
Storm Sewers
Fleet
Equipment
Buildings
Land Improvements
Other Infrastructure
Streetlights
Traffic Signals
Sidewalks
Bridges
Road Surface
Road Base
0
2,000,000
4,000,000
6,000,000
8,000,000
10,000,000
12,000,000
14,000,000
16,000,000
18,000,000
20,000,000
ImmediateNeeds
2014 2015 2016 2017 2018 2019 2020 2021 2022 2023
Future Replacement Cost (Inlfated)
Year of Replacement
Tax Supported AssetsScenario 2 ‐ Based on Adjusted PSAB 3150 Asset Data
Storm Sewers
Fleet
Equipment
Buildings
Land Improvements
Other Infrastructure
Streetlights
Traffic Signals
Sidewalks
Bridges
Road Surface
Road Base

4-8
Watson & Associates Economists Ltd. H:\Collingwood\2013 Asset Management\Collingwood AM Plan Report FINAL.docx
the entire 20 year forecast for this scenario. A total of $102.6 million in tax supported, capital
replacement needs are identified over the 20 year forecast period ($46.15 million in the first 10
years). Please note that the 2014 Budget, as shown in Figure 4-4 below, includes the non-growth
share of growth related projects.
Figure 4-4
10 Year Replacement Forecast
Maintenance, Non-Infrastructure Solutions, Renewal & Rehabilitation
For the recommended scenario to be feasible, the level of service adjustments discussed in
Chapter 3 and Appendix D are required in conjunction with current level of service amounts in
order to effectively maintain and rehabilitate the assets as needed. Appendix D provides
additional rehabilitation and maintenance requirements over the forecast period.
The financing strategy discussed in the next Chapter will incorporate the level of service
adjustments outlined in Appendix D into the recommended financing analysis. In addition,
expansion (i.e. growth) related needs will be layered into the forecast to determine total capital
needs for each year.
Water and Wastewater Capital Assets
The Town recently completed a 2014 Water and Wastewater Rate Study. This study analyzes
operating needs, capital needs and anticipated consumption over a defined forecast period.
Included in this analysis is $15.9 million in water capital and $24.3 million in wastewater capital
needs over a 9-year forecast period, (please see Figures 4-6 and 4-7 below). Appendix G and
H, respectively contain the detailed capital forecasts for water and wastewater.
0
1,000,000
2,000,000
3,000,000
4,000,000
5,000,000
6,000,000
7,000,000
8,000,000
9,000,000
ImmediateNeeds
Budget2014
2015 2016 2017 2018 2019 2020 2021 2022 2023 2024
Future Replacement Cost (Inlfated)
Year of Replacement
Tax Supported AssetsScenario 3 ‐ Phased‐in Replacement
Storm Sewers
Fleet
Equipment
Buildings
Land Improvements
Other Infrastructure
Streetlights
Traffic Signals
Sidewalks
Bridges
Road Surface
Road Base

4-9
Watson & Associates Economists Ltd. H:\Collingwood\2013 Asset Management\Collingwood AM Plan Report FINAL.docx
Figure 4-6
9 Year Forecast
Figure 4-7
9 Year Forecast
4.5 Procurement Methods
Section 270(1) of the Municipal Act, S.O. 2001, provides that municipalities (and local boards)
shall adopt and maintain policies with respect to its procurement of goods and services.
Procurement policies are developed to provide a framework to support open, fair, transparent and
accountable purchasing processes, and to ensure procurement processes are consistently
managed. Moreover, the establishment of a by-law adopting the procurement policy provides a
document which has the approval of Council, which allows an opportunity for public debate.
$0
$1,000,000
$2,000,000
$3,000,000
$4,000,000
$5,000,000
$6,000,000
$7,000,000
2014 2015 2016 2017 2018 2019 2020 2021 2022
Replacement Cost
Replacement Year
Water AssetsReplacement and Expansion Schedule
$0
$1,000,000
$2,000,000
$3,000,000
$4,000,000
$5,000,000
$6,000,000
2014 2015 2016 2017 2018 2019 2020 2021 2022
Replacement Cost
Replacement Year
Wastewater AssetsReplacement and Expansion Schedule

4-10
Watson & Associates Economists Ltd. H:\Collingwood\2013 Asset Management\Collingwood AM Plan Report FINAL.docx
An effective procurement policy assists municipalities in identifying cost-effective options for
providing services, while at the same time reducing risk. Innovative project management models,
such as public-private partnerships (P3’s) or co-operative purchasing, can help bring together
expertise, resources and funding opportunities. Where appropriate, bidders can be required to
provide lifecycle costing for the products and/or services being tendered. Lifecycle costs can
include initial construction/purchase price, plus operating costs for a contracted period of time.
Incorporating a lifecycle perspective in the procurement process can encourage effective asset
management in the time period following the initial capital investment.
In order to have an effective and efficient procurement program, especially related to the
purchase/construction of large capital assets, the procurement policy can include clauses to
protect the Town, as well as assist in receiving competitive responses. Examples include:
Identification of the criteria used to determine the type of competitive process to be
followed (i.e. tender, RFP, RFQ);
Identification of circumstances when Sole Sourcing, Negotiation, and/or In-House Bids
can be used;
Description of the methods to be used for advertising a competitive process;
Providing direction for purchasing in cases of emergency;
Providing direction for purchasing as part of a co-operative purchasing group;
Outlining any requirements related to bid deposits or other financial security;
Inclusion of a non-discrimination clause highlighting positions such as having a ‘no local
preference’ policy;
Notification that any bid can be rejected by the Town;
Identification of reasons for terminating a contract with a supplier/contractor (i.e. poor
performance, unethical behaviour);
Identification of restrictions on the types and/or amounts of damages to which bidders
may be entitled, arising from their responding to a competitive process; and
Requirement for bidders to supply proof of insurance and WSIB.
As part of the continuous asset management update process, it is recommended that the Town’s
procurement policies and procedures be reviewed and compared against procurement best
practices to ensure resources are being allocated in an efficient manner.

Watson & Associates Economists Ltd. H:\Collingwood\2013 Asset Management\Collingwood AM Plan Report FINAL.docx
5. FINANCING STRATEGY


5-1
Watson & Associates Economists Ltd. H:\Collingwood\2013 Asset Management\Collingwood AM Plan Report FINAL.docx
5. FINANCING STRATEGY
5.1 Scope and Process
The financing strategy outlines the suggested financial approach to funding the recommended
asset management strategy outlined in Chapter 4, while utilizing the Town’s existing budget
structure. This section of the asset management plan includes:
Annual expenditure forecasts broken down by:
o Maintenance/non-infrastructure solutions;
o Renewal/rehabilitation activities;
o Replacement/disposal activities; and
o Expansion activities.
Actual expenditures in the above named categories for 2011, 2012 and budget
expenditures for 2013;
A breakdown of annual funding/revenue by source;
Identification of the funding shortfall, including how the impact will be managed; and
All key assumptions are documented within Appendix B.
The long-term financing strategy forecast (including both expenditure and revenue sources) was
prepared, consistent with the Town’s departmental budget structure, so that it can be used in
conjunction with the annual budget process. Various financing options, including taxation,
reserves, reserve funds, debt, user fees and grants were considered and discussed with Town
staff during the process. Figure 5-1 provides a visual representation of how various financing
methods can be used for both initial asset purchases, as well as asset replacements.
For the recommended tax supported asset management strategy scenario, a detailed twenty (20)
year plan was generated. For water and wastewater, a detailed nine (9) year plan was generated
as part of the 2014 Rate Study. The plan identifies specific maintenance & non-infrastructure
solutions, renewal & rehabilitation, replacement & disposal, and expansion activities required for
the forecast periods as described in Chapter 4.

5-2
Watson & Associates Economists Ltd. H:\Collingwood\2013 Asset Management\Collingwood AM Plan Report FINAL.docx
Figure 5-1 Financing Methods of Lifecycle Costs
5.2 Historical Results
Table 5-1 outlines the historical tax supported maintenance/non-infrastructure costs for 2012, as
well as 2013 and 2014 budgeted results. All maintenance for assets was funded through taxation
revenue for tax supported assets based on the Town’s budget structure.
Purchase
Install
Commission
Operate
Maintain
Monitor(Throughout Life
of Assets)
(To End ofUseful Life)
Removal / Decommission
Disposal
New Assets Replacement Assets
Development Charges (Growth)Reserves/Reserve Funds
DebenturesTaxation
User FeesGrantsOther
Proceeds on DisposalFunding of Disposal /
Decommissioning Costs
Tax Supported Operating BudgetUser Fees Operating Budget
Financing Methods
Purchase
Install
Commission
Operate
Maintain
Monitor(Throughout Life
of Assets)
(To End ofUseful Life)
Removal / Decommission
Disposal

5-3
Watson & Associates Economists Ltd. H:\Collingwood\2013 Asset Management\Collingwood AM Plan Report FINAL.docx
Table 5-1
Historical Results
Maintenance & Non-Infrastructure Solutions
Table 5-2 outlines the historical tax supported capital results for 2012 and budgeted results for
2013 and 2014 including renewal/rehabilitation, replacement/disposal, and expansion. The
capital funding includes the use of development charges for growth (expansion) related costs,
reserve/reserve funds, debt, other revenue, as well as contributions from the operating budget.
Table 5-2 Tax Supported Historical Results
Renewal/Rehabilitation, Replacement/Disposal & Expansion
Tax Supported
Asset Maintenance 991,312 1,025,655 1,079,505 Taxation Funding 991,312 1,025,655 1,079,505
Net Unfunded - - -
Budget2014
Budget2013
Description Actual 2012
Capital Expenses
General Government 1,923,055 1,258,278 811,000 Protection Services 2,595,415 3,187,843 724,272 Transportation Services 7,519,099 3,281,000 5,415,000 Parks, Recreation and Culture 6,315,772 9,419,614 2,455,048 Municipal Service Boards 30,202 84,500 57,000 Parking 12,408 - 59,900
Total Capital Expenditures 18,395,951 17,231,235 9,522,220
Capital Financing
Grants 1,000,000 1,644,500 2,282,335 Transfer from Revenue Fund 590,501 334,490 151,000 Debentures - 8,339,315 1,069,900 Internal Borrowing 50,000 81,625 532,000 Development Charge Reserve Fund 2,284,829 3,667,296 1,685,181 Reserve Fund: Capital 2,056,396 992,355 1,286,172 Reserve Fund: Other 1,467,181 1,201,704 1,947,632 Other Revenue 1,036,700 969,950 568,000
Total Capital Financing 8,485,608 17,231,235 9,522,220
Total Capital Expenditures less Capital Financing 9,910,343 - -
Budget2014
Actual2012
Budget2013
Description

5-4
Watson & Associates Economists Ltd. H:\Collingwood\2013 Asset Management\Collingwood AM Plan Report FINAL.docx
5.3 Financing Strategy
Tax Supported
Table 5-3 shows the tax supported expenditure forecast for maintenance, renewal/rehabilitation,
replacement/disposal and expansion for the first 10 years of the forecast. While this summary
only shows high level cost classifications, further detail (including the full 20 year forecast) can be
obtained from Appendix F.
Table 5-3
Tax Supported Expenditure Forecast Summary
Items in Table 5-3 labelled as “LOS Adjustment” refer to the level of service analysis discussed
in Chapter 2 and Appendix D. Expansion related costs labelled as “DC related” refer to projects
identified in the Town’s Development Charge Background Study (please refer to Appendix F).
Table 5-4 summarizes the recommended strategy to finance the asset related costs identified in
Table 5-3.
Table 5-4
Breakdown of Annual Tax Supported Funding (Revenue) by Source
These lifecycle costs are being recovered through several methods:
Taxation funding is suggested for all maintenance costs, as well as level of service
adjustment related costs related to operations.
Grants are shown as indicated in the Town’s capital forecast.
Other Contributions as indicated in the Town’s capital forecast.
Forecast (Inflated)2014 2015 2016 2017 2018 2019 2020 2021 2022 2023
Maintenance: Current Service Levels 1,079,505 1,101,095 1,123,117 1,145,579 1,168,491 1,191,861 1,215,698 1,240,012 1,264,812 1,290,108 Maintenance: LOS Adjustment - 83,232 111,427 140,716 143,531 146,401 149,329 152,316 155,362 158,469 Total Asset Maintenance 1,079,505 1,184,327 1,234,544 1,286,295 1,312,022 1,338,262 1,365,027 1,392,328 1,420,174 1,448,577
Renewal/Rehabilitation/Replacement 7,837,039 3,771,281 3,884,419 4,000,952 4,120,980 4,244,609 4,371,948 4,503,106 4,638,199 4,777,345 Replacement/Disposal - LOS Adjustment - - - - - - - - - - Total Replacement/Disposal 7,837,039 3,771,281 3,884,419 4,000,952 4,120,980 4,244,609 4,371,948 4,503,106 4,638,199 4,777,345
Expansion: DC Related 1,685,181 15,633,712 12,542,384 18,797,527 13,507,524 9,666,259 7,209,210 11,035,166 3,283,975 9,853,321 Expansion: LOS Adjustment - - - - - - - - - - Total Expansion 1,685,181 15,633,712 12,542,384 18,797,527 13,507,524 9,666,259 7,209,210 11,035,166 3,283,975 9,853,321
Total 10,601,725 20,589,319 17,661,347 24,084,774 18,940,526 15,249,130 12,946,185 16,930,600 9,342,348 16,079,244
Asset Lifecycle Costs
Forecast2014 2015 2016 2017 2018 2019 2020 2021 2022 2023
Taxation 1,079,505 1,184,327 1,234,544 1,286,295 1,312,022 1,338,262 1,365,027 1,392,328 1,420,174 1,448,577 Grants 2,282,335 - - - - - - - - - Other Contributions 1,251,000 1,445,476 314,159 9,100,258 392,955 - - - - - Debentures 1,069,900 - 1,800,000 3,200,000 5,200,000 3,000,000 - 2,000,000 - - Development Charges Reserve Funds 1,685,181 8,592,631 8,787,284 6,446,171 7,435,895 5,813,254 5,720,779 6,784,980 2,159,982 6,311,240 Gas Tax Reserve Funds - 868,674 868,674 868,674 536,905 536,905 536,905 536,905 536,905 536,905 Capital Reserve Fund 3,233,804 8,498,212 4,656,686 3,183,375 4,062,750 4,560,710 5,323,474 6,216,387 5,225,287 7,782,521 Total 10,601,725 20,589,319 17,661,347 24,084,774 18,940,526 15,249,130 12,946,185 16,930,600 9,342,348 16,079,244
Funding (Revenue) by Source

5-5
Watson & Associates Economists Ltd. H:\Collingwood\2013 Asset Management\Collingwood AM Plan Report FINAL.docx
Debt financing is shown as required in years where significant capital needs are identified.
The portion of newly acquired or constructed assets that are “growth (DC) related” are
shown as financed by development charges. Depending on the timing of the growth
related projects, growth related debt financing may be required.
Gas Tax funding has been shown as a stable and long-term funding source for eligible
capital projects.
The Town will be dependent upon maintaining healthy capital reserves/reserve funds in
order to provide the remainder of the required lifecycle funding over the forecast period.
This will require the Town to proactively increase amounts being transferred to these
capital reserves during the annual budget process.
While the annual funding requirement may fluctuate, it is important for the Town to implement a
consistent, yet increasing annual investment in capital so that the excess annual funds can accrue
in capital reserve funds.
In order to fund the recommended asset requirements over the forecast period using the Town’s
own available funding sources (i.e. using taxation, gas tax funding and debentures), an increase
in the Town’s taxation levy of 3.60% per year would be required for the years 2015 to 2022,
declining to 1.80% thereafter. This assumes all departmental operating accounts would increase
at 2% annually. However, if other funding sources become available (i.e. grant funding) or if
maintenance and rehabilitation practices allow for the deferral of capital works, then the impact
on the Town’s taxation levy would decrease.
Water
Table 5-5 shows the water expenditure forecast for maintenance, renewal/rehabilitation,
replacement/disposal and expansion for the nine (9) years of the forecast, as per the 2014 Rate
Study. While this summary only shows high level cost classifications, further detail can be
obtained from Appendix G.

5-6
Watson & Associates Economists Ltd. H:\Collingwood\2013 Asset Management\Collingwood AM Plan Report FINAL.docx
Table 5-5
Water Expenditure Forecast Summary
Items in Table 5-5 labelled as “LOS Adjustment” refer to the level of service analysis discussed
in Chapter 2 and Appendix D. Expansion related costs labelled as “DC related” refer to projects
identified in the Town’s Development Charge Background Study (please refer to Appendix G).
Please note that, the Town’s Development Charge Background Study has been recently updated,
and is not reflected in the rate study or above mentioned water financing strategy. It is
recommended that the results of the update be inserted into this asset management plan as well
as the rate study.
Table 5-6 summarizes the recommended strategy to finance the asset related costs identified in
Table 5-5.
Table 5-6
Breakdown of Annual Water Funding (Revenue) by Source
These lifecycle costs are being recovered through several methods:
Water rate revenue is suggested for all maintenance costs, as well as level of service
adjustment related costs related to operations.
Debt financing is shown as required in years where significant capital needs are identified.
The portion of newly acquired or constructed assets that are “growth (DC) related” are
shown as financed by development charges.
The Town will be dependent upon maintaining healthy capital reserves/reserve funds in
order to provide the remainder of the required lifecycle funding over the forecast period.
Forecast2014 2015 2016 2017 2018 2019 2020 2021 2022
Maintenance: Current Service Levels 256,340 262,749 269,318 276,050 282,951 290,025 297,275 304,708 312,325 Maintenance: LOS Adjustment - - - - - - - - - Total Asset Maintenance 256,340 262,749 269,318 276,050 282,951 290,025 297,275 304,708 312,325
Renewal/Rehabilitation/Replacement 1,287,700 1,371,500 755,800 561,200 473,100 544,700 1,192,800 1,204,700 1,192,400 Renewal/Rehabilitation - LOS Adjustment - - - - - - - - - Total Renewal/Rehabilitation 1,287,700 1,371,500 755,800 561,200 473,100 544,700 1,192,800 1,204,700 1,192,400
Expansion: DC Related 768,800 5,148,100 434,000 886,400 - - 118,900 - - Expansion: LOS Adjustment - - - - - - - - - Total Expansion (excl. Contributed) 768,800 5,148,100 434,000 886,400 - - 118,900 - -
Total 2,312,840 6,782,349 1,459,118 1,723,650 756,051 834,725 1,608,975 1,509,408 1,504,725
Asset Lifecycle Costs
Forecast2014 2015 2016 2017 2018 2019 2020 2021 2022
Water Revenue 256,340 262,749 269,318 276,050 282,951 290,025 297,275 304,708 312,325 Grants - - - - - - - - - Non-Growth Related Debentures 1,388,446 2,100,000 - - - - - - - Growth Related Debentures 668,054 3,347,869 - 230,000 - - - - - Development Charges Reserve Funds - 857,551 370,501 656,400 - 20,300 118,900 - - Gas Tax Reserve Funds - - - - - - - - - Capital Reserve Fund - 214,180 819,299 561,200 473,100 524,400 1,192,800 1,204,700 1,192,400 Total 2,312,840 6,782,349 1,459,118 1,723,650 756,051 834,725 1,608,975 1,509,408 1,504,725
Funding (Revenue) by Source

5-7
Watson & Associates Economists Ltd. H:\Collingwood\2013 Asset Management\Collingwood AM Plan Report FINAL.docx
This will require the Town to proactively increase amounts being transferred to these
capital reserves during the annual budget process.
While the annual funding requirement may fluctuate, it is important for the Town to implement a
consistent, yet increasing annual investment in capital so that the excess annual funds can accrue
in capital reserve funds.
In order to fund the recommended asset requirements over the forecast period using the Town’s
own available funding sources (i.e. using water rate revenue and debentures), a recommended
water rate forecast was developed through the 2014 Rate Study process. Please refer to Table
5-7 below. However, if other funding sources become available (i.e. grant funding) or if
maintenance and rehabilitation practices allow for the deferral of capital works, then the impact
on Town water rate revenue would decrease.
Table 5-7
Recommended Water Rate Forecast – Base Charge and Consumption Rate
Wastewater
Table 5-8 shows the wastewater expenditure forecast for maintenance, renewal/rehabilitation,
replacement/disposal and expansion for the 9 years of the forecast, as per the 2014 Rate Study.
While this summary only shows high level cost classifications, further detail can be obtained from
Appendix H.
Water Customers 2013 2014 2015 2016 2017 2018 2019 2020 2021 2022
Base Charge Rate:up to 1 1/4" 9,579 $19.85 20.35 20.86 21.38 21.91 22.46 23.02 23.60 24.19 24.79 1 1/4" 39 $25.08 25.71 26.35 27.01 27.69 28.38 29.09 29.82 30.56 31.33 1 1/2" 81 $38.06 39.02 39.99 40.99 42.02 43.07 44.14 45.25 46.38 47.54 2" 64 $55.99 57.40 58.83 60.30 61.81 63.35 64.94 66.56 68.23 69.93 3" 3 $83.73 85.84 87.98 90.18 92.43 94.74 97.11 99.54 102.03 104.58 4" 8 $126.90 130.09 133.34 136.67 140.09 143.59 147.18 150.86 154.63 158.51 6" 1 $190.73 195.53 200.41 205.42 210.56 215.82 221.21 226.75 232.41 238.23 8" 4 $253.77 260.15 266.65 273.32 280.15 287.15 294.33 301.69 309.23 316.97 10" - $381.45 391.04 400.82 410.83 421.11 431.62 442.41 453.48 464.81 476.45
Annual Increase 2.5% 2.5% 2.5% 2.5% 2.5% 2.5% 2.5% 2.5% 2.5%
Description 2013 2014 2015 2016 2017 2018 2019 2020 2021 2022
Total Water Billing Recovery 1,601,560 1,898,152 1,970,053 2,046,923 2,127,915 2,211,604 2,298,173 2,387,777 2,480,301 2,576,133
Filtered vs. Processed Rates
Consumption Forecast By Block (m 3 )Filtered (Regular) 2,340,200 2,739,121 2,776,247 2,817,220 2,860,277 2,903,334 2,946,391 2,989,448 3,032,504 3,075,561Filtered (Summer) 82,846 96,968 98,283 99,733 101,257 102,782 104,306 105,830 107,354 108,879Processed 712,267 712,267 712,267 712,267 712,267 712,267 712,267 712,267 712,267 712,267Total Consumption 3,135,313 3,548,356 3,586,797 3,629,220 3,673,801 3,718,383 3,762,964 3,807,545 3,852,126 3,896,707
Block Rates ($/m 3 )Filtered - Regular 0.590 0.604 0.620 0.635 0.651 0.667 0.684 0.701 0.718 0.736Filtered - Summer 1.066 1.092 1.119 1.147 1.176 1.205 1.236 1.266 1.298 1.331Processed 0.187 0.192 0.196 0.201 0.206 0.211 0.217 0.222 0.228 0.233
Annual % Increase in Rates 2.5% 2.5% 2.5% 2.5% 2.5% 2.5% 2.5% 2.5% 2.5%

5-8
Watson & Associates Economists Ltd. H:\Collingwood\2013 Asset Management\Collingwood AM Plan Report FINAL.docx
Table 5-8
Wastewater Expenditure Forecast Summary
Items in Table 5-8 labelled as “LOS Adjustment” refer to the level of service analysis discussed
in Chapter 2 and Appendix D. Expansion related costs labelled as “DC related” refer to projects
identified in the Town’s Development Charge Background Study (please refer to Appendix H).
Please note that, the Town’s Development Charge Background Study has been recently updated,
and is not reflected in the rate study or above mentioned wastewater financing strategy. It is
recommended that the results of the update be inserted into this asset management plan as well
as the rate study.
Table 5-9 summarizes the recommended strategy to finance the asset related costs identified in
Table 5-8.
Table 5-9
Breakdown of Annual Wastewater Funding (Revenue) by Source
These lifecycle costs are being recovered through several methods:
Wastewater rate revenue is suggested for all maintenance costs, as well as level of service
adjustment related costs related to operations.
The portion of newly acquired or constructed assets that are “growth (DC) related” are
shown as financed by development charges.
The Town will be dependent upon maintaining healthy capital reserves/reserve funds in
order to provide the remainder of the required lifecycle funding over the forecast period.
Forecast2014 2015 2016 2017 2018 2019 2020 2021 2022
Maintenance: Current Service Levels Mains and Laterals 232,829 238,650 244,616 250,731 257,000 263,425 270,010 276,761 283,680 Wastewater Treatment Plant 172,303 176,610 181,025 185,551 190,190 194,944 199,818 204,814 209,934
Maintenance: LOS Adjustment - - - - - - - - - Total Asset Maintenance 405,132 415,260 425,641 436,282 447,189 458,369 469,828 481,574 493,613
Renewal/Rehabilitation/Replacement 4,408,800 1,784,800 516,900 530,900 544,200 3,457,000 2,950,300 3,025,300 4,722,200 Renewal/Rehabilitation - LOS Adjustment - - - - - - - - - Total Renewal/Rehabilitation 4,408,800 1,784,800 516,900 530,900 544,200 3,457,000 2,950,300 3,025,300 4,722,200
Expansion: DC Related - 288,900 107,700 - 332,100 - 1,483,500 - 124,900 Expansion: LOS Adjustment - - - - - - - - - Total Expansion (excl. Contributed) - 288,900 107,700 - 332,100 - 1,483,500 - 124,900
Total 4,813,932 2,488,960 1,050,241 967,182 1,323,489 3,915,369 4,903,628 3,506,874 5,340,713
Asset Lifecycle Costs
Forecast2014 2015 2016 2017 2018 2019 2020 2021 2022
Wastewater Revenue 455,132 465,260 425,641 436,282 447,189 458,369 469,828 481,574 493,613 Grants - - - - - - - - - Non-Growth Related Debentures - - - - - - - - - Growth Related Debentures - - - - - - - - - Development Charges Reserve Funds - 288,900 107,700 - 250,352 - 1,267,217 - 124,900 Gas Tax Reserve FundsCapital Reserve Fund 4,358,800 1,734,800 516,900 530,900 625,948 3,457,000 3,166,583 3,025,300 4,722,200 Total 4,813,932 2,488,960 1,050,241 967,182 1,323,490 3,915,369 4,903,628 3,506,874 5,340,713
Funding (Revenue) by Source

5-9
Watson & Associates Economists Ltd. H:\Collingwood\2013 Asset Management\Collingwood AM Plan Report FINAL.docx
This will require the Town to proactively increase amounts being transferred to these
capital reserves during the annual budget process.
While the annual funding requirement may fluctuate, it is important for the Town to implement a
consistent, yet increasing annual investment in capital so that the excess annual funds can accrue
in capital reserve funds.
In order to fund the recommended asset requirements over the forecast period using the Town’s
own available funding sources (i.e. using wastewater rate revenue and debentures), a
recommended wastewater rate forecast was developed through the 2014 Rate Study process.
Please refer to Table 5-10 below. However, if other funding sources become available (i.e. grant
funding) or if maintenance and rehabilitation practices allow for the deferral of capital works, then
the impact on Town wastewater rate revenue would decrease. In order to assess the impacts of
the wastewater rates specifically, a wastewater rate study update would be required.
Table 5-10
Recommended Wastewater Rate Forecast – Base Charge and Consumption Rate
5.4 Funding Shortfall
Assuming the Town maintains adequate capital reserve funds, the recommended asset
management strategy discussed in Chapter 4 will be fully funded. It is believed this can be
accomplished through each annual budget process. However, the recommended asset
management strategy does defer significant capital replacements, in comparison to
recommendations stated in various Town asset related reports. In the event that certain deferred
replacements result in increased risks and/or projected asset failures, further funding may be
required to address the costs associated with accelerating replacement timelines. In addition, in
the event that the Town is not successful in recent grant applications, additional funding would be
required in the short-term.
Wastewater Customers 2013 2014 2015 2016 2017 2018 2019 2020 2021 2022
Base Charge Rate:up to 1 1/4" 8,767 $43.37 44.88 46.45 48.08 49.75 51.50 52.78 54.09 55.44 56.82 1 1/4" 39 $54.94 56.86 58.84 60.90 63.03 65.23 66.86 68.52 70.23 71.98 1 1/2" 81 $82.40 85.28 88.26 91.34 94.53 97.84 100.28 102.77 105.33 107.96 2" 64 $121.43 125.67 130.06 134.61 139.31 144.18 147.78 151.46 155.23 159.10 3" 3 $182.15 188.51 195.09 201.91 208.96 216.28 221.67 227.19 232.84 238.65 4" 8 $274.67 284.26 294.19 304.47 315.11 326.13 334.27 342.59 351.11 359.87 6" 1 $413.43 427.87 442.81 458.29 474.29 490.89 503.13 515.66 528.49 541.67 8" 4 $550.77 570.01 589.91 610.53 631.85 653.96 670.27 686.96 704.06 721.61 10" - $828.32 857.25 887.18 918.20 950.26 983.51 1,008.04 1,033.14 1,058.85 1,085.25
Annual Increase 3.5% 3.5% 3.5% 3.5% 3.5% 2.5% 2.5% 2.5% 2.5%
Description 2013 2014 2015 2016 2017 2018 2019 2020 2021 2022
Total Wastewater Billing Recovery 1,837,159 1,924,466 2,017,873 2,118,382 2,224,942 2,336,519 2,429,374 2,525,279 2,624,452 2,727,108
Total Billable Volume (m3) 2,820,087 2,854,008 2,891,134 2,932,107 2,975,164 3,018,221 3,061,278 3,104,334 3,147,391 3,190,448
Constant Rate 0.651 0.674 0.698 0.722 0.748 0.774 0.794 0.813 0.834 0.855
Annual % Increase in Rates 3.5% 3.5% 3.5% 3.5% 3.5% 2.5% 2.5% 2.5% 2.5%
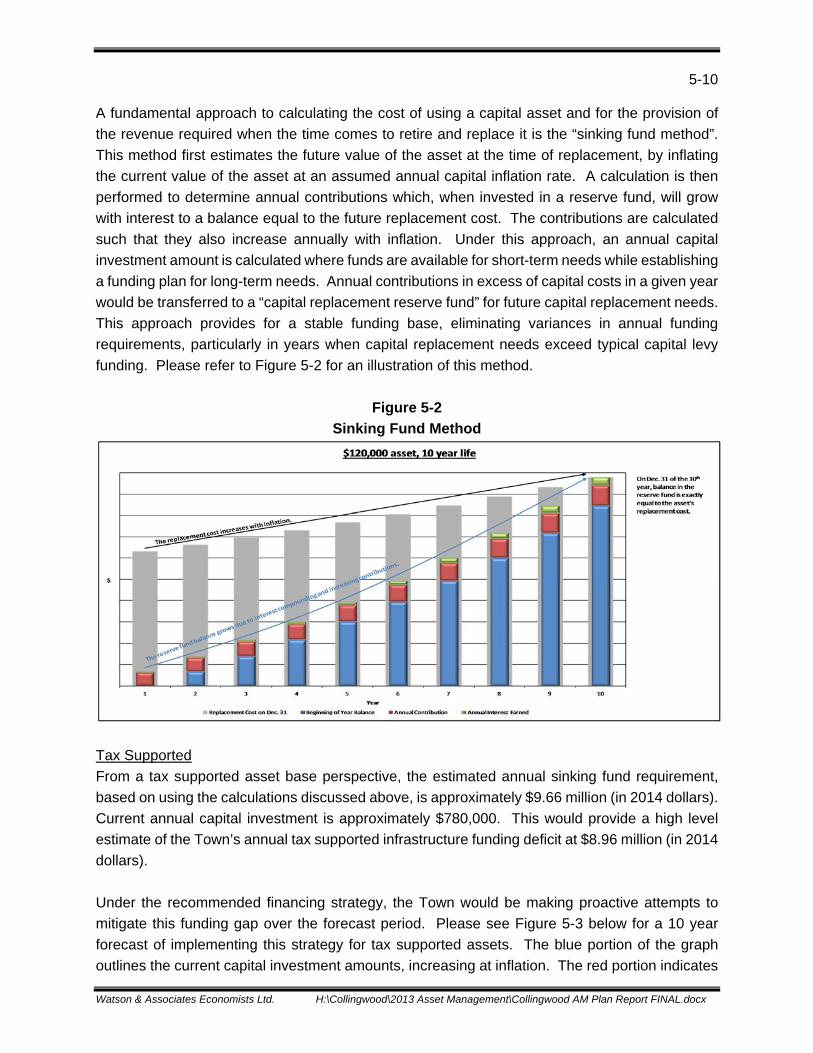
5-10
Watson & Associates Economists Ltd. H:\Collingwood\2013 Asset Management\Collingwood AM Plan Report FINAL.docx
A fundamental approach to calculating the cost of using a capital asset and for the provision of
the revenue required when the time comes to retire and replace it is the “sinking fund method”.
This method first estimates the future value of the asset at the time of replacement, by inflating
the current value of the asset at an assumed annual capital inflation rate. A calculation is then
performed to determine annual contributions which, when invested in a reserve fund, will grow
with interest to a balance equal to the future replacement cost. The contributions are calculated
such that they also increase annually with inflation. Under this approach, an annual capital
investment amount is calculated where funds are available for short-term needs while establishing
a funding plan for long-term needs. Annual contributions in excess of capital costs in a given year
would be transferred to a “capital replacement reserve fund” for future capital replacement needs.
This approach provides for a stable funding base, eliminating variances in annual funding
requirements, particularly in years when capital replacement needs exceed typical capital levy
funding. Please refer to Figure 5-2 for an illustration of this method.
Figure 5-2
Sinking Fund Method
Tax Supported
From a tax supported asset base perspective, the estimated annual sinking fund requirement,
based on using the calculations discussed above, is approximately $9.66 million (in 2014 dollars).
Current annual capital investment is approximately $780,000. This would provide a high level
estimate of the Town’s annual tax supported infrastructure funding deficit at $8.96 million (in 2014
dollars).
Under the recommended financing strategy, the Town would be making proactive attempts to
mitigate this funding gap over the forecast period. Please see Figure 5-3 below for a 10 year
forecast of implementing this strategy for tax supported assets. The blue portion of the graph
outlines the current capital investment amounts, increasing at inflation. The red portion indicates

5-11
Watson & Associates Economists Ltd. H:\Collingwood\2013 Asset Management\Collingwood AM Plan Report FINAL.docx
the result of implementing recommended increases in available funding sources (resulting in
increases in capital investment annually). The green represents optimal annual capital
investment amounts (calculated as described above). Please note “optimal” capital investment
funding can come from a number of additional sources, such as grants, donations, debt and other
contributions. Please refer to Appendix F for a 20 year version of this graph, indicating that if
recommended annual funding levels are achieved, the estimated annual infrastructure funding
gap would be eliminated during the forecast period.
Figure 5-3
Tax Supported Assets
To further mitigate the potential infrastructure funding deficit, the Town could consider:
Decreasing expected levels of service to make available capital funding;
Issuing debt for significant and/or unforeseen capital projects, in addition to the debt
recommended within this report, while staying within the Town’s debt capacity limits (this
would have the impact of spreading out the capital repayment over a defined term);
Actively seeking out and applying for grants;
Consider approaching the development community for funding assistance with respect to
growth/expansion related projects;
Rate increases, where needed (i.e. taxation, user fees); or
Implementing operating efficiencies (i.e. reduced operating costs to allow more capital
investment).


Watson & Associates Economists Ltd. H:\Collingwood\2013 Asset Management\Collingwood AM Plan Report FINAL.docx
6. RECOMMENDATIONS


6-1
Watson & Associates Economists Ltd. H:\Collingwood\2013 Asset Management\Collingwood AM Plan Report FINAL.docx
6. RECOMMENDATIONS
The following recommendations have been provided for consideration:
That the Town of Collingwood Asset Management Plan be received and approved by
Council;
That consideration of this Asset Management Plan be made as part of the annual
budgeting process to ensure sufficient capital funds are available to fund capital
requirements; and
That this Asset Management plan be updated as needed over time to reflect the current
priorities of the Town.
The current level of funding for asset replacement and renewal at the Town will not sufficiently
fund capital needs or close the infrastructure funding gap. As such, it is recommended that the
following additional recommendations be considered during the annual budget process:
Initiation of “level of service” (LOS) strategies discussed in Chapters 3, 4 and Appendix D.
Consider an increase in taxation as part of upcoming budget deliberations, dedicated to
capital, to be transferred to capital reserve(s).
Water and wastewater rate increases consistent with the calculations provided in the 2014
Rate Study.
Substantial investment in capital needs will be required over the forecast period. Through the
recommendations provided above, proactive steps would be taken to increase capital investment,
as well as reduce the annual infrastructure funding gap for these assets. Enhanced level of
service will assist in maintaining adequate asset conditions, mitigate asset risk, as well as
potentially defer capital needs within the forecast period. In addition, the Town should pursue
available capital grants, wherever possible, to further reduce the infrastructure funding gap.
Through the creation of this plan, Town staff have been provided with a model in which
amendments and revisions can be made as needed. It is anticipated that the final plan adopted
by Council will be monitored and updated frequently by Town staff as part of the budget process,
with refinements and specific recommendations being provided with respect to the priority of each
individual project.


Watson & Associates Economists Ltd. H:\Collingwood\2013 Asset Management\Collingwood AM Plan Report FINAL.docx
APPENDIX A
DETAILED ASSET INVENTORY

Watson & Associates Economists Ltd. H:\Collingwood\2013 Asset Management\Collingwood AM Plan Report FINAL.docx
PLEASE REFER TO TECHNICAL APPENDIX


Watson & Associates Economists Ltd. H:\Collingwood\2013 Asset Management\Collingwood AM Plan Report FINAL.docx
APPENDIX B
ASSET MANAGEMENT ASSUMPTIONS


B-1
Watson & Associates Economists Ltd. H:\Collingwood\2013 Asset Management\Collingwood AM Plan Report FINAL.docx
APPENDIX B: ASSET MANAGEMENT PLAN ASSUMPTIONS
The following assumptions were made during the creation of the Town’s asset management plan.
1. STATE OF LOCAL INFRASTRUCTURE
a) Indexing: When inflating an asset value to a 2013 replacement value, the Non-Residential
Building Construction Price Index (NRBCPI) was used for Roads, Sidewalks, Buildings,
and Stormwater related assets. The Consumer Price Index (CPI) was used for all other
assets including Land Improvements, Equipment, Fleet, Traffic Signals, Street Lights, and
Other infrastructure. In order to establish an initial condition assessment for some assets,
calculations were performed to link condition to asset age. This was done in order to
establish condition ratings for this report and it is recommended that the Town follow the
“Condition Assessment Policy” shown in Appendix C in the future.
2. ASSET MANAGEMENT STRATEGY
a) Capital inflation rate will be assumed to be 3% annually.
b) Operating budget inflation rate will be assumed to be 2% annually.
c) Regarding operating expenses included in the Town’s current budget, it is assumed that
they will increase at an operating inflation rate annually, unless staff have provided
alternative impacts.
d) When any existing debenture payments are complete (if applicable), annual budget
savings created through removing these payments have been dedicated to capital.
3. FINANCING STRATEGY
a) Taxation assessment growth is assumed to be 1.0% annually.
b) Development charges rates are assumed to increase at 2% annually.
c) Gas tax revenue has been identified as a funding source for the purposes of this analysis
(i.e. for asset replacement purposes), and has been assumed to continue throughout the
forecast period.
d) Interest rate earned on a Capital Replacement Reserve Fund will be 2% annually.
e) In the case where debt financing is needed, the model assumed debt terms of 20 years at
5% annual interest. For growth related debt, debt payments are shown as funded directly
from the development charge reserve funds.


Watson & Associates Economists Ltd. H:\Collingwood\2013 Asset Management\Collingwood AM Plan Report FINAL.docx
APPENDIX C
DATA VERIFICATION AND CONDITION ASSESSMENT
POLICY


C-1
Watson & Associates Economists Ltd. H:\Collingwood\2013 Asset Management\Collingwood AM Plan Report FINAL.docx
APPENDIX C: DATA VERIFICATION AND CONDITION
ASSESSMENT POLICY
Town of Collingwood
Data Verification and Condition Assessment Policy
Data Verification
1. The main source of asset data updating and editing will be though the Town’s PSAB 3150
compliance procedures.
2. Asset additions, disposals, betterments, and write-offs will be recorded based on the
Town’s PSAB 3150 Compliance Policies.
3. Verification of the correct treatment of asset revisions will be completed through frequent
annual reviews by the Town’s Treasurer as well as an annual review by the Town’s
external auditor.
4. During years in which condition assessments are not being performed, asset replacement
cost will be determined based on a combination of inflating previous current values or
thorough the use of the current year’s historical invoice data. Where indices are being
used, the Non-Residential Building Construction Price Index (NRBCPI) shall be used for
construction related assets (i.e. roads related, storm, water, and facilities) and the
Consumer Price Index (CPI) shall be used for all other assets (i.e. machinery & equipment,
vehicles and land improvements).
Condition Assessment
1. Condition assessments shall be performed as outlined in Table C-1 below. Condition
assessments shall be performed by qualified individuals (or companies) and shall include
a review of the following:
Current asset condition (consistent with the rating format used within this report, unless
Town staff stipulate a new format);
i. Identify any unusual wear from asset use that may hinder asset performance and
eventually reduce useful life.
ii. Assess asset performance and identify (if any) capital improvements that can be
applied to extend the asset’s useful life and/or bring the asset back to proper
service levels.
Current asset replacement cost. This is to be based on replacing the asset under
current legislation/requirements using the Town’s specifications; and
Remaining service life, assuming current maintenance and usage levels.

C-2
Watson & Associates Economists Ltd. H:\Collingwood\2013 Asset Management\Collingwood AM Plan Report FINAL.docx
Table C-1
Condition Assessment Time Table
Asset Type Frequency of Condition Assessment
Roads Related Every 5 years, based on Minimum
Maintenance Standards
Bridges and Culverts (greater than 3m)
Every 2 years, based on applicable legislation
Facilities Every 5-10 years, with priority given
to older buildings
Vehicles, Machinery and Equipment
Annually (typically by Town staff), part of maintenance program
Water, Wastewater, Storm Related
Every 5 years, based on applicable legislation

Watson & Associates Economists Ltd. H:\Collingwood\2013 Asset Management\Collingwood AM Plan Report FINAL.docx
APPENDIX D
LEVEL OF SERVICE IMPACT ANALYSIS

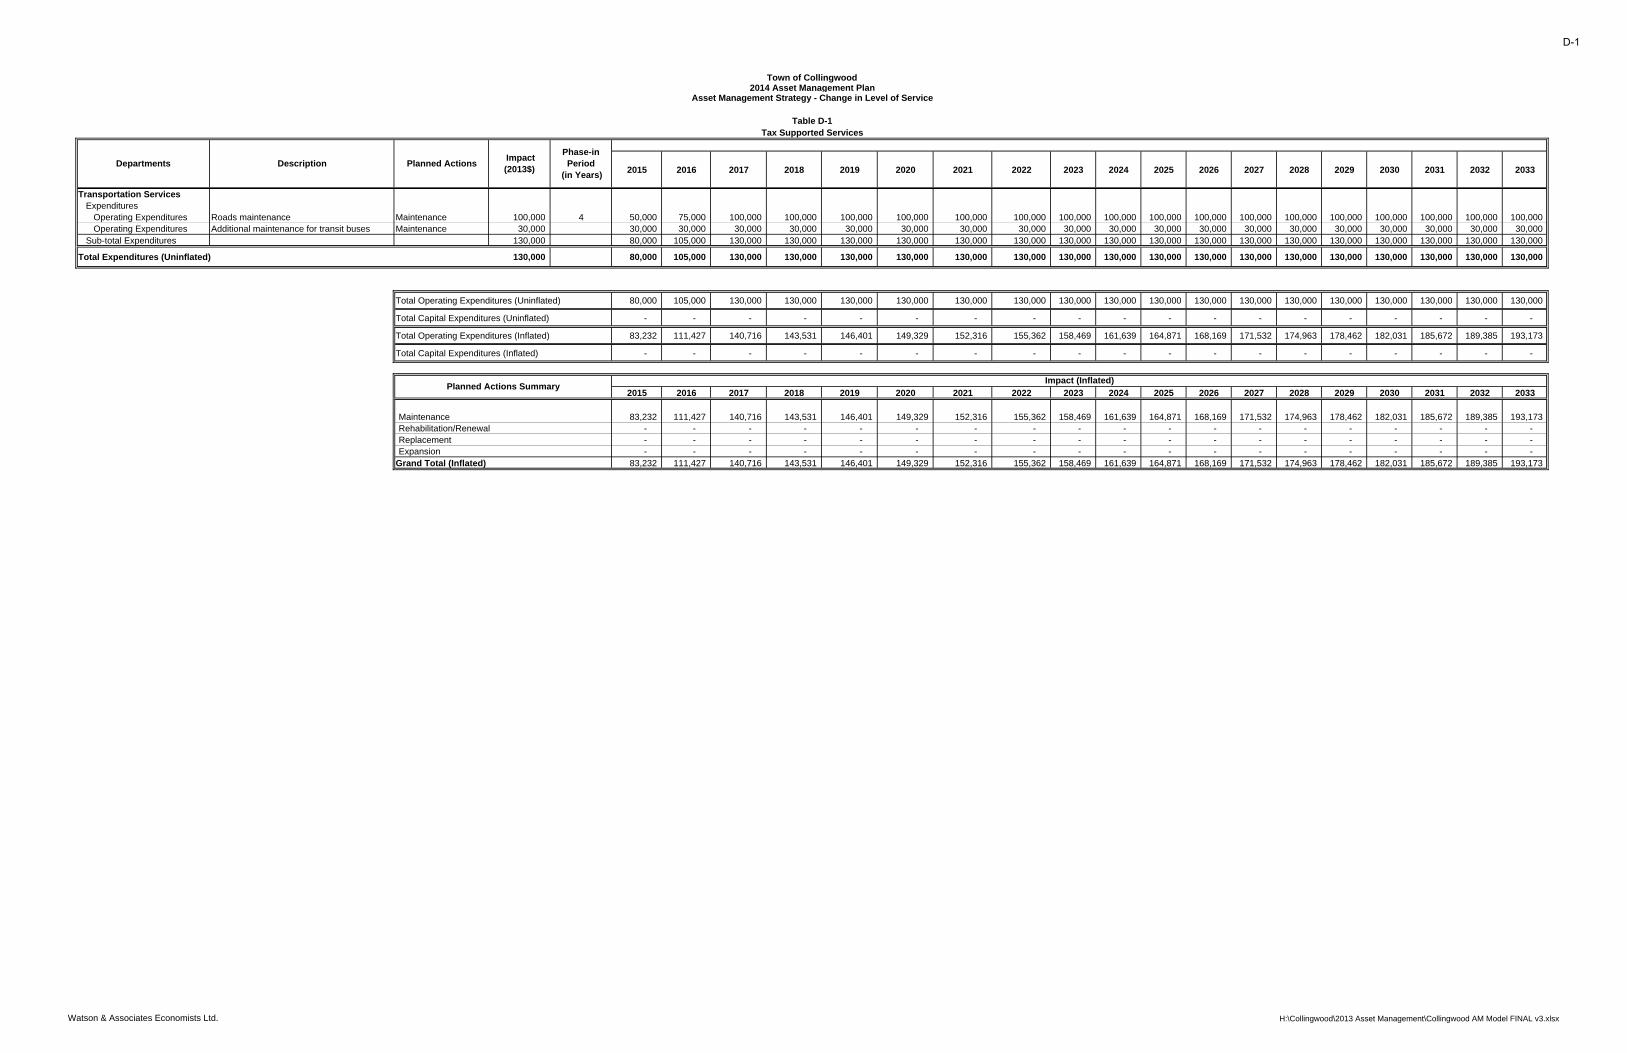
2015 2016 2017 2018 2019 2020 2021 2022 2023 2024 2025 2026 2027 2028 2029 2030 2031 2032 2033
Transportation ServicesExpenditures
Operating Expenditures Roads maintenance Maintenance 100,000 4 50,000 75,000 100,000 100,000 100,000 100,000 100,000 100,000 100,000 100,000 100,000 100,000 100,000 100,000 100,000 100,000 100,000 100,000 100,000 Operating Expenditures Additional maintenance for transit buses Maintenance 30,000 30,000 30,000 30,000 30,000 30,000 30,000 30,000 30,000 30,000 30,000 30,000 30,000 30,000 30,000 30,000 30,000 30,000 30,000 30,000
Sub-total Expenditures 130,000 80,000 105,000 130,000 130,000 130,000 130,000 130,000 130,000 130,000 130,000 130,000 130,000 130,000 130,000 130,000 130,000 130,000 130,000 130,000
Total Expenditures (Uninflated) 130,000 80,000 105,000 130,000 130,000 130,000 130,000 130,000 130,000 130,000 130,000 130,000 130,000 130,000 130,000 130,000 130,000 130,000 130,000 130,000
Total Operating Expenditures (Uninflated) 80,000 105,000 130,000 130,000 130,000 130,000 130,000 130,000 130,000 130,000 130,000 130,000 130,000 130,000 130,000 130,000 130,000 130,000 130,000
Total Capital Expenditures (Uninflated) - - - - - - - - - - - - - - - - - - -
Total Operating Expenditures (Inflated) 83,232 111,427 140,716 143,531 146,401 149,329 152,316 155,362 158,469 161,639 164,871 168,169 171,532 174,963 178,462 182,031 185,672 189,385 193,173
Total Capital Expenditures (Inflated) - - - - - - - - - - - - - - - - - - -
2015 2016 2017 2018 2019 2020 2021 2022 2023 2024 2025 2026 2027 2028 2029 2030 2031 2032 2033
Maintenance 83,232 111,427 140,716 143,531 146,401 149,329 152,316 155,362 158,469 161,639 164,871 168,169 171,532 174,963 178,462 182,031 185,672 189,385 193,173 Rehabilitation/Renewal - - - - - - - - - - - - - - - - - - - Replacement - - - - - - - - - - - - - - - - - - - Expansion - - - - - - - - - - - - - - - - - - -
Grand Total (Inflated) 83,232 111,427 140,716 143,531 146,401 149,329 152,316 155,362 158,469 161,639 164,871 168,169 171,532 174,963 178,462 182,031 185,672 189,385 193,173
Departments Impact(2013$)
Phase-in Period
(in Years)Description Planned Actions
Town of Collingwood
Asset Management Strategy - Change in Level of Service2014 Asset Management Plan
Planned Actions Summary
Tax Supported ServicesTable D-1
Impact (Inflated)
Watson & Associates Economists Ltd. H:\Collingwood\2013 Asset Management\Collingwood AM Model FINAL v3.xlsx
D-1


Watson & Associates Economists Ltd. H:\Collingwood\2013 Asset Management\Collingwood AM Plan Report FINAL.docx
APPENDIX E
SCENARIO ANALYSIS – CAPITAL FORECASTS


Asset TypeImmediate
Needs2014 2015 2016 2017 2018 2019 2020 2021 2022 2023 2024 2025 2026 2027 2028 2029 2030 2031 2032 2033 TOTAL
Total Scheduled Capital - Inflated 69,974,971 2,885,547 5,763,072 5,893,701 4,231,168 7,707,625 4,896,893 11,761,270 2,477,270 3,188,903 9,015,607 4,402,217 6,336,384 3,048,612 4,399,923 10,727,974 11,868,958 16,870,709 4,593,039 6,485,563 13,612,498 210,141,905
Road Base 45,287,082 - 1,621,214 431,765 1,752,334 2,631,966 615,841 1,588,096 913,591 1,984,900 2,361,951 348,875 1,595,157 441,426 - 533,051 - - - 590,723 - 62,697,971 Road Surface - 721,644 983,156 4,151,433 1,054,150 1,269,224 2,995,405 1,215,851 - 131,766 1,138,888 313,811 628,855 868,102 931,943 1,518,748 935,679 189,202 859,108 518,667 241,736 20,667,369 Bridges 7,759,892 - - 186,021 - - - 3,532,736 223,521 - - - - - - 1,285,560 - 2,847,846 - - - 15,835,576 Sidewalks 4,992,933 301,945 1,323,712 327,395 90,909 75,214 148,910 173,293 195,677 175,940 198,684 301,799 222,692 229,536 684,128 783,558 535,783 210,761 - - 1,085,881 12,058,749 Traffic Signals 318,811 - 125,202 - - 133,113 103,626 151,871 - - 304,947 177,242 189,056 485,088 - 282,943 140,935 3,446,660 - 369,756 575,808 6,805,058 Streetlights 1,708,059 3,816 - 10,715 29,164 300,357 94,319 - 121,180 24,167 79,655 28,203 - 137,471 371,133 - - 4,915,320 211,147 - 3,139,129 11,173,835 Other Infrastructure 387,160 266,259 - - - - - - - 100,883 - 124,960 165,367 95,496 203,719 - 2,285,699 104,279 165,628 45,207 837,421 4,782,078 Land Improvements 1,602,534 29,094 42,430 21,696 348,360 271,185 - 1,666,261 115,294 290,590 587,438 567,285 626,780 321,378 465,734 639,246 426,289 3,420,250 385,999 324,101 3,163,822 15,315,766 Buildings 1,241,772 - - 165,467 83,451 34,587 160,414 - 169,367 - 23,409 272,880 - 127,809 947,623 2,327,070 5,374,523 109,695 76,425 4,183,491 1,294,425 16,592,410 Equipment 304,498 151,858 103,768 144,047 94,226 349,696 293,692 888,422 19,229 185,572 514,177 204,084 229,139 101,213 126,632 567,962 293,758 1,480,825 132,929 139,094 691,011 7,015,831 Fleet 783,034 117,879 1,438,013 243,934 173,240 1,473,973 306,264 1,106,566 579,688 91,927 3,412,983 289,047 2,288,052 189,245 106,568 2,511,765 496,471 97,510 2,543,699 289,017 2,395,946 20,934,824 Storm Sewers 5,589,195 1,293,053 125,576 211,228 605,334 1,168,310 178,420 1,438,173 139,723 203,158 393,475 1,774,031 391,287 51,849 562,444 278,071 1,379,820 48,360 218,104 25,508 187,320 16,262,437
Asset TypeImmediate
Needs2014 2015 2016 2017 2018 2019 2020 2021 2022 2023 2024 2025 2026 2027 2028 2029 2030 2031 2032 2033 TOTAL
Total Scheduled Capital - Inflated - 17,165,716 2,132,552 4,978,103 1,498,842 1,675,275 5,517,470 7,646,050 713,477 933,078 2,381,620 3,228,924 8,006,397 1,826,753 3,765,866 6,489,184 10,711,354 8,788,332 4,523,442 6,848,193 1,538,449 100,369,078
Road Base - 3,989,433 - - - - - - - - - - 1,052,636 - - - - - - - - 5,042,069 Road Surface - 721,644 983,156 4,151,433 1,054,150 1,269,224 2,995,405 1,215,851 - 131,766 1,138,888 313,811 628,855 868,102 931,943 1,518,748 935,679 189,202 859,108 518,667 241,736 20,667,369 Bridges - 7,992,689 - 186,021 - - - 3,532,736 223,521 - - - - - - 1,285,560 - 2,847,846 - - - 16,068,373 Sidewalks - - 56,111 - - - 48,520 271,156 - - - - 2,062,750 - 121,610 159,837 - 694,866 - 30,055 55,697 3,500,603 Traffic Signals - 85,269 130,038 123,973 - - - 145,143 - - 154,315 120,132 176,060 - - 353,517 205,472 219,168 562,350 - 328,009 2,603,444 Streetlights - - - - - - - - - - - - - - - - - - - - - - Other Infrastructure - 665,033 - - - - - - - 100,883 - 124,960 165,367 95,496 203,719 - 2,285,699 104,279 165,628 45,207 138,168 4,094,439 Land Improvements - 1,679,704 42,430 21,696 138,931 112,376 - 626,320 - 233,885 382,510 189,218 626,780 321,378 465,734 148,186 774,175 2,615,861 328,893 324,101 377,501 9,409,678 Buildings - 858,913 - 165,467 83,451 34,587 160,414 - 169,367 - 23,409 272,880 - 127,809 947,623 2,269,691 5,433,624 109,695 76,425 4,183,491 53,885 14,970,733 Equipment - 465,491 103,768 75,312 165,023 199,241 228,771 965,784 19,229 103,499 274,027 538,509 139,455 193,587 126,632 456,670 408,389 1,480,825 25,842 249,394 254,662 6,474,109 Fleet - 589,762 817,048 254,202 57,287 59,847 2,069,289 889,058 301,360 363,045 408,470 1,669,415 2,165,535 220,382 968,605 208,308 668,316 469,206 2,505,196 1,466,243 88,791 16,239,367 Storm Sewers - 117,778 - - - - 15,070 - - - - - 988,959 - - 88,668 - 57,383 - 31,035 - 1,298,893
Asset TypeImmediate
NeedsBudget
20142015 2016 2017 2018 2019 2020 2021 2022 2023 2024 2025 2026 2027 2028 2029 2030 2031 2032 2033 TOTAL
Total Scheduled Capital - Inflated - 7,837,039 3,771,281 3,884,419 4,000,952 4,120,980 4,244,609 4,371,948 4,503,106 4,638,199 4,777,345 4,920,666 5,068,286 5,220,334 5,376,944 5,538,253 5,704,400 5,875,532 6,051,798 6,233,352 6,420,353 102,559,796
Road Base - 158,755 163,518 168,424 173,476 178,681 184,041 189,562 195,249 201,107 207,140 213,354 219,755 226,347 233,138 240,132 247,336 254,756 262,398 270,270 3,987,437 Road Surface - 897,040 923,951 951,669 980,219 1,009,626 1,039,915 1,071,112 1,103,246 1,136,343 1,170,433 1,205,546 1,241,713 1,278,964 1,317,333 1,356,853 1,397,559 1,439,485 1,482,670 1,527,150 22,530,828 Bridges - 557,496 574,220 591,447 609,190 627,466 646,290 665,679 685,649 706,219 727,405 749,227 771,704 794,855 818,701 843,262 868,560 894,617 921,455 949,099 14,002,543 Sidewalks - 134,687 138,727 142,889 147,176 151,591 156,139 160,823 165,648 170,617 175,736 181,008 186,438 192,031 197,792 203,726 209,837 216,133 222,616 229,295 3,382,906 Traffic Signals - 96,241 99,128 102,102 105,165 108,320 111,570 114,917 118,364 121,915 125,573 129,340 133,220 137,217 141,333 145,573 149,940 154,438 159,072 163,844 2,417,270 Streetlights - - - - - - - - - - - - - - - - - - - - - Other Infrastructure - 140,776 144,999 149,349 153,830 158,445 163,198 168,094 173,137 178,331 183,681 189,191 194,867 200,713 206,734 212,937 219,325 225,904 232,681 239,662 3,535,856 Land Improvements - 334,456 344,490 354,824 365,469 376,433 387,726 399,358 411,339 423,679 436,389 449,481 462,965 476,854 491,160 505,895 521,072 536,704 552,805 569,389 8,400,490 Buildings - 517,857 533,393 549,395 565,876 582,853 600,338 618,348 636,899 656,006 675,686 695,957 716,835 738,340 760,491 783,305 806,804 831,009 855,939 881,617 13,006,948 Equipment - 248,497 255,952 263,631 271,540 279,686 288,076 296,719 305,620 314,789 324,232 333,959 343,978 354,298 364,926 375,874 387,150 398,765 410,728 423,050 6,241,470 Fleet - 636,466 655,560 675,227 695,484 716,349 737,839 759,974 782,773 806,257 830,444 855,358 881,018 907,449 934,672 962,713 991,594 1,021,342 1,051,982 1,083,541 15,986,043 Storm Sewers - 49,010 50,480 51,994 53,554 55,161 56,816 58,520 60,276 62,084 63,946 65,865 67,841 69,876 71,972 74,131 76,355 78,646 81,005 83,435 1,230,967 All Assets (excl. growth related) 7,837,039 7,837,039
Table E-3Replacement Year Based on Scenario 3
Town of Collingwood2013 Asset Management Plan
Scheduled Capital Replacement (Tax Supported Assets) - Inflated
Replacement Year Based on Scenario 1
Replacement Year Based on Scenario 2Table E-2
Table E-1
Watson & Associates Economists Ltd. H:\Collingwood\2013 Asset Management\Collingwood AM Inventory FINAL v3.xlsx
E-1

Town of Collingwood2013 Asset Management Plan
Scheduled Capital Replacement (Tax Supported Assets) - Inflated
‐
10,000,000
20,000,000
30,000,000
40,000,000
50,000,000
60,000,000
70,000,000
ImmediateNeeds
2014 2015 2016 2017 2018 2019 2020 2021 2022 2023 2024 2025 2026 2027 2028 2029 2030 2031 2032 2033
Future Replacement Cost (Inflated)
Year of Replacement
Figure E‐1Tax Supported Assets
Scenario 1 ‐ Based on PSAB 3150 Asset Data
Storm Sewers
Fleet
Equipment
Buildings
Land Improvements
Other Infrastructure
Streetlights
Traffic Signals
Sidewalks
Bridges
Road Surface
Road Base
0
2,000,000
4,000,000
6,000,000
8,000,000
10,000,000
12,000,000
14,000,000
16,000,000
18,000,000
20,000,000
ImmediateNeeds
2014 2015 2016 2017 2018 2019 2020 2021 2022 2023 2024 2025 2026 2027 2028 2029 2030 2031 2032 2033
Future Replacement Cost (Inlfated)
Year of Replacement
Figure E‐2Tax Supported Assets
Scenario 2 ‐ Based on Adjusted PSAB 3150 Asset Data
Storm Sewers
Fleet
Equipment
Buildings
Land Improvements
Other Infrastructure
Streetlights
Traffic Signals
Sidewalks
Bridges
Road Surface
Road Base
0
1,000,000
2,000,000
3,000,000
4,000,000
5,000,000
6,000,000
7,000,000
8,000,000
9,000,000
ImmediateNeeds
Budget2014
2015 2016 2017 2018 2019 2020 2021 2022 2023 2024 2025 2026 2027 2028 2029 2030 2031 2032 2033
Future Replacement Cost (Inlfated)
Year of Replacement
Figure E‐3Tax Supported Assets
Scenario 3 ‐ Phased‐in Replacement
Storm Sewers
Fleet
Equipment
Buildings
Land Improvements
Other Infrastructure
Streetlights
Traffic Signals
Sidewalks
Bridges
Road Surface
Road Base
Watson & Associates Economists Ltd. H:\Collingwood\2013 Asset Management\Collingwood AM Inventory FINAL v3.xlsx
E-2
Watson & Associates Economists Ltd. H:\Collingwood\2013 Asset Management\Collingwood AM Plan Report FINAL.docx
APPENDIX F
TAX SUPPORTED ASSET MANAGEMENT STRATEGY &
FINANCING STRATEGY


2014 2015 2016 2017 2018 2019 2020 2021 2022 2023 2024 2025 2026 2027 2028 2029 2030 2031 2032 2033
Growth Projects (DC)
Fire Protection Services
Provision for Additional Fire Facility Space 3,913,400 3,913,400
UTV 25,000 25,000
Pumper 650,000 650,000
Rescue 550,000 550,000
Provision for Public Education Vehicle 30,000 30,000
Equipment for New Firefighters (16) 152,000 152,000
Gas Dectection Equipment 10,000 10,000 Police Services
Provision for Additional Facility Space 2,000,000 2,000,000
Upgrade/Expand Cells and Removal of Fuel Tanks 640,000 640,000
Provision for Additional Gear for Additional Officers 22,400 22,400 Roads and Related
Roads
Highway 26: Keith Avenue to Silver Creek Drive 4,684,000 4,684,000
Mountain Road: Tenth Line to Osler Bluff Road 2,872,100 2,872,100
Hume Street: PRP to Hurontario Street 6,931,800 6,931,800
Sixth Line: Poplar Sideroad to Sandford Fleming Dr. 850,400 850,400
Hurontario Street: Hume Street to Collins Street 1,636,000 1,636,000
Collins Street: Ste. Marie Street to Katherine Street 755,600 755,600
High Street: Third Street to Fifth Street 1,002,400 1,002,400
Tenth Line: Sixth Street to Mountain Road 3,326,300 3,326,300
Highway 26: Keith Avenue to Silver Creek Drive 7,277,000 7,277,000
High Street: Poplar Sideroad to Tenth Street 3,276,700 3,276,700
Third Street: High Street to Maple Street 2,179,100 2,179,100
Cameron Street Extension: High St. to Hurontario St. 1,503,400 1,503,400
Mountain Road: Cambridge Street to Tenth Line 8,333,600 8,333,600
Peel Street: Ontario Street to Collins Street 2,441,400 2,441,400
Harbour Street Extension: Tenth Line to Georgian Trail 725,800 725,800
Sixth Street: Tenth Line to High Street 2,404,900 2,404,900
Highway 26: PRP to Marine View Drive 8,700,000 8,700,000
Sandford Fleming Drive Extension: Sixth Line to Highway 26 285,400 285,400
Huron Street: Pine Street to Heritage Drive 685,500 685,500
Class EA & Studies 120,000 120,000
Road Upgrades (Peel & Collins)* 50,000 50,000
Intersection Improvements
Hume Street / St. Marie Street 225,000 225,000
Hume Street / Minnesota Street 225,000 225,000
Hume Street / Peel Street 225,000 225,000
Hume Street / Raglan Street 225,000 225,000
Highway 26N / Sandford Fleming Drive 225,000 225,000
Sixth Street / Oak Street 200,000 200,000
High Street / Home Depot Access 93,750 93,750
High Street / Third Street 250,000 250,000
High Street / First Street 375,000 375,000
Highway 26 / Habour Street / Balsam Street 375,000 375,000
Mountain Road / First Street Extension / Cambridge Street 187,500 187,500
High Street / Third Street 437,500 437,500
High Street / Sixth Street 93,750 93,750
High Street / First Street 250,000 250,000
Mountain Road / Tenth Line 62,500 62,500
Hurontario Street / Hume Street 12,500 12,500
Hume Street / Pretty River Parkway 12,500 12,500
Mountain Road / Tenth Line 1,000,000 1,000,000
Sixth Street / Tenth Line 1,000,000 1,000,000
Poplar Sideroad / Sixth Line 1,000,000 1,000,000
Sidewalks
High Street: Third Street to Fifth Street 213,000 213,000
High Street: Poplar Sideroad to Tenth Street 608,200 608,200
Poplar Sideroad: Hurontario Street to High Street 67,900 67,900
Highway 26: Pretty River Parkway to Sixth Line 627,400 627,400
Mountain Road: Cambridge Street to Tenth Line 457,400 457,400
Tenth Line: Poplar Sideroad to Sixth Street 144,300 144,300
Tenth Line: Sixth Street to Mountain Road 83,100 83,100
Mountain Road: Tenth Line to Osler Bluff Road 170,400 170,400
Highway 26: Osler Bluff Road to Lighthouse Lane 161,900 161,900
Third Street: Spruce Street to Maple Street 264,700 264,700
Collins Street: Hurontario Street to Katherine Street 170,900 170,900
Cameron Street: High Street to Hurontario Street 321,300 321,300
Peel Street: Ontario Street to Bush Street 451,800 451,800
Sixth Street: Tenth Line to High Street 543,900 543,900
Second Street: High Street to Spruce Street 46,000 46,000
Hurontario Street: Lockhart Road to Poplar Sideroad 162,900 162,900
Huron Street: Niagra Street to Naper Street 52,200 52,200
Outstanding Credits 509,161 509,161
Town of Collingwood
2014 Asset Management Plan
Description TotalForecast
Table F-1Tax Supported Expansion Projects - Uninflated (2014 $)
Watson & Associates Economists Ltd. H:\Collingwood\2013 Asset Management\Collingwood AM Model FINAL v3.xlsx
F-1

2014 2015 2016 2017 2018 2019 2020 2021 2022 2023 2024 2025 2026 2027 2028 2029 2030 2031 2032 2033
Town of Collingwood
2014 Asset Management Plan
Description TotalForecast
Table F-1Tax Supported Expansion Projects - Uninflated (2014 $)
Public Works Facilities
Office Addition 380,000 380,000
Rolling Stock
Provision for Added Needs from Growth (2014-2018) 765,000 153,000 153,000 153,000 153,000 153,000
Provision for Added Needs from Growth (2019-2031) 1,989,000 153,000 153,000 153,000 153,000 153,000 153,000 153,000 153,000 153,000 153,000 153,000 153,000 153,000 Transit Vehicles, Shelters and Pads
40 ft Low Floor Eldorado Transit Bus 433,000 433,000
40 ft Low Floor Eldorado Transit Bus 433,000 433,000
Additional Bus Shelters (1/year) 40,000 4,000 4,000 4,000 4,000 4,000 4,000 4,000 4,000 4,000 4,000 Parking Spaces
100 space parking lot 850,000 850,000
100 space parking lot 850,000 850,000 Airport Facilities, Runways & Taxiways
Provision for Airport Space 175,000 175,000
Provision for Airport Space 175,000 175,000
New Taxiway 1,300,000 1,300,000 Parkland Development
Sunset Point phased 4,230,000 1,410,000 1,410,000 1,410,000
Harbourlands phased 4,760,000 4,760,000
New Park - South of Admiral School 825,000 825,000
New Park - Consar/Red Maple Development 825,000 825,000
New Park - Mountain Croft subdivision 715,000 715,000
New Park - Mair Mills phase 2 825,000 825,000
New Park - Riverside Park 210,000 210,000
New Park - Linksview subdivision 825,000 825,000
New Park - Baseball Facility 2,000,000 2,000,000
New Park - future subdivision development 1,000,000 1,000,000
Harbourlands - Shipyards Walkway 911,410 911,410
Fisher Field - soccer fields, washroom, office, parking lots, lighting 625,000 625,000
Heritage Park - phase 1 440,000 440,000
Heritage Park - phase 2 600,000 600,000
Heritage Park - phase 3 700,000 700,000
Harbourview Park washroom facility 500,000 500,000
Picnic Shelter 26,000 26,000
Playground Upgrades 675,000 75,000 75,000 75,000 75,000 75,000 75,000 75,000 75,000 75,000
Neighbourhood Park - field house, washrooms, fencing, lighting, parking lots 675,000 75,000 75,000 75,000 75,000 75,000 75,000 75,000 75,000 75,000
Shade Shelters 500,000 50,000 50,000 50,000 50,000 50,000 50,000 50,000 50,000 50,000 50,000
Town Signage 50,000 50,000
Ball Diamond Lights 100,000 100,000
Multi-Use Courts - tennis, basketball etc. 500,000 500,000
Splash Park 300,000 300,000
Lawn bowling 750,000 750,000
Skateboard Park 400,000 400,000
Harbourview Park pedestrian lighting 250,000 250,000
Docking - Promenade 375,000 375,000
Docking - Finger Docks 500,000 500,000
Docking - MacDonald 1,000,000 1,000,000
Community trails 1,000,000 100,000 100,000 100,000 100,000 100,000 100,000 100,000 100,000 100,000 100,000 Parks and Recreation Vehicles and Equipment
Tractor (1) 60,000 60,000
Tractor (1) 62,000 62,000
Tractor (1) 64,000 64,000
Tractor (1) 66,000 66,000
Tractor (1) 68,000 68,000
Pickup Truck (1 annually) 250,000 25,000 25,000 25,000 25,000 25,000 25,000 25,000 25,000 25,000 25,000
1 Tonne Truck 50,000 50,000
1 Tonne Truck 60,000 60,000
Mower (1 annually) 100,000 10,000 10,000 10,000 10,000 10,000 10,000 10,000 10,000 10,000 10,000
Truck for Facility Division 30,000 30,000 Indoor Recreation Facilities
Curling Club - Renovations 370,000 370,000
Arena Renovation - Accessiblity 21,000 21,000
Eddie Bush Memorial Arena refrigeration & equipment 1,057,000 1,057,000
Eddie Bush Memorial Arena Floor Upgrade to allow for year round use & Board Replacem 500,000 500,000
Indoor Recreation Space at Marina 3,170,000 3,170,000
Building at curling club to house tractor 50,000 50,000 Library Collection Materials
Provision for Materials (2014-2018) 735,000 147,000 147,000 147,000 147,000 147,000
Provision for Materials (2019-2023) 735,000 147,000 147,000 147,000 147,000 147,000 Administration Studies
Road Needs Study/Transportation Study 210,000 210,000
Parks & Recreation Master Plan 250,000 250,000
Development Charge Study 84,000 42,000 42,000
Development Charge Study 200,000 40,000 160,000
Official Plan -
Fire Master Plan -
Total Capital Expenditures 122,240,071 4,137,500 15,178,361 11,822,400 17,202,400 12,001,260 8,338,200 6,037,600 8,972,600 2,592,400 7,551,750 8,624,400 5,018,400 3,590,100 2,557,900 878,800 7,430,000 153,000 153,000 - -
Watson & Associates Economists Ltd. H:\Collingwood\2013 Asset Management\Collingwood AM Model FINAL v3.xlsx
F-2

2014 2015 2016 2017 2018 2019 2020 2021 2022 2023 2024 2025 2026 2027 2028 2029 2030 2031 2032 2033
Town of Collingwood
2014 Asset Management Plan
Description TotalForecast
Table F-1Tax Supported Expansion Projects - Uninflated (2014 $)
Capital Financing
Provincial/Federal Grants - - - - - - - - - - - - - - - - - - - - -
Other Contributions 8,608,150 - - - 8,289,400 318,750 - - - - - - - - - - - - - - -
Growth Related Debenture Requirements - - - - - - - - - - - - - - - - - - - - -
Non-Growth Related Debenture Requirements - - - - - - - - - - - - - - - - - - - - -
Development Charges Reserve Fund 75,094,260 2,073,540 8,342,360 8,282,858 5,899,160 6,606,696 5,014,564 4,791,062 5,516,810 1,705,110 4,837,040 7,506,741 2,997,040 2,284,959 2,076,920 878,800 5,974,600 153,000 153,000 - -
Tax Supported Capital Reserve Fund 38,537,661 2,063,960 6,836,001 3,539,542 3,013,840 5,075,814 3,323,636 1,246,538 3,455,790 887,290 2,714,710 1,117,659 2,021,360 1,305,141 480,980 - 1,455,400 - - - -
Lifecycle Reserve Fund - - - - - - - - - - - - - - - - - - - - -
Total Capital Financing 122,240,071 4,137,500 15,178,361 11,822,400 17,202,400 12,001,260 8,338,200 6,037,600 8,972,600 2,592,400 7,551,750 8,624,400 5,018,400 3,590,100 2,557,900 878,800 7,430,000 153,000 153,000 - -
Watson & Associates Economists Ltd. H:\Collingwood\2013 Asset Management\Collingwood AM Model FINAL v3.xlsx
F-3

2015 2016 2017 2018 2019 2020 2021 2022 2023 2024 2025 2026 2027 2028 2029 2030 2031 2032 2033
Prior Capital ExpensesGeneral Government 1,923,055 1,258,278 811,000 - - - - - - - - - - - - - - - - - - - Protection Services 2,595,415 3,187,843 724,272 - - - - - - - - - - - - - - - - - - - Transportation Services 7,519,099 3,281,000 5,415,000 - - - - - - - - - - - - - - - - - - - Parks, Recreation and Culture 6,315,772 9,419,614 2,455,048 - - - - - - - - - - - - - - - - - - - Municipal Services Boards 30,202 84,500 57,000 - - - - - - - - - - - - - - - - - - - Parking 12,408 - 59,900 - - - - - - - - - - - - - - - - - - -
Capital Replacement ForecastRoad Base 158,755 163,518 168,424 173,476 178,681 184,041 189,562 195,249 201,107 207,140 213,354 219,755 226,347 233,138 240,132 247,336 254,756 262,398 270,270 Road Surface 897,040 923,951 951,669 980,219 1,009,626 1,039,915 1,071,112 1,103,246 1,136,343 1,170,433 1,205,546 1,241,713 1,278,964 1,317,333 1,356,853 1,397,559 1,439,485 1,482,670 1,527,150 Bridges 557,496 574,220 591,447 609,190 627,466 646,290 665,679 685,649 706,219 727,405 749,227 771,704 794,855 818,701 843,262 868,560 894,617 921,455 949,099 Sidewalks 134,687 138,727 142,889 147,176 151,591 156,139 160,823 165,648 170,617 175,736 181,008 186,438 192,031 197,792 203,726 209,837 216,133 222,616 229,295 Traffic Signals 96,241 99,128 102,102 105,165 108,320 111,570 114,917 118,364 121,915 125,573 129,340 133,220 137,217 141,333 145,573 149,940 154,438 159,072 163,844 Streetlights - - - - - - - - - - - - - - - - - - - Other Infrastructure 140,776 144,999 149,349 153,830 158,445 163,198 168,094 173,137 178,331 183,681 189,191 194,867 200,713 206,734 212,937 219,325 225,904 232,681 239,662 Land Improvements 334,456 344,490 354,824 365,469 376,433 387,726 399,358 411,339 423,679 436,389 449,481 462,965 476,854 491,160 505,895 521,072 536,704 552,805 569,389 Buildings 517,857 533,393 549,395 565,876 582,853 600,338 618,348 636,899 656,006 675,686 695,957 716,835 738,340 760,491 783,305 806,804 831,009 855,939 881,617 Equipment 248,497 255,952 263,631 271,540 279,686 288,076 296,719 305,620 314,789 324,232 333,959 343,978 354,298 364,926 375,874 387,150 398,765 410,728 423,050 Fleet 636,466 655,560 675,227 695,484 716,349 737,839 759,974 782,773 806,257 830,444 855,358 881,018 907,449 934,672 962,713 991,594 1,021,342 1,051,982 1,083,541 Storm Sewers 49,010 50,480 51,994 53,554 55,161 56,816 58,520 60,276 62,084 63,946 65,865 67,841 69,876 71,972 74,131 76,355 78,646 81,005 83,435
Level of Service AdjustmentsRehabiliation and Renewal Works - - - - - - - - - - - - - - - - - - -
Capital Expansion ForecastGrowth Projects (DC) 15,633,712 12,542,384 18,797,527 13,507,524 9,666,259 7,209,210 11,035,166 3,283,975 9,853,321 11,590,472 6,946,639 5,118,624 3,756,362 1,329,264 11,575,698 245,520 252,886 - -
Total Expenditures 18,395,951 17,231,235 9,522,220 19,404,992 16,426,803 22,798,478 17,628,504 13,910,869 11,581,158 15,538,272 7,922,174 14,630,666 16,511,138 12,014,925 10,338,958 9,133,307 6,867,516 17,280,098 6,121,052 6,304,684 6,233,352 6,420,353
Capital FinancingProvincial/Federal Grants 1,000,000 1,644,500 2,282,335 - - - - - - - - - - - - - - - - - - - Other Contributions - - - - - 9,058,051 358,756 - - - - - - - - - - - - - - - Non-Growth Related Debentures - 8,339,315 1,069,900 - 1,800,000 3,200,000 5,200,000 3,000,000 - 2,000,000 - - - - - - - - - - - - Growth Related Debentures - - - - - - - - - - - - - - - - - - - - - - Internally Financed 50,000 81,625 532,000 - - - - - - - - - - - - - - - - - - - Reserve Fund: Development Charges 2,284,829 3,667,296 1,685,181 8,592,631 8,787,284 6,446,171 7,435,895 5,813,254 5,720,779 6,784,980 2,159,982 6,311,240 10,088,432 4,148,604 3,257,805 3,050,027 1,329,264 9,308,232 245,520 252,886 - - Reserve Fund: Federal Gas Tax 810,437 33,111 - 868,674 868,674 868,674 536,905 536,905 536,905 536,905 536,905 536,905 536,905 536,905 536,905 536,905 536,905 536,905 536,905 536,905 536,905 536,905 Reserve/Reserve Fund: Other 2,713,140 2,160,948 3,233,804 2,000,000 - - - - - - - - - - - - - - - - - - Other (Expense Recoveries, Donations) 1,036,700 969,950 568,000 1,445,476 314,159 42,207 34,199 - - - - - - - - - - - - - - -
Transfer from Operating 590,501 334,490 151,000 - - - - - - - - - - - - - - - - - - - Reserve Fund: New Capital (Tax Supported) - - - 6,498,212 4,656,686 3,183,375 4,062,750 4,560,710 5,323,474 6,216,387 5,225,287 7,782,521 5,885,801 7,329,416 6,544,248 5,546,375 5,001,348 7,434,961 5,338,627 5,514,893 5,696,447 5,883,448
Total Capital Financing 8,485,608 17,231,235 9,522,220 19,404,992 16,426,803 22,798,478 17,628,504 13,910,869 11,581,158 15,538,272 7,922,174 14,630,666 16,511,138 12,014,925 10,338,958 9,133,307 6,867,516 17,280,098 6,121,052 6,304,684 6,233,352 6,420,353
Total Capital Expenses less Capital Financing 9,910,343 - - - - - - - - - - - - - - - - - - - - -
Actual 2012
Budget 2013
Forecast Budget 2014
Financing Strategy2014 Asset Management Plan
Town of Collingwood
Table F-2
Tax Supported Capital Forecast
Description
Watson & Associates Economists Ltd. H:\Collingwood\2013 Asset Management\Collingwood AM Model FINAL v3.xlsx
F-4

Financing Strategy2014 Asset Management Plan
Town of Collingwood
Non-Growth Related Debt Principal
Year (Inflated) 2015 2016 2017 2018 2019 2020 2021 2022 2023 2024 2025 2026 2027 2028 2029 2030 2031 2032 2033
Budget 2013 4,300,000 345,043 345,043 345,043 345,043 345,043 345,043 345,043 345,043 345,043 345,043 345,043 345,043 345,043 345,043 345,043 345,043 345,043 345,043 345,043 345,043 Budget 2014 1,069,900 85,852 85,852 85,852 85,852 85,852 85,852 85,852 85,852 85,852 85,852 85,852 85,852 85,852 85,852 85,852 85,852 85,852 85,852 85,852
2015 - - - - - - - - - - - - - - - - - - - 2016 1,800,000 144,437 144,437 144,437 144,437 144,437 144,437 144,437 144,437 144,437 144,437 144,437 144,437 144,437 144,437 144,437 144,437 144,437 2017 3,200,000 256,776 256,776 256,776 256,776 256,776 256,776 256,776 256,776 256,776 256,776 256,776 256,776 256,776 256,776 256,776 256,776 2018 5,200,000 417,261 417,261 417,261 417,261 417,261 417,261 417,261 417,261 417,261 417,261 417,261 417,261 417,261 417,261 417,261 2019 3,000,000 240,728 240,728 240,728 240,728 240,728 240,728 240,728 240,728 240,728 240,728 240,728 240,728 240,728 240,728 2020 - - - - - - - - - - - - - - 2021 2,000,000 160,485 160,485 160,485 160,485 160,485 160,485 160,485 160,485 160,485 160,485 160,485 160,485 2022 - - - - - - - - - - - - 2023 - - - - - - - - - - - 2024 - - - - - - - - - - 2025 - - - - - - - - - 2026 - - - - - - - - 2027 - - - - - - - 2028 - - - - - - 2029 - - - - - 2030 - - - - 2031 - - - 2032 - - 2033 - -
Total Annual Non-Growth Related Debt Charges 20,569,900 345,043 430,895 430,895 575,331 832,108 1,249,369 1,490,097 1,490,097 1,650,582 1,650,582 1,650,582 1,650,582 1,650,582 1,650,582 1,650,582 1,650,582 1,650,582 1,650,582 1,650,582 1,650,582
Development Charges Reserve Fund
(All Tax Supported Funds) 2015 2016 2017 2018 2019 2020 2021 2022 2023 2024 2025 2026 2027 2028 2029 2030 2031 2032 2033
Opening Balance 2,724,131 5,221,862 821,902 (3,766,759) (5,959,601) (9,104,308) (10,553,419) (11,831,863) (14,114,074) (11,615,140) (13,189,174) (19,120,608) (19,008,231) (17,879,243) (16,408,020) (13,042,460) (17,636,350) (12,964,272) (7,926,870) (2,419,685) Development Charge Proceeds 4,359,056 4,448,127 4,537,090 4,627,831 4,720,388 4,814,796 4,911,092 5,009,313 5,109,500 5,211,690 4,740,823 4,835,640 4,932,352 5,030,999 5,131,619 5,234,252 5,338,937 5,445,716 5,554,630 5,665,723 Transfer to Capital 1,685,181 8,592,631 8,787,284 6,446,171 7,435,895 5,813,254 5,720,779 6,784,980 2,159,982 6,311,240 10,088,432 4,148,604 3,257,805 3,050,027 1,329,264 9,308,232 245,520 252,886 - - Transfer to Operating 278,534 271,572 264,609 257,647 250,685 243,722 236,760 229,798 222,835 215,873 208,911 201,948 194,986 188,024 181,061 174,099 167,137 - - - Interest Earned 102,389 16,116 (73,858) (116,855) (178,516) (206,930) (231,997) (276,747) (227,748) (258,611) (374,914) (372,710) (350,573) (321,726) (255,735) (345,811) (254,201) (155,429) (47,445) 64,921 Closing Balance 5,221,862 821,902 (3,766,759) (5,959,601) (9,104,308) (10,553,419) (11,831,863) (14,114,074) (11,615,140) (13,189,174) (19,120,608) (19,008,231) (17,879,243) (16,408,020) (13,042,460) (17,636,350) (12,964,272) (7,926,870) (2,419,685) 3,310,958
Required from Development Charges 1,685,181 8,592,631 8,787,284 6,446,171 7,435,895 5,813,254 5,720,779 6,784,980 2,159,982 6,311,240 10,088,432 4,148,604 3,257,805 3,050,027 1,329,264 9,308,232 245,520 252,886 - - Required Debenture FundingNote: Growth related debt may be required when development charge reserve funds go into a negative position. In this situation, development charge proceeds fund the growth related debt payments.
Capital Reserve/Reserve Funds
(All Tax Supported) 2015 2016 2017 2018 2019 2020 2021 2022 2023 2024 2025 2026 2027 2028 2029 2030 2031 2032 2033
Opening Balance 7,118,323 7,803,330 3,025,053 926,112 1,091,699 1,132,163 1,333,271 1,663,517 2,930,758 6,329,505 7,796,336 11,855,129 15,536,536 20,743,027 27,744,014 36,137,010 43,324,061 53,515,433 64,682,939 76,653,961 Transfers From Operating/Capital 532,000 1,660,620 2,539,586 3,327,557 4,081,014 4,735,675 5,621,103 7,426,162 8,499,926 9,096,482 9,712,141 10,706,185 11,344,013 12,003,361 12,685,775 13,772,520 14,480,677 15,414,107 16,164,450 16,941,300 Transfer to Capital - 6,498,212 4,656,686 3,183,375 4,062,750 4,560,710 5,323,474 6,216,387 5,225,287 7,782,521 5,885,801 7,329,416 6,544,248 5,546,375 5,001,348 7,434,961 5,338,627 5,514,893 5,696,447 5,883,448 Transfer to Operating - - - - - - - - - - - - - - - - - - - - Interest Earned 153,006 59,315 18,159 21,406 22,199 26,143 32,618 57,466 124,108 152,869 232,454 304,638 406,726 544,000 708,569 849,491 1,049,322 1,268,293 1,503,019 1,754,236 Closing Balance 7,803,330 3,025,053 926,112 1,091,699 1,132,163 1,333,271 1,663,517 2,930,758 6,329,505 7,796,336 11,855,129 15,536,536 20,743,027 27,744,014 36,137,010 43,324,061 53,515,433 64,682,939 76,653,961 89,466,050 Note: Closing reserve fund balance as a percentage of capital asset balance 3.07% 1.16% 0.34% 0.39% 0.40% 0.45% 0.55% 0.94% 1.97% 2.35% 3.48% 4.42% 5.73% 7.44% 9.41% 10.96% 13.14% 15.42% 17.74% 20.10%
Budget 2014
Forecast
Budget 2014
Forecast
Table F-4
Table F-3Debt Requirements
Reserve and Reserve Fund Continuity Schedules
Budget 2014
Forecast
Watson & Associates Economists Ltd. H:\Collingwood\2013 Asset Management\Collingwood AM Model FINAL v3.xlsx
F-5

Financing Strategy2014 Asset Management Plan
Town of Collingwood
2015 2016 2017 2018 2019 2020 2021 2022 2023 2024 2025 2026 2027 2028 2029 2030 2031 2032 2033
Net Expenditures/(Revenues):General Government 3,695,468 2,888,322 3,441,052 3,509,800 3,579,900 3,651,300 3,724,300 3,798,700 3,874,600 3,952,100 4,031,100 4,111,700 4,193,900 4,277,800 4,363,300 4,450,600 4,539,600 4,630,300 4,722,800 4,817,200 4,913,500 5,011,800 General Taxation (964,167) (730,000) (518,000) (528,400) (539,000) (549,800) (560,800) (572,000) (583,400) (595,100) (607,000) (619,100) (631,500) (644,100) (657,000) (670,100) (683,500) (697,200) (711,100) (725,300) (739,800) (754,600) Protection Services 8,993,758 10,080,152 10,520,300 10,730,700 10,945,300 11,164,300 11,387,600 11,615,300 11,847,600 12,084,600 12,326,400 12,573,000 12,824,500 13,081,000 13,342,600 13,609,500 13,881,700 14,159,400 14,442,600 14,731,500 15,026,100 15,326,600 Parks, Recreation and Culture 2,926,203 3,151,624 3,672,580 3,746,100 3,821,100 3,897,600 3,975,700 4,055,300 4,136,600 4,219,500 4,304,000 4,390,100 4,478,100 4,567,800 4,659,400 4,752,800 4,848,000 4,945,100 5,044,100 5,145,100 5,248,100 5,353,300 Planning & Development 1,024,553 1,109,551 1,110,073 1,132,300 1,154,900 1,178,100 1,201,700 1,225,800 1,250,300 1,275,300 1,300,800 1,326,800 1,353,300 1,380,300 1,407,800 1,436,000 1,464,700 1,493,900 1,523,800 1,554,300 1,585,400 1,617,100 Transportation Services 3,134,181 3,146,449 3,700,341 3,774,400 3,849,900 3,926,900 4,005,500 4,085,600 4,167,200 4,250,500 4,335,500 4,422,200 4,510,600 4,600,900 4,693,000 4,786,900 4,882,600 4,980,200 5,079,900 5,181,500 5,285,300 5,390,900 Municipal Service Boards 1,680,949 1,766,094 1,476,062 1,505,700 1,535,700 1,566,400 1,597,800 1,629,800 1,662,400 1,695,600 1,729,600 1,764,300 1,799,700 1,835,600 1,872,200 1,909,600 1,947,700 1,986,600 2,026,400 2,066,900 2,108,100 2,150,200 Environmental Services (115,124) (135,500) (148,581) (151,600) (154,600) (157,700) (160,900) (164,100) (167,400) (170,800) (174,200) (177,700) (181,300) (185,000) (188,700) (192,500) (196,400) (200,400) (204,400) (208,500) (212,700) (217,000) Social Housing 73,897 79,188 80,708 82,300 84,000 85,700 87,400 89,100 90,900 92,700 94,500 96,400 98,300 100,300 102,300 104,400 106,500 108,600 110,800 113,000 115,200 117,500
Net Expenditures due to Level of Service Adjustments - - - 83,232 111,427 140,716 143,531 146,401 149,329 152,316 155,362 158,469 161,639 164,871 168,169 171,532 174,963 178,462 182,031 185,672 189,385 193,173
Transfer to Capital 590,501 334,490 151,000 - - - - - - - - - - - - - - - - - - -
Transfers to Reserve FundsTransfer to Obligatory Reserve/Reserve Funds - - - - - - - - - - - - - - - - - - - - - - Transfer to Other Reserve/Reserve Funds - - - - - - - - - - - - - - - - - - - - - - Transfers to Reserve Funds (Capital Related) 532,513 424,000 532,000 - - - - - - - - - - - - - - - - - - -
Transfer to Tax Supported Capital Reserve Fund(s) - - - 1,660,620 2,539,586 3,327,557 4,081,014 4,735,675 5,621,103 7,426,162 8,499,926 9,096,482 9,712,141 10,706,185 11,344,013 12,003,361 12,685,775 13,772,520 14,480,677 15,414,107 16,164,450 16,941,300
Debentures Debenture Payments 3,054,891 3,023,516 3,029,660 2,597,321 2,520,093 2,439,525 2,361,425 2,278,555 2,201,061 1,507,311 1,450,001 1,392,335 1,335,502 920,889 883,793 846,697 809,601 391,712 376,047 - - - New Debt - Growth Related - - - - - - - - - - - - - - - - - - - - - - New Debt - Non-Growth Related - - - 430,895 430,895 575,331 832,108 1,249,369 1,490,097 1,490,097 1,650,582 1,650,582 1,650,582 1,650,582 1,650,582 1,650,582 1,650,582 1,650,582 1,650,582 1,650,582 1,650,582 1,650,582 Transfer from Reserve Fund: Development Charges (Debt) - - - (271,572) (264,609) (257,647) (250,685) (243,722) (236,760) (229,798) (222,835) (215,873) (208,911) (201,948) (194,986) (188,024) (181,061) (174,099) (167,137) - - -
Surplus/(Deficit) Adjustment 329 - - - - - - - - - - - - - - - - - - - - -
Total Taxation Levy 24,627,953 25,137,886 27,047,195 28,301,796 29,614,591 30,988,282 32,425,692 33,929,778 35,503,630 37,150,487 38,873,736 39,969,695 41,096,553 42,255,180 43,446,471 44,671,349 45,930,760 47,225,677 48,557,100 49,926,061 51,333,617 52,780,855
Taxation Levy AnalysisPrior Year Taxation Levy 24,431,232 24,627,953 25,137,886 27,047,195 28,301,796 29,614,591 30,988,282 32,425,692 33,929,778 35,503,630 37,150,487 38,873,736 39,969,695 41,096,553 42,255,180 43,446,471 44,671,349 45,930,760 47,225,677 48,557,100 49,926,061 51,333,617 Add: Provision for Assessment Growth (see below) - - 1,380,070 270,472 283,018 296,146 309,883 324,257 339,298 355,036 371,505 388,737 399,697 410,966 422,552 434,465 446,713 459,308 472,257 485,571 499,261 513,336
Current Year Taxation Levy at 0.0% Increase 24,431,232 24,627,953 26,517,956 27,317,667 28,584,814 29,910,737 31,298,165 32,749,949 34,269,076 35,858,666 37,521,992 39,262,473 40,369,392 41,507,519 42,677,732 43,880,936 45,118,062 46,390,068 47,697,934 49,042,671 50,425,322 51,846,953 Additional Increase in Taxation Levy for the year 196,721 509,933 529,239 984,129 1,029,777 1,077,545 1,127,527 1,179,829 1,234,554 1,291,821 1,351,744 707,222 727,161 747,661 768,739 790,413 812,698 835,609 859,166 883,390 908,295 933,902
Total Taxation Levy 24,627,953 25,137,886 27,047,195 28,301,796 29,614,591 30,988,282 32,425,692 33,929,778 35,503,630 37,150,487 38,873,736 39,969,695 41,096,553 42,255,180 43,446,471 44,671,349 45,930,760 47,225,677 48,557,100 49,926,061 51,333,617 52,780,855
Percentage Increase (Factoring in Assessment Growth) 3.60% 3.60% 3.60% 3.60% 3.60% 3.60% 3.60% 3.60% 1.80% 1.80% 1.80% 1.80% 1.80% 1.80% 1.80% 1.80% 1.80% 1.80% 1.80%
2015 2016 2017 2018 2019 2020 2021 2022 2023 2024 2025 2026 2027 2028 2029 2030 2031 2032 2033Assessment Growth Estimate (%) 5.5% 1.0% 1.0% 1.0% 1.0% 1.0% 1.0% 1.0% 1.0% 1.0% 1.0% 1.0% 1.0% 1.0% 1.0% 1.0% 1.0% 1.0% 1.0% 1.0%
Forecast Budget 2014
Actual 2012
Budget 2013
Tax Supported Operating Budget Forecast Summary
Net Impact on Taxation Budget
2014
Forecast
Table F-5
$0
$2,000,000
$4,000,000
$6,000,000
$8,000,000
$10,000,000
$12,000,000
$14,000,000
$16,000,000
$18,000,000
2014 2015 2016 2017 2018 2019 2020 2021 2022 2023 2024 2025 2026 2027 2028 2029 2030 2031 2032
Annual Infrastructure Funding Gap Analysis (Inflated)
Current Capital with Inflation Recommended Funding Increase Optimal Funding
Watson & Associates Economists Ltd. H:\Collingwood\2013 Asset Management\Collingwood AM Model FINAL v3.xlsx
F-6
Watson & Associates Economists Ltd. H:\Collingwood\2013 Asset Management\Collingwood AM Plan Report FINAL.docx
APPENDIX G
WATER ASSET MANAGEMENT STRATEGY & FINANCING
STRATEGY


Ap
pen
dix
G-1
Wat
er S
ervi
ceC
apit
al B
ud
get
Fo
reca
stIn
flate
d $
Bu
dg
etD
escr
ipti
on
To
tal
2013
2014
2015
2016
2017
2018
2019
2020
2021
2022
Cap
ital
Exp
end
itu
res
Wat
erm
ain
Val
ve C
oo
rdin
atio
n:
Val
ve a
dditi
on &
rep
lace
men
t pro
ject
s32
6,40
030
,000
30,0
0030
,000
30,0
0032
,300
33,1
0033
,900
34,8
0035
,700
36,6
00W
ater
Co
nse
rvat
ion
Pro
gra
m19
3,30
045
,000
15,0
0015
,000
15,0
0016
,200
16,6
0017
,000
17,4
0017
,800
18,3
00W
ater
Met
er C
oo
rdin
atio
n:
New
& R
efur
bish
ed w
ater
met
ers
2,08
1,90
030
0,00
030
0,00
030
0,00
015
0,00
016
1,50
016
5,60
016
9,70
017
4,00
017
8,30
018
2,80
0W
ater
Hyd
ran
t C
oo
rdin
atio
n:
Hyd
rant
Rep
lace
men
ts16
3,30
015
,000
15,0
0015
,000
15,0
0016
,200
16,6
0017
,000
17,4
0017
,800
18,3
00T
oo
ls a
nd
Eq
uip
men
t: L
arge
Too
ls &
Equ
ipm
ent P
urch
ases
560,
500
111,
000
45,5
0045
,500
45,5
0049
,000
50,2
0051
,500
52,8
0054
,100
55,4
00R
olli
ng
Sto
ck C
oo
rdin
atio
n:
Veh
icle
Pur
chas
e (W
ater
Dep
artm
ent)
213,
900
060
,000
35,0
000
37,7
000
39,6
000
41,6
000
Wat
er S
ervi
ce P
roje
cts:
New
Res
iden
tial a
nd G
ener
al W
ater
Ser
vice
s15
2,30
014
,000
14,0
0014
,000
14,0
0015
,100
15,5
0015
,800
16,2
0016
,600
17,1
00C
om
pu
ter
Har
dw
are
& S
oft
war
e E
qu
ipm
ent:
Com
pute
r H
ardw
are/
Equ
ipm
ent
424,
200
39,0
0039
,000
39,0
0039
,000
42,0
0043
,000
44,1
0045
,200
46,4
0047
,500
Com
pute
r S
oftw
are
Adm
in D
ept (
Ser
ver
& IF
RS
GP
U
pgra
des)
272,
000
25,0
0025
,000
25,0
0025
,000
26,9
0027
,600
28,3
0029
,000
29,7
0030
,500
Com
pute
r S
oftw
are
Wor
ksta
tions
& S
erve
r21
7,60
020
,000
20,0
0020
,000
20,0
0021
,500
22,1
0022
,600
23,2
0023
,800
24,4
00 G
IS S
oftw
are
& E
quip
men
t Pur
chas
es21
7,60
020
,000
20,0
0020
,000
20,0
0021
,500
22,1
0022
,600
23,2
0023
,800
24,4
00O
ther
: W
ater
Rat
e S
tudy
17,5
0017
,500
00
00
00
00
0 W
ater
Mod
el C
alib
ratio
n45
,000
45,0
000
00
00
00
00
Oth
er P
roje
cts
50,0
000
25,0
0025
,000
00
00
00
0G
row
th R
elat
ed P
roje
cts
(as
iden
tifi
ed in
To
wn
's D
C
Stu
dy)
:S
tudi
es D
C S
tudy
38,2
000
17,9
000
00
020
,300
00
0F
acili
ties
:S
tew
art R
oad
BP
S1,
050,
600
00
1,05
0,60
00
00
00
00
Ste
war
t Roa
d R
eser
voir
3,83
1,00
00
153,
800
3,67
7,20
00
00
00
00
Wat
erm
ain
s:H
igh
St.,
Pop
lar
SR
to C
ampb
ell S
t.
420,
300
00
420,
300
00
00
00
010
th L
ine,
6th
St.
to M
ount
ain
Rd.
615,
000
061
5,00
00
00
00
00
0M
ount
ain
Rd.
from
Mai
r M
ills
to 1
0th
Line
434,
000
00
043
4,00
00
00
00
0C
ranb
erry
to G
eorg
ian
Tra
il Li
nk14
2,40
00
00
014
2,40
00
00
00
Nor
th o
f Firs
t St.,
Map
le S
tree
t to
Hw
y 26
74
4,00
00
00
074
4,00
00
00
00
Cla
ss E
nviro
nmen
tal A
sses
smen
ts11
8,90
00
00
00
00
118,
900
00
Th
e T
ow
n o
f C
olli
ng
wo
od
an
d C
olli
ng
wo
od
Pu
blic
Uti
litie
s S
ervi
ce B
oar
d
Fo
reca
st
Wat
son
& A
ssoc
iate
s E
cono
mis
ts L
td.
Wat
er &
Was
tew
ater
Rat
e M
odel
- F
ebru
ary,
201
4 A
M.x
lsx.
xls
G-1

Ap
pen
dix
G-1
co
n't
Wat
er S
ervi
ceC
apit
al B
ud
get
Fo
reca
stIn
flate
d $
Bu
dg
etD
escr
ipti
on
To
tal
2013
2014
2015
2016
2017
2018
2019
2020
2021
2022
Lif
ecyc
le:
Hig
h Li
ft P
umps
33,1
000
00
033
,100
00
00
0M
agne
tic F
low
Met
er4,
400
00
00
4,40
00
00
00
Tur
bidi
ty M
eter
s4,
400
00
00
4,40
00
00
00
Mem
bran
es0
00
00
00
00
00
Par
ticle
Cou
nter
s2,
160,
200
00
00
20,2
000
069
5,80
071
3,20
073
1,00
0R
epla
cem
ent W
ater
Mai
n P
roje
cts
827,
400
00
504,
300
323,
100
00
00
00
Rep
lace
men
t Wat
er S
ervi
ces
- ol
d &
lead
ser
vice
s30
,800
10,0
0010
,300
10,5
000
00
00
00
Wat
er T
ower
Ref
urbi
shm
ent
350,
000
350,
000
00
00
00
00
0In
Gro
und
Res
ervo
ir R
efur
bish
men
t35
8,80
00
358,
800
00
00
00
00
Wat
er T
reat
men
t Pla
nt R
efur
bish
men
t1,
230,
400
434,
000
256,
300
262,
700
53,8
0053
,800
55,2
0056
,600
58,0
000
0O
pera
tion
Cen
tre
Upg
rade
s (A
ll D
epar
tmen
ts)
96,2
0010
,000
35,9
0010
,500
5,40
05,
400
5,50
05,
700
5,80
05,
900
6,10
0T
otal
Cap
ital E
xpen
ditu
res
17,4
25,6
001,
485,
500
2,05
6,50
06,
519,
600
1,18
9,80
01,
447,
600
473,
100
544,
700
1,31
1,70
01,
204,
700
1,19
2,40
0C
apit
al F
inan
cin
gP
rovi
ncia
l/Fed
eral
Gra
nts
00
00
00
00
00
0D
evel
opm
ent C
harg
es2,
023,
652
00
857,
551
370,
501
656,
400
020
,300
118,
900
00
Deb
entu
re R
equi
rem
ents
- G
row
th R
elat
ed4,
245,
923
066
8,05
43,
347,
869
023
0,00
00
00
00
Deb
entu
re R
equi
rem
ents
- N
on-G
row
th R
elat
ed4,
973,
946
1,48
5,50
01,
388,
446
2,10
0,00
00
00
00
00
Con
trib
utio
ns fr
om O
ther
s -
Dev
elop
men
t Agr
eem
ents
00
00
00
00
00
0C
ontr
ibut
ions
from
New
Tec
umse
th0
00
00
00
00
00
Ope
ratin
g C
ontr
ibut
ions
00
00
00
00
00
0R
eser
ves
and
Res
erve
Fun
ds6,
182,
079
00
214,
180
819,
299
561,
200
473,
100
524,
400
1,19
2,80
01,
204,
700
1,19
2,40
0T
otal
Cap
ital F
inan
cing
17,4
25,6
001,
485,
500
2,05
6,50
06,
519,
600
1,18
9,80
01,
447,
600
473,
100
544,
700
1,31
1,70
01,
204,
700
1,19
2,40
0
Fo
reca
st
Th
e T
ow
n o
f C
olli
ng
wo
od
an
d C
olli
ng
wo
od
Pu
blic
Uti
litie
s S
ervi
ce B
oar
d
Wat
son
& A
ssoc
iate
s E
cono
mis
ts L
td.
Wat
er &
Was
tew
ater
Rat
e M
odel
- F
ebru
ary,
201
4 A
M.x
lsx.
xls
G-2

Ap
pen
dix
G-2
Wat
er S
ervi
ce
Infla
ted
$
Inte
rnal
Deb
entu
reP
rin
cip
alY
ear
(In
flat
ed)
2013
2014
2015
2016
2017
2018
2019
2020
2021
2022
2013
1,48
5,50
011
9,20
011
9,20
011
9,20
011
9,20
011
9,20
011
9,20
011
9,20
011
9,20
020
141,
388,
446
111,
413
111,
413
111,
413
111,
413
111,
413
111,
413
111,
413
111,
413
2015
2,10
0,00
016
8,50
916
8,50
916
8,50
916
8,50
916
8,50
916
8,50
916
8,50
920
160
00
00
00
2017
00
00
00
2018
00
00
020
190
00
020
200
00
2021
00
2022
0
To
tal A
nn
ual
Deb
t C
har
ges
4,97
3,94
60
023
0,61
339
9,12
239
9,12
239
9,12
239
9,12
239
9,12
239
9,12
239
9,12
2
* 20
13 D
ebt
req
uir
emen
t to
be
issu
ed in
201
4 w
ith
fir
st d
ebt
pay
men
t in
201
5
Ap
pen
dix
G-3
Wat
er S
ervi
ce
Infla
ted
$
Inte
rnal
Deb
entu
reP
rin
cip
alY
ear
(In
flat
ed)
2013
2014
2015
2016
2017
2018
2019
2020
2021
2022
2013
00
00
00
00
00
2014
668,
054
53,6
0653
,606
53,6
0653
,606
53,6
0653
,606
53,6
0653
,606
2015
3,34
7,86
926
8,64
226
8,64
226
8,64
226
8,64
226
8,64
226
8,64
226
8,64
220
160
00
00
00
2017
230,
000
18,4
5618
,456
18,4
5618
,456
18,4
5620
180
00
00
2019
00
00
2020
00
020
210
020
220
To
tal A
nn
ual
Deb
t C
har
ges
4,24
5,92
30
053
,606
322,
248
322,
248
340,
704
340,
704
340,
704
340,
704
340,
704
Ap
pen
dix
G-4
Wat
er S
ervi
ce
Infla
ted
$
Inte
rnal
Deb
entu
reP
rin
cip
alY
ear
(In
flat
ed)
2013
2014
2015
2016
2017
2018
2019
2020
2021
2022
2013
6,00
0,00
034
9,47
434
9,47
434
9,47
434
9,47
434
9,47
434
9,47
434
9,47
434
9,47
434
9,47
4
To
tal A
nn
ual
Deb
t C
har
ges
6,00
0,00
00
349,
474
349,
474
349,
474
349,
474
349,
474
349,
474
349,
474
349,
474
349,
474
Th
e T
ow
n o
f C
olli
ng
wo
od
an
d C
olli
ng
wo
od
Pu
blic
Uti
litie
s S
ervi
ce B
oar
d Yea
r
Th
e T
ow
n o
f C
olli
ng
wo
od
an
d C
olli
ng
wo
od
Pu
blic
Uti
litie
s S
ervi
ce B
oar
d Yea
r
Sch
edu
le o
f D
eben
ture
Rep
aym
ents
- N
on
-Gro
wth
Rel
ated
Sch
edu
le o
f D
eben
ture
Rep
aym
ents
- G
row
th R
elat
ed
Th
e T
ow
n o
f C
olli
ng
wo
od
an
d C
olli
ng
wo
od
Pu
blic
Uti
litie
s S
ervi
ce B
oar
d
Sch
edu
le o
f L
oan
Rep
aym
ents
- N
on
-Gro
wth
Rel
ated
Yea
r
Wat
son
& A
ssoc
iate
s E
cono
mis
ts L
td.
Wat
er &
Was
tew
ater
Rat
e M
odel
- F
ebru
ary,
201
4 A
M.x
lsx.
xls
G-3
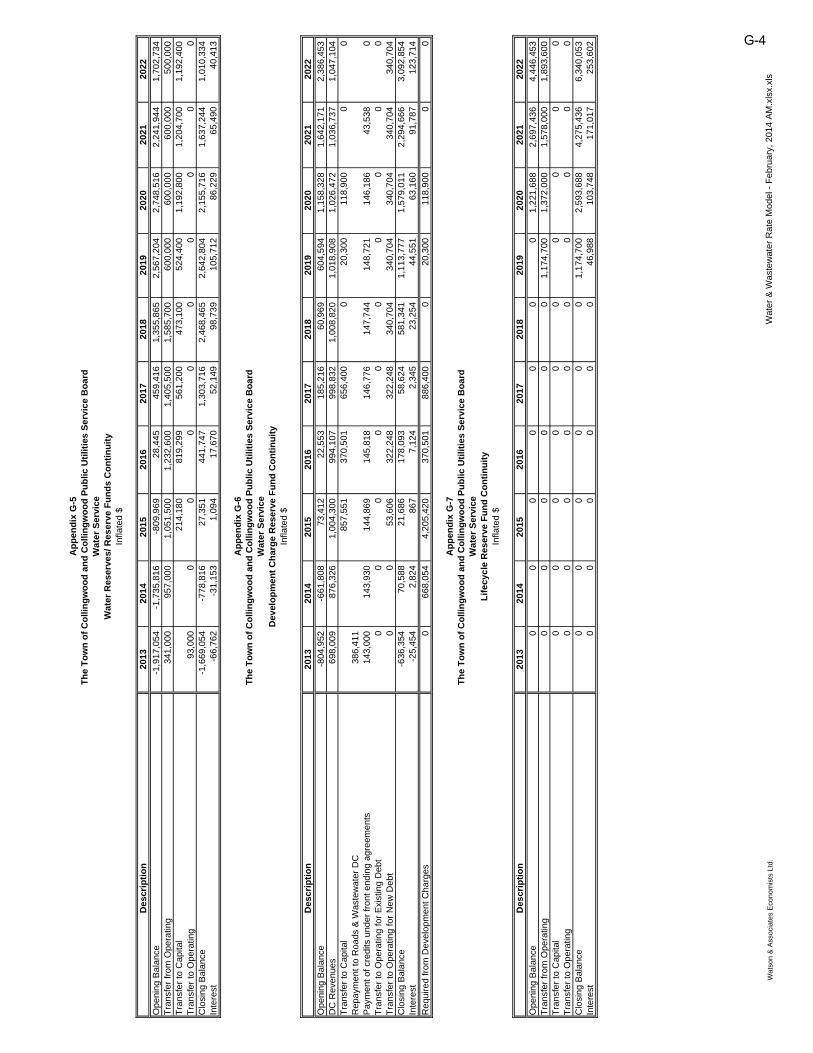
Ap
pen
dix
G-5
Wat
er S
ervi
ceW
ater
Res
erve
s/ R
eser
ve F
un
ds
Co
nti
nu
ity
Infla
ted
$
Des
crip
tio
n20
1320
1420
1520
1620
1720
1820
1920
2020
2120
22
Ope
ning
Bal
ance
-1,9
17,0
54
-1,7
35,8
16
-809
,969
28
,445
459,
416
1,35
5,86
52,
567,
204
2,74
8,51
62,
241,
944
1,70
2,73
4T
rans
fer
from
Ope
ratin
g34
1,00
095
7,00
01,
051,
500
1,23
2,60
01,
405,
500
1,58
5,70
060
0,00
060
0,00
060
0,00
050
0,00
0T
rans
fer
to C
apita
l21
4,18
081
9,29
956
1,20
047
3,10
052
4,40
01,
192,
800
1,20
4,70
01,
192,
400
Tra
nsfe
r to
Ope
ratin
g93
,000
00
00
00
00
0C
losi
ng B
alan
ce-1
,669
,054
-7
78,8
16
27,3
5144
1,74
71,
303,
716
2,46
8,46
52,
642,
804
2,15
5,71
61,
637,
244
1,01
0,33
4In
tere
st-6
6,76
2 -3
1,15
3 1,
094
17,6
7052
,149
98,7
3910
5,71
286
,229
65,4
9040
,413
Ap
pen
dix
G-6
Wat
er S
ervi
ceD
evel
op
men
t C
har
ge
Res
erve
Fu
nd
Co
nti
nu
ity
Infla
ted
$
Des
crip
tio
n20
1320
1420
1520
1620
1720
1820
1920
2020
2120
22
Ope
ning
Bal
ance
-804
,952
-6
61,8
08
73,4
1222
,553
185,
216
60,9
6960
4,59
41,
158,
328
1,64
2,17
12,
386,
453
DC
Rev
enue
s69
8,00
987
6,32
61,
004,
300
994,
107
998,
832
1,00
8,82
01,
018,
908
1,02
6,47
21,
036,
737
1,04
7,10
4T
rans
fer
to C
apita
l85
7,55
137
0,50
165
6,40
00
20,3
0011
8,90
00
0R
epay
men
t to
Roa
ds &
Was
tew
ater
DC
386,
411
Pay
men
t of c
redi
ts u
nder
fron
t end
ing
agre
emen
ts14
3,00
014
3,93
014
4,86
914
5,81
814
6,77
614
7,74
414
8,72
114
6,18
643
,538
0T
rans
fer
to O
pera
ting
for
Exi
stin
g D
ebt
00
00
00
00
00
Tra
nsfe
r to
Ope
ratin
g fo
r N
ew D
ebt
00
53,6
0632
2,24
832
2,24
834
0,70
434
0,70
434
0,70
434
0,70
434
0,70
4C
losi
ng B
alan
ce-6
36,3
54
70,5
8821
,686
178,
093
58,6
2458
1,34
11,
113,
777
1,57
9,01
12,
294,
666
3,09
2,85
4In
tere
st-2
5,45
4 2,
824
867
7,12
42,
345
23,2
5444
,551
63,1
6091
,787
123,
714
Req
uire
d fr
om D
evel
opm
ent C
harg
es0
668,
054
4,20
5,42
037
0,50
188
6,40
00
20,3
0011
8,90
00
0
Ap
pen
dix
G-7
Wat
er S
ervi
ceL
ifec
ycle
Res
erve
Fu
nd
Co
nti
nu
ity
Infla
ted
$
Des
crip
tio
n20
1320
1420
1520
1620
1720
1820
1920
2020
2120
22
Ope
ning
Bal
ance
00
00
00
01,
221,
688
2,69
7,43
64,
446,
453
Tra
nsfe
r fr
om O
pera
ting
00
00
00
1,17
4,70
01,
372,
000
1,57
8,00
01,
893,
600
Tra
nsfe
r to
Cap
ital
00
00
00
00
00
Tra
nsfe
r to
Ope
ratin
g0
00
00
00
00
0C
losi
ng B
alan
ce0
00
00
01,
174,
700
2,59
3,68
84,
275,
436
6,34
0,05
3In
tere
st0
00
00
046
,988
103,
748
171,
017
253,
602
Th
e T
ow
n o
f C
olli
ng
wo
od
an
d C
olli
ng
wo
od
Pu
blic
Uti
litie
s S
ervi
ce B
oar
d
Th
e T
ow
n o
f C
olli
ng
wo
od
an
d C
olli
ng
wo
od
Pu
blic
Uti
litie
s S
ervi
ce B
oar
d
Th
e T
ow
n o
f C
olli
ng
wo
od
an
d C
olli
ng
wo
od
Pu
blic
Uti
litie
s S
ervi
ce B
oar
d
Wat
son
& A
ssoc
iate
s E
cono
mis
ts L
td.
Wat
er &
Was
tew
ater
Rat
e M
odel
- F
ebru
ary,
201
4 A
M.x
lsx.
xls
G-4

Ap
pen
dix
G-8
Wat
er S
ervi
ces
Op
erat
ing
Bu
dg
et F
ore
cast
Infla
ted
$
Bu
dg
etD
escr
ipti
on
2013
2014
2015
2016
2017
2018
2019
2020
2021
2022
Exp
end
itu
res
Ope
ratin
g C
osts
Pro
duct
ion
- P
roce
ss W
ater
Exp
ense
132,
000
-
-
-
-
-
-
-
-
Pro
duct
ion
- F
ilter
ed W
ater
Exp
ense
1,44
5,40
0
-
-
-
-
-
-
-
-
Pro
duct
ion
- O
ther
364,
800
-
-
-
-
-
-
-
-
Mai
nten
ace
1,41
5,13
6
-
-
-
-
-
-
-
-
Out
side
Mun
icip
al W
orks
Exp
ense
(M
eafo
rd)
129,
000
-
-
-
-
-
-
-
-
Wat
er C
onse
rvat
ion
10,9
20
-
-
-
-
-
-
-
-
Adm
inis
trat
ion
Ser
vice
s51
9,60
0
-
-
-
-
-
-
-
-
B
illin
g &
Col
lect
ing
Exp
ense
- L
abou
r, B
urde
n &
Oth
er42
9,00
0
-
-
-
-
-
-
-
-
B
illin
g &
Col
lect
ing
Exp
ense
- C
ontr
act M
eter
Rea
ding
78,0
00
144,
000
147,
600
151,
290
155,
072
158,
949
162,
923
166,
996
171,
171
175,
450
Boa
rd E
xpen
se &
Tra
inin
g18
,000
30
,000
30
,750
31
,519
32
,307
33,1
15
33
,943
34,7
92
35,6
62
36,5
54
Ban
k C
harg
es &
Bad
Deb
t Exp
nese
12,2
40
24,0
00
24,6
00
25,2
15
25,8
45
26
,491
27,1
53
27
,832
28
,528
29
,241
O
utsi
de S
ervi
ces
Exp
ense
232,
416
-
-
-
-
-
-
-
-
Insu
ranc
e &
Inju
ries/
Dam
ages
Exp
ense
133,
496
-
-
-
-
-
-
-
-
Adv
ertis
ing
& M
isc.
Gen
. Exp
ense
s18
,700
8,
400
8,
610
8,
825
9,
046
9,
272
9,
504
9,
742
9,
986
10
,236
In
tere
st E
xpen
se3,
600
-
-
-
-
-
-
-
-
M
unic
ipal
Ret
urn
Exp
ense
216,
000
-
-
-
-
-
-
-
-
Aud
it-
24
,000
24
,600
25
,215
25
,845
26,4
91
27
,153
27,8
32
28,5
28
29,2
41
Che
mic
als
-
94,8
20
97,1
91
99,6
21
102,
112
104,
665
107,
282
109,
964
112,
713
115,
531
Com
pute
r E
quip
men
t, S
uppl
ies,
Sof
twar
e &
Sup
port
-
36,6
00
37,5
15
38,4
53
39,4
14
40
,399
41,4
09
42
,444
43
,505
44
,593
C
onse
rvat
ion
-
7,20
0
7,38
0
7,56
5
7,75
4
7,94
8
8,14
7
8,35
1
8,56
0
8,77
4
Con
sulti
ng-
4,
800
4,
920
5,
043
5,
169
5,
298
5,
430
5,
566
5,
705
5,
848
E
mpl
oyee
Rel
ated
Exp
ense
s-
92
,442
94
,753
97
,122
99
,550
102,
039
104,
590
107,
205
109,
885
112,
632
Equ
ipm
ent R
enta
ls-
60
0
61
5
63
0
64
6
66
2
67
9
69
6
71
3
73
1
F
uel E
xpen
ses
-
39,9
00
40,8
98
41,9
20
42,9
68
44
,042
45,1
43
46
,272
47
,429
48
,615
G
arba
ge C
olle
ctio
n-
28
,260
28
,967
29
,691
30
,433
31,1
94
31
,974
32,7
73
33,5
92
34,4
32
Insp
ectio
n-
30
,200
30
,955
31
,729
32
,522
33,3
35
34
,168
35,0
22
35,8
98
36,7
95
Insu
ranc
e E
xpen
ses
-
145,
800
149,
445
153,
181
157,
011
160,
936
164,
959
169,
083
173,
310
177,
643
Inte
rest
& B
ank
Cha
rges
, Bro
adba
nd F
ees
-
14,0
04
14,3
54
14,7
13
15,0
81
15
,458
15,8
44
16
,240
16
,646
17
,062
Ja
nito
rial E
xpen
ses
-
26,9
40
27,6
14
28,3
04
29,0
12
29
,737
30,4
80
31
,242
32
,023
32
,824
Le
gal
-
6,00
0
6,15
0
6,30
4
6,46
2
6,62
4
6,79
0
6,96
0
7,13
4
7,31
2
Lice
nces
, Fee
s an
d D
ues,
Man
agem
ent F
ees
& W
orks
Day
-
153,
000
156,
825
160,
746
164,
765
168,
884
173,
106
177,
434
181,
870
186,
417
Mat
eria
ls-
50
,040
51
,291
52
,573
53
,887
55,2
34
56
,615
58,0
30
59,4
81
60,9
68
Offi
ce S
uppl
ies,
Pho
toco
pier
Lea
se, P
osta
ge, R
ent &
Tax
es-
47
5,92
0
48
7,81
8
50
0,01
3
51
2,51
3
52
5,32
6
53
8,45
9
55
1,92
0
56
5,71
8
57
9,86
1
R
epai
rs &
Mai
nten
ance
- B
uild
ing
& E
quip
men
t-
17
6,10
0
18
0,50
3
18
5,01
6
18
9,64
1
19
4,38
2
19
9,24
2
20
4,22
3
20
9,32
9
21
4,56
2
S
ecur
ity, O
ffice
Fur
nitu
re, T
ools
, etc
.-
60
,740
62
,259
63
,815
65
,410
67,0
45
68
,721
70,4
39
72,2
00
74,0
05
Stu
dies
-
25,0
00
25,6
25
26,2
66
26,9
23
27
,596
28,2
86
28
,993
29
,718
30
,461
S
ubco
ntra
ct-
98
,600
10
1,06
5
10
3,59
2
10
6,18
2
10
8,83
7
11
1,55
8
11
4,34
7
11
7,20
6
12
0,13
6
U
tiliti
es -
Ele
ctric
ity-
82
6,48
0
84
7,14
2
86
8,32
1
89
0,02
9
91
2,28
0
93
5,08
7
95
8,46
4
98
2,42
6
1,
006,
987
U
tiliti
es -
Nat
ural
Gas
-
9,80
0
10,0
45
10,2
96
10,5
53
10
,817
11,0
87
11
,364
11
,648
11
,939
W
ater
Tes
ting
-
68,7
00
70,4
18
72,1
78
73,9
82
75
,832
77,7
28
79
,671
81
,663
83
,705
W
ebsi
te-
6,
000
6,
150
6,
304
6,
462
6,
624
6,
790
6,
960
7,
134
7,
312
V
ehic
le E
xpen
ses
-
115,
860
118,
757
121,
726
124,
769
127,
888
131,
085
134,
362
137,
721
141,
164
Wag
es-
1,
602,
385
1,
642,
445
1,
683,
506
1,
725,
594
1,
768,
734
1,
812,
952
1,
858,
276
1,
904,
733
1,
952,
351
E
I/CP
P, E
HT
, WS
IG, S
ick,
Vac
atio
n, H
ealth
Ben
eifts
, OM
ER
S, E
xpen
se-
43
8,58
3
44
9,54
8
46
0,78
7
47
2,30
7
48
4,11
5
49
6,21
8
50
8,62
3
52
1,33
9
53
4,37
2
S
ub T
otal
Ope
ratin
g5,
158,
308
4,86
5,17
44,
986,
808
5,11
1,47
95,
239,
266
5,37
0,24
95,
504,
505
5,64
2,11
85,
783,
174
5,92
7,75
4N
ote:
Bud
get s
truc
ture
for
2014
onw
arrd
has
bee
n re
fined
how
ever
, no
sign
ifica
nt c
hang
es in
exp
endi
ture
s ha
ve b
een
mad
e.
Th
e T
ow
n o
f C
olli
ng
wo
od
an
d C
olli
ng
wo
od
Pu
blic
Uti
litie
s S
ervi
ce B
oar
d
Wat
son
& A
ssoc
iate
s E
cono
mis
ts L
td.
Wat
er &
Was
tew
ater
Rat
e M
odel
- F
ebru
ary,
201
4 A
M.x
lsx.
xls
G-5

Ap
pen
dix
G-8
co
n't
Wat
er S
ervi
ces
Op
erat
ing
Bu
dg
et F
ore
cast
Infla
ted
$
Bu
dg
etD
escr
ipti
on
2013
2014
2015
2016
2017
2018
2019
2020
2021
2022
Cap
ital-R
elat
edE
xist
ing
Non
-Gro
wth
Rel
ated
Deb
t 86
7,46
7
14
6,66
4
14
2,35
2
13
8,01
5
13
3,36
5
12
9,13
3
12
4,25
6
11
9,90
1
11
5,40
4
11
0,91
4
E
xist
ing
Gro
wth
Rel
ated
Deb
t-
-
-
-
-
-
-
-
-
-
New
Non
-Gro
wth
Deb
t-
-
230,
613
399,
122
399,
122
399,
122
399,
122
399,
122
399,
122
399,
122
New
Gro
wth
Rel
ated
Deb
t-
-
53,6
06
322,
248
322,
248
340,
704
340,
704
340,
704
340,
704
340,
704
Def
fere
d C
apita
l Pay
men
t-
-
-
-
-
-
-
-
-
-
Loan
Rep
aym
ent -
To
Was
tew
ater
-
349,
474
349,
474
349,
474
349,
474
349,
474
349,
474
349,
474
349,
474
349,
474
Tra
nsfe
r to
Tow
n of
Col
lingw
ood
100,
000
100,
000
100,
000
100,
000
100,
000
100,
000
100,
000
100,
000
100,
000
100,
000
Tra
nsfe
r to
Rat
e S
tabi
lizat
ion
Res
erve
-
-
T
rans
fer
to R
eser
ves
and
Res
erve
Fun
ds34
1,00
0
95
7,00
0
1,
051,
500
1,
232,
600
1,
405,
500
1,
585,
700
60
0,00
0
60
0,00
0
60
0,00
0
50
0,00
0
S
ub T
otal
Cap
ital R
elat
ed1,
308,
467
1,55
3,13
81,
927,
545
2,54
1,46
02,
709,
710
2,90
4,13
41,
913,
556
1,90
9,20
11,
904,
705
1,80
0,21
5T
otal
Exp
endi
ture
s6,
466,
775
6,41
8,31
26,
914,
353
7,65
2,93
97,
948,
976
8,27
4,38
37,
418,
061
7,55
1,31
97,
687,
879
7,72
7,96
9
Rev
enu
esB
ase
Cha
rge
2,42
2,17
22,
520,
444
2,62
6,75
22,
742,
906
2,86
6,73
82,
994,
947
3,12
7,80
93,
265,
565
3,40
8,08
23,
555,
925
Hyd
rant
Ren
tal
148,
800
148,
800
148,
800
148,
800
148,
800
148,
800
148,
800
148,
800
148,
800
148,
800
Wat
er M
eter
Sal
es54
,000
54,0
0054
,000
54,0
0054
,000
54,0
0054
,000
54,0
0054
,000
54,0
00In
tere
st6,
000
6,00
06,
000
6,00
06,
000
6,00
06,
000
6,00
06,
000
6,00
0Le
ase
& R
enta
l Rev
enue
296,
000
237,
792
243,
700
249,
800
256,
000
262,
400
269,
000
275,
700
282,
600
289,
700
Dev
ils G
len
Con
trac
t96
,000
98,4
0010
0,90
010
3,40
010
6,00
010
8,70
011
1,40
011
4,20
011
7,10
012
0,00
0A
dmin
/Bill
ing
Rec
over
y -
Sha
red
with
Was
tew
ater
Ser
vice
s0
184,
779
378,
797
582,
400
597,
000
611,
900
627,
200
642,
900
659,
000
675,
500
Mis
cella
neio
us O
pera
ting
Rev
enue
(M
eafo
rd)
192,
000
196,
800
201,
700
206,
700
211,
900
217,
200
222,
600
228,
200
233,
900
239,
700
Wat
er C
onne
ctio
n C
harg
es, W
hole
Hom
e F
iltra
tion
& M
isc.
Rev
enue
96,6
0069
,960
71,7
0073
,500
75,3
0077
,200
79,1
0081
,100
83,1
0085
,200
Tra
nsfe
r fr
om D
evel
opm
ent C
harg
es R
eser
ve F
und
00
53,6
0632
2,24
832
2,24
834
0,70
434
0,70
434
0,70
434
0,70
434
0,70
4T
own
of B
lue
Mou
ntai
ns (
2013
onl
y) &
New
Tec
umse
th S
ales
1,46
0,64
21,
003,
185
1,05
8,34
41,
116,
262
1,17
7,07
51,
240,
928
1,30
7,97
51,
378,
374
1,45
2,29
21,
529,
907
Con
trib
utio
n fr
om R
eser
ve93
,000
00
00
00
00
0T
otal
Ope
ratin
g R
even
ue4,
865,
215
4,52
0,16
04,
944,
300
5,60
6,01
65,
821,
061
6,06
2,77
96,
294,
588
6,53
5,54
26,
785,
578
7,04
5,43
6
Wat
er B
illin
g R
ecov
ery
- O
pera
ting
1,60
1,56
01,
898,
152
1,97
0,05
32,
046,
923
2,12
7,91
52,
211,
604
1,12
3,47
31,
015,
777
902,
301
682,
533
Life
cycl
e R
eser
ve C
ontr
ibut
ion
($)
1,17
4,70
01,
372,
000
1,57
8,00
01,
893,
600
Wat
er B
illin
g R
eco
very
- T
ota
l1,
601,
560
1,89
8,15
21,
970,
053
2,04
6,92
32,
127,
915
2,21
1,60
42,
298,
173
2,38
7,77
72,
480,
301
2,57
6,13
3
Th
e T
ow
n o
f C
olli
ng
wo
od
an
d C
olli
ng
wo
od
Pu
blic
Uti
litie
s S
ervi
ce B
oar
d
Wat
son
& A
ssoc
iate
s E
cono
mis
ts L
td.
Wat
er &
Was
tew
ater
Rat
e M
odel
- F
ebru
ary,
201
4 A
M.x
lsx.
xls
G-6

Ap
pen
dix
G-9
Wat
er S
ervi
ces
Wat
er R
ate
Fo
reca
stIn
flate
d $
Des
crip
tio
n20
1320
1420
1520
1620
1720
1820
1920
2020
2120
22
Tot
al W
ater
Bill
ing
Rec
over
y1,
601,
560
1,89
8,15
21,
970,
053
2,04
6,92
32,
127,
915
2,21
1,60
42,
298,
173
2,38
7,77
72,
480,
301
2,57
6,13
3
Filt
ered
vs.
Pro
cess
ed R
ates
Con
sum
ptio
n F
orec
ast
By
Blo
ck (
m3)
Filt
ered
(R
egul
ar)
2,34
0,20
02,
739,
121
2,77
6,24
72,
817,
220
2,86
0,27
72,
903,
334
2,94
6,39
12,
989,
448
3,03
2,50
43,
075,
561
Filt
ered
(S
umm
er)
82,8
4696
,968
98,2
8399
,733
101,
257
102,
782
104,
306
105,
830
107,
354
108,
879
Pro
cess
ed71
2,26
771
2,26
771
2,26
771
2,26
771
2,26
771
2,26
771
2,26
771
2,26
771
2,26
771
2,26
7C
heck
Tot
al C
onsu
mpt
ion
3,13
5,31
33,
548,
356
3,58
6,79
73,
629,
220
3,67
3,80
13,
718,
383
3,76
2,96
43,
807,
545
3,85
2,12
63,
896,
707
Blo
ck R
ates
($/
m3)
Filt
ered
- R
egu
lar
0.59
00.
604
0.62
00.
635
0.65
10.
667
0.68
40.
701
0.71
80.
736
Filt
ered
- S
um
mer
1.06
61.
092
1.11
91.
147
1.17
61.
205
1.23
61.
266
1.29
81.
331
Pro
cess
ed0.
187
0.19
20.
196
0.20
10.
206
0.21
10.
217
0.22
20.
228
0.23
3C
heck
Rev
enue
Filt
ered
(R
egul
ar)
1,38
0,14
41,
655,
779
1,72
0,15
31,
789,
119
1,86
1,87
41,
937,
083
2,01
4,91
22,
095,
500
2,17
8,74
82,
265,
002
Filt
ered
(S
umm
er)
88,2
7710
5,90
711
0,02
511
4,43
611
9,09
012
3,90
012
8,87
813
4,03
313
9,35
814
4,87
5P
roce
ssed
133,
139
136,
466
139,
875
143,
368
146,
952
150,
620
154,
383
158,
245
162,
195
166,
256
Che
ck T
otal
Rev
enue
1,60
1,56
01,
898,
152
1,97
0,05
32,
046,
923
2,12
7,91
52,
211,
604
2,29
8,17
32,
387,
777
2,48
0,30
12,
576,
133
Ann
ual %
Incr
ease
in R
ates
2.5%
2.5%
2.5%
2.5%
2.5%
2.5%
2.5%
2.5%
2.5%
Th
e T
ow
n o
f C
olli
ng
wo
od
an
d C
olli
ng
wo
od
Pu
blic
Uti
litie
s S
ervi
ce B
oar
d
Wat
son
& A
ssoc
iate
s E
cono
mis
ts L
td.
Wat
er &
Was
tew
ater
Rat
e M
odel
- F
ebru
ary,
201
4 A
M.x
lsx.
xls
G-7


Watson & Associates Economists Ltd. H:\Collingwood\2013 Asset Management\Collingwood AM Plan Report FINAL.docx
APPENDIX H
WASTEWATER ASSET MANAGEMENT STRATEGY &
FINANCING STRATEGY


Bu
dg
etD
escr
ipti
on
To
tal
2013
2014
2015
2016
2017
2018
2019
2020
2021
2022
Cap
ital
Exp
end
itu
res
San
itary
Sew
er G
rout
ing
and
Spo
t Rep
airs
151,
300
50,0
0050
,000
51,3
000
00
00
00
Was
tew
ater
Odo
r C
ontr
ol S
tudy
& Im
plem
enta
tion
800,
000
50,0
0075
0,00
00
00
00
00
0R
agla
n S
tree
t Loc
al Im
prov
emen
t15
,000
15,0
000
00
00
00
00
Co-
Gen
erat
ion
proj
ect
1,24
5,00
045
,000
1,20
0,00
00
00
00
00
0W
aste
wat
er R
ate
Stu
dy R
evie
w17
,500
17,5
000
00
00
00
00
Gro
wth
Rel
ated
:S
tud
ies:
DC
Stu
dy -
Was
tew
ater
Por
tion
37,3
0017
,500
00
00
19,8
000
00
0F
acili
ties
:B
lack
Ash
Cre
ek S
PS
Exp
ansi
on
135,
800
00
00
013
5,80
00
00
0S
ewer
s:F
rom
11t
h Li
ne to
Mou
ntai
n R
d. (
OS
)17
6,50
00
00
00
176,
500
00
00
Mou
ntai
n R
d. fr
om 1
0th
Line
to B
alsa
m S
t. (T
)1,
483,
500
00
00
00
01,
483,
500
00
Mac
Don
ald
Dr.
trun
k (T
)28
8,90
00
028
8,90
00
00
00
00
Stu
dies
and
Cla
ss E
As
232,
600
00
010
7,70
00
00
00
124,
900
Lif
ecyc
le:
Tre
atm
ent P
lant
9,63
1,30
00
00
00
02,
319,
400
2,37
7,40
02,
436,
800
2,49
7,70
0P
umpi
ng S
tatio
ns2,
383,
200
00
00
00
579,
800
00
1,80
3,40
0S
anita
ry S
ewer
Rep
lace
men
t Pro
gram
9,17
4,60
01,
300,
000
2,40
8,80
01,
733,
500
516,
900
530,
900
544,
200
557,
800
572,
900
588,
500
421,
100
Rep
lace
Bric
k at
WW
TP
50,0
0050
,000
00
00
00
00
0La
goon
Fen
cing
8,00
08,
000
00
00
00
00
0S
t. C
lair
Pum
ping
Sta
tion
50,0
0050
,000
00
00
00
00
0R
epla
ce V
ehic
le W
WT
P (
Fle
et M
anag
emen
t)30
,000
30,0
000
00
00
00
00
Ass
et M
anag
emen
t50
,000
50,0
000
00
00
00
00
Tot
al C
apita
l Exp
endi
ture
s25
,960
,500
1,68
3,00
04,
408,
800
2,07
3,70
062
4,60
053
0,90
087
6,30
03,
457,
000
4,43
3,80
03,
025,
300
4,84
7,10
0
Cap
ital
Fin
anci
ng
Pro
vinc
ial/F
eder
al G
rant
s0
Dev
elop
men
t Cha
rges
2,05
6,56
917
,500
028
8,90
010
7,70
00
250,
352
01,
267,
217
012
4,90
0
Dev
elop
er C
ontr
ibut
ions
0
Loca
l Im
prov
emen
t15
,000
15,0
00
Deb
entu
re R
equi
rem
ents
- N
on-G
row
th R
elat
ed0
00
00
00
00
00
Deb
entu
re R
equi
rem
ents
- G
row
th R
elat
ed0
00
00
00
00
00
Ope
ratin
g C
ontr
ibut
ions
498,
000
398,
000
50,0
0050
,000
00
00
00
0
Life
cycl
e R
eser
ve C
ontr
ibut
ion
00
00
00
00
00
0
Tra
nsfe
r fr
om L
agoo
n R
eser
ve8,
000
8,00
00
00
00
00
00
Tra
nsfe
r fr
om W
aste
wat
er T
reat
men
t Res
erve
17,3
20,8
1528
3,00
02,
350,
000
600,
000
400,
000
200,
000
356,
015
3,29
9,20
02,
777,
400
2,63
6,80
04,
418,
400
Tre
ansf
er fr
om W
aste
wat
er R
eser
ve6,
062,
116
961,
500
2,00
8,80
01,
134,
800
116,
900
330,
900
269,
933
157,
800
389,
183
388,
500
303,
800
Tot
al C
apita
l Fin
anci
ng25
,960
,501
1,68
3,00
04,
408,
800
2,07
3,70
062
4,60
053
0,90
087
6,30
03,
457,
000
4,43
3,80
03,
025,
300
4,84
7,10
0
Ap
pen
dix
H-1
Was
tew
ater
Ser
vice
Cap
ital
Bu
dg
et F
ore
cast
Infla
ted
$
Th
e T
ow
n o
f C
olli
ng
wo
od
an
d C
olli
ng
wo
od
Pu
blic
Uti
litie
s S
ervi
ce B
oar
d Fo
reca
st
Wat
son
& A
ssoc
iate
s E
cono
mis
ts L
td.
Wat
er &
Was
tew
ater
Rat
e M
odel
- F
ebru
ary,
201
4 A
M.x
lsx.
xls
H-1

Inte
rnal
Deb
entu
reP
rin
cip
alY
ear
(In
flat
ed)
2013
2014
2015
2016
2017
2018
2019
2020
2021
2022
2013
00
00
00
00
00
2014
00
00
00
00
020
150
00
00
00
020
160
00
00
00
2017
00
00
00
2018
00
00
020
190
00
020
200
00
2021
00
2022
0
To
tal A
nn
ual
Deb
t C
har
ges
00
00
00
00
00
0
Inte
rnal
Deb
entu
reP
rin
cip
alY
ear
(In
flat
ed)
2013
2014
2015
2016
2017
2018
2019
2020
2021
2022
2013
00
00
00
00
00
2014
00
00
00
00
020
150
00
00
00
020
160
00
00
00
2017
00
00
00
2018
00
00
020
190
00
020
200
00
2021
00
2022
0
To
tal A
nn
ual
Deb
t C
har
ges
00
00
00
00
00
0
Was
tew
ater
Ser
vice
Yea
r
Ap
pen
dix
H-3
Ap
pen
dix
H-2
Was
tew
ater
Ser
vice
Infla
ted
$
Infla
ted
$
Sch
edu
le o
f D
eben
ture
Rep
aym
ents
- G
row
th R
elat
ed
Th
e T
ow
n o
f C
olli
ng
wo
od
an
d C
olli
ng
wo
od
Pu
blic
Uti
litie
s S
ervi
ce B
oar
d
Yea
r
Th
e T
ow
n o
f C
olli
ng
wo
od
an
d C
olli
ng
wo
od
Pu
blic
Uti
litie
s S
ervi
ce B
oar
d
Sch
edu
le o
f D
eben
ture
Rep
aym
ents
- N
on
-Gro
wth
Rel
ated
Wat
son
& A
ssoc
iate
s E
cono
mis
ts L
td.
Wat
er &
Was
tew
ater
Rat
e M
odel
- F
ebru
ary,
201
4 A
M.x
lsx.
xls
H-2

Des
crip
tio
n20
1320
1420
1520
1620
1720
1820
1920
2020
2120
22
Ope
ning
Bal
ance
040
,040
427,
170
750,
225
781,
066
743,
773
856,
274
947,
933
816,
140
769,
746
Tra
nsfe
r fr
om O
pera
ting
1,00
0,00
02,
379,
500
1,42
9,00
011
7,70
026
5,00
034
9,50
021
3,00
022
6,00
031
2,50
044
7,00
0T
rans
fer
to C
apita
l96
1,50
02,
008,
800
1,13
4,80
011
6,90
033
0,90
026
9,93
315
7,80
038
9,18
338
8,50
030
3,80
0T
rans
fer
to O
pera
ting
00
00
00
00
00
Clo
sing
Bal
ance
38,5
0041
0,74
072
1,37
075
1,02
571
5,16
682
3,34
091
1,47
478
4,75
074
0,14
091
2,94
6In
tere
st1,
540
16,4
3028
,855
30,0
4128
,607
32,9
3436
,459
31,3
9029
,606
36,5
18
Des
crip
tio
n20
1320
1420
1520
1620
1720
1820
1920
2020
2120
22
Ope
ning
Bal
ance
315,
076
307,
076
307,
076
307,
076
307,
076
307,
076
307,
076
307,
076
307,
076
307,
076
Tra
nsfe
r fr
om O
pera
ting
00
00
00
00
00
Tra
nsfe
r to
Cap
ital
8,00
00
00
00
00
00
Tra
nsfe
r to
Ope
ratin
g0
00
00
00
00
0C
losi
ng B
alan
ce30
7,07
630
7,07
630
7,07
630
7,07
630
7,07
630
7,07
630
7,07
630
7,07
630
7,07
630
7,07
6
Des
crip
tio
n20
1320
1420
1520
1620
1720
1820
1920
2020
2120
22
Ope
ning
Bal
ance
6,99
9,46
53,
614,
370
1,61
3,84
52,
450,
819
5,03
2,79
48,
040,
268
11,1
99,2
2711
,873
,501
13,3
88,5
7615
,842
,750
Tra
nsfe
r fr
om O
pera
ting
1,20
5,83
00
1,08
7,50
02,
632,
500
2,85
8,00
03,
165,
500
3,62
4,00
03,
943,
000
4,74
1,50
04,
358,
000
Tra
nsfe
r fr
om O
pera
ting
- R
epay
men
t of L
oan
from
Wat
er0
349,
474
349,
474
349,
474
349,
474
349,
474
349,
474
349,
474
349,
474
349,
474
Tra
nsfe
r to
Cap
ital
283,
000
2,35
0,00
060
0,00
040
0,00
020
0,00
035
6,01
53,
299,
200
2,77
7,40
02,
636,
800
4,41
8,40
0P
aym
ent o
f Out
stan
ding
Deb
t4,
307,
925
Tra
nsfe
r to
Ope
ratin
g0
00
00
00
00
0C
losi
ng B
alan
ce3,
614,
370
1,61
3,84
52,
450,
819
5,03
2,79
48,
040,
268
11,1
99,2
2711
,873
,501
13,3
88,5
7615
,842
,750
16,1
31,8
25
Des
crip
tio
n20
1320
1420
1520
1620
1720
1820
1920
2020
2120
22
Ope
ning
Bal
ance
341,
434
341,
434
341,
434
341,
434
341,
434
341,
434
341,
434
341,
434
341,
434
341,
434
Tra
nsfe
r fr
om O
pera
ting
00
00
00
00
00
Tra
nsfe
r to
Cap
ital
Tra
nsfe
r to
Ope
ratin
g0
00
00
00
00
0C
losi
ng B
alan
ce34
1,43
434
1,43
434
1,43
434
1,43
434
1,43
434
1,43
434
1,43
434
1,43
434
1,43
434
1,43
4
Ap
pen
dix
H-4
Ap
pen
dix
H-5
Th
e T
ow
n o
f C
olli
ng
wo
od
an
d C
olli
ng
wo
od
Pu
blic
Uti
litie
s S
ervi
ce B
oar
d
Infla
ted
$
Was
tew
ater
Lag
oo
n R
eser
ve C
on
tin
uit
y
Was
tew
ater
Tre
atm
ent
Res
erve
Infla
ted
$
Ap
pen
dix
H-6
Th
e T
ow
n o
f C
olli
ng
wo
od
an
d C
olli
ng
wo
od
Pu
blic
Uti
litie
s S
ervi
ce B
oar
d
Was
tew
ater
Ser
vice
Ap
pen
dix
H-7
Was
tew
ater
Res
erve
s/ R
eser
ve F
un
ds
Co
nti
nu
ity
Infla
ted
$
Th
e T
ow
n o
f C
olli
ng
wo
od
an
d C
olli
ng
wo
od
Pu
blic
Uti
litie
s S
ervi
ce B
oar
d
Sew
er S
ervi
ce C
har
ge
Res
erve
Co
nti
nu
ity
Infla
ted
$
Was
tew
ater
Ser
vice
Th
e T
ow
n o
f C
olli
ng
wo
od
an
d C
olli
ng
wo
od
Pu
blic
Uti
litie
s S
ervi
ce B
oar
dW
aste
wat
er S
ervi
ce
Was
tew
ater
Ser
vice
Wat
son
& A
ssoc
iate
s E
cono
mis
ts L
td.
Wat
er &
Was
tew
ater
Rat
e M
odel
- F
ebru
ary,
201
4 A
M.x
lsx.
xls
H-3

Was
tew
ater
Ser
vice
Dev
elo
pm
ent
Ch
arg
e R
eser
ve F
un
d C
on
tin
uit
yIn
flate
d $
Des
crip
tio
n20
1320
1420
1520
1620
1720
1820
1920
2020
2120
22
Ope
ning
Bal
ance
4,40
7,22
65,
271,
188
6,19
8,32
37,
222,
429
8,80
2,15
210
,603
,241
12,2
22,8
9914
,182
,269
14,9
16,8
1317
,009
,675
DC
Rev
enue
978,
298
1,01
4,66
81,
228,
191
1,40
7,56
01,
393,
272
1,39
9,89
91,
413,
898
1,42
8,03
71,
438,
643
1,45
3,03
0R
epay
men
t fro
m W
aste
ater
DC
Res
erve
Fun
d15
8,00
0T
rans
fer
to C
apita
l17
,500
028
8,90
010
7,70
00
250,
352
01,
267,
217
012
4,90
0P
aym
ent o
f cre
dits
und
er fr
ont e
ndin
g ag
reem
ents
457,
574
325,
931
192,
971
58,6
810
00
00
0T
rans
fer
to O
pera
ting
00
00
00
00
00
Clo
sing
Bal
ance
5,06
8,45
05,
959,
926
6,94
4,64
38,
463,
608
10,1
95,4
2411
,752
,788
13,6
36,7
9814
,343
,090
16,3
55,4
5718
,337
,805
Inte
rest
202,
738
238,
397
277,
786
338,
544
407,
817
470,
112
545,
472
573,
724
654,
218
733,
512
Req
uire
d fr
om D
evel
opm
ent C
harg
es17
,500
028
8,90
010
7,70
00
250,
352
01,
267,
217
012
4,90
0
Was
tew
ater
Ser
vice
Lif
ecyc
le R
eser
ve F
un
d C
on
tin
uit
yIn
flate
d $
Des
crip
tio
n20
1320
1420
1520
1620
1720
1820
1920
2020
2120
22
Ope
ning
Bal
ance
00
00
00
00
00
Tra
nsfe
r fr
om O
pera
ting
00
00
00
00
058
9,00
0T
rans
fer
to C
apita
l0
00
00
00
00
0T
rans
fer
to O
pera
ting
00
00
00
00
00
Clo
sing
Bal
ance
00
00
00
00
058
9,00
0In
tere
st0
00
00
00
00
23,5
60
Th
e T
ow
n o
f C
olli
ng
wo
od
an
d C
olli
ng
wo
od
Pu
blic
Uti
litie
s S
ervi
ce B
oar
d
Th
e T
ow
n o
f C
olli
ng
wo
od
an
d C
olli
ng
wo
od
Pu
blic
Uti
litie
s S
ervi
ce B
oar
dA
pp
end
ix H
-8
Ap
pen
dix
H-9
Wat
son
& A
ssoc
iate
s E
cono
mis
ts L
td.
Wat
er &
Was
tew
ater
Rat
e M
odel
- F
ebru
ary,
201
4 A
M.x
lsx.
xls
H-4

Bu
dg
etD
escr
ipti
on
2013
2014
2015
2016
2017
2018
2019
2020
2021
2022
Exp
end
itu
res
Ope
ratin
g C
osts
San
itary
Sew
ers
220,
000
225,
500
231,
138
236,
916
242,
839
248,
910
255,
133
261,
511
268,
049
274,
750
San
itary
Sew
er M
ain
Mai
nten
ance
179,
863
184,
360
188,
969
193,
693
198,
535
203,
498
208,
586
213,
801
219,
146
224,
624
San
itary
Sew
er M
ajor
Rep
airs
14,1
82
14,5
37
14
,900
15,2
72
15
,654
16,0
46
16
,447
16,8
58
17
,279
17,7
11
S
anita
ry S
ewer
Lat
rera
ls M
aint
enan
ce28
,897
29
,619
30,3
60
31
,119
31,8
97
32
,694
33,5
12
34
,349
35,2
08
36
,088
San
itary
Sew
er N
ew L
ater
als
33,3
73
34,2
07
35
,063
35,9
39
36
,838
37,7
58
38
,702
39,6
70
40
,662
41,6
78
W
aste
wat
er T
reat
men
t Pla
nt2,
307,
910
2,
365,
608
2,
424,
748
2,
485,
367
2,
547,
501
2,
611,
188
2,
676,
468
2,
743,
380
2,
811,
964
2,
882,
263
P
umpi
ng S
tatio
n -
Min
neso
ta27
,988
28
,688
29,4
05
30
,140
30,8
94
31
,666
32,4
57
33
,269
34,1
01
34
,953
Pum
ping
Sta
tion
- S
t.Cla
ir38
,444
39
,405
40,3
90
41
,400
42,4
35
43
,496
44,5
83
45
,698
46,8
40
48
,011
Pum
ping
Sta
tion
- B
lack
Ash
Cre
ek21
,534
22
,072
22,6
24
23
,190
23,7
70
24
,364
24,9
73
25
,597
26,2
37
26
,893
Pum
ping
Sta
tion
- P
ater
son
St.
15,4
06
15,7
91
16
,186
16,5
91
17
,005
17,4
30
17
,866
18,3
13
18
,771
19,2
40
P
umpi
ng S
tatio
n -
Cra
nber
ry T
rail
12,8
91
13,2
13
13
,544
13,8
82
14
,229
14,5
85
14
,950
15,3
23
15
,706
16,0
99
P
umpi
ng S
tatio
n -
Pre
tty R
iver
2,05
5
2,
106
2,
159
2,
213
2,
268
2,
325
2,
383
2,
443
2,
504
2,
566
P
umpi
ng S
tatio
n -
Silv
er G
len
2,40
0
2,
460
2,
522
2,
585
2,
649
2,
715
2,
783
2,
853
2,
924
2,
997
C
lear
view
Was
tew
ater
Tre
atm
ent P
lant
253,
170
259,
499
265,
987
272,
636
279,
452
286,
439
293,
600
300,
940
308,
463
316,
175
Adm
in/B
illin
g C
osts
- S
hare
d w
ith W
ater
Ser
vice
184,
779
378,
797
582,
400
597,
000
611,
900
627,
200
642,
900
659,
000
675,
500
Sub
Tot
al O
pera
ting
3,15
8,11
3
3,42
1,84
5
3,69
6,79
0
3,98
3,34
3
4,08
2,96
6
4,18
5,01
5
4,28
9,64
3
4,39
6,90
4
4,50
6,85
4
4,61
9,55
0
Cap
ital-R
elat
ed
1,57
0,18
4
1,83
6,48
2
1,79
9,24
4
1,76
5,04
4
1,72
9,93
0
1,69
4,49
7
1,65
9,29
3
1,62
4,91
9
1,04
9,20
6
1,03
0,98
3
New
Non
-Gro
wth
Rel
ated
Deb
t-
-
-
-
-
-
-
-
-
-
New
Gro
wth
Rel
ated
Deb
t-
-
-
-
-
-
-
-
-
-
Cap
ital F
rom
Cur
rent
398,
000
50,0
00
50
,000
-
-
-
-
-
-
-
T
rans
fer
to T
own
of C
ollin
gwoo
d -
Cle
arvi
ew36
,795
37
,715
38,6
58
39
,624
40,6
15
41
,630
42,6
71
43
,738
44,8
31
45
,952
Tra
nsfe
r to
Was
tew
ater
Lag
oon
Res
ere
-
Tra
nsfe
r to
Was
tew
ater
Tre
atm
ent R
eser
ve1,
205,
830
-
1,08
7,50
0
2,63
2,50
0
2,85
8,00
0
3,16
5,50
0
3,62
4,00
0
3,94
3,00
0
4,74
1,50
0
4,35
8,00
0
Tra
nsfe
r to
Sew
er S
ervi
ce C
harg
e R
eser
ve-
T
rans
fer
to R
eser
ve -
Rep
aym
ent o
f Loa
n fr
om W
ater
-
349,
474
349,
474
349,
474
349,
474
349,
474
349,
474
349,
474
349,
474
349,
474
Tra
nsfe
r to
Res
erve
s an
d R
eser
ve F
unds
1,00
0,00
0
2,37
9,50
0
1,42
9,00
0
117,
700
265,
000
349,
500
213,
000
226,
000
312,
500
447,
000
Sub
Tot
al C
apita
l Rel
ated
4,21
0,80
9
4,65
3,17
24,
753,
876
4,90
4,34
35,
243,
019
5,60
0,60
25,
888,
438
6,18
7,13
16,
497,
512
6,23
1,40
9T
otal
Exp
endi
ture
s7,
368,
922
8,
075,
016
8,45
0,66
58,
887,
686
9,32
5,98
59,
785,
617
10,1
78,0
8110
,584
,035
11,0
04,3
6610
,850
,960
Rev
enu
esB
ase
Cha
rge
4,85
7,31
1
5,10
9,37
55,
384,
187
5,68
6,08
16,
010,
014
6,35
0,06
76,
641,
475
6,94
3,11
87,
255,
658
7,57
9,76
4P
roce
eds
from
Loa
n R
epay
men
t (fr
om W
ater
)-
34
9,47
434
9,47
434
9,47
434
9,47
434
9,47
434
9,47
434
9,47
434
9,47
434
9,47
4R
oyal
ties
8,00
0
8,
000
8,00
015
,000
15,0
0015
,000
15,0
0015
,000
15,0
0015
,000
San
itary
Sew
er L
ater
als
Mai
nten
ance
Rec
over
y-
10
,000
10,0
0015
,000
15,0
0015
,000
15,0
0015
,000
15,0
0015
,000
San
itary
Sew
er N
ew L
ater
als
Rec
over
y-
-
-
15
,000
15,0
0015
,000
15,0
0015
,000
15,0
0015
,000
Sew
age
Tre
atm
ent P
lant
- P
ublic
Dis
posa
l Fee
s15
0,00
0
15
0,00
015
0,00
015
0,00
015
0,00
015
0,00
015
0,00
015
0,00
015
0,00
015
0,00
0E
xpen
se R
ecov
erie
s92
,167
92
,167
92,1
6792
,167
92,1
6792
,167
92,1
6792
,167
92,1
6792
,167
Rec
over
ies
134,
320
134,
320
134,
320
134,
320
134,
320
134,
320
134,
320
134,
320
134,
320
134,
320
Con
trac
t Rev
enue
with
Oth
ers
- C
lear
view
289,
965
297,
214
304,
644
312,
261
320,
067
328,
069
336,
271
344,
677
353,
294
362,
127
Dev
elop
men
t Cha
rges
-
-
-
-
-
-
-
-
-
-
C
ontr
ibut
ions
from
Res
erve
s / R
eser
ve F
unds
-
-
-
-
-
-
-
-
-
-
T
otal
Ope
ratin
g R
even
ue5,
531,
763
6,15
0,55
06,
432,
792
6,76
9,30
37,
101,
043
7,44
9,09
87,
748,
707
8,05
8,75
68,
379,
914
8,71
2,85
2
Was
tew
ater
Bill
ing
Rec
over
y -
Ope
ratin
g1,
837,
159
1,92
4,46
62,
017,
873
2,11
8,38
22,
224,
942
2,33
6,51
92,
429,
374
2,52
5,27
92,
624,
452
2,13
8,1
08
Life
cycl
e R
eser
ve C
ontr
ibut
ion
($)
-
-
-
-
-
-
-
-
-
589,
000
Was
tew
ater
Bill
ing
Rec
ove
ry -
To
tal
1,83
7,15
91,
924,
466
2,01
7,87
32,
118,
382
2,22
4,94
22,
336,
519
2,42
9,37
42,
525,
279
2,62
4,45
22,
727,
108
Was
tew
ater
Ser
vice
Op
erat
ing
Bu
dg
et F
ore
cast
Infla
ted
$
Exi
stin
g D
ebt -
Sew
er R
enew
al, E
ast E
nd S
ewer
Mai
n &
San
itary
In
fras
truc
ture
Ap
pen
dix
H-1
0
Fo
reca
st
Th
e T
ow
n o
f C
olli
ng
wo
od
an
d C
olli
ng
wo
od
Pu
blic
Uti
litie
s S
ervi
ce B
oar
d
Wat
son
& A
ssoc
iate
s E
cono
mis
ts L
td.
Wat
er &
Was
tew
ater
Rat
e M
odel
- F
ebru
ary,
201
4 A
M.x
lsx.
xls
H-5

Des
crip
tio
n20
1320
1420
1520
1620
1720
1820
1920
2020
2120
22
Tot
al W
aste
wat
er B
illin
g R
ecov
ery
1,83
7,15
91,
924,
466
2,01
7,87
32,
118,
382
2,22
4,94
22,
336,
519
2,42
9,37
42,
525,
279
2,62
4,45
22,
727,
108
Tot
al B
illab
le V
olum
e (m
3 )2,
820,
087
2,85
4,00
82,
891,
134
2,93
2,10
72,
975,
164
3,01
8,22
13,
061,
278
3,10
4,33
43,
147,
391
3,19
0,44
8
Co
nst
ant
Rat
e0.
651
0.
674
0.69
8
0.
722
0.74
8
0.77
4
0.
794
0.81
3
0.
834
0.85
5
Ann
ual %
Incr
ease
in R
ates
3.5%
3.5%
3.5%
3.5%
3.5%
2.5%
2.5%
2.5%
2.5%
Infla
ted
$
Th
e T
ow
n o
f C
olli
ng
wo
od
an
d C
olli
ng
wo
od
Pu
blic
Uti
litie
s S
ervi
ce B
oar
d
Was
tew
ater
Rat
e F
ore
cast
Was
tew
ater
Ser
vice
Ap
pen
dix
H-1
1
Wat
son
& A
ssoc
iate
s E
cono
mis
ts L
td.
Wat
er &
Was
tew
ater
Rat
e M
odel
- F
ebru
ary,
201
4 A
M.x
lsx.
xls
H-6