towardseffective interventions. it emphasises a strong
TRANSCRIPT

Tr
an
sp
or
T
rE
sE
ar
CH
C
En
Tr
E
2008
TOWARDS ZEROAmbitious Road Safety Targets and the Safe System Approach
TOW
ARD
S ZERO: A
mbitious Road Safety Targets
and the Safe System A
pproach
-:HSTCSC=VUV^Z\:(77 2008 03 1 P1) ISBN 978-92-821-0195-7
TOWARDS ZEROAmbitious Road Safety Targets and the Safe System Approach
Each year around 1.2 million people are killed and 50 million are injured on roads around
the world. But crashes are largely preventable and much can be done to reduce the burden of
pain they cause and their economic impact.
Many countries have set targets to reduce the number of casualties on their roads.
Are these countries on track to meet their targets? What can be done in the immediate and longer
term to achieve these targets? Is there a limit to traditional approaches to road safety?
This report takes stock of recent developments and initiatives to meet increasingly ambitious
road safety targets. It highlights the management changes required in many countries to implement
effective interventions. It emphasises a strong focus on results and examines the economic case
for road safety investment. It challenges the better performing countries to do more
and strongly recommends the adoption of a Safe System approach with a long-term
vision of no fatalities on the roads.
The report constitutes a major international review of progress in developing safe system
approaches, now adopted in a small number of countries. The report should be useful
to transport administrations and to all stakeholders involved in improving road safety.
www.oecd.org/publishing
www.internationaltransportforum.org

Cover_f.fm Page 1 Wednesday, April 7, 2004 11:00 AM

TR
AN
SP
OR
TR
ES
EA
RC
HC
EN
TR
E
TOWARDSZEROAmbitiousRoad Safety Targets andthe Safe System Approach

ORGANISATION FOR ECONOMIC CO-OPERATION AND DEVELOPMENT
The OECD is a unique forum where the governments of 30 democracies work together toaddress the economic, social and environmental challenges of globalisation. The OECD is also at
the forefront of efforts to understand and to help governments respond to new developments andconcerns, such as corporate governance, the information economy and the challenges of an
ageing population. The Organisation provides a setting where governments can compare policyexperiences, seek answers to common problems, identify good practice and work to co-ordinate
domestic and international policies.
The OECD member countries are: Australia, Austria, Belgium, Canada, the Czech Republic,
Denmark, Finland, France, Germany, Greece, Hungary, Iceland, Ireland, Italy, Japan, Korea,Luxembourg, Mexico, the Netherlands, New Zealand, Norway, Poland, Portugal, the Slovak Republic,
Spain, Sweden, Switzerland, Turkey, the United Kingdom and the United States. The Commission ofthe European Communities takes part in the work of the OECD.
OECD Publishing disseminates widely the results of the Organisation’s statistics gathering andresearch on economic, social and environmental issues, as well as the conventions, guidelines and
standards agreed by its members.
Also available in French under the title:
ZÉRO TUÉ SUR LA ROUTEUn système sûr, des objectifs ambitieux
Corrigenda to OECD publications may be found on line at: www.oecd.org/publishing/corrigenda.
© OECD 2008
You can copy, download or print OECD content for your own use, and you can include excerpts from OECD publications, databases and multimedia
products in your own documents, presentations, blogs, websites and teaching materials, provided that suitable acknowledgment of OECD as source
and copyright owner is given. All requests for public or commercial use and translation rights should be submitted to [email protected]. Requests for
permission to photocopy portions of this material for public or commercial use shall be addressed directly to the Copyright Clearance Center (CCC)
at [email protected] or the Centre français d'exploitation du droit de copie (CFC) [email protected].
This work is published on the responsibility of the Secretary-General of the OECD. The
opinions expressed and arguments employed herein do not necessarily reflect the official
views of the Organisation or of the governments of its member countries.

INTERNATIONAL TRANSPORT FORUM
The International Transport Forum is an inter-governmental body within the OECD family. The Forumis a global platform for transport policy makers and stakeholders. Its objective is to serve political leaders
and a larger public in developing a better understanding of the role of transport in economic growth and therole of transport policy in addressing the social and environmental dimensions of sustainable development.
The Forum organises a Conference for Ministers and leading figures from civil society each May in Leipzig,Germany.
The International Transport Forum was created under a Declaration issued by the Council ofMinisters of the ECMT (European Conference of Ministers of Transport) at its Ministerial Session in May
2006 under the legal authority of the Protocol of the ECMT, signed in Brussels on 17 October 1953, andlegal instruments of the OECD. The Forum's Secretariat is located in Paris.
The members of the Forum are: Albania, Armenia, Australia, Austria, Azerbaijan, Belarus, Belgium,Bosnia-Herzegovina, Bulgaria, Canada, Croatia, the Czech Republic, Denmark, Estonia, Finland, France,
FYROM, Georgia, Germany, Greece, Hungary, Iceland, Ireland, Italy, Japan, Korea, Latvia, Liechtenstein,Lithuania, Luxembourg, Malta, Mexico, Moldova, Montenegro, Netherlands, New Zealand, Norway,
Poland, Portugal, Romania, Russia, Serbia, Slovakia, Slovenia, Spain, Sweden, Switzerland, Turkey,Ukraine, the United Kingdom and the United States.
The OECD and the International Transport Forum established a Joint Transport Research Centre in2004. The Centre conducts co-operative research programmes addressing all modes of transport to
support policy making in Member countries and contribute to the Ministerial sessions of theInternational Transport Forum.
Further information about the International Transport Forum is available on Internet at the following address:
www.internationaltransportforum.org
© OECD/ITF 2008
No reproduction, copy, transmission or translation of this publication may be made without written permission. Applications should be sent to OECD
Publishing [email protected] or by fax 33 1 45 24 99 30.

Photo credits: The cover illustration shows State Highway 1 Coast Road north of Wellington, New Zealand, equipped in 2004 with a median barrier to prevent head on collisions on a stretch of road that had suffered a series of fatal accidents. The award winning project is one of the first in the world to make use of such a barrier on a two-lane, two-way road.
Photograph courtesy of the New Zealand Transport Agency.

FOREWORD – 5
TOWARDS ZERO: AMBITIOUS ROAD SAFETY TARGETS AND THE SAFE SYSTEM APPROACH - ISBN 978-92-821-0195-7 © OECD/ITF, 2008
FOREWORD
Most countries have achieved significant improvements in road safety over many years, but many are finding further improvements progressively more difficult to achieve. At the same time, there is still quite a disparity in overall road safety performance in member countries and some countries have seen their road safety situation worsen in recent years.
Ambitious targets have been set by many individual countries and at international level to reduce the number of road casualties but few countries are on track to achieve their targets.
This report Towards Zero: Ambitious Road Safety Targets and the Safe System Approach takes stock of recent developments and initiatives in OECD and International Transport Forum member countries to meet increasingly ambitious road safety targets. It highlights the institutional management changes required in many countries to implement effective interventions through a strong focus on results, and builds the economic case for road safety investment.
The report is the result of a three-year co-operative effort by an international group of safety experts representing 21 countries, as well as the World Bank, the World Health Organisation and the FIA Foundation. The Working Group was chaired by Mr Eric Howard and the work was co-ordinated by the Secretariat of the Joint Transport Research Centre. The report was subject to external review before completion by Mr Fred Wegman and Mr Claes Tingvall and the Group is grateful for their advice in improving the work.
To undertake this report, the working group carried out a survey to collect information and data on road safety performance, recent road safety strategies, the costs of road crashes and expenditures on road safety. Preliminary output from the Working Group was published as Country reports on road safetyperformance to provide a comprehensive description of the road safety situation in each country, available on the website of the Joint Transport Research Centre at: www.internationaltransportforum.org/jtrc/index.html. The present report analyses that data and examines the policies being developed to achieve ambitious road safety targets.


ABSTRACT – 7
TOWARDS ZERO: AMBITIOUS ROAD SAFETY TARGETS AND THE SAFE SYSTEM APPROACH - ISBN 978-92-821-0195-7 © OECD/ITF, 2008
ABSTRACT
ITRD1 NUMBER E138929
Each year around one million people are killed and 50 million people injured on roads around the world. However, crashes are largely preventable.
This report reviews road safety performance in OECD/ITF countries over the past three decades, analyses safety targets adopted in these countries and considers how challenging and ambitious targets can be set and achieved.
It reviews what can be done in the short term and longer term to significantly improve road safety level in all OECD/ITF countries. This includes key road safety interventions that have shown to be highly effective in reducing road trauma and that should be implemented now by all countries (including speed management, combating drink driving, increasing seatbelt use, improving the infrastructure, enhancing vehicle safety and reducing young driver risks, etc.).
The report underlines the necessary fundamental shift in road safety thinking to achieve long term very ambitious targets. This starts with the implementation of a sound safety management framework, focused on results. It describes how a Safe System approach can re-frame the ways in which safety is viewed and managed. The economic considerations that underlie support for implementing road safety programmes and the key principles and practices involved in the effective implementation of a road safety programme are discussed.
Finally the report highlights the vital role played by research and development and knowledge transfer in achieving continuous improvement in safety performance.
Fields: Accident studies (80); accident statistics (81); accidents and transport infrastructure (82); accidents and the human factor (83); safety devices used in transport infrastructure (85).
Keywords: Accident prevention, statistics, data acquisition, accident rate, cause, OECD, state of the art report, speed, traffic restraint, drink driving, safety belt, use, enforcement (law), highway design, accident black spot, communication, education, technology, intelligent transport system, cost, economics of transport, planning
1. The International Transport Research Documentation (ITRD) database of published information on transport and transport
research is administered by TRL on behalf of the Joint OECD/ECMT Transport Research Centre. ITRD contains over 350 000 bibliographical references, and about 10 000 are added each year. Input to the ITRD database is provided by more than 30 renowned institutes and organisations from around the world. For more details about ITRD, please contact [email protected] or see the ITRD website at www.itrd.org.


TABLE OF CONTENTS – 9
TOWARDS ZERO: AMBITIOUS ROAD SAFETY TARGETS AND THE SAFE SYSTEM APPROACH - ISBN 978-92-821-0195-7 © OECD/ITF, 2008
TABLE OF CONTENTS
FOREWORD .............................................................................................................................. 5
ABSTRACT ................................................................................................................................. 7
EXECUTIVE SUMMARY ...................................................................................................... 13
INTRODUCTION .................................................................................................................... 29
1. ROAD SAFETY TARGETS AND PERFORMANCE .................................................. 35
1.1. Road safety trends in member countries .................................................................. 35 1.2. Road safety targets in Member countries ................................................................. 35 1.3. Level of ambition ..................................................................................................... 51 1.4. Conclusions .............................................................................................................. 52
References.......................................................................................................................... 54
2. DATA COLLECTION AND ANALYSIS – REQUIREMENTSAND OPPORTUNITIES .................................................................................................. 55
2.1. Understanding risks and performance – What data should be collected? ................ 55 2.2. The limitations of crash data analysis at aggregate level ......................................... 56 2.3. Analysing levels of crash risk across a road network ............................................... 63 2.4. Why data is important and how it can be improved ................................................. 64 2.5. Conclusion ................................................................................................................ 67 References .................................................................................................................................. 69
3. SOME KEY INTERVENTIONS FOR IMMEDIATE BENEFITS ............................. 71
3.1 Key “building block” interventions .......................................................................... 71 3.2. Providing for safer speeds ........................................................................................ 73 3.3. Reducing drink-driving ............................................................................................ 77 3.4 Increasing use of safety belts .................................................................................... 79 3.5. Improving road infrastructure................................................................................... 79 3.6. Promoting safer vehicles .......................................................................................... 83 3.7 Graduated licensing for novice drivers ..................................................................... 85 3.8. Improving the safety of vulnerable road users ......................................................... 86 3.9. Improving the medical management of people after crashes ................................... 86 3.10. Some national evaluations of road safety interventions ........................................... 87 3.11. Conclusions .............................................................................................................. 89References .................................................................................................................................. 91
4. MANAGING ROAD SAFETY PROGRAMMES FOR RESULTS ............................. 95
4.1. What limits performance in achieving road safety targets? ..................................... 95 4.2. The road safety management system ........................................................................ 96 4.3. Universal application of the road safety management system ............................... 101 4.4. Conclusions ............................................................................................................ 102References ................................................................................................................................ 105

10 – TABLE OF CONTENTS
TOWARDS ZERO: AMBITIOUS ROAD SAFETY TARGETS AND THE SAFE SYSTEM APPROACH - ISBN 978-92-821-0195-7 © OECD/ITF, 2008
5. THE SAFE SYSTEM APPROACH .............................................................................. 107
5.1. What is a Safe System approach? ........................................................................... 107 5.2. Changing the context for developing interventions ................................................ 112 5.3 Implementing a safe system approach .................................................................... 123 5.4. Measuring and projecting performance improvement............................................ 127 5.8. Conclusions ............................................................................................................ 130
References........................................................................................................................ 133
6. BUILDING THE ECONOMIC CASE FOR ROAD SAFETY INVESTMENT ....... 135
6.1. Introduction ............................................................................................................ 135 6.2. Evaluation ............................................................................................................... 135 6.3. Funding ................................................................................................................... 145 6.4 Resource allocation ................................................................................................ 151 6.5 Conclusions ............................................................................................................ 155
References........................................................................................................................ 158
7. MANAGING EFFECTIVE STRATEGIES AND CREATING A SUPPORTIVEPOLITICAL ENVIRONMENT .................................................................................... 159
7.1. Introduction ............................................................................................................ 159 7.2. Creating the supportive political environment using a results focus ...................... 159 7.3. Setting strategic goals and achieving strategic outcomes ....................................... 163 7.4. Co-ordination of road safety management ............................................................. 168 7.5. Legislation .............................................................................................................. 176 7.6. Funding and resource allocation ............................................................................. 177 7.7. Promotion ............................................................................................................... 178 7.8. Research, monitoring and evaluation ..................................................................... 179 7.9. Implementation of Countermeasures ...................................................................... 180 7.10. Conclusions and recommendations ........................................................................ 181
References........................................................................................................................ 183
8. KNOWLEDGE TRANSFER ......................................................................................... 185
8.1. A critical success factor .......................................................................................... 185 8.2. Facing growing complexity .................................................................................... 186 8.3. Overcoming capacity weaknesses and scaling up investment ................................ 187 8.4. International cooperation ........................................................................................ 188 8.5. Conclusions ............................................................................................................ 189
References........................................................................................................................ 190
CONCLUSIONS AND RECOMMENDATIONS ................................................................ 191
Ambitious road safety targets are necessary to focus efforts to reduce road trauma. ....... 191 A long term vision with a very high level of ambition transforms policy ........................ 192 Look to strategies tried and tested elsewhere.................................................................... 193 Comprehensive data analysis enables development of effective
road safety programmes .................................................................................................... 193 Success requires a sound road safety management system ............................................... 194 Adopting a Safe System approach is essential for achieving ambitious targets ............... 194 Road safety investment opportunities ............................................................................... 195 Achieving commitment at the highest levels of government ............................................ 196 Accelerated knowledge transfer is critical to the successful adoption of
a Safe System approach .................................................................................................... 197

TABLE OF CONTENTS – 11
TOWARDS ZERO: AMBITIOUS ROAD SAFETY TARGETS AND THE SAFE SYSTEM APPROACH - ISBN 978-92-821-0195-7 © OECD/ITF, 2008
ANNEX A. ROAD SAFETY TRENDS ................................................................................ 199
A.1. Background ............................................................................................................ 199 A.2. Changes in the numbers of road fatalities .............................................................. 199 A.3. Changes in road fatality rates ................................................................................. 205 A.4. Changes in road injuries ......................................................................................... 207 A.5 Conclusions ............................................................................................................ 208
References........................................................................................................................ 208
ANNEX B. TRENDS IN DIFFERENT CRASH TYPES FOR CANADA,THE NETHERLANDS AND NEW ZEALAND ............................................ 209
B.1. General description of the data analysis ................................................................. 209 B.2 Detailed description of the data analyses ............................................................... 209 B.3. The Netherlands ..................................................................................................... 210 B.4. Canada .................................................................................................................... 214 B.5. New Zealand........................................................................................................... 219 B.6. Discussion .............................................................................................................. 222
References........................................................................................................................ 224
ANNEX C. STEPS TOWARDS IMPLEMENTINGA SAFE SYSTEM APPROACH .................................................................. 225
ANNEX D. DRAFT WORLD BANK COUNTRY CAPACITY CHECKLISTS ........ 229
APPENDIX. CONTRIBUTORS TO THE REPORT ....................................................... 237
Working Group members .................................................................................................... 237
Editorial Group .................................................................................................................... 240
External review .................................................................................................................... 241


EXECUTIVE SUMMARY – 13
TOWARDS ZERO: AMBITIOUS ROAD SAFETY TARGETS AND THE SAFE SYSTEM APPROACH - ISBN 978-92-821-0195-7 © OECD/ITF, 2008
EXECUTIVE SUMMARY
Current road safety trends
Each year around one million people are killed and 50 million people injured on roads around the world. This level of road trauma imposes huge economic costs, representing between 1 and 3 percent of GDP in most countries. In addition, deaths and disability cause great emotional and financial stress to the millions of families affected. Crashes are largely preventable. Each life saved and serious injury avoided reduces pain and suffering and achieves important economic savings.
In most OECD/ITF countries, fatalities decreased by around 50% over the period 1970-2005 but performance has not been evenly spread. The greatest regional reductions were in countries in Western Europe and the Asia-Pacific region (declines of 61% and 45%, respectively). In North America (United States and Canada), fatalities decreased by 20%, with reductions generally greater during the 1980’s than in subsequent years. Central and Eastern European Countries (CEEC) and the Commonwealth of Independent States (CIS) achieved considerable annual reductions in the 1990’s but since 2000 fatalities have stabilised in the CEEC and have increased in the CIS.
Figure 1. Change in the annual number of fatalities for the main OECD/ITF regions1970-2005
Considering individual countries, there has generally been a steady decline in fatalities per head of population since 1970 - with The Netherlands, Sweden, Switzerland, Norway, the United Kingdom, Denmark and Japan reaching rates below 6.0 fatalities per 100 000 inhabitants by 2006. However, even in countries with good performance, progress is not continuous and is marked with periods of stagnation and reversal, as shown in Figure 2.

14 – EXECUTIVE SUMMARY
TOWARDS ZERO: AMBITIOUS ROAD SAFETY TARGETS AND THE SAFE SYSTEM APPROACH - ISBN 978-92-821-0195-7 © OECD/ITF, 2008
Figure 2. Evolution in the number of fatalities between 1995 and 20071995 = index 100
50
60
70
80
90
100
110
1995 1996 1997 1998 1999 2000 2001 2002 2003 2004 2005 2006 2007
Australia Netherlands New Zealand Sweden
Performance against current safety targets
The value of setting targets to improve road safety performance was acknowledged in the OECD’s report Safety on the Road: What’s the Vision? (OECD, 2002). Some subsequent research suggests that countries with quantitative targets perform better than countries without targets (Wong et al 2006). Targets that are based on a comprehensive road safety vision communicate the importance of road safety, motivate stakeholders to act and help hold managers of the road transport system accountable for achieving defined results. Targets indicate that the government is committed to reducing the road toll and is likely to support proposed policy and legislative changes and allocate sufficient resources to safety programmes. Target setting is recommended as useful for all countries attempting to reduce the road toll.
Targets can be set at a number of levels. At an international level, the European Council of Ministers of Transport (ECMT) set a common target for all member countries to reduce the number of fatalities by 50% between 2000 and 2012. Many countries have also set national targets to reduce fatalities and injuries, and some have set targets also for specific regions within the country.
Setting targets does not guarantee their achievement. Few of the OECD and ITF member countries will achieve the ECMT target of a 50% reduction in fatalities by 2012 without substantial additional effort in the remaining years. However, the fact that some countries are on track to meet the target demonstrates that targeted reductions in trauma can be achieved with adequate political will, institutional organisation and sufficient allocation of resources.
What can be done in the immediate term?
Road safety performance levels particularly, in countries with lower levels of road safety performance, can be improved in the short term by implementing a battery of proven measures. A survey conducted for this report (OECD 2006-1) asked leading road safety practitioners to identify the main risks in their country. The key measures to address these risks were identified as follows.

EXECUTIVE SUMMARY – 15
TOWARDS ZERO: AMBITIOUS ROAD SAFETY TARGETS AND THE SAFE SYSTEM APPROACH - ISBN 978-92-821-0195-7 © OECD/ITF, 2008
• Speed management: enforcement of existing speed limits can provide immediate safety benefits, perhaps more quickly than any other single safety measure. Effective speed management also requires that speed limits are appropriate for the standard of the road, the roadside risks, road design, traffic volumes and mix and presence of vulnerable road users. Public support for reduced speed limits needs to be fostered, as there is generally little understanding that small decrements in speed produce substantial reductions in trauma. Other essential components of speed management are infrastructure improvement and the use of new technologies, such as intelligent speed adaptation, to modify behaviour.
• Reduced drink-driving: based on best practice experiences, highly visible enforcement using random breath testing is needed to enforce blood-alcohol limits that should not exceed 0.5g/l for the general population. Enforcement is most effective when backed by extensive publicity, with tough sanctions for repeat offenders. Alcohol interlocks fitted to all vehicles are a future option, subject to successfully increasing public acceptance.
• Seatbelt use: legislation with firm police enforcement backed by intensive mass-media programmes and penalties is the most effective strategy to improve seatbelt wearing. Technologies such as seatbelt reminder systems and seatbelt ignition interlocks could almost completely counter the non-wearing of seatbelts if introduced universally but would require community and vehicle industry acceptance.
• Safer roads and roadsides: at least for the short term, appropriate measures include targeted road improvements that identify and treat the highest crash locations with specific treatments such as audible edge-lining, shoulder sealing, clearing of roadside vegetation and the construction of passing lanes. For longer term, a systematic, proactive approach to road infrastructure design and renewal is needed.
• Enhanced vehicle safety: the safety of vehicles has increased significantly in recent years, due to technological development of passive (crash protection) and active (crash avoidance) systems. In particular, Electronic Stability Control systems represent a major recent advance in active safety, with collision avoidance and lane departure warning systems examples of other promising technologies.
• Reduced young driver risk: graduated licensing schemes in tandem with extended training during the learner period have been effective in reducing deaths among young drivers. Components of a graduated licensing can include night-driving and peer-passenger restrictions, graduated demerit points while on probation, zero blood-alcohol content tolerance and extended learning periods while under supervision to provide for driving in a variety of road and weather conditions.
These proven interventions will continue to be effective only if they are implemented with a sufficient level of intensity and are carefully matched to the individual circumstances of each country. Effective implementation also involves management processes that include analysing data to identify key problem areas, setting targets for achievement, choosing effective interventions, building community and political support, allocating sufficient resources and monitoring and evaluating performance.

16 – EXECUTIVE SUMMARY
TOWARDS ZERO: AMBITIOUS ROAD SAFETY TARGETS AND THE SAFE SYSTEM APPROACH - ISBN 978-92-821-0195-7 © OECD/ITF, 2008
Figure 3. Seatbelt wearing rates reported in a surveyundertaken for this report
2002, 2003, 2004 or 2005 data
0%
10%
20%
30%
40%
50%
60%
70%
80%
90%
100%
Ger
ma
ny
Can
ada
Gre
at B
ritai
n
No
rway
Ne
w Z
eala
nd
Aus
tralia
Fra
nce
Sw
eden
Net
herl
ands
Sw
itzer
land
Au
stria
Pol
and
(urb
an)
Irela
nd
Ma
lta
Hun
gary
Por
tuga
l
Cze
ch R
epub
lic
Japa
n
Lith
uani
a
Latv
ia
Kor
ea
Uni
ted
Sta
tes
GeneralFrontRear
Source: Country Reports on Road Safety Performance, OECD/ITF 2007,www.internationaltransportforum.org/jtrc/safety/targets/Performance/TS3-summary.pdf.
Improving performance in the longer term
Some traditional safety measures are likely to show a diminishing rate of return in countries that have pursued them most effectively. For example, at seatbelt wearing rates of 97% (e.g. in France for front seats), it will clearly be difficult to move closer to 100% through more intensive application of traditional education and enforcement approaches. This is seen by many experts as an indication that a new approach to road safety is necessary.
Further advances will require in the first instance, an expanded understanding of possible achievements and the development of innovative strategies and associated targets. This report contends that further major road safety gains are possible in all countries regardless of their current performance levels, through:

EXECUTIVE SUMMARY – 17
TOWARDS ZERO: AMBITIOUS ROAD SAFETY TARGETS AND THE SAFE SYSTEM APPROACH - ISBN 978-92-821-0195-7 © OECD/ITF, 2008
• Improved data collection and analysis to support longer term targets and interventions.
• Setting robust interim targets, based on an agreed strategy.
• Ambitious long term vision, building on the agreed strategy with innovation.
• Adopting a Safe System approach.
• Improving key institutional management functions.
• Supporting research and development through knowledge transfer.
• Establishing adequate funding for effective safety programmes.
• Meeting management challenges, especially building political support.
These eight points are developed below.
Data collection and analysis
Comprehensive data collection and analysis are essential for designing effective safety strategies, for setting achievable targets, for developing and determining intervention priorities and for monitoring programme effectiveness. Good quality collision statistics are essential and need to be complemented with demographic data and traffic volume data by traffic mode to generate safety performance indicators. Performance indicators can also be used as intermediate targets (such as rates of seat belt and helmet use, speeding and red light running). Data on infrastructure factors (road length by crash risk, mean travel speed, etc.) is also important.
In-depth data analyses enable past safety achievements to be understood and also allow target reductions in fatalities and injuries to be estimated on the basis of measured and expected trends. It is critical that these estimates are not simple forward projections of past reduction rates but are based on a comprehensive understanding of all the underpinning trends likely to impact on system safety.
Reliability and quality of data is a key issue, when developing road safety interventions. Even in good practice countries, there is scope for further efforts to link police collision reports to hospital data records to improve data quality and consistency, especially regarding serious injury crashes. Data quality and effective analysis are fundamental to building risk awareness and intervention effectiveness.
Setting robust interim targets
A results focus is critical to an effective road safety programme. It requires setting targets and identifying the institutional means and interventions to achieve them. The targets relate to outputs (e.g. level of enforcement), intermediate outcomes (e.g. mean travel speeds, seatbelt wearing), final outcomes (e.g. number of fatalities and serious injuries) and social costs savings.
A relatively small number of countries now use empirically derived targets, based on quantitative modelling of intervention options. In this approach, targets are based on empirical evidence relating to the selected interventions’ previous effectiveness combined with best estimates of future effectiveness, using a model linking inputs and outcomes.
This approach to setting targets is recommended. It bases targets on the achievements that can be expected from successful implementation of the interventions that make up the road safety strategy adopted. It promises immediate safety benefits through a known battery of interventions. This helps secure community support, and linking targets to an agreed strategy of interventions strengthens political support.

18 – EXECUTIVE SUMMARY
TOWARDS ZERO: AMBITIOUS ROAD SAFETY TARGETS AND THE SAFE SYSTEM APPROACH - ISBN 978-92-821-0195-7 © OECD/ITF, 2008
Ambitious long term vision
Countries with different levels of performance will have different ambitions in terms of road safety improvement. For some industrialised countries, a target fatality rate of 6 fatalities per 100 000 inhabitants will be seen as an ambitious target. Other countries have already reached this level and will aim at a higher level of ambition. Nil deaths and injuries represent the extreme level of ambition and is based on the belief that any level of serious trauma arising from the road transport system is unacceptable. This view is expressed most formally in the road safety policies of the Netherlands and Sweden known as Sustainable Safety and Vision Zero respectively, both of which are examples of a Safe System strategy. This approach is common in other transport systems and has determined safety programmes in aviation, rail and shipping for several decades.
This is an aspirational vision in that it may be impossible to specify all the interventions required to achieve this final goal. The means of achievement remain uncertain as practitioners are required to go beyond the limits of projected good practice. It therefore requires a strong commitment to innovation to reshape interventions to achieve the desired results, rather than only using current and projected performance expectations to determine them. This impetus for innovation challenges road safety professionals, stakeholders and government to develop the institutional capacity to achieve the desired results, to form new partnerships, and seek new effective approaches.
The long term vision of eliminating deaths and serious injuries needs to be complemented with robust interim targets, as described above, for specific planning terms up to a decade or so. This will help ensure the delivery of benefits over the shorter term, essential if the longer term vision is to remain credible.
Western Australia’s proposed road safety strategy for 2008-2020, Towards Zero: Getting ThereTogether, sets out such an approach as follows. “Towards Zero means that we do not accept that any human being should die or be seriously injured on our roads. Realistically we understand that it is not practical to achieve zero serious injuries on our roads by the year 2020, but we do not accept any death or serious injury as inevitable. This vision can be achieved if the community as a whole makes a fundamental change in the way it thinks about road safety and what it is prepared to accept. Our Target by 2020: 11 000 fewer people killed or seriously injured. If the Towards Zero Strategy is fully implemented we could see up to 11 000 fewer people killed or seriously injured on Western Australian roads between 2008 and 2020, a reduction of up to 40% on the average number of people killed and seriously injured each year between 2005 and 2007”.The targeted reduction in deaths and injuries is derived from modeling the results to be expected from packages of specific interventions.
Aspirational targets for very large reductions in road trauma by specific dates have been adopted in many ITF member countries without links to specified interventions. This makes them very difficult to achieve. In the worst case, targets that fail to be achieved undermine the credibility of target setting and road safety programmes generally. Many of the countries that have adopted the ECMT target for 50% reduction in road deaths between 2000 and 2012 appear unlikely to meet it. Targets based on expected outcomes from specified interventions should therefore now be set, as a means to move systematically towards this level of ambition.
The only effective use of aspirational targets is in establishing a long term vision for achieving rates of deaths and serious injuries close to zero coupled to a twin track approach to make the vision operational: interim targets for quantified improvements over specific periods along the way, through interventions that are part of the road safety strategy; and research into more effective and new interventions to push the performance frontier.

EXECUTIVE SUMMARY – 19
TOWARDS ZERO: AMBITIOUS ROAD SAFETY TARGETS AND THE SAFE SYSTEM APPROACH - ISBN 978-92-821-0195-7 © OECD/ITF, 2008
Adopting a safe system approach
A Safe System approach is of the only way to achieve the vision of zero road fatalities and serious injuries and requires that the road system be designed to expect and accommodate human error. A Safe System approach has the following characteristics:
• It recognises that prevention efforts notwithstanding, road users will remain fallible and crashes will occur.
• It stresses that those involved in the design of the road transport system need to accept and share responsibility for the safety of the system, and those that use the system need to accept responsibility for complying with the rules and constraints of the system.
• It aligns safety management decisions with broader transport and planning decisions that meet wider economic, human and environmental goals.
• It shapes interventions to meet the long term goal, rather than relying on “traditional” interventions to set the limits of any long term targets.
The basic strategy of a Safe System approach is to ensure that in the event of a crash, the impact energies remain below the threshold likely to produce either death or serious injury. This threshold will vary from crash scenario to crash scenario, depending upon the level of protection offered to the road users involved. For example, the chances of survival for an unprotected pedestrian hit by a vehicle diminish rapidly at speeds greater than 30km/h, whereas for a properly restrained motor vehicle occupant the critical impact speed is 50km/h (for side impact crashes) and 70 km/h (for head-on crashes).
Figure 4. Fatality risk
0
10
20
30
40
50
60
70
80
90
100
0 10 20 30 40 50 60 70 80 90 100 110 120 130
fata
lity
risk
%
Collision speed km/h
Pedestrrianor cyclist
Frontal orhard objectcollision
Sidecollision
Source: Wramborg, P. (2005). A New Approach to a Safe and Sustainable Road Structure and Street Design forUrban Areas. Paper presented at Road Safety on Four Continents Conference, Warsaw Poland.
A Safe System approach is appropriate for countries at all levels of road safety performance, with specific interventions likely to differ from country to country. The elimination of all deaths and serious

20 – EXECUTIVE SUMMARY
TOWARDS ZERO: AMBITIOUS ROAD SAFETY TARGETS AND THE SAFE SYSTEM APPROACH - ISBN 978-92-821-0195-7 © OECD/ITF, 2008
injuries represents a long term goal that can be combined with traditional interventions used in the interim to achieve immediate safety benefits. Figure 5 illustrates the association between long term Safe System outcomes and interim outcomes based on traditional interventions.
Figure 5. Interim and longer term performance through the adoption of a Safe System
Source: Eric Howard.
Improving key institutional management functions
Because road safety performance is determined by institutional capacity to implement efficient and effective interventions, targets will be most readily met if a robust management system can be established. This system should have a clear focus on producing agreed results. Results are dependent on interventions which are in turn dependent on institutional management functions (see figure 6). Much of the day to day discussion concerning road safety centres only on interventions. Addressing all parts of the management pyramid brings in such important and often neglected issues as institutional ownership and functional capacities for road safety policies, a safety performance framework for delivery of interventions and accountability for results.

EXECUTIVE SUMMARY – 21
TOWARDS ZERO: AMBITIOUS ROAD SAFETY TARGETS AND THE SAFE SYSTEM APPROACH - ISBN 978-92-821-0195-7 © OECD/ITF, 2008
Figure 6. The road safety management system
Source: Land Transport Safety Authority (2000) and Bliss & Breen (2008).
The following seven institutional management functions are critical determinants of a country’s capacity to achieve results:
• Results focus – a strategic focus that links the delivery of interventions with subsequent intermediate and final outcomes. This requires government to designate a lead agency to work with other agencies to:
− Develop management capacity to understand a country’s road safety issues.
− Provide a comprehensive strategy with intermediate and outcome targets.
− Deliver interventions and target achievements.
− Review performance.
• Coordination of the key agencies to develop and deliver road safety policy and strategy.
• Effective legislation to enable desired results to be delivered.
• Adequate funding and well targeted resource allocation for interventions and related institutional management functions.
• Promotion of road safety within government and the broader community.
• Robust and systematic monitoring and evaluation to measure progress.

22 – EXECUTIVE SUMMARY
TOWARDS ZERO: AMBITIOUS ROAD SAFETY TARGETS AND THE SAFE SYSTEM APPROACH - ISBN 978-92-821-0195-7 © OECD/ITF, 2008
• Proactive research and development and knowledge transfer programmes which actively influence improvement in interventions, institutional management functions and performance monitoring.
Above all, the commitment to a results focused approach to road safety management has a critical role in determining the achievement of a country’s road safety ambition and related targets.
Supporting research and development through knowledge transfer
Research and knowledge transfer will play a pivotal role in the design and delivery of interventions aimed at achieving a Safe System approach and in attaining results that go well beyond what has been achieved so far. Our understanding of why and how crashes occur is based on very limited research. A more complete picture would provide the basis for more effective interventions. High-income countries will rely increasingly on innovation to work towards the ultimate goal of eliminating road deaths and serious injuries. Low and middle-income countries will benefit from these advances.
Knowledge transfer priorities are shaped both by the capacity of countries to implement safety innovations and the capacity of global and regional knowledge transfer processes. In the case of low and middle-income countries, safety management capacity weaknesses present a formidable barrier to progress and must be addressed directly as a strategic priority in knowledge transfer initiatives.
Knowledge transfer must be backed by sufficient targeted investment to overcome the barriers presented by capacity weaknesses at global, regional and national levels. Strong and sustained international cooperation will be required to mobilize knowledge transfer resources and support services commensurate with the sheer scale of the global road deaths and serious injuries.
Adequate funding for effective safety programmes
Road crash costs usually represent between 1% and 3% of a country’s GDP (depending on whether a human capital or willingness to pay approach is used). While a survey conducted for this report shows that many countries are unable to estimate the annual costs of road trauma to government and injury insurers, the available evidence suggests that costs substantially outweigh the funds put into prevention programmes.
The adoption of a Safe System approach can produce important economic savings for society. To compete successfully for limited resources with other political and social programmes the road safety case needs to include sound economic arguments. This requires road safety managers to be skilled in assembling business cases for initiatives, including economic analysis. In particular, accurate estimates of crash costs are necessary to show the scale of the problem and to attract investment in road trauma prevention.
Components of an effective business case include:
• A solid evaluation framework to assess the economic and social scale of the current problem, to analyse injury causation data, to prioritise possible interventions (using cost benefit and cost effectiveness analyses) and to identify the socio-economic returns of expenditures on road safety.
• An allocation and implementation process that delivers resources to areas where the greatest benefits will be generated.

EXECUTIVE SUMMARY – 23
TOWARDS ZERO: AMBITIOUS ROAD SAFETY TARGETS AND THE SAFE SYSTEM APPROACH - ISBN 978-92-821-0195-7 © OECD/ITF, 2008
• Identification of any potential additional funding resources outside government, including encouragement for injury insurer investment in road trauma prevention.
Cost benefit analyses from various member countries show that carefully targeted road safety activity can be a viable investment opportunity, providing a competitive return for the insurance industry as well as government especially when the aggregate costs to the two sectors are considered and not solely the costs to government. Opportunities to attract funding by offering commercially acceptable rates of return for investors need to be vigorously pursued.
Meeting management challenges – building political support
While strong political support is critical for achieving ambitious targets, road safety may often be a hard sell to politicians. Many factors including the level of public interest and public pressure, the economic and political feasibility of solutions and the prospects of demonstrable success determine whether road safety will be treated as a government priority.
Road safety policy makers and advocates need to provide sound advice to government on policies while also accommodating the practical realities of political decision-making by:
• Empirically demonstrating the value of perhaps unpopular road safety policies, to enable politicians to stand firm in the face of opposition.
• Promoting policies that will show positive results within in a timeframe relevant to politicians.
• Displaying an appreciation of the practical realities of political decision-making, including the election cycle.
• Consistently providing competent, timely advice on a day to day basis.
• Carrying out effective policy advocacy at all levels of government.
Politicians need to be engaged in the process of developing the vision for road safety and the strategy for improving performance and not just the legislative process and approval of targets. Ownership of the vision and strategy is more likely to generate the funding and support for management capacity development and training required.
It is also useful to promote the synergies between road safety policies and other policy areas such as occupational health, consumer rights and environmental protection. For example, reductions in greenhouse gas emissions can be achieved through improved speed management to reduce crash risk.
Public opinion represents a key stimulus to political will for road safety. It will always be easier for a government to make road safety a priority if the public supports the effort. Activities such as publishing information on crash risks and measured safety performance may mobilise public as well as political support for road safety. Genuine consultation during strategy development should be integral elements of government road safety activity.
There is a strong and growing market for safety, evidenced by consumer vehicle purchase preferences in response to information programs such as NCAP, by safety programmes for child travel to and from schools and by the demand for the safer operation of public transport and freight activities on the road network. Support for this growing momentum is also evident in the private sector, where

24 – EXECUTIVE SUMMARY
TOWARDS ZERO: AMBITIOUS ROAD SAFETY TARGETS AND THE SAFE SYSTEM APPROACH - ISBN 978-92-821-0195-7 © OECD/ITF, 2008
organisations such as Volvo, oil and mining companies and motoring associations are making strong statements about the future safety of their products and their operations.
Recommendations
1. Adopt a highly ambitious vision for road safety
All countries are advised to adopt and promote a level of ambition that seeks in the long term to eliminate death and serious injury arising from use of the road transport system. Adopting this ambition will alter the community’s view of the inevitability of road trauma, alter institutional and societal responsibilities and accountability and change the way in which road safety interventions are shaped.
This is an aspirational vision in that achievement will require interventions that are some steps removed from prevailing best practice and will require the development of altogether new, more effective interventions. Part of its value lies in driving innovation. The long term vision needs to be complemented with interim targets for specific planning periods up to a decade or so.
2. Set interim targets to move systematically towards the vision
Ambitious, achievable and empirically-derived road safety targets should be adopted by all countries to drive improved performance and accountability. These targets should be developed by using a methodology that links interventions and institutional outputs with intermediate and final outcomes to develop achievable targets for different intervention options.
Exceptional efforts will be required in most OECD and ITF countries to achieve the road safety targets set by Transport Ministers in 2002 - 50% reduction in deaths between 2000 and 2012, or similar ambitious targets. Accordingly, it is recommended that targets based on expected outcomes from specified interventions now be established, as a means to move more systematically towards the level of ambition established by the targets set in 2002.
3. Develop a Safe System approach, essential for achieving ambitious targets
It is recommended that all countries, regardless of their level of road safety performance, move to a Safe System approach to road safety. This approach: builds on existing road safety interventions but reframes the way in which road safety is viewed and managed in the community. It addresses all elements of the road transport system in and integrated way with the aim of ensuring crash energy levels are below what would to cause fatal or serious injury. It requires acceptance of shared overall responsibilities and accountability between system designers and road users. It stimulates the development of the innovative interventions and new partnerships necessary to achieve ambitious long term targets.
4. Exploit proven interventions for early gains
Countries experiencing difficulty in improving their road safety performance should as a matter of urgency conduct high-level reviews of their safety management capacity and prepare long-term investment strategies and related programs and projects to overcome revealed capacity weaknesses. These programmes and projects should adapt and implement proven institutional management arrangements and interventions used in more successful countries, and make use of good practice tools developed by international agencies to assist this process.

EXECUTIVE SUMMARY – 25
TOWARDS ZERO: AMBITIOUS ROAD SAFETY TARGETS AND THE SAFE SYSTEM APPROACH - ISBN 978-92-821-0195-7 © OECD/ITF, 2008
5. Conduct sufficient data collection and analysis to understand crash risksand current performance
All countries are encouraged to develop data collection procedures to cover: final outcomes (including at least deaths and serious injuries by road user); exposure measures (for example, relating outcomes to population levels, licensed driver numbers, distances travelled); intermediate outcomes (also called safety performance indicators and including levels of mean traffic speeds, seat belt wearing, drink driving and vehicle and infrastructure safety ratings); institutional delivery outputs (including different categories of enforcement effort); socio-economic costs associated with road trauma; and underlying economic factors (including new vehicle sales).
Careful data analysis should be conducted to improve understanding of crash and other trends to allow different intervention mixes and intensities to be modelled and ambitious but achievable targets to be set.
6. Strengthen the road safety management system
All countries should commit to ensuring an effective road safety management system and in particular seek to achieve a strong results focus through their institutional management arrangements. This results focus requires clear identification of: a lead agency; the core group of government ministries and agencies to be involved; their roles and responsibilities; and the performance targets in terms of institutional outputs and intermediate and final outcomes to be achieved within a defined strategy.
7. Accelerate knowledge transfer
Knowledge transfer initiatives must be supported with adequate investment in targeted programs and projects, designed to overcome institutional capacity weaknesses, especially by creating sustainable learning opportunities in the countries concerned.
Strong and sustained international cooperation will be required to mobilize resources and support commensurate with the scale of the losses arising from road deaths and serious injuries. This is especially the case with low and middle-income countries, but it is also relevant to high-income countries seeking innovative strategies for achieving the ultimate goal of eliminating death and serious injury.
8. Invest in road safety
Most countries need to improve their knowledge of expenditure on the consequences of road crashes, both by government and injury insurance companies, and investment in road safety improvement and trauma prevention. Road safety authorities need this information to prepare financial and economic evidence on the costs and effectiveness of proposed interventions in order to win whole-of-government support for funding innovative programmes and for transparency in resource allocation for crash prevention and treatment.
There are opportunities for targeted road safety investments that provide competitive returns. Road safety practitioners and authorities should develop business cases for this investment.
A step change in resources invested in road safety management and in safer transport systems is required to realise the achievement of ambitious road safety targets in most of the world.

26 – EXECUTIVE SUMMARY
TOWARDS ZERO: AMBITIOUS ROAD SAFETY TARGETS AND THE SAFE SYSTEM APPROACH - ISBN 978-92-821-0195-7 © OECD/ITF, 2008
9. Foster commitment at the highest levels of government
Sustained government commitment at the highest level is essential for improving road safety. To secure this, road safety managers not only need to develop evidence-based road safety programmes but need to advocate strategies that reflect an understanding of political constraints such as the electoral cycle.
Significant effort needs to be directed at informing the public about the Safe System approach. Public consultation should be comprehensive and should precede final political consideration of new policies.
Road safety practitioners and stakeholders have a responsibility to influence the political process of policy assessment through: competent and persistent advocacy of programmes within government, provision of annual estimates of the socio-economic costs of road trauma and development of an extensive armoury of effective road safety interventions.

EXECUTIVE SUMMARY – 27
TOWARDS ZERO: AMBITIOUS ROAD SAFETY TARGETS AND THE SAFE SYSTEM APPROACH - ISBN 978-92-821-0195-7 © OECD/ITF, 2008
REFERENCES
OECD (2006-1), Country reports on road safety data and performance, Results of a survey undertaken by the OECD/ITF Working Group on Achieving Ambitious Road Safety Targets. Avalaible on the internet at http://www.internationaltransportforum.org/jtrc/safety/targets/Performance/TS3-summary.pdf
OECD 2002, Road Safety: What’s the Vision, OECD, Paris.
Wong, S.C., N.N. Sze, H.F. Yip, Loo, P.Y. Becky W.T. Hung, H.K. Lo, Association between settingquantified road safety targets and road fatality reduction, Accident Analysis and Prevention, 2006, 38, 997-1005
Wramborg, P. (2005), A New Approach to a Safe and Sustainable Road Structure and Street Design forUrban Areas. Paper presented at Road Safety on Four Continents Conference, Warsaw Poland.
Western Australian Road Safety Council (2008), Towards Zero: Getting there Together, Road Safety Council’s Recommendation to Government to Reduce Road Trauma in Western Australia 2008-2020, Perth August 2008.


INTRODUCTION – 29
TOWARDS ZERO: AMBITIOUS ROAD SAFETY TARGETS AND THE SAFE SYSTEM APPROACH - ISBN 978-92-821-0195-7 © OECD/ITF, 2008
INTRODUCTION
Road trauma as a global health burden
Everyone is a regular user of the road system, whether as a vehicle occupant, pedestrian, cyclist or motorcyclist. Everyone expects to complete the journeys that we embark on without incurring injury and, most of the time, these expectations are met. The frequency with which trips are safely completed has led to what the World Health Organisation (2004) has termed ‘optimism bias’: road crashes are rare events that always happen to other people, if they happen at all. Unfortunately this high level of individual safety overlooks the fact that even in the most advanced societies road systems exact an unacceptable cost in trauma:
• Road crashes account for around 1.2 million deaths and 50 million injuries every year worldwide (WHO, 2004).
• In OECD and International Transport Forum countries, 180 000 persons die every year on the road, an average of one fatality every 3 minutes (OECD/ECMT, 2006).
• The costs of road crashes on average are equivalent to between 1 and 3 percent of gross national product in most countries (WHO, 2004).
Road fatalities represent only a small fraction of casualties, with injuries of lesser severity affecting many more individuals, families and societies around the world. Consider for example the following assessment:
It is estimated that there are about 100 million families coping with the death or disability of afamily member involved in a road crash. The impact in terms of emotional and financial stress isenormous. Poverty, depression, physical illness and suicide are common consequences.
(WHO, 2004, p7.)
In recent decades, there have been many efforts around the world to combat the growing problem of road trauma. Programmes have been launched at local, regional, national and international levels – sometimes tackling the whole range of safety issues, sometimes targeting individual issues such as speeding, drink-driving and young drivers. The effectiveness of these programmes has varied widely: while many countries (and especially higher-income countries) have made substantial progress in reducing their road casualties, other countries have seen the number of road casualties worsen.
ITF countries and road trauma reduction
As a key example of international collaboration, Transport Ministers from the European Conference of Ministers of Transport (ECMT)1, at their 2002 Council, affirmed their will to combat road deaths and urged Member States to undertake both joint and national action to tackle this issue. This affirmation was prompted in part by the mixed success of Member States in moving towards hitherto agreed injury reduction targets. A survey of individual Member States to assess their progress revealed the following factors in accounting for the uneven gains:

30 – INTRODUCTION
TOWARDS ZERO: AMBITIOUS ROAD SAFETY TARGETS AND THE SAFE SYSTEM APPROACH - ISBN 978-92-821-0195-7 © OECD/ITF, 2008
• Awareness of the size and urgency of the problem among political decision-makers and the public.
• Delineation of roles and responsibilities across levels of government and other key players.
• Funding and monitoring of those programmes and strategies in place.
• Quality and quantity of enforcement activity.
• Availability of crash and performance data to assess both the problem and the effectiveness of intervention.
As a result of these differences, countries varied greatly in regard to the effectiveness of their road safety programmes and their subsequent movement towards achieving target reductions in road trauma. As noted by the Council of Transport Ministers (OECD/ECMT, 2006): “While a few countries are making good progress, exceptional efforts will be required in most countries over the next five years to achieve the road safety targets that have been set”. It should also be recognised that not all targets were set with sufficient data and evidence based precision.
The Council further reasoned that if those Member States lagging in road safety achievements were to achieve their targets, action in two parallel areas was required:
• Addressing key road safety problems (including speeding, drink driving, insufficient seat-belt wearing, unacceptable young driver crash risk, unsafe road infrastructure and insufficient vehicle crashworthiness), largely through using those measures that had been trialled and proven in the more successful countries. This application of best practice from elsewhere would allow under-performing countries to achieve relatively rapid road trauma reductions.
• Establishing a framework for long-term sustainable safety in order to achieve the more ambitious target reductions. The Council recognised that a number of countries with strong road safety performance – for example, Sweden and the Netherlands – were making a paradigm shift by adopting a Safe System strategy.
A Safe System approach addresses all elements of the road transport system to try and ensure that road users are never subject to impact energy levels sufficient to cause fatal or serious injury when, as is inevitable, errors of judgement result in crashes. This includes the development of forgiving infrastructure design, pursuit of improved vehicle safety and review of speed limits to better manage crash energy. It assigns a responsibility to ensure compliance with safe system design to all parties involved in designing and managing vehicles and the road environment, not just to road users and traffic police.
A Safe System approach builds on existing road safety measures This new thinking also means a cultural shift and a sharing of responsibility for overall road safety, requiring a high level of political, social and community commitment, with government, other groups and individuals all having important roles to play in improving road safety.

INTRODUCTION – 31
TOWARDS ZERO: AMBITIOUS ROAD SAFETY TARGETS AND THE SAFE SYSTEM APPROACH - ISBN 978-92-821-0195-7 © OECD/ITF, 2008
Limits of current traditional approaches
Traditional approaches to road safety, characterised by a strong focus on behaviour have been successful over the past 30 years and largely contributed to significant improvements in road fatality levels in most OECD countries.
However, many countries have recently seen a levelling-off in the reduction of fatalities and injuries and further progress has become more difficult. For example, it is difficult in some jurisdictions to expand further the level of effective police enforcement at a reasonable cost.
An increasing number of countries have therefore started to think in terms of adopting a safe system approach. This is not in opposition with traditional approaches. The knowledge about risk factors and effective interventions to address them is a very important link between traditional approaches and safe system approaches.
It is evident that countries with different safety levels have different needs. Reaching levels below 4-5 fatalities per 100 000 population is likely to require a different strategy than is needed to improve road safety in poorly performing jurisdictions. However, a safe system approach is not a domain reserved for either the high income or well performing countries. Low and middle income countries can also benefit substantially from introduction of this approach, building upon implementation of traditional safety interventions.
Objectives of this report
Leading OECD/ITF countries have now experienced several decades of success with targeted programmes and managing a process which seeks continuous improvement in results. This report takes stock of recent developments and initiatives in OECD and International Transport Forum member countries to meet increasingly ambitious road safety targets. It highlights the institutional management changes required in many countries to implement effective interventions through a strong focus on results, and builds the economic case for road safety investment. It also challenges the better performing countries to do more.
The report highlights the importance of setting targets that are not only ambitious, but set on a robust quantified basis which reflects the outcomes expected from agreed strategies. It examines how countries can most effectively move towards achieving their targets and suggests that this is adopting a safe system approach, regardless of the current level of performance. The rationale of the safe system requires innovative thinking about the full range of possible interventions and thereby opens up new avenues for reducing trauma. Such approach also improves the alignment with other societal goals. For example important synergies exist with environmental protection policies that aim to reduce vehicle emissions through improved driving style and speed limits.
Another objective is to report on the benefits of further reductions in road crashes and casualties in relation to the funding required. This includes analysis of road safety crash measures and the balance in resource allocation between financing such measures and funding the public services needed to deal with the consequences of road crashes. Opportunities to encourage investment in road safety based on the development of business cases for innovative interventions that could provide competitive returns to insurers and governments are discussed.
The report also identifies the management challenges involved in achieving full and effective implementation of tried and tested road safety measures.

32 – INTRODUCTION
TOWARDS ZERO: AMBITIOUS ROAD SAFETY TARGETS AND THE SAFE SYSTEM APPROACH - ISBN 978-92-821-0195-7 © OECD/ITF, 2008
Structure of the report
The report is organised as follows:
• Chapter 1 Road safety targets and performance describes the range of final outcome targets adopted in OECD and International Transport Forum countries, the insufficient performance to date and the potential for wider use of intermediate outcomes and output measures as targets. It considers how challenging and ambitious targets can be set and achieved and illustrate issues associated with modelling of targets.
• Chapter 2 Data collection and analysis: requirements and opportunities aims to show how effective data analysis leads to an improved understanding of road crash risk by type and trend and enables more effective safe system interventions to be developed. Case studies of the type of data analysis that highly ambitious well performing jurisdictions carry out are provided. The chapter highlights the value of crahs risk analysis across a road network and illustrates issues associated with the importance of data quality and reliability for good analysis.
• Chapter 3 Some key interventions for immediate benefits discusses key road safety interventions that experience and research have shown to be highly effective in reducing road trauma and that needs to be implemented to achieve the targets.
• Chapter 4 Managing road safety programmes for results introduces a framework for a road safety management system, necessary to support achievement of road safety programme outcomes at any level of ambition. The capacity of the institutional and management arrangements for road safety in a country is crucially important to improving road safety outcomes. This reflects the complexity of the social issues to be addressed, the need to increase public understanding of the actual risks involved and the need to activate and co-ordinate the many separate government agencies that have a key role to play.
• Chapter 5 The Safe System approach discusses the fundamental shift in road safety thinking required to consolidate the significant improvements in road safety in recent decades and to generate substantial gains towards the ultimate elimination of death and serious injury. It examines the safe system approach, which aims ultimately to ensure road users are never subject to impact energy levels sufficient to cause fatal or serious, disabling injury. It reviews the current state of the art in innovative thinking about the full range of possible interventions, including developing a forgiving road infrastructure, pursuit of improved vehicle safety and speed limits set to reduce unacceptably high injury risk. It reviews progress in developing and implementing safe system approaches in the countries that are leading the way. The chapter describes how a Safe System approach can re-frame the ways in which safety is viewed and managed.
• Chapter 6 Building the economic case for road safety investment presents the economic considerations that underlie support for implementing road safety programmes. In particular, the chapter develops the argument that the costs of road trauma outweigh the costs of effective prevention. Opportunities for investment in road safety are discussed.
• Chapter 7 Managing effective strategies and creating the right political environment presents the key principles and practices involved in the effective implementation of a road safety programme, including the need to achieve an appropriate political environment to achieve the ambitious targets that have been set.

INTRODUCTION – 33
TOWARDS ZERO: AMBITIOUS ROAD SAFETY TARGETS AND THE SAFE SYSTEM APPROACH - ISBN 978-92-821-0195-7 © OECD/ITF, 2008
• Chapter 8 Knowledge transfer presents the vital role played by research and development and knowledge transfer in achieving continuous improvement in safety performance, especially from the development of targeted national programs through to the Safe System approach. Knowledge transfer priorities must reflect the latest developments in interventions and performance measures, but they must also be shaped by both the capacity of countries to implement this knowledge and the capacity of global and regional knowledge transfer mechanisms to accelerate its delivery. In this regard strong and sustained international cooperation will be required to underpin successful knowledge transfer initiatives.
• Chapter 9 Conclusions and Recommendations provides conclusions and key messages and makes recommendations.
The report also contains several annexes, which complement the core chapters:
• Annex A Road safety trends summarises the progress made by OECD/ITF counties in improving their level of road safety since 1970, and completes the information presented in Chapter 1.
• Annex B presents the detailed trends analysis of different crash types for Canada, the Netherlands and New Zealand and completes the information presented in Chapter 2.
• Annex C provides practical guidance on steps towards implementing a safe system approach.
The list of members of the Working Group is presented in the Appendix.
NOTE
1. In 2007, the ECMT was transformed into the International Transport Forum (ITF).

34 – INTRODUCTION
TOWARDS ZERO: AMBITIOUS ROAD SAFETY TARGETS AND THE SAFE SYSTEM APPROACH - ISBN 978-92-821-0195-7 © OECD/ITF, 2008
REFERENCES
OECD/ECMT (2006). Road safety: Achieving Ambitious Road Safety Targets, CEMT/CM(2006)20. Note of the Council of Ministers.
Mathers, C., and D. Loncar, Updated projections of global mortality and burden of disease, 2002-2030:data sources, methods and results, WHO, October 2005.
World Health Organisation (2004), World Report on Road Traffic Injury Prevention, WHO, Geneva.

ROAD SAFETY TARGETS AND PERFORMANCE – 35
TOWARDS ZERO: AMBITIOUS ROAD SAFETY TARGETS AND THE SAFE SYSTEM APPROACH - ISBN 978-92-821-0195-7 © OECD/ITF, 2008
1. ROAD SAFETY TARGETS AND PERFORMANCE
ABSTRACT
This chapter reviews road safety performance in OECD and International Transport Forum (ITF) countries over the past 35 years and the targets set in many countries or by international organisations to reduce the future numbers of deaths and injuries. The chapter highlights the differences in recent and current road safety performance across countries and argues that all countries with the ambition and will, the knowledge and the resources, can achieve reductions in their crash levels at least approaching the reductions achieved by the best performing countries. It discusses the value of setting ambitious and achievable targets to guide future road safety performance and examines how effective safety targets can be set for both the short and longer term.
1.1. Road safety trends in member countries
Over the period 1970 to 2005, road fatalities in most OECD and ITF countries declined substantially in terms of both absolute numbers and rates based on various exposure measures With countries in Western Europe and the Asia-Pacific region making the most progress. Progress in many countries has slowed in more recent years and there is need for new measures and approaches to stimulate a renewed downward trend in fatalities. The progress in reducing fatalities has been greater than for reducing injuries, although limits to the accuracy of injury data prevents precise conclusions being drawn on this point (see figures 1.1 and 1.2).
OECD and ITF countries include a wide range of economies with large differences in their road safety performance. The best performing countries have fatality rates of around 5-7 killed per 100 000 population. These rates represent a decrease of more than 50% since the 1970s, over a period when motorisation increased substantially. However for some countries, particularly those with relatively low levels of road safety performance, the number of fatalities is increasing. There are other countries whose level of road safety performance falls between these two groups. Details of road crash trends for individual countries over the past three or so decades are given in Annex A.
1.2. Road safety targets in Member countries
Road safety targets quantify the road safety results a jurisdiction wishes to achieve and can be expressed in terms of final outcomes, intermediate outcomes and institutional outputs (see section 1.2.4). Targets sharpen the focus on results and also on development of system-wide interventions and effective institutional management process to achieve them. This puts targets at the core of an effective road safety management system (Bliss and Breen, 2008).

36 – ROAD SAFETY TARGETS AND PERFORMANCE
TOWARDS ZERO: AMBITIOUS ROAD SAFETY TARGETS AND THE SAFE SYSTEM APPROACH - ISBN 978-92-821-0195-7 © OECD/ITF, 2008
Figure 1.1. Changes in fatality numbers per region, 1970-2005
Note: Countries for which appropriate data were not available include Albania, Bosnia-H, Malta, Slovak Rep, Turkey, Mexico, Belarus, Armenia.
Source: IRTAD and ITF.
Figure 1.2. Changes in fatalities and injury crashes (1990-2005)
Source: IRTAD and ITF.
ROAD SAFETY TARGETS AND PERFORMANCE – 37
TOWARDS ZERO: AMBITIOUS ROAD SAFETY TARGETS AND THE SAFE SYSTEM APPROACH - ISBN 978-92-821-0195-7 © OECD/ITF, 2008
1.2.1. National Road Safety Visions
The results focussed management approach required for delivery of effective road safety policies is discussed in depth in Chapter 4. Setting target fatality and casualty reductions to reflect each country’s road safety vision is a key part of the focus on results. The road safety vision should be a product of underlying community values that might include the following elements:
• No one should be killed or seriously injured in motor vehicle collisions on our roadways.
• Protecting vulnerable road users such as children should be a priority.
• There should be limits to the disadvantage experienced by road users due to actions taken to protect other road users.
• Mobility should be maximised within the limits of safe operation.
These values indicate the degree to which road trauma is tolerated by a society and are fundamental to determining the level of road safety ambition.
Some countries have adopted the value that it is unacceptable for any fatalities or serious injuries to result from motor vehicle collisions. Sweden’s Vision Zero, for example, states that “Nobody is to be killed or seriously injured as a result of traffic accidents and that the design and functioning of the road transport system shall be adapted to the requirements resulting from this ruling”. Denmark’s vision is “Every accident is one accident too many – road safety starts with you”, which is in the same vein as the Vision Zero. The Netherlands’ vision is based on Sustainable Safety which focuses on prevention of collisions and making roads more forgiving of human error by road users.
Safe System visions of the type developed in Sweden and the Netherlands are described more fully in Chapter 5. These visions are both comprehensive and ambitious and have had a critical impact on the subsequent safety targets set for these countries.
Some other countries’ visions are stated along different lines. By 2010, New Zealand expects to have an “affordable, integrated, safe, responsive, and sustainable transport system”. Canada’s Road Safety Vision 2010 is to “have the safest roads in the world” based on comparisons of fatality rates with other OECD countries. Korea’s five year plan has the vision “to protect the lives and property of the nation due to road traffic accidents, and to minimise social and economic losses”. The underlying philosophy in Great Britain is that government in partnership with many others can achieve significant reduction in road casualties. The United States Department of Transportation (US DOT) Strategic Plan 2003-2008 provides a framework for achieving its strategic objectives in safety, mobility, global connectivity, environmental stewardship and security through Safer, Simpler, Smarter TransportationSolutions.
1.2.2. Why Set Road Safety Targets?
The OECD has recommended the setting of targets (OECD, 2002), based on the following reasoning. The setting of quantitative targets communicates the importance of road safety, motivates stakeholders to act and holds managers of all components of the road transport system accountable for achieving defined positive results. By establishing a target, the message is conveyed that the government is serious about reducing the current road toll. Setting targets also for sub-national levels of government (i.e. province/state, municipality) can widen the sense of ownership by creating greater accountability at

38 – ROAD SAFETY TARGETS AND PERFORMANCE
TOWARDS ZERO: AMBITIOUS ROAD SAFETY TARGETS AND THE SAFE SYSTEM APPROACH - ISBN 978-92-821-0195-7 © OECD/ITF, 2008
all levels, establishing more partnerships and generating more action. Further, ambitious targets raise media and public awareness and hence motivate politicians to support proposed policy and legislative changes and allocate sufficient resources to major problem areas.
A recent review, Wong et al. (2006) compared the safety performance of 14 OECD countries with quantitative targets to countries without targets. Countries with targets performed better over the time period 1981-1999, with the percentage reduction in fatalities ranging from 4.5% in Norway to 21.1% in the Netherlands. A meta-analysis indicated that overall, countries with targets had 17% lower fatalities than the countries without targets.
Target setting is thus a valuable activity for all countries attempting to reduce their road toll, regardless of their current state of development. It also follows that targets representing even a modest road safety ambition can still be productive. At the same time, it is stressed that road targets need not be overly conservative. The crash reduction trends across different countries summarised earlier in this chapter and detailed in Annex A, suggest that countries with modest levels of road safety performance can aspire to the improved safety levels of better performing countries.
1.2.3. Setting road safety targets – aspirational vs empirically derived targets
Aspirational targets for very large reductions in road trauma have been used in most ITF member countries. On the one hand, very ambitious targets may assist in breaking out of a conservative mindset. Their achievement may require best practice interventions which perhaps may be some steps removed from prevailing practices. Their achievement may also require the development of new, more effective interventions. On the other hand, aspirational targets are not linked to specified interventions. Thus they are unlikely to result in the detailed dialogue between the agencies and politicians responsible for safety and the public on actions and likely outcomes that is usually necessary to secure sustained improvements.
Aspirational targets must be feasible and able to achieve at least some benefits in the short term if they are to remain credible. In the worst case, targets that fail to be achieved can undermine the credibility of target setting and road safety programmes generally.
Empirically derived targets reflect the estimated impact of the interventions comprising a given road safety strategy. The estimated impact is based on previous empirical evidence relating to the effectiveness of interventions combined with best estimates of future effectiveness within the strategy framework. By setting empirically derived targets, a firm “road map” (with the necessary flexibility to respond to changing circumstances) is established. This approach provides clarity of purpose, a higher standard of accountability for governments and clearer allocation of responsibilities among key agencies than an aspirational target approach. The link between agreed strategy and estimated outcome means that ongoing progress can be readily measured in a transparent manner, with the strategy and constituent interventions modified as and when necessary.
The best use of aspirational targets is in establishing a long term vision for achieving rates of deaths and serious injuries close to zero (illustrated in Box 1.1 and discussed in section 1.3) coupled to a twin track approach to make the vision operational: interim targets for quantified improvements over specific periods along the way, through interventions that are part of the road safety strategy; and research into more effective and new interventions to push the performance frontier.
Any evaluation of the association between target setting and road safety improvements ideally needs to distinguish between aspirational and empirically based targets. This distinction was not made in the evaluations cited in the preceding section of the report.

ROAD SAFETY TARGETS AND PERFORMANCE – 39
TOWARDS ZERO: AMBITIOUS ROAD SAFETY TARGETS AND THE SAFE SYSTEM APPROACH - ISBN 978-92-821-0195-7 © OECD/ITF, 2008
Box 1.1. Setting empirically derived targets for Western Australia’sRoad Safety Strategy 2008-2020, “Towards Zero”
The Western Australian government, through its Road Safety Council, is developing a new road safety strategy for 2008 to 2020, built around a Safe System framework (Western Australia Safety Council, 2008). The proposed strategy links a long term vision of zero deaths and serious injuries to quantitative targets for improvement in the medium term, stated as follows.
Towards Zero means that we do not accept that any human being should die or beseriously injured on our roads. Realistically we understand that it is not practicalto achieve zero serious injuries on our roads by the year 2020, but we do notaccept any death or serious injury as inevitable. This vision can be achieved if thecommunity as a whole makes a fundamental change in the way it thinks aboutroad safety and what it is prepared to accept.
Our Target by 2020: 11 000 fewer people killed or seriously injured. If theTowards Zero Strategy is fully implemented we could see up to 11,000 fewerpeople killed or seriously injured on Western Australian roads between 2008 and2020, a reduction of up to 40% on the average number of people killed andseriously injured each year between 2005 and 2007.
A key component has been to develop a model to test the projected benefits of a combination of best-practice countermeasures, used to generate a set of injury reduction targets. The process is not yet completed and will continue through 2008.
To identify the best mix of initiatives for Western Australia’s road safety strategy, the concept of a “Safe System Matrix” was created. The matrix addresses a relatively small number of major problems, using proven high impact interventions. This approach still permits other problems of lower priority to be addressed (for example additional bicycle paths, traffic calming, improved pedestrian separation and roadside lighting in remote areas) but at a level commensurate with the potential savings in serious trauma.
The model can also produce a number of additional output measures for each initiative and each strategy option. These include the estimated cost of implementation for each initiative (in present-day values) and the average cost per serious casualty saved, among other indicators.

40 – ROAD SAFETY TARGETS AND PERFORMANCE
TOWARDS ZERO: AMBITIOUS ROAD SAFETY TARGETS AND THE SAFE SYSTEM APPROACH - ISBN 978-92-821-0195-7 © OECD/ITF, 2008
Table 1.1. The Western Australia Safe System Matrix
Safe roads androadsides
Safe speeds Safe Vehicles Safe road use
All ofWesternAustralia
State-wide accident black spot programmes and Safer Roads Programme
Enhanced speed enforcement
Fine tuning of speed limits
Promotion of crash avoidance features
Promotion of advanced crashworthiness features
Development of aggregate behaviour change programmes
Perthmetropolitanarea
Intersection countermeasures
Run-off road countermeasures
Adjustment of speed limits to complement infrastructure measures
No specific countermeasures
Development of specific behaviour change measures
RegionalWA
Safe system transformation of strategically important routes radiating from Perth boundary
Rezone all limits downwards by 10 km/h
Specific promotions of ESC in 4 WDs
Promote ESC selection/ fitment to heavy vehicles
Development of specific behaviour change programmes for regional issues
Remote WA Safe system transformation of strategically important routes around remote centres
Rezone all limits downwards by 10 km/h
Specific promotions of ESC in 4WDs
Promote ESC selection/fitment to heavy vehicles
Development of specific behaviour change programmes or issues in remote areas.
Modelling
Future savings in serious casualties from 2008 to 2020 were forecast using a mathematical model (METS-WA), based on evidence-derived estimates of interventions’ effectiveness and actual crash data for Western Australia over recent years. The model produced two principal outputs:
1. The estimated total number of serious casualties saved over the life of the strategy (relative to the forecast numbers of serious casualties if there were no strategy). Different estimates can be prepared and compared to identify the most effective strategy from a range of competing options.
2. The percentage reduction in serious casualties in the final year of the strategy compared with the most recent year for which full serious casualty data were available. This provides a target for achievement by the end of the strategy (and can be adapted also to provide intermediate targets throughout the life of the strategy).
Figure 1.3 shows the relative performance of each of the groups of initiatives (as described in the WA Safe System Matrix) that were considered for inclusion in the strategy.

ROAD SAFETY TARGETS AND PERFORMANCE – 41
TOWARDS ZERO: AMBITIOUS ROAD SAFETY TARGETS AND THE SAFE SYSTEM APPROACH - ISBN 978-92-821-0195-7 © OECD/ITF, 2008
Figure 1.3. Performance of individual initiatives in isolation
These sets of initiatives were combined to create the Optimum Safe System Strategy Option. The strategy, if adopted fully, has the potential to reduce severe road trauma in Western Australia by up to 50% by 2020, compared to 2006 levels.
1.2.4. Setting targets at different levels to measure road safety achievements
Road safety targets can comprise a hierarchy, including targets for final outcomes, intermediate outcomes and institutional outputs (LTSA, 2000). Targets at the more detailed levels assist in either setting final targets or monitoring progress towards final targets.
• Final outcome targets represent the desired result of road safety policies and usually refer to the total annual number of road casualties (fatalities or injuries). These can include long term visions such as zero deaths and serious injuries and interim targets to be met over a specific time period, often 10 years.
• Intermediate outcome targets, often known as safety performance indicators, set goals for progress in implementing key elements of road safety strategies. They can include average traffic speeds, the level of drunk drivers using the network, seatbelt-wearing rates, helmet-wearing rates, the physical condition of the road network and the standard of the vehicle fleet (measured for example in terms of safety ratings). They may cover different crash categories (for example, to reduce run-off-rural-road crashes by a specified amount); cover specific geographic regions (for example, reducing urban travel speeds by five kilometres per hour); or different types of road user (for example, reducing dangerous loading infractions by heavy vehicles).
• Output targets represent physical deliverables required to produce intermediate and final outcomes. They can include, for example, the number of speed enforcement operations required to reduce average traffic speeds and the time spent by the police to control drink driving.

42 – ROAD SAFETY TARGETS AND PERFORMANCE
TOWARDS ZERO: AMBITIOUS ROAD SAFETY TARGETS AND THE SAFE SYSTEM APPROACH - ISBN 978-92-821-0195-7 © OECD/ITF, 2008
While final outcome targets are employed in most countries, intermediate outcome and output targets are not widely used. Final outcome data are generally systematically collected and monitored whereas intermediate outcome data and institutional output data are collected and monitored less often (ERSO, 2008). These data are, however, important to understanding crash risks across the network and to monitor the effectiveness of road safety actions. They are essential for designing appropriately tailored strategies, for efficiently deploying interventions across areas of higher risk and/or where the greatest potential improvements can be achieved, and for monitoring effectiveness (Wegman et al., 2006).
Box 1.2 describes the comprehensive set of targets developed in Norway. Figure 1.5 summarises the hierarchy of different target levels used by the New Zealand road safety authority. This particular hierarchy includes an ultimate level of measurement, the social costs of road crashes. Interlinked targets have been set for all levels of the hierarchy and these are described in Box 1.4.
Box 1.2. Setting targets at different levels in Norway
The Norwegian Public Roads Administration has an overall final target of reducing the number of killed or seriously injured road users by 50% by 2020, as part of its National Transport Plan 2010-2019. Intermediate targets have also been developed as both a basis for identifying road safety measures designed to achieve the final target and to indicate progress towards the final target. Figure 1.4 illustrates the system.
Figure 1.4. Norway’s system of road safety management by objectives
A total of 21 intermediate targets have been proposed, as listed in Table 1.2. The targets for improving the safety of roads have been formulated in terms of a targeted reduction of the number of road accident fatalities and seriously injured road users. All the other targets are stated in terms of the percentage of road users or vehicles fulfilling them.

ROAD SAFETY TARGETS AND PERFORMANCE – 43
TOWARDS ZERO: AMBITIOUS ROAD SAFETY TARGETS AND THE SAFE SYSTEM APPROACH - ISBN 978-92-821-0195-7 © OECD/ITF, 2008
Table 1.2. Norway’s quantified road safety targets for the year 2020.
Annual mean2003-2006
Projected for 2020 Target for 2020
Targets set for number of road users killed or seriously injured
Number of road users killed 250 285 125
Number of road users seriously injured 980 1 109 490
Targets set for road safety indicators State in 2007 Target for 2020
1. Share of traffic complying with speed limits 52.6 % 75 %
2. Seat belt wearing in built up areas 85.4% 95%
3. Seat belt wearing outside built up areas 92.3% 97%
4. Use of bicycle helmets among children below the age of 12 years 62.9% 90%
5. Use of bicycle helmets among older children and adults 31.8% 75%
6. Use of bicycle lights in the dark 64% 80%
7. Adult use of pedestrian reflective devices in the dark 17% 70%
8. Share of vehicle kilometres performed by drivers impaired by alcohol or drugs
0.5% 0.35 %
9. Share of vehicle kilometres performed by fatigued drivers (based on self-reports)
11% 8.25%
10. (A) Hours of driver training (B) Share of training during first half of training period
104 hours; 10%
250 hours; 40%
11. Share of vehicle kilometres performed by cars rated 4 or 5 stars in EuroNCAP
36% 90%
12. Share of vehicle kilometres performed by cars with electronic stability control
19% 95%
13. Share of vehicle kilometres performed by cars with autonomous cruise control
0% 20%
14. Share of vehicle kilometres performed by cars with enhanced neck injury protection
4% 75%
15. Share of vehicle kilometres performed by cars with e-Call (assuming it is made mandatory from 1.1.2009)
0% 75%
16. Share of heavy vehicles with no brake defects 72% 90%
17. Share of drivers of heavy vehicles complying with regulations concerning length of daily rest period (determined by checking tacographs)
89.7% 95%
18. Share of drivers of heavy vehicles complying with regulations concerning length of daily hours of service (determined by checking tacographs)
94.5% 97%
19. Safety standard of main road network 170 fewer killed or seriously injured
20. Safety standard of other national roads 140 fewer killed or seriously injured
21. Safety standard of regional and local roads 40 fewer killed or seriously injured

44 – ROAD SAFETY TARGETS AND PERFORMANCE
TOWARDS ZERO: AMBITIOUS ROAD SAFETY TARGETS AND THE SAFE SYSTEM APPROACH - ISBN 978-92-821-0195-7 © OECD/ITF, 2008
Norway’s approach to setting intermediate targets rather than solely using final outcome targets (fatalities and serious injuries) is instructive. The hierarchy of targets makes explicit the subsidiary safety factors which need to be achieved in progressing towards the final target. The link between subsidiary and final targets is also of value in identifying some major pitfalls. Because some of the target reductions were set without identifying the possible means of achievement, it has now become demonstrably necessary to either develop appropriate interventions or to reduce the final target of a 50% reduction in deaths and serious injuries.
Figure 1.5. Target hierarchy in New Zealand
− The overall target is to reduce the socio-economic costs of road crashes
− This is to be achieved by meeting the second level of targets, requiring specific reductions in the numbers of fatalities and serious injuries
− A third level of targets consists of performance indicators (including those related to speed, drink driving and rates of seat-belt wearing) that are consistent with the targeted reductions in final outcomes
− A fourth level of targeting is concerned with institutional delivery output such as the enforcement outputs that are required to achieve the third-level targets
Source: Land Transport Safety Authority.
1.2.5. International targets
In response to the number of road crashes and their social and economic consequences, Transport Ministers meeting in 2002 at the European Conference of Ministers of Transport (ECMT), now the International Transport Forum, unanimously adopted a common target for all member countries: to reduce the 2000 road fatality level by 50% by 2012. Similarly, the European Union agreed on a target of 50% reduction in the number of road fatalities by the year 2010, compared to 2001. Both targets were aspirational and were not based on either analysis of crash data or systematic assessment of the means to achieve the reduction. Table 1.3 shows member countries’ progress by 2006 towards the ECMT target of 50% reduction in fatalities by 2012.
To achieve the ECMT target, an average annual reduction in overall fatalities of 5.6% is required between 2000 and 2012. Table 1.3 shows that in 2006, nine European countries (Luxembourg, Portugal, France, Denmark, Switzerland, Netherlands, Germany, Latvia and Norway) were on track. Twenty-eight other countries were behind schedule, including seven countries (Azerbaijan, Georgia, Lithuania, Ukraine, Russia, Hungary and Bulgaria) where the situation has worsened since 2000. It is therefore likely that most countries will not meet the ECMT target, which could be considered both ambitious and unlikely to be achieved. Alternatively, the targets could be considered ambitious but achievable if countries provided stronger political and community support for the required interventions.

ROAD SAFETY TARGETS AND PERFORMANCE – 45
TOWARDS ZERO: AMBITIOUS ROAD SAFETY TARGETS AND THE SAFE SYSTEM APPROACH - ISBN 978-92-821-0195-7 © OECD/ITF, 2008
Table 1.3. Progress amongst ECMT member countries in achieving the ECMT targetof 50% reduction in fatalities 2000-2012
Country Fatalities in 2000 Fatalities in 2006Average of the annual
variation in fatalities since2000
Average annual reductionfrom 2006 onwards requiredto reach the -50% targets in
2012
Luxemburg 76 36 -11.7% Target reached
Portugal 1 860 969 -10.3% -0.7%France 8079 4 709 -8.6% -2.5%Denmark 498 306 -7.8% -3.4%Switzerland 592 370 -7.5% -3.7%
Netherlands 1 082 730 -6.3% -4.9%Germany 7 503 5 091 -6.3% -5.0%Latvia 588 407 -5.9% -5.3%Norway 341 242 -5.6% -5.7%
Spain 5 776 4 104 -5.5% -5.7%Czech Republic 1 486 1 063 -5.4% -5.8%Belgium 1 470 1 069 -5.2% -6.1%Austria 976 730 -4.7% -6.5%
Sweden 591 445 -4.6% -6.6%Greece 2037 1 657 -3.4% -7.8%Poland 6 294 5 243 -3.0% -8.2%Slovenia 313 263 -2.9% -8.3%
Finland 396 336 -2.7% -8.4%Italy 6 649 5 669 -2.6% -8.5%Serbia & Montenegro 1 048 900 -2.5% -8.6%FYR Macedonia 162 140 -2.4% -8.7%
Ireland 415 368 -2.0% -9.1%Bosnia 302 270 -1.8% -9.2%United Kingdom 3 580 3 298 -1.4% -9.7%Croatia 655 614 -1.1% -9.9%
Moldova 406 382 -1.0% -10.0%Slovak Republic 628 608 -0.5% -10.4%Estonia 204 201 -0.2% -10.7%Albania 280 277 -0.2% -10.8%
Romania 2 499 2478 -0.1% -10.8%Bulgaria 1 012 1043 0.5% -11.4%Hungary 1 200 1303 1.4% -12.1%Russia 29 594 32724 1.7% -12.4%
Ukraine 5 984 (in 2001) 6 867 (in 2005)2.8%
(between 2001 and 2006) -12.9% Lithuania 641 759 2.9% -13.4%
Georgia 500 581 in 2005 3.0% -11.3% from 2005Azerbaijan 596 1027 9.5% -18.6%Liechtenstein 3 2 in 2005
Figures too small for analysis Malta 15 11
Iceland 32 31
Total 89 481 7 9159 -2.0% -9.1%

46 – ROAD SAFETY TARGETS AND PERFORMANCE
TOWARDS ZERO: AMBITIOUS ROAD SAFETY TARGETS AND THE SAFE SYSTEM APPROACH - ISBN 978-92-821-0195-7 © OECD/ITF, 2008
Progress in reducing fatalities in non-European OECD countries since 2000 is summarised in Table 1.4 (note these countries are not subject to the ECMT target).
Table 1.4. Progress amongst OECD non-ECMT countries in reducing road fatalities
Country Fatalities in 2000 Fatalities in 2006Average of the annualvariation in fatalities
since 2000
Korea 10 236 6 327 -7.7%
Japan 10 403 7 272 -5.8%
New Zealand 462 391 -2.7%
Australia 1 817 1 598 -2.1%
Canada 2 927 2 892 -0.2%
United States 41 945 42 642 0.3%
1.2.5. National targets
Many countries have adopted national targets, often in addition to the ECMT and EU targets. While most of these targets relate to fatalities, a few jurisdictions have also set targets for injuries (including, Canada, Great Britain, Hungary, the Netherlands). In some countries, regional governments have developed different targets, depending upon their road safety situation. For example, as an attempt to “catch up” after falling behind most other Australian jurisdictions, Western Australia adopted a more ambitious target than the Australian national target. In some countries, the adoption of international targets (such as the ECMT or EU targets) has been an incentive to adopt targets also at national level.
As may be seen from Table 1.5, there are differences in both the ambition represented by the targets and in the approaches used to set the targets. Some countries have conducted in-depth quantitative analyses of their collision data and have set their targets by using statistical models to identify the expected improvements from different safety interventions. As an early conclusion, it appears that those countries that adopted analytically-based targets are generally performing well in meeting their targets, relative to those countries which set aspirational targets.
There are also differences in the measures used to define the target. Some countries have targets based on the percentage change in absolute numbers of fatalities and/or injuries, while others have targets based on change in fatality/injury rates using some measure of exposure such as population (e.g. Australia), or vehicle distance travelled, (e.g. United States). Finally, some targets are short-term (e.g. to be achieved in five years), whereas others are longer term (e.g. 10 years).
Considering some of the countries in more detail, Great Britain’s national target is a 40% reduction in fatalities and serious injuries by 2010 and a 50% reduction among children, relative to the average levels during 1994-1998. Using a ‘bottom-up’ approach, collision data were examined and the effectiveness of potential measures were estimated taking into consideration different traffic growth and policy implementation scenarios (OECD, 2002). A unique sub-target is that casualties are to be reduced to a greater extent in eighty-eight Neighbourhood Renewal areas in Great Britain. These disadvantaged neighbourhoods initially had a greater incidence of casualties resulting from motor vehicle collisions. Road safety policy has been successfully integrated with the government social policy priority of improving welfare in these areas. As of 2005, there was overall a 10% reduction in fatalities and a 33% reduction in fatalities and serious injuries combined.

ROAD SAFETY TARGETS AND PERFORMANCE – 47
TOWARDS ZERO: AMBITIOUS ROAD SAFETY TARGETS AND THE SAFE SYSTEM APPROACH - ISBN 978-92-821-0195-7 © OECD/ITF, 2008
Table 1.5. Countries with their own national target
Country National Target Progress to date Method of Setting Target
Australia -40% in fatals/100 000 population by 2010 compared to 1999
-17.4% as of 2007 Analytical assessment of a range of proven measures, using a multiplicative model
Austria -50% in fatal by 2010 compared to 1998-2000 -20% in injuries by 2010 compared to 1998-2000
-27% fatalities as of 2006
Detailed collision analysis plus political direction
Canada -30% in fatal/serious injuries by 2010 compared to 1996-2001+ 8 sub targets
See box 1.1 Based on comparison with OECD countries plus policy direction
Denmark -40% in fatalities by 2012 compared to 2005 (i.e. less than 200 fatalities) -40% injured persons by 2012 compared to 2005
+23% as of 2007 Based on benefit/cost analysis of possible countermeasures
Finland Less than 250 fatalities by 2010 Less than 100 fatalities by 2025
336 fatalities as of 2006
Based on analysis of likely effectiveness of potential countermeasures
France Less than 3 000 fatalities by 2012 (starting from 4 709 fatalities in 2006)
4620 as of 2007 Political decision + detailed data analysis
Great Britain -40 % in fatal/serious injuries by 2010 compared to 1994-98+ some sub targets
-33% killed and seriously injured as of 2006
Analytical assessment of a range of proven measures, using a multiplicative model
Greece -50 % in fatalities in 2010 compared to 2000 figures
-19% as of 2006 Evaluation of 1st Strategic Plan, Identification of potential of road safety authorities, European Union road safety target
Hungary - 30% in fatal/injuries by 2010 -50% in fatal/injuries by 2015 compared to 2001
No change as of 2007
Political decision
Ireland 6 fatalities / 100 000 population by the end of 2012, i.e. -38% in fatalities per population by 2012 compared to 2005
17% reduction as of 2007
Based on detailed collision analysis and the analysis of likely effectiveness of potential countermeasures
Japan - 40% in fatalities by 2012 compared to 2002 -31% as of 2007 Detailed collision analysis plus political direction
Korea -35% in fatalities by 2006 compared to 2002 -12% as of 2006 Unknown Malta -50% in fatalities by 2014 compared to 2004
-50% in injury accidents by 2014 compared to 2004
13 fatalities in 2004 12 fatalities in 2007
Unknown
Mexico -27% in fatalities by 2015 compared to 2002 Unknown Netherlands Less than 750 fatalities by 2010
Less than 580 fatalities by 2020 (-28% compared to 2004)
709 fatalities in 2007 (12%)
Targets were based on trend analysis, corrected for effects of planned policy measures
New Zealand -33% in fatalities by 2010 compared to 2004 + sub targets
-10% as of 2006 Analytical assessment of a range of proven measures, using a multiplicative model
Norway -30% killed and seriously injured by 2015 compared to 2004
-3% as of 2006 Target has not been officially endorsed.
Romania -20% by 2008 compared to 2002 +3% as of 2006 Unknown Spain -40% in fatalities by 2008 compared to 2003 -24% as of 2006 Political target Sweden -50% in fatalities by 2007 compared to 1996
New targets are under preparation 471 fatalities in 2007 (-20%). The target was not achieved
Political target
Switzerland -50% in both fatalities and serious injuries by 2010 compared to 2000
-38% as of 2006 Political target
Ukraine Proposed target: -35% in fatalities by 2011-2015
Unknown
United States -40% in fatalities per 100 million VMT by 2011 compared to 1996
-14% as of 2006 Targets were based on trend analysis corrected for effects of planned policy measures

48 – ROAD SAFETY TARGETS AND PERFORMANCE
TOWARDS ZERO: AMBITIOUS ROAD SAFETY TARGETS AND THE SAFE SYSTEM APPROACH - ISBN 978-92-821-0195-7 © OECD/ITF, 2008
Sweden had a target of a 50% reduction in fatalities between 1996 and 2007. In addition, there were a variety of sub-targets including: increasing the proportion of traffic volume on busy state roads protected from serious head-on and single vehicle accidents from 10% to 90%; reducing travel speed by 6 kph on the state road network (excluding roads that are protected from serious head-on and single vehicle accidents); increasing seatbelt use to 91%; reducing the proportion of drivers under the influence of alcohol involved in fatal accidents from 28% to 17%; and increasing from 17% to 50% the proportion of cars that have at least four stars in EuroNCAP crashworthiness ratings By 2007, there was only a 20% reduction in the number of fatalities which fell well short of the target set. Sweden is currently (in 2008) preparing a new strategy, which will set interim targets to 2020 on the pathway achieving its vision of eliminating deaths and serious injuries on its roads.
The United States has set road safety targets and sub-targets based on the fatality rate per mile travelled. The current goal of no more than 1 highway fatalities per 100 million miles travelled by 2011 is ambitious. To provide a stronger focus on the various subsets of crash victims that make up the main goal, the United States. has established new, more specific targets: 1) Reduce the rate of passenger vehicle occupant highway fatalities per passenger vehicle mile travelled; 2) Reduce the rate of motorcycle rider highway fatalities per 100 000 motorcycle registrations; 3) Reduce the rate of large-truck- and bus-related fatalities per vehicle mile travelled; and 4) Reduce the rate of non-occupant highway fatalities per vehicle mile travelled. Results as of 2006 indicate that the overall fatality rate per 100 million VMT has steadily declined from 1.64 in 1997 to 1.41 – a 14 percent decline.
Canada and New Zealand are two countries that have progressed substantially beyond setting overall targets to include a range of sub-targets, as shown in Boxes 1.3 and 1.4.

ROAD SAFETY TARGETS AND PERFORMANCE – 49
TOWARDS ZERO: AMBITIOUS ROAD SAFETY TARGETS AND THE SAFE SYSTEM APPROACH - ISBN 978-92-821-0195-7 © OECD/ITF, 2008
Box 1.3. Setting Targets in Canada2002-2006 Progress versus 1996-2001 Baseline Data
Road safety vision2010 Target
Decrease
2004-2006 progressversus 1996-2001
figure
National Target Fatalities Seriousinjuries
A 30% decrease in the average number of road users fatally or seriously injured during the 2008-2010 period (compared to 1996-2001).
-30% -3.7% -5.0%
Sub-Targets
A 40% decrease in the number of unbelted fatally or seriously injured occupants.
-40% -8.3% -13.2%
A 40% decrease in the percentage of road users fatally or seriously injured in crashes involving drinking drivers.*
-40% -6.4% -13.2%
A 40% decrease in the number of road users fatally or seriously injured on rural roadways.
-40% -7.5% -17.2%
A 30% decrease in the number of fatally or seriously injured vulnerable road users (pedestrians, motorcyclists and cyclists).
-30% 3.9% 13.2%
A 20% decrease in the number of young drivers/riders (those aged 16-19 years) killed or seriously injured in crashes.
-20% -4.2% -9.0%
A 20% decrease in the number of road users killed or seriously injured in speed-related crashes.
-20% 9.8% 13.0%
A 20% decrease in the number of road users killed or seriously injured in intersection-related crashes.
-20% -3.3% -9.6%
A 20% decrease in the number of road users killed or seriously injured in crashes involving commercial vehicles.
-20% -1.4% 7.4%
* Progress based on 2003-2005 average figures. Progress for all other targets based on 2004-2006 average figures.
Canada has a national target of a 30% reduction in fatalities and serious injuries by the 2008-2010 period, compared to the 1996-2001 baseline. These targets were set to enable Canada to have the safest roads in the world by 2010, assuming that comparison countries remained unchanged. Sub-targets were also set, based mainly on past achievements and on estimated feasible future achievements, rather than on detailed analyses of collision data. Based on the latest three years of the Road Safety Vision 2010 initiative (2004-2006), fatalities have dropped by almost 4% while serious injuries have declined by 5%. However, progress on the sub-targets has varied substantially. Several of Canada’s provinces (Alberta and Quebec) have also developed road safety plans that include targets for fatality and serious injury reductions based on the national targets. Some municipalities (e.g. Ottawa, Edmonton) have also rolled out their own road safety programs and police agencies such as the Royal Canadian Mounted Police and the Ontario Provincial Police are realigning their enforcement strategies with the RSV 2010 targets.

50 – ROAD SAFETY TARGETS AND PERFORMANCE
TOWARDS ZERO: AMBITIOUS ROAD SAFETY TARGETS AND THE SAFE SYSTEM APPROACH - ISBN 978-92-821-0195-7 © OECD/ITF, 2008
Box 1.4. SETTING TARGETS IN NEW ZEALAND:An example of sub-targets
New Zealand is one of the few countries that has developed targets at all the outcome levels discussed earlier in this chapter. In the first instance, it has set an overall target of a 33% reduction in fatalities by 2010, based on an in-depth analysis of their collision data and on an assessment of a range of proven safety measures (Breen, 2004). In addition, it has set a number of intermediate targets as shown below, as well as annual output targets for breath-testing in that country.
Intermediate outcome targets for speed,excess alcohol and restraint use in New Zealand
Base2001
Target2004
Speed not exceeding Open road mean speed (km/h) 100.2 99 Open road 85th percentile (km/h) 109 107 Urban mean speed (km/h) 55.2 55.2 Urban 85th percentile (km/h) 61.5 61
Alcohol Percent of driver deaths with excess alcohol 21% 21% Number of driver deaths with excess alcohol 55 48
Restraints At least Safety belts – front 92% 92% Safety belts – rear 70% 75% Children (under 15) restrained 89% 90%
Source: Road Safety to 2010, LTSA, 2002, Wellington
Annual output targets for breath-testing for excess alcohol in New Zealand
Output Target 2000-01 2001-02 2002-03 2003-04 2004-05
Hours to be delivered 508 785 505 920 543 025 574 140 616 715
Number of breath tests (country) to be conducted
1.4-1.6M 1.4-1.6M 1.5-1.7M 1.5-1.7M 1.5-1.7M
Number of breath tests (metropolitan) to be conducted
370-410K 370-410K 500-550K 500-550K 800-900K
Offence notices to be issued 26-30 000 23-26 000 23-26 000 23-26 000
While each country must choose its own basis for measurement, it is recommended that the overall number of fatalities (and serious injuries where these can be reliably measured) be the basis for assessing overall improvement in levels of road safety.

ROAD SAFETY TARGETS AND PERFORMANCE – 51
TOWARDS ZERO: AMBITIOUS ROAD SAFETY TARGETS AND THE SAFE SYSTEM APPROACH - ISBN 978-92-821-0195-7 © OECD/ITF, 2008
1.3. Level of ambition
1.3.1. The importance of ambitious long term targets
For the purposes of strategy formulation and planning, long term ambition may purposefully go beyond what can be achieved by current institutional capacity and by current technical performance. ‘Long term’ encompasses at least several decades, say 20 to 30 years, whereas target setting is usually restricted to the next ten or so years. A focus on long term ambition is not common, although this is changing in a small number of countries. In these countries, long term ambition is expressed as a vision with a final outcome target (e.g. Vision Zero in Sweden and Sustainable Safety in The Netherlands).
These new approaches to determining the vision and targets for improved road safety performance represent a radical shift in the road sector, whereas it is the norm for aviation, rail and maritime transport. In this regard the escalated level of ambition can be viewed as the road sector adopting safety performance standards of the same nature as those deemed appropriate and achievable in other modes of transport. The difficulties in making this shift are well recognized, especially given that the other transport modes are more amenable to full control. Notwithstanding this, there is a growing view that road deaths and injuries can no longer be accepted as an inevitable by-product of mobility and this must be reflected in long term safety targets.
Because of the safety achievements that have already resulted from the Swedish and Dutch visions, targets which were previously seen by many as radical and unachievable1 have become benchmarks for an acceptable road safety outcome. It is now politically difficult in a growing number of countries to endorse any significant level of projected deaths and serious injuries on the road network and there is a growing recognition that their elimination sets the appropriate level of ambition for road safety performance. Support for this level of ambition has been amplified by the acknowledgement in many countries that ‘vulnerable’ road users, especially pedestrians, must be viewed as the innocent victims of growing motor vehicle usage. This is especially the case in low and middle-income countries where, in the face of rapid motorization, vulnerable road users often represent the largest proportion of road trauma.
The perspective on ‘achievability’ has also shifted as a consequence of this new performance frontier. When the level of ambition encompasses the elimination of deaths and serious injuries, it may no longer be possible to specify the interventions required to achieve this final target. Hence the shift in perspective requires a strong commitment to innovation to achieve the desired results, rather than relying solely current and projected performance expectations. In this approach, the way forward ultimately remains uncertain, going beyond the limits of projected good practice. This shift in policy perspective implies combining aspirational and evidence based targets. The tools and accumulated practices used to build road safety policy are the same as those used in the past to prepare soundly targeted national plans. Empirically based targets are still set as milestones to be achieved on the path to the ultimate goal, but the interventions are increasingly shaped by the level of ambition.
Chapter 5 addresses the major policy shift required, characterised as the Safe System approach. The Safe System rationale is to ensure that road users are never subject to impact energy levels sufficient to cause fatal or serious, disabling injury. The application of this principle requires innovative thinking about the full range of possible interventions, including developing forgiving road infrastructure, improving vehicle safety and reducing traffic speed to better manage crash energy and reduce unacceptably high injury risk.

52 – ROAD SAFETY TARGETS AND PERFORMANCE
TOWARDS ZERO: AMBITIOUS ROAD SAFETY TARGETS AND THE SAFE SYSTEM APPROACH - ISBN 978-92-821-0195-7 © OECD/ITF, 2008
1.3.2. The importance of interim targets
Some of the elements of the Safe System approach with the largest potential to reduce trauma, particularly those addressing the design of new infrastructure, will take time to deliver results. If political, public and financial support for the strategy is to be maintained, it is essential that empirically based targets be set for the short term and progress made towards them.
The interim targets which follow should be derived from the estimated fatality and serious injury reduction outcomes to be achieved from rolling out the adopted strategy and actions, based on knowledge of their effectiveness. Targets will then not only be ambitious but robust.
While it is understood that ambitious targets are directed towards governments, lead agencies and other parts of the public sector engaged in improving road safety outcomes, targets can also be set by other stakeholders in helping to deliver the national road safety strategy. In Sweden, for example, several companies and organisations have set road safety targets in support of the national vision. In this regard, Volvo’s target is the most far reaching as it states that by 2020 no one will be killed or injured in a Volvo.
The selection of proven interventions to ensure immediate safety benefits is discussed in more detail in chapter 3.
1.4. Conclusions
OECD and ITF countries include a wide range of economies with large differences in their road safety performance. The best performing countries have fatality rates of around 5-7 killed per 100 000 population. Fatalities in these countries have generally decreased by more than 50% since the 1970s, over a period when motorisation increased substantially. However for some countries, particularly those with relatively low levels of road safety performance, the number of fatalities is increasing.
In all countries, significant numbers of lives can be saved by further concerted action. As some countries have achieved 60-70% reductions in road fatalities over a 35-year period, then arguably all countries with the will, the knowledge and the resources can make similar improvements.
Quantitative targets sharpen the focus on results and also on development of system-wide interventions and effective institutional management processes to achieve them. This puts targets at the core of an effective road safety management system. Some research suggests that countries with quantitative targets perform better than countries without targets.
Targets based on a comprehensive road safety vision communicate the importance of road safety, motivate stakeholders to act and hold managers of all components of the road transport system accountable for achieving defined positive results. Targets indicate that the government is committed to reducing the road toll and likely to support proposed policy and legislative changes and to allocate sufficient resources to safety programmes.
Aspirational targets for very large reductions in road trauma by specific dates have been adopted in many ITF member countries without links to specified interventions. This makes them very difficult to achieve. Targets based on expected outcomes from specified interventions should be preferred as a means to move more systematically towards a high level of ambition. This report recommends adopting a Safe System approach in developing and achieving ambitious targets, as described in chapter 5.

ROAD SAFETY TARGETS AND PERFORMANCE – 53
TOWARDS ZERO: AMBITIOUS ROAD SAFETY TARGETS AND THE SAFE SYSTEM APPROACH - ISBN 978-92-821-0195-7 © OECD/ITF, 2008
The only effective use of aspirational targets is in establishing a long term vision for achieving rates of deaths and serious injuries close to zero coupled to a twin track approach to make the vision operational: interim targets for quantified improvements over specific periods along the way, through interventions that are part of the road safety strategy; and research into more effective and new interventions to push the performance frontier.
Many ITF member countries have committed to the ECMT target of a 50% reduction in fatalities by 2012. Most of these countries are unlikely to achieve the target without substantial additional effort, directed in the poorer performing countries to implementing demonstrably effective traditional measures that can quickly deliver safety benefits (see chapter 3). However, the fact that some countries are on track to meet the target demonstrates that it can be achieved with adequate political will, institutional organisation, and sufficient allocation of resources.
Achievement of the ultimate goal of eliminating death and serious injury – a goal being sought by an increasing number of countries – will require continued application of good practice in targeting programs to reduce deaths and serious injuries in the interim, coupled with innovative solutions based on well-established safety principles. Good practice indicates that an effective focus on results involves the following steps: appraising current road safety performance through high-level strategic review and analysis; adopting a far-reaching road safety vision or goal for the longer term; analysing what could be achieved in the shorter term and proposing and agreeing related targets across the road safety partnership; and ensuring stakeholder accountability for results.
The successful implementation of interventions to meet ambitious targets will depend upon the effectiveness of the management arrangements in place to achieve the desired results (see chapter 4). These include: the effectiveness of the coordination framework; whether sustainable funding and resource allocation mechanisms are in place; the provision of necessary legislative support for the strategy; high-level promotion of the shared responsibility for achieving the targets set; the quality of the data sets required for the target-setting work and for subsequent monitoring and evaluation; and ready access to related research and development and consequent knowledge transfer (Bliss and Breen, 2008).
Meeting the interim road safety targets that countries have set for the shorter term will require the implementation of demonstrably effective measures that will quickly deliver safety benefits (see chapter 3). A hierarchy of targets is recommended, using lower-level targets for institutional outputs and intermediate outcomes, which will help to identify and implement interventions necessary to achieve final outcomes. Data on both intermediate outcomes and institutional outputs are needed to monitor progress towards achieving the desired road safety results.
NOTES
1. There is also a view in some quarters that targeting the elimination of death and serious injuries may be ethically indefensible. For example, Professor Richard Allsop argues that human activity includes a degree of risk taking and aiming at zero road deaths and injuries goes beyond what is acceptable in terms of the freedom to take and enjoy risks (Allsop 2003, 2005).

54 – ROAD SAFETY TARGETS AND PERFORMANCE
TOWARDS ZERO: AMBITIOUS ROAD SAFETY TARGETS AND THE SAFE SYSTEM APPROACH - ISBN 978-92-821-0195-7 © OECD/ITF, 2008
REFERENCES
Allsop, R.E. (2003), Risk assessment and target setting in EU transport programmes, European Transport Safety Council, Brussels.
Allsop (2005), Some traffic safety implications of movement of goods by road, in Transportmetrica.
Bliss T and J Breen (2008). Implementing the Recommendations of the World Report on Road TrafficInjury Prevention: Operational guidelines for the conduct of country road safety managementcapacity reviews and the related specification of lead agency reforms, investment strategies andsafety programs and projects, World Bank Global Road Safety Facility, Washington.
Breen, J. (2004), Review of the Road Safety to 2010 strategy, Final report to the National Road Safety Committee, New Zealand, Jeanne Breen Consulting.
Elvik, R. (1993), Quantified road safety targets: a useful tool for policy making. Accident Analysis and Prevention, 25, 569-583.
Elvik, R. (2001), Quantified road safety targets: An assessment of evaluation methodology, TOI Report 539/2001, Oslo, Institute of Transport Economics.
Elvik, R., An overview of target setting in Europe, in Best in Europe 2003: Targeted Road SafetyProgrammes in the EU, European Transportation Safety Council, 2003.
European Road Safety Observatory ERSO (2008), Quantified Road Safety Targets, http://www.erso.eu/knowledge/Content/knowledge.htm
Derriks, H. and P. Mak (2007), Underreporting of road traffic casualties, IRTAD Special report, OECD, Paris.
OECD (2002), Safety on the Road: What’s the Vision, OECD, Paris.
Wegman F., V. Eksler, S. Hayes, D. Lynam, P. Morsink and S. Oppe (2006), SUNflower+6 : acomparative study of the development of road safety in European countries, SWOV, Leidschendam.
Western Australian Road Safety Council (2008), Towards Zero: Getting there Together, Road Safety Council’s Recommendation to Government to Reduce Road Trauma in Western Australia 2008-2020, Perth August 2008.
Wong, S.C., N.N. Sze, H.F. Yip, P.Y. Becky Loo, W.T. Hung, H.K. Lo (2006), Association betweensetting quantified road safety targets and road fatality reduction. Accident Analysis and Prevention, 38, 997-1005.

DATA COLLECTION AND ANALYSIS – REQUIREMENTS AND OPPORTUNITIES – 55
TOWARDS ZERO: AMBITIOUS ROAD SAFETY TARGETS AND THE SAFE SYSTEM APPROACH - ISBN 978-92-821-0195-7 © OECD/ITF, 2008
2. DATA COLLECTION AND ANALYSIS – REQUIREMENTS AND OPPORTUNITIES
ABSTRACT
This chapter examines the need for comprehensive crash and road safety performance data collection and analysis.
To illustrate the importance of detailed data analysis, a case study reviews casualty crash trends in three countries, demonstrating that certain crash types have not proven amenable to the interventions introduced. The chapter also highlights the value of crash risk analysis across a road network and the need to improve the reliability and quality of the data.
2.1. Understanding risks and performance – What data should be collected?
Comprehensive data collection and analysis are essential for designing effective safety strategies, for setting achievable targets, for developing and determining intervention priorities and for monitoring programme effectiveness. It is essential to developing empirically-based targets. This data needs to include crash statistics but should extend to other factors, including:
• Demographic data.
• Traffic volume data (by traffic mode).
• Safety performance indicators (SPI’s) such as rates of seat belt and helmet use, speeding and red light running.
• Infrastructure factors (road length by crash risk, mean travel speed, etc.).
Crash data collection and analysis at an aggregate level and through detailed studies is critical to risk identification, intervention selection, measuring final outcomes and assessing the effectiveness of interventions.
A thorough understanding of crash and other road safety related data (and trends) is the foundation for developing an understanding of risk on the network and for Safe System development. In many countries this range of performance indicator data is not collected. SPI data can be readily collected within a relatively short timeframe given the knowledge and will to do it, and providing that adequate resources are made available.
As Chapter 5 will outline, those countries that have already moved, or are currently moving, to a safe system approach monitor an increasing range of indicators that are pivotal to achieving safe travel. This includes the proportion of drivers traveling at safe speeds (for the relevant road and traffic environment as measured against speed limits), the occurrence of certain crash types and the severe crash outcomes in relation to road infrastructure characteristics (such as the extent of median barriers on 2 lane, 2-way higher speed roads to prevent fatal head on crashes), the levels of compliance with seat belt and helmet wearing requirements and blood alcohol limits by drivers and riders and the presence of specific safety features and levels of crashworthiness in the vehicle fleet.

56 – DATA COLLECTION AND ANALYSIS – REQUIREMENTS AND OPPORTUNITIES
TOWARDS ZERO: AMBITIOUS ROAD SAFETY TARGETS AND THE SAFE SYSTEM APPROACH - ISBN 978-92-821-0195-7 © OECD/ITF, 2008
SAFETY PERFORMANCE INDICATORS
Safety performance indicators are seen as any measurement that is causally related to crashes or injuries and is used in addition to the figures of accidents or injuries, in order to indicate safety performance or understand the process that leads to accidents (ETSC, 2001).
They also provide the link between the casualties from road accidents and the measures to reduce them. (Wegman in ETSC, 2006).
Safety performance indicators help illustrate how well road safety programmes are doing in meeting their objectives or achieving the desired outcomes. They are a means of monitoring, assessing and evaluating the processes and operations of road safety systems. They use qualitative and quantitative information to help to determine a programme's success in achieving its objectives. They can be used to track progress and can provide a basis to evaluate and improve performance.
Source: Vis, M.A. and A.L. Van Gent, (2007).
There are many ways in which underlying crash data analysis can be useful in exposing underlying trends and emerging problems. To illustrate the important opportunities to improve safety that good data analyses can provide, the following section presents a case study on crash data analysis.
2.2. The limitations of crash data analysis at aggregate level
The case study considers analysis of crash types over time for three countries and illustrates that countries which have achieved a strong decrease in overall road trauma in the recent past cannot rely only on a continuation of those decreasing aggregate trends into the future. It indicates that overall crash trends are made up of more complex components, with many crash types not decreasing, and some even increasing. The reasons for these negative sub trends, or emerging problems, are often not yet understood.
2.2.1. Analysing trends in different crash types
Trends in fatalities for different road crash categories have been analysed in three countries; Canada, New Zealand and the Netherlands. While this approach – developed by SWOV (2007) in the Netherlands – does not identify conclusive causal relationships, it is valuable in highlighting crash categories where crash trends are increasing and are running counter to overall improvement. In informing practitioners and researchers of crash types which are not reducing at the same rate as others, the analysis also challenges them to examine reasons for the differential effectiveness of past measures. It is a reminder of the complex mix of a large range of factors that determines safety levels on road networks. Continuing a mix of traditional measures into the future may not in fact prove to be effective in reducing trauma further.
A fresh approach is necessary in these circumstances to further progress road trauma reductions if ambitious road safety targets are to be set and delivered. Simple forward projections of past rates of reduction in fatal and serious injuries to derive future targets would fail to acknowledge the underlying complexity of performance to date.
The case study information below summarises the findings for The Netherlands, Canada and New Zealand. The reader will find in Annex B, detailed data analyses for the three countries.

DATA COLLECTION AND ANALYSIS – REQUIREMENTS AND OPPORTUNITIES – 57
TOWARDS ZERO: AMBITIOUS ROAD SAFETY TARGETS AND THE SAFE SYSTEM APPROACH - ISBN 978-92-821-0195-7 © OECD/ITF, 2008
2.2.2. Case Study – The Netherlands
In conducting the analyses for separate crash categories to identify different crash trends the number of categories must be balanced: too many categories lead to too few data per category for meaningful analysis, whereas too few categories will not give sufficiently specific findings. In the following series of analyses, road fatality data have been disaggregated according to both the traffic mode of the victim and that of any second party involved in the crash. (Crashes entailing three or more units are rare and were not considered.). A crash has been defined as either a collision involving a single unit and an object (for example, a bicyclist hitting a tree), or a collision between two units (e.g., a car and a truck).
DATA ANALYSES – AN EXPLANATION
The time-series of the number of fatalities for all crash types has usually been based on at least 20 years of data. It is important to have a lengthy data set so that trends can be separated from random fluctuations. Also, it becomes easier to recognise corresponding fluctuations in external influencing factors (such as distance travelled, fleet size or vehicle sales).
The first step in this analysis was to generate a collection of time-series graphs, based on fatality data per crash type for each of the three targeted countries.
The second step was to analyse the different crash types and to seek explanations for the data patterns. Possible explanatory factors include:
1. Changes of definitions or registration practices, whereby particularly the definition of a fatality or traffic mode may have changed over time.
2. Changes in the traffic system leading to changes in exposure, including the use of different traffic modes.
3. Changes in fatality risk, often due to a combination of different underlying risk factors.
It is important to distinguish between changes in exposure and changes in crash risk. For example, more people using public transport instead of using a private car is likely to see a decrease in car-related fatalities. However this improvement is not due to any improvement in risk factors relating to car travel but to reduced exposure occasioned by a shift to another traffic mode.
The difference between quickly decreasing and slowly decreasing crash types is also important, especially when projections are being made and safety targets being set. In the following demonstration analyses, the crash types have been divided into two groups: quickly decreasing and slowly decreasing crash types.
Figure 2.1 shows fatality levels over the 30-year period 1976-2005 for the most important crash types for The Netherlands.
There has been a strong and consistent decline in the total annual numbers of fatalities over the past 30 years in The Netherlands – in round terms, falling from approximately 2 500 in 1976 to under 1 000 since 2004. Looking at the marginal sums (bottom row and right column) of crash types, this decline has to varying extents been shared by most of the major crash types and road user groups (the exceptions being all crashes involving slow mopeds and all crashes involving vans). However, once the different

58 – DATA COLLECTION AND ANALYSIS – REQUIREMENTS AND OPPORTUNITIES
TOWARDS ZERO: AMBITIOUS ROAD SAFETY TARGETS AND THE SAFE SYSTEM APPROACH - ISBN 978-92-821-0195-7 © OECD/ITF, 2008
crash types are considered in greater detail, the extent of success in reducing fatalities varies substantially, with some specific crash types either showing no decrease or an increase.
The detailed analysis of each type of collision (see full details in Annex B) made it possible to obtain new insights into road safety in the Netherlands. Changes in the incidence of fatalities from different crash types showed that the most important crash type (single-car collisions) showed the smallest yearly decrease, so there is a need to give special attention to this type of collision. Changes in motorcycle and van-related fatalities were broadly commensurate with changes in the use of motorcycles. Some of these variations are explored in more detail in Annex B.
Figure 2.1. Time series of traffic fatalities in relevant crash typesNetherlands, 1976-2005
Note : Traffic mode of fatality in rows, the colours indicate the proportion of all fatalities represented in that graph (i.e. the darker charts represent the most frequent crash types).
Source: SWOV.
Analysis of quickly decreasing crash types
Quickly decreasing trends were observed for the four crash types that made the largest contribution to the overall number of fatalities:
• The number of killed pedestrians decreased by 6.7% yearly.

DATA COLLECTION AND ANALYSIS – REQUIREMENTS AND OPPORTUNITIES – 59
TOWARDS ZERO: AMBITIOUS ROAD SAFETY TARGETS AND THE SAFE SYSTEM APPROACH - ISBN 978-92-821-0195-7 © OECD/ITF, 2008
• The number of killed cyclists decreased by 5.4% yearly.
• The number of killed car occupants in a car-car crash decreased by 5.0% yearly.
• The number of killed car occupants in a single-unit traffic crash decreased by 2.2% yearly.
Figure 2.2 shows the number of fatalities for these four crash types between 1976 and 2005. (A logarithmic vertical scale was used, which results in straight lines for data with a constant yearly decrease.)
In Figure 2.2, fatal single-unit car collisions clearly outnumber the other three crash types. The predominance of fatalities from single-unit car collisions increased over the years, with the yearly decrease of fatalities from this crash type being 2.2%, compared to a 5- 6% yearly decrease for the other three crash types.
Figure 2.2. Decreasing rates for fatalities in four important crash typesthe Netherlands
car singlecar-car
bicycle-carpedestrian-car
pedestrian car: -6,47%
bicycle car: -5,21%
car single vehicle: -2,21%
car car: -4,84%
10
100
1000
1975 1980 1985 1990 1995 2000 2005year of accident
num
ber
of fa
talit
ies
singleCarBicyclePedestrian
Source: SWOV.
Any possible change in car mobility should affect each car-related crash type in approximately the same way. Given this reasoning, there must be other explanations for the differences between the decreasing rates of these four crash types. In an attempt to identify other causes, the following questions were asked:
• Why did fatalities in car-car crashes decrease much faster than fatalities in single-car crashes?
• What caused the strong decrease in the number of pedestrians and cyclists killed by cars?

60 – DATA COLLECTION AND ANALYSIS – REQUIREMENTS AND OPPORTUNITIES
TOWARDS ZERO: AMBITIOUS ROAD SAFETY TARGETS AND THE SAFE SYSTEM APPROACH - ISBN 978-92-821-0195-7 © OECD/ITF, 2008
Single-car and car-car collisions
It may be assumed that the decrease in the number of single-vehicle fatalities is attributable at least in part to improvements in driver capabilities, speed limit enforcement and vehicle safety (seatbelts, etc.). However these developments were also likely to have contributed to the decrease in fatalities arising from the other three crash types which also involved cars. Therefore the latter crash types must have benefited from additional developments. It may be that for car-car crashes, road infrastructure improvements (for example, the increased number of level road junctions with traffic lights, roundabouts, median barriers separating opposing lanes) specifically improved the survival probabilities for car-car crashes. These measures may have been supplemented by other measures (for example, energy-absorbing zones in vehicles), to explain the greater yearly decrease in the number of car-car fatalities.
Pedestrian-car collisions
The number of pedestrians did not decrease between 1970 and 2005 in the Netherlands. Although there was a change in demographics (30% fewer children in the seventies), the fall in deaths was equally strong over the entire age range. However, there was an increase in the number of large shopping areas and malls and (since 1995) in the number of low speed residential areas. These and other improvements may have led to yearly decrease of 6.47% in pedestrian-car deaths.
Bicycle-car collisions
The number of bicycles in the Netherlands has increased from around 500 000 sold yearly in 1960, to 850 000 in 1970 and to 1.2 million in 2003. Thus the decrease in bicycle-car fatalities is unlikely to be due to any decrease in cycling. A more likely explanation is to be found in the increasing provision of specific bicycle infrastructure – including the separation of cyclists from faster and heavier cars and trucks, as part of sustainable safe road design.
If the trends shown by these four crash types continue for another 10 years, the number of single-unit car fatalities will further outnumber fatalities from the other three crash types involving cars. It is therefore important to aim new traffic safety policies especially at single-vehicle crashes.
2.2.3. Case Study – Canada
Figure 2.3 shows changes in the numbers of fatalities over the period 1984-2003 for each major crash type for Canada.
The figure shows that while some crash types decreased during the period, others remained relatively constant. For example, crashes involving heavy vehicles (vans or trucks) were largely unchanged, while single vehicle crashes showed hardly any decrease after 1995. The greatest improvements were for crashes involving passenger cars (pedestrian-car, bicycle-car, car-car), with motorcyclist fatalities also falling for much of the period.
The six crash types that contributed most to the total number of fatalities in Canada were single vehicle car, car-car and pedestrian-car crashes (all decreasing) and car-LTV, car-truck and single vehicle LTV crashes (all decreasing, but to a lesser extent).
The in-depth analysis indicated that in Canada the crashes between pedestrians and cars showed the strongest decrease (see Annex B for details). Mostly, children have benefited from this development. The need for further research to identify means to improve pedestrian safety in general was recognised.

DATA COLLECTION AND ANALYSIS – REQUIREMENTS AND OPPORTUNITIES – 61
TOWARDS ZERO: AMBITIOUS ROAD SAFETY TARGETS AND THE SAFE SYSTEM APPROACH - ISBN 978-92-821-0195-7 © OECD/ITF, 2008
Another important contribution to the improvement of safety came during a period where there was a decrease in motorcycle use, accompanied by a reduction in associated fatalities. However the recent renewed popularity of motorcycles has been associated with an increase in fatalities.
The in-depth analysis indicated that in Canada the crashes between pedestrians and cars showed the strongest decrease (see Annex B for details). Mostly, children have benefited from this development. The need for further research to identify means to improve pedestrian safety in general, was recognised. Another important contribution to the improvement of safety came during a period where there was a decrease in motorcycle use, accompanied by a reduction in associated fatalities. However the recent renewed popularity of motorcycles has been associated with an increase in fatalities.
Figure 2.3. Time series of traffic fatalities in relevant crash typesCanada, 1984-2003
Note : Traffic mode of fatality in rows, the colours indicate the proportion of all fatalities represented in that graph, the darker charts represent the most frequent crash types).
Source: SWOV.

62 – DATA COLLECTION AND ANALYSIS – REQUIREMENTS AND OPPORTUNITIES
TOWARDS ZERO: AMBITIOUS ROAD SAFETY TARGETS AND THE SAFE SYSTEM APPROACH - ISBN 978-92-821-0195-7 © OECD/ITF, 2008
2.2.4. Case Study – New Zealand
Figure 2.4 shows changes in the number of fatalities over the period 1984-2004 for each major crash type for New Zealand. It shows that the largest decreases in crash types were for pedestrian-car, bicycle-car, car-car and car-single vehicle crashes, with fatalities involving motorcycles also having decreased since 1990. All other crashes were more or less constant over the time period – including car-truck crashes which accounted for a large number of fatalities.
Figure 2.4. Time series of traffic fatalities in relevant crash typesNew Zealand 1980-2004
Note: Traffic mode of fatality in rows; the colours indicate the proportion of all fatalities represented in that graph.
Source: SWOV.
The in-depth analyses showed that in New Zealand, the strong decrease in the number of fatalities appears to be in part the result of the strong decrease in the use of motorcycles, as reflected in registration data. Since 1987, New Zealand has been importing large numbers of second hand Japanese cars that appear to be replacing the motorcycle as the preferred transport mode. The decrease in the yearly number of fatalities among motorcyclists alone is almost -10%, which is a substantial contribution to the total yearly decrease of -3.6%. The remaining number of fatalities decreased with -2.9% yearly, which is likely to be the remaining decrease once the number of motorcycles becomes stable.

DATA COLLECTION AND ANALYSIS – REQUIREMENTS AND OPPORTUNITIES – 63
TOWARDS ZERO: AMBITIOUS ROAD SAFETY TARGETS AND THE SAFE SYSTEM APPROACH - ISBN 978-92-821-0195-7 © OECD/ITF, 2008
2.2.5. Lessons learnt from the analysis
Detailed analysis of fatality trends in selected countries has shown that different crash types have their own time-dependent behaviour. Although there has often been an overall decrease in fatalities over time, both the magnitude of the decrease and contribution to the total fatality level have differed.
The difference between slowly decreasing and quickly decreasing crash types is significant when setting targets. As an example, the yearly decrease of single-car collisions was much lower than that of car-car crashes in all three countries. When crash types associated with many fatalities show only little improvement, it is necessary to understand the obstacles to achieving further reductions and to then identify and implement means to counter these obstacles. To be achievable, target reductions need to take these considerations into account.
Understanding the causes of quickly decreasing crash types is also important. The Canadian data indicated that the strong improvement of pedestrian safety was largely due to improving the safety of children, and less so to improving the safety of pedestrians in general. While the analyses in this report did not give a conclusive explanation, the reduction may have been due to changes in infrastructure around schools and in means of transporting children. If so, this might indicate that any further improvement of pedestrian safety will require a shift in attention to older pedestrians.
The trend differences across separate crash categories also have implications for forecasting future road safety performance. A projection is likely to give a better estimate of the future number of fatalities if based on the sum of the different trends for individual category types.
Many of the past achievements in safety were due to safety measures (reduced drink driving, improved safety belt wearing rates, infrastructure improvements) and others stem from the shift from more dangerous traffic modes to safer traffic modes. As the analysis shows, in both cases the improvements in the past do not guarantee improvements in the future. Some crash types have not proven amenable to the interventions introduced, and new safety measures may be needed. The safe system approach offers such improvements, as intrinsically every aspect of safety is at stake.
2.3. Analysing levels of crash risk across a road network
It is contended that a much greater understanding of the presence of risk across the network – and the reasons for it – need to be analysed and understood, rather than a total reliance upon crash analysis. Risk assessment – and the development of understanding of underlying risk factors and subsequent system wide responses which will reduce crash and crash outcome severity risk – is a more proactive approach compared with the more reactive approach inherent in traditional and extensive reliance upon crash analysis.
Determining road safety performance by measurement of many road safety performance indicators across a country’s’ network is an important element of a comprehensive risk assessment and monitoring approach. It provides a clear indication of areas of opportunity for intervention development.
Utilising data in detail in order to derive more specific risk assessments for road lengths on a system wide basis provides a powerful framework for developing proactive road safety programmes based upon further detailed examination of these lengths of higher crash risk. An example is the iRAP strategy (see Box 2.1) which analyses data across a jurisdiction’s road network to determine relative levels of crash risk on lengths of the network.

64 – DATA COLLECTION AND ANALYSIS – REQUIREMENTS AND OPPORTUNITIES
TOWARDS ZERO: AMBITIOUS ROAD SAFETY TARGETS AND THE SAFE SYSTEM APPROACH - ISBN 978-92-821-0195-7 © OECD/ITF, 2008
A competent road authority will seek to obtain a more detailed understanding of linkages between crash rates and road protection scores derived from iRAP – to identify behavioural, traffic mix, road infrastructure and speed limit contributions to elevated crash risk levels on sections of the network. But iRAP is an important (and increasingly powerful) tool to commence the risk identification and treatment assessment process.
Box 2.1. The International Road Assessment Programme – iRAP
iRAP (International Road Assessment Program) began in 2000 with the European Road Assessment Programme (EuroRAP), which introduced international protocols to measure the safety of roads regardless of national engineering standards. By 2005, road assessment programmes had been introduced into 20 European countries, Australia (AusRAP) and the United States (usRAP). iRAP was then formed to manage consistency in the now global programme and to develop techniques for developing countries where crash data may not exist. Today iRAP is being rolled out on every continent with the support of road authorities, road user groups and vehicle manufacturers.
iRAP has the following formal objectives:
• To establish a programme of systematic risk assessment and benchmarking to help reduce deaths and serious injuries on roads.
• To identify major shortcomings on roads which are amenable to practical remedy on a large scale.
• To make injury risk assessments a priority for road infrastructure improvements and for route management standards.
• To establish partnerships among those responsible for a safe road system.
iRAP uses three protocols for risk assessment:
• Risk rate maps: simple colour coded maps show the varying levels of risk of fatal and serious injury crashes along segments of the road network.
• Performance tracking: segments of network are tracked over time to identify which have or have not improved their safety performance and to identify what counter-measures have been effective.
• Road protection score: based on ‘drive-through’ inspections, road segments receive one to five stars based on their capacity to prevent and protect from death or serious injury.
In developing countries, iRAP not only identifies the high risk roads but also introduces new tools to enable large scale programmes of affordable engineering counter-measures, particularly for vulnerable road users. These Network Safety Upgrading Programmes suggested by iRAP are designed to give high returns in terms of lives saved and economic return. These new iRAP tools may also have wide application in developed countries where economic returns well in excess of 50% per annum are still commonly available.
iRAP is a major step away from the traditional 'fix the driver' approach. It recognises that most crashes result from normal people making often minor errors. Its central precept is to provide a road environment that makes human beings less likely to be involved in serious crashes and that provides protection when crashes do occur.

DATA COLLECTION AND ANALYSIS – REQUIREMENTS AND OPPORTUNITIES – 65
TOWARDS ZERO: AMBITIOUS ROAD SAFETY TARGETS AND THE SAFE SYSTEM APPROACH - ISBN 978-92-821-0195-7 © OECD/ITF, 2008
2.4. Why data is important and how it can be improved
Comprehensive crash and road safety system performance data collection and analysis are critical requirements for:
• Understanding trends in types of crash rates and crash risks across the network.
• Development of effective strategies and supporting interventions.
• Designing effective strategies and supporting interventions.
• Efficiently deploying these interventions across areas of higher risk and/or where the greatest potential improvements can be achieved.
• Monitoring effectiveness of programmes.
• Enabling road safety to be highlighted as a priority for action and developing robust arguments for the adoption of interventions.
To understand the magnitude and the nature of the road safety situation and to set realistic results-based targets, it is essential to conduct and utilise detailed analyses of the available data. These data need to include collision data but should extend to other measures, including: demographic data, traffic volume data (by traffic mode), Safety Performance Indicators (SPI's) such as seat belt and helmet use, speeding and red light running, and infrastructure factors (road length by crash risk , mean travel speed, etc.). A thorough understanding of crash and other road safety related data (and trends) is the foundation for developing an understanding of risk on the network and for Safe System development.
In many countries this range of performance indicator data are not collected. In that case, it should be an early priority for road safety agencies to establish data collection protocols and procedures to gather this information to guide road safety strategy development. These SPI data could be readily collected within a relatively short timeframe if there is knowledge and will to do so.
It is also likely that output data, such as hours each week for which random breath testing is conducted, or speed camera hours of operation over a day or week, are often not readily available.
In most countries, crash data and statistics come from the police, based either on police reports made on the scene of the crashes or on information sent to the police (in the case of damage only crashes).
While police data constitute a reliable source of information, some shortfalls in the reporting process have been demonstrated and the underreporting rate can in some cases be quite important. While in good practice countries, fatal crashes are usually well reported, injury crashes can be largely underestimated (Derriks et al, 2007). In The Netherlands, for instance, it has been found that up to 6% of fatalities, up to 40% of in-patients, and up to 86 % of minor injuries were not reported by the police. This shortfall in reporting has been found by comparing hospital data and police data.
Linking the police data with hospital data constitute a valuable approach for improving the overall quality of the data and thus better understand the road safety problem of a country. This approach has been adopted in several countries, with the situation in the Netherlands shown in the following box.

66 – DATA COLLECTION AND ANALYSIS – REQUIREMENTS AND OPPORTUNITIES
TOWARDS ZERO: AMBITIOUS ROAD SAFETY TARGETS AND THE SAFE SYSTEM APPROACH - ISBN 978-92-821-0195-7 © OECD/ITF, 2008
Linking police and hospital injury information in the Netherlands
In the Netherlands, when a collision involving an injured patient is registered by the police, it is determined by police whether the injured person is admitted to hospital for at least 24 hours, or otherwise treated in the emergency room and then discharged. Based on police registrations, the number of hospitalised (admitted) victims is about ten times the number of fatalities. However the National Patient Register (NPR) database, using hospital records, shows that the number of traffic victims admitted to hospital is about twice the number registered by the police. The difference is apparently caused by the distinction between crashes involving motorised vehicles and all other road crashes, with police registering only the former. Half of all in-patients registered in the NPR are cyclists, the large majority of whom were in crashes where only bicycles were involved.
The trends in the number of fatalities, police registered in-patients and NPR-registered in-patients are shown in Figure 2.5.
Figure 2.5. Number of in-patients according to the National Patient Registrationand police accident records in The Netherlands, compared to fatalities
1976-2005
Note: Solid lines are exponential regressions with the mean yearly change.
Where possible, NPR records are linked to police records to enable analysis of crash factors recorded only by the police (road type, type of crash, other vehicles involved, time of day, etc). However, many in-patients (especially cyclists) are not linked because they have not been recorded by police (95% missing). However for many other conflict types, and especially those with cars or trucks involved, there is little under-reporting (approximately 90% of NPR cases are also recorded by police). For crashes involving mopeds and motorcycles, the proportion of missed cases is somewhat larger (around 20-30%). Because the levels of under-reporting may have decreased in recent decades, interpretation of the time series has to be conducted with care.

DATA COLLECTION AND ANALYSIS – REQUIREMENTS AND OPPORTUNITIES – 67
TOWARDS ZERO: AMBITIOUS ROAD SAFETY TARGETS AND THE SAFE SYSTEM APPROACH - ISBN 978-92-821-0195-7 © OECD/ITF, 2008
As an additional consideration, the number of patients without injuries or only minor injuries, who have nevertheless stayed in hospital overnight, is increasing over the period. This is illustrated in Figure 2.6, which shows the development of the numbers of in-patients for each category of injury severity, based on the Maximum Abbreviated Injury Scale (MAIS).
Figure 2.6. Number of in-patients according to theNational Patient Registration, for different injury severities
1984-2005
Hospitals are increasingly holding patients with low MAIS (MAIS=0 or MAIS=1), perhaps for observation as a precaution, perhaps because of hospitals’ concerns about liability, perhaps because of possible hidden injuries or because of alcohol intoxication. The remaining number of moderate (MAIS=2) to serious (MAIS ≥ 3) injuries is decreasing more or less in proportion to the decreasing number of fatalities. This suggests that hospital admission counts (the criterion being "at least 24 hours in hospital") are increasingly including people without serious injuries.
2.5. Conclusions
Comprehensive crash and road safety system performance data collection and analysis are critical requirements for an effective road safety programme. It is essential for designing effective strategies, for efficiently deploying these interventions across areas of higher risk and/or where the greatest potential improvements can be achieved, and for monitoring effectiveness.
In-depth analysis, such as those presented here, illustrates that countries which have achieved a strong decrease in road trauma in the recent past may not automatically rely on a continuation of those decreasing trends into the future. Simple forward projections of past rates of reduction in fatal and serious injuries to derive future targets would fail to acknowledge the underlying complexity of

68 – DATA COLLECTION AND ANALYSIS – REQUIREMENTS AND OPPORTUNITIES
TOWARDS ZERO: AMBITIOUS ROAD SAFETY TARGETS AND THE SAFE SYSTEM APPROACH - ISBN 978-92-821-0195-7 © OECD/ITF, 2008
performance to date and – as seems likely – into the future. The range of interventions which have successfully addressed some crash types to date in many countries suffer from limitations to the extent of their effectiveness. In addition, trends in other crash types have, for a range of known and unknown reasons, proven immune to improvement in trauma outcomes from use of available measures. A fresh approach is necessary to further progress road trauma reductions if ambitious road safety targets are to be set and delivered.
Determining road safety performance by measurement of road safety performance indicators across the network is an important element of a comprehensive risk assessment and monitoring approach.
Mean free speeds (by vehicle category or by geographic area – urban and rural), vehicle safety ratings on the network, infrastructure safety ratings, blood alcohol level compliance, seat belt and helmet wearing rates are all examples of safety performance indicators (intermediate outcomes) which, through measurement, will clearly indicate current road trauma trends and opportunities for intervention.
System wide assessments of crash rates on road links across the network (on an absolute or per distance travelled basis) are useful analyses. Subsequent risk models can be used (e.g., for run-off-road or head-on crash risk) to predict the highest risk lengths warranting treatment. These risk based approaches and tools are enabling – and will increasingly drive – a much more innovative and proactive system focussed approach (a safe system approach) to road safety strategies and programmes. Tools such as iRAP are providing increasing support to road authorities in this area.
Reliability and quality of data is a key issue, when developing road safety interventions. Even in good practice countries, much can be done to improve the quality and reliability of data and to reduce the rate of underreporting. There is scope for further efforts to be made in most countries to link police collision reports to hospital data records to improve data quality and consistency, especially regarding serious injury crashes. Data quality and effective analysis is fundamental to building risk awareness and intervention effectiveness.

DATA COLLECTION AND ANALYSIS – REQUIREMENTS AND OPPORTUNITIES – 69
TOWARDS ZERO: AMBITIOUS ROAD SAFETY TARGETS AND THE SAFE SYSTEM APPROACH - ISBN 978-92-821-0195-7 © OECD/ITF, 2008
REFERENCES
Derriks, H. and P. Mak (2007), Underreporting of road traffic casualties, IRTAD Special report. OECD, Paris. http://www.cemt.org/irtad/IRTADPublic/irtadpub.htm.
ETSC (2001), Safety performance indicators, ETSC Brussels, Belgium
ETSC (2006), Road Safety Performance Index (PIN), Flash 1, ETSC, Brussels.
SWOV (2007), De top bedwongen, Stichting Wetenschappelijk Onderzoek Verkeersveiligheid (SWOV), Leidschendam (in Dutch).
Vis, M.A. and A.L. Van Gent (Eds.) (2007), Road Safety Performance Indicators: Country Comparisons, EU SafetyNet Project.


SOME KEY INTERVENTIONS FOR IMMEDIATE BENEFITS – 71
TOWARDS ZERO: AMBITIOUS ROAD SAFETY TARGETS AND THE SAFE SYSTEM APPROACH - ISBN 978-92-821-0195-7 © OECD/ITF, 2008
3. SOME KEY INTERVENTIONS FOR IMMEDIATE BENEFITS
ABSTRACT
Once a jurisdiction has analysed its crash data, set targets for achievement and determined the areasfor intervention as discussed in Chapter 1, it is critical that the interventions chosen are effective inaddressing the road safety problems.
Chapter 3 provides a summary of some key road safety interventions that experience and researchhave shown to be effective in reducing road trauma. These key interventions should be the essential“building blocks” that establish sound foundations for any jurisdiction’s overall approach to road safety.
The key building block interventions include those that achieve safer speeds, improve safety beltwearing, reduce drink-driving, improve road and roadside infrastructure, promote the introduction ofsafer vehicles, deliver graduated licensing for novices, improve safety for vulnerable road users andimprove the medical management of people after crashes.
3.1 Key “building block” interventions
Traditionally, road users were held responsible for the safety of the road transport system.Consequently, early prevention strategies were directed mainly at improving road users’ behaviour,mostly through education, information and enforcement strategies. The almost exclusive focus on tryingto improve driver behaviour in the 1950’s and 1960’s progressed to more comprehensive approacheswhich included interventions for vehicles, roads and medical care. This change in perspective washeavily influenced by the Haddon Matrix (Haddon, 1968), shown in Table 3.1 below.
Table 3.1. The Haddon Matrix for understanding road crash injury factors
PHASE
FACTORSHuman
(road userbehaviour)
Machine(vehicle)
Environment(road and roadenvironment)
Pre-crash(crash prevention)
AttitudesInformationImpairmentEnforcement
HandlingSpeed management
BrakingCollision avoidance
Electronic stability systems
Road design & layoutSpeed limits
Intelligent transportsystemsWeather
Pedestrian facilitiesCrash
(injury preventionduring crash)
Use of restraintsImpact speedImpairment
Crash protection of vehicle shellRestraints
Safety features, e.g. airbags
Kinetic energyabsorbing roadside
objectsPost-crash
(sustaining life)Access to medical
careGeneral health of
road user
Automatic crash notificationsystems
Access to crash siteFire risk
Rescue servicesElapsed time to
appropriate medicalcare

72 – SOME KEY INTERVENTIONS FOR IMMEDIATE BENEFITS
TOWARDS ZERO: AMBITIOUS ROAD SAFETY TARGETS AND THE SAFE SYSTEM APPROACH - ISBN 978-92-821-0195-7 © OECD/ITF, 2008
The development of more comprehensive road safety programmes finds its ultimate expression inthe “Safe System” approach examined in detail in Chapter 5. In brief, this approach views the trafficsystem holistically, addressing interactions between the road user, the vehicle, the road and travel speeds.A full Safe System response to road trauma requires that crash energies not exceed levels that result indeath or serious injury. It recognises that humans will always make mistakes in traffic no matter howeducated and compliant they are in obeying traffic laws, and requires system designers to provide atransport system that supports the highest level of safety outcome possible.
Developing and implementing a Safe System response to road trauma is a long-term project, withthe benefits often being limited during the early years. Early support for either a system response orsimply a more comprehensive road safety programme can be gained by implementing a battery ofcountermeasures capable of producing substantial benefits within a reasonable time frame. This Chaptersummarises some key road safety interventions that experience and research have shown to be effectivein reducing road trauma. Their systematic implementation can be considered as an essential part ofdeveloping a safe system approach.
The selection of these interventions is based on two OECD surveys (OECD 2002 andOECD 2006-1) that asked road safety practitioners to identify the key road safety risks in their country.The most common responses included:
• Speeding.
• Drink-driving.
• Non-wearing of safety belts.
• Poor road infrastructure.
• Young drivers.
• Vulnerable road users such as pedestrians, cyclists and moped riders/motorcyclists.
The purpose of this chapter is to summarise a short list of “building block” interventions that ifimplemented effectively, will provide substantial and immediate road safety benefits. These interventionshave been selected in direct response to the issues identified in the two OECD surveys, together withvehicle safety improvement, but are not intended to be exhaustive1. The essential “building blocks”described in this chapter are:
1. Providing for safer speeds.
2. Reducing drink-driving.
3. Increasing safety belt use.
4. Improving road and roadside infrastructure.
5. Promoting safer vehicles.
6. Providing for graduated licensing of novice drivers.
7. Improving the safety of vulnerable road users such as pedestrians, cyclists and powered two-wheeled vehicles.
8. Improving the medical management of people after crashes.

SOME KEY INTERVENTIONS FOR IMMEDIATE BENEFITS – 73
TOWARDS ZERO: AMBITIOUS ROAD SAFETY TARGETS AND THE SAFE SYSTEM APPROACH - ISBN 978-92-821-0195-7 © OECD/ITF, 2008
To achieve their maximum impact, these measures should be implemented as part of a Safe Systemapproach to improve road safety, where they would be part of an overall programme aimed at improvingthe intrinsic safety of the road system. However, it is recognised that not all countries have yet reachedthe point where a Safe System approach is feasible, in which case each of these measures can beimplemented independently and still provide substantial benefits.
The selected interventions do not represent fixed programmes of action. They need to be tailored tothe circumstances of each jurisdiction and need to be continually adapted to maximise their effectiveness.What is acceptable or effective in one country cannot be automatically transferred unchanged to anothercountry. For example, the effectiveness of a speed enforcement programme will depend upon theintensity of enforcement, the underlying strategies (covert or overt operation, targeted or randomselection of enforcement sites, timing of enforcement and so on), the nature and severity of sanctions andthe extent of support provided by the public. The reader will find additional information on best practicesin Europe in the European SUPREME report (SUPREME, 2007).
3.2. Providing for safer speeds
Speed is at the core of the road safety problem. It affects both the risk of being involved in a crashand the subsequent outcomes (Aarts & van Schagen, 2006, ERSO, 2006-1). The likelihood of beingseriously injured in a collision rises significantly with even minor changes in impact speed (OECD 2006-2). The relationship between crashes and speed has been modelled by Nilsson (2004)2, as shown inFigure 3.1.
Figure 3.1. The Power Model: relationship between change in mean speed and crashes
Source: Nilsson 2004.
Based on this model, a 5% increase in mean speeds leads to approximately a 10% increase in allinjury crashes and a 20% increase in fatal crashes. Similarly for a 5% decrease in mean speed, there aretypically 10% fewer injury crashes and 20% fewer fatal crashes.

74 – SOME KEY INTERVENTIONS FOR IMMEDIATE BENEFITS
TOWARDS ZERO: AMBITIOUS ROAD SAFETY TARGETS AND THE SAFE SYSTEM APPROACH - ISBN 978-92-821-0195-7 © OECD/ITF, 2008
Other researchers have repeatedly validated the association between speed and road trauma across arange of different scenarios. As one example, the relationship between speed and road crashes has beenevaluated by means of a meta-analysis of 98 studies that contain 460 estimates of effect (Amundsen etal., 2004). This study strongly supports Nilsson’s formulae. Other key studies include: Elvik et al,(2004); Aarts and Van Schagen, (2006); Kimber, (2001); Taylor, (2002); Patterson, (2000); and Kloedenet al., (1997). Comprehensive reviews of speeding problems and speed management options can also befound in a variety of sources including: ERSO, 2006-1: OECD, 2006-2; and GRSP, 2008.
According to the findings of the OECD report on Speed Management (OECD 2006-2), an effectivespeed management programme should have the following elements:
• Targeted education and information to the public and policy makers.
• Review of existing speed limits for all types of roads in relation to crash risk, based on roadfunction, presence of vulnerable road users, traffic composition, road design and roadsidecharacteristics. In urban areas the speed limit should not exceed 50km/h and 30km/h zones arerecommended where vulnerable road users are at risk.
• Infrastructure improvements aimed at achieving safe, “self explaining” roads, where the roaddesign and appearance provide a constant visual guide to drivers in choosing the appropriatespeed.
• Sufficient levels of traditional police enforcement and automatic speed control (electronicenforcement) and the development of section control (control of average speeds over sectionsof a road using electronic means). More effective enforcement can be achieved throughmeasures like minimum tolerances above speed limits and the use of mobile cameras.
• Development of vehicle engineering to include technologies such as collision avoidancesystems. In countries where this is not immediately feasible, consideration should be given tomandatory speed limiters for trucks and coaches.
Given the great potential benefits from new technologies, their progressive implementation isparticularly encouraged. Appropriate actions could include:
• All new cars to be equipped with manually adjustable speed limiters and, as soon aspracticable, with voluntary informative or supportive Intelligent Speed Adaptation (ISA)systems.
• To help secure the potential benefits of ISA technologies, governments should also cooperatewith relevant partners to develop interoperable digital speed limit databases which provideelectronic maps of all speed zones on the road network which are then made widely availableas part of the features on in vehicle navigation systems to warn the driver when they areexceeding the speed limit.
• Move to a regulatory requirement for ISA.
3.2.1. Speed limits
A speed limit is traditionally based on safety and mobility considerations – and increasingly, onenvironmental (emissions and noise) and public amenity considerations. In addition, some countriesincluding Sweden and the Netherlands are now proposing that the balance between safety and mobility

SOME KEY INTERVENTIONS FOR IMMEDIATE BENEFITS – 75
TOWARDS ZERO: AMBITIOUS ROAD SAFETY TARGETS AND THE SAFE SYSTEM APPROACH - ISBN 978-92-821-0195-7 © OECD/ITF, 2008
should be judged from a more ethical standpoint: death and serious injury are not acceptable by-productsfrom using the road transport system. This requires that the speed limits be set in coordination with roadinfrastructure provisions to eliminate the risk of fatality or serious injury (ERSO 2006-1, Tingvall,(1999)). Speed limits compatible with nil death or serious injury are detailed in Chapter 5.
While many jurisdictions may not be able to move immediately to these Safe System speed limits,intermediate steps are possible. Much research concludes that for any road environment when averagespeed has increased (due to raised speed limits and/or increased speeding), there has been acorresponding rise in road trauma (see Box 2.1 for example). Conversely, where speed has decreased(lower speed limits, less speeding), there has been a drop in road trauma. Any jurisdiction that imposeslower speed limits can expect safety benefits.
Box 3.1. The effects of changing rural interstate speed limits in the United States
Up until 1973, individual States could set their own limits on rural interstate highways, which weregenerally above 55 mph. In 1973, and in response to a national oil crisis, the US set a National MaximumSpeed Limit (NMSL) of 55 mph on these roads. Then in 1987 the NMSL was raised to 65 mph, forcertain rural highways, with 40 States over the subsequent years raising their limits to the new maximum.In 1995 the US Congress repealed the NMSL, allowing States once more to set their own limits. Manyjurisdictions promptly increased the maximum permissible limits, generally to either 70 or 75 mph.
Each change in the NMSL was accompanied by a series of evaluation studies. As a broad summary,the 1973 reduction in the NMSL resulted in reduced fatalities, the 1987 increase in the NMSL resulted inincreased fatalities and the 1995 repeal resulted in increased fatalities for those States that chose toincrease the maximum limit above 65 mph.
One of the more sophisticated evaluations of the safety impact of changing speed levels wasconducted by Patterson et al (2002), focusing on the 1995 decision to allow States to set their own limitson rural interstate highways. Based on statistical modelling, it was estimated that in the subsequent fouryears, States that raised the NMSL to 70 mph had a 35% higher fatality level compared to States that didnot change their limits – whereas States with a 75 mph limit had a 38% increase in fatalities. It wasestimated that an extra 1 900 people died in association with the 1995 change, with the increased speedlimit considered the most likely causal factor.
Source: Patterson, T. L., W.J. Frith and M.W. Small (2000), and Patterson, T. L., W.J. Frith,L.J. Povey and M.D. Keall, (2002).
3.2.2. Speed enforcement
Based on their summary of the research, Elvik and Vaa (2004) have concluded that:
• Stationary speed enforcement (e.g. observation and stopping points staffed by police officers)has been found to reduce fatal crashes by 14% and injury crashes by 6%, with cost-benefitratios ranging from 0.3 to 12.1.
• Mobile patrols reduced crashes by 16%, although the main type of behaviour influenced bypatrols appears to be drink-driving, rather than speeding.

76 – SOME KEY INTERVENTIONS FOR IMMEDIATE BENEFITS
TOWARDS ZERO: AMBITIOUS ROAD SAFETY TARGETS AND THE SAFE SYSTEM APPROACH - ISBN 978-92-821-0195-7 © OECD/ITF, 2008
• Automated enforcement using speed cameras has been shown to reduce all crashes by 19% andinjury crashes by 17%, with greater benefits in urban areas (28% reduction) than in rural areas(4% reduction). Benefit-cost ratios range from 2.6 to 26.7.
While they remain controversial in a number of countries, there has been a high social acceptance ofspeed cameras in at least some countries, including Finland, Norway and the United Kingdom (WHO2004-1). In the United Kingdom this high public acceptance has been brought about in part by publishedresults of crash reductions.
Box 3.2. Case Study: The National Safety Camera Programme in Great Britain
Speed and red-light enforcement cameras (referred to collectively as ‘safety cameras’) were firstdeployed in the early 1990s. It was soon concluded that, while cameras were effective at reducingcrashes, the full benefits were not being realised due to budgetary constraints, i.e. insufficient funding tocover installation and running costs. The same study noted that these constraints could be removed byallowing local road safety partnerships to recover their enforcement and other related costs from finesincurred by offenders.
In 1998, the national government decided to allow local road safety partnerships to recover theirenforcement costs, subject to strict criteria to prevent abuse. In 2000, the new system was introduced foreight pilot areas, with a national programme subsequently established.
In December 2005, an independent research report analysed the effectiveness of the system in 38areas over the first four years, from April 2000 to March 2004 (PA Consulting Group and UCL 2005).
• Vehicle speeds at camera sites dropped by around 6%. At new sites, there was a 31% reductionin vehicles breaking the speed limit. At fixed sites, there was a 70% reduction and at mobilesites there was an 18% reduction. Overall, the proportion of vehicles speeding excessively (i.e.15mph more than the speed limit) fell by 91% at fixed camera sites, and 36% at mobile camerasites.
• Cameras were associated with a 22% reduction in personal injury collisions (PICs) afterallowing for the long-term trend, but without allowing for selection effects (such as regression-to-mean). Overall, 42% fewer people were killed or seriously injured. At camera sites, therewas also a reduction of over 100 fatalities per annum (32% fewer). There were 1 745 fewerpeople killed or seriously injured and 4 230 fewer personal injury collisions per annum in 2004.There was an association between reductions in speed and reductions in PICs.
• There was a positive benefit to cost ratio of around 2.7:1. In the fourth year, the benefits tosociety from the avoided injuries were in excess of £258million compared to enforcement costsof around £96 million.
The public supported the use of safety cameras for targeted enforcement. This was evidenced bypublic attitude surveys, both locally and at a national level, that have shown support consistently from atleast 70% of respondents.
New technologies such as section control or point-to-point speed cameras are being implemented ina number of countries, with early evaluations showing positive impacts on speed and crashes. In Austria,cameras used over a section of motorway with a tunnel were associated with injury crash reductionsof 33% over two years, with a cost-benefit of 1:5.3 (Stefan, 2006). A preliminary evaluation of the

SOME KEY INTERVENTIONS FOR IMMEDIATE BENEFITS – 77
TOWARDS ZERO: AMBITIOUS ROAD SAFETY TARGETS AND THE SAFE SYSTEM APPROACH - ISBN 978-92-821-0195-7 © OECD/ITF, 2008
Strathclyde A77 section control system by Transport Scotland reported a statistically significant 20%reduction in reported injury crashes during the first two years of operation (A77 Safety Group 2007, inCameron, 2008).
3.2.3. Intelligent speed adaptation systems
Intelligent Speed Adaptation (ISA) is an in-vehicle system that supports the driver’s compliancewith speed limits by ‘reading’ the prevailing speed limits across a route. Research in the UK by Carstenand Tate (2005) suggests that the mandatory use of a supportive ISA system could bring about areduction of serious crashes of up to 50%, while the use of an informative ISA system could result in a2-10% reduction in crashes (in OECD, 2006-2). Trials in Sweden suggest that ISA, if introducednationally on a voluntary basis using a market driven approach, may produce around 20% reduction ofserious crashes (Biding et al, 2002 in OECD 2006-2).
ISA systems may also contribute to increasing public support for speed management, as in-vehiclesystems inform drivers about the prevailing speed zone and the speed of their vehicle, enabling them tocomply with speed limits and avoid inadvertently travelling at an illegal speed.
3.3. Reducing drink-driving
The association between drink-driving and crash risk was first formally quantified by Borkenstein in1964 and has been repeatedly confirmed by later researchers. As shown in Figure 3.2, the crash risk riseswith increasing blood alcohol content (BAC), with the risk curve being steeper as higher alcohol levelsare reached.
Figure 3.2. Drivers' blood alcohol concentrations and the relative riskof police-reported crash involvement
Source: Borkenstein R.F. et al. (1974), Compton et al. (2002), Moskowitz et al. (2002), Allsop (1966),in WHO (2004).

78 – SOME KEY INTERVENTIONS FOR IMMEDIATE BENEFITS
TOWARDS ZERO: AMBITIOUS ROAD SAFETY TARGETS AND THE SAFE SYSTEM APPROACH - ISBN 978-92-821-0195-7 © OECD/ITF, 2008
Drink-driving at illegal levels is a reported factor in fatal crashes in most countries, the incidenceranging from lows of around 5% of all driver fatalities in Mexico, Bulgaria, Czech Republic, Portugaland Romania to highs of around 30 to 40% in Canada, Slovenia, United States, France, Ireland and NewZealand (OECD, 2006-1). About 25% of all road deaths in Europe are alcohol related, whereas around1% of all kilometres driven in Europe are driven by drivers with 0.5g/l alcohol in their blood or more(ERSO, 2006-2).
The large variations are likely to reflect, at least in part, differences in reporting and detection. Forexample, Austria, with a low reported incidence of drink-driving crashes, has also reported a range ofdata collection problems likely to have resulted in an under-estimate of the true association betweendrink-driving and crashes. In several countries, it is not legally permissible to make blood tests on a deadbody, hence the low reporting rates in these countries. This issue in itself warrants early examination asunder-estimating the incidence of drink-driving crashes reduces the perceived importance of the issue.Further, support for drink-driving interventions may be eroded as incomplete data make it difficult tomeasure their impact.
Police enforcement of drink-driving laws, with random breath testing programmes and the loweringof legal blood alcohol limits to a BAC of around 0.05, are among the most effective strategies. TheEuropean Road Safety Observatory (ERSO, 2006-2) recommends that measures to reduce drink drivingshould include:
• Random breath tests for all drivers and not only for “suspected drivers”.
• Raising the chance of getting caught by carrying out more random roadside breath tests,especially at times and in locations where drink driving is suspected.
• Installation of alcohol interlocks in the vehicles of severe first time offenders and all repeatoffenders, in combination with a driver improvement course and a health counsellingprogramme if alcohol dependency is suspected.
• Improved public awareness and education campaigns for all age groups based on research.
• Reducing the availability of alcoholic beverages, especially for young novice drivers. Methodsfor achieving this can include raising the age limit for purchasing alcohol and banning alcoholsales in petrol stations and transport cafes.
Alcohol interlocks (devices which prevent a vehicle from being started if a breath sample readsabove a set limit) are being implemented in Canada, the United States, Sweden and Australia, targetingrecidivist drink-drivers who make up about 30% of drink-driving convictions in some jurisdictions. Earlyresearch suggests that interlocks hold potential for reducing this problem, especially when fitted almostimmediately following the offence and when coupled with alcohol counselling and treatmentprogrammes.
There is the potential for drink-driving as a road safety problem to be almost totally eliminated ifalcohol interlocks were fitted in all vehicles, rather than only in repeat offenders’ vehicles. However inmost countries, broader community acceptance of their value and confidence in their technical reliabilityneeds to be developed before introduction of a mandatory requirement for inclusion in all vehicles.Sweden is proposing mandatory inclusion of interlocks in all new vehicles for 2012.

SOME KEY INTERVENTIONS FOR IMMEDIATE BENEFITS – 79
TOWARDS ZERO: AMBITIOUS ROAD SAFETY TARGETS AND THE SAFE SYSTEM APPROACH - ISBN 978-92-821-0195-7 © OECD/ITF, 2008
3.4 Increasing use of safety belts
It is estimated that since 1980, the introduction of safety belts (or seatbelts) has resulted in 300 000lives saved and 9 million injuries prevented in the industrialised world (WHO, 2004-1). A United Statesstudy of the contribution of vehicle safety technology for the years 1960 to 2002 found that fatalities hadbeen halved as a result of safety belts (NHTSA, 2004).
High seatbelt wearing rates above 90% for front seat occupants are found in many countries,including Australia, Canada, Denmark, Finland, France, Germany, Japan, Malta, Netherlands, NewZealand, Norway, Sweden, and United Kingdom (OECD 2006-1). Lower seatbelt wearing rates arefound in Belgium (51-77%), Czech Republic (56%), Hungary (59%) and Lithuania (around 60%)(OECD, 2006-1). Although there is a legal obligation in many countries for front seat occupants to usesafety restraints, this is not always the case for rear seat passengers. Seatbelt wearing rates in the EU 25lie between 59% (Hungary) and 97% (France) for front seat occupants, compared to 21% (Estonia) and90% (Germany) for those in the rear seat (OECD 2006-1).
Seatbelt wearing rates also fluctuate across other factors. For example, in low and middle incomecountries, the use of occupant protection devices such as seatbelts and child restraints, is generally lowerthan in higher-income countries. The former countries account for 80% of the estimated 1.2 millionpeople killed on the roads worldwide each year, including many car occupants (FIA Foundation website:www.fiafoundation.com).
Police enforcement backed by legislation and penalties is the most effective strategy to improveseatbelt wearing. Enforcement is more effective if it is supported by intensive mass-media educationprogrammes, both to highlight the injury risk of not wearing a seatbelt and to increase the perception ofbeing detected and penalised if not wearing a seatbelt. Active safety belt enforcement has been shown toincrease the wearing rate by up to 20% in urban areas and 16% in rural areas (Elvik and Vaa, 2004).
Technologies such as seatbelt reminder systems are now being introduced into vehicles to remindoccupants to buckle up, thereby helping to counter any human error in forgetting to put on the seatbelt. Itis estimated that up to 99% of car drivers would use their belt if reminded by such a device (ETSC 2006).
Seatbelt ignition interlocks that prevent a vehicle from operating if there is an unrestrained occupantare already used in industrial settings and could almost completely counter the non-wearing of seatbeltsif introduced universally. This development will depend upon gaining community and vehicle industryacceptance.
3.5. Improving road infrastructure
Many individual road features have a strong association with crash occurrence. For example:
• Crash rates vary with road alignment, road width, roadside and median treatment and withjunction type and design.
• Rural road crashes are generally more severe than crashes on urban roads, particularly onundivided highways, due to a number of factors including higher travelling and hence impactspeeds, relatively poor road geometry (in comparison to motorways for example), anddispersed enforcement (OECD 1999, ERSO 2006-3). Average fatal crash rates per vehiclekilometre can be up to 6 times higher on 2-lane rural roads than on motorways. Rates decreaseas traffic flows increase (Lynam 2004).

80 – SOME KEY INTERVENTIONS FOR IMMEDIATE BENEFITS
TOWARDS ZERO: AMBITIOUS ROAD SAFETY TARGETS AND THE SAFE SYSTEM APPROACH - ISBN 978-92-821-0195-7 © OECD/ITF, 2008
Box 3.3. ‘Por Amor Use el Cinturón’ (Seatbelt) campaign in Costa Rica
In the 1990s compulsory seatbelt legislation in Costa Rica was challenged by a group of civillibertarians. As a result the law was overturned and seatbelt wearing rates fell to 24%.
From the autumn of 2003 until the summer of 2004, the FIA Foundation, in conjunction with theMinistry for Transport, the National Road Safety Council, the National Insurance Institute and the CostaRican Automobile Club, supported a nationwide campaign to reinstate the seatbelt law – an objective whichwas achieved in May 2004 when new legislation once again made seatbelt use compulsory for front and backseat car occupants.
A related objective was to achieve a wearing rate of 70%. A national seatbelt survey conducted after thecampaign in August 2004 confirmed that the combination of the compulsory seatbelt legislation, traffic policeenforcement and a media campaign resulted in the target being exceeded, with seatbelt wearing rates fordrivers rising from 24% to 82%.
The Lessons Learned
Political champions are vital
The support and commitment of the Ministers in the Transport Department; the President of theParliament and the President of the Republic were essential in maintaining momentum at key stages in thedevelopment and execution of every aspect of the campaign.
Campaigns need a simple objective
The ‘Por Amor Use el Cinturón’ campaign set out a simple objective and a strategy to achieve thatobjective: compulsory seatbelt legislation and a target for seatbelt compliance. This gave the partners a cleargoal to work towards and provided a rallying point for supporters.
Campaigns need a clear message
There was a danger at one stage in the development of the campaign that the core issue of seatbelt usewould be lost in a wider ‘values’ campaign. By refusing to compromise on the campaign content, even at therisk of losing financial support, the campaign steering group achieved clarity of message and developed apowerful and clearly understood campaign which resonated with the public.
Celebrities bring positives but can be unpredictable
Celebrities can bring immense benefits in terms of media coverage, public awareness and ‘personality’for a campaign, but can also be an unpredictable element in campaign planning.
Securing funds can be difficult …the first time
Finding additional sources of funding to supplement the grant from the FIA Foundation proved difficult.No private sector donors could be persuaded to participate, despite some lengthy discussions. Since thesuccess of the ‘Por Amor Use el Cinturón’ campaign, companies have been much more open to working withcampaign organisers. Success breeds success.
Evaluation
Pre and post campaign evaluation was essential for understanding the scale of the seatbelt non-compliance problem and for measuring the extent of change following the campaign and the introduction oflegislation. The evaluation data has been extremely useful for targeting further campaigning, for example onthe link between parental non-compliance and a lack of child restraints.
The full report is available at: www.fiafoundation.com/ media/ por_amor_a_practical_review.html

SOME KEY INTERVENTIONS FOR IMMEDIATE BENEFITS – 81
TOWARDS ZERO: AMBITIOUS ROAD SAFETY TARGETS AND THE SAFE SYSTEM APPROACH - ISBN 978-92-821-0195-7 © OECD/ITF, 2008
• While fatal crashes are more likely to occur on rural roads, the majority of injury crashes (up to65% in some jurisdictions such as France and Western Australia, OECD 2006-1) occur onurban roads. This is due to more traffic movements and more chances of conflict with a greatervariety of road users (e.g. pedestrians, cyclists, trucks), moving at different speeds.
Appropriate designs for each road type are needed to minimise the number of crashes likely to occurand to mitigate injury severity, particularly on higher speed roads. Road design must also reflect thelimitations of human capacity and performance in traffic and must cater for all likely users, with youngand elderly pedestrians being the most at risk. Risk for motorised two-wheelers is also high, withroadside hazards forming a particular risk.
3.5.1. System wide evaluation of road risk
Many jurisdictions, both in Europe and elsewhere, have taken a proactive approach to improving thesafety of their roads through systematic use of road audits.
Box 3.4. Road Safety Impact of Road Safety Audits
Road safety audits should occur before, during and after the design and construction stages of allroad projects.
What are road safety audits?
The road safety audit process is designed to pro-actively improve road safety through formalindependent review of proposed road and traffic plans and through inspection of new and existing roadsand traffic operation plans. Increasingly in recent years, road authorities around the world haverecognised road safety audits as an effective means of either preventing crashes or reducing theirseverity.
There are several key factors in conducting a road safety audit:
• Auditing is a formal process and not an informal check.
• Auditing is conducted by someone independent of the road designer and builder.
• Auditing is possible during design and also following construction of the road.
• Auditing is restricted to road safety considerations.
The Benefits of Road Safety Audits
• Surrey County Council (1994) in the UK undertook a study of 19 audited and 19 non-auditedtraffic schemes. For sites with audited schemes, the average number of casualties dropped by1.25 per year (from 2.08 to 0.83) while casualty crashes at the un-audited sites dropped by only0.26 per year (from 2.60 to 2.34).
• The UK Highways Agency studied 22 road projects audited at the design stage. The evaluationconsisted of comparing the costs of implementing safety recommendations made by the audit atthe design stage with the costs of making changes after the project was constructed. For the 22audits, the total estimated saving was GBP 250 215, or an average saving of GBP 11 373.
• In Denmark, a study was undertaken by Schelling (1995) to estimate the cost effectiveness ofmeasures recommended in road safety audits. He examined 13 projects, using crash predictionmethods to estimate expected crash rates had road safety audit recommendations not been

82 – SOME KEY INTERVENTIONS FOR IMMEDIATE BENEFITS
TOWARDS ZERO: AMBITIOUS ROAD SAFETY TARGETS AND THE SAFE SYSTEM APPROACH - ISBN 978-92-821-0195-7 © OECD/ITF, 2008
implemented at the design stage. Total costs and estimated casualty savings for the 13 projectsgave a first year rate of return of 146%. The rate varied considerably from one audit to another,but in all cases was above 100%.
• A study in Jordan focussed on projects in which no audit had taken place and where, shortlyafter the projects were completed, road safety problems occurred and corrective works had tobe carried out (Al-Masaeid, 1998). The study assumed that the necessary repair works wouldhave been included in the initial design if an audit had been carried out. On the basis of thenumber of crashes that could have been prevented, the first year rate of return of conductingdesign stage audits was estimated to be 120%.
The benefits of audits can also be demonstrated indirectly by reference to the proven crashreductions arising from the types of infrastructure and other treatments commonly recommended inaudits.
Conclusions
Road safety audits represent an important, cost-effective engineering tool for preventing road trauma.While direct evidence attesting to their safety and economic benefits remains limited, their underlyingprinciples and the proven efficacy of road improvements in other contexts both strongly support audits asa highly effective road safety countermeasure.
IRAP (the International Road Assessment Programme) represents another proactive strategy forassessing the risk of road networks. The methodology is still evolving but IRAP uses two basic protocolsto assess road-related crash risk: risk rate maps, based upon the location and level of fatal and seriousinjury crashes along segments of the road network; and a road protection score, whereby road segmentsreceive star ratings according to their capacity to protect users from crashes or from death or seriousinjury in the event of a crash. IRAP’s objective of generating publicity for the relative risk and safetyratings of different roads can assist in the on-going development of safer road networks.
3.5.2. Other road improvement options
In the short term, low-cost, effective and efficient infrastructure measures that fit within existingroad maintenance programmes should be considered. In the longer term, major infrastructureimprovement programmes are recommended. The latter programmes should focus on creating moreforgiving roadsides in both urban and rural areas and need to include area and length-based treatments, aswell as improvements to intersections (OECD 2002).
Targeted road improvements that identify and treat the highest crash locations with specifictreatments such as audible edge-lining, shoulder sealing, clearing of roadside vegetation and theconstruction of passing lanes, have been highly successful. Crash reductions ranging from 14-48% andbenefit cost ratios ranging from 4:1 to 60:1 have been found in Australia, the United States, GreatBritain, Norway, France, Canada, Netherlands, Nordic Countries and New Zealand. In addition, thebenefits from targeted programmes accrue and compound over the life of the treatment, which can be upto 25 years. It has been estimated that in Australia, each $100m spent as part of a targeted roads safetyimprovement programme saves at least 20 lives, compared to about 1.5 lives for each $100m spent ongeneral road improvement programmes (Elvik 1997, Vulcan and Corben 1998).

SOME KEY INTERVENTIONS FOR IMMEDIATE BENEFITS – 83
TOWARDS ZERO: AMBITIOUS ROAD SAFETY TARGETS AND THE SAFE SYSTEM APPROACH - ISBN 978-92-821-0195-7 © OECD/ITF, 2008
Box 3.5. State-wide High Risk Location Program – Victoria, Australia
In 2000, the State Government of Victoria commenced a four year AUD 240 million Statewidehigh-risk location programme. Sites to be treated were identified based on their poor crash history, with841 sites subsequently selected.
The study found that relative to chosen comparison sites, casualty crashes at treated sites werereduced by a statistically significant 31%, while serious casualty crashes were reduced by about 35%.Based on the specific crash costs used, the programme was estimated to return a present value saving ofAUD 494 million, or a Benefit-Cost-Ratio of 2.4. If alternative injury costs were assumed, the predictedsavings rise to AUD 763 million and the Benefit-Cost-Ratio to 3.7.
It was also estimated that over the life of the program, the number of lives saved by preventingcrashes at treated sites is likely to be in excess of 200, while the number of incidents of seriously injuredroad users prevented is estimated to be about 3 000.
Of the three broad types of treatments implemented as part of the programme (intersection, off-pathand vulnerable users), those targeting crashes at intersections resulted in the greatest estimated reductionin serious casualty crashes at treated sites. The estimated serious casualty crash reduction at such siteswas 45%, compared with 29% for treatments targeting off-path crashes. Treatments targeting crashesinvolving vulnerable road users (i.e. pedestrians and cyclists) did not effectively reduce serious casualtycrashes or all types of casualty crashes at treated sites.
However, targeting high-risk locations is likely to produce benefits only for a limited period. Ashigh-risk locations are successfully treated, a growing proportion of crashes will occur at uniquelocations. For the longer term, it is better to reduce crashes with a systematic, proactive approach withina Safe System framework (see Chapter 5). In addition to road improvement programmes which targethigh-risk locations, specific road infrastructure treatments have also been extensively evaluated. Forexample:
• There is a very high potential for improving overall safety by treating or removing roadsideobstacles, with obstacle-free zones of between 4 and 10 metres being desirable if practical.
• Flexible barriers at the roadside where there are obstacles, and down the centre-line, areeffective in dissipating kinetic energy without severe damage to vehicles and occupants.
• Roundabouts are a proven solution for intersection safety.
• Treatments such as traffic channelling, road lighting and road marking with lights makeintersections easier and safer to use (OECD, 2002).
3.6. Promoting safer vehicles
Improvements to vehicles can increase safety at two levels: by reducing the severity of injury in theevent of a crash (crash protection); and by preventing a crash altogether (crash avoidance). The benefitsfrom these two forms of safety improvement take time to accumulate, as they depend on the rate of fleetturnover as improved vehicle designs penetrate the market. However, the rate of penetration can beaccelerated, especially through consumer education about new safety features which can drive market-led demand for the new safety features.

84 – SOME KEY INTERVENTIONS FOR IMMEDIATE BENEFITS
TOWARDS ZERO: AMBITIOUS ROAD SAFETY TARGETS AND THE SAFE SYSTEM APPROACH - ISBN 978-92-821-0195-7 © OECD/ITF, 2008
Box 3.6. Success story – Vehicle crash testing programmes for consumers
Programmes to advise consumers of comparative vehicle safety first began in the United States inthe 1960’s, largely as a result of continued advocacy on behalf of consumers by Ralph Nader. Vehiclecrash testing programmes conducted by the National Highway Traffic Safety Administration (NHTSA)of the United States Department of Transportation and the Insurance Institute for Highway Safety toinform consumers about vehicle safety, together with partnerships with the vehicle industry, have sinceachieved considerable progress in vehicle safety features and design.
During the 1990s, significant steps towards improved protection of car occupants were made in thehighly-motorised countries outside of the United States. In the European Union, there were severaldirectives on frontal and side impact protection and information on crash tests from the European NewCar Assessment Programme (EuroNCAP) began to be widely disseminated. This programme tests thecrashworthiness of new light vehicle models by conducting standardised barrier crash tests underlaboratory-controlled conditions. The primary purpose is to provide consumer information on relativevehicle safety in regard to certain crash types. This information has led to informed consumer pressureon manufacturers to rapidly improve safety in their vehicles, well above that achieved in the past.
Equivalent vehicle crash testing programmes are conduced also in Australia, Japan and Korea.China is currently developing its own NCAP programme which will mobilise considerable purchasingpower, given that country’s growing economic situation. Significant regional differences remain,however, in the level of vehicle design standards, their policing and access by consumers to vehicle crashtest information.
The critical importance of improved vehicle safety to reducing road trauma is evidenced by therecent announcement from one manufacturer, Volvo, that by 2020 no-one in their vehicles will die as aresult of a collision.
3.6.1. Safer vehicles and improved crash protection
Crash protection has a proven history of effectiveness. For example, a review of the main casualtyreduction measures in the United Kingdom between 1980 and 1996 found that the greatest contributionto casualty reduction was from crash protection in vehicles (Broughton, 2000). This accounted for 15%of the reduction, compared with 11% from drink-drive measures and 6.5% from road engineeringmeasures. Along similar lines, it has been claimed that if all cars were designed to provide ‘bestavailable’ crash protection, 50% of all fatal and disabling injuries would be avoided (WHO, 2004-2).
As further examples of research findings:
• The SUNFlower study of road safety in Sweden, United Kingdom and The Netherlandsattributed 20% reduction of fatalities from 1980-2000 (i.e. about 1% per year) to vehicle safetyimprovements (Koonstra, 2002). The study notes that it is extremely difficult to identify theeffects of individual policies with confidence, but attaches more reliability to the fatalitysavings from vehicle safety, seat belt wearing, and drinking and driving than other measures.
• In Australia, researchers have found that a vehicle built between 1991 and 1998 is twice aslikely to protect the occupants from injury relative to a vehicle built between 1964-69. There isa clear association between the introduction of Australian Design Rules for improved vehicledesign and improved vehicle crashworthiness, particularly those rules introduced in the 1970s.

SOME KEY INTERVENTIONS FOR IMMEDIATE BENEFITS – 85
TOWARDS ZERO: AMBITIOUS ROAD SAFETY TARGETS AND THE SAFE SYSTEM APPROACH - ISBN 978-92-821-0195-7 © OECD/ITF, 2008
As a general finding, there is also a strong association between injury reduction and year of thevehicle’s manufacture (Austroads, 2005). These findings dispel the popular myth that oldvehicles with a solid chassis are safer than modern vehicles that crumple to absorb kineticenergy before it reaches the human body.
3.6.2. Improved crash avoidance
There is as yet relatively little conclusive research on the safety benefits of crash avoidancetechnologies, but Electronic Stability Control (ESC) systems promise to be a major advance in activesafety measures. These systems use sensors to detect variations in vehicle direction from the driver’sintended path (measured by steering input) and then automatically apply braking or power restriction toindividual wheels to bring the vehicle under control and to steer in the intended direction. These systemsare increasingly found in new vehicles and are estimated to be present in about 50% of new cars sold inEurope (already 96% of vehicles sold in Sweden) and about 20% of new cars in Australia. Studies inEurope, the United States and Japan have estimated that ESC can reduce single-vehicle fatal crashesinvolving loss of control (run off road to hit object and/or rollover) by between 25–72%, the higher endof the range being associated with sports utility vehicles (NHTSA, 2007).
While the rate of implementation of ESC in new vehicles is being driven largely by consumerdemand/market forces, some countries are now considering making the systems mandatory for all newvehicles. The United States, for example, has recently established a Federal safety standard requiring thatall new passenger vehicles be fitted with ESC from the year 2011. In November 2007, an agreement wasreached within the UNECE to equip new coaches and trucks with ESC as of 2010.
Collision avoidance systems and lane departure warning systems are examples of other promisingtechnologies.
3.7 Graduated licensing for novice drivers
Traffic crashes are the single greatest killer of 15-24 year olds in OECD countries. Young novicedrivers are greatly over-represented in all crash and fatality statistics. For each young driver killed,about 1.3 other people also die (passengers and other road users).
Young driver crashes differ from those of more experienced drivers. They are more likely to occurat night, not involve another vehicle and involve loss of control, high speeds and alcohol. Their crashesprimarily stem from immaturity, lack of experience, risk taking, impairment, distraction by passengersand lifestyles associated with their age and gender. Young males in particular are often overconfidentabout their driving skills.
A full analysis of the young driver problem and the range of possible countermeasures are providedin a recent companion report (OECD/ECMT, 2006-3). As noted in the report, there is no single solution.Rather, a reduction in young driver crashes requires a combination of countermeasures involving thelicensing process, training methods, enforcement, education and communication, and technology.
In particular, graduated licensing schemes have proved to be effective. These involve licensingprocedures that build experience and progressively manage exposure of the novice to the full demands ofthe driving task and deter early patterns of unsafe driving behaviour. Components of a graduatedlicensing scheme might include restrictions on night-driving and carrying young passengers, graduateddemerit points while on probation, zero blood alcohol tolerance and extended learning periods prior tofull licensing to encourage driving in a variety of road and weather conditions while under supervision.In support of extended learning periods, there is evidence from Sweden that substantial amounts

86 – SOME KEY INTERVENTIONS FOR IMMEDIATE BENEFITS
TOWARDS ZERO: AMBITIOUS ROAD SAFETY TARGETS AND THE SAFE SYSTEM APPROACH - ISBN 978-92-821-0195-7 © OECD/ITF, 2008
(around 120 hours) of on-road driving experience by the learner driver under the supervision of anexperienced driver/instructor, provides significant benefits in terms of reduced involvement in crashesduring subsequent driving (OECD/ECMT, 2006-3).
3.8. Improving the safety of vulnerable road users
Deaths among pedestrians and cyclists in Europe since 1980 have decreased by about 65% and 55%respectively. However, the proportion of pedestrian deaths is still about 17% of all road fatalities and theproportion of cyclist deaths is about 6%. Motorcycle and moped fatalities in Western Europe currentlyrepresent 10-15% of all traffic fatalities.
Pedestrians, cyclists and motorised two-wheeler riders are relatively unprotected in the event of acrash. Speed and mass of the vehicles involved therefore play a critical role in determining the injuryoutcomes for these groups. Their probability of being either killed or seriously injured is high if struck bya vehicle travelling in excess of 30km/h. Studies in Sweden, the United Kingdom and the Netherlandsreport that when road engineering and speed management measures have been implemented in tandem toreduce the probability of impact speeds exceeding 30 kph, there have been fatality savings for vulnerableroad users of 25% to 35% (Koornstra et al., 2002).
Together with such engineering treatments, compulsory helmet wearing education, legislation andenforcement programmes, protective clothing for cyclists and riders of motorised two-wheelers, havebeen found to be the most effective programmes to reduce injuries to these two groups (OECD, 1997).
While there are important short-term benefits to be gained from these measures pursued in isolation,it is likely that full protection of vulnerable road user groups will result only from a Safe Systemapproach which enables pedestrians, cyclists and motorised two-wheeler riders to be either separatedfrom vehicles or exposed only to vehicles travelling below 30 km/h.
3.9. Improving the medical management of people after crashes
A review of European studies of death in traffic crashes concluded that about 50% of all deathsoccurred within a few minutes of the crash, either at the crash scene or on the way to a hospital. Many ofthese deaths could have been prevented had more immediate medical care been available (WHO,2004-1). The European Commission has stated that several thousands of lives could be saved in the EUby improving the response times of the emergency services and other elements of post-impact care in theevent of road traffic accidents (Commission of the European Communities, 2003). A review of1970-1996 data in several OECD countries suggested that between 5% and 25% of the reductions in roadcrash deaths may have been due to improvements in medical care and technology (Noland, 2004).
Risk factors in the pre-hospital phase include lack of effective and timely emergency services, lackof communications (e.g. mobile phones) and lack of health insurance for the poor in countries withoutbasic universal health service provision. Hospital risk factors include lack of suitably trained medicalstaff, particularly with respect to emergency medicine and trauma management, and lack of suitablemedical equipment. While these factors vary between low and high-income countries, they also varywithin countries and between urban and more remote areas.
“Mayday” systems aim to reduce the time between crash occurrence and the provision of medicalservices. By improving information transfer between the trauma care physician and emergency medicalservice personnel, they also aim for faster and more appropriate treatment. Automatic Crash CallNotification which is currently being implemented in Europe (ecall Project) extends the benefits ofMayday systems by providing emergency responders with data covering the location and the severity of

SOME KEY INTERVENTIONS FOR IMMEDIATE BENEFITS – 87
TOWARDS ZERO: AMBITIOUS ROAD SAFETY TARGETS AND THE SAFE SYSTEM APPROACH - ISBN 978-92-821-0195-7 © OECD/ITF, 2008
the crash and the nature of injuries sustained (ERSO, 2006-4). This system has been estimated to reduce4-8% of road deaths and 5-10% of vehicle occupant deaths in Finland (Ware, 1998).
Other effective countermeasures in the pre-hospital phase include trauma management training foremergency services personnel. Helicopter services in higher income countries are proving to be cost-effective, particularly within a 200 km radius of major hospitals, as they provide rapid long-distancetransport to specialised medical treatment and avoid delays associated with traffic congestion.
In-hospital care can be improved by training teams for trauma management with the AdvancedTrauma Life Support course of the American College of Surgeons, widely recognised as the standard forthis type of training. Adequate funding for physical resources, including equipment and consumablemedical products and for training of medical staff, is also essential. Advances in surgical technique,trauma management and technology, all informed by research, are also improving hospital care of roadand other trauma victims: panel reviews indicate an average reduction of 50% in medically preventabledeaths and trauma registry studies show around a 15-20% reduction (Simons (1999); Mann (1999); andBrennan et al., 2002).
Finally, the adequate provision of quality rehabilitation programmes and services can have a majorimpact on reducing the consequences of road trauma and hastening recovery. While attention is paid tophysical rehabilitation and care, there are generally less services available to support mental andemotional recovery from crashes and for grief and loss counselling due to road trauma.
3.10. Some national evaluations of road safety interventions
Many countries conduct formal reviews of their progress in reducing road trauma. One of the mostsubstantial reports on such reviews is the SUNflower study, conducted in Sweden, the United Kingdomand the Netherlands (Koornstra et al. 2002). Table 3.2, taken from the SUNflower study, summarisesestimated reductions in fatalities as a result of key interventions in these three countries. The study notesthat it is extremely difficult to identify the effects of individual policies with confidence, but the fatalitysavings from vehicle safety, seat belt wearing, and drinking and driving seem rather reliable.
Table 3.2. Saving in fatalities between 1980-2000 attributed to different road safety interventionsin Sweden, Britain and The Netherlands
InterventionsSweden Britain Netherlands
(Estimated % of total fatalities saved)
Vehicle safety, seat belts, drinking and driving 48% 54% 46%
Local road engineering 4% 10% 5%Other vulnerable road users related measures (e.g.residential infrastructure treatment and lower urbanspeed limits)
38% 29% 31%
Other car occupant measures 10% 7% 18%
Estimated no. of total fatalities saved 426 3 124 1 455
Source: Koornstra (2002).
Countries also use the demonstrated effectiveness of countermeasures to estimate future road safetygains, often when preparing their national road safety strategies. Table 3.3 summarises expected benefitsfrom a suite of different countermeasures, as estimated in a number of OECD countries.

88 – SOME KEY INTERVENTIONS FOR IMMEDIATE BENEFITS
TOWARDS ZERO: AMBITIOUS ROAD SAFETY TARGETS AND THE SAFE SYSTEM APPROACH - ISBN 978-92-821-0195-7 © OECD/ITF, 2008
Table 3.3. Projected savings in fatalities 2000-2010 attributed to different typesof road safety interventions in selected countries
Interventions
SwedenAchievable
(2000-2010)
BritainAchievable
(2000-2010)
NetherlandsAchievable
(2000-2010)
New Zealand(2000-2010)
Australia(2001-10)
Estimated % of total fatalities savedRoad engineeringand speedmanagement(excludingenforcement)
16% 19% 28% Blackspots 2.1%Road programmes:
existing (5%)expanded
(11.7-18%)
19%
Speed enforcement 17% 10% 10% Speed management(urban 3.3-5.3%)
(rural 11.6-19.1%)
Not calculatedseparately
Vehicle safety 10% 10% 10% 15.5% 10%
Belt/child restraintuse/enforcement
2% 4% 8% 4.2% 3%
Drinking & Drivingenforcement
3% 4% 5% 3.3% Not calculatedseparately
Intensifiededucation, trainingand publicity
2% 2% 2% Not calculatedseparately
*Improve road userbehaviour 9%
Other Traumamanagement (0.9%)
New technology 2%
Achievable total343.5% 40% 49.5% Not calculated 43%
Extrapolatedexposure increase
-10% -8% -12% Not calculatedseparately
Allowance foroverlap of measures/increase in exposure
Resulting total 33.5% 32% 37.5% 50% 40%
Note: The estimations have been made through different methods and the "absolute" figures cannot be comparedfrom one country to another.
Source: Koornstra et al., 2002, LTSA 2000, Australian Transport Council, undated.
Along similar lines, a 2007 independent review of the United Kingdom road safety strategy notedthe areas from which benefits had accrued and identified further gains that could be achieved in a rangeof areas if implementation were to progress further (Broughton, 2007).
Table 3.4 Estimated past and projected future impacts of road safety measures averaged over alltypes of road and road user (% reduction in killed and seriously injured).

SOME KEY INTERVENTIONS FOR IMMEDIATE BENEFITS – 89
TOWARDS ZERO: AMBITIOUS ROAD SAFETY TARGETS AND THE SAFE SYSTEM APPROACH - ISBN 978-92-821-0195-7 © OECD/ITF, 2008
Table 3.4. Estimated past and projected future impacts of road safety measures averaged over alltypes of road and road use (% reduction in killed and seriously injured)
Period2000-2005
%
Period2006-2010
%
Combined
%
New road safety engineering programme 7.0 2.5 9.3
Improved secondary safety in cars 2.8 7.2 9.8
Other vehicle safety improvements 0.1 0.1 0.2
Motorcycle and pedal cycle helmets 0.3 0.2 0.5
Safety on rural single carriageways 1.0 0.5 1.5
Reducing accident involvement of novicedrivers
0.0 0.0 0.0
Additional measures for pedestrian and cyclistprotection
0.0 0.0 0.0
Additional measures for speed reduction 4.0 2.0 5.9
Additional measures for child protection 0.1 0.1 0.2
Reducing casualties in drink-drive accidents 0.0 0.0 0.0
Reducing accidents during high-mileage workdriving
0.3 0.2 0.5
Additional measures for improved driverbehaviour
0.0 0.0 0.0
Combined effect of all measures 14.8 12.2 25.2
Source: Broughton, 2007.
3.11. Conclusions
The interventions recommended in this chapter as essential components of any country’s road safetyprogramme, consist of measures to manage speed, eliminate drink-driving, increase seatbelt use, improveroad and roadside infrastructure, enhance vehicle safety, manage the safe introduction of novice driversto the road system, provide a safer environment for vulnerable road users and improve the medicalmanagement of people involved in crashes.
There are other road safety issues requiring different responses but every country, regardless of itsstage of road safety development, will experience safety improvements by properly applying the keyproven measures described in this chapter.
Countries with relatively poor road safety performance are advised to tackle the behaviouralproblems of speeding, drink-driving and the non-wearing of safety belts as a priority. Enforcementprogrammes of adequate scope and intensity, backed by penalties to deter unsafe behaviour andextensive publicity, are effective in bringing about large improvements in a short period of time. Theserapid improvements need to be maintained by ongoing effort particularly in the area of enforcement, asimprovements can decay.

90 – SOME KEY INTERVENTIONS FOR IMMEDIATE BENEFITS
TOWARDS ZERO: AMBITIOUS ROAD SAFETY TARGETS AND THE SAFE SYSTEM APPROACH - ISBN 978-92-821-0195-7 © OECD/ITF, 2008
Over reliance on behavioural strategies must, nevertheless, be avoided. Even well-educated andcompliant road users will make mistakes, and an over-reliance on enforcement and compliance measureswill not always counter these mistakes. The interventions recommended in this chapter, therefore, arebest seen as early steps towards the development of a full Safe System.
These proven interventions will continue to be effective only if they are implemented with asufficient level of intensity. Effective implementation involves management processes that includeanalysing data to identify key problem areas, setting targets for achievement, choosing effectiveinterventions, building community and political support, allocating sufficient resources, monitoring andevaluating performance. These issues are described more fully in Chapters 1 and 6.
NOTES
1. As noted by Rumar (ECMT 2002), there are several levels of road safety problems, ranging from theobvious problems known and seen by many people (for example, excessive speeding by young males) to theless known, hidden problems (for example, low level speeding by many people). Rumar states that it is thesehidden problems that contribute the most to road trauma.
2. Any model is a simplified representation of reality. The Nilsson model of the relationship between vehiclespeed and fatalities and injuries, while founded on a sound scientific base, can not take into account all thecharacteristics of the road environment. The actual effects depend on the exact road traffic andcharacteristics. For example, the effect is considerably larger on urban roads as compared to motorways.
3. The estimates of the achievable saving percentages from the rows above yield proportional reduction factorsthat are multiplied to obtain the achievable total reduction percentages (not using the added total, becausethen double counting the saved fatalities from one source that are already saved by other sources).

SOME KEY INTERVENTIONS FOR IMMEDIATE BENEFITS – 91
TOWARDS ZERO: AMBITIOUS ROAD SAFETY TARGETS AND THE SAFE SYSTEM APPROACH - ISBN 978-92-821-0195-7 © OECD/ITF, 2008
REFERENCES
Al-Masaeid, H.R. (1998), Effectiveness of Road Safety Audit. Proceedings of the Road Safety in EuropeConference, Bergisch Gladbach, Germany, September 1998.
Allsop, R.E. (1966), Alcohol and road accidents RRL Report No 6 Crowthorne: Road ResearchLaboratory.
Aarts, L. and I. Van Schagen, (2006), Driving speed and the risk of road crashes: A review. In AccidentAnalysis and Prevention 38 (2006), 215-224.
Amundsen, A.H., R. Elvik and P. Christensen (2004), Speed and road accidents: an evaluation of thePower Model. www.toi.no
Australian Transport Council (undated-1), National road safety strategy 2001-2010. Australian TransportSafety Bureau, Canberra. http://www.atcouncil.gov.au/documents/pubs/strategy.pdf
Australian Transport Council (undated-2), National road safety action plan 2007 and 2008. AustralianTransport Safety Bureau, Canberra. Available on the internet athttp://www.atcouncil.gov.au/documents/nrss_actionplan_0708.pdf
Austroads 2005, Promoting vehicle crashworthiness (prepared by S. Newstead, M. Cameron, andJ. Langford), in Australasian Road Safety Handbook Volume 2.
Biding, T. and G. Lind, (2002), Intelligent Speed Adaptation (ISA), Results of large-scale trials inBorlange, Linkoping, Lund and Umeaa during the period 1999-2002. Vaegverket Publikation,89E, 122pp. http:///www.isa.vv.se/novo/filelib/pdf/isarapportengfinal.pdf
Borkenstein RF et al. (1964), The role of the drinking driver in traffic crashes, Dept. of PoliceAdministration, Indiana University, Bloomington, Indiana, USA.
Brennan, P.W. et al. (2002), Risk of death among cases attending South Australian major trauma serviceafter severe trauma: 4 years operation of a state trauma system. The Journal of Trauma 2002,53: 333-339.
Broughton, J. et al. (2000), The numerical context for setting national casualty reduction targets,Crowthorne, Transport Research Laboratory Ltd, TRL Report No.382.
Broughton, J. (2007), Monitoring Progress Towards the 2010 Casualty Reduction Target – 2005 data,TRL, Crowthorne.
Cameron, M.H. (2008), Development of Strategies for Best Practice in Speed Enforcement in WesternAustralia, Supplementary Report.

92 – SOME KEY INTERVENTIONS FOR IMMEDIATE BENEFITS
TOWARDS ZERO: AMBITIOUS ROAD SAFETY TARGETS AND THE SAFE SYSTEM APPROACH - ISBN 978-92-821-0195-7 © OECD/ITF, 2008
Carsten, O. and F. Tate (2005), Intelligent speed adaptation: accident savings and cost-benefit analysis,in Accident Analysis and Prevention 37.
Commission of the European Communities (CEC ) (2003), “European road safety action programme:Halving the number of road accident victims in the European Union by 2010: A sharedresponsibility”, Communication from the Commission Com (2003) 311 final.
Compton R.P. et al. (2002), Crash risk of alcohol impaired driving. In: Mayhew D.R.and C. Dussault,eds., Proceedings of the 16th International Conference on Alcohol, Drugs and Traffic Safety,Montreal, 4–9 August 2002, Montreal, Société de l’assurance automobile du Québec, 2002:39–44(http: //www.saaq.gouv.qc.ca/t2002/actes/pdf/ (06a).pdf, accessed 17 November 2003).
Elvik, R. (1997), “Evaluations of road accident blackspot treatment; a case of the iron law of evaluationstudies”, Accident Analysis and Prevention, Vol. 29, No.2, pp.191-199.
Elvik, R. and Vaa, T. (2004), The handbook of road safety measures, Elsevier Science, Amsterdam.
European Road Safety Observatory (ERSO) (2006-1), Speeding, retrieved 20 January, 2007 fromwww.erso.eu
European Road Safety Observatory (ERSO) (2006-2), Alcohol, retrieved 25 January, 2008 fromwww.erso.eu
European Road Safety Observatory (ERSO) (2006-3), Roads, retrieved 5 March, 2008 fromwww.erso.eu
European Road Safety Observatory (ERSO) (2006-4), Post Impact Care, retrieved 20 March 2007 fromwww.erso.eu
European Transport Safety Council (ETSC), (2006), Seat belt reminders: Implementing advanced safetytechnology in Europe’s cars, ETSC Brussels.
Global Road Safety Partnership (GRSP) (2008), Speed management: a road safety manual for decision-makers and practitioners, Geneva, Global Road Safety Partnership.
Haddon Jr., W. (1968), “The changing approach to the epidemiology, prevention, and amelioration oftrauma: the transition to approaches etiologically rather than descriptively”, American Journal ofPublic Health, 1968, 58:1431–1438. 33. Henderson M. Science and society.
Kimber, R. (2001), 2010 - Getting there in one piece, The 11th PACTS Westminster Lecture on TransportSafety, Transport Research Foundation, Crowthorne.
Kloeden, C.N., A.J. McLean, V.M. Moore and G. Ponte (1997), Travelling speed and the rate of crashinvolvement, Volume 1: findings, Report No CR 172, Federal Office of Road Safety, FORS,Canberra.
Koornstra M., D. Lynam, G. Nilsson, P. Noordzij, H-E. Pettersson, F. Wegman and P. Wouters (2002),SUNFlower: A comparative study of the development of road safety in Sweden, the UnitedKingdom and the Netherlands, SWOV, Available on the Internet:http://www.swov.nl/rapport/Sunflower/Sunflower.pdf

SOME KEY INTERVENTIONS FOR IMMEDIATE BENEFITS – 93
TOWARDS ZERO: AMBITIOUS ROAD SAFETY TARGETS AND THE SAFE SYSTEM APPROACH - ISBN 978-92-821-0195-7 © OECD/ITF, 2008
LTSA (2000), Estimated effects of interventions on road safety outcomes to 2010, New Zealand, LandTransport Safety Authority, Also available on Internet:http://www.ltsa.govt.nz/publications/docs/sdwp7.pdf
Lynam, D., T. Hummel, J. Barker, and S. Lawson (2004), European Road Assessment Programme 1(2003) Technical Report www.eurorap.org
Mann, N., M.S. Clay, R. Mullins, E.J. MacKenzie, G.J. Jurkovich, C.N. Mock, and N. Charles (1999),A systematic review of trauma system effectiveness based on registry comparisons, The Journal ofTrauma, 1999, 47: pp.546-555.
Moskowitz H et al.(2002), Methodological issues in epidemiological studies of alcohol crash risk. In:Mayhew D.R., C. Dussault, eds., Proceedings of the 16th International Conference on Alcohol,Drugs and Traffic Safety, Montreal, 4–9 August 2002. Montreal, Société de l’assuranceautomobile du Québec, 2002:45–50 (http://www.saaq.gouv.qc.ca/t2002/actes/pdf/ (06a).pdf,accessed 17November 2003).
National Highway Traffic Safety Administration (NHTSA) (2007), Statistical Analysis of theEffectiveness of Electronic Stability Control (ESC) Systems –Final Report. NHTSA, Technicalreport, July 2007.
National Highway Traffic Safety Administration (NHTSA) (2004), “Lives saved by the federal motorvehicle safety standards and other vehicle safety technologies, 1960-2002”.
Nilsson, G. (2004), “Traffic safety dimension and the power model to describe the effect of speed onsafety”, Lund Institute of Technology, Sweden.
Noland, R.B. (2004), A review of the impact of medical care and technology in reducing traffic fatalities,IATSS Research, Vol. 28, No.2: pp. 6-12.
OECD (1997), Safety of Vulnerable Road Users, OECD, Paris.
OECD (1999), Safety strategies for rural roads, OECD, Paris.
OECD (2002), Safety on the roads; What’s the vision? OECD, Paris.
OECD/ECMT (2006-1), Country reports on road safety data and performance, Results of a surveyundertaken by the OECD/ECMT Working Group on Achieving Ambitious Road Safety Targets:Joint OECD/ECMT Transport Research Centre, Paris. Avalaible on the internet athttp://www.cemt.org/JTRC/index.htm
OECD/ECMT (2006-2), Speed management, Joint OECD/ECMT Transport Research Centre.
OECD/ECMT (2006-3), Young drivers: The road to safety Joint OECD/ECMT TransportResearch Centre.
Patterson, T.L., W.J. Frith and M.W. Small (2000), Down with speed: A review of the literature, and theimpact of speed on New Zealanders, Accident Compensation Corporation/Land Transport SafetyAuthority, Wellington, New Zealand.

94 – SOME KEY INTERVENTIONS FOR IMMEDIATE BENEFITS
TOWARDS ZERO: AMBITIOUS ROAD SAFETY TARGETS AND THE SAFE SYSTEM APPROACH - ISBN 978-92-821-0195-7 © OECD/ITF, 2008
Patterson, T. L., W.J. Frith, L.J. Povey and M.D. Keall (2002), The effect of increasing rural interstatespeed limits in the USA, Traffic Injury Prevention, 3 (4), pp. 316-320.
Schelling, A. (1995), Road Safety Audit, the Danish Experience, Proceedings Road Safety in Europe andStrategic Highway Research Program, Prague, Czech Republic, September 1995.
Stefan, C. (2006) Section control automatic speed enforcement in the Kaisermühlen tunnel (Vienna, A22Motorway), Austrian Road Safety Board (KvF), Vienna.
SUPREME (2007b), Best practices in road safety, Handbook for measures at the country level.
Surrey County Council (1994), Road Safety Audit: An investigation into casualty savings Discussionreport, Surrey County Council Highways Management Division, Casualty Reduction Group.
Taylor, M.C., A. Baruya and J.V. Kennedy (2002), The relationship between speed and accidents onrural single-carriageway roads, TRL Report TRL 511 prepared for Road Safety Division,Department for Transport, Local Government and the Regions.
Tingvall C. and N. Howarth (1999), Vision Zero: an ethical approach to safety and mobility.The 6th Institute of Transport Engineers International Conference on Road Safety and TrafficEnforcement: Beyond 2000, Melbourne 1999.
Vulcan, P. and B. Corben (1998), Prediction of Australian road fatalities for the year 2010.
World Health Organisation (2004-1), World report on road traffic injury prevention, Full Reportavailable on Internet at: http://www.who.int/world-health-day/2004/infomaterials/world_report/en/
World Health Organisation (2004-2), Preventing road traffic injury: A public health perspective forEurope. WHO, also available on Internet at:http://www.euro.who.int/violenceinjury/injuries/20040326_2

MANAGING ROAD SAFETY PROGRAMMES FOR RESULTS – 95
TOWARDS ZERO: AMBITIOUS ROAD SAFETY TARGETS AND THE SAFE SYSTEM APPROACH - ISBN 978-92-821-0195-7 © OECD/ITF, 2008
4. MANAGING ROAD SAFETY PROGRAMMES FOR RESULTS
ABSTRACT
This chapter sets out the elements of the road safety management system that are essential todelivering the interventions described in chapter 3 and fundamental in determining level of performance.This management system can be usefully applied in all countries, irrespective of their income levels orinstitutional and technical capacity.
The development of an effective management system is explored in terms of its focus on results andthe challenges associated with the shift to a Safe System approach. This shift requires a strongcommitment to institutional capacity building and ongoing innovation, sustained by the process ofresearch and knowledge transfer within and across national boundaries.
Consideration of all elements of the road safety management system becomes critical for anycountry seeking to surpass its current performance levels and to go beyond good practice outcomes toachieve even more ambitious results.
4.1. What limits performance in achieving road safety targets?
Chapter 1 described the range of performance targets in OECD and ITF countries, highlighting thatthey have become a feature of good-practice road safety programmes in OECD member countries andhave been the subject of previous OECD publications (OECD, 1994 and 2002). More recently the WHOand World Bank World Report on Road Traffic Injury Prevention summarised good practice andrecommended that national road safety strategies include ambitious but achievable performance targets,supported by national action plans that set out specific interventions to achieve them (WHO, 2004). Thisapproach is widely accepted in good practice countries, with much of their effort focusing uponidentifying the limits to ‘ambitious but achievable’ road safety results. Setting ambitious targets is onething; meeting them is another.
While setting the limits to improved performance is ultimately a political decision, experience todate suggests that many countries continue to put a strong emphasis on achievability to ensure that the settargets are credible: that is, the targets are achievable using available interventions. In thesecircumstances the targets are often inherently conservative and limited by the bounds of what is deemedto be technically feasible and institutionally manageable.1 This is not to suggest that innovation islacking. However, this approach fails to recognise that the existing limits can sometimes be stretched bya degree of aspiration that seeks to go beyond what the available evidence suggests could be achieved.
The limits to improved road safety performance are also shaped by the capacity of the road safetymanagement system operating in a country. This determines the results being sought and produces theinterventions to achieve them. The limits to a country’s road safety performance are constrained by itsinstitutional capacity to implement efficient and effective interventions, and the subsequent results mayfall short of what is technically feasible with any particular set of road safety interventions. This isparticularly the case in low and middle-income countries where institutional capacity is weak, but it alsoremains an issue in high-income countries faced with competing policy priorities, funding constraints

96 – MANAGING ROAD SAFETY PROGRAMMES FOR RESULTS
TOWARDS ZERO: AMBITIOUS ROAD SAFETY TARGETS AND THE SAFE SYSTEM APPROACH - ISBN 978-92-821-0195-7 © OECD/ITF, 2008
and political tensions concerning the community acceptability of proposed safety measures. There aremany manifestations of these tensions, and one example is the inability in some countries of road safetyagencies to successfully convince governments to implement automated speed management.
4.2. The road safety management system
Institutional responsibilities and accountabilities for road safety are coming under closer scrutiny asa consequence of progressively more ambitious road safety results being targeted. In particular, the shiftto a Safe System approach requires higher levels of road network operator accountability for safeperformance and this in turn sharpens the focus on the safety performance of the vehicles and peoplewho access the network. With increased accountability, a key concern for governments and institutionsbecomes the achievability of the desired performance. The limits to improved road safety performanceare shaped by the road safety management system that determines the results being sought and producesthe interventions to achieve them. Hence the setting and meeting of ambitious road safety targets requiresa clear understanding of all elements of the road safety management system and the linkages betweenthem.
The elements of the recommended road safety management system are shown in Figure 4.1. Themanagement pyramid shown in the figure derives from the Land Transport Safety Authority of NewZealand’s comprehensive target setting framework, which linked desired results with interventions andrelated institutional implementation arrangements (Land Transport Safety Authority, 2000). The NewZealand framework was further refined by the European Transport Safety Council (Wegman, 2001), theSunflower Project (Koornstra et al., 2002) which defined the institutional implementation arrangementsin broader terms as ‘structure and culture’, and the World Bank which expressed ‘structure and culture’in terms of seven institutional management functions (Bliss and Breen, 2008).
Figure 4.1. The road safety management system
Source: Land Transport Safety Authority (2000) and Bliss & Breen (2008).

MANAGING ROAD SAFETY PROGRAMMES FOR RESULTS – 97
TOWARDS ZERO: AMBITIOUS ROAD SAFETY TARGETS AND THE SAFE SYSTEM APPROACH - ISBN 978-92-821-0195-7 © OECD/ITF, 2008
Level 1 of the management pyramid: Institutional management functions
The seven institutional management functions depicted in the lower tier of the pyramid in Figure 4.1and expanded on in Box 4.1 are the foundation to the road safety management system. These functionsare essential for the efficient and effective production of interventions which in turn achieve road safetyresults. They are delivered primarily by the government entities with main responsibility for road safetyinterventions, but also by business entities and safety advocacy groups that have formed partnershipswith the government entities to achieve the desired focus on results.
Box 4.1. Institutional management functions
• Results Focus concerns a strategic orientation that links all actual and potential interventions withresults, analyses what results can be achieved over time, and sets out a safety performanceframework for the delivery of interventions and their intermediate and final outcomes (i.e. the levelof safety which a country wishes to achieve expressed in terms of visions, goals, objectives andrelated targets).
• Coordination concerns the orchestration and alignment of the interventions and other relatedinstitutional management functions delivered by government partners and related community andbusiness partnerships to achieve the desired focus on results.
• Legislation concerns the legal instruments necessary for governance purposes to specify thelegitimate bounds of institutions, their responsibilities and accountabilities, their interventions andtheir related institutional management functions to achieve the desired focus on results.
• Funding and resource allocation concerns the financing of interventions and related institutionalmanagement functions on a sustainable basis using a rational evaluation and programmingframework to allocate resources to achieve the desired focus on results.
• Promotion concerns the countrywide and sustained communication of road safety as a corebusiness for Government and society, emphasising the shared societal responsibility to support thedelivery of the interventions required to achieve the desired focus on results.
• Monitoring and evaluation concerns the systematic and ongoing measurement of road safetyoutputs and outcomes (intermediate and final) and evaluation of interventions in terms of theirachieving the desired focus on results.
• Research and development and knowledge transfer concerns the systematic and ongoingcreation, codification, transfer and application of knowledge that contributes to the improvedefficiency and effectiveness of the road safety management system to achieve the desired focus onresults.
Source: Bliss and Breen (2008).
In managing for improved road safety results, the foremost and pivotal institutional managementfunction is results focus. All the other institutional management functions are subordinate to this functionand contribute to its achievement. A country’s ‘results focus’ can be interpreted as a pragmaticspecification of its ‘ambition’ to improve road safety and the means agreed to achieve this ambition. Inthe absence of a clear focus on results, all other institutional functions and related interventions can lackcohesion and direction and the efficiency and effectiveness of safety programmes can be undermined(Bliss and Breen, 2008).

98 – MANAGING ROAD SAFETY PROGRAMMES FOR RESULTS
TOWARDS ZERO: AMBITIOUS ROAD SAFETY TARGETS AND THE SAFE SYSTEM APPROACH - ISBN 978-92-821-0195-7 © OECD/ITF, 2008
Four distinct phases can be identified in the evolution of the focus on results through to the SafeSystem approach, as summarised in Box 4.2.
Box 4.2. The evolving focus on results
As outlined in the World Report on Road Traffic Injury Prevention (WHO, 2004) and the follow upWorld Bank Transport Note (Bliss, 2004), progressive shifts in road safety management thinking andpractices in high-income countries have been evident. Since the 1950s there have been four significantphases of development, which have become progressively more ambitious in terms of the results desired.
Phase 1 – Focus on driver interventions. In the 1950s and 60s safety management was generallycharacterised by dispersed, uncoordinated, and insufficiently resourced institutional units performingisolated single functions (Koornstra et al., 2002). Road safety policies placed considerable emphasis onthe driver by establishing legislative rules and penalties and expecting subsequent changes in behaviour,supported by information and publicity. It was argued that since human error contributed mostly to crashcausation it could be addressed most effectively by educating and training the road user to behave better.Placing the onus of blame on the road traffic victim acted as a major impediment to the appropriateauthorities fully embracing their responsibilities for a safer road traffic system (Rumar, 1999).
Phase 2 – Focus on system-wide interventions. In the 1970s and 1980s, these earlier approachesgave way to strategies which recognised the need for a systems approach to intervention. Dr. WilliamHaddon, an American epidemiologist, developed a systematic framework for road safety based on thedisease model which encompassed infrastructure, vehicles and users in the pre-crash, in-crash and postcrash stages (Haddon, 1968). Central to this framework was the emphasis on effectively managing theexchange of kinetic energy in a crash which leads to injury to ensure that the thresholds of humantolerances to injury were not exceeded. The focus of policy broadened from an emphasis on the driver inthe pre-crash phase to also include in-crash protection (both for roadsides and vehicles) and post crashcare. This broadened it to a system-wide approach to intervention and the complex interaction of factorswhich influence injury outcomes. It underpinned a major shift in road safety practice which took severaldecades to evolve. However, the focus remained at the level of systematic intervention and did notdirectly address the institutional management functions producing these interventions or the results thatwere desired from them.
Phase 3 – Focus on system-wide interventions, targeted results and institutional leadership. By theearly 1990s good practice countries were using action focused plans with numerical outcome targets tobe achieved with broad packages of system-wide measures based on monitoring and evaluation. On-going monitoring established that growing motorisation need not inevitably lead to increases in deathrates but could be reversed by continuous and planned investment in improving the quality of the trafficsystem. The United Kingdom, for example, halved its death rate (per 100 000 head of population)between 1972 and 1999 despite a doubling in motorised vehicles. Key institutional managementfunctions were also becoming more effective. Institutional leadership roles were identified, inter-governmental coordination processes were established and funding and resource allocation mechanismsand processes were becoming better aligned with the results required. Developments in Australasianjurisdictions (e.g. Victoria and New Zealand) further enhanced institutional management functionsconcerning results focus, multi-sectoral coordination, delivery partnerships, and funding mechanisms(WHO, 2004; Bliss, 2004; Wegman et al., 2006; Trinca et al., 1988). Accountability arrangements wereenhanced by the use of target hierarchies linking institutional outputs with intermediate and finaloutcomes to coordinate and integrate multi-sectoral activities. This phase laid the foundation for today’sbest practice and reflects the state of development found in many higher performing countries today.

MANAGING ROAD SAFETY PROGRAMMES FOR RESULTS – 99
TOWARDS ZERO: AMBITIOUS ROAD SAFETY TARGETS AND THE SAFE SYSTEM APPROACH - ISBN 978-92-821-0195-7 © OECD/ITF, 2008
Phase 4 – Focus on system-wide interventions, long-term elimination of deaths and serious injuriesand shared responsibility. By the late 1990s, two of the best performing countries had determined thatimproving upon the ambitious targets that had already been set would require rethinking of interventionsand institutional arrangements. The Dutch Sustainable Safety (Wegman et al., 1997 and 2008) andSwedish Vision Zero (Tingvall, 1995; Committee of inquiry into road traffic responsibility, 2000)strategies re-defined the level of ambition and set a goal to make the road system intrinsically safe. Theimplications of this level of ambition are currently being worked through in the countries concerned andelsewhere. These strategies recognise that speed management is central and have re-focused attention onroad and vehicle design and related protective features. The ‘blame the victim’ culture is superseded by‘blaming the traffic system’ which throws the spotlight on operator accountability. These examples ofSafe System approaches have influenced strategies in Norway, Finland, Denmark, Switzerland andAustralia.
Today the growing view is that road safety is a system-wide and shared multi-sectoral responsibilitywhich is becoming increasingly ambitious in terms of its results focus. Sustaining the level of ambitionnow evident in high-income countries requires a road safety management system based on effectiveinstitutional management functions that can deliver evidence-based interventions to achieve desiredresults. Achievement of the ultimate goal of eliminating death and serious injury will require continuedapplication of good practice developed in the third phase of targeted programmes coupled withinnovative solutions which are yet to be determined based on well-established safety principles.
Source: Bliss and Breen (2008).
The evolving focus on results in successful road safety management systems – especially from thedevelopment of targeted national programmes through to the Safe System approach – has beenunderpinned by the process of research and development and knowledge transfer within and acrossnational boundaries. This vital institutional management function has maintained the focus on results andguided the design and implementation of national strategies that have sustained reductions in road deathsand injuries in the face of growing mobility and exposure to risk. In supporting the evolution of higherand higher levels of performance ambition, research and development and knowledge transfer has takenon important global and regional dimensions.
Research and development and knowledge transfer concerns the creation, codification, transfer andapplication of knowledge that contributes to the improved efficiency and effectiveness of the road safetymanagement system. The successful transfer of knowledge requires not only its transmission but also itsabsorption and ultimate use. If the knowledge ends up not being used then the transfer has beenineffective. If it is absorbed and used, this knowledge is enhanced, further codified and subject toongoing transfer. Hence knowledge transfer can be viewed as an ongoing process that transfers existingknowledge and creates new knowledge to achieve continuous improvement in performance. Managingthis process is the primary responsibility of the researchers and national policy-makers that play a crucialrole in planning and evaluating road safety programmes.
The process of knowledge transfer usually begins within a country, but what is learned from thisexperience can also be transferred and adapted to improve road safety results in other countries.Knowledge is first diffused in the country of its creation by a process of ‘learning by doing’ that sharpensthe performance of the safety management system and enhances and strengthens the evidence base thatsupports it. This takes time, as at least several years of sustained activity are needed to gather sufficientproof that the new practices are effective. Once this has been convincingly demonstrated the relevantknowledge can then begin being disseminated and transferred to other countries.2 Research and

100 – MANAGING ROAD SAFETY PROGRAMMES FOR RESULTS
TOWARDS ZERO: AMBITIOUS ROAD SAFETY TARGETS AND THE SAFE SYSTEM APPROACH - ISBN 978-92-821-0195-7 © OECD/ITF, 2008
development and knowledge transfer will take on an increasingly important role as countries commit tomaking the shift to a Safe Systems approach.
Level 2 of the management pyramid: Interventions
Interventions are shaped to achieve the desired focus on results. They address the safe planning,design and operation of the road network, and the conditions under which vehicles and people arepermitted to use it; and they set standards and rules for this safety and aim to secure compliance withthem. Standards and rules stipulate how road safety assets are to be built and used. Compliance aims tomake road builders and operators, the motor vehicle industry and road users adhere to safety standardsand rules using a combination of education, enforcement and incentives.
In effect interventions must address a fundamental trade-off between standards and compliance. Aroad system can be engineered with high standards of safety to fully accommodate user infractions anderrors, or it can be engineered with lower standards of safety and operationally managed to ensure highlevels of road user compliance with its use. A mixed approach is generally taken to managing this trade-off. For example, high traffic volume, high speed roads are usually carefully managed in terms of useraccess and are provided with side and median barriers to eliminate deaths and injuries arising from head-on or run-off-road crashes. Many medium traffic volume high-speed roads do not have these safetyfeatures provided and intensive general deterrence enforcement is required to reduce crash deaths andinjuries. With the shift to a Safe System approach the trade-off between standards and compliance isbeing reconsidered and more emphasis is being placed on building safety into the system from the outset,rather than inspecting or enforcing it in with far-reaching compliance regimes.
Box 4.3. Classification of interventions
Intervention types Standards and rules Compliance
Planning, design, operationand use of the roadnetwork.
Conditions of entry andexit of vehicles and roadusers to the road network.
Recovery and rehabilitationof crash victims in the roadnetwork.
Source: Bliss (2004).
Standards and rules cover safe roaddesign, construction, operation andmaintenance.
Standards and rules also govern howthe road network is to be used safelyby setting speed and alcohol limits,occupant restraint and helmetrequirements, vehicle standards andvehicle and road user licensingrequirements.
Standards and rules also govern thedelivery of appropriate emergencymedical and rehabilitation services tocrash victims.
Compliance aims to make roadbuilders and operators, thevehicle and transport industry,road users and emergencymedical and rehabilitationservices adhere to safetystandards and rules, using acombination of education,enforcement and incentives.
However, even in the Safe System approach the fundamental trade-off between standards andcompliance with these standards prevails, as a safe system still requires all operators and users to complywith the standards and rules set for its use. What has changed in this new approach is the overarchingpriority placed on speed management and the setting of speed limits in accordance with injury tolerance

MANAGING ROAD SAFETY PROGRAMMES FOR RESULTS – 101
TOWARDS ZERO: AMBITIOUS ROAD SAFETY TARGETS AND THE SAFE SYSTEM APPROACH - ISBN 978-92-821-0195-7 © OECD/ITF, 2008
thresholds of the human body, rather than the revealed speed behaviour of the road users. Safetystandards take priority over mobility or capacity standards and the protection of road users becomesparamount.
Some of the key interventions for a road safety program of any level of ambition are described inmore detail in Chapter 2.
Level 3 of the management pyramid: Results
The final element of the road safety management system concerns the measurement of the desiredresults and their expression as targets in terms of final outcomes, intermediate outcomes, and outputs(Bliss, 2004).
Final outcomes can be expressed as performance measured against a long term vision of the futuresafety of the road traffic system (e.g. Vision Zero and Sustainable Safety). Final outcomes can also beexpressed as performance measured against more short to medium term targets for social costs, fatalitiesand serious injuries, which represent the level of safety a country wishes to achieve within a defined timeframe. This level of safety is ultimately determined by the quality of the delivered interventions, which inturn are determined by the quality of the country’s institutional management functions.
Intermediate outcomes are of value for their contribution to improved, final outcomes. They caninclude average traffic speeds, the proportion of drunk drivers using the network, seatbelt-wearing rates,helmet-wearing rates, and the physical condition of the road network and the relative safety standards ofthe vehicle fleet, measured for example in terms of safety ratings.
Output measures are also useful. These take the form of physical deliverables from institutions, forexample the number of speed enforcement operations employed to reduce average traffic speeds.
Good practice countries set quantitative outcome and intermediate outcome targets to achieve theirdesired results focus. They can also set related quantitative output targets commensurate with thetargeted outcomes
4.3. Universal application of the road safety management system
As defined, the road safety management system has a number of generic characteristics that allowfor its universal application to all countries, irrespective of their income levels or management capacity,as follows:
• The system places an emphasis on the production of road safety, and recognises that it isproduced just like any goods and services. The production process is viewed as a managementsystem with three distinctive levels: institutional management functions which produceinterventions, which in turn produce results. Much of the day to day discussion concerning roadsafety centres on interventions alone, and using the management system opens up thediscussion to the important and often neglected issues of institutional ownership andaccountability for results.
• The system is neutral to country structures and cultures which will shape the way institutionsfunction and goals will be set and achieved. Any country can use this framework and adapttheir road safety initiatives to it.

102 – MANAGING ROAD SAFETY PROGRAMMES FOR RESULTS
TOWARDS ZERO: AMBITIOUS ROAD SAFETY TARGETS AND THE SAFE SYSTEM APPROACH - ISBN 978-92-821-0195-7 © OECD/ITF, 2008
• The system accommodates evolutionary development. This is illustrated by the evolving focuson results that has been evident in high-income countries through to the Safe System approach,and in any particular period of development the system can be used to analyse road safetymanagement capacity and prepare related strategies and programmes.
• The system applies to any given land use/transportation system. In this sense it takes the currentand projected exposure to risk as given, but it can also manage the land use/transport trade-offsby considering these in the desired focus on results and addressing them with interventionsconcerning the planning, design, operation and use of the road network and the entry and exitof vehicles and road users to this road network.
• The system takes the road network as its frame of reference and locates the deaths and injuriesthat are avoidable. The three broad categories of intervention are defined in terms of the roadnetwork and have strong spatial dimensions. This distinguishes the system from earlierframeworks that emphasised safer roads, safer vehicles, and safer people, without locating themspecifically in the network contexts where deaths and serious injuries occur (Bliss and Breen,2008).
Consideration of all elements of the road safety management system becomes critical for anycountry seeking to surpass its current performance levels and to go beyond good practice outcomes toeven more ambitious results. In this regard a Safe System is synonymous with a management system thathas all its elements performing effectively to achieve the desired results focus. In terms of the three levelsof the road safety management system, the Safe System approach is characterised by its long term goalof death and serious elimination with challenging but achievable interim outcome and output targets; itsintegrated system-wide interventions; and the shared responsibility for results across its institutionalmanagement functions led by government and supported by all related stakeholder partnerships.
4.4. Conclusions
It is recognised good practice that national road safety strategies include ambitious and achievableperformance targets, with their achievability being determined by both the country’s institutionalmanagement capacity and the technical performance boundaries of the interventions implemented.However, longer-term ambition can go beyond what can be achieved with current and projected means,and in leading countries the goal of eliminating deaths and serious injuries has been set and requires ashift to the Safe System approach to bring the road sector into line with the safety performanceexpectations for other modes of transport.
The policy perspective on ‘achievability’ has shifted as a consequence of this new performancefrontier, and now requires a strong commitment to innovation to reshape interventions to achieve thedesired results. The Safe System approach reinterprets what is already known and raises critical issuesabout the wider adoption of interventions that have proven to be effective in eliminating deaths andserious injuries. The question becomes one of how to more comprehensively and rapidly introduce thesesafety interventions, and more broadly how to strengthen all elements of the road safety managementsystem with potential for improvement. The evolving focus on results in successful road safetymanagement systems has been underpinned and sustained by the process of research and developmentand knowledge transfer within and across national boundaries, and this will take on an increasinglyimportant role as countries commit to making the shift to a Safe System approach.
The limits to improved road safety performance are also shaped by the road safety managementsystem that determines the results being sought and produces the interventions to achieve them, and this

MANAGING ROAD SAFETY PROGRAMMES FOR RESULTS – 103
TOWARDS ZERO: AMBITIOUS ROAD SAFETY TARGETS AND THE SAFE SYSTEM APPROACH - ISBN 978-92-821-0195-7 © OECD/ITF, 2008
system can be viewed in three distinct and linked levels in its evolution to a Safe System approach. Thefirst level concerns institutional management functions, of which results focus is pivotal with all theother functions directed to achieving this desired focus on results. The second level concernsinterventions produced by the institutional management functions, and the third level concerns the resultsproduced by the interventions. In the absence of a clear focus on results, all the other institutionalmanagement functions and interventions can lack cohesion and direction.
This management system has a number of generic characteristics that allow for its universalapplication to all countries, irrespective of their income levels or management capacity. It places anemphasis on the production of road safety, and recognises that it is produced just like any goods andservices, it is neutral to country structures and cultures, it accommodates evolutionary development, itworks within any given land use/transportation system, and it takes the road network as its frame ofreference and locates the deaths and injuries that are avoidable. Consideration of all the elements of theroad safety management system becomes critical for any country seeking to surpass its currentperformance levels and to go beyond good practice outcomes to even more ambitious results.
In looking ahead, ambitious road safety targets will be most readily met if a robust road safetymanagement system is established to support performance improvement. While efforts to improve allelements of the road safety management system will be needed, a special emphasis on the keyinstitutional management function of ‘results focus’ will be essential, along with a heightened prioritybeing placed on research and development and knowledge transfer, to sustain the high levels ofinnovation necessary to implement a Safe System approach (see Chapter 8).
Awareness of effective interventions is rarely sufficient to achieve successful implementation. Aneffective road safety programme requires a sound road safety management system to assist short term(0-5 years) improvement and to underpin both medium term (5-10 years) and long term (>10 years)improvements. Adequate institutional management capacity to support the development andimplementation of effective interventions focused on ambitious results is a critical component. Inparticular, strengthened institutional management capacity to support the desired focus on results isrequired in the following areas:
• Coordination of the key agencies in developing and delivering road safety policy and strategy.
• Effective legislative development.
• Adequate funding and well targeted resource allocation.
• Socially inclusive promotion and advocacy.
• Robust monitoring and evaluation arrangements.
• Proactive research and development and knowledge transfer programmes.
The commitment to a results focused approach to road safety management has a critical role indetermining the achievement of a country’s road safety ambition and related targets.

104 – MANAGING ROAD SAFETY PROGRAMMES FOR RESULTS
TOWARDS ZERO: AMBITIOUS ROAD SAFETY TARGETS AND THE SAFE SYSTEM APPROACH - ISBN 978-92-821-0195-7 © OECD/ITF, 2008
NOTES
1. The issue of affordability is a critical institutional consideration and available funding will strongly influencethe overall results that can be achieved and hence the targets that are set. More specifically the economic valuesplaced on risk reduction will guide resource allocation decisions and the selection of interventions. Countriesdiffer in their approach to the valuation of deaths and serious injuries avoided, although good practice tends tofavour the use of willingness to pay measures for risk reductions. Economic considerations strongly underpinthe policy dialogue on meeting ambitious road safety targets and related issues are addressed in more detail inChapter 6.
2. An example of effective knowledge transfer across national boundaries is provided by the experiences in thelate 1980s and 1990s of the Australian States of Victoria and New South Wales in the areas of speedmanagement and drink driving, with the knowledge gained transferring rapidly to New Zealand. Thisknowledge helped shape legislative frameworks, operational road policing strategies and tactics, and publiceducation campaigns in New Zealand, and similar results were achieved with appropriate adjustments topractices to reflect the new conditions encountered (Cameron, M.; P. Vulcan, N. Haworth, S. Kent, (1994),H. Hayes, M. Moloney, T. Lester (1996), Fitzgerald, S. (1999)).

MANAGING ROAD SAFETY PROGRAMMES FOR RESULTS – 105
TOWARDS ZERO: AMBITIOUS ROAD SAFETY TARGETS AND THE SAFE SYSTEM APPROACH - ISBN 978-92-821-0195-7 © OECD/ITF, 2008
REFERENCES
Bliss, T. (2004), “Implementing the Recommendations of the World Report on Road Traffic InjuryPrevention”, Transport Note No. TN-1, World Bank, Washington DC.
Bliss, T. and J. Breen (2008), Implementing the Recommendations of The World Report on Road TrafficInjury Prevention, Operational guidelines for the conduct of country road safety managementcapacity reviews and the related specification of lead agency reforms, investment strategies andsafety programs and projects, Global Road Safety Facility, World Bank, Washington DC.
Cameron, M., P. Vulcan, N. Haworth and S. Kent (1994), Advice to Assist Bid for Additional Funding inRoad Safety in New Zealand, Monash University Accident Research Centre, Melbourne.
Fitzgerald, S. (1999), A Case Study of the Victoria Road Safety Model in New Zealand. The EnforcementPerspective. MBA Programme, Leicester University, Leicester.
Hayes, H., M. Moloney and T. Lester (1996), Peer Group Review of Traffic Enforcement. Main Report.New Zealand Police, Wellington.
Haddon Jr., W. (1968), “The changing approach to the epidemiology, prevention, and amelioration oftrauma: the transition to approaches etiologically rather than descriptively”, American Journal ofPublic Health, 1968, 58:1431–1438. 33. Henderson M. Science and society
Koornstra, M. et al. (2002), SUNflower: a comparative study of the development of road safety inSweden, the United Kingdom, and the Netherlands, Leischendam, Dutch Institute for Road SafetyResearch, 2002.
Land Transport Safety Authority (2000), Road Safety Strategy 2010, A Consultation Document, NationalRoad Safety Committee, Land Transport Safety Authority, Wellington.
OECD (1994), Targeted Road Safety Programmes, OECD, Paris.
OECD (2002), What’s the Vision, OECD, Paris.
Rumar, K. (1999), Transport safety visions, targets and strategies: beyond 2000, 1st European TransportSafety Lecture, European Transport Safety Council, Brussels,http://www.etsc.be/documents/etsl1.pdf.
Committee of Inquiry into Road Traffic Responsibility (2000), “Shared Responsibility for Road Safety”SOU 2000:43 (English Summary), Swedish National Road Administration, Borlange, Sweden.
Tingvall, C., “The Vision Zero”, In: van Holst H, Nygren A, Thord R, eds (1995). Transportation, trafficsafety and health: the new mobility, Proceedings of the 1st International Conference, Gothenburg,Sweden Berlin, Springer-Verlag, 1995, pp35–57.

106 – MANAGING ROAD SAFETY PROGRAMMES FOR RESULTS
TOWARDS ZERO: AMBITIOUS ROAD SAFETY TARGETS AND THE SAFE SYSTEM APPROACH - ISBN 978-92-821-0195-7 © OECD/ITF, 2008
Trinca, G., I. Johnston, B. Campbell, F. Haight, P. Knight, M. Mackay, J. McLean and E. Petrucelli(1988), Reducing Traffic Injury: A Global Challenge, Royal Australasian College of Surgeons,1988, ISBN 0 909844 20 8.
Wegman F, Aarts L, and C. Bax (2008), “Advancing sustainable safety: National road safety outlook forThe Netherlands for 2005–2020”, pp 323-343, in Safety Science, Elsevier.
Wegman, F. and L. Aarts, Advancing Sustainable Safety, Leischendam, Dutch Institute for Road SafetyResearch, 2006.
Wegman, F. (2001), Transport safety performance indicators. Brussels, European Transport SafetyCouncil.
Wegman, F. and P. Elsenaar (1997), Sustainable solutions to improve road safety in the Netherlands,Leidschendam, Institute for Road Safety Research, 1997. (SWOV Report D – 097 – 8).
WHO (2004), World Report on Road Traffic Injury Prevention. Geneva, World Health Organisation,2004.

THE SAFE SYSTEM APPROACH – 107
TOWARDS ZERO: AMBITIOUS ROAD SAFETY TARGETS AND THE SAFE SYSTEM APPROACH - ISBN 978-92-821-0195-7 © OECD/ITF, 2008
5. THE SAFE SYSTEM APPROACH
ABSTRACT
A fundamental policy shift, characterised as the Safe System approach, is required both to consolidate the significant improvements in road safety in recent decades and to generate further gains in the future. This chapter describes how the Safe System approach can meet the expectation for continued road safety improvements and how it can re-frame the ways in which safety is viewed and managed. The chapter describes new ways to define road safety problems and identifies new groups of stakeholders to target and new methods of influence to improve performance. It also highlights opportunities for integration of road safety into other policy areas and draws conclusions on the safety benefits that can be expected from these approaches. Some guidance on steps towards implementing a safe system approach is provided in Annex C.
5.1. What is a Safe System approach?
5.1.1. The need for a fundamental shift in safety programmes
There has been a steady downward trend in road trauma in many OECD countries over the last three decades. This has occurred largely as a result of implementing road safety interventions to address specific, identified risks and problems. There have been significant improvements in the safety of the road network, in the crashworthiness of the vehicles using the roads and in the safety behaviours of road users. A range of these direct interventions and the opportunity they provide to reduce road trauma is addressed in Chapter 3.
There has been extensive research into the causes and prevention of road trauma, used also for evaluation and improvement of safety programmes. There have been significant coordination efforts in developing and implementing national and regional safety plans, and an increasingly sophisticated analysis of the road transport system.
Traditional road safety interventions, and the supporting management functions, have proven their effectiveness and need to be maintained and intensified. Nevertheless, many jurisdictions that have relied especially on behavioural campaigns are now aware that ‘business as usual’ may only be sufficient to maintain existing safety levels and is unlikely to generate significant improvements in the future. Diminishing cost-effectiveness is already factored into analyses in some countries: in New Zealand, the rate of social cost reduction for each additional dollar investment in enforcement and advertising programmes has been assumed to decrease from around 9:1 to 4:1 over the course of this decade.
For example, most countries achieving a safety belt wearing rate for all vehicle occupants around 97% would be pleased with that progress. However, within a safe system framework, managing a set of interventions that still leaves open the opportunity for fatality or serious injury is not enough. Pushing traditional approaches of educational campaigns and enforcement to close the gap would be difficult and face rapidly declining returns. It is therefore necessary to find non-traditional approaches to improving

108 – THE SAFE SYSTEM APPROACH
TOWARDS ZERO: AMBITIOUS ROAD SAFETY TARGETS AND THE SAFE SYSTEM APPROACH - ISBN 978-92-821-0195-7 © OECD/ITF, 2008
the rate of safety belt wearing to 100%. Similarly for driving while impaired by alcohol. In some countries up to 98% of all drivers and riders may not be impaired. However, it is necessary to achieve 100% because a disproportionate share of crashes involves impaired drivers. Means to address these and related challenges need to be found if a safe network is to be achieved and current and new technologies, such as seatbelt or alcohol ignition interlocks, are certain to be an important part of the solution.
A consensus is emerging across the OECD that a fundamental shift in road safety management to a Safe System approach is now required. The safest communities in the future will be those that embrace this shift and begin work now on the interventions required to close the gap between current performance and the performance associated with a genuinely safe road transport system.
5.1.2. Describing the Safe System approach
Several countries are currently using a Safe System approach in developing and implementing their road safety programmes. Sweden has developed a ‘Vision Zero’ approach, the Netherlands has developed a closely related ‘Sustainable Safety’ approach, and several jurisdictions in Australia are establishing similar programmes. While the specific details vary, Safe System approaches typically:
• Aim to develop a road transport system better able to accommodate human error. This is commonly achieved through better management of crash energy, so that no individual road user is exposed to crash forces likely to result in death or serious injury.
• Incorporate many strategies for better management of crash forces, with a key strategy being road network improvements in conjunction with posted speed limits, the latter set in response to the level of protection offered by the road infrastructure.
• Rely on strong economic analyses to understand the scale of the trauma problem, and direct investment into those programmes and locations where the greatest potential benefit to society exists.
• Are underpinned by comprehensive management and communication structures incorporating all key government agencies and other organisations which have a role in determining the safe functioning of the transport system.
• Align safety management decision making with broader societal decision making to meet economic goals and human and environmental health goals, and to create a commercial environment that generates demand for, and benefits the providers of, safe road transport products and services.
• Embrace the ethos of “shared responsibility” for road safety among the various actors of the road transport system, such that there is a shared vision amongst citizens, public, private and not for profit organisations regarding the ultimate safety ambition, and how to achieve it.
• Vision Zero is based on an ethical imperative to eliminate death and serious injury from the transport system. Sustainable Safety takes elimination of preventable accidents as the starting point and attaches greater weight to cost-effectiveness in determining interventions but argues that the utmost efforts must be made in building and maintaining road systems to ensure that future users, including in generations to come, are protected from harm.

THE SAFE SYSTEM APPROACH – 109
TOWARDS ZERO: AMBITIOUS ROAD SAFETY TARGETS AND THE SAFE SYSTEM APPROACH - ISBN 978-92-821-0195-7 © OECD/ITF, 2008
The changed view of road user responsibilities is a key feature of a Safe System approach. Sustainable Safety describes the road user as the weakest link in the transport chain, unpredictable and not to be relied upon to behave safely, education and information efforts notwithstanding (Wegman et al., 2005). Both Sustainable Safety and Vision Zero argue that for as long as inappropriate behaviours are likely, those individuals and organisations with system design responsibilities need to strive to protect all road users from the impact of those behaviours.
Another key feature is the recognition that simply introducing more and more intensive countermeasures is insufficient. A stronger ethos of “shared responsibility” amongst the many different parties that influence the safety of the road transport system is regarded as vital in both lifting society’s level of ambition in road safety performance, and mobilising the societal resources needed to achieve ambitious road safety targets.
5.1.3. The Safe System approach and societal values
Because road transport touches all parts of economic and social life, the Safe System approach must connect with, incorporate, and contribute to changing overarching societal values. Values in three areas require particular consideration when implementing a Safe System approach.
• The significance of economic development – without the necessary transport infrastructure to support production and service sectors in the economy, there would be a lessening of community wealth and individual income. This has tended to generate a dichotomous trade-off such that safety is regarded as subsidiary to mobility, rather than the other way round. The Safe System task is to reverse the safety/mobility balance, to turn mobility into a function of safety, by bringing system designers to accept responsibility for the safety of users of the road transport system, and explain the safety constraints within which users need to operate.
• Sustaining human and environmental health – there is increasing recognition, illustrated by stronger health and environmental lobbies, that maintaining community wealth and individual income cannot be achieved at any cost. Just as public health authorities demand that economic development cannot be at the cost of environmental degradation, so too can safety managers require that economic development not come at the cost of death or serious injury. The Safe System task is to communicate a safety vision and approach to the community which taps this growing value, seeks greater responses to the safety problem and gives safety discussions a firm public health perspective.
• The individual as consumer – there is a growing tension between the rights of individuals (and the limits to which the state can be seen to inhibit those rights) and a growing consumerist value (for example, motorist lobbies have long exercised commercial and corporate pressure to improve the safety of roads used by their members). The Safe System task is to recognise the limits to which individual behaviours can be regulated and to accelerate the extent to which communities both recognise the safe constraints of the system and demand safer products and services.

110 – THE SAFE SYSTEM APPROACH
TOWARDS ZERO: AMBITIOUS ROAD SAFETY TARGETS AND THE SAFE SYSTEM APPROACH - ISBN 978-92-821-0195-7 © OECD/ITF, 2008
Box 5.1. Leading the change to a Safe System
Sweden’s Vision Zero – Not just zero fatalities and zero serious injuries
Recognising that the road transport system is one of the most dangerous technical systems humanity has created, the elected members of the Swedish Parliament in Autumn 1997 adopted a new traffic safety policy, known as “Vision Zero”. This new policy expresses a new long term goal and is based on fourelements: ethics, responsibility, a philosophy of safety, and creating mechanisms for change.
Human life and health are paramount ethical considerations. According to Vision Zero, life and health should not be allowed to be traded off against the benefits of the road transport system, such as mobility. Rather than placing responsibility for crashes and injuries on the individual road user, Vision Zero responsibility is shared between the providers of the system and the road users. The road user remains responsible for following basic rules, such as obeying speed limits and not driving while under the influence of alcohol. The system designers and enforcers – such as those providing the road infrastructure, the car-making industry and the police – are responsible for the functioning of the system. In the event that road users make errors or even fail to follow the rules, the responsibility reverts to the system designers to ensure that these failings do not result in death or serious injuries.
Vision Zero philosophy
The Vision Zero philosophy is based on two premises – that human beings make errors, and that there is a critical limit beyond which survival and recovery from an injury are not possible. The safety philosophy recognises that a system that combines human beings with fast-moving, heavy machines will be very unstable, and a human tragedy can occur if a driver loses control for just a fraction of a second.
The road transport system should therefore be able to take account of human failings and absorb errors in such a way as to avoid deaths and serious injuries. Crashes and even minor injuries, on the other hand, need to be accepted. The chain of events that leads to a death or disability must be broken, and in a way that is sustainable, so that over the longer time period loss of health is eliminated. The limiting factor of this system is the human tolerance to mechanical force. The components of the road transport system – including road infrastructure, vehicles and systems of restraint – must therefore be designed in such a way that they are linked to each other. The amount of energy in the system must be kept below critical limits by ensuring that speed is restricted.
Driving mechanisms for change
While society as a whole benefits from a safe road transport system in economic terms, Vision Zero relates to the citizen as an individual and his or her right to survive in a complex system. It is therefore the demand from the citizen for survival and health that is the main driving force. In Vision Zero, the providers and enforcers of the road transport system are responsible to citizens and must guarantee their safety in the long term. In so doing, they are necessarily required to cooperate with each other, because simply looking after their own individual components will not produce a safe system.
Leading the change to a safe system in Sweden, with system designers being challenged to develop an error-proof system, has generated new initiatives and emphases. These include a strong focus on consumer-based vehicle crash protection, installing crash-protective central barriers on single-carriageway rural roads, encouraging local authorities to implement 30 km/h zones, wider use of speed camera technology and random breath testing, and the promotion of safety as a competitive variable in road transport contracts.

THE SAFE SYSTEM APPROACH – 111
TOWARDS ZERO: AMBITIOUS ROAD SAFETY TARGETS AND THE SAFE SYSTEM APPROACH - ISBN 978-92-821-0195-7 © OECD/ITF, 2008
One of the most notable new initiatives goes to the heart of road safety management – crash investigation. Alongside traditional investigations conducted by the Swedish Accident Investigation Board, and studies of all fatal crashes by staff of the Swedish National Road Administration, a new systematic collaboration has been established during which system designers work together to prevent a fatal accident from happening again. “OLA” (a Swedish acronym for Objective data, List of solutions, and Addressed action plans) brings together companies, authorities and organisations that can contribute to a safer road transport system. Together, they first review the facts relevant to the fatal crash, then identify feasible solutions that would prevent the crash from occurring again, and then each declare what it is they will do, as a matter of public record. A full range of parties are thereby jointly encouraged to take responsibility for improving the safety of the road transport system.
While Vision Zero does not say that the ambitions on road safety historically have been wrong, the actions that would have to be taken are partly different. The main differences probably can be found within how safety is being promoted; there are also some innovations that will come out as a result of the vision, especially in infrastructure and speed management.
A tool for all
Vision Zero is relevant to any country that aims to create a sustainable road transport system, and not just for the excessively ambitious or wealthy ones. Its basic principles can be applied to any type of road transport system, at any stage of development.
Source: Swedish Road Administration.
A Safe System approach implies a greater level of vision, together with a greater level of individual and societal commitment to safety in the road transport system. A safe system approach is one where citizens demand and expect safety improvements. This could be summed up in terms of “a stronger safety culture”. A strong safety culture is arguably one where the number and rate of serious injury and death are constantly dropping. A weak safety culture is arguably one where fatalities and serious injuries are maintained or increase over time, and where there is no publicly accepted push to remedy this situation and a sense of resignation that road casualties are unavoidable.
5.1.4. The ambition of the Safe System approach
The recognition that any level of serious trauma arising from the road transport system is ultimately unacceptable, and that the system should be designed to expect and accommodate human error, is relatively new in road safety. These views have long been held in other transport and infrastructure systems, such as air transport or the distribution of domestic electricity. In these environments elaborate protection strategies have been developed; the manager of the system responds to crashes and other incidents by making systemic improvements, and the leaders of the system expect a failsafe system and prioritise activity and resources accordingly.
It should be recognised that the safety principles at play in these industries reflect the relatively closed nature of the systems in which they operate. There are highly personalised accountabilities associated with a relatively limited number of participants and a relatively small set of interactions between those participants, with the focus on maintaining the safety of the system. In contrast, road transport is an almost entirely open system. Everyone participates, there are extraordinarily large numbers of human interactions, and the focus is on achieving a state of balance between mobility and the safety of the system (World Business Council for Sustainable Development, 2004).

112 – THE SAFE SYSTEM APPROACH
TOWARDS ZERO: AMBITIOUS ROAD SAFETY TARGETS AND THE SAFE SYSTEM APPROACH - ISBN 978-92-821-0195-7 © OECD/ITF, 2008
Achieving ambitious road safety targets first requires defining the desired level of ambition. The highest level of ambition is that which applies to other infrastructural services. The challenge of the Safe System approach is to apply ethical, public health, responsibility and integration perspectives that are apparent in relatively closed industrial systems to the relatively open road transport system, to achieve a transport system that is safe – at least in terms of avoiding deaths and disabling serious injuries.
5.2. Changing the context for developing interventions
The long term goal of no road deaths or serious injuries will necessarily require a fundamental change in how different organisations and communities are encouraged to take action to improve safety. It will also necessarily require a fundamental change in how the interaction between the road environment, travel speeds and vehicles is managed. These aspects of the changing context within which interventions are developed are addressed below.
5.2.1. The interaction between infrastructure, speed and physical vulnerability
The human body’s tolerance to physical force is at the centre of the Safe System approach. Figure 5.1 illustrates the fatality risk for a pedestrian-car crash, a side-impact crash between two cars, and a head-on or fixed object crash. A pedestrian hit by a vehicle travelling at 60km/h is almost certain to be killed, as is a motor vehicle occupant involved in a side-impact crash at 80km/h, and a motor vehicle occupant involved in a head-on or fixed object crash at 100km/h.
Figure 5.1. Fatality risk for three major crash types at different impact speeds
0
10
20
30
40
50
60
70
80
90
100
0 10 20 30 40 50 60 70 80 90 100 110 120 130
fata
lity
risk
%
Collision speed km/h
Pedestrrianor cyclist
Frontal orhard objectcollision
Sidecollision
Source: Wramborg, P. (2005).

THE SAFE SYSTEM APPROACH – 113
TOWARDS ZERO: AMBITIOUS ROAD SAFETY TARGETS AND THE SAFE SYSTEM APPROACH - ISBN 978-92-821-0195-7 © OECD/ITF, 2008
The implications for road authorities in designing safe road environments and setting safe speed limits are significant, and are fully recognised in the Netherlands where the Institute for Road Safety Research’s report Advancing Sustainable Safety (SWOV, 2008) sets out four safe speed thresholds (Table 5.1).
Table 5.1. Safe speed thresholds for different road types
Road types combined with allowed road usersSafe Speed
(km/h)Roads with possible conflicts between cars and unprotected users 30
Intersections with possible side-on conflicts between cars 50
Roads with possible frontal conflicts between cars 70
Roads with no likelihood of frontal or side-on conflicts between road users ≥100
Source: SWOV 2008.
The challenges are well illustrated by considering the design and management of urban intersections. Although intersecting roads that are speed limited at greater than 50 km/h will generally result in avoidable road trauma, many urban arterial roads run at faster speeds, often considerably faster. Traffic signals are critical traffic management tools, but are not failsafe, and there is a limit to which the safety of the intersection can be improved with red light camera enforcement. Many users drive through signalised intersections when they should not, whether knowingly or unknowingly, and significant numbers of fatalities and serious injuries consequently occur in urban centres. Crashes can still occur at roundabouts, but are likely to be much less severe, and other engineering based treatments are being developed. A Safe System approach to intersections is therefore to either reduce the speed limits on the intersecting roads, and/or re-engineer the intersection to encourage the driver to reduce speed or improve the interaction between vehicles. Either way, the goal is to make intersections safe for users to travel through without risk of death or serious injury.
Box 5.2. Leading the change to a Safe System
Australia’s Safe System – Illustrating the primacy of speed management
The foundation of Australia’s Safe System approach recognises that by managing entry and exit of vehicles and users to the system, supporting users with information and education, enforcing road rules, and building understanding of road crashes and risks, there is a lot that can be achieved in making road users alert and compliant. But the framework assumes that, no matter how alert and compliant they are, road users will still make mistakes. The key to safer travel is managing safety within three primary and connected sets of interventions:
• Safer roads and roadsides based on risk analysis of risk and crash-related safety performance of the road network.
• Safer speeds – whereby speed management is seen as a complementary measure to road-based improvements.
• Safer vehicles – especially through improved marketing of vehicles with high safety ratings.

114 – THE SAFE SYSTEM APPROACH
TOWARDS ZERO: AMBITIOUS ROAD SAFETY TARGETS AND THE SAFE SYSTEM APPROACH - ISBN 978-92-821-0195-7 © OECD/ITF, 2008
A le rt and c om pl ian t road us ers
S a fe r s pe e ds( l ow e r sp e e d s m o re
fo rg iv in g o f h u m a n e rro r )
H u m anto l era nc e
S afe rv e h ic le s
S a fe r ro a ds a ndr oa ds id e s
(m o r e f or giv in go f h u m a n e r ro r)
S afer trave l
A d m it t an c e tosyst e m
U n d er stan d in gc ra sh e s an d ri sk s
E d uc a ti o n andin fo rm a t ion
s u pp o rt in g ro a du s er s
E nforc e m e n to f r o ad ru l es
The point of connection between these three elements of the Safe System approach is the human tolerance to physical force – that is, the extent to which the interface between vehicles and roads and humans in any crash results in kinetic forces that go beyond the capability of the human body to withstand the impact. The key to this is safer speeds.
The Safe System approach has been agreed by the Australian Transport Council which comprises Federal, State and Territory Transport Ministers. Implementation is taking time, but transport authorities are becoming increasingly aware of their responsibilities and the opportunities they have to substantially lift the safety of the service they provide. Continued efforts are also required at a stakeholder and broader community level to promulgate the analysis and discuss the implications for their road safety efforts. The strongest progress to date has been perhaps with automobile clubs. To promote their member's primary safety interests, they have been leading the introduction of road and vehicle safety rating systems. As with the community as a whole, the club's membership can have some difficulty in applying safe system thinking to speed management issues, but increasingly their representatives are placing their discussion of these issues within the context of the overall challenge that the safe system approach implies.
5.2.2. The Safe System approach to responsibility
Traditionally, the task of the road safety manager has been to identify the risks confronting road users, to develop and gain agreement (from government and elsewhere) on the best set of countermeasures, and to inform people about the decisions that have been made. The responsibility for the safety of the road transport system and the focus for road safety efforts have been centred on the

THE SAFE SYSTEM APPROACH – 115
TOWARDS ZERO: AMBITIOUS ROAD SAFETY TARGETS AND THE SAFE SYSTEM APPROACH - ISBN 978-92-821-0195-7 © OECD/ITF, 2008
individual road user. This “hard” approach is built on rigorous analysis of the evidence and on the application and evaluation of known countermeasures – and as noted earlier, has met with considerable success: consider for example, the impact of legislation around the world targeting non-use of seat belts, drink-driving and speed legislation.
In the Safe System approach, it remains the case that the traditional designers of transport systems have primary responsibility for ensuring safe conditions for all road users by addressing three key factors – the road and roadside, the travel speed as influenced by speed limits, and the primary and secondary safety features of vehicles. However, the Safe System approach also stresses that there are many other “system designers” beyond the road and vehicle engineers that have an impact on use of the network and who also carry a major responsibility for developing safer, survivable crash outcomes.
The full range of system designers stretches from road builders and the police to companies operating heavy goods carriage: in short, all actors that professionally influence the design and functionality of the road transport system. This entails a more difficult, “soft” approach, requiring a new set of target groups. A critical precondition to a Safe System approach is an acceptance of the need for change from:
• Community leaders and elected representatives who make decisions and set strategies and expected road safety performance.
• Government agencies that implement the strategy and facilitate achievement of the expected performance.
• Corporate participants in the road transport system who deliver safe services and products.
• Professional bodies that set expectations for how different professional groupings, such as engineers or educators, approach the safety task.
• User groups and lobbies that frame and re-interpret the problems that their constituents face for decision makers.
This is a fundamental shift away from placing almost sole responsibility on the road user, to also requiring system designers/providers to provide an intrinsically safe environment. It raises the question of how the performance of the system designers is to be monitored and improved over time. In some countries all fatal accidental deaths, including road deaths, are investigated under a court system to determine what can be learnt to reduce future risks. The strengthening of these systems and – in other countries – the possible establishment of independent inspectorates of traffic crash risks (as planned in Sweden) is a potential means of achieving independent performance monitoring. This will be a substantial challenge to public and private organisations in many countries, and will generate some concerns about potential civil liability claims, but should be viewed as a positive opportunity for system improvement.
If new target groups are to change their attitudes, values and behaviours in making the road transport system safer, a change is also required in engaging and communicating with these groups. Some principles are set out below:
• Given the level of change implied by a Safe System approach, a vision-led approach is required. It is not necessary to specify all the actions required to implement a Safe System approach, but it is necessary to reach a common understanding of what is to be achieved.

116 – THE SAFE SYSTEM APPROACH
TOWARDS ZERO: AMBITIOUS ROAD SAFETY TARGETS AND THE SAFE SYSTEM APPROACH - ISBN 978-92-821-0195-7 © OECD/ITF, 2008
• Open engagement and debate over what a Safe System might look like should be encouraged. Identifying the gold standards in road, vehicle and behavioural factors (and the interaction of these factors) is required to prevent short-term decisions getting in the way of longer-term improvements.
• Early and voluntary agreement on actions by each group of system designers is necessary to build upon a basic vision, and can at times be preferable to legislating for specific actions or standards.
• Greater use of incentives is required to generate voluntary change amongst system designers, particularly in the use of market or consumer-led mechanisms that lead system designers to better consider the intrinsic value of their safety actions.
These principles can be illustrated by considering vehicle safety. Notwithstanding stronger governmental regulation, the most notable change in improving vehicle safety has been the independent crash testing of vehicles and the subsequent publication of safety information on different vehicles for consumers. More needs to be done to, for example, promote car fronts that are less aggressive to the most vulnerable road users. However, in many instances, regulators are now acting in ‘catch-up mode’ following commercial decisions made by manufacturers to install ever-better safety features – with manufacturers’ decisions having been at least partly led by consumer demand for better protection.
The responsibility for vehicle safety innovation should not lie entirely with consumers. Vehicle manufacturers can be encouraged to take greater responsibility for investing in safety research and development and for subsequently installing new technologies. Fleet managers can be encouraged to purchase safer vehicles to ensure that the clearly identifiable occupational safety and health risks associated with road transport are mitigated to the greatest possible extent. Government leadership in this area is critical, both for reducing the occupational risks of government employees and for stimulating demand for new safety technologies. Public policies, for example requiring certain vehicle safety features to be provided in new vehicles in order for them to be registered for use, or providing financial/tax incentives for consumers who buy vehicles with certain safety technologies, can help change fleet safety levels substantially, and support market demand for safe vehicles.
5.2.3. The Safe System approach to the road environment
A Safe System approach places particular importance on the interaction between the road environment and permissible travel speeds. While the specific steps vary from system to system, the Netherlands’ Sustainable Safety represents one of the most comprehensive approaches to improving the safety of the road environment, outlined in Box 5.3.

THE SAFE SYSTEM APPROACH – 117
TOWARDS ZERO: AMBITIOUS ROAD SAFETY TARGETS AND THE SAFE SYSTEM APPROACH - ISBN 978-92-821-0195-7 © OECD/ITF, 2008
Box 5.3. Leading the Change to a Safe System
The Netherlands’s Sustainable Safety – Systemic change within the road environment
The Sustainable Safety vision is to prevent road crashes and, if this is not possible, to minimise death and serious injury from crashes. The broad strategy to achieve this starts with a thorough study of the crash circumstances leading to death or serious injury. The next stage involves two options: either changing the circumstances to minimise crash risk; or if this is not feasible, changing the circumstances to minimise the risk of death or serious injury. The ethical impetus behind Sustainable Safety is to avoid handing over to the next generation a traffic system which continues to produce the current casualty levels.
It is possible to achieve an intrinsically safe road traffic system by tailoring the environment (and especially the road) to human limitations and assisting the road user to perform traffic tasks. For this, it is necessary to make the traffic system as independent as possible from individual road user errors. The Sustainable Safety vision is a shift from a reactive approach to a general proactive approach which seeks to integrate man, vehicle and road into a safe system. This requires the infrastructure to be designed to meet human capacities and limitations and the vehicle to support the execution of traffic tasks and provide protection in the event of a crash. It also requires the road user to be well informed and willing to correctly execute the traffic task.
People are the measure of all things
Human capacities and limitations are the guiding factors underpinning Sustainable Safety. People, even if highly motivated to behave safely while using the road, will make unintentional errors and will not always be able to perform to the highest standards of safety. Others are not always willing to comply with rules, which may result in crashes injuring other people as well as themselves. Given that people make suboptimal and even risky choices, it is important in creating a safe road traffic system to design the environment so that that such behaviour cannot lead to crashes or, if this is impossible, do not cause serious injury.
Road users have to be well informed and trained to participate in traffic. It is essential that road users are aware of their potential risk, and consequently develop and use safe behaviours to prevent a crash. Since there are differences in road user capabilities, more experienced road users are encouraged to engage consciously in safe traffic behaviour to protect against less experienced or incompetent drivers. A forgiving driving style can assist in preventing crashes caused by other road users as part of a safe social system.
Reducing latent errors in the traffic system
Crashes are almost always the result of a chain of events rather than a single dangerous action by a road user. The deficiencies in the design and operation of components of the traffic system which contribute to a crash are called “latent errors”. Ultimately, crashes occur if latent errors in the traffic system and dangerous actions coincide in time and place. Because road traffic is characterised by a great many latent errors, particularly compared with other transport modes, current road traffic has to be considered intrinsically dangerous.
Since dangerous actions can never be completely avoided, the Sustainable Safety vision strives to remove latent errors from traffic: the traffic system has to be forgiving to dangerous actions by road users so that these cannot lead to crashes.

118 – THE SAFE SYSTEM APPROACH
TOWARDS ZERO: AMBITIOUS ROAD SAFETY TARGETS AND THE SAFE SYSTEM APPROACH - ISBN 978-92-821-0195-7 © OECD/ITF, 2008
Taking into account physical vulnerability
Human beings are physically vulnerable in impacts with comparatively big masses, hard materials and large decelerations acting on the human body. Accordingly, human physical characteristics need central consideration when creating sustainable safe road traffic.
The human body's vulnerability (its biomechanical tolerance) and the important influence of speed on crash severity (determining the degree of local force and deceleration acting on the body) is the starting point for a safe travel speed concept in Sustainable Safety. Protective vehicles also have a role to play: if enough of the forces released in a crash can be absorbed by the vehicle (perhaps by use of seat belts and airbags), higher crash and travel speeds can be permitted.
Sustainable Safety and the road environment
Because people make errors, do not always comply with rules and are physically vulnerable, it is essential that latent errors (or gaps) in the traffic system are removed. According to the Sustainable Safety vision, in order to prevent serious unintentional errors, the environment and the tasks associated with road use have to be adapted to promote safe behaviour: the road user needs to know what to expect and possible errors need to be absorbed by a forgiving environment. This strategy also lessens the impact of any intentional or unintentional road use violations. Insofar as unsafe behaviour prior to using the road can be detected – such as alcohol consumption or not having a driving licence – denying access to the road is also part of Sustainable Safety.
The vulnerable human has to be protected in traffic by means of environmental structures that absorb the kinetic energy released in the event of a crash. To this end, the mass of different vehicles sharing the same space needs to be compatible. If this is not possible, then speeds need to be lowered to mitigate the effects of different masses in the event of a collision. In this context, Sustainable Safety places particular importance on the road environment by identifying five key elements in the safe design and management of the road environment:
• Functionality – that the actual use of the road matches the intended use as either a through road, a distributor road or an access road.
• Homogeneity – that significant differences in speeds, driving directions and vehicle mass are avoided and different traffic types are segregated, or the speed differential is reduced.
• Predictability – that users can predict the characteristics of the road they are using, particularly in complex situations.
• Forgiving – that when something goes wrong and a crash occurs, roadway obstacles are shielded or “soft”, thus preventing severe injury or death.
• Status recognition – helping road users to be able to assess their competence to use the road and preventing unfit road users from exposure to situations they cannot cope with.
For example, a main arterial road has the primary function of facilitating the efficient movement of people and goods in inter- and intra-urban travel. It is designed to avoid car-to-car conflicts by separating opposing (head-on or from the side) streams of traffic, unless speed is reduced to a level that any crash cannot cause serious injury. Away from merging traffic zones it may have a reasonably high speed of,

THE SAFE SYSTEM APPROACH – 119
TOWARDS ZERO: AMBITIOUS ROAD SAFETY TARGETS AND THE SAFE SYSTEM APPROACH - ISBN 978-92-821-0195-7 © OECD/ITF, 2008
say, 70 km/h or more. By contrast, an urban access road facilitates both motorised and non-motorised movement within neighbourhoods, accepts a mix of traffic and non-motorised road users who directly access residential and other properties and has a much lower speed limit (in principle, no more than 30 km/h).
A Safe System analysis of a safe road environment and its risk factors is not restricted to the safety of the physical road infrastructure in conjunction with permissible travel speeds, but includes the match with surrounding land-use. Similarly, the safety of road users is determined not just by the safety of the different vehicles that are being used nearby, but also by the road environment in which they are used. Risk factors are also not restricted to particular user behaviours, but include the individual and corporate travel decisions and route choices users make prior to using the road.
To obtain a network wide picture of risk, many road authorities use some form of risk based assessment and produce rankings of sections of the network. Some authorities have moved to produce network wide assessments of treatment options prioritised by cost effectiveness. An example of how this has been undertaken in Victoria, Australia, is set out in Box 5.4.
Developing innovative road treatment approaches by road authorities and introducing sufficient scale of works to drive cost efficiencies are, together, highly important if opportunities to implement infrastructure related improvements are to be realised. The capacity of road authorities to implement innovative, cost effective treatments will vary, but all road authorities need to move in this direction. Some potential infrastructure related responses for a range of crash types are shown in Box 5.5.
Improving the safety of the road environment can only be considered in conjunction with permissible travel – and in the event of a crash – impact speeds. Safe road/speed interaction therefore has as its basis, the physical vulnerability of the human body.
Box 5.4. Mapping infrastructural treatment options
Forward thinking road authorities will develop quite detailed risk assessment mapping, using approaches such as those applied in iRAP for specific crash types across their network. They can then use this as a basis for calculating and mapping various treatment options known to be cost effective in reducing the risk of injury for those crash types. The development of system wide intervention opportunities based on system wide assessment of casualty crash risk is a critical characteristic of a safe system approach. The network links where one or more options could be most advantageously applied can then be selected and more detailed risk analysis carried out if needed (for example, to determine locations for barrier installation to shield roadside objects). Below is an example of the mapping of cost effective treatment types for the rural road network in Victoria, Australia, by VicRoads, the road authority.
While always advisable to prioritise treatment options by benefit cost ratio and location, the application of Safe System thinking will encourage treatment to the maximum extent possible to improve the overall level of safety in the system, while achieving a benefit cost ratio of at least 1:1 to 1.5:1 for the length treated. This mapping enables a network wide picture of potential treatments, which will reduce crash risk for a certain crash type, to be obtained.

120 – THE SAFE SYSTEM APPROACH
TOWARDS ZERO: AMBITIOUS ROAD SAFETY TARGETS AND THE SAFE SYSTEM APPROACH - ISBN 978-92-821-0195-7 © OECD/ITF, 2008
Figure 5.2. Mapping of cost effective treatment types for the rural road network in Victoria
Country Victoria - Non Urban "C" RoadsLengths of Road Meeting Minimum Run off Road Crash Rate for Treatment
VicRoads Regions
MABC Roads Run off Road Crash Rates (per vkt)Above MeanAbove Mean but <3 crashesAbove Mean but <2 crashesBelow MeanNo Volume Available
C Roads Run off Road BlacklengthsBlacklength >=.06cc/km/yrNot a blacklength
C Roads Run off Road Treatments where BCR>=3Painted EdgelineTactile EdgelineShoulder Sealing (TE)Wire Rope Safety BarrierLow Crash Rate
V ic R o a d s R e g io n s
M A B C R o a d s R u n o f f R o a d C ra s h R a t e s (p e r v k t)A b o v e M e a nA b o v e M e a n b u t < 3 c ra s h e sA b o v e M e a n b u t < 2 c ra s h e sB e lo w M e a nN o V o lu m e A v a i la b le
C R o a d s R u n o f f R o a d B la c k le n g t h sB la c k le n g t h > = .0 6 c c /k m /y rN o t a b la c k le n g th
C R o a d s R u n o f f R o a d T re a tm e n ts w h e re B C R > = 3P a in te d E d g e l in eT a c t i le E d g e lin eS h o u ld e r S e a l in g ( T E )W ir e R o p e S a f e ty B a r r ie rL o w C ra s h R a t e

THE SAFE SYSTEM APPROACH – 121
TOWARDS ZERO: AMBITIOUS ROAD SAFETY TARGETS AND THE SAFE SYSTEM APPROACH - ISBN 978-92-821-0195-7 © OECD/ITF, 2008
Box 5.5. Targeting specific crash types based on safe system thinking
The main crash types that a Safe System approach needs to address are usually pedestrian crashes, crashes at intersection, run-off-road crashes and head-on crashes.
Pedestrian fatal and serious injury crashesTo minimise the likelihood of fatal outcomes from any vehicle-pedestrian crash, impact speed should not
exceed 30km/h. Intervention options which could assist in achieving fatality reductions include:
• Separating pedestrians and vehicles physically by fencing or other barriers.
• Lowering the travel speeds of vehicles by reducing and enforcing speed limits at or below 30km/h.
• Providing adequate traffic light controlled road crossings in areas of high pedestrian activity in order to encourage pedestrian use of these crossings and their compliance with the signals.
• Promoting pedestrian-friendly vehicle design.
Fatal and serious injury crashes at intersectionsBased on Safe System principles, the impact speed in a side impact crash should not exceed 50 km/h.
Opportunities to reduce impact speeds include:
• Lowering speed limits, especially in the vicinity of intersections on 60, 70 km/h and 80 km/h arterials.
• Improving intersection controls with roundabouts, traffic signals, platforms or other treatments.
• Applying skid resistance pavement treatments to improve braking performance.
• Modifying traffic signals to allow fully controlled turning movements, albeit at the cost of reduced intersection throughput.
Fatal and serious injury run-off-road crashesThese can be reduced by ensuring that roads include some of the following features:
• Wide paved shoulders.
• Tactile edge lining.
• Clear roadsides for 10 to 15 metres or roadsides with objects shielded by flexible barriers.
• Lower speed limits to provide more recovery time.
Requiring that new vehicles are fitted with electronic stability control (to reduce skidding out of control sideways into road side objects) will also help.
Fatal and serious injury head on crashesThese can be addressed by:
• Lowering speed limits on two lane two way roads to 70km/h or less.
• Constructing a divided carriageway.
• Installing a centre median between the two opposing lanes of traffic.
• Safe speeds in general.
An efficient transport system is a vital component of economic well being. Investment in principal routes to ensure they can be utilised safely at speeds of 90 to 100 km/h is most often a priority in all countries. There will be many other roads where investment is not likely to occur for many years, which have a high crash risk, and where a reduction in speed limits would provide the basis for safer travel. To the extent that these roads cater for lower traffic volumes, little freight movement, and do not cater for longer journeys, a convincing case for lower limits can be made.

122 – THE SAFE SYSTEM APPROACH
TOWARDS ZERO: AMBITIOUS ROAD SAFETY TARGETS AND THE SAFE SYSTEM APPROACH - ISBN 978-92-821-0195-7 © OECD/ITF, 2008
5.2.4. The increasing importance of vehicle safety technologies
There have been remarkable developments in vehicle safety over the last decade, particularly in passive, or secondary safety features that improve injury outcomes in the event of a crash (OECD, 2003). Rollout of these technologies (including, for example, stability control, head protecting curtain air bags, and whiplash protection) is, however, unevenly distributed. Many vehicle safety features such as side curtain air bags and electronic stability control, now commonly available in Western Europe and North America, are available only on a limited range of vehicle models supplied in some ITF member countries. Rather than making safety features standard in the range, or even bundling them as a safety option, many suppliers offer safety features bundled with non-safety items, making their additional cost prohibitive.
As a matter of international corporate policy, manufacturers and importers need to be encouraged to give greater priority to the provision of available and emerging safety features. Options open to national governments to progress vehicle safety improvement more rapidly include:
• Developing community information programmes promoting the importance of vehicle safety, and the information available through new car testing programmes, and used car safety ratings.
• Leading consumer demand for safer vehicles by requiring best practice safety features on vehicles.
• Encouraging fleet operator commitment, perhaps through tax incentives.
• Working with vehicle suppliers to improve vehicle safety standards.
• Eliminating inappropriate vehicle advertising.
The recent statement by Volvo that “Our vision is to design cars that should not crash and by 2020no one will be killed or injured in a Volvo” has the potential to shift the ground further towards safety. It is to be hoped that such a clear expression of corporate value in the inherent safety of its product translates into a more competitive market for safety, which would likely result in benefits to individual consumers, and society as a whole. It is also a clear signal to road safety managers about the shift in the scope and sophistication of the technologies becoming available for use by the vehicle industry.
An extensive range of active, or primary, safety features that reduce the risk of a crash occurring are now coming onto the market, and will be a major trend in 2008 and beyond. These crash avoidance technologies will include vehicle to vehicle communications, vehicle to driver interactions (to assist behavioural compliance in areas including for example, drink driving, speeding and drug use) and vehicle to road and roadside infrastructure technologies. The United States Department of Transport provides a comprehensive internet summary1 of emerging technologies in this area addressed by the Federal Intelligent Transportation Systems (ITS) program under the headings of Intelligent Infrastructure and Intelligent Vehicles. Specific relevant sub categories include the following:
Intelligent Infrastructure includes:
• Crash prevention and safety: Road geometry warning systems for curves and hazardous locations, highway rail crossing systems, intersection collision warning systems using sensors to monitor traffic approaching dangerous intersections and warn vehicles of approaching cross traffic, pedestrian safety systems automatically activating in-pavement lighting to alert drivers as pedestrians enter crosswalks, and animal warning systems using detection technologies to identify large animals approaching the roadway and alert drivers by activating warning signs.
THE SAFE SYSTEM APPROACH – 123
TOWARDS ZERO: AMBITIOUS ROAD SAFETY TARGETS AND THE SAFE SYSTEM APPROACH - ISBN 978-92-821-0195-7 © OECD/ITF, 2008
• Commercial vehicle operations: safety assurance allowing enforcement personnel at check stations to confirm regulatory compliance data and crosscheck safety assurance information through electronic screening as trucks approach (for carriers that equip their fleets with low-cost in-vehicle transponders), and on-board monitoring of cargo technologies can alert drivers and carriers of potentially unsafe load conditions.
• Arterial management systems, utilising traffic surveillance and detection technologies, such as sensors or cameras to monitor traffic flow, traffic control technologies including sophisticated traffic signalling systems, lane management systems, information dissemination arrangements and enforcement.
• Freeway Management systems, which are similar to arterial management systems except that traffic signal control is limited to ramp metering and closure control and to priority access arrangements.
• Roadway Operations and Maintenance activities, including information dissemination, asset management and work zone management.
Intelligent Vehicles includes:
• Driver assistance systems, including navigation/route guidance, driver communication, vision enhancement, object detection, adaptive cruise control, intelligent speed control, lane keeping assistance, roll stability control, drowsy driver warning system, precision docking, coupling/ decoupling, on-board monitoring.
• Collision Avoidance systems, including intersection collision warning, obstacle detection, lane change assistance, lane departure warning, rollover warning, road departure warning, forward collision warning and rear impact warning.
• Collision Notification systems: advanced collision notification systems using in-vehicle crash sensors, GPS technology, and wireless communications systems to supply public/private call centres with crash location information.
Vehicle technologies will continue to develop. This is likely to occur at a more rapid pace than previously. There is a need for road authorities to work to understand these emerging vehicle technologies, particularly the primary safety features now becoming available, and work to adjust the road system with supportive features to maximise the effectiveness of the new crash avoidance technologies. There are also some potential threats to safe travel if some of the new emerging ITS technologies are applied (for example texting traffic flow advisory information to drivers’ phones) without consideration of safety impacts. The OECD study (OECD, 2003) highlights the need to pay attention to unregulated proliferation of technologies that could distract the driver or otherwise worsen road safety. The scale of opportunity means it is important that public road authorities begin to engage with manufacturers now to bring a number of potentially beneficial measures to market as rapidly as possible.
5.3 Implementing a safe system approach
The Safe System approach builds on existing knowledge about the identification of specific road safety risks and available countermeasures, and pushes the analysis of these issues to a greater level of systemic thinking. In a Safe System approach, road safety problems are typically treated by considering

124 – THE SAFE SYSTEM APPROACH
TOWARDS ZERO: AMBITIOUS ROAD SAFETY TARGETS AND THE SAFE SYSTEM APPROACH - ISBN 978-92-821-0195-7 © OECD/ITF, 2008
the interaction of several components of the transport system, rather than by implementing individual countermeasures in relative isolation. This strategy assumes the development of high levels of local and national coordination. Perhaps most importantly, this approach addresses prevailing attitudes and cultural influences on safety behaviour amongst all the designers and users of the road transport system, and makes connections between safety issues and wider transport and societal issues. This section addresses each of these aspects.
5.3.1 Developing a co-ordinated response
Effective road safety strategies are heavily dependent in the first instance on establishing an effective co-ordinating mechanism through which the various actors can exchange information, align organisational and sectoral strategies, and cooperate as necessary on implementing effective interventions (Howard, 2004). In many jurisdictions, this takes the form of a grouping of government agencies that span the following functions:
• Strategy/policy, analysis, and monitoring.
• Education, information and promotion.
• Road funding and highway management.
• Vehicle regulation and management.
• Transport management.
• User licensing and general traffic enforcement.
• Injury treatment and rehabilitation.
These functions are inevitably dispersed across a range of transport, justice and health agencies. While road safety leadership needs to be assumed by one agency, responsibility for road safety also needs to be widely shared, with regular coordination of activity to enhance the safe functioning of the human, vehicle and environmental aspects of the transport system. A central grouping of these agencies is required to support political engagement and direction on road safety. It is also required to support action by local government (which usually involves responsibility for local road networks) and community actors, and to provide or identify leadership opportunities for those actors.
A critical issue in implementing a Safe System approach is to extend basic coordination mechanisms to a more widespread engagement of profit and not-for-profit organisations, and to develop the safety consciousness of the general public. The purpose of this extended engagement is to move from the communication of specific behavioural changes to the realm where safety principles are evident in everyday professional and personal life.
Ongoing engagement processes need to be established so that communities do not just hear from the safety manager when new interventions have been developed and a specific change is sought. Rather, there is the need to build and monitor understanding of safety risks and analyses within communities, to build and maintain understanding of community issues affecting road safety and to promote positive community responses to interventions led by safety managers.
Ideally, a social compact is developed that voluntarily brings different government and non-government actors together in a shared understanding about what level of safety is being sought, and how that will be achieved. Rather than undertaking limited consultation to test the strength of support or
THE SAFE SYSTEM APPROACH – 125
TOWARDS ZERO: AMBITIOUS ROAD SAFETY TARGETS AND THE SAFE SYSTEM APPROACH - ISBN 978-92-821-0195-7 © OECD/ITF, 2008
opposition to specific interventions, a safety manager applying a Safe System approach is more likely to take the following practical steps to generate greater community support for a safety culture:
• Identify the group of critical issues that need to be addressed – for example, young and novice drivers, safety engineering, speed management.
• Develop compelling information relating to the scale and significance of the issue, and ways in which other jurisdictions have addressed it.
• Bring a wide range of private and public interest groups and citizens together to:
− discuss, verify, or modify the nature of the issue being addressed, and the relevance of the information provided;
− discuss, verify, or modify the best responses that could be made to the issue;
− develop contributions that those private and public interest groups and citizens can make to address the issue.
• Develop options for interventions that are likely to prove effective in addressing the issue, taking into account the views that have been discussed.
This strategy assumes that the community is most likely to make a positive change, or otherwise accept actions leading toward solution, once it accepts that the underlying issue is significant. At the same time, it recognises that promoting a particular intervention can assist in forming community views, with additional engagement being necessary if the intervention is to continue to be supported.
A corollary to a greater acceptance of community views must be that the Safe System safety manager presents issues in a way that clearly identifies significant avoidable risks of death or serious injury. Expectations need to be set around the highest levels of social or individual behaviour, in a way that increases the chances of the safety agenda moving from voluntary adoption through to societal norm.
5.3.2. Integrating road safety with other transport and wider societal goals
The Safe System manager is prepared to step into environments where safety analyses and targets may be challenged by and challenge other aspects of social and economic life. Integrating safety management with other transport goals is an important first step. Rather than focusing solely on road safety, the safety manager needs to look more broadly at improving the quality of people’s interaction with the transport system. The starting point is to meet the need for people and goods to move so that the destination is reached at the scheduled time, and in a manner that does not cause serious damage to the environment or harm to people.
Economic costs for firms can be reduced through a safety culture that minimises road crashes and the disruption to distribution (and production) they cause (Murray et al., 2003).
Given the dominant impact of the road transport system on land use, long term improvements in safety are intrinsically aligned with better organised urban environments, where there is a clear road hierarchy that facilitates inter-urban traffic flow and meets intra-urban social and environmental needs. Ensuring a better match between urban facilities and the needs of different population groups should mean fewer safety conflicts.
Beyond the substantial direct public health benefits that safety programmes provide, it is also important to recognise the synergy with other public health issues, for example by supporting strategies

126 – THE SAFE SYSTEM APPROACH
TOWARDS ZERO: AMBITIOUS ROAD SAFETY TARGETS AND THE SAFE SYSTEM APPROACH - ISBN 978-92-821-0195-7 © OECD/ITF, 2008
to combat obesity that promote safe walking and cycling, and by safely accommodating ageing populations within the road transport system. The synergies with environmental progress are also significant, with potential to integrate safety and environmental progress across a range of elements from speed management through to vehicle technology.
Synergies between road safety objectives and environmental protection in particular should be promoted. The single greatest connection between human and environmental health in the road transport system lies in speed management. On roads without separation of opposing traffic lanes, substantially lower travel speeds are critical to reducing road trauma, and have a major beneficial impact on fuel consumption and the emission of greenhouse gases. In urban road environments, lower travel speeds are critical in creating environments that are conducive to the safe movement of pedestrians and cyclists, and the choice of non-motorised, or public transport to shops, schools and recreational facilities. In this way, safer urban road environments support better environmental and health outcomes, promoting walking and cycling and reducing noise as a result of lower traffic speeds. Potential exists in generating even wider societal benefits by encouraging people back into public space that has previously been dominated by the perceived value of more motorised vehicles, travelling faster.
Box 5.6. Speed Management, Environment, Safety and Congestion
Lowering of Speed Limits in the Randstad
Persistent air pollution problems in the Randstad (an agglomeration in the Western part of the Netherlands), particularly from NOx emissions, led the Dutch Government to experiment with reduced speeds on motorways in this densely populated part of the country.
In 2002, an 80 km/h zone was introduced on the A13, a motorway between The Hague and Rotterdam. The speed limit was reduced from 100 km/h to 80 km/h and strictly enforced by section control. This pilot project recorded a decrease of 4-6% in NO2 concentrations in the air, and a reduction of 10–14% for the contribution from traffic. The reduction in NOx emissions was about 13%. The speed reduction resulted in a decrease of more than 50% in injury accidents and had a positive effect on the traffic flow.
After this successful experiment it was decided to extend the number of 80 km/h zones to nine other locations on the Dutch motorways in the Randstad, at locations where, based on expected future traffic flows, air quality would not be able to comply with the requirements for 2010 under the EU air quality directive. Ex ante research on the consequences of introduction of an 80 km/h speed limit at these locations for the period 2010-2015 suggests promising reductions in emissions and positive effects on traffic safety and noise.
Source: Van Beek et al., 2007.
Safety managers may also need to work towards reducing car dependency and towards increasing the use of effective public transport systems. Public transport systems are significantly safer than individual transport options, and have the potential to carry significantly greater volumes of people. There may also be safety benefits from better individual or community decision making that matches transport need with transport service options in a way that reduces overall demand.
Safety philosophies must also be compatible with the overall functioning of societies. It is important that safety is managed in an integrated rather than insular manner. For example, a consideration of

THE SAFE SYSTEM APPROACH – 127
TOWARDS ZERO: AMBITIOUS ROAD SAFETY TARGETS AND THE SAFE SYSTEM APPROACH - ISBN 978-92-821-0195-7 © OECD/ITF, 2008
transport-specific tasks can be meaningfully extended into the area of occupational safety and health, where roads and streets form part of the workplace of many employees (professional drivers, home-help and home-nursing personnel, security staff and salespersons and so on). It has been estimated that between 20 and 30 percent of all work-related fatalities occur on the roads (Driscoll et al., 2001; Royal Society for the Prevention of Accidents, 2002), with employers commonly sharing the responsibility for minimising the risks of injuries for work-related travel at work – as well as covering any subsequent injury insurance costs. Road safety managers can approach this issue in a way that supports occupational safety and health initiatives and seeks to increase the purchase of safer fleet vehicles and the adherence to safety principles by employees.
As other examples, the mental pressures building from the continuous quest for workplace efficiencies, together with a rise in complexity of personal/family situations, represent issues that have identifiable implications when using the roads. It has been argued that these social pressures are already being felt through the impact of fatigue or distraction on drivers. Recognising emotional and mental stress external to the task of using the road transport system may therefore have positive repercussions for road safety.
Ageing populations pose new problems and opportunities. Greater fragility may tend to increase the injury impact of crashes, but greater wealth in a larger older population may result in greater political power for this group of road users to improve their safety through, for example, introducing traffic calming in their residential areas. While the core task of the safety manager is to improve the safety of the road transport system rather than solve seemingly intractable problems elsewhere, the safety manager who is alert to issues outside the day-to-day functionality of the transport system is in a better position to reframe and build support for safety issues.
5.4. Measuring and projecting performance improvement
The Safe System approach requires considerable attention to be paid to the development and management of performance indicators, and the re-orientation of these indicators to the systems and interventions that are going to create the greatest safety value. It may be that a change in performance indicators towards a greater focus on systemic interventions will coincide with slower safety outcome progress in the short-to-medium term, but the more systemic approach is likely to provide stronger returns in the long term.
5.4.1 Measuring performance
Within a safe system approach there is a need to switch from injury based data (final outcomes) to performance data (intermediate outcomes). Some countries such as Sweden have already started to develop systems which give them an opportunity to address road safety problems within the road transport system without needing to wait to measure final outcomes in terms of fatalities and injuries. Focusing on this intermediate data and its measurement builds awareness that, for a safe system, 100% achievement of safety performance in various sub–target areas is required.
Considerable effort has been made in different countries and through different international collaborations (for example IRTAD, the SUNFlower report, and the European Road Safety Observatory) to establish and report meaningful indicators that can be used to monitor overall system performance. There is a lot of opportunity for jurisdictions at different levels of performance to refine their key indicators and better use these to promote delivery of safer services by key system designers. However, work on performance indicators under a Safe System approach demands even stronger commitment to ongoing monitoring and evaluation of different interventions.

128 – THE SAFE SYSTEM APPROACH
TOWARDS ZERO: AMBITIOUS ROAD SAFETY TARGETS AND THE SAFE SYSTEM APPROACH - ISBN 978-92-821-0195-7 © OECD/ITF, 2008
Moreover, it is critical that performance indicators are relevant to the different approach to infrastructure, or speed, or vehicle interventions raised earlier in this chapter if those interventions are to be successful. This includes areas of road safety intermediate performance that are not usually measured. The priority parameters will need to be identified, monitored and reported to encourage ongoing action to rollout associated interventions. For example, in order to avoid head on fatalities it is necessary to achieve 100% separation of traffic streams in opposing directions wherever travel speeds (speed limits and enforcement efficacy are both relevant here) are in excess of 70 km/h. The extent of the network which falls within those safety parameters needs to be known and monitored.
Other areas requiring investigation in terms of performance indicators might include the proportion of the road network assessed to fit within a safe speed analysis, or the proportion of the new vehicle fleet that provides the latest crash avoidance and user protection technology, or in the longer term the proportion of the road transport system that is managed by electronic connections between the vehicle and the road.
Examples of safety performance indicators centred on achieving a safe system are to be found in Norway’s targets for its future strategy (see Chapter 1, Box 1.2) and in Sweden’s strategy for the period 1996 to 2007.
Performance indicators for Sweden’s 50% fatality reduction target were as follows:
• Increasing the proportion of traffic on busy state roads protected from serious head-on and single vehicle accidents from 10% to 90%.
• Reducing travel speed by 6 kph on the state road network (excluding roads that are protected from serious head-on and single vehicle accidents).
• Increasing seatbelt use to 91%.
• Reducing the proportion of drivers under the influence of alcohol involved in fatal accidents from 28% to 17%.
• Increasing the proportion of cars with at least four stars in EuroNCAP crashworthiness ratings, from 17 to 50%.
Ultimately, performance indicators need to be lined up with the full aspiration of the Safe System approach. That is:
• Five star users – who are restrained, unimpaired, and complying with road rules.
• Five star vehicles – that avoid crashes, and protect road users.
• Five star roads – that are homogeneous, predictable, and forgiving.
• Five star speed limits – that are safely aligned with the road function.
A potentially important new performance measurement activity has recently begun within the International Standards Organisation, which has identified a market for a Road Traffic Safety Management Systems Standard. To be developed at a level of principles and systems, the Standard is intended to help codify what a shift towards a safe system will require from organisations that play an influential role in road safety.

THE SAFE SYSTEM APPROACH – 129
TOWARDS ZERO: AMBITIOUS ROAD SAFETY TARGETS AND THE SAFE SYSTEM APPROACH - ISBN 978-92-821-0195-7 © OECD/ITF, 2008
The requirements of the Standard are intended to be applicable to all organisations regardless of type, size, products and services provided. Categories of companies and organisations that have been identified as relevant to the Standard are those influencing:
• The design, building and maintenance of roads and streets.
• Design and production of cars, lorries and other road vehicles including parts and equipment.
• Companies working with the transport of goods and people.
• Companies generating significant flows of goods and people.
• All organisations having personnel working in the road transport system.
The significance of this lies in the provision of direct guidance for public agencies about how to go about the task of re-orienting their approach to managing safety in the road transport system. It also lies in the potential to stimulate market based responses to safety demand within the community, and to provide companies with the means to make a commercial return on the inherent safety of the products and services they provide.
5.4.2 Projecting improvement from the Safe System approach
It is usually feasible to estimate the likely benefits arising from changes in key behaviours and in individual aspects of the road environment (as is already done in many countries). It is more difficult to make a firm quantitative estimate of reductions in serious injuries and fatalities arising from a Safe System approach. However as examples of the benefits that might accrue, Sweden and The Netherlands, which have developed the strongest Safe System responses, estimate that a further 70-75% reduction in fatalities can be achieved in the medium term (SWOV).
There is likely to be less certainty associated with the boundaries of what can be achieved with a move towards a Safe System approach as new analyses are undertaken and new interventions explored. It is also likely that an approach that seeks to engage more directly with the full range of actors and/or system designers, rather than relying solely on public agencies, may reduce the short term results that are possible. However, traditional methods are expected to show an inevitable levelling off in performance. Some additional increments are possible, but the over reliance on behavioural techniques place a cap on the level of improvement that is possible. The Safe System approach necessarily opens a far greater field of performance improvement over time. This is conceptually illustrated in Figure 5.3. If the road transport system is addressed in a manner similar to other core infrastructural services, including other transport services, a far greater improvement in performance over the long term can be expected.
The safest countries are likely to be those that work earliest and hardest at changing their analyses of safety issues, and that create new types of interventions which begin to systematically close the gap between current performance and the performance of a road transport system where people do not suffer death or serious injury as a result of its use. Appropriate performance indicators, and the establishment of ambitious interim road safety targets, will be critical in achieving this. But while important in driving safety progress forward, the primary strategic and communication task of a Safe System is to engender support for the notion that there is no acceptable level of trauma arising from use of the road transport system.

130 – THE SAFE SYSTEM APPROACH
TOWARDS ZERO: AMBITIOUS ROAD SAFETY TARGETS AND THE SAFE SYSTEM APPROACH - ISBN 978-92-821-0195-7 © OECD/ITF, 2008
Figure 5.3. Interim and longer term performance possibilities
Source: Eric Howard, this report.
5.8. Conclusions
The impact of the Swedish and Dutch road safety visions on other countries has been profound. While the escalated level of ambition (zero deaths and serious injuries) represents a radical shift within the road sector, these targets can be viewed as consistent with the safety expectations prevalent in other modes of transport (for example, the aviation, rail and maritime sectors). What was initially seen as radical and unachievable has increasingly become the benchmark for acceptable road safety results. This approach seeks to consolidate the significant improvements in road safety in recent decades and to generate further reductions in deaths and serious injuries from road crashes. In doing so, it explicitly adopts a results focussed approach, it forces the nature of interventions to be re-considered, and it relies on a systematic re-focusing of institutional arrangements to implement those interventions.
Vision Zero in Sweden and Sustainable Safety in the Netherlands are but two examples of a Safe System strategy. The various strategies now being developed in numerous countries represent the latest evolution in road safety strategies as a means to further improve safety outcomes. While these approaches remain firmly linked to previous efforts, they also have a number of distinctive characteristics, as follows:
• They aim to eliminate all fatalities and serious trauma arising from road crashes in the long term.
• They recognise that prevention efforts notwithstanding, road users will remain fallible and crashes will occur.
• They stress that those involved in the design of the system need to accept responsibility for ensuring that no deaths or serious injuries occur as a result of using the road transport system,

THE SAFE SYSTEM APPROACH – 131
TOWARDS ZERO: AMBITIOUS ROAD SAFETY TARGETS AND THE SAFE SYSTEM APPROACH - ISBN 978-92-821-0195-7 © OECD/ITF, 2008
and those that use the system need to accept responsibility for complying with the rules and constraints of the system. Establishment or strengthening of current arrangements for independent monitoring of system designer performance would support safe system performance.
• They aim to develop a transport system better able to accommodate human error by reducing crash energy through managing the interaction of all components of the transport system, but particularly through improved management of the road infrastructure, travel speed and vehicles.
• They seek close to 100% compliance with current rules, only possible through the implementation of innovative solutions including new technologies.
• They rely upon comprehensive management structures incorporating all key government agencies and other organisations which have a role in determining the safe functioning of the transport system.
• They align safety management decisions with broader transport and planning decisions that meet wider economic goals and human and environmental health goals.
• They re-orient their interventions to focus on the inherent safety quality of the road infrastructure, and align travel speed to the safety thresholds implied by that infrastructure, whether it is an urban access street, or a major inter-regional highway.
• They place greater priority on the use of technology to improve the safety of the road transport system, whether addressing drink driving through ignition interlocks, or improving the inherent safety of vehicles, and seek to develop technological links between the vehicle and the road infrastructure.
• They address road safety at an organisational or corporate level, whether through improvements in the standards and guidelines used by road authorities, or through encouraging mechanisms such as the development of an ISO standard that helps create a commercial demand, and a commercial return, for safe products and services.
In summary, the Safe System rationale is to seek to ensure that road users are never subject to impact energy levels sufficient to cause fatal or serious, disabling injury. The detailed application of this principle requires innovative thinking about the full range of possible interventions, including developing a forgiving road infrastructure, pursuit of improved vehicle safety and speed limits set to reduce unacceptably high injury risk. It requires a clear understanding of crash types and associated risks, their distribution on the road network and the existence of adequate legislation and enforcement to achieve high levels of road user compliance. It seeks adequate controls over access to the road system for drivers and vehicles and improved road safety alignment with other societal goals, for example important synergies exist with environmental protection policies that aim to reduce vehicle emissions through improved driving style and speed limits. A Safe System approach also focuses on interactions between interventions to lessen crash risk and severity, because better managing the interfaces between road and vehicle, vehicle and driver and non-motorised road user and infrastructure is critical to success. It relies upon adequate institutional management capacity to prioritise road safety in areas beyond the reach of the agents traditionally concerned.

132 – THE SAFE SYSTEM APPROACH
TOWARDS ZERO: AMBITIOUS ROAD SAFETY TARGETS AND THE SAFE SYSTEM APPROACH - ISBN 978-92-821-0195-7 © OECD/ITF, 2008
NOTES
1. www.itsoverview.its.dot.gov.

THE SAFE SYSTEM APPROACH – 133
TOWARDS ZERO: AMBITIOUS ROAD SAFETY TARGETS AND THE SAFE SYSTEM APPROACH - ISBN 978-92-821-0195-7 © OECD/ITF, 2008
REFERENCES
Driscoll, T., R. Mitchell, J. Mandryk, S. Healey, L. Hendrie and B. Hull, 2001. “Work-related fatalities in Australia, 1989 to 1992: an overview”, J. Occup. Health Saf. Aust. N. Z. 17 1, pp. 45–66.
Howard, E, (2004), “Implementing a ‘Safe System’ Approach to Road Safety in Victoria”, 2004 Road Safety Research, Policing and Education Conference, Perth.
Koornstra M., D. Lynam, G. Nilsson, P. Noordzij, H-E. Pettersson, F. Wegman and P. Wouters (2002), SUNFlower: A comparative study of the development of road safety in Sweden, the UnitedKingdom and the Netherlands, SWOV.
Murray et al. (2003), Evaluating and improving fleet safety in Australia. Department of Transport and Regional Services.
Royal Society for the Prevention of Accidents, National Occupational Safety and Health Committee: Comments on “Adapting to change in work and society: a new Community strategy on health and safety at work 2002-2006”, COM (2002) 118 final http://www.epha.org/IMG/doc/EUOSH3.doc
Swedish Ministry for Industry, Employment and Communications (2004), Continued Action for RoadSafety.
Swedish National Road Administration “Vision Zero: from Concept to Action”.
Van Beek, W., H. Derriks, P. Wilbers, P. Morsink, L. Wismans, Van Beek, P, The effects of speedmeasures on air pollution and traffic safety, Proceedings of the European Transport Conference 2007, 17 - 19 October, 2007,http://www.goudappel.nl/Site/basicsite.nsf/0/1FB37C466248B8D7C12573D1005723DA/$file/The%20effects%20of%20speed%20measures%20on%20air%20pollution%20and%20traffic%20safety.pdf
Wegman, F. and A. Dijkstra (2005), Sustainable Safety in the Netherlands: the Vision, theImplementation and the Safety Effects, SWOV.
Wegman F. and L. Aarts, (2008), Advancing Sustainable Safety – National road Safety Exploration2005-2020, SWOV, Netherlands Institute for Road Safety Research, 2008.
World Business Council for Sustainable Development (2004), Mobility 2030: Meeting the challenges tosustainability.
Wramborg, P. (2005), “A New Approach to a Safe and Sustainable Road Structure and Street Design for Urban Areas”, Paper presented at Road Safety on Four Continents Conference, Warsaw Poland.


BUILDING THE ECONOMIC CASE FOR ROAD SAFETY INVESTMENT – 135
TOWARDS ZERO: AMBITIOUS ROAD SAFETY TARGETS AND THE SAFE SYSTEM APPROACH - ISBN 978-92-821-0195-7 © OECD/ITF, 2008
6. BUILDING THE ECONOMIC CASE FOR ROAD SAFETY INVESTMENT
ABSTRACT
This Chapter presents the economic considerations that underlie the implementation of road safety programmes. It reviews the social costs of road crashes in a range of countries and describes the various funding sources available for road safety programmes. The chapter reports on the expected benefits of further reductions in road casualties and the funding required to achieve them. Opportunities to encourage investment in road safety based on the development of business cases for interventions that could provide competitive returns to insurers and government are discussed.
6.1. Introduction
This report has so far presented the key challenges facing road safety managers in achieving ambitious road safety targets. Data analysis, strategy setting and implementation have been addressed. The ability to successfully meet these challenges also relies in good measure on the ability of the manager to build a strong strategic case for road safety that can be defended on economic grounds.
A strong economic analysis is critical for road safety managers to effectively juggle the complex array of competing budget priorities, the ever increasing demand for improved safety performance and the acceptability constraints inevitably associated with safety options. Implementing the policies and programmes necessary to achieve ambitious road safety targets requires:
• A strong evaluation framework to assess the economic and social scale of the current problems, to prioritise possible interventions and identify the socio-economic returns of expenditures on road safety.
• A funding system for prioritising current resources or for seeking additional resources.
• An allocation and implementation process that delivers resources to where the greatest benefits will be generated.
This chapter goes through each of these items – evaluation, funding, allocation – to identify the critical resourcing elements for reaching the set targets. This chapter also includes results from a survey of OECD countries undertaken in the preparation of this report, which sought information particularly about the cost of road crashes and the expenditure on road safety programmes in each country.
6.2. Evaluation
An essential starting point in building the case for road safety investment is a rigorous evaluation framework. Other chapters have discussed the need to use crash data to identify specific problems associated with the road infrastructure, vehicles or road user behaviour. This chapter starts by discussing the importance of identifying the total cost of injury in road transport systems.

136 – BUILDING THE ECONOMIC CASE FOR ROAD SAFETY INVESTMENT
TOWARDS ZERO: AMBITIOUS ROAD SAFETY TARGETS AND THE SAFE SYSTEM APPROACH - ISBN 978-92-821-0195-7 © OECD/ITF, 2008
6.2.1. Issues in costing road crashes
Assessing the value of statistical life has long been the subject of economic discussion with recent reports, for example, prepared by both the European Conference of Ministers of Transport in 2000 and the Organisation of Economic Cooperation and Development in 2002. A review of these reports is not intended here.
An integrated approach to road safety does, however, raise issues in relation to the socio-economic valuation of road crashes. If countries are questioning the acceptability of a road transport system which is designed and functions in a way that results in death or serious injury, then:
• The economic value associated with reducing road trauma must also include the intrinsic values that individuals place on safety, as well as direct costs. While the willingness to pay approach readily includes these values, the human capital approach can also include an intrinsic element referred to as “immaterial costs”; for example in the Netherlands.
• Subsequent evaluation of road transport projects should also give greater weight to safety and human values – that is, the desire to remain injury free or to remain in otherwise good health.
6.2.2. Costing Road Crashes
Costing road crashes or injuries serves two main purposes:
• Measuring the total economic burden that road crashes impose on society (often expressed in relation to GDP).
• Measuring the benefits of road injury prevention measures in cost-benefit analyses (thereby comparing the value of benefits to be compared with the monetary cost of road safety measures).
There are two main approaches to the economic evaluation of safety measures: the human capital and the willingness to pay approaches. These approaches and their elements of cost were reviewed in the COST 313 study (European Commission 1994) and at ECMT Round Table 117 (ECMT 2001).
The human capital approach is probably the more widely used method. It involves valuing damage in terms of economic impact and places values on lost output and restitution costs, e.g. medical treatment and repair of damage to property. The underlying principle is that road crashes lead to losses of both human and material capital. Material capital is damaged or even destroyed in crashes (e.g. vehicles) and the monetary value of these lost resources has to be borne by the society. Injured or killed persons are no longer able to take part in the production process leading to a reduction in economic wealth creation. These human capital costs can be derived from national account data by calculating the productive potential of the crash victim lost because of their death or disablement.1
Aside from direct material losses, road crashes are associated with significant human costs associated with emotional and psychological impairment. The main disadvantage of the human capital approach is that it does not readily reflect the intrinsic value of the loss of life or suffering incurred as a result of road traffic injury. This deficiency however can be countered through a number of means: for example, by adding a somewhat arbitrary element termed “pain, grief and suffering”, known sometimes as “immaterial costs”.

BUILDING THE ECONOMIC CASE FOR ROAD SAFETY INVESTMENT – 137
TOWARDS ZERO: AMBITIOUS ROAD SAFETY TARGETS AND THE SAFE SYSTEM APPROACH - ISBN 978-92-821-0195-7 © OECD/ITF, 2008
The willingness to pay approach measures that amount which individuals or society are willing to pay to prevent loss of life or serious injury, or to accept as compensation for such an occurrence.2 This approach allows social decisions on investment in safety measures to take account of public willingness to trade off safety against other desirable things that could be purchased. Typically questionnaires are used to elicit willingness to pay values, to which are added estimates of economic loss: net lost output, medical costs and damage costs associated with the crash rather than the victim.
This approach has the advantage of measuring the intrinsic value of crash prevention, but has the downside of a lack of precision in the measurement process. However, both COST 313 and the ECMT Round Table concluded that willingness to pay is the preferred methodology as the human capital approach is not conceptually sound. The willingness to pay method focuses on the right parameter, and members of the Round Table agreed that “it was better to obtain an approximate measurement of the right parameter than to obtain an accurate measurement of the wrong parameter” (ECMT, 2001, pp 165).
The approach used to evaluate the cost of road crashes differs from country to country. In Australia, the Netherlands and the United States crash costs are based on the human capital approach. The Netherlands include “immaterial costs” as well as loss of production, while Australia also adds a value for the pain and suffering associated with crashes and injuries. Sweden, New Zealand, Norway and the United Kingdom adopt willingness to pay approaches. Sweden combines willingness to pay values with the cost of illness and a health index. The other three countries combine willingness to pay values with restoration costs such as medical, police, insurance and property costs.
As road crash statistics are based on counting separate cases, countries can use either approach to identify separately the social cost of fatalities, serious or minor injuries, or property damage crashes. Crash costs for significant risk factors can also be assessed: for example the social cost of alcohol-involved crashes.
However the costs are measured and analysed against other transport related values. It is clear from Table 6.3 that OECD countries continue to face significant economic costs arising from road crashes. Collecting and understanding this information is the starting point for building credible cases for increased safety investment.
Box 6.1. Evaluating the socio-economic cost of road crashes in the Netherlands
The socio-economic evaluation of the cost of road crashes has become essential to achieving ambitious road safety targets, for two primary reasons (Jacobs, 2000). First, national costs are needed to ensure that road safety is ranked appropriately against all other national objectives. Second, costs are needed to help ensure that as far as possible, road safety resources are directed to those interventions that are likely to give the greatest return on investment and not to interventions likely to provide little or no return.
The Netherlands itemises six different cost categories, which in 2003 amounted to a total crash cost of EUR 12.3 billion. Table 6.1 shows that the largest categories were human costs (EUR 5.5 billion) and material costs (EUR 3.8 billion), with the production loss and settlement costs (each EUR 1.3 billion) also having a large share.
In 2003 the costs of road crashes in the Netherlands amounted to 2.6% of the country’s Gross National Product (GNP). This percentage had declined between 1997 and 2000 from 3.0 to 2.6 and has remained stable since then.

138 – BUILDING THE ECONOMIC CASE FOR ROAD SAFETY INVESTMENT
TOWARDS ZERO: AMBITIOUS ROAD SAFETY TARGETS AND THE SAFE SYSTEM APPROACH - ISBN 978-92-821-0195-7 © OECD/ITF, 2008
Table 6.1. Social costs of road crashes in The Netherlands (1997-2003)
Cost categoryEUR million current prices
1997 2000 2003
Medical costs (injury treatment, rehabilitation and management) 182 192 232
Material costs (damage to vehicles, freight, roads and adjacentobjects)
2 647 3 250 3 866
Settlement costs (fire, police, courts and insurers) 834 1 055 1 262
Production loss (loss of production) 1 290 1 441 1 294
Traffic jam costs (lost time) 88 100 125
Human costs (pain, suffering and grief) 5 206 4 957 5 549
Total 10 248 10 995 12 327
Source: AVV (2005).
As shown in Table 6.2, most of the crash costs can be attributed to hospital in-patients (EUR 4.7 billion) and deaths (EUR 2.6 billion). The table also shows that the costs of crashes with Accident & Emergency (A & E) department patients or casualties with less severe injuries are relatively low (EUR 0.8 billion). Between 1997 and 2003, the number of fatalities decreased by 12% but the total crash costs increased by 20%. This is partly due to inflation; in addition, while the costs of deaths and in-patients declined almost proportionately with the number of casualties, the costs of crashes with hospital A & E patients increased in spite of the number of casualties declining. There was also a large increase in the costs per A & E patient, due mainly to increases in material costs and settlement and traffic jam costs.
Table 6.2. Number of casualties and costs by crash seriousness and per casualty in 2003and the 1997-2003 development (excluding inflation)
Number of casualties
Costs(EUR Million)
Costs per casualty(EUR million)
2003 1997-2003 2003 1997-2003 2003 1997-2003
Deaths 1 088 -12% 2.640 -12% 2.427 0%
In-patients 18 600 -8% 4.655 -9% 0.249 -1%
A & E 97 000 -10% 767 12% 0.008 25%
Source: AVV, 2006.
It takes sustained effort over an extended period of time to develop a sophisticated understanding of crash costs, such as that found in the Netherlands, and present elsewhere. With each stage in that development, better questions are able to be answered and stronger bids for road safety investment are possible. For example:

BUILDING THE ECONOMIC CASE FOR ROAD SAFETY INVESTMENT – 139
TOWARDS ZERO: AMBITIOUS ROAD SAFETY TARGETS AND THE SAFE SYSTEM APPROACH - ISBN 978-92-821-0195-7 © OECD/ITF, 2008
• By knowing what portion of costs relate to direct/material or indirect/immaterial factors, the value placed on road safety by the community can be monitored.
• By breaking down the costs associated with the health sector, the significance of road safety programmes on reducing cost pressures in the health sector can be highlighted.
• By comparing crash costs with other transport costs, internal debate within government transport agencies on the allocation of resources within the sector can be undertaken.
Whether strategic funding bids are being contested within the transport sector or across different sectors, knowledge of the socio-economic costs of road crashes is vital for managers charged with achieving ambitious road safety targets.
6.2.3 The socio-economic costs of road crashes
The measured level of road crash costs is determined by many factors. These include a country’s vehicle stock, infrastructure, population, road user behaviour and as discussed above, the value placed on preventing loss of life or maintaining life quality. These values can vary substantially between countries, depending particularly on the methodologies used for establishing the values. All these factors need to be kept in mind when comparing road crash costs for different countries.
A study from Elvik (1999) covering 12 countries found that if economic valuation of lost quality of life is included, total crash costs amount to around 2.5% of GNP. There is substantial variation between countries, with a range from 0.5 to 5.7%. If the costs of lost quality of life are excluded, road crash costs on the average drop to 1.3% of GNP, with a range from 0.3 to 2.8%.
A survey of OECD countries has been undertaken for this report, particularly to gather information about each country’s cost of road crashes and expenditure on road safety programmes. Survey results suggested that the socio-economic cost of road crashes was up to 4.9% of Gross Domestic Product (see Table 6.3).
While crash costs could usually be provided, it became apparent from the survey that most countries were unable to estimate their total direct spending on road safety. Only six countries were able to estimate expenditures on enforcement, regulation, education, roads and other safety activities and only two countries were able to include estimates on total safety expenditures across different government levels and across the transport, health, enforcement, insurance and other sectors. For countries that did provide an estimate of total safety expenditures, annual expenditure was less than half of total cost of road crashes.
Given communities’ and governments’ value for money expectations, it is important there is a clear and transparent, widespread understanding of the total resources being applied to road safety programmes and the returns from the investment. Looked at in the context of national economies, the scale of the costs imposed on the community by road crashes should also be made apparent. Cost-effective road safety programmes can then be presented as investment programmes that provide significant social benefits through extending life quality years, with measurable economic benefits based on effective and targeted deployment of resources.
The direct benefits to the economy from road safety investments can be illustrated by the following example in Box 6.2.

140 – BUILDING THE ECONOMIC CASE FOR ROAD SAFETY INVESTMENT
TOWARDS ZERO: AMBITIOUS ROAD SAFETY TARGETS AND THE SAFE SYSTEM APPROACH - ISBN 978-92-821-0195-7 © OECD/ITF, 2008
Table 6.3. Economic costs of road crashes, as a % of GDP
Method Total crash costs % GDP
Australia (Victoria) Human capital approach AUD 3.21 billion 1.59%
Australia (Western Australia) (2004)
Human capital approach AUD 2.04 billion 2.0%
Austria (2004) Human capital approach, including willingness-to pay components.
EUR 10.2 billion (including damage property only crashes)
EUR 7.2 billion (excluding damage property only crashes)
4.3%
3%
Canada Willingness to pay, based on costs of one province
CND 63 billion, including indirect costs (effects of congestion due to crashes on environment, policing costs, etc.)
4.9%
Great Britain (2004)
Willingness to pay and economic loss for direct costs, e.g. hospital treatment
GBP 18.0 billion 1.7%
Greece (2003) Mixed approach (WTP / Human costs)
EUR 3.14 billion 2.04%
Netherlands (2003) The total costs of traffic crashes are calculated by looking at medical costs, costs of loss of production, immaterial costs, material costs, settlements (administration) costs and costs of congestion.
EUR 11.8–13.02 billion 2.54%
New Zealand (2004)
Willingness to pay and economic loss for directs costs e.g. hospital treatment
NZD 3.6 billion 2.4%
Norway (2004) NOK 31,9 billion 2.8% if economic
valuation of lost quality
of life is included.
Sweden (2001) Cost of illness, willingness to pay and heath index
SEK 49.1 billion 2.0%
United States (2000)
Mixed approach USD 230.6 billion 2.3%
Source: Survey of the working group.

BUILDING THE ECONOMIC CASE FOR ROAD SAFETY INVESTMENT – 141
TOWARDS ZERO: AMBITIOUS ROAD SAFETY TARGETS AND THE SAFE SYSTEM APPROACH - ISBN 978-92-821-0195-7 © OECD/ITF, 2008
Box 6.2. Benefits of road safety investments in South Australia
In South Australia in 2005, crash costs and the savings were estimated for crash reductions of 10 fatalities, 100 serious injuries and 1 000 minor injuries.
Total savings were estimated at: AUD 63 793 751 – with human costs representing 80%, vehicle costs 9% and general costs 10%.
The various savings components presented were also described in terms of specific annual benefits to the state and included:
• A lifetime’s labour for ten people (in the workplace, household and community).
• At least an additional 2 500 days of labour (in the workplace, household and community).
• A saving equivalent to over 850 typical ambulance call-outs.
• The availability of nearly 900 extra hospital bed days.
• Approximately 4 400 fewer of each of the following: instances of use of hospital out-patient or emergency care, visits to a general practitioner, consultations with a specialist, use of prescription pharmaceutical products and sessions of treatment by allied health services.
• No more need for the long term care of 18 people, five of whom would be severely and permanently disabled, thus lessening the need for the provision and co-ordination of carers, which, in turn, would also ease the burden on rehabilitation centres.
• A saving of approximately AUD 5.7 million in insurance costs (legal costs plus administration), which could result in lower insurance premiums.
• A saving of the cost of 535 days of prison time for one person.
• Reduced workplace disruption and staff replacement, saving business in the state AUD 1.7 million.
• A saving of over 7 000 hours of police time.
• Reduced travel delays, saving business in the state AUD 4.7 million.
The evaluation of the socio-economic costs of road crashes is not an academic exercise. It provides the basis for illustrating the benefits of public health investments to the economy as a whole. Assuming the case for investment is made, the next task is to assess how to direct that investment into the most cost-effective projects.
6.2.4. Socio-economic tools
Establishing a monetary figure on expected road crash reductions allows road safety managers to more confidently evaluate the worth of specific safety measures, argue for road safety resources against other competing objectives and allocate road safety resources to where they will have the best effect. These reductions can be achieved by changing either the risk of road trauma or exposure to that risk (whether through safer roads, safer vehicles or safer people). Many of the proven countermeasures, which address the main crash problems, have been presented in Chapter 3.
Once the injury reduction benefits arising from the planned countermeasures have been identified, there are several economic analysis methodologies for quantifying the subsequent socio-economic impact. The strongest is the welfare-economics-based benefit-cost analysis (BCA) which measures all relevant costs and benefits in monetary terms. By putting financial values to all benefits and all costs, the

142 – BUILDING THE ECONOMIC CASE FOR ROAD SAFETY INVESTMENT
TOWARDS ZERO: AMBITIOUS ROAD SAFETY TARGETS AND THE SAFE SYSTEM APPROACH - ISBN 978-92-821-0195-7 © OECD/ITF, 2008
BCA can be used firstly, to assess whether a proposal is economically efficient: that is, whether the estimated benefit-cost ratio is greater than 1.0. The cost effectiveness of a given road safety proposal can then be assessed against other proposals and against all other demands for public resources. The rigour with which the road safety manager identifies and demonstrates cost effective solutions is critical for achieving targets in both the short and long term.
Box 6.3. Applying cost-effectiveness tests in Finland
The systematic application of evaluation techniques that identify core crash problems and their countermeasures, allows road safety managers to rank the cost-effectiveness of different safety proposals and develop strategic funding options.
In Finland in 2004 there were 375 fatalities, with a national target of no more than 250 fatalities by 2010. In order to develop a new road safety programme for 2006-2010, research was undertaken on possible measures and their safety benefits. Using national and international findings, 108 traffic safety measures were evaluated in terms of fatalities, costs and cost-effectiveness. The analyses entailed an in-depth description of the key safety problems, the estimated effectiveness of various potential measures (Elvik and Vaa, 2004) and leading risk factors including effects of alcohol, non-use of safety devices, crashworthiness of vehicles, knowledge and skills, road conditions and choice of speed-level. The calculations were applied to traffic and network conditions projected for 2010.
A traffic safety tool was prepared for evaluating the combined effects of different scenarios on the number of fatalities (Peltola, 2005). All scenarios included potential measures that could produce the necessary benefits needed to reach the set target, a reduction of about 175 fatalities. Five different policy scenarios were analysed: 1) extensive use of all available effective countermeasures; 2) extensive use of only those countermeasures for which reliable cost data exists; 3) only clearly cost-effective measures proven by research information; 4) extensive cost-effective measures but where the data included some shortcomings; and 5) a step towards Vision Zero.
The impact of each scenario in terms of fatality reductions, costs and cost-effectiveness is given below. (Some data were missing, which meant cost-effectiveness could not be calculated across all scenarios.)
When considering the implications for resource allocation the analysis allowed the cost-effectiveness of different categories of measures to be evaluated. The five most effective categories of countermeasures (in terms of lives saved / costs) were: road design, road maintenance activities, traffic management, vehicles and education and information.
Scenario 1 Scenario 2 Scenario 3 Scenario 4 Scenario 5
Baseline (fatalities) 415 415 415 415 415
Effect (deathreduced/year)
174 121 108 144 190
Costs (€ million) ? 3519 842 1470 1470
Cost-effectiveness ? 1.5 0.39 0.51 ?

BUILDING THE ECONOMIC CASE FOR ROAD SAFETY INVESTMENT – 143
TOWARDS ZERO: AMBITIOUS ROAD SAFETY TARGETS AND THE SAFE SYSTEM APPROACH - ISBN 978-92-821-0195-7 © OECD/ITF, 2008
Benefits and costs have traditionally been estimated for engineering measures and more recently, for enforcement programmes – with both areas usually showing very good benefit-cost ratios (see boxes below). However other safety programmes, especially those involving multi-sector efforts, often have difficulty in providing the basic necessary data for cost-effectiveness calculations.
While a safe system approach requires a focus on system wide assessment of network wide crash risk and the economic returns for such an approach are likely to be less than a traditional blackspot programme, it is important to recognise the substantial economic benefits that infrastructure safety treatment can provide. This is illustrated in Box 6.4.
Box 6.4. State-wide Blackspot ProgrammeVictoria, Australia
In 2000, the State Government of Victoria commenced a four year USD 240 million Statewide Blackspot programme. Sites to be treated were identified based on their poor crash history, with 841 sites subsequently selected.
The study found that relative to chosen comparison sites, casualty crashes at treated sites were reduced by a statistically significant 31%, while serious casualty crashes were reduced by about 35%. Based on the specific crash costs used, the programme was estimated to return a net present value saving of USD 494 million, and a Benefit-Cost-Ratio of 2.4. If alternative injury costs were assumed, the predicted savings rise to USD 763 million and the Benefit-Cost-Ratio to 3.7.
It was also estimated that over the life of the programme, the number of lives saved by preventing crashes at treated sites is likely to be in excess of 200, while the number of incidents of seriously injured road users prevented is estimated to be about 3 000.
Of the three broad types of treatments implemented as part of the programme (intersection, off-path and vulnerable users), those targeting crashes at intersections resulted in the greatest estimated reduction in serious casualty crashes at treated sites. The estimated serious casualty crash reduction at such sites was 45%, compared with 29% for treatments targeting off-path crashes. Treatments targeting crashes involving vulnerable road users (i.e. pedestrians and cyclists) did not effectively reduce serious casualty crashes or all types of casualty crashes at treated sites.
6.2.5. Cost effectiveness and resource allocation
Beyond the evaluation of specific proposals, cost-effectiveness principles can also be applied to population or system based analyses. Young people in some member countries, for example, drive greater distances than old people and may warrant being given greater attention in terms of their safety and other needs. Major urban arterials or rural highways tend to carry the most traffic and so may justify being given greater resources. Cost-effectiveness analyses used in regard to different parts of the user population and of the road transport system help to ensure appropriate allocation of resources to the different problem areas.

144 – BUILDING THE ECONOMIC CASE FOR ROAD SAFETY INVESTMENT
TOWARDS ZERO: AMBITIOUS ROAD SAFETY TARGETS AND THE SAFE SYSTEM APPROACH - ISBN 978-92-821-0195-7 © OECD/ITF, 2008
Box 6.5. Road safety expenditure is a sound investmentAchieving Ambitious Road Safety Targets – London
Road safety is a major problem in London. In 2005 there were 214 people killed, 3 436 seriously injured and 28 180 slightly injured in road collisions.
The value to society of all these casualties is reckoned by the UK Government to be GBP 1.2 billion a year, with the current value for a fatal collision set at GBP 1.4 million and at GBP 0.234 million for a casualty.
Notwithstanding this significant suffering and loss of lives, casualties have been falling rapidly in London. Against the National baseline of the annual average of casualties in 1994 to 1998 inclusive, all killed and seriously injured (KSI) in London have fallen 45%, as shown in the Table below. The national target is to reduce killed and seriously injured (KSI) by 40% by 2010, so London has exceeded this some 5 years early. Assessment of the possible impact of the congestion charge scheme was also undertaken and showed a neutral impact on road safety.
2005 Casualty Figures
Casualty Numbers% change in
12 months endingDec 2005 compared with
Killed and Seriously Injured(KSI)
1994-1998Average
12 monthsending
Dec 2004
12 monthsending
Dec 2005
12 monthsending
Dec 2004
1994-1998average
Pedestrians 2 136.6 1 334 1 224 -8% -43%
Pedal cyclists 566.8 340 372 9% -34%
Powered two-wheeler 932.8 895 -6% -9%
All KSI 6 684.4 4 169 3 650 -12% -45%
Children (under 16yrs) 935.4 487 355 -27% -62%
The success so far can be attributed to a number of factors, the most important of which are probably:
• Having strong political support from the Mayor.
• A new London Road Safety Unit set up to coordinate road safety activities.
• Large increases in budgets.
• Applying a full range of known infrastructural and behavioural interventions.
Expenditure directly on road safety in London has risen sharply, from GBP 10 million a year in 2000 and 2001, to GBP 15 million in 2002, GBP 35 million in 2004 and GBP 39 million in 2005 amounting to a total of GBP 133 million. The majority of the money is spent on road safety engineering and is targeted at schemes that give the best return, in terms of casualties saved per GBP spent. The casualty benefits obtained from engineering work is well understood in London and the GBP 133 million spent over this period is estimated to give a reduction of around 600KSI a year, i.e. 3000 KSI between 2000 and 2005. This equates to an estimated GBP 700 million benefits, i.e. a benefit to cost ratio of 5.2:1.

BUILDING THE ECONOMIC CASE FOR ROAD SAFETY INVESTMENT – 145
TOWARDS ZERO: AMBITIOUS ROAD SAFETY TARGETS AND THE SAFE SYSTEM APPROACH - ISBN 978-92-821-0195-7 © OECD/ITF, 2008
The enforcement activities have included installing over 600 cameras in London, which have helped to treat some of the sites where speeding has been the cause of collisions. Research shows fatal and serious casualties at camera sites fall by over 40%.
There are some casualty groups, however, that cannot be treated with engineering measures (for example motorcycles), so the primary treatments here were advertising campaigns. Other high-risk groups targeted with advertising campaigns in London, which have totalled £25 million over six years, include children, teenagers, young drivers and cyclists. Though the safety benefits of these campaigns have been impossible to measure directly, they have played apart in supporting other activity.
Assessment of the possible impact of the congestion charge scheme was also undertaken and showed a neutral impact on road safety. That said, other non safety specific factors are likely to have made an impact, such as changes in travel mode (more people travel by bus now in London) and major road schemes such as the pedestrianisation of Trafalgar Square.
Such has been the progress that the Mayor of London announced new more challenging targets in 2006. These were to reduce by 2010 all KSI, pedestrian KSI and cyclist KSI by 50%; motorcycle KSI by 40%; child KSI by 60% and all slight casualties by 25%.
Source: Transport for London.
6.3. Funding
Achieving ambitious safety targets means that one or both of the following changes need to be made. First, the use of current resources can be made more efficient, either through more targeted allocation of financial and human resources (for example, better targeting of engineering resources to high risk parts of the road network) or through better policies and procedures (for example, tightening the legislative rules to be enforced by police). Secondly, the total volume of resources, and especially funding, can also be increased. The stronger the data and quantitative analyses available, the easier it is to establish the basis for assessing what efficiencies can be made, or costing what additional resources are required to bridge the resource gap.

146 – BUILDING THE ECONOMIC CASE FOR ROAD SAFETY INVESTMENT
TOWARDS ZERO: AMBITIOUS ROAD SAFETY TARGETS AND THE SAFE SYSTEM APPROACH - ISBN 978-92-821-0195-7 © OECD/ITF, 2008
6.3.1. Traditional funding and funding sources
Sustainable funding sources are critical to the establishment of ongoing and new safety programmes in pursuit of ambitious targets. The traditional funding sources are (OECD, 2002 and Aeron-Thomas etal, 2002):
• General tax revenues – as part of the national budgeting processes, specific road safety components are often embedded within larger engineering, enforcement and education programmes and are difficult to identify as individual budget items.
• Road funds – revenue sources for road funds typically come from fuel taxes, vehicle registration and licensing fees and road user charges for heavy vehicles.
• User fees – regulatory services associated with driver licensing, vehicle inspection and operator licensing are directly funded from road user fees, paid either to the government agencies responsible or private sector agencies working on their behalf. User fees are usually collected on a cost recovery basis.
• Insurance levies – some countries levy a fee on vehicle insurance premiums to help fund road safety programmes, but the amount of funding raised is often small and used to fund education and publicity initiatives to improve road user awareness of road safety risks.
• Earmarked charges – as well as various taxes and user charges being channelled to road funds for a variety of purposes, some taxes can be earmarked (or hypothecated) for a specific purpose. For example, revenue from traffic fines is used to finance road safety activities in some countries.
There are many different funding combinations and permutations across jurisdictions. In Australia, the Federal Government, which receives fuel tax revenues, directs significant investment from consolidated revenue to the States for the upgrading of the national highway system and to modest remedial blackspot programmes. Each state raises its own revenues for investment in its own roads and enforcement, regulatory and educational activity. Injury insurers are also playing a growing role in safety investment, particularly in the state of Victoria where the monopoly insurer has invested heavily in both educational and infrastructure projects. This approach is discussed further in Section 6.3.2.
In contrast, road safety policy measures in the Netherlands are financed by allocations from the Ministry of Finance to the relevant ministries, including the Home Office (responsible for the funding of regional and local authorities). Road tax, fuel tax, fines and so on are not earmarked and are received by the Ministry of Finance. In Norway too, road safety measures are mostly funded by general taxation or by consumer expenditure (for vehicle safety features and driver instruction).
In Great Britain, transport and police budgets cover expenditure on traffic policing, crash investigation, road safety research, publicity and media campaigns and administration of road safety policy. The Highways Agency is funded from general taxation for both new general road schemes and for safety focused improvement schemes on motorways and trunk roads. Local Highway Authorities also have a statutory duty for safety of the roads for which they are responsible and produce Local Transport Plans containing local road safety strategies. Their activities are funded through their annual capital settlements which reflect their bids in their Local Transport Plans, but there is at present no ring-fenced budget for road safety. Non-capital expenditure, for instance the activities of road safety officers, are funded out of local government grant income and local Council Tax.
Since 2000 there has also been separate funding for safety cameras in Great Britain through a cost recovery programme funded out of the fine income from camera operations. This has been administered

BUILDING THE ECONOMIC CASE FOR ROAD SAFETY INVESTMENT – 147
TOWARDS ZERO: AMBITIOUS ROAD SAFETY TARGETS AND THE SAFE SYSTEM APPROACH - ISBN 978-92-821-0195-7 © OECD/ITF, 2008
through a national board and in each area there are local camera partnerships that include local authorities, Magistrates Courts, the Highways Agency and the Police. In England, future funding will be integrated into the Local Transport Plan process and the level of funding for road safety within LTPs will be enhanced by GBP 110 million per year. Cameras are thus being integrated into wider road safety delivery processes which will provide local road safety partnerships with greater flexibility to implement their mix of road safety measures. This development will also provide financial stability and facilitate long term planning. Both cameras and other road safety measures will be funded in exactly the same way and the focus will be on casualty reduction outcomes with cameras part of the overall toolbox. Similar systems will be set up for Wales and Scotland.
Box 6.6. The Transport Accident Commission and the role of insurers in Victoria
The Transport Accident Commission (TAC) in Victoria, Australia is a relatively rare example of an injury insurer which is re-investing in road safety. As the compulsory injury insurer, the TAC’s objectives include both providing suitable and just compensation respecting persons injured or killed as a result of transport accidents and reducing the incidence of transport accidents.
TAC has become a key partner within the Victorian safety management system, fully internalising a results focussed framework. It identifies road safety as a critical mechanism for maintaining its financial viability and for reducing the cost of compensation to the Victorian community. TAC has moved well beyond considering whether or not road safety expenditure is a cost or an investment. Its hospitalised claim rate and its accepted no-fault claim rate are key results in determining both the success of its road safety investments and the success of its insurance business.
The corporation’s involvement began with investment in advertising support for enforcement, taking responsibility for ensuring that an intensive, research led advertising program was well integrated with enforcement operations. This programme, augmented by specific capital purchasing assistance for Victoria Police in the form of random breath testing and speed enforcement technology, was the first to demonstrate the highly cost-beneficial effect of well orchestrated enforcement and advertising campaigns and has influenced road safety practice the world over.
As TAC became comfortable with its road safety role, it has branched out into other significant funding programmes, each time testing and assessing the impact on its core business. Most significantly, it is now moving into major systemic interventions in the safety performance of the road network. Its 2006 Annual Report referred to:
• Continuation of an AUD 130 million programme to improve roads to reduce run-off-road crashes.
• Implementation of an AUD 110 million programme to improve dangerous intersections. • New commitment of AUD 60 million per annum (indexed over 10 years) to further improve
road safety infrastructure. • This approach is discussed further in Section 6.3.3.
There are other ways that injury or property insurance corporations can make significant contributions to road safety: for example, rewarding individuals who have vehicle safety technology features such as electronic stability control programmes, side curtain airbags or black boxes that monitor the safe use of the vehicle, with lower premiums. Insurance corporations are a major element in the total safety of the road transport system and road safety managers would do well to work at bringing them into the fold.
The Insurance Corporation of British Colombia, Canada and the Accident Compensation Corporation in New Zealand are other examples of insurers who are investing heavily in crash reduction programmes.

148 – BUILDING THE ECONOMIC CASE FOR ROAD SAFETY INVESTMENT
TOWARDS ZERO: AMBITIOUS ROAD SAFETY TARGETS AND THE SAFE SYSTEM APPROACH - ISBN 978-92-821-0195-7 © OECD/ITF, 2008
6.3.2 New thinking about funding sources
The need for alternative road safety resources has been identified within the European Union and the United States. Although no practical solutions have yet been produced, differentiation of vehicle taxes in relation to CO2 emissions (as practised in a number of countries) could be a model for road safety incentives. For example, it may be possible to either differentiate taxes in relation to safety characteristics which could be revenue neutral, or increase taxes in the absence of key safety features to fund safety programmes.
A mid-term review of the 2006 European Road Safety Action Programme (ECORYS, 2006) included an impact assessment with comments on alternative policy options, one of which was financial incentives. It concluded that several possible financial incentives could be used to improve road safety, as follows:
• Price/tax policy: this includes fiscal incentives to encourage private and business investments in safety measures and to promote the design of safer infrastructure and vehicles. The incentives could relate to certain categories of equipment with proven effectiveness in terms of safety for which it would be difficult to otherwise find outlets. Examples include the possible production of safety belt reminders for retrofitting in existing vehicles.
• Insurance premiums: behaviour that reduces safety on roads could be discouraged by adjusting premiums to:
− Ensure that road safety gets prominent attention within companies (through safe fleet management practices, for example).
− Match travel speeds through pay as you drive, or pay as you speed mechanisms.
− Spread the costs of risks associated with crashes causing bodily injuries more fairly.
− Assign the total costs of a crash cover from society to the person who caused the accident.
• Financial options: strategies might include loans instead of grants for safety projects or a success fee disbursed after the project has shown its effectiveness. However this might prevent the submission of potentially effective, high risk projects. Another difficulty in the case of a success fee is that a clear relationship must be established between the effect (decrease in the number of road deaths) and the project and this is not always easy to do.
Using financial and fiscal incentives, to change the behaviour of road users and to stimulate safety measures by car manufacturers and infrastructure managers, has the advantage of conforming with market principles and might be more acceptable than direct interference by governments: unsafe behaviour becomes more expensive, while safe behaviour is rewarded.
6.3.3. Injury insurer investment in road safety programmes
As mentioned earlier, a survey of OECD countries was conducted to establish the levels of government expenditure on:
• Road trauma treatment costs (consequences).
• Road crash avoidance and crash severity reduction investment (prevention).

BUILDING THE ECONOMIC CASE FOR ROAD SAFETY INVESTMENT – 149
TOWARDS ZERO: AMBITIOUS ROAD SAFETY TARGETS AND THE SAFE SYSTEM APPROACH - ISBN 978-92-821-0195-7 © OECD/ITF, 2008
All countries had difficulty in providing whole of government road safety expenditure figures. Given the different assumptions and approaches that were used, it was considered that any comparison of results across the different countries would be problematic at best and liable to produce misleading interpretations. It was subsequently decided not to report the results at a collective level.
A major challenge to compiling total road trauma costs is that in many countries, treatment costs are shared between a number of government departments and injury insurance bodies, with precise arrangements and extent of sharing varying substantially. Even within the one country, arrangements can change from jurisdiction to jurisdiction, with the total direct costs of treating road trauma requiring very specific information from many agencies.
The size and complexity of this task makes any comparison of road trauma treatment costs with prevention costs difficult – and in many countries, effectively impossible, given current data availability. However this task is considered essential if the full economic impost of road trauma is to be recognised and responded to: and in the final analysis, it is the general public in each country – whether as tax payer or injury insurance policy holder – who carries this economic burden.
The evidence returned from the OECD survey of countries does suggest that as a general rule, total road trauma costs well exceeded the expenditure on prevention efforts. Detailed evidence from Victoria, Australia, illustrates this finding and is reported in table 6.4.
Table 6.4. Estimated expenditure on treating and preventing road traumaVictoria, Australia, for the year 2004
Source of expenditureExpenditure in 2004 (AUD millions):
TotalTreating road trauma Preventing road trauma
Government 49 321 370
Injury Insurer 950 75 1 025
Total 999 396 1 395
Source: Based on data from and analysis by TAC and VicRoads.
These figures are based on estimated expenditures in 2004 by the key road safety agencies and the monopoly injury insurer, the Transport Accident Commission. The table shows that the costs of treating road trauma greatly outweigh the expenditure on programmes aimed at preventing road trauma – an imbalance which is likely to be true of most if not all countries. This imbalance also suggests the opportunity for increased investment in preventive programmes, which could be promoted to the insurance agencies and others as sound commercial investments.
If only government expenditure were considered, expenditure on prevention substantially outweighed treatment costs. However over 90 per cent of treatment costs were incurred by Victoria’s injury insurer, which contributed less than 10 per cent of prevention costs. Taking the treatment and prevention costs in total, broadly twice the amount was spent on treatment costs compared to prevention.
Based upon the Victorian data and the survey results from some OECD countries, it appears that greater public and private resources are being spent on treatment and other consequences of road crashes than on injury prevention. Both Governments and insurance bodies are therefore encouraged to review their resource allocations and increasingly favour injury prevention. The “public dividend” for both government and for insurers (in addition to their achievement of a commercial return) is lower injury risk on the network for all members of the public and for all policy holders.

150 – BUILDING THE ECONOMIC CASE FOR ROAD SAFETY INVESTMENT
TOWARDS ZERO: AMBITIOUS ROAD SAFETY TARGETS AND THE SAFE SYSTEM APPROACH - ISBN 978-92-821-0195-7 © OECD/ITF, 2008
For this change to occur, there is a need for greater knowledge about funding mechanisms for injury prevention and treatment.
Greater transparency in funding and resource allocation is required to establish:
• Socio-economic costs of road trauma.
• Current road safety funding by government and personal injury insurers for expenditures on the consequences of crashes.
• Current road safety funding by government and personal injury insurers for investment in the prevention of injury.
The development of business cases for carefully targeted investment in prevention measures based upon achieving acceptable rates of return (reduced trauma costs) is also recommended. Infrastructure measures are recommended to have a key role in these business cases, as the flow of benefits from carefully selected projects usually extends over 20 or more years. Enhanced enforcement funding with clear performance monitoring and outcome targets agreed between the insurers, government and key road safety agencies, is another possible component of any business case. In either instance, the business case needs to draw upon known relationships between the various measures (and associated investment costs) and the predicted serious injury reductions that these measures are estimated to provide. There are opportunities for insurance companies to invest more extensively in road safety programmes of this nature.
Companies will require a commercial rate of return on their investments in crash reduction. That is, the benefit to cost ratio they will require will be higher than for governments who essentially have an interest in funding projects where the socio-economic benefits to costs exceed unity.
Governments should consider opportunities to identify targeted road safety investment which provides competitive returns for the insurance industry and adequate socio-economic returns for government. This investment could be funded in association with or, perhaps for some projects, separately by the industry. Suitable cost sharing arrangements would need to be devised and agreed across the insurance industry, and business cases submitted to finance ministries.
Figure 6.1 shows preliminary estimates of the return on investment for road infrastructure safety programmes for Victoria, Australia, in 2004. Based on use of accepted values for crash savings, the NPV of those estimated savings compared to the proposed investments in improving blackspots in metropolitan areas delivers a benefit to cost ratio above 3:1, with a reduction in returns as programmes are expanded. In rural areas returns are lower. For reducing roadside hazards (a targeted but comprehensive network risk reduction approach) the benefit to cost ratios are estimated to be some 1.5:1. While the blackspot treatments address isolated high risk locations, the network crash risk treatments (e.g. roadside hazard reduction) seek to assess, identify and treat risk progressively across the whole network – consistent with seeking a safe system outcome. Selectively treating only high crash rate locations (using a blackspot approach) can serve to undermine the economic viability of network wide treatment in the medium term.
A mix of treatments can achieve better economic viability while making progress on achieving network wide risk reduction.

BUILDING THE ECONOMIC CASE FOR ROAD SAFETY INVESTMENT – 151
TOWARDS ZERO: AMBITIOUS ROAD SAFETY TARGETS AND THE SAFE SYSTEM APPROACH - ISBN 978-92-821-0195-7 © OECD/ITF, 2008
Figure 6.1. Preliminary estimates of the return on investment for road infrastructure safetyprogrammes for Victoria, Australia 2004
Source: VicRoads (2004).
6.4 Resource allocation
The precision with which road safety resources are allocated is important in making sure that the expected safety benefits are actually achieved and the public credibility of safety management systems is enhanced. The allocation of resources and the subsequent delivery of safety programmes is the final step in the chain of identifying crash costs, evaluating the most cost-effective programmes and securing sustainable funding.
The significance of the resource allocation task is well illustrated in New Zealand where a model was developed in 1996 for allocating road policing resources to achieve road safety targets (Land Transport Safety Authority, 1996). This model took into account a range of traffic volumes, population, crash factors and injury risk to draw firm conclusions regarding those regions where additional road policing resources should be applied and those behaviours to be targeted by additional policing resources. The model used marginal analysis to identify the best allocation of resources, and to estimate how much additional investment was needed and to inform where and how to spend the resources. Combined with a target setting model, this analysis identified a resource gap between the resources available in 1997 and the resources required to achieve New Zealand’s road safety targets in 2001. The analysis was a critical element leading to government decisions to significantly increase investment in road policing and subsequently achieve the country’s targets.
6.4.1. Resource allocation approaches
Resource allocation has to be based on a reliable framework. The goal is to channel available resources into those road safety activities that are likely to produce the maximum benefits for society as a whole. Typical allocation approaches include at least some assessment of what resources are available (inputs), what programmes will be delivered (outputs) and what will be achieved (outcomes). The body of evidence available to road safety managers means that road safety allocation mechanisms can be underpinned by rigorous cost-benefit analyses. It is important to note that while rational and scientific

152 – BUILDING THE ECONOMIC CASE FOR ROAD SAFETY INVESTMENT
TOWARDS ZERO: AMBITIOUS ROAD SAFETY TARGETS AND THE SAFE SYSTEM APPROACH - ISBN 978-92-821-0195-7 © OECD/ITF, 2008
analysis is available to road safety managers, it does not mean that this analysis will predominate in the final allocation. Poor decision making will however be more likely when managers do not outline the basic principles behind their proposed allocation.
Usually governments have long, medium and short term strategies in their annual budgetary strategy. Resources and funding are directed in all of these phases but with varying levels and accuracy. Efficient road safety programmes include targets that will direct the resource allocation through the application of benefit-cost analyses relating to specific safety measures or groups of measures. However, at a total societal level, road safety resource allocation may depend particularly on political evaluations and comparisons. Here the basic questions are usually how important and with what priority road safety should be taken into account when government activities are being planned. Public agencies thus need to advance road safety investment arguments based on rational approaches and to convince the public at large to support the allocation of resources to road safety.
Allocation problems also exist in relation to the allocation of resources across agencies, many of which may be responsible for safety programmes. Sectoral priorities can differ, particularly regarding the support given to identified road safety policies compared to other priorities. In the case of enforcement agencies, key issues include how traffic policing is managed within the total enforcement effort and how traffic policing is prioritised by management and staff. The challenge here is to analyse the allocation task within the context of the total benefit to society, in part a reflection of how road safety targets have been accepted and defined by governments.
In road safety policy making we need good tools to help policy makers choose between alternative policy options. The development of policy options is a political activity that involves practical and political feasibility judgements. Usually road safety policy making includes certain steps that bind the resource allocation phase to the process. The following steps are necessary for realistic allocation (Elvik and Vaa, 2004):
• Definition of safety targets and other policy options and objectives.
• Assessment of potential safety measures.
• Development of alternative policy options including different measures.
• Estimation of effects of alternative policy options on targets and objectives.
• Discussion of and taking into account the uncertainties of the process.
• Definition of the final road safety policy and resource allocation.
There are a number of barriers to the application of these steps, however, as illustrated in the ROSEBUD project, which identified solutions to these barriers, such as better training of professionals in the area, better assembly of known values around cost-effective treatments, and even legal remedies to embed economic assessment into decision making processes (Weserrmann and Hakkers, 2004). The embedding of economic analysis is perhaps best illustrated by the legal requirement for the Land Transport Safety Authority in New Zealand to promote “safety at reasonable cost”.
However, it is rare that economic transparency simply translates into an allocation of resources where projects are funded according to their net benefit to society. Safety projects that are highly beneficial to society are regularly overlooked in favour of less beneficial but more popular, or accepted, projects. In itself, this suggests that the allocation of societal resources to road safety require ethical issues and issues associated with the creation of a shared vision within the community that have been

BUILDING THE ECONOMIC CASE FOR ROAD SAFETY INVESTMENT – 153
TOWARDS ZERO: AMBITIOUS ROAD SAFETY TARGETS AND THE SAFE SYSTEM APPROACH - ISBN 978-92-821-0195-7 © OECD/ITF, 2008
addressed throughout this report, rather than technical analyses, needs considerable early attention when the economic case for road safety investment is being developed.
This connection between rational resource allocation, and ethical underpinnings of investment strategies, will become increasingly important in the private sector. It will be important for public agencies to facilitate mechanisms that allow the private sector to benefit from the supply of safe products and services. But these market mechanisms may be less effective if there is not an ethical underpinning to corporate decision making. This reinforces the notion that governments and road safety managers seeking to increase road safety investment, in either the public or private sphere, need to engage with leaders in all sectors of society.
Box 6.7. Resource Allocation and Management in New Zealand
Specific road safety budgets and allocation processes have been critical elements in improving road safety in New Zealand since 1990.
The social cost of road crashes in 2004 was NZD 3 624 million.
Revenue from user charges in the form of fuel taxes (NZD 1 315 million) and from vehicle registration and licensing fees (NZD 222 million) were directed to a dedicated National Land Transport Fund in 2004/05. These funds in the form of the New Zealand Road Safety Programme (NZRSP) have financed the national road policing programme, national road safety education, national publicity and awareness campaigns and national strategy management and coordination processes.
National and local low-cost safety engineering measures and general road network investments that contribute to improved road safety outcomes have been financed through the National Land Transport Programme (NLTP). The NZRSP and the NLTP both complement local government activity (funded through residential rates) within local communities and on local road networks. In addition, a compulsory injury insurance scheme, the Motor Vehicle Account (NZD 583 million) charges road users premiums to meet injury treatment, rehabilitation and compensation costs arising from motor vehicle crashes. While the bulk of this income is directed to injury management and rehabilitation, the injury insurer applies a portion of this account to safety promotion programmes.
Road safety has over the last 15 years been a key outcome sought from resources applied to the transport system. Road safety goals and targets are established by government. Budgets have been set to make progress towards and eventually achieve those goals and resource allocation procedures have been developed to support the best allocation of resources.
The best example of this is in the resourcing and allocation of enforcement budgets. Economic analyses of investments in enforcement inform decisions about the scale of Police budgets and the safety benefits that are expected as a result of best practice enforcement activity. With specific behavioural targets set, a resource allocation model breaks down the total resource available in the 12 Police districts and the resource to be applied in those districts to strategic enforcement activities (drinking and drugged driving, speeding etc). Police Commanders then work collaboratively with their local safety partners to make decisions on the specific deployment of enforcement patrols.
As of 2006/07, the NZRSP and the NLTP are being merged. This integration is to achieve further safety improvements from current spending. The central government funding agency is, for example, seeking a greater commitment from local government road authorities to lead localised road safety action planning. It is hoped that actions such as these will engender a greater commitment from road authorities to providing the safest possible road network for road users – just as Police have internalised the safety task. This will become increasingly important in New Zealand as road authorities take responsibility for trading off the quality of the infrastructure they can provide with the travel speeds that they manage.
Source: Land Transport Safety Authority.

154 – BUILDING THE ECONOMIC CASE FOR ROAD SAFETY INVESTMENT
TOWARDS ZERO: AMBITIOUS ROAD SAFETY TARGETS AND THE SAFE SYSTEM APPROACH - ISBN 978-92-821-0195-7 © OECD/ITF, 2008
Figures 6.2 and 6.3 give some insight as to how road safety managers have met the technical challenge of allocating resources at a system wide level. Specific allocations require more detailed consideration often on a cost benefit basis as discussed earlier.
Figure 6.2. Proportion of the road network associated with road safety problems
Targeting deaths and injuries
0%10%20%30%40%50%60%70%80%90%
100%
0% 20% 40% 60% 80% 100%Cumulative road length (%)
Cumulative traffic volume or social cost (%)
Traffic volumeSocial cost of crashes
20% of roads account for 79% of trafficand 87% of social cost of crashes
10% of roads account for 56% of trafficand 74% of social cost of crashes
Source: Land Transport Safety Authority (1996).
Figure 6.2 (derived from data analysis in New Zealand) recognises that a relatively small portion of the population and the road transport system is associated with most of the transport activity and most of the consequent road safety problem. Those parts of the network that are generating the most trauma are inevitably also where the greatest volume of traffic is occurring – in this case, 10% of the network could be identified as catering for 56% of the traffic and 74% of the trauma. The most significant reductions in trauma, and the most cost effective engineering or enforcement treatments, will therefore be available on that 10% of the network. Lower returns can be expected if safety resources are in the next 10% of the network, with investment in other parts of the network unlikely to be cost effective. Understanding injury occurrence, severity and frequency are critical to effective resource allocation.
Figure 6.3 (derived from data analysis in Victoria, Australia) illustrates the need to differentiate between, on the one hand, progressively reducing speed limits on roads where the crash risk is high and the traffic volume is low and on the other hand, delivering infrastructural based solutions for those high volume roads with relatively high crash risks. On the higher volume, economically important routes with a higher than average crash rate per distance travelled, there will be a requirement – and the likely economic justification – for upgrading infrastructure to a suitably safe standard.
However, for low volume routes with higher crash rates per distance travelled than average it is often unlikely that there is an adequate economic justification (compared to other demands on government funds) for some effective safety related works to be funded. For these locations it is important to review travel speeds and where necessary to reduce speed limits.

BUILDING THE ECONOMIC CASE FOR ROAD SAFETY INVESTMENT – 155
TOWARDS ZERO: AMBITIOUS ROAD SAFETY TARGETS AND THE SAFE SYSTEM APPROACH - ISBN 978-92-821-0195-7 © OECD/ITF, 2008
Figure 6.3. Selecting the appropriate interventions
Future Safe System application – Higher speed roads (>80 km/h) –a potential approach
Casualty Crashes per 10^8 Vehicle Kilometres Travelled (VKT) by Annual AverageDaily Travel (AADT) on Rural Road Sections in Victoria (excluding intersection
crashes)
0
5
10
15
20
25
30
35
40
45
0 2000 4000 6000 8000 10000 12000 14000 16000 18000 20000
Annual Ave rage Daily Trave l
Cas
ual
ty C
ras
hes
per
10^
8 V
KT
Review speedlimits
Infrastructure Solutions
Source: VicRoads.
Striking the optimum balance between speed reduction and infrastructure improvement is difficult. It requires significant investment support in infrastructure, a straightforward regulatory system that empowers road agencies to set appropriate safety limits and an effective policing agency to enforce limits on all roads. Moreover, it requires significant investment in analytical and educative activity to build understanding amongst the range of decision-makers and communities required to support the approach in practice.
6.5 Conclusions
Evaluation, funding and resource allocation activities require an understanding of economic analysis and its application in transport project settings, knowledge of how organisations and decision making systems function and a thorough grasp of modern road safety management principles. Road safety is an important societal investment, but it is not the only one. There will always be a competition for limited resources and any case for support for road safety programmes will need to include sound economic arguments backed by efficient allocation and management processes.
Cost-benefit analysis is an essential tool for demonstrating the socio-economic value of investments in road safety. In order to conduct these analyses, all countries need to have up-to-date estimates of the costs to society of fatalities, serious injuries and minor injuries, and be able to quantify their direct crash treatment costs and road safety investment expenditures.
Recommendations for improving the evaluation of socio-economic costs associated with road crashes, managing resources to best effect and marshalling new resource include the following:
• Clearly define both the financial and non-financial scale of the road safety problem at a national level, as this is critical to assessing the value to be gained from countermeasures.

156 – BUILDING THE ECONOMIC CASE FOR ROAD SAFETY INVESTMENT
TOWARDS ZERO: AMBITIOUS ROAD SAFETY TARGETS AND THE SAFE SYSTEM APPROACH - ISBN 978-92-821-0195-7 © OECD/ITF, 2008
• Consider the extent to which the national monetary value placed on road crashes incorporates the pain and suffering caused by road crashes.
• In developing strategies for achieving ambitious road safety targets, establish a sound scientifically based analytical framework with clear policy objectives and targets.
• Define and analyse the main policy options and policy scenarios and compare these options and scenarios with the available resources and with previous results and experiences.
• Consider the various funding avenues that may be available to increase investment in road safety countermeasures including approaches that encourage substantial injury insurer investment (with some government facilitation or financial involvement if necessary) in road trauma prevention.
• Include a reliable theory-based approach to allocating resources, principally either the cost-benefit or cost-effectiveness approach.
• Develop a national performance approach which as far as possible builds on an analysis of crash costs, the resources that are available or need to be made available and the allocation of available resources across the responsible agencies.
• Refine the evaluation, funding and allocation processes applying to road safety by investing in analysis in these areas and by examining past results, taking into account the uncertainties of the process.
This chapter highlights the need to know more about societal crash costs and road safety expenditures. The preliminary results from the few countries with adequate data show that expenditures on road safety are as low as one tenth of the social costs of crashes. In the case of Victoria, available figures indicate the possibilities of obtaining a return on direct investment which is commercially attractive to the insurers. The job of road safety managers will be that much harder if they do not recognise the value of good evaluation and monitoring of injury costs. They also need to understand how funding and allocation processes impact on the level of safety performance.
In the competition for funds from government to support innovative programmes, road safety practitioners need to be armed with strong financial evidence attesting to the costs and effectiveness of proposed interventions.
A step change in resources invested in road safety management and in safer transport systems is required to realise achievement of ambitious road safety targets in most of the world.

BUILDING THE ECONOMIC CASE FOR ROAD SAFETY INVESTMENT – 157
TOWARDS ZERO: AMBITIOUS ROAD SAFETY TARGETS AND THE SAFE SYSTEM APPROACH - ISBN 978-92-821-0195-7 © OECD/ITF, 2008
NOTES
1. Three methods are used for this calculation:
• For killed persons, gross loss of production also includes the loss of the (private) consumption of the victims mainly as a calculation element for taking human cost into account.
• Net loss of production excludes the (private) consumption of the victim and focuses on the loss for the rest of society, only. In this case, the personal loss borne by the victim is excluded.
• Value of lost years of life, i.e. an approach which tries to cover the loss of leisure time in addition to the loss of productive capacity by using some kind of opportunity cost derived from production losses.
2. The willingness to pay/accept evaluation approach is mainly performed by the following three methods:
• Contingent valuation assesses these values of statistical life by simulating a market situation in which an individual can choose between different risk options “sold” at different prices.
• Hedonic wages valuation assesses these values from different wages, paid for risk-prone jobs depending on the level of risk workers have to face in their job.
• Preventive expenses valuation tries to derive these values mainly from society’s decisions on safety measures and risk levels.

158 – BUILDING THE ECONOMIC CASE FOR ROAD SAFETY INVESTMENT
TOWARDS ZERO: AMBITIOUS ROAD SAFETY TARGETS AND THE SAFE SYSTEM APPROACH - ISBN 978-92-821-0195-7 © OECD/ITF, 2008
REFERENCES
Aeron-Thomas, A., A.J. Downing, G.D. Jacobs, J.P. Fletcher, T. Selby and D.T. Silcock (2002), Reviewof Road Safety Management Practice, Final Report. 2002, Transport Research Laboratory Limited with Ross Silcock, Babtie Group Ltd, United Kingdom.
AVV (2005), Bereikbaarheid en ondernemingsklimaat, Adviesdienst Verkeer en Vervoer, Rotterdam.
AVV (2006), Kosten verkeersongevallen in Nederland, Ontwikkelingen 1997-2003, Adviesdienst Verkeer en Vervoer, Rotterdam.
ECORYS (2006), Impact Assessment, Road Safety Action Programme, European Commission – DG Energy and Transport.
ECMT (2001), Economic Evaluation of Road Traffic Safety Measures, Round Table 117, ECMT Publications, Paris.
Elvik, R. and T. Vaa (2004), The Handbook of Road Safety Measures, Elsevier, London.
Elvik, R. (1999), How much do road accidents cost the national economy? Accident analysis and prevention, Elsevier.
European Commission (1994), COST 313 Socio Economic Costs of Road Accidents. Report EUR 15464 EN, Brussels, Commission of the European Communities.
Jacobs, G. (2000), Estimating Global Road Fatalities, Transport Research Laboratory, Report 445, Crowthorne, England.
Land Transport Safety Authority (1996), “A road safety resource allocation model”, Safety Directions Working Paper 1, New Zealand, Wellington.
Land Transport Safety Authority (2000), “Predicting and costing road safety outcomes”, Safety Directions Working Paper 6, New Zealand, Wellington.
OECD (2002), Safety of Roads, What is the Vision, OECD, Paris.
Peltola, H., et al. (2005), Evaluation of road traffic safety measures and experience of preparing a trafficsafety programme, Ministry of Transport and Communications Finland.
Wesermann, P. and S. Hakkert (2004), ROSEBUD, Workpackage 3, The use of efficiency assessmenttools: solutions to barriers, European Commission, Directorate General for Energy and Transport.

MANAGING EFFECTIVE STRATEGIES AND CREATING A SUPPORTIVE POLITICAL ENVIRONMENT – 159
TOWARDS ZERO: AMBITIOUS ROAD SAFETY TARGETS AND THE SAFE SYSTEM APPROACH - ISBN 978-92-821-0195-7 © OECD/ITF, 2008
7. MANAGING EFFECTIVE STRATEGIES AND CREATING A SUPPORTIVEPOLITICAL ENVIRONMENT
ABSTRACT
Effective implementation of the strategies and actions required to achieve ambitious road safety targets needs a positive political environment and synergies with other related policy areas. The support of the public is also critical, and to improve the likelihood of public support, implementation of new countermeasures needs to include (and be preceded by) supportive public information campaigns.
The chapter explores the requirements for effectively managing a road safety programme, identifies the main issues likely to influence success and provides possible means to address those issues. It presents the key principles and practices involved in effectively managing a road safety program, particularly the institutional and management frameworks and related matters. The principles and practices are applicable to programmes within a broad range of ambitions.
7.1. Introduction
Although many countries have experienced improvements in road safety over the last thirty years, this progress has often been achieved by a micro approach to address specific problems, rather than by a more systematic macro approach as described in earlier chapters. In the future, effective implementation of the strategies and actions required to achieve ambitious road safety targets will be more likely to be feasible if supported and encouraged through a positive political environment and synergies with other related policy areas. Effective implementation occurs at two levels: strategic planning, often occurring at a national level; and detailed implementation of particular road safety programmes and countermeasures. Strategic planning encompasses all the elements of the Institutional Management Functions layer, with particular emphasis on Results Focus, which is fully described in chapter 4 Managing Road SafetyProgrammes for Results. The Safe System approach to road safety management emphasises the need to align safety decisions with broader community values. This will be facilitated by a supportive political environment that makes road safety a priority for action and for governmental funding. A coherent strategy based on a comprehensive knowledge base using crash and other data is necessary to achieve a detailed understanding of the scale of the road safety problem and the measures available to reduce casualties. Information on the efficacy of countermeasures also needs to be gathered to ensure cost-effectiveness and to optimise the use of scarce resources.
7.2. Creating the supportive political environment using a results focus
7.2.1. The need for political will to make road safety a governmental priority
Creating a positive political environment is essential if governments are to give road safety the priority justified by the prevailing levels of death and injury that occur on the roads in all OECD/ITF member countries and elsewhere.

160 – MANAGING EFFECTIVE STRATEGIES AND CREATING A SUPPORTIVE POLITICAL ENVIRONMENT
TOWARDS ZERO: AMBITIOUS ROAD SAFETY TARGETS AND THE SAFE SYSTEM APPROACH - ISBN 978-92-821-0195-7 © OECD/ITF, 2008
Government support for any public policy issue is always subject to limits of available time (for policy development and legislation) and resources (in terms of staffing and budgetary allocations). Road safety competes with other public policy subjects for political support that may appear either more important or attractive to the politicians who will ultimately decide on the priorities of their administrations. Many factors (including the level of public interest and public pressure, the economic and political feasibility of solutions and the prospects of demonstrable success) determine whether road safety will be treated as a government priority. Accordingly it is necessary to influence positively the political process of policy assessment through a variety of strategies.
Foremost among these strategies is the creation of a lead agency with the objective of vigorously promoting road safety within government decision-making bodies, and developing strong arguments to ensure that sufficient funds and other resources are allocation to this issue. This agency also needs to coordinate activity between government departments and encourage delivery partnerships between government and non-governmental organisations at all levels of development and implementation. Other promotional needs are discussed later in this chapter.
7.2.2. Using evidence to promote political support
Road safety planners need to address a basic issue: how much road safety does each society want? For instance, in most European countries, the public has supported a maximum blood alcohol level of 0.5 g/l, whereas in the United States it took significant effort just to reduce the maximum blood alcohol rate from 1 g/l to 0.8 g/l. Any planned road safety measure needs to consider these types of cultural factors and how proposed countermeasures can be marketed and made acceptable to the general public. In general, the more the public recognises the seriousness of an underlying problem and agrees to be regulated in regard to that problem, the more likely its compliance.
Road safety is often a ‘hard sell’ to politicians. Effective injury reduction strategies often require measures that seek to curb high-risk behaviours which are widely tolerated by the public due to lack of awareness of the true level of risk, e.g. speeding. It can be difficult to persuade politicians to promote road safety initiatives that are expected to be unpopular. Particularly in such circumstances, politicians need positive results in a timeframe that is meaningful to them. Support is unlikely if the reductions in deaths and injuries are either only vaguely promised or will occur only years after the end of a government’s term of office. Road safety policy makers and advocates must therefore accommodate the practical realities of political decision-making by empirically demonstrating the value of perhaps unpopular road safety policies, to enable politicians to stand firm in the face of opposition.
Box 7.1. Assessing effects of limits of political commitment to road safety
A case study of the gap between outcomes that can be delivered by a traditional road safety partner/lead agency (in this case the road authority) and those potentially available from the full mix of policy, legislative and enforcement options with the full support of government has been outlined by Elvik ( 2007) for Norway.
Elvik stated that “Norwegian politicians are opposed to quantified road safety targets, arguing that it is unethical to set such targets and that the only defensible target is zero road accident fatalities”. He then analysed the impact this position will have on the estimated reductions in road trauma to be achieved in Norway over the next strategy period from 2008 to 2020.
The preliminary goal of the Norwegian strategy to 2020 is a 50% reduction in deaths and serious injuries from 2003-2006 average levels – i.e. from 250 to 125 annual deaths and from 980 to 490 serious injuries. A series of intermediate and final outcome indicators have been identified by the road safety agencies as goals which, if achieved, would deliver a better outcome than the preliminary target (reduction to 101 annual deaths) if successfully applied.

MANAGING EFFECTIVE STRATEGIES AND CREATING A SUPPORTIVE POLITICAL ENVIRONMENT – 161
TOWARDS ZERO: AMBITIOUS ROAD SAFETY TARGETS AND THE SAFE SYSTEM APPROACH - ISBN 978-92-821-0195-7 © OECD/ITF, 2008
However, Elvik contended that the road authority does not have the policy instruments to directly implement measures to reduce deaths to the extent required, relying on government action for new laws and enhanced enforcement and upon the EC and UN-ECE for changes to vehicle regulation. He also asserted that for a number of the performance indicators sought there are in fact no proven means of achievement and that therefore they are not meaningful in a target sense.
He looked at what target would be achievable for the reduction of fatalities and seriously injured road users by using known cost – effective road safety measures and then considered the potential target achievement if the subset of cost effective measures which are acceptable to (and whose achievement is within the power of) government were to be implemented. Table 7.1 below indicates that use of cost – effective measures would not achieve the target but it is estimated they would reduce deaths to 142 annually. However, based on an assessment of the subset of measures which government has the power and the preparedness to implement, there would be an estimated reduction of fatalities to 171 by 2020.
Table 7.1. Expected number of road users killed or seriously injured in Norway in 2020if cost effective road safety measures are implemented
Description of assumptions Killed Seriously injured
Mean annual numbers 2003- 2006 (basis for targets for 2020) 250 980
Target for 2020 (50% reduction of baseline numbers) 125 490
Expected number in 2020 if no road safety measures are introduced 285 1 109
Expected number in 2020 if all targets for road safety indicators are realised 101 534
Expected number in 2020 if all cost – effective measures are implemented 142 665
Expected number in 2020 if cost – effective measures controlled by the Norwegian government are introduced
171 766
Elviks’ paper highlights the political challenges in achieving improved road safety outcomes. He pointed out that the above ambitious preliminary target (50% reduction target) developed for Norway has not so far received political support. He also indicates that a similar system of targets developed for the revision of the national transport plan for Norway for the term 2006 – 2015, including road crash fatality reduction, did not get political support.
Elvik suggested, “Road safety management by objectives is an attractive idea, but Norwegian experience so far suggests that successful implementation of the idea requires more firm institutional and political foundations for the system than the Public Roads Administration has been able to create. The lack of support for quantified road safety targets among Norwegian politicians means that an effective system of management by objectives does not really exist in Norway. The targets set for the road safety indicators basically serve as administrative guidelines for the Public Roads Administration. While these targets may not be entirely worthless, their value would no doubt increase if the targets were more widely publicised and more prestige invested in their attainment. Successful road safety management requires a firm commitment to such a system from the top management – in the present case from leading politicians. In the absence of this support, the system becomes nothing more than a paper tiger”.
The preparation of evidence based strategies can also benefit from synergies with activities of other related government departments and with other compatible government policy areas. For example, measures to promote ‘greener’ driving can be partnered with better enforcement of speed limits if the environmental benefits of reduced speeds can be readily demonstrated to the public. In this way, road safety can be integrated ‘vertically’ into the priorities of other government departments and agencies to achieve “win-win” outcomes.

162 – MANAGING EFFECTIVE STRATEGIES AND CREATING A SUPPORTIVE POLITICAL ENVIRONMENT
TOWARDS ZERO: AMBITIOUS ROAD SAFETY TARGETS AND THE SAFE SYSTEM APPROACH - ISBN 978-92-821-0195-7 © OECD/ITF, 2008
The highest levels of government should especially be targeted to ensure sustained effort to reduce road injuries. In France, for example, President Chirac identified road safety as a personal priority for his administration following his re-election in 2002. Political leadership of this kind sent a powerful message to government departments, the police and to the public about the high cost of road injuries and the importance of combating them. With better enforcement of road traffic regulations, new policy measures and much higher public awareness of the issue, the number of road crash fatalities fell in France by 38%, from 7 655 in 2002 to 4 709 in 2005.
Support also needs to be sought in the wider community, where effective lobbying can influence the political profile of road safety. Where lobby groups are well informed and recognise the need to work constructively with government, they can create a dialogue that can lead to mutual understanding and allow progress to be made. For example, in the United Kingdom, considerable progress has been made in recent years on policy for motorcycling, including safety, by Government and interest groups working constructively together. An Advisory Group on Motorcycling was set up by the Department of Transport, chaired by a Minister. Through regular meetings and discussion where all parties had the opportunity to have their views considered, an agreed strategy on motorcycling was produced (Department for Transport, 2005).
It is also important that political support is matched not only to commitment to regulation and legislation but also to a commitment to funding, with a long term vision.
Wherever possible ‘early wins’ should be identified and used to reinforce particularly political support for the overall strategy. This may involve setting targets or adopting measures that are less demanding in the early phase of implementation but give encouragement to move forward more aggressively at a later stage. Using evidence to report and publicise early successes gives confidence to the strategy and will win further support from within government circles. Promoting the positive impact of countermeasures with significant target groups in the community, such as parents, can also help to reduce resistance from other road users. This results-focused approach strengthens political and community commitment by showing that proven measures will produce real gains.
Box 7.2. Third Party Groups and Their Impacts on Highway Safety
In the United States, third party organisations concerned with highway safety are often among safety regulators’ strongest allies, but they can also be the governments’ strongest critics. Their participation in safety initiatives can range from working at the grassroots level to raise awareness of a safety risk, to applying more sophisticated and professional political lobbying intended to present their agendas to legislators and other senior government officials. Professional organisations in the United States, such as Advocates for Highway and Auto Safety and the Insurance Institute for Highway Safety, take a comprehensive and business-like approach to safety issues. These organisations typically were not created in response to a single incident, but rather apply their resources to promoting technical and legal, as well as legislative and regulatory aspects of highway safety.
Other organisations have been initially formed often as a result of a particular incident. These groups most often base their activities on the victims of road safety tragedies and often use emotional pleas for increased safety. Examples of these organisations include Mothers Against Drunk Drivers (MADD) and Parents Against Tired Truckers (PATT). In spite of their often narrow and local beginnings, groups such as these have often expanded to become extremely influential in national highway-safety policymaking in the United States.

MANAGING EFFECTIVE STRATEGIES AND CREATING A SUPPORTIVE POLITICAL ENVIRONMENT – 163
TOWARDS ZERO: AMBITIOUS ROAD SAFETY TARGETS AND THE SAFE SYSTEM APPROACH - ISBN 978-92-821-0195-7 © OECD/ITF, 2008
Mothers Against Drunk Drivers was founded and incorporated in 1980 four months after a mother’s 13-year-old daughter was killed by a drunk-driver in Fair Oaks, California. The driver had three prior drink-driving convictions and was out on bail from a hit-and-run arrest two days earlier. In the last 27 years, MADD has grown to over 600 chapters, Community Action Teams and State offices. MADD's mission is to stop drink-driving, support drink-driving victims, and prevent underage drinking. MADD’s current agenda advocates mandatory alcohol testing for accidents resulting in death and serious injury; the development and implementation of technology to assist in the enforcement of drink-driving law and to include passive alcohol sensors, videotaping of offenders, and in-vehicle computer terminals for license/criminal records checks.
Parents Against Tired Truckers was formed in May 1994, after a heavy goods vehicle driver fell asleep at the wheel of his truck, killing four teenagers. PATT grew from a small Maine grassroots group to a nationally recognised organisation which focuses on: commercial truck driver fatigue and changes in drivers’ duty hours-of-service rules; legislation mandating that drivers get paid not by the mile, but in accordance with all hours worked; instituting on-board computers that record safety events; and, ensuring the availability of safe rest areas for drivers.
7.2.3. Using evidence to promote public support
Public opinion represents a key stimulus to political will for road safety. It will always be easier for a government to make road safety a priority if the public supports the effort. Using evidence to mobilise public as well as political support for road safety should, therefore, be an integral part of a fully comprehensive road safety strategy. Effective communication and education campaigns, especially when based on actual achievements, can help to generate the public demand for safer transport which, in turn, will encourage politicians to give road safety greater priority in government. Using the media to publicise both the scale of the road toll and the feasibility of the solutions, is a major challenge to be tackled as part of this task.
Non-governmental organisations and pressure groups often play an important role in generating public and political support. The natural caution of governments may be overcome in the face of well researched and cogently presented evidence for effective road safety measures. Such an approach can foster the right climate of opinion for progress to be made.
The opportunity for increased public support for road safety strategies which can be obtained through achieving extensive public involvement in the full strategy development process are discussed in Section 7.3.3.
7.3. Setting strategic goals and achieving strategic outcomes
7.3.1. What are the key elements of results focus for effective road safety management?
Results focus is the set of requirements that need to be pursued vigorously if road safety performance is to be effective and achieve planned results.
Specifically, a country with a strong results focus will:
• Identify the lead government agency for road safety.
• Establish clear roles and responsibilities for the major road safety agencies.

164 – MANAGING EFFECTIVE STRATEGIES AND CREATING A SUPPORTIVE POLITICAL ENVIRONMENT
TOWARDS ZERO: AMBITIOUS ROAD SAFETY TARGETS AND THE SAFE SYSTEM APPROACH - ISBN 978-92-821-0195-7 © OECD/ITF, 2008
• Develop the management capacity to deliver:
− In –depth understanding of the road safety issues in the country.
− Strategies and targets to meet an agreed level of ambition or vision.
− Effective interventions.
− Reviews of performance.
− Confidence by government and the community in the level of competence.
7.3.2. The importance of a lead agency and clear accountabilities
A key recommendation of the World Report on Road Safety (WHO, 2004) was that there should be a lead agency within central government with responsibility for road safety – with the precise form of the agency varying according to the political and administrative arrangements in particular countries.
A lead agency that is politically accountable for achieving the targeted improvements in road safety is much more likely to drive coordinated effort and outcome achievement across the range of stakeholders. However, the agency should regard itself as a “first among equals” to respect the separate responsibilities and reporting relationships of other agencies.
Other major government stakeholders also need to have their roles and responsibilities clearly defined by government to ensure that they play their agreed part in implementation. The performance of all of these stakeholders in achieving outcomes should be regularly measured and reported to government in a joint agency review of progress.
Mechanisms such as signed memoranda of agreement should be adopted by the lead agency with (and between) other responsible agencies in order to formalise commitment to the targets, strategies, intermediate and final outcomes and necessary outputs to achieve these that have been developed and agreed.
The lead agency has a particular responsibility to facilitate these arrangements.
In countries with shared responsibility for road safety such as Canada, the United States, Germany and Australia where provinces, territories or states have major responsibilities regarding the licensing of vehicles and drivers, maintaining driver records, design and maintenance of road infrastructure, collection of collision data, traffic enforcement, adjudication of traffic offences and road safety promotion, the federal lead agency will usually set national goals and policies, facilitate data exchange and comparisons and set vehicle safety standards. However, each jurisdiction (state or province) is usually responsible for addressing the road safety issues within their territory, developing and implementing their strategies and coordinating across borders with other jurisdictions and the national lead agency to seek consistency and compare relative performance.
7.3.3. In–depth understanding of the road safety issues in the country
A prerequisite for addressing the problem of death and injury on the roads is adequate knowledge as a basis for developing a strategy for action. Lack of evidence about the numbers of road crashes and their circumstances is likely to mean a lack of awareness about the problems, action that will be unfocused and objectives that will be unclear. Further, without sound data, there is no credible way to refute opponents of road safety investments or to evaluate the outcomes of the action.

MANAGING EFFECTIVE STRATEGIES AND CREATING A SUPPORTIVE POLITICAL ENVIRONMENT – 165
TOWARDS ZERO: AMBITIOUS ROAD SAFETY TARGETS AND THE SAFE SYSTEM APPROACH - ISBN 978-92-821-0195-7 © OECD/ITF, 2008
The OECD report, Safety on Roads: What’s the Vision (OECD 2002), showed the importance of road safety visions, targets and plans, underpinned by comprehensive crash and other data. Without an evidence-based planning approach with clearly articulated objectives, it is unlikely that an effective strategy can be developed or implemented.
A first priority is the development of reliable national and local systems for collection of crash statistics. Data may be provided from police reports, from health authorities or from insurance companies depending on the most practicable arrangements in any particular country. Systems for data collection exist in most OECD countries, but the quality and comprehensiveness of the data are highly variable. In many low and medium income countries, there are no national crash data systems. This lack of data makes it difficult to highlight road safety as a priority for action at the strategic level, or to have a consistent evidence-based approach to problem identification and countermeasure development and implementation.
Good data systems (in terms of scope, collection procedures and quality arrangements) first and foremost need to measure crash occurrence and key risk factors. Systems also need to extend to measuring intermediate outcomes (such as mean free speeds, speeding offence levels, alcohol impaired driving rates, seat belt wearing rates, network route safety level ratings, vehicle fleet safety ratings) and major other influences on road safety outcomes (e.g. travel growth, alcohol consumption and drug taking trends, heavy vehicle, motorcycle and moped growth). In addition, competent analysis of these data is a critical requirement for any country aspiring to improve road safety performance.
The value of these requirements is demonstrated in Chapter 2.
7.3.4. The process of strategy development
Planning for road safety is not just the responsibility of central government. It is essential to have a good consultative process with stakeholders and with the wider community to ensure that plans will be acceptable and practicable, with maximum ownership from stakeholders. Without this consultation, implementation will be more difficult and there may be resistance to taking action. Early and comprehensive consultation will also increase knowledge as well as avoid the “not invented here” syndrome when the strategy is launched. At the very least, early consultation needs to involve transport, health, education and planning authorities.
A suitable planning timeline also needs to be identified. If the timeline is too long, it will be more difficult to prioritise action; if too short, it will result in a focus on short-term policies, ignoring those that take longer to deliver. The strategy should clearly identify policies to be implemented in short, medium and longer time periods, with commensurate milestones to monitor on-going progress. As part of this planning, it is necessary to recognise the time period between policy implementation and results being sought. For example, new vehicle safety measures take several years to deliver effects as they are dependent on the rate of turnover of the vehicle fleet.
A strategy should articulate not only the proposed cost effective interventions, but also the institutional arrangements to be adopted to deliver the specified road safety outcome targets – with an eye to the long term ambition as well as the focus on the short term interim targets. This will include identification of the accountable agencies for the key associated actions.
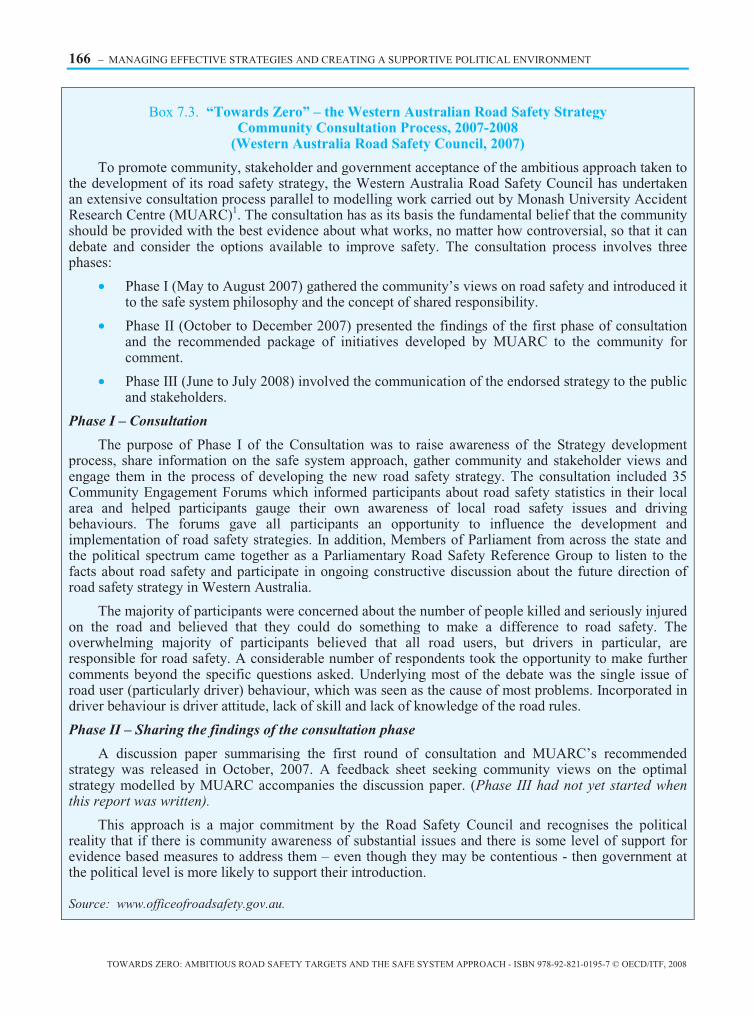
166 – MANAGING EFFECTIVE STRATEGIES AND CREATING A SUPPORTIVE POLITICAL ENVIRONMENT
TOWARDS ZERO: AMBITIOUS ROAD SAFETY TARGETS AND THE SAFE SYSTEM APPROACH - ISBN 978-92-821-0195-7 © OECD/ITF, 2008
Box 7.3. “Towards Zero” – the Western Australian Road Safety StrategyCommunity Consultation Process, 2007-2008
(Western Australia Road Safety Council, 2007)
To promote community, stakeholder and government acceptance of the ambitious approach taken to the development of its road safety strategy, the Western Australia Road Safety Council has undertaken an extensive consultation process parallel to modelling work carried out by Monash University Accident Research Centre (MUARC)1. The consultation has as its basis the fundamental belief that the community should be provided with the best evidence about what works, no matter how controversial, so that it can debate and consider the options available to improve safety. The consultation process involves three phases:
• Phase I (May to August 2007) gathered the community’s views on road safety and introduced it to the safe system philosophy and the concept of shared responsibility.
• Phase II (October to December 2007) presented the findings of the first phase of consultation and the recommended package of initiatives developed by MUARC to the community for comment.
• Phase III (June to July 2008) involved the communication of the endorsed strategy to the public and stakeholders.
Phase I – Consultation
The purpose of Phase I of the Consultation was to raise awareness of the Strategy development process, share information on the safe system approach, gather community and stakeholder views and engage them in the process of developing the new road safety strategy. The consultation included 35 Community Engagement Forums which informed participants about road safety statistics in their local area and helped participants gauge their own awareness of local road safety issues and driving behaviours. The forums gave all participants an opportunity to influence the development and implementation of road safety strategies. In addition, Members of Parliament from across the state and the political spectrum came together as a Parliamentary Road Safety Reference Group to listen to the facts about road safety and participate in ongoing constructive discussion about the future direction of road safety strategy in Western Australia.
The majority of participants were concerned about the number of people killed and seriously injured on the road and believed that they could do something to make a difference to road safety. The overwhelming majority of participants believed that all road users, but drivers in particular, are responsible for road safety. A considerable number of respondents took the opportunity to make further comments beyond the specific questions asked. Underlying most of the debate was the single issue of road user (particularly driver) behaviour, which was seen as the cause of most problems. Incorporated in driver behaviour is driver attitude, lack of skill and lack of knowledge of the road rules.
Phase II – Sharing the findings of the consultation phase
A discussion paper summarising the first round of consultation and MUARC’s recommended strategy was released in October, 2007. A feedback sheet seeking community views on the optimal strategy modelled by MUARC accompanies the discussion paper. (Phase III had not yet started whenthis report was written).
This approach is a major commitment by the Road Safety Council and recognises the political reality that if there is community awareness of substantial issues and there is some level of support for evidence based measures to address them – even though they may be contentious - then government at the political level is more likely to support their introduction.
Source: www.officeofroadsafety.gov.au.

MANAGING EFFECTIVE STRATEGIES AND CREATING A SUPPORTIVE POLITICAL ENVIRONMENT – 167
TOWARDS ZERO: AMBITIOUS ROAD SAFETY TARGETS AND THE SAFE SYSTEM APPROACH - ISBN 978-92-821-0195-7 © OECD/ITF, 2008
7.3.5. Objectives and target setting
Chapter 1 discussed targets in detail. This section describes the key elements in the target setting process that are relevant to effective strategy development.
A road safety strategy is most effective if it is linked to clear objectives and time-specific numerical targets. Specific targets are a focus for action, and combined with monitoring of progress, are also a spur to action. Targets can be derived through either a top-down or bottom-up approach, although in practice the division is seldom black and white. The former may produce a more idealistic, aspirational target that is not necessarily linked to data, plans or resource allocation. Bottom-up approaches typically are based on knowledge of crash trends and on the estimated effects of implementing available road safety measures and may result in attainable but weak targets. To be an effective spur to action, to prompt innovative problem-solving, to achieve the target and to command the support of the public and policy makers, it is important that targets be seen as challenging but attainable. Overly ambitious targets may be ignored as unattainable.
It is considered good practice for countries to strive to develop bottom-up targets based upon specific interventions. This provides the potential for dialogue with the political level as well as the public to clearly identify the links between proposed measures and likely trauma reductions. Without these specific links being clearly specified and broadly understood, obtaining political support for many measures – especially those seeking widespread behavioural change – is more problematic.
Some jurisdictions have utilised “discussion papers” signed off by government which have been the focus of community consultation efforts, with much of the feedback received at public meetings and through correspondence being incorporated into the final strategy placed before government for adoption. It is considered important that the public is exposed to the issues associated with development of a road safety strategy and is not excluded from the information and knowledge associated with the development process. Some governments are not comfortable with adopting this approach.
Setting an appropriate target is but one element of effective planning. A strategy plan as outlined above is also required that includes a policy framework and a clear programme for delivery of action to achieve the target. Usually the analysis that underpins the choice of a bottom-up target will be the key input to creating that programme, while top-down targets do not necessarily preclude such an approach. Regardless of how targets have been derived, they must be accompanied by high-quality analysis and forward-looking development of policy and programme frameworks.
Ownership of targets by stakeholders and all delivery agents is needed to ensure that all players are fully engaged in making their contribution to delivery of the strategy. Targets solely imposed by the central government are less likely to be achieved than those that have been developed with the agreement of those responsible for delivery. However, achieving a consensus must not preclude challenge, and political leadership may sometimes be needed to persuade delivery agents to support the required degree of ambition.
For those countries that adopt a Safe System approach, at least some measures will be effective in reducing serious casualty risk only on a fairly long time scale (e.g. alcohol interlocks being operational in every vehicle in the fleet). It is critical that long term measures – along with other interventions yielding greater benefits in the short and medium terms – continue to receive attention and support.
168 – MANAGING EFFECTIVE STRATEGIES AND CREATING A SUPPORTIVE POLITICAL ENVIRONMENT
TOWARDS ZERO: AMBITIOUS ROAD SAFETY TARGETS AND THE SAFE SYSTEM APPROACH - ISBN 978-92-821-0195-7 © OECD/ITF, 2008
Box 7.4. Case Study: Targeting the future in Great Britain
The approach adopted in Great Britain in developing a road safety strategy and targets for 2010 illustrates these principles. An earlier target had been set for 2000, and in 1996 work began to consider the best approach to the post-2000 period. In looking forward to the years beyond 2000 it was necessary to review progress to date and to consider how to build on the success of the current target in the new century. As part of the process, it was decided to consult widely on the different options for a new target.
Three documents spelt out the framework for the future. “Targeting the Future” supported the concept of a new target, and set out options for the type of target, and the target date. “Road Safety: Towards Safer Roads” summarised the current casualty position in terms of trends, problems and priorities, and “Road Safety Strategy: Current problems and Future Options” presented the analyses in more detail.
A Steering Group and related sub-groups were subsequently established. In parallel with the sub-groups discussing policy options, a group was set up to take forward statistical forecasting and analysis to produce options for a national target. The effects of past policies were analysed, and casualty forecasts for 2010 for a range of possible scenarios were produced, building in assumptions on trends in casualty rates, traffic growth and the effects of future policies. The results of this modelling were used to inform further work on policy development and the final choice of the new target for 2010. In March 2000 the new Road Safety Strategy and targets for 2010 were published. (DfT 2000).
Following the publication of the Strategy, arrangements were put in place for monitoring progress. A Road Safety Advisory Panel (RSAP) was appointed with membership drawn from representatives of all main stakeholders. A schedule of all policy actions in the Strategy was drawn up, and regular reports on progress are published on the Department for Transport (DfT) website. In addition, the road safety targets were brought into the government’s Public Service Agreement (PSA) system as official PSA targets for the Department for Transport.
A system for regular three yearly reviews of progress was established and a report on the first Three Year Review was published in 2004 (DfT 2004). The second Three Year Review was published in March 2007 (DfT 2007). This Review identified the key issues that need to be addressed in planning for the post-2010 period, and a Road Safety Delivery Board has been set up to facilitate policy development and delivery. Extensive consultation is planned in support of the next road safety strategy beyond 2010.
7.4. Co-ordination of road safety management
7.4.1. An effective decision making hierarchy for road safety
Particularly in countries which share responsibilities for road safety across different government levels, it is critical that there be coordinating bodies to integrate overall activity. For example, the Canadian Council of Motor Transport Administrators (CCMTA) has representatives from all levels of government who participate in cooperative and collaborative activity to promote road safety in Canada. The CCMTA reports to a Council of Ministers Responsible for Transportation and Highway Safety through a Council of Deputy Ministers. In Australia, there are similar coordinating bodies that manage the National Road Safety Strategy. In the State of Victoria, there is a Cabinet Committee for Road Safety supported by executive and management committees of officers in the road safety agencies which ensures a high level of commitment to, and accountability for, improving road safety across different State departments.

MANAGING EFFECTIVE STRATEGIES AND CREATING A SUPPORTIVE POLITICAL ENVIRONMENT – 169
TOWARDS ZERO: AMBITIOUS ROAD SAFETY TARGETS AND THE SAFE SYSTEM APPROACH - ISBN 978-92-821-0195-7 © OECD/ITF, 2008
It is considered critical that coordination arrangements do not extend the membership of high level committees to the point where frank discussion and effective decision making are totally compromised.
The key road safety government agencies are able (and expected) to commit to ongoing actions and resourcing to achieve agreed performance targets. This often requires frank and forthright negotiation about performance and financial commitment between agency heads. It is not realistic to expect senior government officers to speak as candidly about commitments of this nature in the presence of a large group, and particularly with non–government stakeholders present. Suggested coordination arrangements are as follows:
• A coordinating hierarchy comprising decision-making and consultation levels at national level. The upper levels of the coordination hierarchy need to be kept small to promote accountability and might be restricted to those ministries responsible for infrastructure/transport, police, roads, justice, health and education. The road safety executive council and the road safety managers working group of senior government officials are at the core of the hierarchy. Coordinated consultation across the broader stakeholder partnership is carried out lower down the hierarchy (See Figure 7.1).
• Build or develop key partnerships between stakeholders, e.g. police and roads authorities.
• Engage the road safety NGO sector in the coordination hierarchy and create a range of partnerships to achieve results.
• Engage professionals and their organisations in road safety, e.g. engineering and medical professions and utilise the substantial technical capacity which exists in target setting and strategy development.
• Encourage all party Parliamentary transport and health interest in road safety.

170 – MANAGING EFFECTIVE STRATEGIES AND CREATING A SUPPORTIVE POLITICAL ENVIRONMENT
TOWARDS ZERO: AMBITIOUS ROAD SAFETY TARGETS AND THE SAFE SYSTEM APPROACH - ISBN 978-92-821-0195-7 © OECD/ITF, 2008
Figure 7.1. National road safety co-ordination council
The National Road Safety Council comprises a decision-making hierarchy and partnership for achieving road safety results through the development and implementation of a well-developed and coordinated road safety strategy and targets which have been agreed across Government.
The hierarchy comprises three main levels:
The Road Safety Executive Council comprises the Chief Executives (Secretaries/Assistant Ministers) of the key governmental stakeholders and reports to, supports and receives direction from Ministers. Its role is in communicating, coordinating and agreeing on top-level strategy between agencies on road safety issues. It monitors and reports progress to the Government through its Ministers, who sign off the national road safety strategy based on detailed plans for the outputs of the key stakeholders to achieve results. The Group meets approximately 4 times each year and the Chair is occupied by the lead agency for road safety strategy development and coordination.
The Road Safety Managers’ Working Group is the hub of the road safety co-ordination meeting monthly and comprises senior managers from Government departments with responsibilities for day to day road safety management. The Chair is occupied by the lead agency for road safety. With the lead agency as the key link, the group coordinates implementation of the road safety strategy, develops and implements programmes and interventions, reviews identified programmes, identifies research priorities, and promotes and monitors a coordinated country-wide programme of activities. The Group can set up Technical Working Groups to assist its activity.
The Road Safety Advisory Group is a consultative body comprising all the main road safety stakeholders, including the non-governmental sector, which meets quarterly and is chaired by the lead agency head of road safety.
The Coordination Secretariat is a dedicated, funded unit which sits within the road safety strategy unit of the road safety department of the lead agency.

MANAGING EFFECTIVE STRATEGIES AND CREATING A SUPPORTIVE POLITICAL ENVIRONMENT – 171
TOWARDS ZERO: AMBITIOUS ROAD SAFETY TARGETS AND THE SAFE SYSTEM APPROACH - ISBN 978-92-821-0195-7 © OECD/ITF, 2008
The absence of a strong lead agency to coordinate activities can result in the diffusion of authority that allows public authorities to avoid accountability for road safety, which represents one of the most difficult barriers to overcome when implementing effective countermeasures. In some federal states, licensing of motor vehicles and operators is the primary responsibility of one government agency, while safety is the primary responsibility of a separate agency. Licensing of safe vehicles and drivers are primary elements of safe transportation systems. But if these elements are fragmented to the point where they lack a common and singularly accountable official and cannot or will not work together, effective outcomes are often stymied.
Box 7.5. Case Study: Road Safety Management in Western Australia
Road safety in Western Australia is managed through a legislated body called the Road Safety Council comprising an independent chairperson, the key government agencies responsible for road safety matters, an elected member of local government and the Royal Automobile Club WA representing the community interest.
A discrete Act of Parliament, the Road Safety Council Act (2002) sets out the role, functions and responsibilities of the Council.
The Office of Road Safety is a Government lead agency for road safety within Western Australia. The Office acts as the working executive of the Road Safety Council and is responsible for developing road safety policy and strategy, implementing mass media campaigns, monitoring and reporting progress and coordinating road safety actions with local government in Western Australia, State level agencies such as the Police, roads, planning and licensing authorities and Nationally as part of Australia’s national road safety strategy.
In this structure, road safety business is clearly identified as an important issue for attention with a nominated lead agency supporting the key agencies which retain their individual core responsibilities for different aspects of road safety but have a shared, collective responsibility as the Road Safety Council to strategically advance road safety with and for the Western Australian community.
The Council, through the Office of Road Safety, maintains a high level of transparency in the progress and accountability for road safety with the Western Australian community which includes the presentation of an annual review of road safety to the Minister for tabling in the Parliament of Western Australia.
The Australian National Road Safety Strategy 2001-2010 and the WA Arriving Safely Road Safety Strategy for 2003-2007 are complementary and ensure that priority, evidence based actions are implemented in a coordinated and collaborative way for maximum effectiveness and the most efficient use of resources at by National, State and Local Governments.
Since its establishment in 1997 this model of a peak Council supported by a lead agency has proven to be very effective in progressing significant reforms in road safety which has seen Western Australia record the greatest reduction in deaths (32%) of any Australian jurisdiction from 1999 to 2005, turning around what was the second worst road safety record of any jurisdiction in 1999.
Countries with a more unified political structure (e.g. Sweden, Great Britain, The Netherlands) can usually operate national road safety programmes more readily. However, even here there are invariably a number of different agencies involved – such as transportation, police, and health – which can pose leadership and coordination challenges. Similarly, there are usually regional levels of government such as counties or districts which also have significant roles to play in developing and implementing programmes.

172 – MANAGING EFFECTIVE STRATEGIES AND CREATING A SUPPORTIVE POLITICAL ENVIRONMENT
TOWARDS ZERO: AMBITIOUS ROAD SAFETY TARGETS AND THE SAFE SYSTEM APPROACH - ISBN 978-92-821-0195-7 © OECD/ITF, 2008
Regardless of the different structures, coordination of road safety can be improved if there exists: a clear vision of where the country wants to go; specific, measurable targets; data with which to monitor progress against the targets, and sound strategies that can produce safety improvements. As discussed in 2.3.1, implementation will be more effective if there is also a lead agency that is politically accountable for achieving the targeted improvements in road safety.
While the diffusion of authority, without setting clear roles and accountability mechanisms for performance could allow public authorities to avoid accountability for road safety, conversely, excessive centralisation can also result in ineffective programmes. Local conditions sometimes require local solutions, and a “one-size-fits-all” approach is rarely the optimal strategy for implementing safety improvements. If local jurisdictions feel they have no input to solving problems, they also are likely to feel no ownership, which could affect their enthusiasm for implementing safety countermeasures. For instance, grant programmes that transfer money from a central government to local governments based on fixed formulae, regardless of need, do not generally give these local jurisdictions an incentive to improve safety. If the local jurisdictions know they will receive funding regardless of their safety needs or performance in improving road safety, then the delegation of safety responsibility or the automatic distribution of funding to weak performers should be re-evaluated.
7.4.2. Strategy implementation coordination and communication
The importance of coordination and communication in both developing a road safety strategy and managing responsibility for that strategy has already been stressed in this chapter. Most of the same principles hold true for strategy implementation.
The lack of governmental coordination (including cross-checking and quality control) across the various tiers may result in large amounts of repetitive work or gaps in “ownership.” This also may result in poor communication and ineffective business practices with stakeholders and poor use of monetary or staff resources. Cross purposes can also occur, (e.g. constructing a ground-level instead of an elevated rail crossing may be cost-efficient in the short run; however, if this crossing results in increased crashes, the economic and social costs over the long run will be substantially greater.) This type of problem can often be avoided if communication between highway builders and safety groups occurs early in the planning process.
Box 7.6. Case Study: The United Kingdom Safety Camera Programme
This programme has been implemented at the local level through safety camera partnerships which include representatives of the local highway authority, the police, Magistrates Courts and other governmental representatives.
A national board was set up to oversee the introduction and operation of the cost recovery programme that allows these partnerships to recover their costs out of the fines income generated by the cameras. The partnerships submit business plans to the national programme board for approval each year and the DfT passes the funds for the partnership to a local authority that acts as treasurer to redistribute the funds to each of the partners.
From 2007, these partnerships will have a wider role as road safety partnerships with a different funding regime separated from camera income, but the principle of co-operation at local level within a nationally determined funding regime will be maintained.

MANAGING EFFECTIVE STRATEGIES AND CREATING A SUPPORTIVE POLITICAL ENVIRONMENT – 173
TOWARDS ZERO: AMBITIOUS ROAD SAFETY TARGETS AND THE SAFE SYSTEM APPROACH - ISBN 978-92-821-0195-7 © OECD/ITF, 2008
One of the first steps in effectively implementing road safety countermeasures is setting up good organisations and structures. As mentioned earlier in this chapter, all government agencies that have a role in improving road safety should have their individual missions and responsibilities clearly spelled out in their charter and should be held accountable for delivery. The responsibilities may include data collection and analysis, public education, research, setting safety standards and conducting enforcement activities. Failure to do this may result in poor communication, ineffective business practices and poor use of monetary or staff resources – with some tasks being duplicated, others ‘falling between the gaps’, others being in conflict.
7.4.3. Exploiting the full potential of interrelated road safety countermeasuresand other public policy objectives and activities
It is important that any implementation plan addresses both positive and negative externalities. Accentuating positive externalities can help leverage resources by encouraging expenditures by other organisations and programmes in support of road safety activities. Also, all implementation plans should take into account the effect of the proposed road safety initiative on other, related entities and the plan should try to mitigate negative effects as much as possible. Communication and coordination among both the core and peripheral groups affected by road safety countermeasures, represents a primary method for exploiting the full potential of inter-related agencies and bodies.
For example, in the United States screening and intervention of populations with high-risk of alcohol abuse is a priority for both the Departments of Transportation and of Health and Human Services. Driving While Intoxicated courts, which focus on court supervision of convicted impaired driving offenders, are in many cases closely tied to Drug Courts and are therefore also of interest to law enforcement. Collaborating with other government agencies can increase resources devoted to reducing impaired driving and underage drinking, provide highly visible support for impaired driving initiatives, interagency sponsored events, reports and/or commissions, and foster interagency consensus on alcohol policy issues.
7.4.4. Role of Safety Councils
Many countries have used Road Safety Councils to work with the public to promote and foster a safe driving environment. For example, the Danish Road Safety Council is a private association of authorities and national organisations in Denmark. The Council’s purpose is to increase road safety through information and traffic education by means of campaigns, consulting and the production of instruction materials. The Danish Traffic Safety Commission Action Plan, which covers a period from 2001-2012, aims to reduce the number of fatal and heavy casualties by 40% through a focus on four main areas:
• Accidents due to excessive speed.
• Drink-driving accidents.
• Accidents at crossings.
• Accidents with cyclists.
As another example, the European Transport Safety Council is a Brussels-based independent non-profit organisation dedicated to the reduction of the number and severity of transportation crash injuries in Europe. Strategies include providing impartial cross-EU expert advice on countermeasures to European policymakers. It has:

174 – MANAGING EFFECTIVE STRATEGIES AND CREATING A SUPPORTIVE POLITICAL ENVIRONMENT
TOWARDS ZERO: AMBITIOUS ROAD SAFETY TARGETS AND THE SAFE SYSTEM APPROACH - ISBN 978-92-821-0195-7 © OECD/ITF, 2008
• Published a range of reports, briefings and newsletters to enhance awareness about transport policymaking needs and activity at EU level.
• Assessed the huge cost of EU transport crashes and estimated comparative risk for EU travel and transport across the modes.
• Pushed road safety to the centre-stage of EU transport policymaking.
• Campaigned successfully for substantial increases in the EU transport safety budget and the setting of an EU-wide road fatality reduction target.
• Campaigned successfully for EU legislation on vehicle safety standards such as car occupant front and side impact protection, mandatory front underrun protection on heavy good vehicles and for a legislative framework for pedestrian protection.
Currently the ETSC is developing a Road Safety Performance Index, a new policy instrument to help EU Member States to improve road safety. By comparing Member States' performance, it helps to identify and promote best practice in Europe and to stimulate strong and active political leadership in the area.
7.4.5. Role of third party and non-governmental road safety organisations
Just as third party and non-governmental organisations have an important role in developing road safety programmes, they also are valuable allies in implementing the subsequent programmes. For example, associations dedicated to advancing minority group interests, whose members are part of high risk groups, are often prepared work in concert with local authorities to develop effective countermeasures. Potential partners for helping government agencies to improve road safety include: police associations; regional and local government associations; anti-drunk driving organisations; and student and youth organisations. Government planners should seek as many partners as appropriate in developing effective road safety countermeasures. Unlike government bodies which may be viewed with suspicion, these groups are often able to employ strategies that resonate with their members and consequently influence road safety behaviours.

MANAGING EFFECTIVE STRATEGIES AND CREATING A SUPPORTIVE POLITICAL ENVIRONMENT – 175
TOWARDS ZERO: AMBITIOUS ROAD SAFETY TARGETS AND THE SAFE SYSTEM APPROACH - ISBN 978-92-821-0195-7 © OECD/ITF, 2008
Box 7.7. The role of the non-governmental sector in road safety:Examples from different countries
The non-governmental sector (NGOs) is well-developed in countries which are active in road safety and can play a major role on road casualty reduction. The scope of non-governmental organisation road safety activity is broad, contributing to a variety of country institutional road safety management functions. Activity includes:
• Providing an ‘umbrella’ role for road safety activity and advocacy for visions, strategies,targets and interventions e.g. Sweden’s National Society for Road Safety (NTF) which plays a key role in promoting and monitoring the national Vision Zero strategy and the Parliamentary Advisory Council for Transport Safety (PACTS) in Britain.
• Providing an authoritative source of impartial factual information and engaging in national debate on road safety issues e.g. the Dutch Institute for Road Safety Research (SWOV), Monash University Accident Research Centre (MUARC) in Victoria, Australia and the Insurance Institute for Highway Safety (IIHS) in the United States.
• Carrying out evidence-based interventions, e.g. the partnership between government, motoring and consumer organisations coming together in the European New Car Assessment Programme to provide safety rating information on new car crash performance.
• Providing support from road users for key interventions. Examples include the British Automobile Association (in establishing the European Road Assessment Programme) and the Dutch Pedestrians’ Association’s support for speed management in the Netherlands.
• Increasing understanding about the consequences of road crashes. Victims’ organisations play an important role although they may have broader interests than road safety and engage in pursuit of matters of social justice and victim support. Examples of victim groups are Mothers Against Drunk Driving (MADD), Asociación Familiares y Víctimas de Accidentes del Tránsito (Argentina) (Association of Families and Victims of Traffic Accidents) and Britain’s Road Peace and BRAKE.
• Encouraging knowledge transfer about best practice. Professional organisations in the health and transport sectors play an important role in preparing national guidelines and promoting best practice, e.g. the Institution of Highways and Transport (UK); CROW (the Dutch National information and technology platform for infrastructure, traffic, transport and public space) in the Netherlands and the ARRB(spell out acronyms) in Australia.
• Coordinating local road safety activity. Local community groups engage and provide coordination for local stakeholders in road safety such as the Community Road Safety Councils in Victoria and the New Zealand.
• Working across national boundaries to promote best practice, e.g. international foundations and partnerships such as the European Transport Safety Council, FIA Foundation for the Automobile and Society, and the Global Road Safety Partnership.
At their most effective, NGOs: are wholly or partly independent of government for funding, so maintaining independence of action; publicise the true scale of the road injury problem and provide impartial information for use by policymakers; identify and actively promote demonstrably-effective and publicly-acceptable solutions, with due consideration of their cost; publicly challenge ineffective policy options; form effective coalitions of organisations with a strong interest in casualty reduction; and measure their success by their ability to influence the implementation of effective road casualty reduction measures. (Breen, 1999). Funding sources include government grants, sponsorship, membership fees and research funding.

176 – MANAGING EFFECTIVE STRATEGIES AND CREATING A SUPPORTIVE POLITICAL ENVIRONMENT
TOWARDS ZERO: AMBITIOUS ROAD SAFETY TARGETS AND THE SAFE SYSTEM APPROACH - ISBN 978-92-821-0195-7 © OECD/ITF, 2008
There are substantial potential benefits in harnessing the support of the insurance industry in particular, which is increasingly realising that safety improvements result in reduced claims. Examples of opportunities for the insurance companies to invest further in road safety, which are described in Chapter 6, include:
• Funding for carefully targeted behavioural programmes (education and enforcement) or infrastructure programmes, based on well developed business cases with attractive rates of return on investment.
• Reducing premium costs for consumers who purchase safer vehicles, or who demonstrate safer driving, perhaps as measured by black box recorders fitted to their vehicles, perhaps as reflected in a lack of recorded traffic offences or in non–involvement in crashes.
The commercial benefits and relatively short payback periods for insurers can be substantial, with the community benefiting from reduced road trauma – a potential win-win outcome.
It also needs to be noted that third parties can oppose road safety measures, particularly if safety measures carry a financial cost and may be seen by commercial interests as likely to raise product prices and/or lead to market resistance and thus reduce profits. For example, the WHO Report on Alcohol in the European Region (WHO 2001) noted that in some countries, the alcohol and spirits industry has cooperated in the prevention of under-age drinking, drink–driving and drinking in the workplace. However in other countries, there has been resistance to these developments, with negative practices of the alcoholic beverage industry including marketing aimed at young people, sponsorship of sports, and strong opposition to reductions of BAC limits or the introduction of random breath testing.
The actions of the automobile industry represent another example of commercial interests delaying or obstructing implementation of some safety measures. Legislation on safer car fronts for pedestrian protection has been slow in being introduced as a Directive in the European Union, despite technological feasibility and sound evidence on the benefits. Although pedestrian protection is incorporated into EuroNCAP tests and star ratings given for it, the full potential benefits are not being achieved. The Directive only phases the introduction of this feature, largely as a result of concerns about implementation on the part of automobile manufacturers.
Governments are often accused by commercial interests of being anti-enterprise with safety measures being seen as “red-tape” and examples of a “nanny-state”. To counter these assertions, public and political demand for improved safety practice needs to be encouraged through good information strategies. Working with commercial interests to encourage self-regulation and codes of practice can also be fruitful, but often there can also be a need for legislation
7.5. Legislation
Legislative requirements
Both primary and secondary legislation will be required for the implementation of safer road transport systems. Legislation is needed in three areas: regulation of road user behaviour; road infrastructure; and vehicle standards:
• Legislation affects and regulates behaviour through the establishment of a clear body of road traffic law that sets out the rules that must be obeyed and the sanctions that will be imposed for non-compliance. Road users need to be informed of the legal requirements through road safety
MANAGING EFFECTIVE STRATEGIES AND CREATING A SUPPORTIVE POLITICAL ENVIRONMENT – 177
TOWARDS ZERO: AMBITIOUS ROAD SAFETY TARGETS AND THE SAFE SYSTEM APPROACH - ISBN 978-92-821-0195-7 © OECD/ITF, 2008
education, driver training and testing, and public information campaigns. Publication of a rule book or “Highway Code” written in an accessible format that is regularly updated is good practice. Behaviour is also affected by the deterrent effect of penalties and the law enforcement systems that are in place.
• Legislation covering road infrastructure regulates road systems design through standards of design and construction that deliver roads and facilities that conform to best safety practice.
• Vehicle standards are often set internationally but national legislation is required to regulate the construction and use standards that apply.
Depending on the system of Government, legislation may be at national, state or local level. There are advantages in a consistent approach within countries on rules and sanctions governing behaviour, but this cannot always be achieved where legislative powers are devolved below national level.
7.6. Funding and resource allocation
7.6.1. The need for financial resources for road safety programmes
As mentioned earlier, it is important to demonstrate the practicality and cost-effectiveness of proposed countermeasures as a means to persuade both politicians and the public to commit resources to road safety. The future negative impact on government revenues and increased cost to health and social security services, if road safety is ignored, is an important aspect of this approach that should be based on analysis of costs and benefits.
It is also important to develop a funding scheme for road safety that will be predictable and sustainable in the future. Systems of charging for road use, assessing levies or taxes on automotive fuels, or vehicle taxation could be used as regular sources of funding for safety initiatives. Allocating revenues from enforcement fines may also gain public acceptance for greater investment in safer roads. At the same time, one needs to be careful to avoid the appearance that fine collection has the primary purpose to fund road safety programmes: curbing risky behaviours must be the predominate purpose. There is also significant potential in raising additional funds through sponsorship, public private partnerships and from other non-governmental sources.
In allocating resources to road safety, sufficient funds must be provided to ensure that evidence-based research is available to support the proposed countermeasures and their monitoring and evaluation. An assessment will be needed of the most cost-effective allocation of funds, to be applied to all aspects of crash prevention including all the incident phases (pre-crash, crash and post crash).
Post-crash measures are often seen as less relevant than measures intended to prevent crashes. While the ultimate aim of policy should be to avoid crashes and resultant injury, it is also important that rapid and skilled medical response is available, ideally within the first “golden” hour, after a crash has occurred. Attention to the post-crash scenario can significantly reduce the likelihood of death and can also help to improve the long-term health prognosis.
Insurance companies can also contribute by moving away from an approach that simply compensates for losses due to crashes, to one where they take an active role in crash prevention and the development of safe driving skills. This makes good commercial sense as investment in preventive programmes can significantly reduce claims. As an example, in the State of Victoria, Australia, some of the Transport Accident Commission (TAC) premium is used to support programmes aimed at preventing

178 – MANAGING EFFECTIVE STRATEGIES AND CREATING A SUPPORTIVE POLITICAL ENVIRONMENT
TOWARDS ZERO: AMBITIOUS ROAD SAFETY TARGETS AND THE SAFE SYSTEM APPROACH - ISBN 978-92-821-0195-7 © OECD/ITF, 2008
transport accidents funding enhanced enforcement activities by police and infrastructure safety programmes for blackspot treatments and crash risk reduction measures across the road network.
7.6.2. Building human capacity
Resource needs are not simply financial. Budgets for road safety schemes need a supply of suitably skilled practitioners to ensure that budgets are used cost-effectively. It takes time to build a cadre of safety professionals with sufficient education and experience in road safety. Resources for training are needed to improve the supply of skilled human resources available to relevant authorities. Creating road safety specialist positions at national and local levels will also help to attract high-quality personnel.
This professionalism should start with the formal education in road safety disciplines offered at universities and colleges and extend to further on-the-job training. For countries that do not have institutions that offer appropriate safety courses, managers should consider sending their staff to one of the many road safety courses offered for example in Australia, New Zealand, Canada, Britain, or the United States. If sufficient training funding is not available, road safety managers should consider developing their own training curricula based on the many reference materials that are available.
Professionalism in the financial management of projects is also important, but represents a source of difficulty in many countries. Financial standards should be set and vigorously enforced for all major projects.
The capability of all relevant authorities can be also enhanced by investing in the dissemination of best practices. Promoting success is a worthwhile investment and will reinforce public and political support for the strategy. Central governments can also encourage the road safety performance of local authorities by linking funding mechanisms to the achievements of local targets based on these best practices.
During implementation, resources can be used also to help to maintain public support for the strategy through effective road safety communication campaigns. This will establish a cycle of strong political will, public support and adequate funding that can, in turn, help to reduce the deadly toll of death and injury on the road – thus leading to further support.
7.7. Promotion
The need for road safety to be vigorously promoted within government circles by a specified lead agency has already been identified (see Section 7.2.1). Promotion also needs to occur at other levels.
For most people, the risk of death or injury in a road transport crash is not uppermost in their mind when they use the roads. Safe outcomes using the transport system are reinforced over 99 percent of the time. Just as road safety must compete for the attention of politicians, it must also compete for the attention of often complacent road users. In tackling the problem of lack of public awareness, it is useful to anticipate that demand for road safety may be weaker than other demand characteristics, such as reliability and cost when using the transport system.
The problem of poor risk awareness may be compounded by a combination of active and passive resistance to road safety countermeasures. The argument that established behaviours represent rights or ‘freedoms’ has frequently been used against laws promoting seatbelt and helmet use and against speed restrictions. Resistance to road safety initiatives may also take a more passive form and be caused by ‘lifestyle’ or commercial pressures – as examples, the use of mobile phones while driving, or the need to achieve faster journey or delivery times.

MANAGING EFFECTIVE STRATEGIES AND CREATING A SUPPORTIVE POLITICAL ENVIRONMENT – 179
TOWARDS ZERO: AMBITIOUS ROAD SAFETY TARGETS AND THE SAFE SYSTEM APPROACH - ISBN 978-92-821-0195-7 © OECD/ITF, 2008
Public support for road safety measures can also be encouraged by increasing trust in public authorities. For example, the perception that speed enforcement is to raise revenue for government and is not based on a real assessment of risk can undermine public support. Any possibility of corrupt use of funds raised will also have a very adverse effect on public confidence in the integrity and justification of road safety measures.
Road safety strategies should, therefore, include measures that act as a stimulus to greater awareness of the real level of risk of death and injury. Consider for example, the New Car Assessment Programmes (NCAPs). The programmes that exist in Australia, the European Union, Japan and the USA provide car buyers with occupant protection ratings based on crash test results and also draw attention more generally to the risks and potential consequences of car crashes. These programmes have also acted as a powerful economic stimulus to the engineering efforts of the car manufacturers as they compete to achieve higher safety test ratings than their competitors.
NCAP experiences highlight the benefits of combining a competitive environment among the suppliers of safety-related products with greater information leading to consumer demand for those products. This model is now being applied in other areas of road safety. For example, the European Road Assessment Programme has begun to develop a safety rating system for the roads in Europe. This initiative is helping to promote competitive pressure on governments to improve the safety performance of the road network, stimulated by greater public awareness of the varying risk levels of different roads.
To overcome public resistance to road safety initiatives, public information campaigns to support new countermeasures is vital. The purpose and positive impact of the intervention must be actively communicated to the public through the media, and with the support of a well-mobilised alliance of community supporters and stakeholders. If the policy is introduced without a supportive awareness campaign, it is less likely to succeed. Public information will also help to overcome distrust of government motives and reduce public fears of misuse of revenues.
7.8. Research, monitoring and evaluation
There is a need for research and analysis, monitoring and evaluation to identify and better understand problems, to prioritise them for action, and to develop, implement, and evaluate countermeasures. Much of this should be the responsibility of the central government, as many local authorities will not have the resources to carry out high quality research. However, there is still a need for local investigation to prioritise and select both areas for treatment and suitable countermeasures. Cost-benefit and cost-effectiveness analyses should be an integral part of such research, to ensure effective use of resources and to identify benefits and positive outcomes.
The scale, depth and extent of research should take into account the existing state of knowledge, building on what has already been learned both locally and in other countries. This is particularly relevant for low and medium income countries where there is arguably the greater need for assimilation of existing research conducted elsewhere, with adaptation of the procedures to suit local circumstances as appropriate.
Pilot studies and demonstration projects are useful means of making an early assessment of the effects of measures and addressing the inevitable problems that will arise in any full-scale implementation. Advice on best practices should result from such work so that future implementation is based on hard evidence of effect, with barriers to successful implementation identified and neutralised. Post implementation monitoring and evaluation of the effects of measures can also provide vital evidence to support the expansion and continuation of policy and to counter opposition, as exemplified by the

180 – MANAGING EFFECTIVE STRATEGIES AND CREATING A SUPPORTIVE POLITICAL ENVIRONMENT
TOWARDS ZERO: AMBITIOUS ROAD SAFETY TARGETS AND THE SAFE SYSTEM APPROACH - ISBN 978-92-821-0195-7 © OECD/ITF, 2008
annual evaluation of the safety camera programme in the United Kingdom (PA Consulting Group and UCL 2005).
Once full road safety programmes have been developed and are ready for implementation, monitoring interventions is essential, starting with a baseline measurement of the safety issue. It is helpful if there is at least a notional trajectory towards a target showing the required casualty reductions, either annually or at set milestones, so that progress can be tracked. Regular reviews of progress that alert policy makers to problems, and give advance warning of any difficulties in meeting targets, identifies whether achievement of the target needs to be ‘put back on track’. Reviews of the strategy may be carried out as part of normal business on a rolling programme, or may be scheduled at set intervals. Involving stakeholders in the monitoring process will help to share the responsibility and commitment that is required for success.
As previously argued, comprehensive crash injury data systems need to be established to provide the means for tracking trends in casualties and for use in analysis to provide understanding at a disaggregated level. Where such comprehensive national databases do not exist, an interim solution may be to collect data on specific indicators as proxy measures of progress. Health sector data can be a useful source of information on trends in casualties if cause of injury is accurately recorded, and systems for linkage of hospital and crash injury data should be established. However, crash data are insufficient on their own. To fully assess the impact of interventions, information is also needed on levels of activity from traffic surveys and surveys of personal travel by mode of travel, and on other indicators such as vehicle registrations and sales.
Publication of monitoring results on a regular basis is good practice as a means of promoting success or highlighting where effort needs to be directed. Publicity is also useful in communicating that government and stakeholders are willing to be held accountable for goal achievement in a very public sense.
Box 7.8. Using the ETSC Road Safety Performance Index to monitor road safety performance
The ETSC's Road Safety Performance Index is a new policy instrument to help EU Member States in improving road safety. By comparing Member States’ performance, it serves to identify and promote Best Practice in Europe and bring about the kind of political leadership that is needed to create what citizens deserve – a road transport system that offers a maximum of safety.
Started in June 2006, the Index covers all relevant areas of road safety including road user behaviour, infrastructure and vehicles, as well as road safety policymaking more generally. National research organisations and independent researchers from 27 countries participating in the programme are ensuring that any assessment carried out within the programme is based on scientific evidence and is effectively communicated to European road safety policymakers.
7.9. Implementation of Countermeasures
7.9.1. The need for comprehensive planning
Even the best designed road safety strategies and countermeasures need to be implemented properly with potential barriers to implementation being addressed early in the planning process to maximise safety benefits. For example, the success of new road safety countermeasures may be compromised by over-reliance on existing road safety practices which may be flawed or have become obsolete over time.

MANAGING EFFECTIVE STRATEGIES AND CREATING A SUPPORTIVE POLITICAL ENVIRONMENT – 181
TOWARDS ZERO: AMBITIOUS ROAD SAFETY TARGETS AND THE SAFE SYSTEM APPROACH - ISBN 978-92-821-0195-7 © OECD/ITF, 2008
As one instance, in the United States, many areas adopted standard heights for road signs and guard rails that are effective in protecting the typical passenger vehicle but which may be exacerbating injuries to motorcycle riders in a crash. However, there is significant resistance to replacing these standards, at least partly because of the large replacement costs. Existing road safety policies and procedures should be evaluated regularly – and ideally during design stages – to determine their effectiveness and whether they are resulting in unintended outcomes.
7.9.2. Commercial interests that may affect implementation
Commercial interests are not always in tune with road safety priorities and in some cases, may thwart road safety initiatives. For example, measures to increase safety may carry a financial cost and may be seen by commercial interests as likely to raise product prices, lead to market resistance and thus reduce profits. Conversely, there are examples where safety improvements can be harnessed by industry either as a selling point or to reduce costs (see also section 7.4.5 on the potential influences of the automotive, insurance and alcohol and spirits industry).
Whereas workplace safety is usually strongly regulated and employers have responsibility for the safety of their employees on site, the same is not true for the safety of employees who drive as part of their work. Employers need to be made aware of the true cost to their companies of road traffic injuries and the cost savings that may be realised by attention to safety. Such information is needed to counter the desire to cut costs by imposing unsafe practices, such as unrealistic work schedules that require drivers to speed and take insufficient rest periods. Good practice in this area includes using safety conscious firms as champions and encouraging firms to use crash reduction strategies that combine penalties and incentives for their workforce to encourage safer driving. Such voluntary measures also need to be backed up by regulatory means to enforce good safety practice if necessary.
7.10. Conclusions and recommendations
There is a long history in many countries of success in reducing road traffic injury. Gains in road safety have been accomplished by the development of coordinated road safety strategies at the national level, and by detailed implementation of specific road safety programmes and countermeasures at the regional and local levels. Future success in raising the level of ambition in order to move to a Safe System Approach to produce positive road safety outcomes can be achieved through sound road safety planning and analysis, coupled with input from various stakeholders and other affected parties. While barriers to road safety countermeasures are almost inevitable, experience shows that these barriers can be successfully overcome with careful programme design, involvement by affected groups and vigilant implementation.
The arrangements identified in this chapter based on the road safety management framework set out in the pyramid in Chapter 4 are the foundation for implementation of a safe system approach to achievement of ambitious road safety outcomes. Political will to set casualty reduction as a national priority is fundamental to effective implementation. It will require competent evidence-based policy work and demonstrated competence by agency staff in providing that advice, and in day-to-day briefings of the political level.
Although strong institutional and governmental action is needed this cannot be in isolation. The essence of the Safe Systems Approach is the recognition that road safety is the responsibility of the wider community and all stakeholders, from road and vehicle designers through to individual road users who have the responsibility to abide by the rules governing safe behaviour. Building the right environment for safety to be seen as a priority and a desired goal must be the ultimate aim.

182 – MANAGING EFFECTIVE STRATEGIES AND CREATING A SUPPORTIVE POLITICAL ENVIRONMENT
TOWARDS ZERO: AMBITIOUS ROAD SAFETY TARGETS AND THE SAFE SYSTEM APPROACH - ISBN 978-92-821-0195-7 © OECD/ITF, 2008
Otherwise road safety may be a hard sell to politicians, especially if some of the interventions are seen as likely to be unpopular. Road safety vies with other transport issues (such as mobility, development and environment) and with other social issues, especially for funding priority. As a critical part of the management of programmes, road safety advocates need to have an extensive armoury, including: policies that are politically relevant; policies supported by comprehensive research and evaluation evidence; the likelihood of positive results in a timeframe that is meaningful to politicians; and the capacity to accommodate the practical realities and requirements of political decision-making. Within a Safe Systems Approach, road safety should be seen as an integral part of policy planning across other government programmes, rather than an add-on at additional cost to be resisted.
Strong sustained government commitment at the highest level is essential for improving road safety. It increases the chances of:
• Securing appropriate and sustainable funding.
• Securing supportive policy and legislative changes.
• Actively engaging stakeholders.
• Implementing effective measures which may not be popular in the short term.
• Building institutional capacity.
As countries move towards a more systematic and more ambitious approach, there is a need for better organisation and increased institutional capacity to implement the necessary measures to achieve ambitious road safety targets. Laying the groundwork for moving to safe systems will take time. A key requirement is that there should be a strategic approach to road safety management with a lead agency that has the political support, accountability, and resources to be able to develop, coordinate and implement an evidence-based road safety strategy. A targeted approach with clear aims and objectives firmly based on analysis and consultation with stakeholders is vital for the success of casualty reduction measures.
NOTE
1. See modelling work in Chapter 6.

MANAGING EFFECTIVE STRATEGIES AND CREATING A SUPPORTIVE POLITICAL ENVIRONMENT – 183
TOWARDS ZERO: AMBITIOUS ROAD SAFETY TARGETS AND THE SAFE SYSTEM APPROACH - ISBN 978-92-821-0195-7 © OECD/ITF, 2008
REFERENCES
Breen, J. (1999), Promoting research-based road safety policies in Europe: the role of the non-governmental sector, In: Proceedings of the 2nd European Road Research Conference, Brussels, European Commission, 1999.
Department for Transport (2000), Tomorrow’s Roads – Safer for Everyone, www.dft.gov.uk/pgr/ roadsafety/strategytargetsperformance/tomorrowsroadssaferforeveryone
Department for Transport (2004), Tomorrow’s Roads-Safer for Everyone: the first three year review.www.dft.gov.uk/pgr/roadsafety/strategytargetsperformance/tomorrowsroadssaferforeveryo4866
Department for Transport (2007), Tomorrow’s Roads-Safer for Everyone: the second three year review. www.dft.gov.uk/pgr/roadsafety/strategytargetsperformance/2ndreview
Department for Transport (2005), The Government’s Motorcycling Strategy, www.dft.gov.uk/ pgr/roads/vehicles/motorcycling/thegovernmentsmotorcyclingst4550
Elvik, R. (2007), Prospects for improving road safety in Norway, Report 897, Institute of Transport Economics, Oslo.
OECD (2002), Safety on Roads: What’s the Vision? OECD, Paris.
PA Consulting Group and UCL (2005), The national safety camera programme: four-year evaluationreport, www.dft.gov.uk/pgr/roadsafety/cameras/nscp/thenationalsafetycameraprogr4597
Western Australia Road Safety Council (2007), Towards Zero, getting there together, Discussion paper, Office of Road Safety, Perth.
World Health Organisation (2004), World Report on Road Traffic Injury Prevention. Geneva, World Health Organisation, Geneva 2004.
World Health Organisation 2001, Alcohol in the European Region – consumption, harm and policies.Copenhagen, WHO Regional Office for Europe, 2001, www.euro.who.int/document/E76240.pdf.


KNOWLEDGE TRANSFER – 185
TOWARDS ZERO: AMBITIOUS ROAD SAFETY TARGETS AND THE SAFE SYSTEM APPROACH - ISBN 978-92-821-0195-7 © OECD/ITF, 2008
8. KNOWLEDGE TRANSFER
ABSTRACT
Research and knowledge transfer will play a pivotal role in the design and delivery ofinterventions aimed at achieving a Safe System approach and in attaining results that go well beyondwhat has been achieved so far. Our understanding of why and how crashes occur is based on verylimited research. A more complete picture would provide the basis for more effective interventions.High-income countries will rely increasingly on innovation to work towards the ultimate goal ofeliminating road deaths and serious injuries. Low and middle-income countries will benefit from theseadvances.
Knowledge transfer must be grounded in actual practice in a ‘learning by doing’ model, backedwith sufficient targeted investment to overcome the barriers presented by the evident capacityweaknesses at the global, regional and country levels. This chapter explores how knowledge transferpriorities should reflect the latest developments in interventions and also be shaped by the capacity ofcountries to implement this knowledge and the capacity of global and regional knowledge transferarrangements to support and accelerate its delivery. The chapter concludes that strong and sustainedinternational cooperation will be required to mobilise knowledge transfer resources commensuratewith the scale of the losses arising from road deaths and serious injuries.
8.1. A critical success factor
The evolving focus on results in successful road safety management systems – especially from thedevelopment of targeted national programmes through to the Safe System approach – has beenunderpinned and sustained by the process of research and development and knowledge transfer withinand across national boundaries. This vital institutional management function has guided the design andimplementation of national strategies that have sustained reductions in road deaths and injuries in theface of growing mobility and exposure to risk. In supporting the evolution of higher and higher levels ofperformance and ambition, research and development and knowledge transfer has taken on importantglobal and regional dimensions.
Road safety management has reached a significant turning point in the early 21st century, where theshift from targeted levels of death and serious injury to their total elimination has become the ultimateSafe System goal, and accelerated research and knowledge transfer is critical to its achievement. Thisrequires a reappraisal of what is already known about effective safety initiatives and catalyzed the searchfor innovative solutions that can build on this knowledge. Knowledge transfer priorities must reflect thelatest developments in interventions and performance measures, but they must also be shaped by both thecapacity of countries to implement this knowledge and the capacity of global and regional knowledgetransfer mechanisms to accelerate its delivery.
Accelerated research, development and knowledge transfer is critical to the success of high-incomecountries seeking to move from current good practice and performance outcomes to the long-term

186 – KNOWLEDGE TRANSFER
TOWARDS ZERO: AMBITIOUS ROAD SAFETY TARGETS AND THE SAFE SYSTEM APPROACH - ISBN 978-92-821-0195-7 © OECD/ITF, 2008
Safe System goal of eliminating deaths and serious injuries on their roads. It is also critical to low andmiddle-income countries operating at far poorer levels of performance and aiming to move rapidly tocurrent good practice outcomes and beyond, within far shorter timeframes than those previouslyexperienced and suffered by high-income countries. Meeting these priorities will require knowledgetransfer, which will play a pivotal role in the design and delivery of institutional reforms andinterventions aimed at refocusing and scaling up country road safety programmes to more rapidlyachieve higher levels of performance (Bliss and Breen, 2008).
High-income countries have accumulated considerable experience in meeting ambitious road safetytargets and built up a body of knowledge that is readily accessible to any country with sufficientinstitutional capacity to absorb it. At the same time, the shift to a Safe System approach seeks results thatgo well beyond what has been achieved so far with targeted programmes and it will rely increasingly oninnovation. Knowledge of these innovative approaches must be shared rapidly between countries.
Knowledge transfer is even more challenging for low and middle-income countries, as their currentknowledge base is fragmented and often out of date. These countries can ill-afford to spend the next fiftyyears following the evolutionary pathway taken by high-income countries to bring their road safetyperformance to current levels. Little or nothing can be gained, and much lost, by acquiescing to thenotion that they must repeat the historical road safety experience of high-income countries. This fatalisticview ignores the knowledge that has been accumulated in high-income countries and the lessons thathave been learned. It also denies low and middle-income countries considerable opportunities to benefitfrom the advances being made with the Safe System approach in high-income countries today.Undoubtedly there will be difficulties in successfully transferring available and emerging knowledge tolow and middle-income countries, but it is clear that these difficulties must be overcome if many millionsof deaths and serious injuries are to be avoided over the coming decades.
8.2. Facing growing complexity
In all countries, institutional management functions and interventions must come under closerscrutiny to assess how well they are constituted and aligned to achieve the long-term target of death andserious injury elimination. Interventions must also be shaped by this new level of ambition and interimtargets set as milestones on the path to its ultimate achievement. In this regard knowledge transfer mustaddress all elements of the safety management system, and it must embrace multi-sectoral andmultidisciplinary perspectives. It must also acknowledge the uncertainty to be faced as safety initiativesreach out to be effective beyond what is practiced and known, and are adapted to the road environmentsof low and middle-income countries that reveal more complexity than the environments in which theinitiatives were developed.
Increasing road use in high-income countries has historically undergone a relatively smooth processof more protected modes of transport substituting for unprotected modes. Trips made by pedestrians,cyclists and motorcyclists gradually switched to public transport and private cars, and this contributed tosteady reductions in deaths and injuries for vulnerable road users.1 In the poorer countries, large numbersof vulnerable road users – pedestrians, non-motorised vehicles, motorcyclists and street vendors – willfor the foreseeable future continue to share the roads with the rapidly growing fleets of private cars andcommercial vehicles. This will result in dangerous mixes of traffic given their differing masses, speeds,and levels of injury protection. Without special initiatives increased deaths and injuries will beinevitable. Poorer countries also experience higher levels of informality in their public transport sectorand what is generally a safe mode of transport in high-income countries is often unsafe in the countriesconcerned and requires targeted attention.

KNOWLEDGE TRANSFER – 187
TOWARDS ZERO: AMBITIOUS ROAD SAFETY TARGETS AND THE SAFE SYSTEM APPROACH - ISBN 978-92-821-0195-7 © OECD/ITF, 2008
Knowledge transfer must address these complexities and adapt the growing body of knowledgesupporting the Safe System approach to the circumstances encountered in all countries, especially lowand middle-income countries. An overarching priority will be to help create the understanding thatreduced network speeds are not necessarily detrimental to the achievement of mobility goals, and thatthey can contribute to the achievement of sustainable development goals concerning climate change andenergy security (European Environment Agency, 2008). Low and middle income countries stand tobenefit substantially from the application of Safe System design principles that are well suited toameliorating the high levels of road user vulnerability evident in their mixed traffic systems.
8.3. Overcoming capacity weaknesses and scaling up investment
Safety management capacity in low and middle-income countries is generally weak. Institutionalmanagement functions require strengthening. A clearly defined results focus is often absent. This reflectsa lack of leadership through a targeted strategy that is ‘owned’ by the government and relevant agencies,and where responsibilities and accountabilities for its achievement are clearly specified and understood.As a consequence coordination arrangements can be ineffective, supporting legislation fragmented,funding insufficient and poorly targeted, promotional efforts narrowly directed to key road user groups,monitoring and evaluation systems ill-developed, with knowledge transfer impeded to the point ofineffectiveness. Likewise, interventions are often fragmented, do not reflect good practice, and little isknown about the results they achieve. These systemic safety management capacity weaknesses present aformidable barrier to progress and must be directly addressed as a strategic priority in related knowledgetransfer initiatives (World Bank Global Road Safety Facility, 2007).
Safety management capacity weaknesses can also become evident in high-income countries, as theymake the shift to higher levels of ambition. With the evolving focus on results in high-income countries,agency accountability for the core institutional management functions has been sharpened, and thecrucial lead agency role in directing the effort across functions has been highlighted (WHO, 2004).However, with the shift to a Safe System approach what has proved to be effective in managing a targetedprogramme could be inadequate to the demands of the new task. For example, a recent review of roadsafety in Sweden highlighted the highly advanced nature of its road safety management system whenbenchmarked internationally, but still found that it required considerable strengthening to ensure theachievement of its ambitious goal of death and serious injury elimination (J. Breen, E. Howard andT. Bliss, 2008).
Global and regional knowledge transfer arrangements are well established among high-incomecountries. They benefit from an extensive collaborative network that provides technical, statistical andpolicy support. Important institutional arrangements include the United Nations Economic Commissionfor Europe (UNECE) Working Party on Road Traffic Safety (WP1) and the World Forum forHarmonization of Vehicle Regulations (WP29), the Joint Transport Research Committee of theInternational Transport Forum and the Organisation for Economic Cooperation and Development and itsInternational Road Traffic and Accident Database (IRTAD), and the World Road Association (PIARC).While these arrangements in part reach out to low and middle-income countries their effectiveness ismost pronounced in high-income countries that have sufficient resources and technical expertise to fullyparticipate and capture the benefits of this engagement. Low and middle-income countries often remainisolated, with limited access to knowledge sharing and mutual support. This isolation is compounded bythe lack of road safety management capacity in the international financial institutions such as the WorldBank and regional development banks, the World Health Organization, and the UN Regional EconomicCommissions, and hence capacity strengthening is also required in these organisations at the global andregional level to ensure that country capacity building initiatives can be fully supported with effectiveknowledge transfer arrangements and processes (Commission for Global Road Safety, 2006).

188 – KNOWLEDGE TRANSFER
TOWARDS ZERO: AMBITIOUS ROAD SAFETY TARGETS AND THE SAFE SYSTEM APPROACH - ISBN 978-92-821-0195-7 © OECD/ITF, 2008
In addition to requiring sufficient global, regional and country capacity to support and accelerate itsdelivery, the successful transfer of knowledge requires not only its transmission but also its absorptionand ultimate use. If the knowledge ends up not being used then the transfer has been ineffective. Henceknowledge transfer must also be grounded in country practice using a ‘learning by doing’ model, backedwith sufficient targeted investment to overcome the barriers presented by the evident capacityweaknesses at the global, regional and country levels. This approach is illustrated by the World Bank’sshift from ‘1st Generation’ to ‘2nd Generation’ road safety projects which aim to anchor country capacitybuilding efforts in systematic, measurable and accountable investment programmes (World Bank GlobalRoad Safety Facility, 2007). The objectives of ‘2nd Generation’ projects are to accelerate the transfer ofroad safety knowledge to project participants; strengthen the capacity of participating agencies, industriesand community groups; and to achieve quick proven results that generate benchmark measures todimension a programme to further roll-out successful initiatives. In this way knowledge transfercontributes to the ongoing process of continuous improvement in performance. This approach hasparticular relevance to low and middle-income countries, but is also pertinent to high-income countriesseeking to break through current good practice performance barriers and make rapid progress towardsachieving the ultimate goal of death and serious injury elimination.
To be effective, therefore, knowledge transfer initiatives must address global, regional and countrycapacity weaknesses with scaled up investments in targeted programmes and projects designed toovercome these weaknesses by creating sustainable learning opportunities in the countries concerned.The first and crucial step in this process is to systematically review country safety management capacity.The World Bank has developed capacity review tools and successfully piloted these in a range of lowand middle-income countries, as well as in a high-income country, Sweden (Bliss, 2004; Bliss and Breen,2008; Breen, Howard & Bliss, 2008; Annex C, World Bank Country Capacity Checklists). The reviewfindings are used to prepare a long-term investment strategy to overcome revealed capacity weaknessesin a sequential manner, and to identify ‘2nd Generation’ programmes and projects to implement theinvestment strategy. Key attributes of the programmes and projects include a high level of government‘ownership’, agency accountability for results, partnership commitment to their success beyond theinitial phase, robust monitoring and evaluation of results, and a high priority placed on ensuring that theirresearch and development and knowledge transfer potential is fully realised.
8.4. International cooperation
Knowledge transfer must be viewed in a global and regional context which is recognizing a growingpublic health crisis on the roads of the world and is calling for increased international cooperation toaddress this issue. This crisis is particularly acute for low and middle-income countries and a frameworkfor action is being built which addresses the recommendations of the World Report on Road TrafficInjury Prevention (WHO, 2004) and draws on the mandate provided by the UN General AssemblyResolutions 58/289, A/60/L8 and A/62/L.43 (Improving global road safety) and World Health AssemblyResolution WHA57.10 (Road safety and health) concerning global road safety (World Bank Global RoadSafety Facility, 2007). Strong and sustained international cooperation will be required to mobiliseresources and support services commensurate with the sheer scale of the global health losses arising fromroad deaths and serious injuries.
The goals and initiatives of the World Bank Global Road Safety Facility are particularly relevant inthis context, as are the activities of the global and regional partners it supports such as the UNCollaboration, the Global Road Safety Partnership, the Road Traffic Injuries Researchers Network, theInternational Road Assessment Programme, the Harvard Initiative for Global Health, the InternationalRoad Traffic Accident Database, the Global Road Safety Forum, the International Road Federation, andothers. The Facility’s goals emphasise the need to strengthen global, regional and country safety

KNOWLEDGE TRANSFER – 189
TOWARDS ZERO: AMBITIOUS ROAD SAFETY TARGETS AND THE SAFE SYSTEM APPROACH - ISBN 978-92-821-0195-7 © OECD/ITF, 2008
management capacity and to accelerate knowledge transfer and scale up investment, to achieve large-scale reductions in road deaths and serious injuries in low and middle-income countries over the comingdecade and beyond. In support of the Facility, the Commission for Global Road Safety has set out anaction plan to mobilise resources through the Facility to help implement the World Report on RoadTraffic Injury Prevention recommendations over the coming decade and to champion the Safe Systemapproach in road infrastructure provision (Commission for Global Road Safety, 2006).
Adopting a Safe System approach is essential to achieving the most ambitious road safetyperformance targets, and it requires a strong and sustained commitment to innovation and internationalcooperation. In this regard global, regional and national knowledge transfer has a crucial contribution tomake to the process of surpassing the limits of current good practice to achieve the ultimate goal ofeliminating deaths and serious injuries on the world’s roads.
8.5. Conclusions
Accelerated knowledge transfer will play a pivotal role in the design and delivery of institutionalreforms and interventions aimed at assisting countries to adopt a Safe System approach to achieve resultsthat go well beyond what has been achieved so far with targeted programmes. To support this endeavournew knowledge must be created and more rapidly shared within and between countries. High-incomecountries are well positioned in this regard, but they will rely even more heavily in the future oninnovation and continuous improvement to achieve their goal of eliminating road deaths and seriousinjuries. While achieving this is even more challenging for low and middle-income countries, they haveconsiderable opportunities to benefit from the advances being made in high-income countries and thedifficulties of transferring knowledge to them must be overcome if many millions of deaths and seriousinjuries on their roads are to be avoided over the coming decades.
Knowledge transfer priorities must reflect the latest developments in interventions and performancemeasures, but they must also be shaped by both the capacity of countries to implement this knowledgeand the capacity of global and regional knowledge transfer arrangements and processes to support andaccelerate its delivery. Safety management capacity weaknesses at global, regional and country levelspresent a formidable barrier to progress and must be directly addressed as a strategic priority in relatedknowledge transfer initiatives. In addition to requiring sufficient global, regional and country capacity tosupport and accelerate its delivery, the successful transfer of knowledge requires not only itstransmission but also its absorption and ultimate use.
Knowledge transfer must be grounded in country practice using a ‘learning by doing’ model, backedwith sufficient targeted investment to overcome the barriers presented by the evident capacityweaknesses at the global, regional and country levels. The objectives are to accelerate the transfer of roadsafety knowledge to project participants; strengthen the capacity of participating agencies, industries andcommunity groups; and to achieve quick proven results that generate benchmark measures to dimensiona programme to further roll-out successful initiatives. In this way knowledge transfer contributes to theongoing process of continuous improvement in performance. This approach has particular relevance tolow and middle-income countries, but is also pertinent to high-income countries seeking to break throughcurrent good practice performance barriers and make rapid progress towards achieving the ultimate goalof death and serious injury elimination. Strong and sustained international cooperation will be required tomobilise knowledge transfer resources and support services commensurate with the scale of the globalhealth losses arising from road deaths and serious injuries.

190 – KNOWLEDGE TRANSFER
TOWARDS ZERO: AMBITIOUS ROAD SAFETY TARGETS AND THE SAFE SYSTEM APPROACH - ISBN 978-92-821-0195-7 © OECD/ITF, 2008
NOTE
1. Note that high-income countries are now seeking to reverse this trend and aim to make walking andcycling a more attractive mode of transport, to achieve reductions in emissions and fuel consumption,and the improved physical wellbeing resulting from healthier lifestyles. However, this will require theprovision of sufficient road space and related retro-fitting of protective features in existing networks, tomake them safer and more attractive to existing and potential users.
REFERENCES
Bliss, T. (2004), Implementing the Recommendations of the World Report on Road Traffic InjuryPrevention, Transport Note No. TN-1, World Bank, Washington DC.
Bliss, T. and J. Breen (2008), Implementing the Recommendations of The World Report on Road TrafficInjury Prevention, Operational guidelines for the conduct of country road safety managementcapacity reviews and the related specification of lead agency reforms, investment strategies andsafety programs and projects, World Bank Global Road Safety Facility, Washington DC.
Breen, J., E. Howard and T. Bliss (2008), Independent Review of Road Safety in Sweden, Jeanne BreenConsulting, Eric Howard and Associates, and the World Bank.
Commission for Global Road Safety (2006), Make Roads Safe. A New Priority for SustainableDevelopment, Commission for Global Road Safety, London.
European Environment Agency (2008), Success stories within the road transport sector on reducinggreenhouse gas emission and producing ancillary benefits, EEA Technical Report No. 2/2008,Copenhagen.
WHO (2004), World Report on Road Traffic Injury Prevention. Geneva, World Health Organization,2004.
World Bank Global Road Safety Facility (2007), Strategic Plan 2006 – 2015, World Bank,Washington DC.

CONCLUSIONS AND RECOMMENDATIONS – 191
TOWARDS ZERO: AMBITIOUS ROAD SAFETY TARGETS AND THE SAFE SYSTEM APPROACH - ISBN 978-92-821-0195-7 © OECD/ITF, 2008
CONCLUSIONS AND RECOMMENDATIONS
OECD and International Transport Forum (ITF) countries represent a wide range of economieswhich differ greatly in their road safety performance. The best performing countries currently havearound 5-7 fatalities per 100 000 population. Fatalities in these countries have generally decreased bymore than 50% since the 1970s, despite this being a period when motorisation increased substantially.Countries that have successfully implemented most of the traditional safety measures now facediminishing returns in some areas of intervention. At the other extreme, countries with relatively lowlevels of road safety performance are experiencing a continuing increase in the number of fatalities.
It is evident that countries with different safety levels have different needs. Reaching levels below4-5 fatalities per 100 000 population is likely to require a different strategy than is needed to improveroad safety in poorly performing jurisdictions. Nevertheless, one of the keys to major improvements inroad safety everywhere is adopting a Safe System approach that addresses all aspects of the road safetymanagement system. This requires a shift to more protective interventions that separate dangerous mixedtraffic, ameloriate crash impacts and improve post-crash recovery and rehabilitation services. It involvesdeveloping forgiving road infrastructure, pursuing improved vehicle safety and reducing traffic speed tobetter manage crash energy and reduce unacceptably high injury risk. It requires ensuring higher levels ofuser compliance with the safety standards set for the system and the strengthening of institutionalmanagement capacity to underpin and sustain the delivery of the interventions designed to achieve thedesired results.
In all countries, the level of road casualties is too high. Whatever the current level of road safety,significant numbers of lives can be saved by systematic, concerted and resolute action.
Ambitious road safety targets are necessary to focus efforts to reduce road trauma
Ambitious road safety targets sharpen the focus on results and also on development of system-wideinterventions and effective institutional management processes to achieve them. This puts targets at thecore of an effective road safety management system. Targets serve to raise the profile of road safetywhich in turn enables more intensive deployment of proven safety strategies. The raised profile alsoassists in developing targeted programmes and new approaches to preventing loss of life and seriousinjury on the roads.
While ambitious targets are invaluable for reducing road trauma, they are not a guarantee that thetarget reductions will be achieved. Aspirational targets for very large reductions in road trauma byspecific dates have been adopted in many ITF member countries without links to specified interventions.This makes them difficult to achieve. In the worst case targets that fail to be achieved undermine thecredibility of target setting and road safety programmes generally. Many of the countries that haveadopted the ECMT target for 50% reduction in road deaths between 2000 and 2012 appear unlikely tomeet it. Targets based on expected outcomes from specified interventions should therefore now be set, asa means to move more systematically towards this level of ambition.
Targets must be achievable as well as ambitious. They need to be based on estimated results fromspecific proposals for interventions, using a model specifying the required intervention outputs and

192 – CONCLUSIONS AND RECOMMENDATIONS
TOWARDS ZERO: AMBITIOUS ROAD SAFETY TARGETS AND THE SAFE SYSTEM APPROACH - ISBN 978-92-821-0195-7 © OECD/ITF, 2008
estimating the expected intermediate and final outcomes. Setting ambitious targets without going throughthis process can result in their non-achievement.
Most countries have set final outcome targets, that is reductions in the number of deaths fromcrashes and also, in many cases, the number of serious injuries. Some have adopted targets forintermediate outcomes (such as improving safety belt wearing rates) and institutional outputs (forexample, increasing the number of hours per month of random breath testing). A hierarchy of targets isrecommended, using lower-level targets for institutional outputs and intermediate outcomes to help toidentify and implement interventions necessary to achieve final outcomes. Data on both intermediateoutcomes and institutional outputs are needed to monitor progress towards achieving the desired roadsafety results.
Recommendations
Ambitious, achievable and empirically derived road safety targets should be adopted by allcountries to drive improved performance and accountability. These targets are best developed using amethodology that links interventions and institutional outputs with intermediate and final outcomes todevelop achievable targets for different intervention options.
Exceptional efforts will be required in most OECD and ITF countries to achieve the 2012 roadsafety targets set by Transport Ministers in 2002 or similar ambitious targets. Accordingly, it isrecommended that targets based on expected outcomes from specified interventions now be set, as ameans to move systematically towards the level of ambition established by the targets set in 2002.
A long term vision with a very high level of ambition transforms policy
Several counties now have an explicit ambition to eliminate death and serious injury from the roadnetwork. The primary value of adopting such an ambitious, long term vision is to provide a strongimpetus for innovation – challenging road safety professionals, stakeholders and government to developthe institutional capacity to achieve the desired results, to seek effective new interventions andpartnerships and support the associated research and implementation effort.
An explicit ambition to eliminate death and serious injury on the road network in the long termmakes it clear that no death or serious injury is accepted as inevitable and helps to refocus the effortsmade to protect road users from harm.
The long term vision of zero deaths and serious injuries needs to be linked to interim targets basedon expected outcomes from specified interventions in order to move systematically towards the vision.
Recommendations
All countries are advised to adopt and promote a level of ambition that seeks in the long term toeliminate death and serious injury arising from the use of the road transport system. Adopting thisambition will alter the community’s view of the inevitability of road trauma, alter institutional andsocietal responsibilities and accountability and change the way in which road safety interventions areshaped.
This is an aspirational vision in that achievement will require interventions that are some stepsremoved from prevailing best practice and will require the development of altogether new, more effectiveinterventions. Part of its value lies in driving innovation. The long term vision needs to be complementedwith interim targets for specific planning periods up to a decade or so.

CONCLUSIONS AND RECOMMENDATIONS – 193
TOWARDS ZERO: AMBITIOUS ROAD SAFETY TARGETS AND THE SAFE SYSTEM APPROACH - ISBN 978-92-821-0195-7 © OECD/ITF, 2008
Look to strategies tried and tested elsewhere
Safety outcomes in countries with lower levels of road safety performance, whether in low, middleor high-income countries, could be improved significantly by adopting institutional managementpractices and interventions used effectively elsewhere. Proven road safety interventions include measuresto manage speed, eliminate drink-driving, increase seatbelt and helmet use, improve infrastructure (roadsand roadsides), enhance vehicle safety, reduce young driver risk, separate vulnerable road users fromother traffic and improve the medical management and rehabilitation of crash victims. Implementingthese traditional measures can result in quick safety gains, which in turn can be used to support moreambitious road safety programmes.
However, these interventions do not represent fixed programmes of action. To be successful, theyneed to be adapted to each country’s social and political circumstances. In particular, they need to becongruent with existing legislative settings and be implemented with adequate resources, including forenforcement and public information campaigns. More generally there should be a focus on bothimproving the effectiveness of current institutional management functions and related interventions, andextending the range of future interventions through ongoing research and development and knowledgetransfer.
Recommendations
Countries experiencing difficulty in improving their road safety performance should as a matter ofurgency conduct high-level reviews of their safety management capacity and prepare long-terminvestment strategies and related programmes and projects to overcome revealed capacity weaknesses.These programmes and projects should adapt and implement proven institutional managementarrangements and interventions used in more successful countries, and make use of good practice toolsdeveloped by international agencies to assist this process.
Comprehensive data analysis enables development of effective road safety programmes
Comprehensive data collection and analysis are critical for developing road safety interventions.Crash and other data are required for measuring the distribution of risk across the road network, foridentifying appropriate interventions, monitoring the impact of these interventions and refining futureinterventions.
In-depth data analysis is essential, especially for setting trauma-reduction targets based on specifiedsafety interventions. New targets will have credibility if they are empirically derived from assessment ofthe combined effect of interventions. Development of a model that links intervention options toreductions in deaths and injuries should be an integral part of the strategy and target developmentprocess.
Adequate crash and related safety data do not exist in many low and medium income countries; dataon critical road safety issues such as levels of impaired driving, crash types, use of safety equipment,network speeds, vehicle safety ratings, and travel exposure measures for different road users anddifferent vehicle types are rarely collected. However these data can be readily collected within arelatively short timeframe, providing adequate resources are made available for the purpose. Expertise isavailable in ITF countries to advise on setting up effective data collection systems.

194 – CONCLUSIONS AND RECOMMENDATIONS
TOWARDS ZERO: AMBITIOUS ROAD SAFETY TARGETS AND THE SAFE SYSTEM APPROACH - ISBN 978-92-821-0195-7 © OECD/ITF, 2008
Recommendations
All countries are encouraged to develop data collection procedures to cover: final outcomes(including at least deaths and serious injuries by road user); exposure measures (for example, relatingoutcomes to population levels, licensed driver numbers, distances travelled); intermediate outcomes(also called safety performance indicators and including levels of mean traffic speeds, seat belt wearing,drink driving and vehicle and infrastructure safety ratings); institutional delivery outputs (includingdifferent categories of enforcement effort); socio-economic costs associated with road trauma; andunderlying economic factors (including new vehicle sales).
Careful data analysis should be conducted to improve understanding of crash and other trends toallow different intervention mixes and intensities to be modelled and ambitious as well as achievabletargets to be set.
Success requires a sound road safety management system
An effective road safety programme requires a sound road safety management system. A strongresults focus is critical in setting out the long-term and interim targets to be achieved from a set ofinterventions and institutional outputs based on a comprehensive safety strategy. Adequate institutionalmanagement capacity to support the development and implementation of effective interventions isessential. This requires identification of a lead agency and definition of the roles, responsibilities andaccountabilities of key road safety organizations and individuals and the delivery of related managementfunctions critical to success. The commitment to a results focused approach by road safety managementis essential if ambitious targets are to be achieved.
Recommendations
All countries should commit to ensuring an effective road safety management system and inparticular seek to achieve a strong results focus through their institutional management arrangements.This results focus requires clear identification of: a lead agency; the core group of governmentministries and agencies to be involved; their roles and responsibilities; and the performance targets interms of institutional outputs and intermediate and final outcomes to be achieved within a definedstrategy.
Adopting a Safe System approach is essential for achieving ambitious targets
The Safe System rationale is to ensure that road users are never subject to impact energy levelssufficient to cause fatal or serious, disabling injury. The application of this principle requires innovativethinking about the full range of possible interventions, including developing forgiving roadinfrastructure, improving vehicle safety and reducing traffic speeds to better manage crash energy andreduce injury risk. A focus on the interactions between these system elements is essential to success.
The Safe System approach builds on traditional elements of road safety policy and is characterisedby integrated system-wide interventions and the shared responsibility for results. The existence ofadequate legislation and enforcement to achieve high levels of road user compliance with behaviouralsafety regulations remains an important requirement. Controlling the access of drivers and vehicles to theroad system through safety-driven licensing and registration policies is also a basic requirement. TheSafe System approach also requires change in road safety culture, including the acknowledgement ofshared responsibility and accountability for safety by road system managers, vehicle manufacturers andother system designers in addition to road users and traffic police.

CONCLUSIONS AND RECOMMENDATIONS – 195
TOWARDS ZERO: AMBITIOUS ROAD SAFETY TARGETS AND THE SAFE SYSTEM APPROACH - ISBN 978-92-821-0195-7 © OECD/ITF, 2008
The Safe System approach offers opportunities for improved alignment of road safety policy withother societal goals – for example, important synergies exist with environmental protection policies thataim to reduce vehicle emissions through improved driving style and lower speeds.
A Safe System approach is the key to achieving longer term ambitious targets and is now central tothe achievement of targets set in many of the countries that have been most successful in reducing roaddeaths and serious injuries. A Safe System approach is also appropriate for countries at all levels of roadsafety performance even if the specific interventions, strategies and pace of progress will differ fromcountry to country. It offers new opportunities to reduce death and injury and has the potential to greatlyaccelerate improvements in performance. To be successful, the adoption of a Safe System approach mustbe made in close co-operation with the public to increase its acceptance.
Recommendations
It is recommended that all countries, regardless of their level of road safety performance, move to aSafe System approach to road safety. This approach builds on existing road safety interventions butreframes the way in which road safety is viewed and managed in the community. It addresses allelements of the road transport system in an integrated way with the aim of ensuring crash energy levelsare insufficient to cause fatal or serious injury. It requires acceptance of shared overall responsibilitiesand accountability between system designers and road users and stimulates the development ofinnovative interventions and new partnerships.
Road safety investment opportunities
Road crash costs usually represent between 1% and 3% of a country’s GDP (depending on whethera human capital or willingness to pay approach is used). While a survey conducted for this report showsthat many countries are unable to estimate the annual costs of road trauma to government and injuryinsurers, the available evidence suggests that costs substantially outweigh the funds put into preventionprogrammes.
The adoption of a Safe System approach can produce important economic savings for society. Tocompete for limited resources with other government programmes, the road safety case needs to includesound economic arguments. This requires road safety managers to be skilled in assembling businesscases for initiatives, including economic analysis. Accurate estimates of crash costs are necessary toshow the scale of the problem and to attract investment in road trauma prevention.
Cost benefit analyses from various member countries show that carefully targeted road safetyactivity can be a viable investment opportunity, providing a competitive return for the insurance industryas well as government especially when the aggregate costs to the two sectors are considered and notsolely the costs to government.
Opportunities to attract funding by offering commercially acceptable rates of return for investorsneed to be vigorously pursued.
A step change in resources invested in road safety management and in safer transport systems isrequired to realise the achievement of ambitious road safety targets in most of the world.

196 – CONCLUSIONS AND RECOMMENDATIONS
TOWARDS ZERO: AMBITIOUS ROAD SAFETY TARGETS AND THE SAFE SYSTEM APPROACH - ISBN 978-92-821-0195-7 © OECD/ITF, 2008
Recommendations
Most countries need to improve their knowledge of expenditure on the consequences of roadcrashes, both by government and injury insurance companies, and investment in road safetyimprovement and trauma prevention.
Road safety authorities need this information to prepare financial and economic evidence on thecosts and effectiveness of proposed interventions in order to win whole-of-government support forfunding innovative programmes.
There are opportunities for targeted road safety investments that provide competitive returns. Roadsafety practitioners and authorities should develop business cases for this investment.
Achieving commitment at the highest levels of government
Sustained government commitment at the highest level is essential for improving road safety. It isparticularly important for securing funding in competition with other government priorities, forimplementing measures that may not be popular in the short term, for building institutional capacity andfor developing strong partnerships between the public agencies involved in road safety. Road safety canbe hard to sell to politicians.
Achieving sustainable progress in reducing road trauma requires an informed community, exposedto and engaged in the issues through public debate, not only during the strategy development period buton an ongoing basis. Such engagement positively influences the political debate.
Recommendations
Road safety managers not only need to develop evidence-based road safety programmes but need toadvocate strategies that reflect an understanding of political constraints such as the electoral cycle.
Significant effort needs to be directed at informing the public about the Safe System approach.Public consultation should be comprehensive and should precede final political consideration of newpolicies.
Road safety practitioners and stakeholders have a responsibility to influence the political process ofpolicy assessment through competent and persistent advocacy of programmes within government,provision of annual estimates of the socio-economic costs of road trauma and development of anextensive armoury of effective road safety interventions.
Accelerated knowledge transfer is critical to the successful adoption of a Safe System approach
High-income countries will increasingly depend on innovation to achieve their safety targets. Low-and middle-income countries will be able to benefit from these innovative approaches if subsequentknowledge is shared between countries.
Knowledge transfer priorities must reflect the latest developments in improving road safetyperformance and be shaped by the capacity of countries, and supporting global and regional institutions,to implement this knowledge through scaled up investment programmes and projects designed toovercome capacity weaknesses and achieve targeted results across the road network.

CONCLUSIONS AND RECOMMENDATIONS – 197
TOWARDS ZERO: AMBITIOUS ROAD SAFETY TARGETS AND THE SAFE SYSTEM APPROACH - ISBN 978-92-821-0195-7 © OECD/ITF, 2008
Recommendations
Knowledge transfer initiatives must be supported with adequate investment in targeted programsand projects designed to overcome institutional capacity weaknesses, especially by creating sustainablelearning opportunities in the countries concerned.
Strong and sustained international cooperation will be required to mobilize resources and supportcommensurate with the scale of the losses arising from escalating road deaths and serious injuries. Thisis especially the case with low and middle-income countries, but it is also relevant to high-incomecountries seeking innovative strategies for achieving the ultimate goal of eliminating death and seriousinjury.


ANNEX A. ROAD SAFETY TRENDS – 199
TOWARDS ZERO: AMBITIOUS ROAD SAFETY TARGETS AND THE SAFE SYSTEM APPROACH - ISBN 978-92-821-0195-7 © OECD/ITF, 2008
ANNEX A. ROAD SAFETY TRENDS
ABSTRACT
Annex A summarises the progress made by OECD/ITF member countries in improving their levelof road safety over the past 35 years. It shows examples of measures that have contributed to the changesin fatality levels include improved vehicle safety standards, roads designed for safety and laws topromote seat belt use and deter impaired driving.
A.1. Background
This annex has three objectives
1. To illustrate that different countries have achieved substantially different levels of road safetysuccess over the past 35 years.
2. To argue that the success enjoyed by the best performing countries can also be at least partlyachieved by other countries, regardless of their current stage of safety and economicdevelopment.
3. To support the argument made in Chapter 1, that a key component of any effective approach isto adopt a results focus, underpinned by adequate data systems.
Adequate data systems allow road safety outcomes to be tracked over time, allow risk areasrequiring action to be identified and allow the effectiveness of road safety interventions to be evaluated.At a minimum, countries should have reliable measures of the number of fatalities on their roadways toserve as ultimate outcome measures. Preferably, countries will also track other injury collisions, as wellas tracking intermediate measures such as seat belt use, impaired driving and the percentage of newvehicles with maximum safety ratings. To achieve greater understanding of their road safetyprogrammes, countries are also recommended to track input measures such as the level of funds beingspent on road safety and for what purpose (e.g. road improvements and police traffic enforcement).
A.2. Changes in the numbers of road fatalities
Table A.1 shows the changes in the absolute number of fatalities for OECD/ITF member countriesover the period 1970-2005, the percentage change in fatalities for the period 1970-2005, as well as theaverage annual variations for different time periods.

200 – ANNEX A. ROAD SAFETY TRENDS
TOWARDS ZERO: AMBITIOUS ROAD SAFETY TARGETS AND THE SAFE SYSTEM APPROACH - ISBN 978-92-821-0195-7 © OECD/ITF, 2008
Table A.1.a. Absolute number of fatalities in OECD/ITF member countries 1970-2005and average annual variation
OECD Asia / Pacific
Average annual variation
1970 1980 1990 2000 2005 Change1970-2005
1970-1980
1980-1990
1990-2000 2000-05
Australia 3 798 3 272 2 337 1 817 1 637 -57% -1.5% -3.3% -2.5% -2.1%Japan 21 795 11 388 14 595 10 403 7 931 -64% -6.3% 2.5% -3.3% -5.3%Korea 3 529 6 449 14 174 10 236 6 376 81% 6.2% 8.2% -3.2% -9.0%New Zealand 655 597 729 462 405 -38% -0.9% 2.0% -4.5% -2.6%
Total OECDAsia/Pacific 29 777 21 706 31 835 22 918 16 349 -45% -3.1% 3.9% -3.2% -6.5%
Table A.1.b. Absolute number of fatalities in OECD/ITF member countries 1970-2005and average annual variation
OECD North America
Average annual variation
1970 1980 1990 2000 2005Change1970-2005
1970-1980
1980-1990
1990-2000
2000-05
Canada 5 080 5 461 3 963 2 927 2 925 -42% 0.7% -3.2% -3.0% 0.0%United States 52 627 51 091 44 599 41 945 43 443 -17% -0.3% -1.3% -0.6% 0.7%
Total N. AmericaExcludingMexico 57 707 56 552 48 562 44 872 46 368 -20% 0% -2% -1% 1%
Table A.1.c. Absolute number of fatalities in OECD/ITF member countries 1970-2005and average annual variation
CIS countries
Average annual variation
1970 1980 1990 2000 2005Change1970-2005
1970-1980
1980-1990
1990-2000 2000-05
Armenia 214Azerbaijan 1 214 596 -6.9% -Belarus 2 211 1 594 -3.2% -Georgia 795 902 1 067 500 581 -27% 1.3% 1.7% -7.3% 3.0%Moldavia 585 931 1 127 406 391 -33% 4.8% 1.9% -9.7% -0.8%Russia 27 500 35 366 29 594 33 957 2.5% -1.8% 2.8%Ukraine 9 600 5 200 7 229 -5.9% 6.8%
Russia, Ukraine,Georgia andMoldavia 47 160 35 700 42 158 -2.7% 3.4%

ANNEX A. ROAD SAFETY TRENDS – 201
TOWARDS ZERO: AMBITIOUS ROAD SAFETY TARGETS AND THE SAFE SYSTEM APPROACH - ISBN 978-92-821-0195-7 © OECD/ITF, 2008
Table A.1.d. Absolute number of fatalities in OECD/ITF member countries 1970-2005and average annual variation
CEECs (Central and Eastern Europe and the Baltic Sea)
Average annual variation
1970 1980 1990 2000 2005Change1970-2005
1970-1980
1980-1990
1990-2000
2000-05
Albania 280 308 1.9%Bulgaria 838 1 199 1 567 1 012 957 14% 3.6% 2.7% -4.3% -1.1%Croatia 1 166 1 603 1 380 655 597 -49% 3.2% -1.5% -7.2% -1.8%Czech Republic 1 983 1 261 1 291 1 486 1 286 -35% -4.4% 0.2% 1.4% -2.8%Estonia 252 303 436 204 168 -33% 1.9% 3.7% -7.3% -3.8%FYR Macedonia 148 221 207 162 143 -3% 4.1% -0.7% -2.4% -2.5%Hungary 1 627 1 630 2 432 1 200 1 278 -21% 0.0% 4.1% -6.8% 1.3%Latvia 646 653 877 588 442 -32% 0.1% 3.0% -3.9% -5.5%Lithuania 667 779 933 641 772 16% 1.6% 1.8% -3.7% 3.8%Malta 15 17 2.5%Poland 3 446 6 002 7 333 6 294 5 444 58% 5.7% 2.0% -1.5% -2.9%Romania 1 938 1 863 3 782 2 499 2 641 36% -0.4% 7.3% -4.1% 1.1%Serbia / Mont 1 425 1 969 2 095 1 048 841 -41% 3.3% 0.6% -6.7% -4.3%Slovak Republic 662 648 600 -0.2% -1.5%Slovenia 620 558 517 314 258 -58% -1.0% -0.8% -4.9% -3.9%
Total CEECsexcluding Albania,Bosnia-H, Maltaand Slovak Rep.
14 756 18 041 22 850 16 103 14 827 0% 2.0% 2.4% -3.4% -1.6%
Table A.1.e. Absolute number of fatalities in OECD/ITF member countries 1970-2005and average annual variation Western Europe
Average annual variation
1970 1980 1990 2000 2005 Change1970-2005
1970-1980
1980-1990
1990-2000
2000-2005
Austria 2 574 2 003 1 558 97 768 -70% -2.5% -2.5% -4.6% -4.7%Belgium 3 070 2 396 1 976 1 47 1 089 -65% -2.4% -1.9% -2.9% -5.8%Denmark 1 208 690 634 49 331 -73% -5.4% -0.8% -2.4% -7.8%Finland 1 055 55 649 39 379 -64% -6.3% 1.7% -4.8% -0.9%France 16 445 13 499 11 215 8 07 5 318 -68% -2.0% -1.8% -3.2% -8.0%Germany 21 653 15 050 11 046 7 50 5 361 -75% -3.6% -3.0% -3.8% -6.5%Greece 1 099 1 446 2 050 2 03 1 658 51% 2.8% 3.6% -0.1% -4.0%Iceland 20 25 24 32 19 -5% 2.3% -0.4% 2.9% -9.9%Ireland 540 564 478 41 348 -36% 0.4% -1.6% -1.4% -3.5%Italy 11 025 9 220 7 151 6 64 5 426 -51% -1.8% -2.5% -0.7% -4.0%
Liechtenstein* 12 9 3 2 -83% -2.8%-
10.4% 0.0% -7.8%Luxemburg 132 98 71 7 46 -65% -2.9% -3.2% 0.7% -9.6%Netherlands 3 181 1 996 1 376 1 082 750 -76% -4.6% -3.7% -2.4% -7.1%Norway 560 362 332 34 224 -60% -4.3% -0.9% 0.3% -8.1%Portugal 1 615 2 579 2 646 1 86 1 247 -23% 4.8% 0.3% -3.5% -7.7%Spain 5 456 6 522 9 032 5 77 4 442 -19% 1.8% 3.3% -4.4% -5.1%Sweden 1 307 848 772 59 440 -66% -4.2% -0.9% -2.6% -5.7%Switzerland 1 643 1 209 925 592 409 -75% -3.0% -2.6% -4.4% -7.1%United Kingdom 7 771 6 182 5 402 3 58 3 336 -57% -2.3% -1.3% -4.0% -1.4%
Total Western EuropeExcluding Turkey 80 366 65 249 57 340 41 95 31 593 -61% -2.1% -1.3% -3.1% -5.5%

202 – ANNEX A. ROAD SAFETY TRENDS
TOWARDS ZERO: AMBITIOUS ROAD SAFETY TARGETS AND THE SAFE SYSTEM APPROACH - ISBN 978-92-821-0195-7 © OECD/ITF, 2008
Source: IRTAD and ITF statistics.
While many countries have seen sustained decreases in the number of road fatalities from 1970 to2005, there has been considerable variation across individual countries, with some countries showingeither occasional or regular periods of increase. The greatest reductions were observed in theNetherlands, which had a 76% decline in fatalities for the total period, followed closely by Germany andSwitzerland, both with a 75% reduction.
Figure A.1 shows the changes in fatalities over the same period for different country regions.
Figure A.1. Changes in fatality numbers per region, 1970-2005
Source: IRTAD and ITF.
Note: Countries for which appropriate data were not available include: Albania, Bosnia-H, Malta, SlovakRepublic, Turkey, Mexico, Belarus, Armenia, Ukraine, Azerbaijan.
As summarised in Figure A.1, the greatest regional reductions in fatalities over the total period wereobserved in the Western European and Asian Pacific countries (declines of 61% and 45%, respectively).During the more recent period 2000 to 2005, the greatest reductions again occurred in the Asian Pacificand Western European regions (declines of 6.5% and 5.5%, respectively). In North America, annualreductions in fatalities were generally greater during the 1980’s than in subsequent years, with fatalitiestending to level off most recently. Central and Eastern European Countries (CEEC) and Commonwealthof Independent States (CIS) showed considerable annual reductions in the 1990s but since 2000, fatalitieshave stabilised in the CEEC and have increased in the CIS.
Although it is difficult to identify and quantify specific causes for the improvements that have beenmade especially in the best-performing countries, at least some factors can be confidently identified. Forexample, it is evident that vehicles have become safer in terms of both ability to avoid crashes andcrashworthiness compared to 35 years ago, and roadways are being designed to better separate and henceprotect road users. In addition, seat belt and helmet use laws, anti-impaired driving laws and enforcementtechnology such as speed cameras are having a substantial impact on the behaviour of road users in manycountries. These and other interventions are explored in greater detail in Chapter 3. With sufficient will,knowledge and resources, all countries with reduced performance can substantially improve their level ofroad safety by adopting these and other measures.

ANNEX A. ROAD SAFETY TRENDS – 203
TOWARDS ZERO: AMBITIOUS ROAD SAFETY TARGETS AND THE SAFE SYSTEM APPROACH - ISBN 978-92-821-0195-7 © OECD/ITF, 2008
Great Britain’s road safety success has been linked to identifiable policies
Between 1970 and 2005, Great Britain more than halved its number of road fatalities. As part of thedetailed statistical analysis that was carried out prior to setting the casualty reduction target for 2010, anattempt was made to relate casualty trends to particular policy initiatives. In practice, it was possible togo only a certain way towards this goal. Three areas of policy were identified as having contributedsignificantly to the casualty reductions during the decade 1985 to1995:
• Improved standards of passive/secondary safety in cars.
• Measures to reduce the level of drink/driving.
• Road infrastructure engineering.
The combined effects of these three measures, termed the “DESS”, were separated from the effectsof all other road safety policies, termed the “core programme”. The table below shows the estimates ofreductions in casualties by road type attributed to the two groups of measures.
Table A.2. Estimates of the reduction in non-motorcyclist casualty rates achieved between 1985 and1995 by the DESS measures and the core programme.
Table A.2. Estimation of the reduction of non motorcyclists casualty rates1985-1995
Growth (%)in
Casualty rate reduction (%)achieved by
Traffic Casualties DESS measures Core programme
Deaths, serious injuries
Motorways 87 -11 13 45Urban A roads 21 -35 13 39Rural roads 43 -25 16 33Minor roads 36 -11 16 33
Slight casualties
Motorways 87 77 3 2Urban A roads 21 11 6 2Rural A roads 43 23 4 10Minor roads 23 7 3
Note: Motorcyclist casualties are excluded from the analysis because part of the reductions in motorcyclistcasualties over this period resulted from the reduced popularity of motorcycling (a trend that has sincereversed).
Measures comprising the core programme include education, publicity, speed and trafficmanagement apart from engineering, enforcement apart from drink driving and vehicle standards apartfrom secondary protection. The methodology looked for effects from known measures that could beidentified from casualty trends. Apart from the DESS measures, none were large enough to be identifiedseparately.

204 – ANNEX A. ROAD SAFETY TRENDS
TOWARDS ZERO: AMBITIOUS ROAD SAFETY TARGETS AND THE SAFE SYSTEM APPROACH - ISBN 978-92-821-0195-7 © OECD/ITF, 2008
Improving road safety in Germany
Particularly in the last 15 years, the number of fatalities on German roads has fallen sharply. In1991, 11 300 people were killed in road crashes. By 2005, fatalities had fallen to 5 361. The reasons weretwofold: first, active and passive safety features of vehicles (e.g. ESP, front passenger airbags, sideprotection systems); and secondly, the development and implementation of governmental road safetyprogrammes.
The fundamental, long-term governmental road map for enhancing road safety in Germany is the“Programme for More Safety in Road Traffic”, which was launched in 2001 by the Federal Ministry ofTransport, Building and Urban Affairs. The Programme aims to decrease the numbers of fatalities bypreventing the collisions that cause them, mitigating the impact of crashes and avoiding their adverseeconomic effects. It focuses on improving Germany’s road culture/“climate”, protecting vulnerable roadusers, making novice drivers less prone to collisions, reducing the danger posed by heavy goods vehiclesand on raising road safety on rural roads. The Federal Ministry's road safety programme comprises over100 individual measures to improve the road safety performance in Germany. There is no ranking ofmeasures within this programme.
By implementing the road safety programme and by introducing other recent initiatives, the federalgovernment is making a major contribution to improving road safety while still ensuring that Germanyremains mobile. Despite the achievements made so far, road safety issues remain an outstandingchallenge for the future, requiring the on-going development of appropriate road safety measures.
The challenge for road safety in the Russian Federation
A review of road safety in the Russian Federation was carried out by the World Bank (2006), withroad travel and transport policy in the Russian Federation currently undergoing major change. This is aresult of the rapidly increasing access of citizens to motor cars and the widely-acknowledged need in theRussian Federation for further development in public policy, legal frameworks and road safetymanagement.
Against the background of a 260% increase in the size of the car fleet since the early 1990s,indicators have shown a dramatic deterioration in road safety. In 2005, more than 280 000 reportableroad crashes took place, resulting in more than 34 500 deaths and 251 400 injuries. Reported road deathsrose by 25% since 1991, with further increases in deaths and serious injuries expected. According toofficial sources, the socio-economic costs of road crashes are estimated at around 2.5% of GrossDomestic Product.
The growing burden of road injury and the substantial societal price being paid for the newvehicular mobility in the Russian Federation is, clearly, a key challenge for the responsible agencies andsociety at large.

ANNEX A. ROAD SAFETY TRENDS – 205
TOWARDS ZERO: AMBITIOUS ROAD SAFETY TARGETS AND THE SAFE SYSTEM APPROACH - ISBN 978-92-821-0195-7 © OECD/ITF, 2008
A.3. Changes in road fatality rates
Assessing a country’s relative progress in road safety may be sensitive to which measure ofexposure to risk is used (i.e. population, registered vehicles, distance travelled). In the health sector, thereis a preference for the use of fatalities-per-population, since it permits comparisons with other injury anddisease outcomes and facilitates setting priorities for health promotion – but does not take accountespecially of different levels of motorisation across different countries. Vehicle-based rates make itdifficult to compare especially countries which vary geographically. For example, countries with largeland masses such as Canada, the United States and Australia, have higher rates of private vehicle usageand greater difficulty in providing public transport such as buses or trains in rural areas and smallpopulation centres. In the transport sector, it is more common to use distance travelled as the measure ofexposure to risk or if these data are not available, to use the number of registered vehicles as the proxyfor distance travelled. However the use of a per-distance fatality rate means that the level of road safetycould appear to be improving if the amount of travel were increasing, without there necessarily being areduction in the absolute number of fatalities.
Table A.3 shows the fatality rates per 100 000 population and per billion kilometres travelled for theperiod 1970-2005, for those countries able to provide this information.
For most of the countries shown in Table A.3, there has been a fairly steady decline in the fatalityrate per population over the last 35 years – with Sweden, Great Britain, the Netherlands, Switzerland andNorway having the lowest rates in 2005 (all below 6.0 fatalities per 100 000 inhabitants). The relativelyfew countries that have trend data for fatalities per distance travelled, all show declines over time – withSweden, Great Britain, the Netherlands, Denmark, Germany, Norway and Finland having the lowestrates in 2005 (8 or fewer fatalities per billion vehicle-kilometres). It is evident that those countries thathave the lowest fatalities per million population also tend to have amongst the lowest fatalities perdistance travelled. While there are some exceptions (for example, Japan and Iceland have relatively lowfatalities per population but relatively high fatalities per distance travelled), overall, it appears that thesetwo measures of exposure produced similar results.

206 – ANNEX A. ROAD SAFETY TRENDS
TOWARDS ZERO: AMBITIOUS ROAD SAFETY TARGETS AND THE SAFE SYSTEM APPROACH - ISBN 978-92-821-0195-7 © OECD/ITF, 2008
Table A.3. Road fatality rates per100 000 inhabitants and per billion vehicle-kilometres1970-2005
Country Killed per 100 000 inhabitants Killed per billion veh-km
1970 1980 1990 2000 2005 1970 1980 1990 2000 2005
Albania 9.6Armenia 7.7Australia 30.4 22.3 13.7 9.5 8.1 49.3 9.3 7.9Austria 34.5 26.5 20.3 12.2 9.3 109 56.2 27.9 13.2 9.3Azerbaijan 17.6 9.6Belarus 17.4Belgium 31.8 24.3 19.9 14.4 10.4 105 50.0 28.1 16.3 11.5Bosnia - H. 5.9Bulgaria 12.4Canada 23.8 22.7 14.9 9.5 9.1 9.5 9.2Croatia 28.5 13.4Czech Republic 20.0 12.2 12.5 14.5 12.6 53.9 48.3 37 25.6Denmark 24.6 13.5 12.4 9.3 6.1 51 25.0 17.3 10.7 7.7*Estonia 27.3 12.4Finland 22.9 11.6 13.1 7.7 7.2 20.6 16.3 8.5 7.3France 32.6 25.1 19.8 13.6 8.8 90 43.6 25.7 15.1 9.6FYR Macedonia 7Georgia 13Germany 27.7 19.3 14.0 9.1 6.5 37.3 20.0 11.3 7.8Great Britain 13.9 10.9 9.4 6.0 5.5 37 21.9 12.7 7.3 6.4Greece 12.5 15 20.1 18.7 15Hungary 15.8 15.2 23.4 12 12.7Iceland 9.8 11 9.5 11.5 6.5 21.1 13.5 16.0Ireland 18.3 16.6 13.6 11.0 8.3 28.4 19.2Italy 16.4 12.4 9Japan 21.0 9.3 11.8 8.2 6.2 96 29.3 23.2 13.4 10.3Korea 17.2 33.5 21.8 13.2 49.5 18.3Latvia 19.2Liechtenstein 5.8Lithuania 22.6Luxemburg 27.0 18.8 17.5 10.1Malta 4.2Moldavia 9.3Netherlands 24.6 14.2 9.2 6.8 4.6 26.7 14.2 8.5New Zealand 23.0 18.9 21.4 12.1 9.9 12.4 10.3Norway 14.6 8.9 7.8 7.6 4.9 19.3 12.0 10.5 6.1Poland 10.6 16.8 19.2 16.3 14.3Portugal 18.6 27.7 28.3 18.1 11.8Romania 12.2Russia 23.7Serbia / Mont 11.1Slovak Republic 11.1Slovenia 35.8 29.2 25.9 15.8 12.9 167 96.1 65.1 26.7 16.6Spain 17.7 23.2 14.5 10.2Sweden 16.3 10.2 9.1 6.7 4.9 35 16.4 12.0 8.5 5.9Switzerland 26.6 19.2 13.9 8.3 5.5 56.5 30.9 18.5 10.4 6.6Ukraine 15.3United States 25.8 22.5 17.9 15.3 14.7 29.7 20.9 12.9 9.5 9.0
Source: IRTAD and ITF* 2004

ANNEX A. ROAD SAFETY TRENDS – 207
TOWARDS ZERO: AMBITIOUS ROAD SAFETY TARGETS AND THE SAFE SYSTEM APPROACH - ISBN 978-92-821-0195-7 © OECD/ITF, 2008
Figure A.2 compares the risks in terms of fatalities per 100 000 population and the risks in terms offatalities per billion vehicle-kilometres. Countries situated on the bottom left corner can be considered asthe safest countries.
Figure A.2. Comparison of fatalities per veh-km and population20061
A.4. Changes in road injuries
The World Report on Road Traffic Injury Prevention (WHO, 2004) estimated that each year thereare between 20 and 50 million people injured in motor vehicle collisions around the world. The widerange in this estimate is due to difficulties in obtaining comparable injury data across jurisdictions. Evenwhen data are available, they are often not reliable due especially to variations in collection procedures.While it is therefore not meaningful to compare injury levels across countries, it is important that withineach country, data are collected in a consistent way from year to year so that at least internal trends canbe identified and analysed.
Figure A.3 shows the changes in the numbers of fatalities and injury crashes in a collection ofOECD/ITF countries over the past fifteen years, indexed against the fatality and injury crash levelsin 1990.
There has been a drop in fatal crashes of over 30% among OECD/ITF countries but a drop of onlyabout 13% for injury collisions. Both sets of reductions occurred despite a 30% increase in the number ofregistered vehicles in member countries. The greater decrease in fatal crashes may be due to some of thesafety measures (for example, improved vehicle crashworthiness) resulting in a shift in the injuryseverity distribution: some fatalities may have been converted to serious injuries, and to a lesser extentsome of the serious injuries to minor injuries. Alternatively, there could have been reporting changeswhich resulted in additional injury collisions being captured.

208 – ANNEX A. ROAD SAFETY TRENDS
TOWARDS ZERO: AMBITIOUS ROAD SAFETY TARGETS AND THE SAFE SYSTEM APPROACH - ISBN 978-92-821-0195-7 © OECD/ITF, 2008
Figure A.3. Changes in fatalities and injury crashes (1990-2005)
Source: IRTAD and ITF.
To counter the latter possibility, there is merit therefore in a reporting system that allows for betterbut consistent capture of injury information, for example, by linking police data with hospital data. Thisapproach has been adopted in several countries, as shown in Chapter 2.
A.5 Conclusions
Over the period 1970 to 2005, road fatalities in most OECD/ITF countries declinedsubstantially in terms of both absolute numbers and rates based on various exposure measures. Therehave been, however, considerable variations across individual countries, with some countries showingeither occasional or regular periods of increase. The progress in reducing fatalities has been greater thanfor reducing injuries, although the suspect quality of injury data prevents any definitive conclusions.
NOTE
1. 2006 data, except : Denmark (number of killed per billion veh-km for 2004) and the United States(number of killed per billion veh-km for 2005).
REFERENCES
IRTAD, The International Road Traffic and Accident Database, www.irtad.net
ECMT (2006), Road safety performance: National Peer Review: Russian Federation, ECMT, Paris.
World Health Organization (2004), World Report on Road Traffic Injury Prevention, 2004.

ANNEX B – TRENDS IN DIFFERENT CRASH TYPES FOR CANADA, THE NETHERLANDS AND NEW ZEALAND – 209
TOWARDS ZERO: AMBITIOUS ROAD SAFETY TARGETS AND THE SAFE SYSTEM APPROACH - ISBN 978-92-821-0195-7 © OECD/ITF, 2008
ANNEX B. TRENDS IN DIFFERENT CRASH TYPES FOR CANADA,THE NETHERLANDS AND NEW ZEALAND 1
B.1. General description of the data analysis
Considering different crash categories may assist in developing appropriate intervention priorities,especially if the categories are showing different trends. The number of categories must be balanced: toomany categories lead to too few data per category for meaningful analysis, whereas too few categorieswill not give sufficiently specific findings. In this analysis, road fatality data have been disaggregatedaccording to both the traffic mode of the victim and that of any second party involved in the crash.Collisions entailing three or more units are rare and were not considered. A crash has been defined aseither a collision involving a single unit and an object (for example, a bicyclist hitting a tree) or acollision between two units. Each single-unit crash has been denoted as: traffic mode of the fatality –single unit. For example, a collision between a cyclist and a tree resulting in the death of the rider wouldbe categorised as a ‘bicycle-single unit’ crash. Each two-unit crash has been classified as crash type “P-Q”, where a user of traffic mode P was the fatality and the user of traffic mode Q was the second partyinvolved in the crash. Thus a crash in which a pedestrian was killed after being struck by a car, would becategorised as a pedestrian-car crash.
A pedestrian is considered a traffic mode, as is travel by bicycle, moped, motorcycle, car, van andby heavy vehicle, with the exact categories differing between countries. Because the analyses presented inthis chapter do not aim to compare countries but rather changes across time within each country, thetraffic mode categories vary across the three countries according to the available data.
Each fatality arising from a road crash has been separately classified. For example, a collisionbetween a car (with a passenger) and a van, in which both drivers and the passenger of the car werekilled, has been counted three times: twice as a car-van crash and once as a van-car crash2.
The time-series of the number of fatalities3 for all crash types has usually been based on at least 20years of data. It is important to have a lengthy data set so that trends can be separated from randomfluctuations. Also, it becomes easier to recognise corresponding fluctuations in external influencingfactors (such as distance travelled, fleet size or vehicle sales).
Based on this approach, SWOV analysed the crash data of several countries. This Annex presentsthe analysis that was made for three countries: The Netherlands, Canada and New Zealand.
B.2 Detailed description of the data analyses
The first step in this analysis was to generate a collection of time-series graphs based on fatality dataper crash type for each of the three targeted countries.
The second step was to analyse the different crash types and to seek explanations for the datapatterns. Possible explanatory factors include:

210 – ANNEX B – TRENDS IN DIFFERENT CRASH TYPES FOR CANADA, THE NETHERLANDS AND NEW ZEALAND
TOWARDS ZERO: AMBITIOUS ROAD SAFETY TARGETS AND THE SAFE SYSTEM APPROACH - ISBN 978-92-821-0195-7 © OECD/ITF, 2008
• Changes of definitions or registration practices, whereby particularly the definition of a fatalityor crash type may have changed over time
• Changes in the traffic system leading to changes in exposure, including the use of differenttraffic modes
• Changes in fatality risk, often due to a combination of different underlying risk factors.
It is important to distinguish between changes in exposure and changes in crash risk. For example,more people using public transport instead of using a private car is likely to see a decrease in car-relatedfatalities. However this improvement is not due to any improvement in risk factors relating to car travelbut to reduced exposure occasioned by a shift to another traffic mode.
The difference between quickly decreasing and slowly decreasing crash types is also important,especially when projections are being made and safety targets being set. In the following demonstrationanalyses, the crash types have been divided into two groups: quickly decreasing and slowly decreasingcrash types4.
B.3. The Netherlands
The figure B.1 shows the time series of the most important crash types for The Netherlands.
Figure B.1. Time series of traffic fatalities in relevant crash typesThe Netherlands
Source: SWOV.
Note: The left column shows the traffic mode of each fatality; the top row shows the traffic mode of the other partyin the crash (with the image of a tree symbolizing a solo crash); the colours of each graph indicate the proportion ofall fatalities represented in that graph.

ANNEX B – TRENDS IN DIFFERENT CRASH TYPES FOR CANADA, THE NETHERLANDS AND NEW ZEALAND – 211
TOWARDS ZERO: AMBITIOUS ROAD SAFETY TARGETS AND THE SAFE SYSTEM APPROACH - ISBN 978-92-821-0195-7 © OECD/ITF, 2008
There has been a strong and consistent decline in the total annual numbers of fatalities over the past30 years in The Netherlands – in round terms, falling from approximately 2 500 in 1976 to under 1 000in 2006. Looking at the sums of crash types, this decline has to varying extents been shared by most ofthe major crash types and road user groups (the exceptions being all crashes involving slow mopeds andall crashes involving vans). However once the different crash types are considered in greater detail, theextent of success in reducing fatalities varies substantially, with some specific crash types either showingno decrease or an increase. Some of these variations are explored in more detail below.
Analysis of quickly decreasing crash types
Quickly decreasing trends were observed for the four crash types that made the largest contributionto the overall number of fatalities:
• The number of killed pedestrians decreased by 6.7% yearly.
• The number of killed cyclists decreased by 5.4% yearly.
• The number of killed car occupants in a car-car crash decreased by 5.0% yearly.
• The number of killed car occupants in a single-unit traffic crash decreased by 2.2% yearly.
Figure B.2 shows the number of fatalities for these four crash types in the last 30 years. Alogarithmic vertical scale was used, which results in straight lines for data with a constant yearlydecrease.
Figure B.2. Decreasing rates for fatalities in four important crash types in the Netherlands
car singlecar-car
bicycle-carpedestrian-car
pedestrian car: -6,47%
bicycle car: -5,21%
car single vehicle: -2,21%
car car: -4,84%
10
100
1000
1975 1980 1985 1990 1995 2000 2005year of accident
num
ber o
f fat
aliti
es
singleCarBicyclePedestrian
Source: SWOV.

212 – ANNEX B – TRENDS IN DIFFERENT CRASH TYPES FOR CANADA, THE NETHERLANDS AND NEW ZEALAND
TOWARDS ZERO: AMBITIOUS ROAD SAFETY TARGETS AND THE SAFE SYSTEM APPROACH - ISBN 978-92-821-0195-7 © OECD/ITF, 2008
In Figure B.2, fatal single-unit car collisions clearly outnumber the other three crash types. Thepredominance of fatalities from single-unit car collisions increased over the years, with the yearlydecrease of fatalities from this crash type being 2.2%, compared to a 5- 6% yearly decrease for the otherthree crash types.
Any possible change in car mobility should affect each car-related crash type in approximately thesame way. Given this reasoning, there must be other explanations for the differences between thedecreasing rates of these four crash types. In an attempt to identify other causes, the following questionswere asked:
• Why did fatalities in car-car collisions decrease much faster than fatalities in single-carcollisions?
• What caused the strong decrease in the number of pedestrians and cyclists killed by cars?
Single-car and car-car collisions
It may be assumed that the decrease in the number of single-vehicle fatalities is attributable at leastin part to improvements in driver capabilities, speed limit enforcement and vehicle safety (seatbelts etc.).However these developments were also likely to have contributed to the decrease in fatalities arisingfrom the other three crash types which also involved cars. Therefore it has to be assumed that the lattercrash types benefited from additional developments. It may be that for car-car crashes, road infrastructureimprovements (for example, the increased number of level road junctions with traffic lights,roundabouts, median barriers separating opposing lanes) specifically improved the survival probabilitiesfor car-car crashes. These measures may have been supplemented by other measures (for example,energy-absorbing zones in vehicles), to explain the greater yearly decrease in the number of car-carfatalities. Other explanations are also possible.
Pedestrian-car collisions
The number of pedestrians did not decrease between 1970 and 2005 in the Netherlands. Althoughthere was a change in demographics (30% fewer children in the seventies), the fall in deaths was equallystrong over the entire age range. However, there was an increase in the number of large shopping areasand malls and (since 1995) in the number of slow speed residential areas (woonerfs). These and otherimprovements may have led to yearly decrease of 6.47% in pedestrian-car deaths.
Bicycle-car collisions
The number of bicycles in the Netherlands has increased from around 500 000 sold yearly in 1960,to 850 000 in 1970 and to 1.2 million in 2003. Thus the decrease in bicycle-car fatalities is unlikely to bedue to any decrease in cycling. A more likely explanation is to be found in the increasing provision ofspecific bicycle infrastructure - including the separation of cyclists from faster and heavier cars andtrucks, as part of sustainable safe road design.
If the trends shown by these four crash types continue for another 10 years, the number of single-unit car fatalities will further outnumber fatalities from the other three crash types involving cars. It istherefore important to aim new traffic safety policies especially at single-vehicle crashes.

ANNEX B – TRENDS IN DIFFERENT CRASH TYPES FOR CANADA, THE NETHERLANDS AND NEW ZEALAND – 213
TOWARDS ZERO: AMBITIOUS ROAD SAFETY TARGETS AND THE SAFE SYSTEM APPROACH - ISBN 978-92-821-0195-7 © OECD/ITF, 2008
Analysis of slowly decreasing crash types
The other interesting group of crash types are those where there has been little or no improvementover time. This includes crashes with vans and with motorcycles.
Motorcycle crashes
Figure B.3 shows the association between motorcycle fatalities and motorcycle travel and sales.
Figure B.3. Number of motorcyclist fatalities (circles), compared to travel data (solid line, left) andsales data (dashed line, right)
Year
Motorcycles in The Netherlands
fatalities and sales
0
50
100
150
200
250
1950 1960 1970 1980 1990 2000
fata
litie
s
0
0,5
1
1,5
2
2,5
3
sale
s x
10,0
00
fatalities and mobility
0
50
100
150
200
250
1950 1960 1970 1980 1990 2000
fata
litie
s
0
0,5
1
1,5
2
mob
ility
[109
km
]
Source: SWOV.
The fluctuations in the number of motorcycle casualties in The Netherlands may be at least partlyattributed to fluctuations in sales. In periods when motorcycle sales increase, one can expect many newand inexperienced motorcyclists, who are arguably at greater crash risk (Paulozzi, 2005, using US data).As shown in Figure B.3, in these periods of increasing sales, fatalities (as well as hospitalisations)increase at broadly the same rate. An improved understanding of the association between motorcyclesales and fatalities is a logical early step in achieving ambitious safety targets relating to this road usergroup.
Van crashes
The possible association between collisions with vans and their use in traffic, is best demonstratedby comparing sales data with the numbers of hospitalised van drivers in single-unit collisions, as given inFigure B.4. (Fatality data were not used, given the very small numbers.)

214 – ANNEX B – TRENDS IN DIFFERENT CRASH TYPES FOR CANADA, THE NETHERLANDS AND NEW ZEALAND
TOWARDS ZERO: AMBITIOUS ROAD SAFETY TARGETS AND THE SAFE SYSTEM APPROACH - ISBN 978-92-821-0195-7 © OECD/ITF, 2008
Figure B.4. Hospitalised casualties in single-unit traffic crashes with a van and annual van salesThe Netherlands
Vans
0
50
100
150
200
250
1960 1965 1970 1975 1980 1985 1990 1995 2000 2005
year
fata
litie
s
0
20
40
60
80
100
120
sale
s, 1
03
hospitalized (single vehicle)sales
Source: SWOV.
The increase in the number of hospitalisations resulting from collisions with vans (in TheNetherlands a van is a vehicle meant for goods transport, up to 3 500 kg) also correlates closely withsales data. While it has not been scientifically established that any change in the number of fatalities orhospitalisations is related to changes in the number of inexperienced van drivers, there are some groundsfor expecting this relationship, given that inexperienced drivers generally have a higher risk thanexperienced drivers (e.g. Maycock and Lockwood, 1991).
B.4. Canada
Figure B.5. shows changes in the numbers of fatalities over the period 1984-2003 for each majorcrash type for Canada.

ANNEX B – TRENDS IN DIFFERENT CRASH TYPES FOR CANADA, THE NETHERLANDS AND NEW ZEALAND – 215
TOWARDS ZERO: AMBITIOUS ROAD SAFETY TARGETS AND THE SAFE SYSTEM APPROACH - ISBN 978-92-821-0195-7 © OECD/ITF, 2008
Figure B.5. Time series of traffic fatalities in relevant crash typesCanada
Source: SWOV.
Note: The tractor symbolises miscellaneous vehicles; traffic mode of fatality in rows. The colours indicate theproportion of all fatalities represented in that graph.
Presentation of the development of crash types
Figure B.5. shows that while some crash types decreased during the period, others remainedrelatively constant. For example, crashes involving heavy vehicles (vans or trucks) were largelyunchanged, while single vehicle crashes (the first column of Figure B.5.) showed hardly any decreaseafter 1995. The greatest improvements were for crashes involving passenger cars (pedestrian-car,bicycle-car, car-car), with motorcyclist fatalities also falling for much of the period.
The six crash types that contributed most to the total number of fatalities in Canada were singlevehicle car, car-car and pedestrian-car crashes (all decreasing) and car-LTV, car-truck and single vehicleLTV crashes (all decreasing but to a lesser extent). The figure shows that between 1990 and 2005, thefirst three crash types decreased by 3% to 5%, and the last three by 1% to 2.6%.

216 – ANNEX B – TRENDS IN DIFFERENT CRASH TYPES FOR CANADA, THE NETHERLANDS AND NEW ZEALAND
TOWARDS ZERO: AMBITIOUS ROAD SAFETY TARGETS AND THE SAFE SYSTEM APPROACH - ISBN 978-92-821-0195-7 © OECD/ITF, 2008
Figure B.6. Decreasing rates for fatalities in six important crash types, on a logarithmic scaleCanada
year
-3,3%
-5,1%
-3,7%
100
1000
1990 1995 2000 2005
fata
litie
s
car single vehiclecar carpedestrian car
-2,2%
-2,6%-1,1%
100
1000
1990 1995 2000 2005
car LTVcar truckLTV single veh icle
Source: SWOV.
In order to explain the different developments, the following questions were put:
• What happened to improve the safety of pedestrians (especially to protect them from crasheswith cars)?
• Why was there a decline in fatalities involving motorcycles?
• Why was there a decline in fatalities involving heavy transport vehicles?
Pedestrians
Figure B.7 shows the mean number of fatalities per year of age and per calendar year, amongpedestrians in four consecutive periods of five years.
The strong decrease in the number of fatalities among all pedestrians was not uniformly distributedacross the different ages nor across the total time span. Fatalities among 15-20 year olds have notchanged since 1989-1993, whereas there has been a strong and consistent decrease for 5-10 year oldpedestrians (around a 9.0% yearly decrease). Any decrease for 35-55 year olds has been negligible, witha more marked decrease for those aged 60 years and above. It would be important to know if theimprovement of safety for children is due to specific measures (perhaps improved safety measuresaround schools and in residential areas), which might not impact on adults who may be killed at otherlocations. Transport Canada suggests as a further possible explanation, an increase in the number ofchildren travelling by school bus.
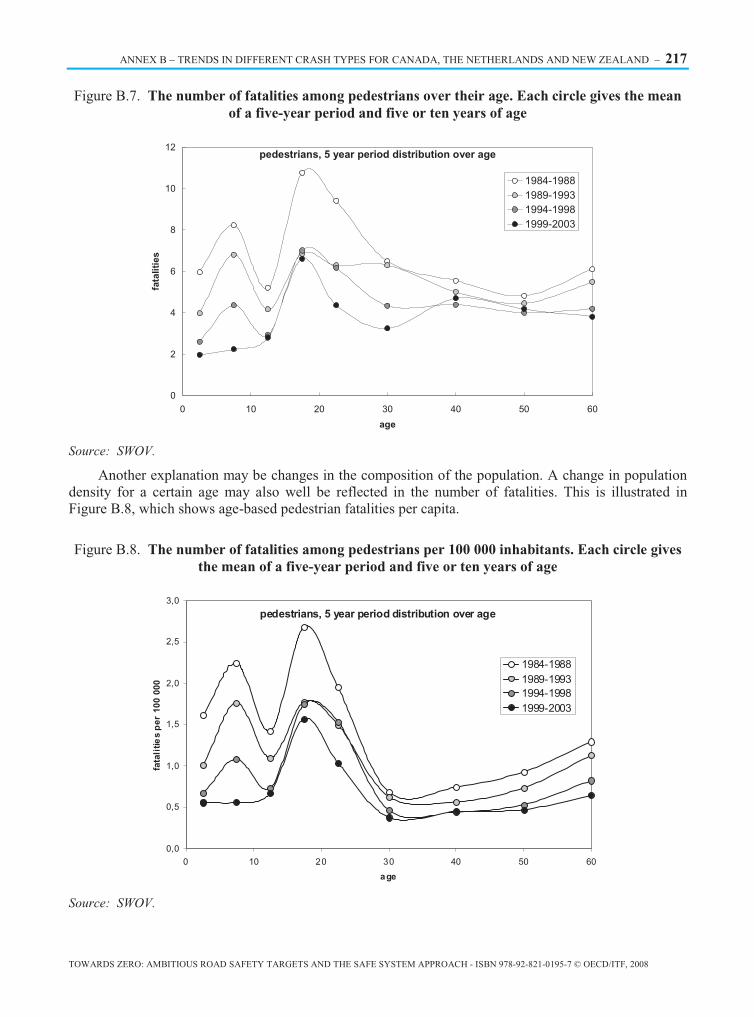
ANNEX B – TRENDS IN DIFFERENT CRASH TYPES FOR CANADA, THE NETHERLANDS AND NEW ZEALAND – 217
TOWARDS ZERO: AMBITIOUS ROAD SAFETY TARGETS AND THE SAFE SYSTEM APPROACH - ISBN 978-92-821-0195-7 © OECD/ITF, 2008
Figure B.7. The number of fatalities among pedestrians over their age. Each circle gives the meanof a five-year period and five or ten years of age
pedestrians, 5 year period distribution over age
0
2
4
6
8
10
12
0 10 20 30 40 50 60
age
fata
litie
s
1984-19881989-19931994-19981999-2003
Source: SWOV.
Another explanation may be changes in the composition of the population. A change in populationdensity for a certain age may also well be reflected in the number of fatalities. This is illustrated inFigure B.8, which shows age-based pedestrian fatalities per capita.
Figure B.8. The number of fatalities among pedestrians per 100 000 inhabitants. Each circle givesthe mean of a five-year period and five or ten years of age
pedestrians, 5 year period distribution over age
0,0
0,5
1,0
1,5
2,0
2,5
3,0
0 10 20 30 40 50 60
age
fata
litie
s p
er 1
00 0
00
1984-19881989-19931994-19981999-2003
Source: SWOV.

218 – ANNEX B – TRENDS IN DIFFERENT CRASH TYPES FOR CANADA, THE NETHERLANDS AND NEW ZEALAND
TOWARDS ZERO: AMBITIOUS ROAD SAFETY TARGETS AND THE SAFE SYSTEM APPROACH - ISBN 978-92-821-0195-7 © OECD/ITF, 2008
Figure B.8 shows that despite their increase in population numbers over this period, the per capitafatality rate for pedestrians aged 40 years and older decreased. The figure also shows that the rate ofpedestrian fatalities among children 5-10 has declined even when correcting for population changes,while the risk remains higher for the 15-20 age group – perhaps due to alcohol consumption and risk-taking. This age group, given its high per capita fatality rates, emerges as a priority for furtherinvestigation.
However there is the need to improve the safety of all pedestrians, not only those from specific agegroups. The extent to which the achievements made over the last 20 years will continue into the future,needs to be monitored.
Motorcycles
The overall decrease in the number of fatalities among motorcyclists can be partly explained bylooking at the number of motorcycles registered. Figure B.9 shows that both fatalities and registrationsdecreased between 1984 and 1997, and then both increased thereafter.
Figure B.9. Yearly number of fatalities among motorcyclists and numberof registered motorcycles (left axis)
motorcyclists
0
100
200
300
400
500
600
1980 1985 1990 1995 2000 2005year
Reg
istra
tions
[tho
usan
ds]
0
50
100
150
200
250
300
350
400
450
500
Fata
litie
s
fatalitiesregistrations
Source: SWOV.
Note: The solid lines are a guide to the eye only.
It is not possible to make a definite statement about travel by motorcycle over this period, as traveldata are only available from 1999 onwards.

ANNEX B – TRENDS IN DIFFERENT CRASH TYPES FOR CANADA, THE NETHERLANDS AND NEW ZEALAND – 219
TOWARDS ZERO: AMBITIOUS ROAD SAFETY TARGETS AND THE SAFE SYSTEM APPROACH - ISBN 978-92-821-0195-7 © OECD/ITF, 2008
Transport vehicles
Figure B.5. shows that there has been little change in the numbers of fatal crashes over the 20-yearperiod involving light trucks, vans (LTV’s) and heavy trucks – with the numbers of fatalities amongtruck occupants increasing in the last 10 years. This effect can partly be explained by the relatively strongincrease in commercial transport since 1990, both cross-border and domestic. This is shown inFigure B.10.
Figure B.10. Amount of commercial transport in Canada
transport
0
20
40
60
80
100
120
140
160
180
200
1986 1988 1990 1992 1994 1996 1998 2000 2002 2004
year
109 to
n km
DomesticInternationalTotal
Source: SWOV.
From the above analyses, it may be seen that some of the strongest safety improvements in Canadahave come from reductions in pedestrian-car crashes, especially involving child pedestrians. As theremaining pedestrian problems (for example, elderly pedestrians) have made little gain, it is importantthat new measures be developed. The same holds for the changes in the number of fatalities amongmotorised two-wheelers, which seems associated with extent of motorcycle use. Accordingly, if this useincreases, it is possible that the number of fatalities will rise in response.
B.5. New Zealand
Figure B.11 shows changes in the numbers of fatalities over the period 1984-2004 for each majorcrash type for New Zealand.

220 – ANNEX B – TRENDS IN DIFFERENT CRASH TYPES FOR CANADA, THE NETHERLANDS AND NEW ZEALAND
TOWARDS ZERO: AMBITIOUS ROAD SAFETY TARGETS AND THE SAFE SYSTEM APPROACH - ISBN 978-92-821-0195-7 © OECD/ITF, 2008
Figure B.11. Time series of traffic fatalities in crash types for New Zealand
Source: SWOV.
Note: Traffic mode of fatality in rows. The colours indicate the proportion of all fatalities represented in that graph.
Figure B.11 shows that the largest decreases in crash types were for pedestrian-car, bicycle-car,car-car and car-single vehicle crashes, with fatalities involving motorcycles also having decreased since1990. All other crashes were more or less constant over the time period – including car-truck crasheswhich accounted for a large number of fatalities. In combination the other constant crash types made asubstantial contribution to the total number of fatalities.
The four most important crash types in New Zealand were single vehicle car/van, pedestrian-car/van, car/van – car/van and car/van – truck crashes. (In New Zealand car and van are notdistinguished). In addition, all crashes involving motorcycles were important. Figure B.12 presents thedevelopment of these five crash categories, 1980-2004.

ANNEX B – TRENDS IN DIFFERENT CRASH TYPES FOR CANADA, THE NETHERLANDS AND NEW ZEALAND – 221
TOWARDS ZERO: AMBITIOUS ROAD SAFETY TARGETS AND THE SAFE SYSTEM APPROACH - ISBN 978-92-821-0195-7 © OECD/ITF, 2008
Figure B.12. The four most important crash types and the fatalities among motorcyclistsNew Zealand (since 1988)
car/van single vehicle -3,2%
car/van -car/van -2,1%
all motorcycle fatalities -10%
car/van - truck -2,0%
pedestrian - car/van -5,0%
10
100
1000
1985 1990 1995 2000 2005
num
ber
of f
atal
ities
single vehicle car&vancar/van - car/vancar/van - truckpedestrian - car.vanall motorcycle fatalities
Source: SWOV.
Note: On a logarithmic scale. The solid lines are exponential regression lines, with yearly decrease.
Figure B.12 shows the strong decrease in fatalities of motorcyclists (an average 10% yearlyreduction). While this decrease has contributed strongly to the decrease in fatalities in the past 15 years,it may not do so in the future as prevailing fatality levels lessen. Of the other four crash types in thefigure, pedestrian-car/van fatalities showed the greatest decrease. The other three crash types whileaccounting for high numbers of fatalities only had relatively small decreases (2% to 3% per year).
In order to understand the different developments, the following questions were explored:
• Why was there a steep decrease in the number in motorcycle fatalities?
• Why was there a major decrease in the number of single-car fatalities in 1998?
• Why was there a decrease in the number of fatalities among pedestrians and bicyclists?
Motorcycles
An enquiry sent to the New Zealand Land Transport Department suggested that an increase insecond-hand Japanese cars resulted in decreased motorcycle use (as reflected in motorcycleregistrations), as shown in Figure B.13.

222 – ANNEX B – TRENDS IN DIFFERENT CRASH TYPES FOR CANADA, THE NETHERLANDS AND NEW ZEALAND
TOWARDS ZERO: AMBITIOUS ROAD SAFETY TARGETS AND THE SAFE SYSTEM APPROACH - ISBN 978-92-821-0195-7 © OECD/ITF, 2008
Figure B.13. The number of registered cars (new and ex overseas, left axis),and the number of registered motorcycles (right axis)
New Zealand (between 1980 and 2005)
registration of new cars and motorcycles
0
20
40
60
80
100
120
140
160
180
1980 1985 1990 1995 2000 2005
year
num
ber
of c
ars
(103 )
0
5
10
15
20
25
30
35
40
num
ber
of m
otor
cycl
es (1
03 )
new carsEx-overseas carsmotorcycles
Source: SWOV.
The annual numbers of new vehicle registrations from 1980 onwards were separated into new andex-overseas cars. There was a strong increase in the registration levels for vehicles from overseas after1987, while the number of new registrations of motorcycles decreased sharply between 1987 and 1992.While these two trends do not do not prove causality, they are considered to provide a likely explanation.
Single-car fatalities
No explanation was found for the sustained decrease in the number of single vehicle fatalitiesbetween 1997 and 1998.
Bicyclist fatalities
Travel survey data from New Zealand shows that bicycle usage decreased by 20% between 1990and 1998, thus providing a possible explanation for the decrease in bicyclist fatalities. However the samedata show that pedestrian mobility increased by 4% in the same period, despite the decrease in pedestrianfatalities. It may be that both pedestrians and cyclists may have improved levels of safety because of the4% fall in free speeds in urban areas between 1996 and 2005. More information is required if furtherpossible explanations of the decreases are to be explored.
B.6. Discussion
Additional analyses of data to identify possible underlying trends and causes, can assist to predictfuture developments and to understand what can be done to achieve ambitious targets. The differentcrash types within each country considered in this chapter, have their own time-dependent behaviour.Although there has often been an overall tendency of decrease across the time span, both the magnitude

ANNEX B – TRENDS IN DIFFERENT CRASH TYPES FOR CANADA, THE NETHERLANDS AND NEW ZEALAND – 223
TOWARDS ZERO: AMBITIOUS ROAD SAFETY TARGETS AND THE SAFE SYSTEM APPROACH - ISBN 978-92-821-0195-7 © OECD/ITF, 2008
of the decrease and contribution to the total fatality toll have differed. When sophisticated statisticaltechniques are used to predict overall safety performance based on (a) total fatality trends and (b) thesum impact of the different fatality trends per individual crash type, there is invariably a sizeablediscrepancy between the two predictions. Accordingly it is recommended that any projection of thenumber of fatalities based on the sum of all fatalities (ignoring differences in the trends for crash types)be used with care. A projection is likely to give a better estimate of the future number of fatalities ifbased on the sum of the different trends for individual category types.
Additional data analyses also show that some safety improvements may stem from modal shifts. Forexample, in New Zealand the decline in fatalities arising from motorcycle crashes since 1990 seems to bedue to a shift from motorcycle use to passenger cars. This understanding of possible cause is important toavoid unjustified optimism based on an assumed decrease in risk factors and to avoid setting unrealisticreduction targets.
The difference between slowly decreasing and quickly decreasing crash types may also besignificant in setting targets. As an example, the yearly decrease of single-car collisions was much lowerthan that of car-car crashes, particularly in the Netherlands but also in the other countries. When crashtypes associated with many fatalities show only little improvement, further overall reductions willdepend heavily on the improvements for those crash types. Accordingly it is necessary to understand theobstacles threatening further reductions and to identify and implement means to reduce these key crashtypes.
Understanding the causes of quickly decreasing crash types is also important. The Canadian dataindicated that the strong improvement of pedestrian safety was largely due to improving the safety ofchildren, and less so to improving the safety of pedestrians in general. While the analyses in this reportdid not give a conclusive explanation, the reduction may have been due to changes in infrastructurearound schools and in means of transporting children. If so, this might indicate that any furtherimprovement of pedestrian safety will require a shift in attention to older pedestrians.
NOTES
1. This annex completes the information provided in Chapter 2.
2. However, crashes with more than one fatality are a minority (e.g. 10% in the Netherlands).
3. It is important to note that this approach can be extended to include non-fatal injury data – a practice thatwould be particularly valuable in better understanding those conflict types that rarely lead to fatalities: forexample, bicycle-single traffic mode. However for the purposes of this report, only fatal data have been used.
4. This was done by ordering the conflict types by the magnitude of their yearly decrease, and dividing theentire set into two groups of approximately the same size (based on the number of fatalities in the year2000). Given this procedure, slowly-decreasing crash types include some crash types where there is either nochange or an increase in frequency.

224 – ANNEX B – TRENDS IN DIFFERENT CRASH TYPES FOR CANADA, THE NETHERLANDS AND NEW ZEALAND
TOWARDS ZERO: AMBITIOUS ROAD SAFETY TARGETS AND THE SAFE SYSTEM APPROACH - ISBN 978-92-821-0195-7 © OECD/ITF, 2008
REFERENCES
Paulozzi, L.J. (2005), The role of sales of new motorcycles in a recent increase in motorcycle mortalityrates, Journal of safety Research 36 (2005) 361-364.
Maycock, G., and C.R. Lockwood (1991). The accident liability of British car drivers, Report 315, TRL,Crowthorne, England, p. 141-146.

ANNEX C – STEPS TOWARDS IMPLEMENTING A SAFE SYSTEM APPROACH – 225
TOWARDS ZERO: AMBITIOUS ROAD SAFETY TARGETS AND THE SAFE SYSTEM APPROACH - ISBN 978-92-821-0195-7 © OECD/ITF, 2008
ANNEX C. STEPS TOWARDS IMPLEMENTING A SAFE SYSTEM APPROACH
CHECK LIST OF POSSIBLE ACTIONS TOWARDS BUILDINGA SAFE SYSTEM APPROACH
Moving towards a safe system approach requires opportunities to be taken that not only improvethe immediate safety of the road transport system but build a long term, sustainable, path towards asafe road transport system. A series of actions are identified below that governments can take that areconsistent with that long term path.
1. Adopt the elimination of death and serious injury from use of the road transport system as thelevel of ambition for long term road safety achievement. While shorter term, intermediate, targetswill be required, the challenge this long term ambition will present to the full range of actors thatinfluence the safety of the road transport system is likely in itself to improve the quality of theinterventions that are developed and introduced over time.
2. Conduct a review of the road safety management systems and structures that are currently inplace. The World Bank Capacity Review Checklist that was discussed in Chapter 4, and isattached in Annex 3 is recommended. Such a review should address current capacity within thejurisdiction across the following three dimensions:
• Results.
• Interventions.
• Institutional management functions.
Particular attention should be given to assessing the adequacy of the institutional managementfunctions to create a vital results focus. The existence or development of this underpinning focusis necessary if sufficient quality interventions to meet the desired targets are to be developed andimplemented.
3. Address institutional management issues. Most attention is typically given to interventions, butthe full range of management functions need to be running effectively to support a results focus,and to support the development and implementation of high quality interventions. There is likelyto be value in either developing, amending, or reconfirming the approach to the followingmatters.
• Ensure a key agency decision making hierarchy and reference group arrangements are inplace.
• Clearly establish roles and accountabilities for agencies.
• Build capacity in the key agencies.
• Establish coordinated activity between agencies.
• Establish agreement on (desired) crash data system and agency access arrangements.
• Calculate and regularly review the annual socio- economic cost of road crashes.
• It is particularly important that a lead road safety agency is established on a “first amongequals’ basis to provide leadership and coordination in the development, implementation andmonitoring of road safety strategy.

226 – ANNEX C – STEPS TOWARDS IMPLEMENTING A SAFE SYSTEM APPROACH
TOWARDS ZERO: AMBITIOUS ROAD SAFETY TARGETS AND THE SAFE SYSTEM APPROACH - ISBN 978-92-821-0195-7 © OECD/ITF, 2008
4. Foster continuously increasing levels of knowledge within key agencies of good and emergingpractice in: safety treatments for roads; appropriate speed limits to achieve survivable crashoutcomes; road user compliance with rules addressing high risk behaviours; current and proposedactive and passive vehicle safety features and other innovative features. A completeunderstanding and uptake of a safe system approach will take some time once adopted, and willneed to be characterised in time by continuous improvement activity which examines innovativemeans to improve performance towards zero fatalities and disabling injuries.
5. Arrange for different agencies to lead in addressing different challenges. For example, a completerethink will be required within road authorities of existing policies, guidelines and standards, andthis is perhaps best illustrated in response to the threshold impact speeds for certain crash typesbeyond which fatal outcomes are likely, as addressed in Table 5.1. Road authorities that embracethe safe system approach will endorse the position that safe system outcomes will generally beachieved when applicable interventions combine to reduce impact speeds in these crash typesbelow the fatality threshold levels.
6. Ensure the move to a safe system approach is fully understood, embraced and actively advocatedby central and local government professionals, focussing on:
• The elimination of death and serious injury as the long term goal.
• The limits of the human body to survive various crash types at different impact speedswithout debilitating injury.
• The significant crash types and risks, their scale and distribution on the network, and theopportunities to reduce these risks.
• Developing system wide measures to lower the risk of these specific crash types and risks, byaddressing road and roadside condition, speed limits and speed enforcement, non–compliancewith road rules, consumer information on vehicle purchasing.
• The full range of coordinated actions that are required throughout the transport, health, police,and education sectors.
• The separate but mutually supportive responsibilities and accountabilities of system designersand road users.
• A full range of mechanisms to monitor and report on the performance of system designers.
7. Recognise that setting an ambitious target in an interim strategy period (for example, 10 years)on the path towards zero in the long term requires a strong management capacity to be applied tothe adopted safe system thinking and approach to drive development of innovative andcomprehensive potential interventions.
8. Plan for potential redesign of much of the existing road transport system over time to achievelowered risk over the whole system using innovative and emerging improvements in availableinterventions, to be applied together as appropriate. These interventions will have an eye to thelong term and will, wherever possible, be applied in concert to reduce the likelihood and outcomeseverity (to survivable levels) of crash risks for the major crash types or risks targeted, through:
• Improving the safety of roads and roadsides along higher risk lengths (including adjacent landuse, roadway access arrangements and roadside activity).
• Lowering speed limits, particularly along lengths where infrastructure safety improvementswill not be feasible (e.g. on lower volume rural routes) in the medium term and atintersections and in pedestrian areas. (i.e. dealing with deficiencies in the safety of the systemdesign). Assiduous enforcement will then be necessary.

ANNEX C – STEPS TOWARDS IMPLEMENTING A SAFE SYSTEM APPROACH – 227
TOWARDS ZERO: AMBITIOUS ROAD SAFETY TARGETS AND THE SAFE SYSTEM APPROACH - ISBN 978-92-821-0195-7 © OECD/ITF, 2008
• Encouraging early rollout by manufacturers of specific available (and foreshadowed) vehiclesafety features and planning in advance for supportive road infrastructure measures toimprove the effectiveness of these new technologies.
9. Legislative standards, the enforcement of these standards, and the interface of this enforcementwith the justice system need to be regularly reviewed to achieve very high levels of road usercompliance, taking into account:
• The need to improve safe behaviours ahead of the minimum standard currently required inlegislation, and then to assess opportunities to raise the minimum standard.
• The quantity and quality of traffic enforcement, including road users’ perception of the risk ofdetection and the targeting of enforcement resources to high risk behaviours on high risk partsof the road network.
• The extent to which judicial systems are supporting the safety directions being given to roadusers, and the value of increasing the imposition of administrative sanctions.
It is important to recognise in this area that vehicle based technologies have the potential tosubstantially assist achievement of high compliance rates into the future and to plan for andencourage their introduction.
10. Assess opportunities to improve road safety quality of controls over the entry to and exit from thesystem for drivers and for vehicles. A range of good practice initiatives is available to reducenovice driver crash risk (described as “graduated licensing systems”). Good practice for vehiclesafety development within a safe system context as discussed above is best demonstrated inSweden. Emergency medical systems should be reviewed for potential improvement.
11. Set effective road safety strategies and intermediate road safety targets using a comprehensiveprocess:
• Identify cost-effective strategy options and a time period that goes beyond the routinedecision making cycle – for example ten years.
• Model the estimated outcome targets that are achievable for the different strategy inputoptions.
• Conduct extensive dialogue with the public and stakeholders about the strategy options andthe relationship between the strategy options and the targets.
• Negotiate required medium term funding from government (and others), based on theeconomic merits of the programmes.
• Decide the package of measures and programs to be implemented as the substance of theadopted road safety strategy option and the associated reductions in fatalities and seriousinjuries to be achieved over the life of the strategy.
• Publicise the adopted road safety strategy and targets and seek community support.
12. Give considerable attention to the implementation, monitoring and review of road safetystrategies and targets. In particular:
• Take decisions on agency management roles and responsibilities for programmeimplementation.
• Prepare a full implementation plan based on good practice and research, including all aspectsof infrastructural and vehicle fleet improvements, user standards and enforcement.

228 – ANNEX C – STEPS TOWARDS IMPLEMENTING A SAFE SYSTEM APPROACH
TOWARDS ZERO: AMBITIOUS ROAD SAFETY TARGETS AND THE SAFE SYSTEM APPROACH - ISBN 978-92-821-0195-7 © OECD/ITF, 2008
• Plan and develop publicity materials and programs for implementing and promoting thestrategy.
• Establish a comprehensive set of performance indicators to monitor the effectiveness of thestrategy over time, both in terms of system user and system designer responsibilities.
• Develop research capacity and programs, and seek the active involvement of the researchcommunity in the ongoing public dialogue.
• Continue to encourage innovation in development of possible safe system measures and toinvolve the public in dialogue about these emerging opportunities and challenges.
• Regularly review progress against the agreed implementation plan and intermediateperformance indicators, and publish a summary of the results to indicate progress.
• Adjust implementation plans to meet issues arising and establish monitoring of systemdesigner performance and publish results at least annually.
13. Build upon the public awareness of safe system thinking to align long term elimination of roadtrauma with occupational safety, environmental, social responsibility and other values within asociety. Use this to encourage measures such as:
• Road safety compliance clauses in cartage and public transport contracts.
• Adoption of vehicle safety policies by government and corporate employers.
• Development of and active monitoring of compliance with vehicle advertising codes ofpractice.
• Legislative action to limit vehicle top speed and performance for use on public roads.
• Reduction in unchallenged media activity which supports irresponsible vehicle use –especially speed and performance.
• Road safety outcomes for the network as a result of new property developments which are atworst neutral.
• Many other, as yet unidentified, opportunities, including legislative action by governments.
14. Foster social norms which affirm that loss of life on the roads is unacceptable. Promote publicendorsement and understanding of the safe system approach, and the nature and interdependenceof the separate crash risks. It will take some time for effective communication to achieve thisunderstanding, but engaging with them on how these risks can be managed and a safer roadsystem achieved through challenging (medium and long term) action plans, and the differentresponsibilities of the road user and of the system designers is critical.

ANNEX D –DRAFT WORLD BANK COUNTRY CAPACITY CHECKLISTS – 229
TOWARDS ZERO: AMBITIOUS ROAD SAFETY TARGETS AND THE SAFE SYSTEM APPROACH - ISBN 978-92-821-0195-7 © OECD/ITF, 2008
ANNEX D. DRAFT WORLD BANK COUNTRY CAPACITY CHECKLISTS*
(i) Checklist 1: Results focus at system level
Questions Yes Partial Pending No
Are estimates of the social costs of crashes available?
Are data on road deaths and injuries readily available?
Have the risks faced by road users been identified?
• Drivers?• Passengers?• Motor cyclists?• Pedestrians?• Cyclists?• Children?• Others?
Has a national vision for improved road safety performance in the longer-term beenofficially set?
Have national and regional targets been set for improved safety performance?
• Social cost targets?• Final outcomes targets?• Intermediate outcomes targets?• Intervention output targets?• At risk group targets?• Industry targets?• Other targets?
Have all agencies responsible for improved safety performance been identified and arethey formally held to account for performance achieved to achieve the desired focus onresults?
• Highways?• Police?• Transport?• Planning?• Justice?• Health?• Education?• Others?
Have industry, community and business responsibilities for improved roads safetyperformance been clearly defined to achieve the desired focus on results?
Are regular performance reviews conducted to assess progress and make improvementsto achieve the desired focus on results?
Has a lead agency been formally established to direct the national road safety effort toachieve the desired focus on results?
Is the lead agency role defined in legislation and/or policy documents and annualperformance agreements to achieve the desired focus on results?

230 – ANNEX D –DRAFT WORLD BANK COUNTRY CAPACITY CHECKLISTS
TOWARDS ZERO: AMBITIOUS ROAD SAFETY TARGETS AND THE SAFE SYSTEM APPROACH - ISBN 978-92-821-0195-7 © OECD/ITF, 2008
(ii) Checklists 2 – 5: Results Focus at Intervention Level
Checklist 2: Planning, design, operation and use of the road network
Questions Yes Partial Pending NoHave comprehensive safety standards and rules and associated performance targetsbeen set for the planning, design, operation and use of roads to achieve the desiredfocus on results?
• National roads?• Regional roads?• Provincial roads?• City roads?
For each category of roads (national, regional, provincial, city) are complianceregimes in place to ensure adherence to specified safety standards and rules to achievethe desired focus on results?
• Road safety impact assessment?• Road safety audit?• Road safety inspection?• Black spot management?• Network safety management?• Speed management?• Alcohol management?• Safety belts management?• Helmets management?• Fatigue management?
Do the specified safety standards and rules and related compliance regimes clearlyaddress the safety priorities of high-risk road user groups to achieve the desired focuson results?
Do the specified safety standards and rules and related compliance regimes comparefavourably with international good practice?
Checklist 3: Entry and exit of vehicles to and from the road network
Questions Yes Partial Pending NoHave comprehensive safety standards and rules and associated performance targetsbeen set to govern the entry and exit of vehicles and related safety equipment to andfrom the road network to achieve the desired focus on results?
• Private vehicles?• Commercial vehicles?• Public transport vehicles?• Motor cycle helmets?• Cycle helmets?
For each category of vehicles and safety equipment (private, commercial, public,helmets) are compliance regimes in place to ensure adherence to the specified safetystandards and rules to achieve the desired focus on results?
• Vehicle certification?• Vehicle inspection?• Helmet certification?
Do the specified safety standards and rules and related compliance regimes and safetyrating surveys clearly address the safety priorities of high-risk road user groups toachieve the desired focus on results?
Do the specified safety standards and rules and related compliance regimes and safetyrating surveys compare favourably with international good practice?

ANNEX D –DRAFT WORLD BANK COUNTRY CAPACITY CHECKLISTS – 231
TOWARDS ZERO: AMBITIOUS ROAD SAFETY TARGETS AND THE SAFE SYSTEM APPROACH - ISBN 978-92-821-0195-7 © OECD/ITF, 2008
Checklist 4: Entry and exit of road users to and from the road network
Questions Yes Partial Pending NoHave comprehensive safety standards and rules and associated performance targetsbeen set to govern the entry and exit of road users to and from the road network toachieve the desired focus on results?
• Private drivers and passengers?o Cars?o Heavy vehicles?o Mopeds?o Motor cycles
• Commercial drivers?• Public transport drivers?
o Taxis?o Buses?o Non-motorised vehicles?
For each category of driver (private, commercial, public) are compliance regimes inplace to ensure adherence to the specified safety standards and rules to achieve thedesired focus on results?
• Driver testing?• Roadside checks?
Do the specified safety standards and rules and related compliance regimes clearlyaddress the safety priorities of high-risk road user groups to achieve the desired focuson results?
• Young drivers?• Older drivers?• Commercial drivers?• Public transport drivers?
Do the specified safety standards and rules and related compliance regimes comparefavourably with international good practice?
Checklist 5: Recovery and rehabilitation of crash victims from the road network
Questions Yes Partial Pending NoHave comprehensive safety standards and rules and associated performance targetsbeen set to govern the recovery and rehabilitation of crash victims from the roadnetwork to achieve the desired focus on results?
• Pre-hospital?• Hospital?• Long-term care?
For each category of post-crash service (pre-hospital, hospital, and long-term care) arecompliance regimes in place to ensure adherence to the specified safety standards andrules to achieve the desired focus on results?
Do the specified safety standards and rules and related compliance regimes clearlyaddress the safety priorities of high-risk road user groups to achieve the desired focuson results?Do the specified safety standards and rules and related compliance regimes comparefavourably with international good practice?

232 – ANNEX D –DRAFT WORLD BANK COUNTRY CAPACITY CHECKLISTS
TOWARDS ZERO: AMBITIOUS ROAD SAFETY TARGETS AND THE SAFE SYSTEM APPROACH - ISBN 978-92-821-0195-7 © OECD/ITF, 2008
(iii) Checklists 6 – 11: Results Focus at Institutional Management Function Level
Checklist 6: Coordination
Questions Yes Partial Pending NoAre interventions being coordinated horizontally across agencies to achieve thedesired focus on results?
Are interventions being coordinated vertically between national, regional, provincialand city agencies to achieve the desired focus on results?
Have robust intervention delivery partnerships between agencies, industry,communities and the business sector been established to achieve the desired focus onresults?Have Parliamentary committees and procedures supporting the coordination processbeen established to achieve the desired focus on results?
Checklist 7: Legislation
Questions Yes Partial Pending NoAre legislative instruments and procedures supporting interventions and institutionalmanagement functions sufficient to achieve the desired focus on results?
Are legislative instruments and procedures supporting interventions and institutionalmanagement functions regularly reviewed and reformed to achieve the desired focuson results?
Checklist 8: Funding and resource allocation
Questions Yes Partial Pending NoAre sustainable funding mechanisms supporting interventions and institutionalmanagement functions in place to achieve the desired focus on results?
• Central budget?• Road fund?• Fees?• Other sources?
Are formal resource allocation procedures supporting interventions and institutionalmanagement functions in place to achieve the desired focus on results?
• Cost effectiveness?• Cost benefit?
Is there an official value of statistical life and related value for injuries to guideresource allocation decisions?Are funding mechanisms and resource allocation procedures supporting interventionsand institutional management functions sufficient to achieve the desired focus onresults?
Checklist 9: Promotion
Questions Yes Partial Pending NoAre government, industry, community and business responsibilities for safety activelyand regularly promoted to achieve the desired focus on results?
• Communications objectives?• Target audiences?• Key messages?• Media?• Frequency and reach?

ANNEX D –DRAFT WORLD BANK COUNTRY CAPACITY CHECKLISTS – 233
TOWARDS ZERO: AMBITIOUS ROAD SAFETY TARGETS AND THE SAFE SYSTEM APPROACH - ISBN 978-92-821-0195-7 © OECD/ITF, 2008
Checklist 10: Monitoring and evaluation
Questions Yes Partial Pending NoFor each category of roads (national, regional, provincial, city) are sustainable systemsin place to collect and manage data on road crashes, fatality and injury outcomes, andall related road environment/vehicle/road user factors, to achieve the desired focus onresults?
For each category of roads (national, regional, provincial, city) are sustainable systemsin place to collect and manage data on road network traffic, vehicle speeds, safety beltand helmet wearing rates, to achieve the desired focus on results?
For each category of roads (national, regional, provincial, city) are regular safetyrating surveys undertaken to quality assure adherence to specified safety standards andrules, to achieve the desired focus on results?
• Risk ratings?• Road protection scores?
For each category of roads (national, regional, provincial, city) are systems in place tocollect and manage data on the output quantities of safety interventions implementedto achieve the desired focus on results?
• Safety engineering treatments?• Police operations?• Educational activities?• Promotional activities?• Driver training?• Vehicle testing?• Emergency medical services?
For each category of vehicles and safety equipment (private, commercial, public,helmets) are systematic and regular safety rating surveys undertaken to quality assureadherence to the specified safety standards and rules to achieve the desired focus onresults?
• Crash testing?• Helmet testing?
For each category of post-crash service (pre-hospital, hospital, long-term care) aresystematic and regular surveys undertaken to quality assure adherence to the specifiedstandards and rules to achieve the desired focus on result?
Are systems in place to monitor and evaluate safety performance against targetsregularly to achieve the desired focus on results?
Do all participating agencies and external partners and stakeholders have open accessto all data collected?

234 – ANNEX D –DRAFT WORLD BANK COUNTRY CAPACITY CHECKLISTS
TOWARDS ZERO: AMBITIOUS ROAD SAFETY TARGETS AND THE SAFE SYSTEM APPROACH - ISBN 978-92-821-0195-7 © OECD/ITF, 2008
Checklist 11: Research and development and knowledge transfer
Questions Yes Partial Pending NoHas a national road safety research and development strategy been established toachieve the desired focus on results?
• Vehicle factors?• Highway factors?• Human factors?• Institutional factors?• Other factors?
Has an independent national road safety research organization been established toachieve the desired focus on results?
• Vehicle factors?• Highway factors?• Human factors?• Institutional factors?• Other factors?
Have demonstration and pilot programs been conducted to achieve the desired focuson results?
• Vehicle factors?• Highway factors?• Human factors?• Institutional factors?• Other factors?
Are mechanisms and media in place to disseminate the findings of national road safetyresearch and development to achieve the desired focus on results?
• Conferences?• Seminars?• Training?• Journals?• Other?

ANNEX D –DRAFT WORLD BANK COUNTRY CAPACITY CHECKLISTS – 235
TOWARDS ZERO: AMBITIOUS ROAD SAFETY TARGETS AND THE SAFE SYSTEM APPROACH - ISBN 978-92-821-0195-7 © OECD/ITF, 2008
(iv) Checklist 12: Lead agency role and institutional management functions
Questions Yes Partial Pending NoDoes the lead agency (or de facto lead agency/agencies) effectively contribute to the‘results focus’ management function?
• Appraising current road safety performance through high-level strategicreview?
• Adopting a far-reaching road safety vision for the longer term?• Analysing what could be achieved in the shorter term?• Setting appropriate quantitative targets by mutual consent across the road
safety partnership and building an evidence-based strategy around thesedesired outcomes and outputs?
• Establishing mechanisms to ensure stakeholder accountability for results?Does the lead agency (or de facto lead agency/agencies) effectively contribute to the‘coordination’ management function?
• Horizontal coordination across central government?• Vertical coordination from central to regional and local levels of government?• Specific delivery partnerships between government, non government,
community and business at the central, regional and local levels?• Parliamentary relations?
Does the lead agency (or de facto lead agency/agencies) effectively contribute to the‘legislation’ management function?
• Reviewing legislative needs to achieve results in relation to other alternativesand carrying out impact assessments of costs and benefits?
• Consulting on and developing/updating enforceable standards and rules?• Consolidating key safety rules?• Finding legislative slots in Government and Parliamentary programs?
Does the lead agency (or de facto lead agency/agencies) effectively contribute to the‘funding and resource allocation’ management function?
• Securing access to sustainable, annual sources of road safety funding?• Establishing procedures to guide allocation of resources across safety
programs?Does the lead agency (or de facto lead agency/agencies) effectively contribute to the‘promotion’ management function?
• Promotion of a far-reaching road safety vision?• Championing and promotion at high level?• Multi-sectoral promotion of effective intervention?• Leading by example with in-house road safety policies?• Developing and supporting safety rating programs?• Carrying out national advertising?• Encouraging promotion at local level?
Does the lead agency (or de facto lead agency/agencies) effectively contribute to the‘monitoring and evaluation’ management function?
• Ensuring that appropriate data systems, linkages and management capacity areestablished to set and monitor targets and strategies?
• Transparent review of the national road safety strategy and its performance?• Making any necessary adjustments to ensure that results are achieved?
Does the lead agency (or de facto lead agency/agencies) effectively contribute to the‘research and development and knowledge transfer’ management function?
• Developing capacity for multi-disciplinary research and knowledge transfer?• Creating a national road safety research strategy and annual program?• Securing sources of sustainable funding for road safety research?• Training and professional exchange?• Establishing best practice guidelines?• Setting up demonstration projects?
* Bliss and Breen, 2008


APPENDIX – CONTRIBUTORS TO THE REPORT – 237
TOWARDS ZERO: AMBITIOUS ROAD SAFETY TARGETS AND THE SAFE SYSTEM APPROACH - ISBN 978-92-821-0195-7 © OECD/ITF, 2008
APPENDIX. CONTRIBUTORS TO THE REPORT
The report is the result of a three-year co-operative effort by an international group of safety expertsrepresenting 21 countries, as well as the World Bank, the World Health Organisation and the FIAFoundation. The Working Group was chaired by Mr Eric Howard and the work was co-ordinated by theSecretariat of the Joint Transport Research Centre. The report was drafted primarily by the ten membersof the editing group listed separately below.
WORKING GROUP MEMBERS
Chair Mr. Eric Howard (Australia)
Australia Mr. Iain CameronOffice of Road SafetyWestern Australia
Mr. Eric HowardVicroads
Mr. Ian JohnstonMUARC, Monash University
Mr. Jim LangfordMUARC, Monash University
Austria Mr. Thomas FesslKfV
Belgium Mr. Patric DerweduwenInstitut Belge pour la Sécurité Routière
Canada Mr. Marc GaudryUniversité de Montréal
Mr. Brian JonahTransport Canada
Czech Republic Mr. Jaroslav HeinrichCDV

238 – APPENDIX – CONTRIBUTORS TO THE REPORT
TOWARDS ZERO: AMBITIOUS ROAD SAFETY TARGETS AND THE SAFE SYSTEM APPROACH - ISBN 978-92-821-0195-7 © OECD/ITF, 2008
Denmark Mr. Hans LundDanish Road Directorate
Finland Mr. Matti RoineMinistry of Transport and Communications
France Mr. Benoît HironCERTU
Mr. Laurent RicciDRAST
Mr. Vincent SpenlehauerINRETS
Germany Mr. Rudolf KruppBASt
Mr. Heiko PetersBASt
Greece Mr. George KanellaidisNational Technical University of Athens
Hungary Mr. Péter HolloKTI
Japan Mr. Kunihiko OkaNational Institute for Land and Infrastructure Management
Mr. Takanobu MoriuchiDirectorate General for Policies on Cohesive Society
The Netherlands Mr. Rob MethorstAVV
Mr. Henk StipdonkSWOV
New Zealand Mr. Martin SmallMinistry of Transport
Norway Mr. Finn Harald AmundsenPublic Roads Administration
Mr. Richard MuskaugPublic Roads Administration

APPENDIX – CONTRIBUTORS TO THE REPORT – 239
TOWARDS ZERO: AMBITIOUS ROAD SAFETY TARGETS AND THE SAFE SYSTEM APPROACH - ISBN 978-92-821-0195-7 © OECD/ITF, 2008
Spain Ms. Candelaria Mederos-CruzDirección General de Tráfico
Mr. Juan Carlos González LuqueDirección General de Tráfico
Sweden Mr. Matts-Ake BelinMinistry of Industry, Employment and Communications
Ms. Asa ForsmanVTI
Mr. Hans-Eric PetterssonVTI
Mr. Björn StafbomMinistry of Industry, Employment and Communications
Switzerland Mr. Rolland AllenbachBfU
Ukraine Mr. Volodymyr AgeyevMinistry of Transport and Communications
Mr. Anatoliy RedziukMinistry of Transport and Communications
Mr. Anatoliy StoliarovMinistry of Transport and Communications
United Kingdom Ms. Kate McMahonDepartment for Transport
United States Ms. Jane DionNational Highway Traffic Safety Administration
Mr. Michael HalladayFederal Highway Administration
Ms. Rose McMurrayFederal Motor Carrier Safety Administration

240 – APPENDIX – CONTRIBUTORS TO THE REPORT
TOWARDS ZERO: AMBITIOUS ROAD SAFETY TARGETS AND THE SAFE SYSTEM APPROACH - ISBN 978-92-821-0195-7 © OECD/ITF, 2008
Word Bank Mr. Anthony Bliss
Ms. Jeanne Breene
World Health Organisation Ms. Margie Peden
Ms. Francesca Racioppi
FIA Foundation Ms. Rita Cuypers
Mr. David Ward
JTRC Secretariat Ms. Véronique Feypell-de La Beaumelle
Mr. Stephen Perkins
Mr. John White
EDITORIAL GROUP
The report was drafted primarily by members of the editing group:
Chair Mr. Eric Howard
Australia Mr. Iain Cameron, Office of Road Safety, Western Australia
Mr. Jim Langford, Monash University, Victoria
Mr. Martin Small, Department for Transport Energy andInfrastructure, South Australia
Canada Mr. Brian Jonah, Transport Canada
The Netherlands Mr. Henk Stipdonk, SWOV
United Kingdom Ms. Kate McMahon, Department for Transport
United States Ms. Rose McMurrayFederal Motor Carrier Safety Administration
World Bank Mr. Anthony Bliss
Ms. Jeanne Breen

APPENDIX – CONTRIBUTORS TO THE REPORT – 241
TOWARDS ZERO: AMBITIOUS ROAD SAFETY TARGETS AND THE SAFE SYSTEM APPROACH - ISBN 978-92-821-0195-7 © OECD/ITF, 2008
EXTERNAL REVIEW
The following individual experts accepted a request from the Editorial Group to act as ExternalReviewers of the draft Final Report. The Group is grateful for the improvements that resulted.
Mr. Claes Tingvall Swedish Road Administration
Mr. Fred Wegman SWOV, The Netherlands Institute for Road SafetyResearch

OECD PUBLICATIONS, 2, rue André-Pascal, 75775 PARIS CEDEX 16
PRINTED IN FRANCE
(77 2008 03 1 P) ISBN 978-92-821-0195-7 – No. 56249 2008
999-eng_ITF.fm Page 1 Wednesday, September 17, 2008 3:50 PM

Tr
an
sp
or
T
rE
sE
ar
CH
C
En
Tr
E
2008
TOWARDS ZEROAmbitious Road Safety Targets and the Safe System Approach
TOW
ARD
S ZERO: A
mbitious Road Safety Targets
and the Safe System A
pproach
-:HSTCSC=VUV^Z\:(77 2008 03 1 P1) ISBN 978-92-821-0195-7
TOWARDS ZEROAmbitious Road Safety Targets and the Safe System Approach
Each year around 1.2 million people are killed and 50 million are injured on roads around
the world. But crashes are largely preventable and much can be done to reduce the burden of
pain they cause and their economic impact.
Many countries have set targets to reduce the number of casualties on their roads.
Are these countries on track to meet their targets? What can be done in the immediate and longer
term to achieve these targets? Is there a limit to traditional approaches to road safety?
This report takes stock of recent developments and initiatives to meet increasingly ambitious
road safety targets. It highlights the management changes required in many countries to implement
effective interventions. It emphasises a strong focus on results and examines the economic case
for road safety investment. It challenges the better performing countries to do more
and strongly recommends the adoption of a Safe System approach with a long-term
vision of no fatalities on the roads.
The report constitutes a major international review of progress in developing safe system
approaches, now adopted in a small number of countries. The report should be useful
to transport administrations and to all stakeholders involved in improving road safety.
www.oecd.org/publishing
www.internationaltransportforum.org