towards wellbeing: monitoring poverty in kutai … rustam and imanuel; the data entry team,...
TRANSCRIPT

Review of poverty alleviation and its indicators of forest-dependent rural poor
Towards Wellbeing Monitoring Poverty in Kutai Barat, Indonesia
Christian Gönner Ade Cahyat Michaela Haug Godwin Limberg

Towards wellbeing: MoniToring poverTy in KuTai baraT, indonesia
Christian gönner, ade Cahyat, Michaela Haug and godwin limberg

© 2007 Center for International Forestry Research (CIFOR)
All rights reserved. No part of this publication may be reproduced, stored in a retrieval system, or transmitted, in any form or by any means (electronic, mechanical, photocopying, recording or otherwise) without the prior permission of the publishers. Proper citation is requested:
Gönner, C. et al.
A portrait of household wellbeing in Kutai Barat, 2003–2006/by Gönner, C., Cahyat, A., Haug, M. and Limberg, G. Bogor, Indonesia: Center for International Forestry Research (CIFOR), 2007.
ISBN: 978-979-1412-10-093p.
CABI thesaurus: 1. rural communities 2. households 3. poverty 4. wellbeing 5. decentralisation 6. local government 7. natural resources 8. East Kalimantan 9. Indonesia.
All photographs by C. Gönner, except where specified otherwise.
Published by Center for International Forestry ResearchMailing address: P.O. Box 6596 JKPWB, Jakarta 10065, IndonesiaOffice address: Jl. CIFOR, Situ Gede, Sindang Barang, Bogor Barat 16680, IndonesiaTel.: +62 (251) 622622; Fax +62 (251 62200Email: [email protected]: http://www.cifor.cgiar.org

iii
ConTenTs
Glossary and Abbreviations vAcknowledgements viiiExecutive Summary ixChapter 1. Introduction 1
The Problem of Poverty Assessment in Indonesia 1The CIFOR–BMZ Poverty and Decentralization Project 3
Chapter 2. A Brief Overview of Kutai Barat 5Ethnic Groups 5Decentralisation and Poverty Alleviation Policy in Kutai Barat 5Trends of Official Poverty Indices 9
Chapter 3. Poverty and Wellbeing: A New Concept 11Poverty or Wellbeing? 11Poverty is More Than Low Income 11Poverty and Wellbeing Have Many Dimensions 12Poverty is Dynamic 14Trade-offs Between Poverty Spheres 14
Chapter 4. Methods 15Institutional Arrangements 15Baseline Survey 15Development of the Poverty and Wellbeing Monitoring System 16Field Methods 16Calculating and Comparing Indices 17Using Landsat Imagery for Validating Household Data 17Workshops and Training 18Some Experiences from Working with the Local Government 18
Chapter 5. A Portrait of Household Wellbeing 19Wellbeing at the Household Level 19Distribution of Wellbeing 20Subjective Wellbeing 20

iv | Towards Wellbeing: Monitoring Poverty in Kutai Barat, Indonesia
Health and Nutrition 22Wealth 23Knowledge 25Natural Sphere 26Economic Sphere 29Social Sphere 32Political Sphere 33Infrastructure and Services 35
Chapter 6. Why Are Some People Poor in Kutai Barat? 43Some Correlations 43Which Factors Influence Household Wellbeing? 47
Chapter 7. What Has Been Done in Kutai Barat? 51Trends of Local Government Budget and Poverty-related Projects 51Have the Programmes Met Their Targets? 51What are the Impacts of Local Government Programmes on Household Wellbeing? 53
Chapter 8. Conclusions 55How Poor are Households in Kutai Barat? 55So Why are Some People Poor in Kutai Barat? A Summary 55What are the Poor’s Chances of Escaping Poverty in Kutai Barat? 56
Chapter 9. Recommendations 61Use NESP for More Effective Poverty Monitoring 61Improve Planning 62Improve the Enabling Environment 63Actions for the District Government 64
Endnotes 67References 71Annexes 73
Annex 1. Project Activities 75Annex 2. Questionnaire for Poverty and Wellbeing Monitoring 77Annex 3. Long List of Wellbeing Indicators 85Annex 4. Most Relevant Constraints to Rural Wellbeing 89Annex 5. Official Compensation Fees (Rp) for Selected Plant Species 90Annex 6. Poverty and Wellbeing Bar Diagrams of Subdistricts 91

v
glossary and abbreviaTions
Adat Customs, traditional law
Anon. Anonymous
ANOVA Analysis of Variance
ASEAN Association of Southeast Asian Nations
Askes Gakin Asuransi Kesehatan Keluarga Miskin (health insurance for poor families)
AUK Aneka Usaha Kehutanan (various forestry businesses)
Bappeda Badan Perencanaan dan Pembangunan Daerah (District Planning and Develop-ment Agency)
BBM Bahan Bakar Minyak (fuel)
BEAF Beratungsgruppe Entwicklungsorientierte Agrarforschung (Advisory Service on Agricultural Research for Development, Germany)
BKKBN Badan Koordinasi Keluarga Berencana Nasional (National Family Planning Coordi-nation Agency)
BKM Bantuan Khusus Murid (Special Assistance for Pupils)
BKPS-BBM Bantuan Kompensasi Pengurangan Subsidi-Bahan Bakar Minyak (Compensation aid for the reduction of fuel subsidies)
BMZ Bundesministerium für Wirtschaftliche Zusammenarbeit und Entwicklung (Federal Ministry for Economic Cooperation and Development, Germany)
BPK Badan Perwakilan Kampung (community councils)
BPS Badan Pusat Statistik (Central Statistics Agency)
BTL Bantuan Tunai Langsung (Direct Cash Support, part of BKPS-BBM)
Bupati District head
c. circa, about
cf. compare
CIFOR Center for International Forestry Research
Debt bounds Technical term for very tight supplier–buyer relations in which the buyer often pays the supplier in advance (generally in kind), which often leads to increasing debts
DPM Dinas Pemerdayaan Masyarakat (Community Empowerment Service)
DPRD Dewan Perwakilan Rakyat Daerah (district legislative assembly)
e.g. for example
etc. et cetera, and so on

vi | Towards Wellbeing: Monitoring Poverty in Kutai Barat, Indonesia
Gaharu Agarwood, eaglewood
Garis merah Critical height–weight ratio
GDP Gross Domestic Product
GI Gini Index
GSM Gerakan Sendawar Makmur (Prosperous Sendawar Movement)
GTZ Deutsche Gesellschaft für Technische Zusammenarbeit (German Agency for Techni-cal Cooperation)
Gotong-royong Collective action
Guguq Tautn High-ranking ritual of the Dayak Benuaq
HDI Human Development Index
HP Cellular (mobile) phone
HPH Hak Pengusahaan Hutan (Commercial Forestry Concession)
HPHH Hak Pemungutan Hasil Hutan (Forest Product Harvest Concession)
HPI Human Poverty Index
HRM Hutan Rakyat Murni (people’s true forest)
HRPK Hutan Rakyat Pola Kebun (people’s agroforest)
HT Walkie-talkie
i.e. that is
IMF International Monetary Fund
incl. including
IUPHHK Izin Usaha Pemanfaatan Hasil Hutan Kayu (Forest Timber Product Utilisation Per-mit)
Kabupaten District
Kaleng c. 11 kg (rice)
kCal kilo-calories (measure of energy)
Kecamatan Subdistrict
Kesejahteraan Prosperity
Kewenangan Authority, competence
kg kilogram(s)
KHM Kehutanan Masyarakat (a type of community forestry)
km kilometre(s)
KPK Komite Penanggulangan Kemiskinan (Poverty Alleviation Committee)
Krismon Financial crisis 1997–1998
Ladang Dry rice fields
LG Local Government
MoU Memorandum of Understanding
Musrenbangcam Musyawarah Perencanaan Pembangunan Kecamatan (annual planning session at subdistrict level)
Musrenbangdes Musyawarah Perencanaan Pembangunan Desa (annual planning session at the village level)
n sample size
neg. negative
NESP Nested Spheres of Poverty
NGO Nongovernmental organisation
No. Number
n.s. not (statistically) significant
NTFP non-timber forest product(s)
PAD Pendapatan Asal Daerah (regionally produced income)
Pembeliatn Shaman, traditional healer
Pemda Pemerintah Daerah (Local Government)

Glossary and Abbreviations | vii
Pemkab Pemerintah Kabupaten (District Government)
Perda Peraturan Daerah (Local Government Act)
Perkam Local regulations
PKPS-BBM Program Kompensasi Pengurangan Subsidi Bahan Bakar Minyak (Programme on Compensation for Reduced Petroleum Fuel Subsidies)
PLN Perusahaan Listrik Negara (National Electricity Company)
PRS(P) Poverty Reduction Strategy (Paper)
puskesmas Pusat Kesehatan Masyarakat (local health centre, small clinic)
Rapaq Swamp rice field
Raskin Beras Miskin (subsidised rice for the poor)
Reboisasi Reforestation
Reformasi Reform period following the downfall of former President Suharto
Rotan manau A large-diameter rattan species that grows with single stems
Rp Indonesian Rupiah
Rumah Sakit Hospital
Sawah Wet rice field
SD Sekolah Dasar (primary school)
Simpukng Mixed forest garden
SLTA Sekolah Lanjutan Tingkat Atas (junior high school)
SLTP(T) Sekolah Lanjutan Tingkat Pertama (Terbuka) ((open) junior secondary school)
SSB Single-side band (radio)
SUSENAS Survei Sosial Ekonomi Nasional (National Socioeconomic Survey)
SWB Subjective wellbeing
Swidden Slashed-and-burnt field
UN United Nations
UNDP United Nations Development Programme
Urusan Affair, matter; used in the context of ‘government affair’—an area in which the government intervenes or is otherwise involved
USD US Dollar
UU Undang-undang (Law (national level))
VCD Video CD
Wartel Commercial telecommunications centre

viii
This report is the result of close cooperation among the District Government of Kutai Barat, the CIFOR–BMZ Poverty and Decentralization Project and numerous enthusiastic persons from throughout the kabupaten. In particular, we want to thank Rama A. Asia, Encik Mugnidin, Silas Sinan, Fredrick Ellia, Yuvinus Nyintih, Fincen Allotodang and Asrani from Pemkab Kutai Barat; Subhan Noor, Sangga Sarira, Firdaus, Abimael, Elivianus, Edi Almudin, Erwin Dani, Eli Surario, Rudi Warjono and Jakaria from the monitoring team; the baseline survey team (2003), comprising Darius Dalip, Kukuh Tugiyono, Doni Tiaka, Brigita Edna, Maria Goretti Dau, Berry Iranon, Harifuddin, Muksin, Supiansyah and Yohanes; the assessors of the first trial (2004), comprising Erwin Dani, Mikael Meksis, Yosep Darius, Wehang and Benyamin; the assessors of the second trial (2005), comprising Y. Njuk Hanyeq, Mikael Deng, David Erison, Rusandi, Mikael Muis, Y. Silam Ajang, Arlis, Markus, Hang Huvang and Junaidi; the team of trainers, comprising Wilhelmus, Yansen Toding Datu, Tusin, Arminsyah Sumardi, Ham Wilhelmus, Ruth Aktalia,
Priyana, Rustam and Imanuel; the data entry team, comprising Istanto, Gung Usat, Ami Paramban, Nanda Pratama, Rikardo, Ahmad, Yosep Suparno, Yance, Edy, Victor Yosafat, Nuryani and Waina; as well as more than 200 community assessors of the official monitoring (2006). Brigita Edna, Cathrin Bullinger, Bison and Benyamin assisted the project in selected case studies; Lenny Christy assisted the project by analysing satellite imagery.
The GTZ project ProBangkit, including Roto Priyono, and GTZ’s chief technical advisor Manfred Poppe supported the project through excellent cooperation.
At CIFOR, we thank Rita Rahmawati, Dina Hubudin, Charlotte Soeria, Doris Capistrano, Sonya Dewi, Brian Belcher, Gideon Suharyanto, Atie Puntodewo and Christine Wulandari for technical support and fruitful discussions. We also thank consultant editor Guy Manners.
At BMZ/BEAF, we thank Stefan Krall, Michael Bosch and Iris Schubert for their great support and supervision.
aCKnowledgeMenTs

ix
exeCuTive suMMary
This report is based mainly on data assessed in a comprehensive wellbeing survey conducted jointly by the district government of Kutai Barat and the CIFOR–BMZ Poverty and Decentralization Project in early 2006. Some 50 poverty and wellbeing indicators were assessed covering more than 10,000 households in 222 of the 223 villages of the district. The results of this survey are presented together with the findings of additional case studies conducted under the project.
In contrast to a single poverty figure, the report examines multiple dimensions of poverty and wellbeing. Data are presented in tables and maps, providing a unique snapshot of the district’s current condition.Some findings of concern are:
On average, about one third of all households live in critical wellbeing conditions52.1% said that they live in povertyThe knowledge of 45.2% of the households is in critical conditionAlmost every fourth household suffers from poor access to healthcare and nutrition87% of all households have at least one out of eight wellbeing spheres (health, wealth, knowledge; natural, economic,
•
••
•
•
social and political environments; infrastructure-and-services) in critical condition, 62% have two and 42% threeAbout one third of all households live in a critical natural environment, often as a trade-off for unsustainable economic developmentDespite relatively high social cohesion, conflicts (often about access to and benefits from natural resources) are increasing at all levelsAlmost half of the households lack political empowerment and possibilities for participation in decision making.
These data are worrisome, but they are in line with older data collected in surveys by the former National Family Planning Coordination Agency (BKKBN), which reported a poverty rate for Kutai Barat close to 50%.
On the other hand:Basic infrastructure and government services are provided to most households—though with some limitations in remote areasEconomic opportunities are growing, especially close to the district’s centre, Sendawar, with almost 70% of people
•
•
•
•
•

x | Towards Wellbeing: Monitoring Poverty in Kutai Barat, Indonesia
living and working in moderate or good economic environmentsNew jobs were created by employing hundreds of civil servantsThe local government has started to fight poverty and improve wellbeing through many projects; despite the often negative reputation, many of these programmes are well targeted.75% of the households said that social cohesion in their community is strong.
Overall, decentralisation and the initiatives of the local government have had many positive impacts on household wellbeing. New economic opportunities have been generated and infrastructure and services improved in many areas. Despite the ubiquitous corruption, elite capture and rent seeking behaviour of individual officials and entrepreneurs, substantial economic benefits can be generated and retained in the district.
However, this progress has not reached everyone. In fact, official poverty data show a stagnation of poverty incidence at a higher level than before decentralisation. Some societal groups are especially marginalised, including people living in remote forested areas with poor access to markets and the district centre. Households headed by single mothers or widows, as well as households with disabled persons or orphans are significantly worse off than ‘regular’ households.
Although extended subsistence is still a widespread livelihood strategy, there is a visible shift towards more market dependency and reduced rice self-sufficiency. Natural resources are of significant importance, with rattan and fish as the most important sources of income, and more than 80% of all households regard forest game as important or very important for their own livelihoods. Forests often constitute invaluable economic safety nets, especially for vulnerable groups.
•
•
•
There are great differences in the forest dependency among the ethnic groups (with the Penihing, Seputan, Kayan and Bukat being the most forest-dependent groups). But ethnicity is not a direct differentiator of poverty. It is more the remoteness of some ethnic groups that contributes to their poverty, rather than their specific cultural traits.
Causes of poverty can be found at various levels. Some are located right at the household itself, like low school attendance or short-sighted expenditure of cash income. Others are more the responsibility of higher levels, such as inadequate health and education budgets or the lack of acknowledgement of traditional land and resource rights. In addition, there are poverty causes beyond the government’s direct control, such as natural calamities, macroeconomic events and the topography of the region.
The big exception of the rule that remoteness always leads to poverty is Hulu Riam, the area above the Mahakam rapids, where most wellbeing indices are almost as high as in the area close to Sendawar, mainly due to income from high-priced birds’ nests and gold. However, the area occasionally suffers from being cut off from the centre, especially when the upper Mahakam is not navigable due to too little or too much water.
In general, decentralisation has had its early winners and losers in Kutai Barat. It is the district government’s responsibility to minimise the environmental and social trade-offs and to achieve a more balanced and sustainable development of the district. So far, the economic growth has been largely based on the non-regenerative extraction of natural resources (timber, coal, gold, wildlife, etc.). It is the district government’s responsibility to minimise the environmental and social trade-offs and to achieve a more balanced and sustainable development of the district.

�
CHapTer 1inTroduCTion
The Problem of PoverTy AssessmenT in indonesiA
In August 2006, the President of Indonesia announced that poverty had been reduced from 23.4% in 1999 to 16% in 2006 (Anon. 2006a). This announcement came on the heels of a year of hardship with fuel price increases, which logically was felt to have increased poverty. The result was a re-emergence of the discussion of poverty figures and definition of poverty (Anon. 2006a, b, c; Khomsan 2006; Ivanovich 2006; Lesmana 2006; Sugema 2006). Confusion over poverty figures arises from the use of at least five parallel information systems for determining who is poor (see also Cahyat 2004).
1. BPS SUSENAS. The Central Statistics Agency (BPS) applies regionally determined poverty lines related to household consumption and conducts national socioeconomic surveys (SUSENAS) every 3 years at the provincial level. BPS assesses food and non-food consumption, which is then converted to a Rupiah value using standard prices. E.g. the poverty line in one district was equivalent to Rp 114,841 (USD 12.80) per capita per month for extreme poverty and
Rp 136,847 (USD 15.20) per capita per month for poverty. Samples are drawn randomly, but rarely cover isolated or distant parts of the district.
2. BKKBN surveys. The former Family Planning Agency (BKKBN) measured wellbeing/poverty in terms of a family’s basic needs such as clothing, housing and food consumption. Families were then differentiated into levels of prosperity, e.g. pre-prosperity, prosperity I, prosperity II. These surveys are not being conducted at this time.
3. Programme on Compensation for Reduced Petroleum Fuel Subsidies (PKPS-BBM). BPS identified poor households with input from village leaders and other existing data, and then surveyed tentatively poor households. The 2005 programme aimed to determine households eligible for direct cash subsides as compensation for increased fuel prices. Households were selected based on a poverty line of Rp 150,000 (USD 16.70) per capita per month and according to centrally determined criteria related to basic needs such as housing, water and food consumption. This poverty information is based on a one-time incidental survey.

� | Towards Wellbeing: Monitoring Poverty in Kutai Barat, Indonesia
4. UNDP Human Development Index (HDI) and Human Poverty Index (HPI). These indices are calculated from district data. Among other factors, they are used to calculate general fund allocations from Jakarta.
5. Self-sufficiency movements (GSM). The district of Kutai Barat defined villages as self-supporting, self-developing or self-sufficient/reliant, largely on the basis of village heads’ reports.
In all these assessments, poverty in remote areas is significantly underrepresented (Ediawan et al. 2005), resulting in policies that do not address the specific problems of poor people in remote areas—usually the people living in and around forests. Indeed, poverty in forest areas is almost invisible, since poverty alleviation is not considered the mandate of the forestry agencies.
With a less than clear definition of poverty, it is not surprising that the Indonesian Government’s efforts since the mid-1970s have been unsuccessful in eradicating poverty. Poor people remain highly vulnerable to changes in economic, social and political conditions and natural
disasters. Weaknesses have been: centralised policies, too much focus on charity, a focus on macroeconomic growth, an economy orientated viewpoint of poverty, positioning communities as objects, and assumptions that poverty problems and management are uniform throughout the country (KPK 2003).
The economic and political crisis of 1997–1999 further aggravated the situation. In 1998, the ratio of poor people in Indonesia rose to approximately 24.2% of the total population, compared to only 11.3% in 1996 (Figure 1).1 This sharp increase forced the Indonesian Government to drastically change economic policies and reform the governance systems towards decentralisation. With decentralisation, the authority—and also the responsibility—for poverty alleviation was handed over to the districts (kabupaten).
At the national level, succeeding presidents issued a series of poverty alleviation policies, which have now been coalesced into three types of policies shaping districts’ current interest in poverty: (1) the national drive to develop and implement a Poverty Reduction Strategy (PRS) as imposed
Figure 1. Percentage of poor people in Indonesia, 1976–2003. Source: BPS Jakarta (2004a, b).
0%
10%
20%
30%
40%
50%
1976 1978 1980 1981 1984 1987 1990 1993 1996 1998 1999 2000 2001 2002 2003
Year
Pove
rty
Rate

Introduction | �
by the IMF—among other things, the PRS established Poverty Alleviation Committees (KPK) responsible for creating poverty alleviation strategies at the district, provincial and national levels; (2) national assistance programmes intended to promote food security and reduce economic vulnerability—these provide important subsidies (e.g. for rice), relying on the district to distribute benefits fairly; in the forestry sector, the Forest and Land Rehabilitation Project (funded by National Reforestation Funds) subsidises individuals to plant trees; and (3) districts’ own interest in creating self-sufficient, prosperous villages to maintain the financial viability of the district.
At the regional level, districts initiated empowerment and prosperity movements,2 and community forestry programmes. These, however, are not necessarily targeted at specific groups of the poor, but rather are a drive for general economic development. But how can districts target the poor if they are not sure of who is poor and why they are poor? How can districts develop good policies where such confusion and lack of information exists, where information is
based on a mix of units (household, family and village) and criteria, and authority is spread over multiple agencies? How will districts implement their PRS in line with the provincial and national PRS as imposed by IMF?
For developing specific poverty reduction programmes, local governments need detailed information on the following five questions:1. Who are the poor?2. How poor are they?3. Where do they live?4. Why are they poor?5. What are the changes over time?
The Cifor–bmZ PoverTy And deCenTrAliZATion ProjeCT
The role of local government can only be expected to grow in coming years. Given the urgent problems and opportunities associated with strong local government, CIFOR and its partners started a project to provide tools to help local governments respond to their new roles in alleviating poverty and enhancing rural livelihoods.
Office complex of the District Government of Kutai Barat, Sendawar (Photo: M. Haug)

� | Towards Wellbeing: Monitoring Poverty in Kutai Barat, Indonesia
The CIFOR–BMZ project ‘Making local government more responsive to the poor: Developing indicators and tools to support sustainable livelihood development under decentralisation’ worked with local governments in forested areas of Indonesia (Kutai Barat and Malinau) and Bolivia (Pando) from 2003 until 2007. It applied a participatory learning approach for improving the understanding of trends in local poverty and wellbeing, and for developing local monitoring and planning tools to strengthen local governments’ poverty alleviation efforts. Selected tools have been published as a sourcebook for local governments (CIFOR 2007).
In Kutai Barat, the project assisted the district government in the development and implementation of a household monitoring system that is based on local indicators of poverty and wellbeing. In addition, detailed
studies of selected villages were conducted, as well as baseline surveys and numerous interviews. However, the heart of the research is the 2006 wellbeing survey that covered more than 10,000 households from 222 villages.3 All this information has been evaluated to create a portrait of household wellbeing in Kutai Barat at a time when the initial constraints of the newly formed district were overcome and the first results of the new policies became tangible.
In this report, we examine the poverty and wellbeing situation of households in the district in 2005–2006, and shed some light on the underlying causes of persisting poverty. In addition, the report also reflects on the process of this participatory learning project between CIFOR and the local government of Kutai Barat, and provides practical recommendations to make the local government more responsive to the poor.

�
CHapTer 2a brief overview of KuTai baraT
Kutai Barat is a district typical of many forested areas in the tropics. It is known for having ‘rich resources, but poor people’. With the formation of the new district, a semi-urban centre, Sendawar (comprising Melak and Barong Tongkok) has emerged with rapid economic and infrastructural development. Many new roads and bridges have been constructed, improving access throughout the areas close to Sendawar. On the other hand, the area above the Mahakam rapids (Hulu Riam4) is only accessible by subsidised planes and, depending on the water level, by longboats, while other areas (such as Bentian Besar and Long Hubung) are left without any subsidised access.
eThniC GrouPs
Kutai Barat is home to many ethnic groups (see Table 1), including Dayak, such as the Tunjung (Tonyoi), Benuaq, Bahau, Kenyah and Bentian, but also Malay-speaking groups like the Banjar (originally from South-Kalimantan), Kutai, and groups from other Indonesian islands, like Javanese, Bugis and Batak.
A rough distribution of groups is shown in Figure 3, where village majority groups are shown. Note that many villages host several ethnic groups.
deCenTrAlisATion And PoverTy AlleviATion PoliCy in KuTAi bArAT
Kutai Barat is a young district. It became an official kabupaten (district) in October 1999, when the former district of Kutai was split into three parts, Kutai Barat, Kutai Timur and Kutai Kartanegara.
For remote, previously isolated and forested districts like Kutai Barat, decentralisation brought new opportunities for self-driven development with significant potential gains. While previously, timber concessions were one of the major sources of development assistance, few services reached villages, and district residents were politically marginalised. Decentralisation also brought new levels of government accountability and new responsibilities for addressing local people’s needs.
With decentralisation:Local government (LG) became responsible for delivering public services, including the development of its own poverty alleviation strategyLG became responsible for managing its rich natural resources LG became responsible for creating local revenue Local revenue increased
•
•
•
•

� | Towards Wellbeing: Monitoring Poverty in Kutai Barat, Indonesia
LG (temporarily) gained authority to legislate at the district level and issue licenses (for mining and logging) Many new, often inexperienced staff were hired by LGLeadership changed from former elites (Javanese and Kutai) to new elites (now mainly Dayak Benuaq and Tunjung).
Under Kutai Barat’s first Bupati (head of district), Rama Asia, the district government tried to implement an integrated development approach, called Gerakan Sendawar Makmur (GSM).5
•
•
•
The approach had been developed by a team from Gadjah Mada University in Yogyakarta under the leadership of the late Professor Mubyarto (Mubyarto et al. 2003). The vision of GSM was a just society with increased wellbeing of its inhabitants to be achieved through empowering village autonomy and alleviating poverty through programme integration and synergy among stakeholders to focus more on poor villages, poor families and poor individuals.
In 2004, DPM—the coordinating agency for GSM (also hosting the secretariat of
Figure 2. Map of Kutai Barat. Source: Pemkab Kutai Barat, 2007.

A Brief Overview of Kutai Barat | �
box 1. Kutai barat at a glance
Official establishment of district October 1999Population 147,776 people Area 31,628 km2
Population density 4.67 people/km2
Population growth 2.2% p.a.(1995–2003)Number of subdistricts 21Number of villages 223Land status 70% of area is state forest land Literacy rate 93.2%Life expectancy 69.1 yearsMean years of schooling 7.3Adjusted real per capita expenditure per month
Rp 583,800 or USD 64.9*
Poverty (BPS) 12.2% (2002)Poverty (BKKBN) 48.6% (2001)Poverty (BTL) 39% (2005)Economy Swidden agriculture, forest use; timber, coal mining,
gold mining (closing), rubber, rattan, oil palms, livestock
GDP Rp 2.5 trillion or USD 278 million p.a. (half comes from the mining industry)
Annual district budget (2003) Rp 663.2 billion or USD 74 million
Source: CIFOR–BMZ Poverty and Decentralization Project 2006 (unpublished).* USD 1 = Rp 9000 (April 2006).
Figure 3. Map of ethnic groups in Kutai Barat. Note: Groups with fewer than 10 interviewed households per village are not shown.

� | Towards Wellbeing: Monitoring Poverty in Kutai Barat, Indonesia
the district’s poverty alleviation committee, KPK)—reported 194 projects that had been implemented or had started under GSM (174 run by the local government, 20 by NGOs), of which 163 had direct impacts on poverty alleviation.6 A preliminary analysis of some of these projects is given in Section 7.
The KPK is responsible for adjusting the national PRSP into a local poverty alleviation strategy. The cross-sectoral approach to reduce poverty is reflected in the KPK’s composition, though it is generally not supported by the highly sectoral bureaucracy of most government institutions. Despite its wider mandate, DPM is mainly considered as just another government sector, but one that lacks political weight and funding.7
The main planning of district development activities is done by Bappeda, the regional planning agency. Officially, villages can submit proposals to the subdistrict, where a subdistrict proposal is compiled. These proposals are then collected at the district level by the respective sector units. The sectors decide themselves whether to incorporate proposals from the subdistricts or not, and send their own list to Bappeda, where all proposals are evaluated. The final decision is then largely up to Bappeda, which is known as the ‘remover’ that rejects many proposed ideas with little explanation.
The principal administrative setup of the district’s planning cycle can be visualised as in Figure 4.
Since all proposals are treated in a sectoral way, cross-sectoral programmes, such
Figure 4. Simplified administrative setup in rural Kutai Barat.8
Table 1. Ethnic majority within households
Bahau 9.3% Bugis 3.2% Luangan 0.2%Bakumpai 1.7% Bukat 0.2% Penihing
(Aoheng)1.7%
Banjar 4.5% Jawa 10.7%Batak 0.2% Kayan 1.4% Seputan 0.6%Bentian 2.3% Kenyah 2.4% Tunjung
(Tonyoi)24.2%
Benuaq 19.9% Kutai 15.5%
as the PRSPs and GSM/KPK activities fall in-between sectors and are left with only marginal budgets. Hence, any local government programme that addresses poverty—and there are many (see Section 7)—has not been the result of strategic pro-poor planning, but of sectoral ‘business as usual’.
Another problem is that neither subdistricts nor villages or even sector units are assisted in the planning process. There are no official guidelines that set financial limits or priorities. As a result, many proposals are unrealistic and never get accepted. Villages are often left in limbo without any response, until they either request the same projects year after year or eventually give up. On the other hand, communities frequently receive projects they never asked for, including many inappropriate activities that do not reflect local demand (Andrianto et al. 2006).
CommunityCommunityCommunityCommunity
Planning &
Evaluation
Head of District District Assembly
District Technical Agencies
Subdistrict LeaderSubdistrict Leader

A Brief Overview of Kutai Barat | �
In general, current capacities and incentives to reduce poverty at the district level remain fragmented and inadequate. Weaknesses of poverty alleviation still include centralised policies (e.g. regarding poverty definition and alleviation programmes), a focus on charity and macroeconomic growth, an economy orientated viewpoint of poverty, positioning communities as objects, and assumptions that poverty problems and alleviation are uniform throughout the country (KPK 2003). Poverty indicators so far do not reflect local conditions and cultural patterns, but mainly consist of basic needs and financial aspects (Cahyat 2004). Little emphasis is given to the general natural, economic, social and political context that could enable people to escape chronic poverty.
Trends of offiCiAl PoverTy indiCes
In Indonesia, poverty is measured through at least five different methods (see ‘Introduction—The Problem of Poverty Assessment in Indonesia’). The result is a lack of consistency among official poverty data, even at the district level. For instance, while BPS data indicate a decline of poverty in East Kalimantan from 20.16% in 1999 to 12.2% in 2002 (with Kutai Barat being below the province level with 12.63% in 2000; BPS Jakarta 2004a, b), BKKBN data show a dramatic increase in poor households between 1998 and 1999 by more than 50%, followed by a slight recovery in Kutai Barat (see Figure 5). A survey to identify
households eligible for cash payment to compensate the reduced fuel subsidies (BTL) reported a poverty incidence of 39% for Kutai Barat in 2005.
This contradiction between BPS and BKKBN data was also found at the village level. None of the 10 villages ranked poorest by the two agencies was found in both top-10 lists of poor villages. Officials working for BPS and BKKBN also admitted great methodological and logistic problems that could have biased data. Hence, most probably none of the existing official data sets is reliable.9
The regional disparity of poverty within Kutai Barat is apparent from Figure 5.
Figure 5. Trend of poverty indices in three regions of Kutai Barat and Kutai Barat district. Source: BKKBN Kutai Barat, 1995–2002 (no data are
available after 2002).
0%
10%
20%
30%
40%
50%
60%
70%
80%
1997 1998 1999 2000 2001 2002
Pove
rty
Rate
Hulu RiamDataran TinggiDataran RendahKutai Barat


��
CHapTer 3poverTy and wellbeing: a new ConCepT
PoverTy or WellbeinG?
Understanding wellbeing and poverty is the first step to reducing poverty. Meaningful definitions are important in order to identify the causes of poverty, the objectives of poverty reduction, and the scope of what should be done.
Declining poverty means increasing wellbeing. Both terms are interwoven and look at the same problem from two different sides. A broad definition of poverty comes very close to ‘a lack of wellbeing’. So both terms are used in this report almost interchangeably. For instance, if people completely lack wellbeing, they are in poverty. On the other hand, if they are in a state of high wellbeing, their lives are characterised by prosperity, happiness and satisfaction.
Although this definition is not conventional, it is useful when combining different national concepts and helpful when assessing and analysing various dimensions of poverty. Furthermore, ‘poverty’ often has a negative connotation of passivity, incompetence or backwardness and the use of the term can be offensive or demeaning. The term ‘wellbeing’ allows discussion of poverty in more positive terms. Hence,
‘poverty’ should be read as ‘lack of wellbeing’ and ‘wellbeing’ as ‘reduced poverty’.
PoverTy is more ThAn loW inCome
For many years, being poor was defined as not having enough money. Many countries continue to measure poverty only in terms of income, consumption or access to services. Even today, one of the most well known poverty definitions is the poverty line of a minimum income of $1 per day. The World Bank continues to use this standard for its global comparison of poverty (World Bank 2000/01, 2002).
Of course, money is important. It is used to pay for food, medicine and education. But money alone is not sufficient. Families could have enough income relatively, but lack access to healthcare, clean drinking water or formal education. In other cases, a family may have little cash income, but meet all of its subsistence needs. Does this automatically mean that the family is poor?
Over the last two decades, poverty concepts have changed from the simple consideration of income or consumption
10

�� | Towards Wellbeing: Monitoring Poverty in Kutai Barat, Indonesia
to definitions that include multiple dimensions of deprivation and wellbeing. Today, despite the $1 index mentioned above, leading development organisations like the World Bank and UNDP also apply poverty definitions that comprise aspects like basic needs, self-determined lifestyles, choice, assets, capabilities, social inclusion, inequality, human rights, entitlement, vulnerability, empowerment and subjective wellbeing.11
PoverTy And WellbeinG hAve mAny dimensions
Poverty is a time-dependent condition. It can be temporary (acute or short-term poverty) or persistent (chronic poverty). It can be a permanent threat for those living just above the poverty line and it can be a trap for those who cannot get out of it.12 Poverty is a lack of many things. It may be caused by insufficient income, or unsatisfied basic needs, such as health, education or housing. But poverty is also highly subjective and may be caused by feelings of deprivation, vulnerability, exclusion, shame, pain, and other forms of ill-being.13 In addition, poverty is a result of a lack of means, capabilities, freedom and options for a better future.
Both unsatisfied basic needs and means to address this deprivation explain why poverty is often a self-reinforcing problem. We propose to use these two conditions
in a single concept of poverty. If there is no enabling environment for getting out of poverty, people get trapped in chronic poverty. Thus, poverty is not only ‘having no fish’, it is also ‘not knowing how to fish’, ‘not knowing where to fish’, ‘not having a net’ or ‘lacking the right to fish’. Plus, in many cases, there are ‘no fish’ because a lake has been polluted or has dried up. Ultimately, however, it is the subjective feeling of ‘being hungry because of not having eaten fish’ that is the very essence of poverty.
In order to capture all these notions and attributes of poverty, we conceptualised our poverty model in a nested shape (Figure 6). The centre is formed by subjective
box 2. who is officially poor?
At the global scale, the World Bank and the UN define extreme economic poverty as having an income of less than $1 per day in purchasing power parity. The Human Development Index (HDI) of UNDP (e.g. UNDP 2005) measures three fields: longevity, knowledge and decent standard of living. Longevity is measured by the percentage of people who die before age 40; knowledge is measured by adult literacy combined with the gross enrolment ratio for primary, secondary and tertiary schools; and standard of living is measured by real GDP per capita. The Human Poverty Index (HPI) uses the same fields, but measures standards of living in terms of access to safe water and healthcare, and by the percentage of underweight children younger than 5.
In Indonesia, including Kutai Barat, the poor are defined by poverty lines of 2100 kCal of daily food consumption (plus non-food consumption) equalling about Rp 136,000–150,000 of monthly per capita consumption (BPS). Wellbeing was defined by BKKBN using five ‘prosperity’ (kesejahteraan) strata using a basic needs approach (Cahyat 2004).
Figure 6. Nested spheres of poverty (NESP).
SWBWealthHealth
Knowledge
Natural
Sphere
EconomicSphere
SocialSphere Politi
cal
Sphere
Infrastructure
Services

Poverty and Wellbeing: A New Concept | ��
individual capabilities are aggregated into three categories: health, adequate wealth and knowledge (both formal and informal or traditional). The core is also what most local people in the Indonesia study expressed as the principal aspects of poverty. Together with subjective wellbeing, it is a good measure of the poverty or wellbeing of a household.
The context consists of five spheres. The natural sphere includes availability and quality of natural resources. The economic sphere covers economic opportunities and safety nets. Social capital and cohesion, but also trust and conflicts make up the social sphere. The political sphere comprises rights and participation or representation in decision making, empowerment and freedom. The outer layer of the NESP model is the fifth sphere, which influences the other four: infrastructure and services, often provided by government agencies, NGOs, development projects or the private sector. The context is the enabling environment for
Coal mining in former forest gardens.
wellbeing (SWB), surrounded by core aspects of poverty, including basic needs, and the contextual enabling environment that represents the means to escape from poverty.
Subjective wellbeing (SWB) is highly individual and emotional. It does not have a constant value, but varies with moods and circumstances. People compare their standard of living with that of others or with their own prior wellbeing. Personal feelings of happiness, safety, inclusion and contentedness also contribute to the overall subjective wellbeing. It also includes other forms of wellbeing like bodily wellbeing, social wellbeing, having self respect, and feeling safe and secure.
The core of the model includes ‘basic needs’, such as food, health, housing and education. It also comprises general individual capabilities (i.e. skills and physical condition) to get out of poverty. In the NESP model, basic needs and

�� | Towards Wellbeing: Monitoring Poverty in Kutai Barat, Indonesia
supporting self-driven attempts to escape poverty.
The categories presented in the NESP model are intentionally comprehensive. For any given setting, a local government may wish to define the spheres and their indicators according to their own priorities.
PoverTy is dynAmiC
The dynamics and causal links between the spheres of poverty is reflected by the different layers of the NESP model. Subjective wellbeing has a very momentary nature. It often fluctuates as it is influenced by so many thangs. But subjective wellbeing is also correlated with the combined core aspects. Hence, improvement of core wellbeing generally leads to improved subjective wellbeing. By the same token, low wellbeing in the core usually means low subjective wellbeing.
On a longer timescale, both core wellbeing and subjective wellbeing are influenced by the context. For instance, knowledge increases as a result of improved education, health problems grow because of environmental pollution, subjective wellbeing declines due to social conflict. Hence, there is a strong causal link from the outside towards the centre.
As we will show in Section 9, successful poverty reduction needs to address the dynamics of poverty. Sustaining wellbeing means creating opportunities and ‘freedom
for development’ (Sen 1999) for people, but it also means reducing vulnerability to avoid that people fall (back) into poverty and get chronically trapped.
TrAde-offs beTWeen PoverTy sPheres
In many cases, economic development is not sustainable and comes at the expense of the natural or social sphere. Such trade-offs become easily visible in the NESP representation and can optically alert decision makers. Figure 7 shows an illustrative example from a village in Kutai Barat where the positive economic sphere is accompanied by a critical natural sphere, critical health, wealth and subjective wellbeing.
Figure 7. Trade-offs among wellbeing spheres.
I & S
K
HW
PS
EN
SWB

��
CHapTer 4MeTHods
The project team applied a participatory learning approach in developing and implementing the wellbeing monitoring tool. The various steps of this approach, as well as the field methods used, are summarised here together with the main lessons learnt.
insTiTuTionAl ArrAnGemenTs
A special monitoring team was established at the beginning of the project, comprising five staff members of the local government and one representative of a local NGO. The monitoring team reported to the head of the community empowerment service (DPM), which also hosted a liaison person. Technical training, such as on statistics, various computer programs (SPSS, ArcView) and data assessment methods, was regularly provided or organised by CIFOR.
bAseline survey
Preliminary data were collected in a baseline survey in October 2003 that covered 20 poor villages.14 Besides the monitoring team, additional assessors were employed to collect the data. In order to allow data comparison, all six case study villages of the
box 3. Monitoring Team—lessons learnt
+ After some initial inertia, the monitoring team (mainly composed of young government officers) showed good motivation.
+ The team developed a good sense of group identity and mutual respect.
+ All members actively participated in the development of the wellbeing monitoring tool.
– Some well-trained team members were moved to new positions in the government.
– Some team members felt uneasy staying in villages for more than 2or 3 days.
– The analytical part of the monitoring tool was too complicated to be fully managed by the monitoring team alone.
box 4. baseline survey—lessons learnt
+ All assessors worked according to the guidelines presented in a training workshop.
+ No serious contradictions were discovered when cross-checking data against expert knowledge in selected communities.
– The timing was not optimal as many people worked on their rice fields in the forest.
– Some team members felt uneasy staying in villages for more than 2 or 3 days.
project were included in the survey. The results were compiled in a village profile book (Cahyat et al. 2005).

�� | Towards Wellbeing: Monitoring Poverty in Kutai Barat, Indonesia
develoPmenT of The PoverTy And WellbeinG moniTorinG sysTem
A number of information sources were used to identify the dimensions of poverty and wellbeing that were regarded as relevant in Kutai Barat:
Baseline survey dataPerceptions of local people on poverty and wellbeing (collected in the case study communities)Perceptions of government staff on poverty and wellbeing (collected during a workshop)Official poverty and wellbeing concepts used in Indonesia (e.g. BPS, BKKBN)Discussions held at the annual meetings of the project teams from Kutai Barat and MalinauDiscussions held within the monitoring team.
Long list of wellbeing indicatorsBased on the sources above, a long list of more than 100 possible wellbeing indicators was compiled and converted into a trial questionnaire.
First trialThe long list was tested in seven villages, of which three were also included in the baseline survey (for quality control reasons).
Reducing the number of indicatorsThe indicators of the long list were aggregated into the nine spheres of the NESP model. Then different combinations
••
•
•
•
•
of indicators were tested against the full set of indicators for each sphere. Those combinations that showed the highest correlation were selected as a representative subset, given that the selection also reflected the monitoring team’s understanding of wellbeing. By reducing the number of indicators in this manner, a short list of 33 indicators for wellbeing/poverty plus 21 indicators for assessing the performance of the local government were selected.
Second trialThe short list was tested in 11 new villages. This time, villagers were trained to conduct the assessment by themselves. In one case of inconsistent data the respective village was revisited for cross-checking.
field meThods
The core data used for this report were collected in February–March 2006 during the official poverty monitoring survey organised by DPM. A total of 10,431 households from all 21 subdistricts, covering 222 of 223 villages15 were assessed.
Households were sampled in the following way.
A census was conducted in villages with a maximum of 20 households. For villages with between 21 and 60 households, 20 households (i.e. 33–95%) were randomly selected. In villages with more than 60 households, all houses were mapped and every third household was selected (i.e. approximately 33%). Longhouse compartments and rented apartments were treated as separate households.
An adult member of each household was interviewed by a trained village assessor using a standardised closed questionnaire (see Annex 2).16
In-depth studies of selected communities were conducted by Michaela Haug (PhD student) and Cathrin Bullinger (MSc student). Ms Haug conducted research
box 5. development of the Monitoring system—lessons learnt
+ A suitable and locally meaningful set of indicators was found.
+ Input from many stakeholders and agencies was used.
+ The two trials helped eradicate several mistakes and flaws.
– The statistical tests for reducing the number of indicators had to be done by CIFOR.
– BPS could not be fully involved as it is not part of the local government (and budget).

Methods | ��
in three Benuaq communities (Engkuni – Pasek, Jontai and Muara Nayan) mainly focusing on perceptions and changes of wellbeing since the beginning of decentralisation (see Haug forthcoming). Ms Bullinger studied similar aspects in two Kutai villages (Jambuq and Jerang Melayu) in order to test the hypothesis that Kutai are marginalised in the new district of Kutai Barat (Bullinger 2006). In addition, Christian Gönner continued his long-term research of a Benuaq community (Lempunah), which began in 1988. All three researchers used structured questionnaires, key respondent interviews, focus group discussions, and participant observation as their main methods.
A policy analysis of the district’s poverty alleviation programme was conducted by Agus Andrianto in October 2004. Mr Andrianto interviewed 76 respondents, including 60 district government officials, in Kutai Barat and Malinau. He also analysed secondary data related to poverty and district government poverty management efforts, including district statistical data, regional regulations, district strategic plans, regional development programmes, district heads’ accountability reports, accountability and performance reports, government office reports, project reports, and output from other studies (Andrianto 2006).
Implementation problems of local government programmes were studied for Jempang subdistrict by Mr Benyamin, head of BPK Perigiq.
CAlCulATinG And ComPArinG indiCes
All indicators used in the household survey were based on a simple scoring system.
Poor/critical conditions (red colour, Figure 8) were given 1 point, intermediate conditions17 (yellow) were given 2 points, and prosperous/good conditions (green) were given 3 points. The score conditions were defined by the monitoring team according to local conventions. Nine indices were calculated based on the NESP model (see Section 3) for subjective wellbeing, health, wealth, knowledge, natural sphere, economic sphere, social sphere, political sphere, and infrastructure and services. The indices are normalised totals of the respective indicators of each sphere. The colour code used in the visualisation of the results is based on the 3 point score system described above.18
Statistical analysis was done in SPSS. For the sake of robustness, only non-parametric tests were used. Spearman’s Rank Correlation Test was used for analysing correlation; Mann–Whitney U-Test was used for comparing means of two independent samples (in lieu of t-test); Kruskal–Wallis Test was used for comparing means of k independent samples (in lieu of one-way ANOVA). Significance (*) was accepted for P < 0.05; high significance (**) was accepted for P < 0.01; very high significance (***) was accepted for P < 0.001.
usinG lAndsAT imAGery for vAlidATinG household dATA
In order to cross-check the information on the forest condition provided by households, satellite imagery (Landsat 7) covering 20 communities was analysed by measuring the ground cover ratio of the following categories: burnt vegetation/bare soil, bush, clearings (plantations), farmland, settlement, scrub/heavily fragmented forest, moderately fragmented forest, slightly fragmented forest and non-fragmented forest; cloud cover and water bodies were excluded. A simple weighting system was used to quantify the degree of forest disturbance:Settlement: weight 0Burnt vegetation/bare soil, grass, bush, Figure 8. Colour coding of indices
Critical
Intermediate
Good

�� | Towards Wellbeing: Monitoring Poverty in Kutai Barat, Indonesia
farmland, clearings (plantations): weight 1 Scrub, heavily fragmented forest: weight 2Moderately and slightly fragmented forest: weight 3Non-fragmented forest: weight 4
Remote sensing data and household information on forest condition from 15 communities were compared by using Spearman’s rank correlation test.
WorKshoPs And TrAininG
An initial workshop on perceptions of poverty and wellbeing was held with the district government in September 2003. Annual meetings between representatives of DPM and the monitoring team were held in March–April 2004, March 2005 and March 2006. These meetings were mainly used for reviewing project progress and refining the conceptual framework. A number of training workshops on monitoring and data analysis (SPSS) and data presentation (ArcView) were conducted for members of the monitoring team, for a team of trainers, as well as for additional government officials (Bappeda).
some exPerienCes from WorKinG WiTh The loCAl GovernmenT
In general, CIFOR enjoyed excellent working relations with all levels of the district government. The project was well received by the previous leadership back in 2003. The monitoring team was established with
great administrative support and comprised highly motivated people. Working with the monitoring team, and later also with the trainers (from NGOs), was very positive. Although the CIFOR team probably dominated the process in the beginning, discussions—especially during the training courses and the annual meetings—soon became more balanced, with substantial input from district government staff members and the monitoring team.
Obstacles that the project encountered were caused by the long delay of the budget transfer from central government to the district government. This delayed the official poverty and wellbeing monitoring by several months. However, thanks to the strong commitment of the district government, the survey was conducted and covered all villages of Kutai Barat.
Once the monitoring findings were analysed, the question was how to make best use of these comprehensive and detailed data. The presence of a new GTZ project (ProBangkit) offered an excellent opportunity to link the monitoring tool to the new planning approach supported by GTZ. Bappeda and GTZ kindly offered to host a liaison staff member of the project in the GTZ office. However, after a few successful weeks, GTZ had to stop its activities in Kutai Barat, which leaves a good opportunity unutilised.
The CIFOR–BMZ project hopes that the monitoring system will nonetheless be continued by the district, hopefully under the auspices of Bappeda.

��
The monitoring results based on the survey of all villages in early 2006 allows us to draw a snapshot portrait of Kutai Barat’s households, 5 years after decentralisation. The overall picture is mixed. Economic and political opportunities had emerged and were used, but at the same time the condition of the forest environment suffered from overly extractive resource use. Benefits were also not shared equally. While there was some prosperity close to the district centre, most aspects of wellbeing declined with increasing distance from that centre. The surprising exception, however, is Kutai Barat’s most remote area—Hulu Riam: with the exception of subjective wellbeing (happiness, felt prosperity and poverty), all other aspects scored almost as high as in areas close to Sendawar. This clearly contradicts the official (BKKBN) poverty data shown in Figure 5.
WellbeinG AT The household level
The latest BKKBN survey (BKKBN Kutai Barat 2002) calculated a poverty rate of 45.5% for Kutai Barat. This figure is close to the households’ own perception: in the wellbeing survey 2006, some 43.5% of the households scored critical values for
CHapTer 5a porTraiT of HouseHold wellbeing
subjective wellbeing, though this figure was probably biased by the payment scheme for compensating the reduced fuel subsidies (BKPS-BBM) that became an incentive for people to appear ‘poor’.
Table 2 summarises the percentages of households in critical, intermediate or good condition for all NESP spheres.
The high rate of poor knowledge (both, formal and informal) is worrisome, with 45.2% of all households finding themselves in critical condition. The high percentage (46.6%) of households in a critical political context (i.e. lack of political participation, lack of information and insecure property rights) is also a concern.19
Basic infrastructure and services were available to most households, which reflects
box 6. Household Composition
Male Female TotalChildren 0.91 0.84 1.75Adult 1.67 1.47 3.14Total 2.58 2.31 4.89
On average, one household comprised 1.39 core families.

�0 | Towards Wellbeing: Monitoring Poverty in Kutai Barat, Indonesia
the local government’s strong investment in this sphere.
Eighty-seven per cent of all households have at least one sphere (core and context, without SWB) in critical condition, 62% at least two, and 42% at least three (see Figure 9)!
also mean that half of the households score 1, while the other half score 0. A widely used method to examine the distribution of data is the Gini Index.21 Based on ten percentiles, the Gini Index (GI) is 39.3 for the core values of the 2006 monitoring data (n = 10,431 households), which is higher than the indices for Indonesia (GI = 34.3; World Bank 2006) and East Kalimantan (GI = 30.4; BPS Kutai Barat 2003a, b). This means that the disparity of wellbeing distribution is higher in Kutai Barat than the disparity of poverty distribution measured by BPS for the whole of Indonesia and East Kalimantan.
subjeCTive WellbeinG
Where is subjective wellbeing low? There are four main areas of poor subjective wellbeing: Bongan, Bentian Besar, Long Hubung and the subdistricts above the Mahakam rapids (Hulu Riam) (Figure 10). In the case of Bongan, Bentian Besar, Laham21 and Long Hubung, the situation is in general not good.
Why is subjective wellbeing low in these areas?The major reason for low SWB in these areas is probably remoteness and lack of access to markets, information and government services, but possibly also missing entertainment. The low SWB does
Table 2. Percentage of households in critical, intermediate and good condition by wellbeing sphere
Wellbeing sphere Critical Intermediate Good
SWB 43.5 27.5 29.0
Health 24.6 14.8 60.6
Wealth 36.4 20.7 42.9
Knowledge 45.2 25.6 29.2
Natural sphere 30.9 55.3 13.8
Economic sphere 30.4 14.4 55.2
Social sphere 14.3 10.7 75.0
Political sphere 46.4 34.6 19.0
Infrastructure and services 7.9 58.8 33.3
disTribuTion of WellbeinG
The average village values do not reveal the distribution or disparity of wellbeing. An average value of 0.5 could mean that all 50 households of a given village are in the same situation with a score of 0.5, but it could
Figure 9. Percentage of households with one or more wellbeing spheres in critical condition (SWB is not considered here).
0%
5%
10%
15%
20%
25%
0 1 2 3 4 5 6 7 8
Number of Critical Spheres
Perc
ent o
f Hou
seho
lds

A Portrait of Household Wellbeing | ��
Table 3. Household condition of subjective wellbeing
Condition Felt wellbeing Felt poverty Felt happiness
Good 20.6% 7.9% 35.9%
Intermediate 48.0% 40.0% 51.5%
Critical 31.3% 52.1% 12.6%
not necessarily correlate with a low overall poverty as shown by the case of Hulu Riam—in all other wellbeing spheres, this area scores much higher than most other areas.
What are the general trends?SWB has recently declined
While data from our baseline survey (2003) showed that in 20 selected poor villages, 20.1% of the households experienced an increased wellbeing compared to 18.1% who stated a decline of their wellbeing (61.1% said it did not change), more recent figures show a decline. This is probably influenced by a new ‘incentive’ to appear poor in
•
order to receive compensation payment for the abolished fuel subsidies (BKPS-BBM), but also by the end of the timber boom and the severe prosecution of illegal logging. Within-village material inequality has increased
In particular, the uneven distribution of fees and compensation payments widened the economic gap between well-off and poor households. In many cases this created envy and jealousy.Self-esteem of Dayak has increased
Due to their more prominent role in local governance, Dayak groups, which had been marginalised before decentralisation, now enjoy a much
•
•
Figure 10. Subjective wellbeing condition of all villages in Kutai Barat.

�� | Towards Wellbeing: Monitoring Poverty in Kutai Barat, Indonesia
higher esteem. By the same token, some Kutai people (the former elite of the old district) feel marginalised in some rural areas, as access to decision makers has become more difficult for them.22
heAlTh And nuTriTion
Where is health and nutrition critical?The health situation is not too bad. In most villages, people have moderate or even good access to public or traditional healthcare and clean water. However, more than a third of all households experience food shortage for more than one month a year.
Remote villages in particular, especially in Bentian Besar, are in critical condition. An important point to mention is that good access to healthcare does not automatically mean that the quality and medication is also good. This seems to vary from place to place.
Why is health critical in these areas?A major cause for low health and nutrition scores is occasional food shortage in some areas. More than one third of all households report food shortage of more than one month. This is probably caused by insufficient rice stocks, although most people could afford to buy subsidised rice. Food shortage, as well as low food quality
Table 4. Household condition of health and nutrition
Condition Food shortage† Access to clean water Access to healthcare
Good 65.3% 40.3% 45.2%
Intermediate — 36.8% 43.8%
Critical 34.7% 22.9% 11.0%
† Some of the variables (e.g. food shortage) only offer two answers (yes/no).
Figure 11. Health condition of all villages in Kutai Barat.

A Portrait of Household Wellbeing | ��
(not assessed here), results in other health problems especially for children.
Another serious problem is that more than 20% of all households have no access to clean drinking water. Water-borne diseases like diarrhoea therefore result. Poor water quality is caused in many areas by sanitation problems, pollution from mining (see below), pesticides and fertiliser (also used for fishing in some areas!), and siltation due to deforestation. In recent years, water availability has become an increasing problem, especially in semi-urban areas around Sendawar.
What are the general trends?Quality of drinking water is declining
Run-off water from newly constructed roads and logged over areas has led to local silting of rivers. Extreme fluctuations of river water level have left people with poor water quality over long periods, as low water volumes mean high concentrations of pathogens and pollutants. Close to mining sites (especially gold mining, both illegal and commercial), local rivers are partially or temporarily polluted by chemicals and heavy metals (mercury). Spill-off water from coal mines occasionally pollutes rivers like the Sungai Lawa. In some areas (e.g. Sungai Ohong in Jempang subdistrict), pesticides and poison (cyanide) are used for fishing and catching ducks and herons (see ‘Natural Sphere’ below).Public healthcare is slowly improving
The government has invested in new health centres and a new hospital, although this does not necessarily mean that there are always skilled staff and
•
•
medication available (see ‘Infrastructure and Services’ below). In fact, in many places, the new facilities are often left empty, as nurses or doctors are in Samarinda.The future of traditional healthcare is uncertain
Though young traditional healers (e.g. Pembeliatn) occur in some areas, many other places will soon face a shortage of these experts. Traditional knowledge regarding medicinal plants and other traditional healing is declining as it is not often appreciated by the younger generation.
WeAlTh
Where is wealth low?Like in most other spheres, Bongan, Bentian Besar, Laham and Long Hubung score very low for wealth. Wealth is also low in Siluq Ngurai and Muara Lawa, whereas material wealth is relatively high around Sendawar, where economic growth has been most tangible over recent years and hundreds of government employees who live there received motor cycles and decent houses. Also the Hulu Riam area shows a number of villages with substantial wealth, mainly due to relatively high income from birds’ nests and gold. However, the same area is also home to some of the poorest households in terms of wealth.
Why is wealth low in these areas?The reason for the low wealth in these areas is straightforward. Material wealth depends on financial income, and income sources are still limited in many places, especially in areas with weak infrastructure and poor
•
Table 5. Household condition of wealth
Condition Housing Motor bike/Motor boat† Satellite dish/Refrigerator†
Good 12.9% 66.6% 47.6%
Intermediate 57.2% — —
Critical 29.9% 33.4% 52.4%
† In the case of motor bikes/boats and satellite dish/refrigerator ‘good’ means that the household owns such an item, ‘critical’ means it does not own one.

�� | Towards Wellbeing: Monitoring Poverty in Kutai Barat, Indonesia
access to markets. In some places, electronic equipment (one of the indicators) does not make much sense as electricity is not (permanently) available, and income might have been invested in other less visible goods (e.g. gold, houses in Tenggarong or Samarinda).
What are the general trends?Access to goods has increased
Due to improved transportation infrastructure, access to goods has increased either by enabling people to access markets or by traders visiting villages (night markets and trucks).
•
Figure 12. Material wealth condition of all villages in Kutai Barat.
box 7. rattan, rubber and rice
Although farm-gate prices for rattan and rubber have increased, they have not ketp up with the general increase in living costs, e.g. the price for rice (Figure 13).
Figure 13. Price of rattan Sega (Calamus caesius) and rubber (semi-dried sheets) in comparison to rice (one village in Kecamatan Jempang). The red line (right axis) shows how
many kg of rice can be bought for 1 kg of rattan or rubber.
Rat
tan
Pric
e p
er k
g
200
400
600
800
1,000
Rp 1,200
1996 1998 2000 2002 2004 20060
2 kg
kg o
f Ric
e
1,000
2,000
3,000
4,000
5,000
Rp 6,000
1996 1998 2000 2002 2004 2006Rubb
er P
rice
per
kg
0
1
2
3 kg
kg o
f Ric
e

A Portrait of Household Wellbeing | ��
Expenses for goods have increased Some 68.5% of the interviewed
households stated that their daily expenditures had increased over the last 5 years. People spent more money on goods, including electronic equipment and motorbikes. This is due to the increased availability of cash and goods (through better market access, compensation fees and income from logging). However, living costs also increased, e.g. local prices for rice, cooking oil, sugar and cigarettes doubled in Kecamatan Jempang between 2000 and 2006, though commodity prices vary by up to 100% between Dataran Tinggi and Hulu Riam.
On the other hand, income from natural resources (e.g. rattan, rubber) has not increased proportionately.House building activities have increased
The increased cash income (compensation payments, fees, but also income from new jobs) was partially invested in new houses.
At subdistrict level, wealth is also strongly correlated with subjective wellbeing and health, although correlation with knowledge is only moderate.23 Hence, the materially better off also feel better and enjoy better health.
KnoWledGe
Where is knowledge low?Knowledge is generally in a moderate condition, although the typically poor areas (see above) are again in a critical situation. An interesting observation is the low scoring for fishermen’s households in the lake area, despite their relatively high ranking in other spheres. (See Figure 14.)
•
•
Why is knowledge low in these areas?The low knowledge scores in the typical poverty areas are explained by the same reasons that are responsible for the overall low ranking, i.e. remoteness and lack of economic opportunities. The latter leads to situations in which not all children can regularly attend school, as they often have to follow their parents into the rice fields or even contribute to household income. In villages near an oil palm plantation, it was observed that children stopped their school education so that they could work on the plantation.
The low knowledge score observed in fishermen’s households is probably caused by the involvement of (older) children in fishing and the often early marriages of girls in Bugis, Kutai and Banjarese households. In a similar vein, young men in Hulu Riam find little incentive in higher education compared to the direct income opportunities from guarding birds’ nest caves.
In general, it takes time for increased wealth to translate into better education, as the example of the relatively prosperous areas around Sendawar shows, where knowledge is not yet in good condition.
What are the general trends?Traditional knowledge is disappearing
Fewer young people are interested in studying traditional rituals (partially because these apprenticeships are very expensive, and young people have other priorities for spending money); knowledge about medicinal plants is being replaced by modern medication; traditional farming techniques are disappearing due to an increasing shift
•
Table 6. Household condition of knowledge
Condition Level of school education School enrolment Informal knowledge
Good 35.1% 52.6% 4.0%
Intermediate 23.7% 37.0% 22.6%
Critical 41.1% 10.4% 73.4%

�� | Towards Wellbeing: Monitoring Poverty in Kutai Barat, Indonesia
towards other occupations; knowledge about the forest and forest resources is vanishing as forests become more remote and people become less dependent on forest products.Literacy has increased
Increased literacy is partly the result of an increasing school enrolment due to the increased awareness of the importance of education among parents, but also to the demographic transition in which old illiterate people die. The recent removal of schooling fees for primary (SD) and secondary (SLTP) schools will further enhance literacy, as until recently (2003/04) the increased schooling costs were a major reason for unfinished formal education. In 27% of the households interviewed in 2003, at least one child had stopped school education. In more than 60% of these cases, the high costs associated with schooling were said to be the main reason for dropping out of school.
•
nATurAl sPhere
Where is the natural sphere in critical condition?The critical areas for the natural sphere are south and southwest of Lake Jempang, as well as around the district capital. Apparently, a few villages on the upper Mahakam (Long Hubung) are also in critical condition, while the largely intact areas are in Hulu Riam (Figure 15). This was also confirmed by analysis of Landsat satellite imagery. The comparison shows a moderate correlation between household data and remote sensing data, though the latter is biased against intact swamp areas.24
Why is the natural sphere critical in these areas?The low scores close to Lake Jempang are caused by large-scale forest conversion to oil palm and wood plantations, repeated forest fires and open pit coal mining. In other
Figure 14. Knowledge condition of all villages in Kutai Barat.

A Portrait of Household Wellbeing | ��
areas, logging operations and the general conversion of natural forests to semi-urban and agricultural landscapes are responsible for the critical condition of the natural environment. Forest fire and pollution caused by waste water, heavy metals (from gold mining in the upper Mahakam and Kelian River), pesticides and spill-off from mining areas are other factors threatening the quality of the environment.
What are the general trends?Quality of natural resources and environment is declining
The rapid deforestation (due to (illegal) logging, forest conversion and vegetation fires), pollution of rivers and lakes (by
•
pesticides, heavy metals, acidic waste water, cyanide and other chemicals), but also noise and siltation (affecting the Irrawaddy dolphin) have led to a severe decline in ecosystem quality. Sensitive animal species (e.g. hornbills, dolphins and orang utans) are suffering from these disturbances.25
Natural resources are being overexploited Many natural resources have been
extracted in a very short time and at very high intensity. This has led to the rapid decline of the respective resources (e.g. ironwood, orang utans, turtles, herons, storks and wandering whistling-ducks; see Box 8). The government’s reforestation programme has only been
•
Table 7. Condition of natural sphere
Condition Condition of environment Hornbills/Lesser Adjutant Water quality
Good 13.5% 69.8% 16.8%
Intermediate 15.6% — 63.1%
Critical 70.9% 30.2% 20.1%
Figure 15. Natural sphere condition of all villages in Kutai Barat.

�� | Towards Wellbeing: Monitoring Poverty in Kutai Barat, Indonesia
Shipping of coal: occasional accidents pollute the Mahakam and its tributaries.
box 8. poisoning ducks and Herons
In October 2004, fishermen poisoned hundreds of wandering whistling-ducks (Dendrocygna acuata) in Lake Jempang. They said they used herbicides to make the ducks ‘dizzy’. In a nearby village fishermen used cyanide for poisoning Javan pond-herons (Ardeola speciosa).
Fisherman with poisoned wandering whistling-ducks (left); fishermen laying out poisoned bait for Javan pond-herons (right).

A Portrait of Household Wellbeing | ��
partially successful. Some 12,500 ha have been officially ‘reforested’26 in 123 villages of 15 subdistricts. However, in many areas, a high percentage of the funds has been misused by project members and local counterparts.27 Natural resources have become more accessible
Accessibility has increased, both physically (through new roads) and institutionally (through more, though often only informally acknowledged use rights). However, as a direct consequence of the current strong anti illegal logging campaign and the stricter prosecution, most people have not dared to cut timber (even for local house construction) since early 2005.
•
eConomiC sPhere
Income sourcesThere is a relatively high diversity of income sources, including rattan, fishery, rubber and gaharu (agarwood, eaglewood), which rely on a healthy natural environment. The distribution of income sources differs among ethnic groups. Javanese transmigrants, for instance, depend far more on commercial agriculture than do the more forest-dependent Dayak groups. The low figure for timber is probably caused by the recent crackdown on illegal logging, though there might be some underreporting due to the legal prosecution of the mainly illegal logging activities.28
Table 8. Condition of economic sphere
Condition Number of income sources
Stability of income sources
Rice stock / ability to buy
Access to capital (loan)
Good 47.7% 59.6% 20.8% 61.3%
Intermediate — — 63.1% 16.9%
Critical 52.3% 40.4% 16.1% 21.8%
Figure 16. Economic sphere condition of all villages in Kutai Barat.

�0 | Towards Wellbeing: Monitoring Poverty in Kutai Barat, Indonesia
Where is the economic sphere in critical condition?Villages at the periphery, in some areas of the upper Mahakam, as well as a few fishing communities are in critical condition (Figure 16). Overall, the economic sphere is in relatively good condition, which is mainly due to relatively good access to (borrowed) capital. But more than half of all households have only one source of financial income (e.g. fishermen) and more than 40% do not regard their income source as stable (Table 8). At the household level, 26.2% are in critical condition with much higher figures in remote areas.
Why is the economic sphere critical in these areas?Remote areas often lack diverse income sources. An exception is Hulu Riam, where
various valuable forest products are collected (birds’ nests, gaharu) and gold is extracted from the rivers.
The low rating of fishing communities is caused by the fact that income is only generated from one source (i.e. fish), despite the fact that some of these villages are rather prosperous (see ‘Wealth’ above). The relevant point is that relying on one income source creates vulnerability. Fish resources can quickly decline due to droughts or pollution and, hence, leave fishermen in an insecure situation.
What are the general trends?Number of income sources has increased
Some 60.6% of the households interviewed in our baseline survey said that they had new income opportunities
•
Table 9. Relative importance of income sources†
Income source Percentage
Rattan 38.31
Fish (from rivers and lakes) 27.72
Family assistance 24.57
Agriculture (vegetable, coffee, livestock, aquaculture) 17.34
Rubber 16.27
Gaharu 11.20
Small shops/cafes 10.37
Handicraft 10.23
Birds’ nests 8.44
Other forest products 8.34
Timber fee 7.89
Services 7.89
Hunting 6.59
Other fees, compensation payment 6.11
Timber 5.16
Honorarium for village leaders 4.67
Salary (government service, private sector) 3.97
Trade 0.32
Other 11.00
† Measured in percentage of households who reported a particular income source as one of their three most important sources.

A Portrait of Household Wellbeing | ��
compared to 5 years ago. New jobs have been created through the formation of the new kabupaten (service jobs, construction jobs, government jobs), as well as through the visible economic growth in the district. In addition, plantation and mining companies have created new jobs or provided income through compensation payments, and fees are being paid by timber companies to local people. However, the often only temporary quality of these opportunities can be seen in the example of a large gold mine which was recently closed after more than 10 years of labour-intensive extraction. Hundreds of workers are
now jobless, although the company has provided training courses to increase their former employees’ chances for finding a new occupation.Desire for stable income sources has increased
In order to cope with uncertainty, there is a strong wish for stable income sources. This is also reflected by large numbers of people applying for government jobs (e.g. teachers) and the increased interest in establishing rubber gardens.Rice self sufficiency has declined
Between 1999 and 2003, at least29 67.5% of the households in 20 selected poor villages had a ladang dry rice
•
•
box 9. who benefits from forest fees?
The former HPHH regulation (1999–2002), as well as negotiations between illegally operating logging companies and villages, have brought far more money into the communities than decades of commercial HPH logging: 19.7% of all households interviewed received fees from HPHH (cf. 9.6 % from HPH). This has led to increased material wealth (mainly invested in televisions, VCD players and motorbikes), but it has also increased inequality and social conflict. Legal uncertainty has further contributed to conflicts within families, within villages, among villages, and between villages and companies. Revenues from logging are one of the largest regional contributions to the district’s budget. On the other hand, the decentralised (and often illegal) logging system has led to rapid deforestation throughout the kabupaten, leaving more and more villages with declining options for their own economic future.(Photo: M. Haug)
box 10. Creating options, removing options
The development of oil palm estates, which started several years before decentralisation, has had ambiguous impacts on rural wellbeing. On the one hand, it led to the creation of many new cash-oriented jobs (many of them for migrant workers from other parts of the country, such as Flores, Java and Sumatra), but on the other hand many other, often more sustainable development options, were destroyed.
In many cases, oil palms were not planted on wasteland, but on cultivated and thus productive land. Thousands of forest gardens (rattan, fruit trees, rubber) were burnt and converted (often against the will of their owners) to plantation land. So far, of the cleared land, only a part has been actually replanted with oil palms.
The outcome was severe conflict, first between villages and companies, but soon among villagers who benefited unequally from compensation and participation in the new projects. Future oil palm projects will certainly need a much more balanced and participatory approach.

�� | Towards Wellbeing: Monitoring Poverty in Kutai Barat, Indonesia
field, and 9.8% had a sawah or rapaq (swamp) wet rice field. The percentage of households with a ladang declined from 70.4 in 1999 to 65.5 in 2003, and approximately 75% of the households planted less than 3 Kaleng of rice (c. 33 kg equalling approximately 1–1.5 ha) on their field. Both factors underline the declining self sufficiency in Kutai Barat: 12.2% of households with a field suffered from a failed harvest, 36.1% had harvested enough rice for up to 6 months, 42.4% for 7–12 months and only 3.8% enough for more than a year. In general, there is a tendency to shift household activities towards more cash income activities and to buy additional rice.Dependency on markets has increased
The continuing shift from substance towards more market involvement has increased dependency on markets.Business environment is improving
The general business environment for investment (including foreign) is improving in Kutai Barat. Most likely, this will attract possible investors from other ASEAN countries, such as Malaysia and The Philippines. While new investment will create new jobs, the local government has to take care that this development does not deprive the rural population of other, often more sustainable income options.Number of micro-credit unions has increased
Since decentralisation started, the district government has initiated micro-credit units in several kecamatan. In addition, NGOs and religious organisations have created a number of similar institutions. Hence, more than 60% of the households have good access to borrowed capital.Financial income is lost due to corruption
People have to pay more for formerly free services (e.g. to police officers). In addition, there is widespread anecdotal evidence that substantial parts of government project budgets are diverted from the projects to personal benefits of project leaders, contractors and government officials. On the other
•
•
•
•
hand, 24% of the people interviewed said that they receive family assistance, which might partly also come from corruption, and thus constitutes some sort of financial redistribution.
soCiAl sPhere
Where is the social sphere in critical condition?Overall, the social sphere is in rather good condition with relatively high social cohesion, especially within extended families. There are only a few critical villages, mainly located at the periphery of the district (Figure 17).
Why is the social sphere critical in these areas?The few critical villages are caused by intracommunity conflicts, mainly about access to natural resources (e.g. birds’ nests) and the distribution of (logging) fees and compensation payment. However, increasing pressure on natural resources, including some which previously had no market (such as water and sand), might result in more social conflicts.
What are the general trends?Conflicts over natural resources have increased
Conflicts have occurred over resources that used to be openly accessible as common property, but have now become commodities (e.g. sand for construction). In addition, conflicts have been caused by the uneven distribution of compensation or fee payments. These disputes are found at all levels, within families, within communities, between communities and companies, and between communities. Wealth and the social sphere are positively correlated at the subdistrict level: social cohesion is higher in wealthier subdistricts than in materially poorer ones. On the other hand, the social sphere and the natural sphere are negatively correlated at subdistrict level: the more degraded the natural environment the lower the
•

A Portrait of Household Wellbeing | ��
score of the social sphere.30 As many of the resource-related conflicts occur in areas with critical natural sphere (caused by logging, plantations or mining) both findings make sense. Collective action for common and economic activities is declining
While there is a high level of help in emergency cases (95% reported that they get help from relatives and neighbours), it is increasingly difficult to organise unpaid collective action. Only 10% of 175 respondents in 7 villages stated that the level of gotong-royong (collective action) was high (32% said it was low and 58% said it was intermediate).
•
PoliTiCAl sPhere
Where is the political sphere in critical condition?In contrast to most other aspects, the political sphere was most critical in villages close to Sendawar; it is also low in some remote villages (Figure 18).
Why is the political sphere critical in these areas?The explanation for the low scores near the district’s centre is probably that these villages are relatively large compared to remote communities. Therefore, a smaller proportion of villagers is involved in
Table 10. Condition of social sphere
Condition Mutual help Trust Conflict
Good 11.2% 8.7% 89.3%
Intermediate 74.2% 79.4% —
Critical 14.6% 11.9% 10.6%
Figure 17. Social sphere condition of all villages in Kutai Barat

�� | Towards Wellbeing: Monitoring Poverty in Kutai Barat, Indonesia
Table 11. Condition of political sphere
Condition Resource rights Information Participation
Good 16.3% 6.2% 13.7%
Intermediate 71.6% 64.7% 49.8%
Critical 12.1% 29.1% 36.5%
Figure 18. Political sphere condition of all villages in Kutai Barat.
decision making, which results in lower scores. In addition, people in remote areas often need to organise life on their own without too much external support.
Another reason for low scores in the political sphere is that community leaders are often involved in small government projects (e.g. road and bridge construction, reforestation31), from which they can seek rents. So leaders are not always interested in increasing transparency in their communities. On the other hand, the public is getting more and more informed due to better access to information and their knowledge of the law.
What are the general trends?Self-determination has increased
Self-determination has increased at •
different levels from the kabupaten itself (with substantial autonomy regarding its budget and development programmes) down to the communities. At the local level, resource rights are de facto more acknowledged than before decentralisation, and village councils (BPK) have been created as new legislative institutions, although their mandate has been restricted by the new Law No. 32 (2004), which withdraws BPK’s control over the village head.Relations with local government have improved
People in the 20 baseline villages stated that, in general, the commitment, information policy and services of the local government had become better. Access to local government had also improved, both physically—through
•

A Portrait of Household Wellbeing | ��
the more central location of the new capital Sendawar, new and better roads and other transportation means (speedboats, planes)—and personally, as more local people are now members of the local government or at least linked to it through social networks. However, some areas (such as Hulu Riam or areas close to Kutai Kartanegara and Central Kalimantan) have not benefited equally from this development due to their remoteness and difficult access (see below). Trust in the local government is further threatened by persistent corruption at all levels.Dayak groups are better represented
Since decentralisation, the influence and representation of the various Dayak groups (mainly Benuaq, Tunjung and Bahau) has substantially increased and led them out of the previous political marginalisation. At the same time, the political influence and representation of the Kutai (as the former elite) has slightly declined, although some key positions are held by Kutai.32
Uncertainty about land rights persists Despite the improved informal
acknowledgement of traditional resource and land rights, a high level of uncertainty persists. Traditional rights are not yet officially acknowledged and the continuing struggle between central and local government leave local people without clear prospects. This uncertainty is another strong driver of unsustainable resource use.
infrAsTruCTure And serviCes
Where is the infrastructure and services sphere in critical condition?
The infrastructure and services sphere is most critical in Kutai Barat’s remotest areas, as well as in the region around Long Hubung and Laham (Figure 19). The region close to Sendawar has benefited a lot over recent years. Communication facilities and especially training are, however, in critical condition.
•
•
Why is the infrastructure and services sphere critical in these areas?Poor access from the centre and expensive transportation within and to areas like Long Apari and Bentian Besar make the provision of government services difficult and costly. The rugged terrain, heavy rainfall and unstable soils are constraints to road construction. In addition, few government employees want to live and work in remote areas. All these contribute to the difficulties that some areas experience.
On the other hand, the local government tries to compensate for these problems by subsidising air transport. Additional support is provided by nongovernmental and religious organisations.
What are the general trends?Number of education facilities has increased
The total number of governmental schools has slightly increased from 264 in 1999 to 287 in 2004; although there was some decline in SLTP schools after 2000 (Table 13).33 However, like in many other government programmes, the implementation of the construction works frequently violated the specifications and clearly a large amount of the allocated budget was misused. In some areas, open junior secondary schools (SLTPT) and private junior high schools (SLTA) were opened.35 Branch schools of universities and new private universities started mushrooming. However, due to the often unclear legal status of these schools and their debatable quality, some of them were recently closed again.Maintenance of education facilities has declined
Although some schools are supported by the private sector (e.g. in Belusuh by a coal mining company), others lack the funds for regular maintenance. More teachers have been employed
More teachers have been employed (316 contract teachers in 2003), mainly on an honorary basis. Between 1999 and
•
•
•

�� | Towards Wellbeing: Monitoring Poverty in Kutai Barat, Indonesia
Table 12. Condition of infrastructure and services sphere
Condition Critical Intermediate Good
Access to education facility 6.9% 48.0% 45.1%
Teaching quality 4.8% 58.5% 36.7%
Access to health facility 3.8% 44.5% 51.7%
Quality of healthcare 3.1% 60.1% 36.8%
Training 84.9% — 15.1%
Road/bridge access 14.7% 55.7% 29.7%
Market access 8.3% 47.6% 44.1%
Communication facilities 34.3% 44.2% 21.5%
Figure 19. Infrastructure and services sphere condition of all villages in Kutai Barat
2003, the total number of teachers (SD, SLTP, SLTA) in Kutai Barat increased by 26.6%. However, villages in remote areas still lack sufficient education staff as honoraries do not fully compensate for the shortcomings related to working in a remote place. The recent establishment of decentralised teacher seminars (e.g. in Tanjung Isuy, Kecamatan Jempang) are a promising way to cope with the lack of teachers in some areas.
Some new health facilities have been established
Some old and dilapidated primary health centres have been rehabilitated and equipped (e.g. in Kecamatan Jempang), and a new clinic has been built in Sendawar. However, many remote areas are still left without appropriate health facilities. Overall, the total number of health facilities almost stagnated (see Table 13).
•

A Portrait of Household Wellbeing | ��
Health services have been improved Local government, private sector and
NGOs have all contributed to improved health services. Foundations like Yayasan Anum Lio (formerly Rio Tinto) are engaged in health campaigns. Poor people are entitled to get free medication (Askes Gakin).35 Additional health staff (mainly nurses and midwives) have been hired and located in remote areas, and the number of doctors increased from 1 in 1999 to 22 in 2001. Nonetheless, many doctors and nurses who are on
• duty in rural areas are too often absent from their post. Access to electricity has improved
Some 62.2% of the households in the study36 had access to electricity. This was partly due to the expanded grid provided by PLN (24.1%), and partly to the widespread use of generators. However, in many rural areas, electricity is only available at night, which limits its use for economic activities.Transportation facilities have improved
Between 2001 and 2003, the district
•
•
box 11. no space for school tables
A new SLTA school was constructed in a remote kecamatan. However, the contractor did not follow the specifications.
He reduced the size of the rooms until there was not enough space to fit in tables for all the students. Only with the help of a private initiative were chairs with wooden desk pads carpentered and the students had some decent studying environment. In addition, the constructor forgot the provisions for installing electricity.
Box 12. Asphalt on the Sand…
In one of the districts, a road connecting three villages with the kecamatan centre was constructed in September–October 2004 (left picture). Despite a budget of almost Rp 1 billion (USD 111,111) per kilometre, the implementation was so poor that the road was no longer passable by motorbike only 6 months later (right picture), leaving the connection of the villages in a worse condition than it was before the works.
Villagers complained to the district government. But when the official monitoring team checked the situation they did not dare to report the poor implementation quality. The contractor had well-known family ties with the district leader, and the monitors feared for their careers.
On the other hand, the contractor complained that he had so many costs associated with getting the contract that little was left for properly implementing the project!
September 2004 April 2005 (Photo: M. Haug)

�� | Towards Wellbeing: Monitoring Poverty in Kutai Barat, Indonesia
box 13. reforestation with rattan and the help of spirits
In a small village in Dataran Rendah, 50 ha of swamp forest were enriched with Jepukng seedlings (Daemonorops crinita). About 100 families participated organised in various farmer groups.
The total budget allocated by Dinas Kehutanan was Rp 162.5 million. However, to the farmers’ surprise, they were forced to buy certain equipment and inputs from single sources, they had to pay taxes (VAT and income tax) despite only marginal income, and some forestry officers only helped when they were paid some ‘acceleration’ money (Rp 1–2 million). According to the local people, a total of 19.4% of the budget was spent on these issues.
In order to ensure a sufficiently long rainy season (required by this rattan species), Rp 10 million was spent on a Guguq Tautn ritual.
Table 13. Health and education infrastructure and services between 1995 and 2003†
1995 1996 1997 1998 1999 2000 2001 2003No. SD schools 199 192 201 207 207 207 216 214 No. SLTP schools 35 35 34 37 45 45 40 41 No. SLTA schools 9 10 11 9 12 12 15 20No. SD students 19,432 19,704 19,299 19,024 21,584 21,584 19,374 21,292No. SLTP students 4,608 5,084 5,021 5,242 5,663 5,663 7,659 5,199No. SLTA students 1,191 1,477 1,712 1,331 1,765 1,765 2,477 3,011No. SD teachers 2,081 1,322 1,338 1,453 925 925 1,732 1,480No. SLTP teachers 438 361 392 474 660 660 524 493No. SLTA teachers 140 171 172 124 244 244 252 342No. doctors 9 12 6 3 1 15 22 n.d. No. health facilities 72 76 86 73 87 82 76 89No. pharmacies 2 2 2 3 3 2 2 6
† No data were collected in 2002.Source: Andrianto (2006).
government allocated a total of about Rp 400 billion for infrastructure. Approximately half of this budget was spent on the improvement of transportation facilities, including roads and bridges. Many of these roads have been asphalted, though with declining quality the further one gets away from the district’s capital.Project implementation is often poor due to corruption
Although no official data exist, there is widespread anecdotal evidence for a conservative estimate that 10–30% of many project budgets is used for non-specified purposes.
•
This is clearly one of the most critical constraints to the kabupaten’s development, as it leads to poor quality implementation of government projects (see Boxes 11 and 12). Access to markets has improved
Thanks to new road and bridge infrastructure, physical access to markets has improved in many regions. In some regions (Jempang and Muara Pahu), night markets are held on a weekly basis, while trucks deliver goods in other areas. Access to information has increased
Telecommunication facilities have largely improved over recent years
•
•

A Portrait of Household Wellbeing | ��
Table 14. Correlation between infrastructure & services sphere and core spheres of wellbeing
Service & Infrastructure vs. Correlation (r =)
SWB 0.82
Health 0.80
Wealth 0.81
Knowledge 0.68
Core 0.81
Figure 20. Core and context values of 21 subdistricts.
(mainly through expanding coverage of mobile phones). This leads to shorter information pathways. People in the remote area of Hulu Riam often use commercial telecommunication centres (Wartel) equipped with satellite phones. In addition, the creation of the new kabupaten has reduced the physical remoteness of many villages,37 which also facilitates access to information. Equally important are the denser social networks due to more local representatives in the district assembly and other government institutions. Information is commonly channelled through these informal networks.
Table 13 summarises the trends of some infrastructure and services provided by the government before and after decentralisation.
The strategic importance of infrastructure and services can be seen in the high correlation between this sphere and the core spheres (Table 14).
Wellbeing at Subdistrict LevelIn absolute terms, the picture gets less extreme when data are aggregated at subdistrict level, as poor and better-off villages partially balance the score. However, there are substantial differences among the
Context
Core
0.30
0.40
0.50
0.60
0.70
0.80
0.40 0.45 0.50 0.55 0.60 0.65 0.70
Laham
Penyinggahan
Sekolaq Darat
MelakBarong Tongkok
Long Hubung
Bentian Besar
Long Apari
Siluq Ngurai
Jempang
Muara Lawa
Bongan

�0 | Towards Wellbeing: Monitoring Poverty in Kutai Barat, Indonesia
Table 16. Subdistricts with largest difference between economic and natural sphere (economic sphere index – natural sphere index)
Subdistrict Difference Trade-off due to
Siluq Ngurai 0.30 Coal mining
Melak 0.24 Urbanisation
Muara Lawa 0.23 Coal mining
Sekolaq Darat 0.22 Rubber estates
Barong Tongkok 0.19 Urbanisation
Jempang 0.16 Oil palm plantation and coal mining
Long Apari −0.16 Intact environment, little economic development
Table 15. Wellbeing scores by subdistrict and sphere† (in each sphere the 3 most critical kecamatan are marked ‘#’)
Kecamatan SWB H W K N E S P I&SLong Apari 0.45 0.61 0.52 0.46 0.74 0.58 0.53# 0.44 0.62Long Pahangai 0.32# 0.61 0.52 0.45 0.62 0.61 0.61 0.49 0.49Long Bagun 0.45 0.59 0.53 0.41 0.46 0.53 0.57 0.47 0.49Long Hubung 0.32# 0.49# 0.34# 0.38 0.39 0.49 0.61 0.38 0.42#Long Iram 0.52 0.66 0.51 0.42 0.51 0.59 0.65 0.44 0.56Melak 0.58 0.71 0.64 0.48 0.37 0.61 0.71 0.46 0.67Barong Tongkok 0.50 0.74 0.57 0.50 0.43 0.62 0.64 0.37# 0.66
Damai 0.41 0.57 0.43 0.47 0.48 0.55 0.61 0.41 0.58Muara Lawa 0.44 0.61 0.52 0.51 0.32# 0.55 0.60 0.39 0.56Muara Pahu 0.48 0.71 0.54 0.46 0.48 0.54 0.65 0.50 0.56Jempang 0.38 0.59 0.56 0.39 0.34# 0.49# 0.64 0.47 0.53Bongan 0.41 0.58 0.47 0.37# 0.47 0.62 0.62 0.44 0.58Penyinggahan 0.54 0.73 0.63 0.60 0.59 0.70 0.70 0.60 0.66Bentian Besar 0.31# 0.43# 0.35# 0.42 0.49 0.49# 0.45# 0.43 0.42#Linggang Bigung 0.46 0.64 0.57 0.42 0.49 0.55 0.62 0.34# 0.64
Nyuatan 0.42 0.57 0.48 0.37# 0.55 0.50# 0.55# 0.37# 0.53Siluq Ngurai 0.35 0.66 0.37# 0.42 0.31# 0.61 0.58 0.45 0.47#Manor Bulatn 0.42 0.56 0.41 0.40 0.43 0.59 0.62 0.45 0.50Tering 0.45 0.59 0.47 0.45 0.48 0.55 0.57 0.46 0.55Sekolaq Darat 0.50 0.83 0.69 0.55 0.43 0.65 0.69 0.45 0.71Laham 0.42 0.43# 0.54 0.33# 0.57 0.53 0.63 0.43 0.48Average 0.45 0.64 0.52 0.44 0.46 0.57 0.62 0.43 0.57
† SWB = subjective wellbeing; H = health; W = wealth; K = knowledge; N = natural sphere; E = economic sphere; S = social sphere; P = political sphere; I&S = infrastructure and services.
21 subdistricts of Kutai Barat (Figure 20). The best-off kecamatan are Penyinggahan, Sekolaq Darat, Melak and Barong Tongkok, while Long Hubung, Bentian Besar, Laham and Siluq Nguray are left far behind.
The detailed scores are listed by sphere in Table 15. The three most critical subdistricts for each sphere are highlighted in red.

A Portrait of Household Wellbeing | ��
In general, differences among kecamatan are consistent for most spheres, though there are a few exceptions, where values seem ‘too’ high or ‘too’ low:
Health: Manor Bulatn, Siluq Ngurai and Nyuatan appear ‘too’ high—this is possibly due to frequent Belian rituals resulting in relatively good access to traditional healthcare and a relatively high share of rice self-sufficiency.Wealth: Jempang and Laham appear ‘too’ high, possibly due to recent compensation payment (from an oil palm company and coal mining) and fees (from logging).SWB: Long Pahangai appears ‘too’ low, possibly due to its remoteness and lack of entertainment, though SWB is higher in the even more remote Long
•
•
•
Apari. The political desire for a separate kabupaten might be another factor, as well as the general dissatisfaction with decentralisation.
Trade-offsThe trade-offs between the (critical) natural sphere and the (prospering) economic sphere are most apparent in seven subdistricts (Table 16).
This trade-off is also found in the statistical analysis of villages with either the natural or the economic sphere in critical condition. For such villages, both sphere indices show a moderate negative correlation.38
Thus, in many areas economic growth is accompanied by environmental destruction.


��
CHapTer 6wHy are soMe people poor in KuTai baraT?
some CorrelATions
Statistical analysis of the wellbeing monitoring data revealed a number of interesting correlations between poverty and factors, such as ethnicity, forest dependency or remoteness.
Poverty and ethnicityAlthough some ethnic groups, such as Javanese, Kutai or Bugis, do generally fairly well, while some Dayak groups like the Kayan, Kenyah and Bentian score much lower (the Benuaq and Tunjung majority scores in the middle), this cannot be linked to cultural traits. In villages with multiple ethnic groups, such as Tanjung Isuy, Barong Tongkok, Tering Seberang and Melak Ilir, there were very few significant differences (if any) in the respective wellbeing aspects. Other factors, such as remoteness, available infrastructure and access to resources are far more decisive on household wellbeing than ethnicity. Hence, ethnicity is not a direct cause of poverty. However, the more successful groups often live closer to the centre compared to the poorer ones. If, for instance, Javanese households are compared across different subdistricts, wellbeing differences become highly significant for the same ethnic group; for example, Javanese households in Barong Tongkok are twice
as well-off (core wellbeing) compared to Javanese households in Bongan.
Poverty and forest dependencyAccording to the wellbeing monitoring survey, 60.3% of the respondents still enter forests or lakes on a regular basis and 39.5% of all interviewed households had a rice field (mainly ladang) in the previous year.39 Natural resources, such as rattan and fish, are the two most important sources of income, and more than 80% of all households regard forest animals/game as important or very important for their own livelihoods. Thus, forests and natural resources are an important basis for many households in the district, especially in remote areas without many economic alternatives (see Box 14).
However, despite this very obvious importance of forest resources, there is also a clear correlation between forest dependency and poverty. The Kruskal–Wallis Test shows a highly significant difference for all wellbeing spheres between households with no, low or medium/high forest dependence: the higher the forest dependency, the lower the wellbeing scores. On the other hand, the direction of the causality is not clear. It could well be that poor or marginalised households choose livelihood strategies that are more dependent on forests. This is

�� | Towards Wellbeing: Monitoring Poverty in Kutai Barat, Indonesia
Figure 23. Three categories of forest dependency versus seven remoteness categories. Remoteness = Travel time by usual public transportation (boats, cars, busses) between district centre and community: 1: less than 1 hour; 2: 1–2 hours; 3: 2–4 hours; 4: 4–8 hours; 5: 8 hours to 1 day; 6: 1–2 days by boat; 7: more than 2 days by boat (but usually accessible by plane).
the case for households led by a widow or widower. Such households are significantly more dependent on forests than others.40
Hence, for those vulnerable households the forest has become a safety net.
Not surprisingly, forest dependency increases with remoteness (Figure 23).
However, with the exception of the most remote category, remoteness does not automatically mean better condition of the natural sphere, as some relatively remote areas have been heavily damaged by logging, plantations and mining (Figure 24).
0%10%20%30%40%50%60%70%80%90%
100%
1 2 3 4 5 6 7
Remoteness
Hou
seho
lds
No Forest DependencyLow Forest DependencyModerate/high Forest Dependency
box 14. riches of the forest
Forest resources are highly valued by households in Kutai Barat (Figure 21).
Figure 21. Importance of game animals and other non-timber forest products.
The increasing pressure on land can also be seen in the relatively young age of forest cleared for preparing dry-rice fields (ladang) (Figure 22).
Figure 22. Age distribution of forest cleared for annual swiddens was in 2005/06.
Importance of Game Animals
18.8%
55.7%
25.5%
Not importantImportantVery important
Importance of NTFPs (no animals)
31.7%
51.2%
17.1%
Not importantImportantVery important
Forest Age
< 5 years
5-10 years
10-20 years
> 20 years
Old forest
53.80%
24.90%
7.40%
4.30%
9.70%

Why are Some People Poor in Kutai Barat? | ��
Hence, relying on forests is less a strategy based on the abundance of resources, but rather the only economic option for many families.
Forest dependency and ethnicityThere are great differences in the degree of forest dependency among the ethnic groups of Kutai Barat, with the Penihing, Seputan, Kayan and Bukat being the most forest-dependent groups, while Bugis, Batak, Banjar and Javanese show very little forest dependency (Table 17).
Poverty and remotenessRemoteness is one of the most important factors influencing wellbeing in Kutai Barat. All core spheres, the economic and the infrastructure and service spheres are negatively correlated with remoteness, i.e. the more remote a village, the lower its wellbeing scores (Figures 25, 26 and 27). The big exception is Hulu Riam which scores similar to the vicinity of Sendawar! The explanation is probably a combination of special government attention, e.g. through subsidised flights, the strong economy based on birds’ nests and gold, as well as a broad subsistence basis,41 educational and other welfare and infrastructure programmes provided by the churches for many decades.
However, despite the otherwise good condition, Hulu Riam scores very low in all aspects of SWB (see Figure 25), possibly due to the remoteness per se, the lack of entertainment and access to the outside world, and, most likely, also because of often violent conflicts about valuable resources. On the other side, the natural sphere increases with remoteness (with the exception of some logged-over areas in remoteness category 6, e.g. Bentian Besar). This is still due to difficult access regarding large-scale businesses, like open pit mining and plantations. The economic sphere shows few differences, though remoteness categories 5 and 6 (Upper Mahakam) are clearly worse off than the other areas, mainly due to long travel distances to markets and the general lack of infrastructure (see Figure 27).
Both the social and economic spheres are lowest in Category 6 for unclear reasons. As described earlier, the political sphere shows a moderate positive correlation with remoteness, probably caused by smaller village size and, hence, a higher proportion of villagers who are politically involved. With the exception of areas in remoteness categories 1 (high) and 6 (low), social sphere scores are very similar throughout Kutai Barat.
Figure 24. Natural sphere index versus remoteness.
Table 17. Ranking of ethnic groups regarding forest dependency
Group Rank† n‡Penihing 1 174Seputan 2 67Kayan 3 138Bukat 4 21Bahau 5 890Luangan 6 19Bentian 7 228Kenyah 8 175Benuaq 9 1988Bakumpai 10 171Tunjung 11 2284Kutai 12 1238Bugis 13 293Batak 14 16Banjar 15 432Jawa 16 1036† 1 = most forest dependent, 16 = least forest dependent.‡ n = Number of sampled households.
0
0.5
1.0
1.5
2.0
2.5
3.0
1 2 3 4 5 6 7
Remoteness
Nat
ural
Sph
ere
Inde
x

�� | Towards Wellbeing: Monitoring Poverty in Kutai Barat, Indonesia
Figure 25. Aspects of subjective wellbeing versus remoteness.
0
20
40
60
80
100
120
140
160
180
1 2 3 4 5 6 7
Remoteness
Mea
n Ra
nkSWB Prosperity Poverty Happiness
Figure 26. Core and context poverty indices versus remoteness.
0
20
40
60
80
100
120
140
160
180
200
1 2 3 4 5 6 7
Remoteness
Mea
n Ra
nk
Core & Context Core Context

Why are Some People Poor in Kutai Barat? | ��
Disadvantaged householdsSome 18.7% of all households have at least one member who is a widow, a widower, an orphan or disabled. These households score significantly lower for all wellbeing aspects except the natural sphere.
Household sizeHousehold size itself is not correlated with either core or context values. However, there is a difference in household size among different ethnic groups. Dayak households (with the exception of Tunjung) are on average larger (6.0 members) than the households of Bugis, Banjar, Kutai, Javanese and Tunjung (average 4.6 members). Hence, if the average household sizes of the different ethnic groups are tested against core and context, a moderate negative correlation is found. However, as explained under ‘Poverty and ethnicity’ above, the causal link is rather between location and livelihood options of a community and wellbeing than due to ethnicity per se.
WhiCh fACTors influenCe household WellbeinG?
Table 18 shows the factors that directly influence the NESP spheres of wellbeing.
What are the Main Constraints to Wellbeing According to Local People? We also assessed local perceptions regarding the most relevant constraints to household wellbeing in Kutai Barat. Forty focus group discussions were moderated by our team.42 The results are shown in Figure 28.While there is no doubt between the two groups about the importance of education, health, natural disaster (forest fires and flooding) and jobs/income, the male elite also emphasised assistance by the local government and transportation infrastructure as important for improving wellbeing, while women stated that clean water, assets and lower school costs were needed. In addition to these findings,
Figure 27. Context sphere values versus remoteness.
0
20
40
60
80
100
120
140
160
180
200
1 2 3 4 5 6 7
Remoteness
Mea
n Ra
nk
Natural SphereEconomic SphereSocial SpherePolitical SphereInfrastructure & Services

�� | Towards Wellbeing: Monitoring Poverty in Kutai Barat, Indonesia
Table 18. Main poverty causes in Kutai Barat
Sphere Poverty causes
SWB Increasing intra-village inequality and envy due to unequal distribution of profits and fees
Increasing level of conflicts General cultural change from adat-based society to individualismFeeling of living too remote; lack of entertainment and informationDissatisfaction with decentralisation results
Health & Nutrition Pollution and silting up of rivers and lakesDeforestation with resulting erosion, changed hydrological patterns and
loss of biodiversity as a source of food and medicineFailed harvests along with loss of old rice varieties and other cultigens
due to natural calamities (droughts, fire)Insufficient healthcare (staff, facilities, medication)
Wealth Increasing living costs (since Asian financial crisis 1997/98), especially high in Hulu Riam
Often short-sighted investment of profits and fees in luxury items, gambling and prostitutes instead of physical, financial or human assets
Lack of construction material due to deforestation
Knowledge Insufficient access to schoolsLack of funds to covering school expendituresLivelihood pattern of household does not allow children to always
attend school (fishermen, forest-based farmers)Loss of traditional knowledge without adequate substitution
Natural sphere Loss of natural resources (quality and quantity) with impacts on all aspects of life including health and socioeconomy
Increasing number of natural disasters, such as wild fires, droughts and flooding
Increasing pollution, e.g. from mining, plantations
Economic sphere Loss of traditional safety net, often before new safety nets can be established (incl. declining subsistence base and social capital)
Lack of stable income sources or choice of income sourceLack of value-added for investmentIncreased dependency on markets, often along with weak bargaining
power due to monopsonies
Social sphere Increasing number of inter-village, intra-village and intra-family conflicts often due to unequal or unclear distribution of profits and fees
Declining cooperation for communal affairs due to increased monetarisation and individualisation
Political sphere Lack of formal acknowledgement of traditional land and resource rightsPersistent uncertainty over access rights, institutional authority and
power relationsLack of political participation for many poor
Infrastructure & Services
Some areas have difficult access to the district centre and to other facilities (e.g. schools, health centres, markets)
Remoteness of Hulu Riam and some other areas (Bentian Besar, Upper Mahakam)
Too little investment in education and health facilitiesLack of extension services to support local enterprises

Why are Some People Poor in Kutai Barat? | ��
detailed studies in three villages (Engkuni-Pasek, Jontai and Muara Nayan) showed that social relations are equally important to most people. All of these priorities have been incorporated into our two-dimensional wellbeing model.
Some aspects (e.g. education, health, clean water and the feeling of good social relations) belong to the core, while others (e.g. income opportunities, natural disasters, social conflict, local government assistance and transportation) belong to the context.
While these priorities are clear messages to the local government, the causality
underlying these constraints is not always clear. Some of these issues are under the government’s own jurisdiction, such as education, health and transportation infrastructure. Other problems, such as the lack of income opportunities, the poor quality of drinking water and increasing damage due to natural disasters, require improved cooperation among all parties, including state, civil society, private sector and international organisations.
In addition to these locally identified constraints, our team compiled a more comprehensive list of trends affecting people’s wellbeing.
Figure 28. Main constraints for household wellbeing according to 40 focus groups. (See also Annex 4)
Education
Health
Disaster
Jobs
Clean water
School costs
Assets
Income
LG assistance
Transport
WomenVillage elite (men)


��
CHapTer 7wHaT Has been done in KuTai baraT?
Trends of loCAl GovernmenT budGeT And PoverTy-relATed ProjeCTs
During the first 2 years of its existence, the new kabupaten Kutai Barat received its budget from the Province of East Kalimantan and the central government.43 After 2001, the budget was made up by contributions from the centre, the provincial government, as well as from the kabupaten’s own revenues (Table 19).
Under the local government’s GSM44 programme, 194 projects have been initiated (174 run by the local government, 20 by NGOs), of which 163 have direct impacts on wellbeing (Table 20).
According to the respective implementing agencies, 84% of these projects have been fully implemented. Unfortunately, the available data do not allow a deeper analysis in terms of size of the projects and direct impact. This shortcoming will be taken up again in the final discussion and the recommendations of this report.
hAve The ProGrAmmes meT Their TArGeTs?
A commonly heard criticism in villages is that the local government does not respond
to their proposals. Indeed, our in-depth community studies revealed that many proposals submitted by the villages are not responded to. In some cases this is probably due to unrealistic demands, but the local government has not provided any guidance to communities on how to develop a realistic proposal.45
But how about those government programmes that were implemented? Do they meet their target?
Table 21 lists the percentages of those households interviewed in the wellbeing monitoring survey who had received assistance through a government programme.
Some 43.4% of the households said that local government support was low, 48.8% that it was intermediate, and only 7.9% said it was high.
The data from the 2006 household wellbeing monitoring allows checking whether selected programmes really reached those in need.46
Scholarships Households with children under 17 years who received scholarships were not significantly worse off (core; P = 0.070

�� | Towards Wellbeing: Monitoring Poverty in Kutai Barat, Indonesia
Table 19. Local government budget (Rp) in Kutai Barat, 2001–2003
Budget of Kutai BaratBudget year
2001 2002 2003
Income 372,415,119,582 518,540,152,807 663,156,706,652
Carryover from previous year 10,726,503,820 103,727,691,475 68,265,698,232
Local revenues (PAD) 11,164,966,987 35,751,589,134 24,842,572,516
Fiscal balance 340,145,389,282 357,031,471,513 455,949,268,463
Loan 0 0 82,599,167,441
Other legal income 10,378,259,493 16,728,480,852 31,500,000,000
Special affairs† 0 5,300,919,833 0
Expenditures
Routine 105,751,563,843 132,767,853,983 207,245,095,353
Development 161,372,277,816 315,603,487,781 408,256,044,353
† Obligated levy and income tax from government employees. The obligated levy is utilised to pay benefits gained by employees, like pension and health insurance. So, it is not real income, in the new accounting structure it is noted as ‘financing income’.
Table 21. Percentages of interviewed households that received local government support
LG Programme Received / used
Scholarships (only families with school age children) 25.3%
Health support (Askes Gakin) 20.4%
BBM compensation 24.3%
Subsidised rice (Raskin) Sometimes: 31.7%Often: 36.4%
Subsidised housing 3.2%
Recreation areas 52.6%
Spiritual services 94.7%
Table 20. Relevance of GSM projects regarding wellbeing categories (one project can have more than one impact)
Wellbeing dimension NESP category No. projects
SWB Subjective Wellbeing 0
Core Health & Nutrition 69
Wealth 1
Knowledge 83
Context Natural sphere 60
Economic sphere 100
Social sphere 80
Political sphere 53
Infrastructure & Services 52

What Has Been Done in Kutai Barat? | ��
n.s.) or less knowledgeable than others (P = 0.094 n.s.). Hence, scholarships were not targeted at households in need.
Health support (Askes Gakin) 47
Households that received free health cards (Askes Gakin) were significantly poorer than households that did not receive them (P = 0.000***), though there was no difference regarding health (P = 0.221 n.s.). Hence, free health care was relatively well targeted.
Compensation for increased fuel costs (BTL)Households that received cash compensation were significantly poorer than those that did not receive BTL (P = 0.000***). Hence, BTL was relatively well targeted.
Subsidised rice (Raskin) 48
Those who often bought subsidised rice were significantly poorer than those who did not (P = 0.000***); they also had smaller rice stocks or were less able to buy rice (P = 0.000***). Hence, the subsidised rice programme was relatively well targeted.
HousingAlthough only few villages received financial assistance for their homes, those who received subsidies had worse housing conditions than those who did not receive help (P = 0.000***). These few cases were relatively well targeted.
Although there are cases where individual households were forgotten or others who were not in need received help, the monitoring data show that the local government’s direct assistance generally meets its targets.
Households that received government assistance also appreciate this. The higher the aggregated benefits, the higher the score of perceived local government support (P = 0.000***), i.e. people also tend to acknowledge local government support.
WhAT Are The imPACTs of loCAl GovernmenT ProGrAmmes on household WellbeinG?
Decentralisation has clearly brought new scope to local governments and their ability to tackle poverty related issues. However, the previous sections show that the causality between a given government regulation or programme and an observed wellbeing trend is not always clear. The wellbeing of a household is influenced by many parameters in a highly interdependent way. Nonetheless, we can try to identify the impacts of the strongest causal links. The matrix in Table 22 summarises the overall direction of the impacts triggered by the government actions, based on the discussion of wellbeing trends described above.
The activities of the district government had many positive impacts on household wellbeing (Table 22). In some cases (e.g. water supply and housing), the government’s help only reached a few of the more than 200 villages, in other cases (e.g. scholarships) the help was more widely spread.
Due to the high population share of Dataran Tinggi (2003: 74.2%) most of 174 poverty-related projects (74.6%) were implemented in this part of Kutai Barat, while less was done in the more sparsely populated Dataran Rendah (17.5%) and Hulu Riam (7.9%).
Especially for the latter area (Hulu Riam), decentralisation has not yet come up to the people’s expectations, despite the subsidised flights and the relatively high scores of most wellbeing spheres. However, subjective wellbeing was low in most villages of Hulu Riam, and the wish for creating a kabupaten (district) of its own was frequently mentioned.
However, some government programmes had negative impacts, too, especially in the

�� | Towards Wellbeing: Monitoring Poverty in Kutai Barat, Indonesia
natural and social spheres (Table 22). Due to the strong emphasis on the economic and infrastructure-and-services spheres, trade-offs were made against the environment and social cohesion. The results were degraded forests, increasing pollution and conflict. Most of the negative impacts can be linked to unsustainable resource use and persisting uncertainty about resource rights. Therefore, the fault is not only on the local government’s side, but also related to the ongoing unclear direction of Indonesia’s decentralisation. People along the whole chain from the central government down to the villages use the opportunities provided by this void of governance. Misuse of public budgets and corruption can be observed at all levels, including local people who
lost the strength of their traditional adat institutions without seeing them replaced by new ones. Thus, there is a strong need for clarifying responsibilities over natural resources in a highly participatory way in order to approach environmental and social sustainability.
Besides the direct local government interventions, several other aspects related to decentralisation which are not under the full responsibility of the local government have significant impact on household wellbeing. These includes the creation of the new kabupaten (along with the generation of thousands of new jobs), central allocation of budgets, the spirit of reformasi,49 and individual desires for specific lifestyles.
Table 22. Summarised direct and indirect impacts of local government actions on household wellbeing (based on judgment of the authors)
Local government action SWB H W K N E S PMore schools +More teachers +Scholarships (BKM, Pemda) + +More health facilities +More health personnel +Raskin +Askes Gakin +Housing programme + +Rehabilitation of adat houses + +Drinking water supply +Working & transportation safety +Healthy housing environment +HPHH/KHM/IUPHHK + – + – +/–Agricultural extension services + +Training courses + +Subsidies for buying assets (livestock, plants) + +Facilitation of access to capital +BPK + +Informal acknowledgement of land rights +/– +/– + – +LG administration +/– + +Support of subdistrict and village government +Support of local institutions and groups +Conflict resolution + +Road & bridge construction +/– +/– + + – +/– +/– +Reforestation programme +/– +/– + +/– –Rubber programme +Improved business environment + +/– +/–

��
CHapTer 8ConClusions
hoW Poor Are households in KuTAi bArAT?
As explained in the Introduction, we do not see any use in a single poverty index, such as the World Bank’s $1 poverty line. Instead, we examined the various core and context spheres of household wellbeing. This multidimensional approach allows a far more differentiated analysis. Figure 29 shows the distribution of households by wellbeing condition and sphere.
The figure clearly shows that on average about one third of all households live in critical condition, one third in intermediate and one third in good condition. Bar diagrams of all 21 subdistricts are presented in Annex VI.
so Why Are some PeoPle Poor in KuTAi bArAT? A summAry
Causes of poverty can be found at various levels. Some are located right at the
Figure 29. Distribution of 10,431 households by wellbeing condition and sphere.
0%10%20%30%40%50%60%70%80%90%
100%
SWB H W K N E S P S&I
Wellbeing Spheres
Perc
enta
ge o
f Hou
seho
lds
Good
Intermediate
Critical

�� | Towards Wellbeing: Monitoring Poverty in Kutai Barat, Indonesia
household itself like low school attendance or short-sighted expenditure of cash income. Others are more the responsibility of higher administrative tiers, such as inadequate health and education budgets or lack of acknowledgement of traditional land and resource rights. And in addition, there are poverty causes beyond the government’s direct control, such as natural calamities, macroeconomic events and the topography of the region.
Macro-level causes (at international and national levels, general structural causes)
Volatile resource prices on the world marketNatural calamitiesTopography (remoteness)Increasing living costs (e.g. due to krismon)Many aspects of power remain at the central level.
Meso-level causes (at district and subdistrict levels)
Lack of capacity in government agenciesNon-targeted government programmes (non-transparent planning)Corruption and rent-seeking behaviourLack of infrastructure, unequal distribution and unequal quality of infrastructureLack of economic investment in long-term development (beyond extraction)Lack of acknowledgement of traditional resource and land rightsEnvironmental pollutionUnsustainable resource use and resource degradationToo little investment in health and educationToo little capacity buildingLack of participationConflicts between companies and communitiesLack of (sustainable) economic opportunitiesLack of access to capital.
•
•••
•
•
•
••
•
•
••
•
•••
•
•
Micro-level causes (at village and household levels)
RemotenessUneven distribution of economic benefits (local elite capture)Individual vulnerability (e.g. widows, orphans, disabled)Lack of knowledge (formal and informal)Short-sighted investment of cash incomeLack of reliable or diverse income sourcesWeak bargaining powerLoss of traditional economic safety netsDeclining social cohesionLivelihood pattern (e.g. nomadic or on lakes)Intra-household disparity.
WhAT Are The Poor’s ChAnCes of esCAPinG PoverTy in KuTAi bArAT?
Decentralisation and initiatives of the local government have clearly had many positive impacts on household wellbeing in the villages of Kutai Barat. New economic opportunities were generated, and infrastructure and services improved in many areas. However, this progress did not reach everyone. In fact, official poverty data show a stagnation of poverty incidence at a higher level than before decentralisation (see Figure 5) and the 2006 household wellbeing monitoring shows that, depending on the wellbeing sphere, up to 46% of all households are in a critical condition, with 52% of the population stating that they live in poverty. In addition, our own empirical long-term data suggest a widening gap between the better-off and the poorest of the poor due to unequal distribution of benefits with elite capture at all levels. Also alarming is the dramatic degradation of the natural sphere and the beginnings of a down-turn of the social sphere, including an increase in conflicts, often about land and natural resources.
••
•
•
•
•
••••
•

Conclusions | ��
In order to judge the poor’s chances of escaping poverty and increasing their wellbeing, we need to answer three questions.
Did decentralisation bring new opportunities?In Kutai Barat, decentralisation clearly generated many new economic and political opportunities. New income sources were created by the new administration as well as through an improved business environment and the easier access to natural resources.
Politically, more decision-making power was devolved to local communities which can—through their BPK councils—pass local regulations (Perkam). However, the recently passed UU 32 removed some power from the village council, including the right to dismiss a village head.
Although not yet officially acknowledged, informally traditional resource use rights are far more respected than before decentralisation. This is also reflected in the district’s practice of establishing a compensation scheme for expropriated agricultural land, which ranges from Rp 4.5 million to Rp 25 million per hectare (depending on the location and previous management). Compensation prices for standing crops on average increased by 1260% compared to 1993 (if compared against rice prices, the increase was 250%).50 This new legal possibility of de facto selling of traditionally owned land has become a very important source for new income and a dramatic source of new conflict (see ‘Is the current development in Kutai Barat sustainable?—Social sustainability’ below). However, the district government also left some opportunities unused. Particularly in the natural sphere, the local government failed to establish or enforce stricter regulations for controlling the environmental performance of extractive businesses.
Local government could also have given communities more chances to participate in planning their own development.
Did decentralisation reduce vulnerability?Approximately 95% of the households interviewed in the baseline survey reported that they received help in emergency situations, mainly from family members or neighbours. On the other hand, only 11% of 10,431 respondents stated that the level of gotong-royong (collective action) was still high in their community. Apparently, there are still functioning traditional socioeconomic safety nets, though mainly within extended families. However, due to the ongoing cultural change towards a more individualised modern society, these traditional safety nets are slowly being dissolved while their substitutes (e.g. insurance systems, stable income sources, contractual security) are not yet fully in place. This development puts many rural poor at a permanent risk of sliding into chronic poverty. In fact, inequality between the better-off and the poorest of the poor has already increased with the unequal distribution of financial benefits. The elderly, orphans, disabled persons, people living in remote places and single mothers are often deprived of these benefits and left in an increasingly difficult economic situation.
Vulnerability is also increasing where the risk-minimising subsistence base is given up in favour of a more profitable but risky production for often volatile and instable markets. Only 16% of the households in the baseline survey produced enough rice in 2003 to last for a full year. Most families rely on a mixed strategy with some food produced for subsistence and additional occupations for generating income. As long as buying markets are accessible and profitable, such an extended subsistence mode can work. However, the capture of local businesses by elites and patrons,

�� | Towards Wellbeing: Monitoring Poverty in Kutai Barat, Indonesia
as well as the lack of competition among buyers (i.e. monopsonies) often leaves rural producers in a weak bargaining position, which puts their livelihoods at risk. The focus on single income sources and large-scale land conversion from traditionally managed extensive agroforestry systems towards commercial monoculture deprives local people of other development options. Additional vulnerability is caused by the increase in natural calamities, such as droughts, wild fires andflooding. Some such events, e.g. forest fires, were the direct result of environmentally and socially unsustainable development. For instance, many of the devastating fires in 1997/98 (prior to decentralisation!) were directly or indirectly caused by oil palm companies.51
In this respect, the unbalanced use of the new economic opportunities will ultimately increase the vulnerability of the poor and put sustainability at risk, unless counter measures are taken by the local government.
Is the current development in Kutai Barat sustainable?The current transition of rural Kutai Barat from a customary extended subsistence economy52 to a much more market oriented one, together with a societal change towards increasing individualisation, is happening at a pace that raises serious doubts about its overall sustainability.
Economic sustainability: The district’s economic development is to a large extent based on the extraction of non-renewable resources (coal and gold) and on resources which suffer from a dramatic stock decline due to overexploitation and habitat destruction (timber, some non-timber forest products). So far, there is no significant shift towards other forms of production in sight, with the exception of rubber and oil palm estates, which could have—if carefully managed—more sustainable prospects. The district government itself provides hundreds of jobs within its own institutions, but these are at risk if there is no long-term economic
sustainability that generates sufficient local revenues.
Environmental sustainability: Unclear resource use rights, lack of control and law enforcement, as well as local elite capture have accelerated the speed of environmental degradation since 1999. Although the new central government seems to have put a (temporary?) end to large-scale illegal logging in Kutai Barat, the loss of forest cover and biodiversity—often due to plantations and mining—has been dramatic. Reforestation efforts have mainly focused on enriching rubber and rattan gardens, but have not substituted for the lost habitat and species diversity. Mining and the increasing use of pesticides pollute rivers and lakes. These, together with other forms of unsustainable resource use (e.g. electro fishing, fish and bird poisoning), are putting Kutai Barat’s environment at high risk.
Social sustainability: The non-transparent and often obscure negotiations between timber, mining and plantation companies and local people have created increasing inequality among villagers. Envy and competition over formerly open resources have led to serious conflicts between villages and companies, between villages, between villagers and even within families. The enhanced individualisation of resource use rights (e.g. through individual certificates) has eroded social cohesion and willingness to cooperate for collective goods. However, it is not easy to judge social sustainability during a time of dynamic societal change. In due course, functions of the traditional society, such as social safety nets and collective labour input, will be substituted by other elements like insurances or reliable contractual agreements. During this transition, social cohesion is becoming increasingly fragile and vulnerability might also increase (see ‘Pay-offs and trade offs’ below).
Political sustainability: The ongoing struggle between the central and local governments creates uncertainty and local voids of authority, governance and power. The latest

Conclusions | ��
UU 32 law indicates a slight power shift from the district back to the provincial level. The ongoing struggle between districts and the centre about forest resources, as well as the lack of formal acknowledgement of traditional land and resource rights underline the current lack of a stable political framework. This uncertainty attracts parastatal institutions, such as local elites who capture these former state functions and establish informal patron–client relations.53 The sustainability of development is also under threat from the current practice of wide-scale replacement of technical senior staff after elections. Professional qualification comes second to political proximity, which disrupts many good initiatives. Unless more transparency and stability are created, no political sustainability can be achieved.
Cognitive sustainability: The general shift towards modernisation leaves behind a large amount of traditional knowledge. This is a normal process in societal and cultural change. However, the rate at which this knowledge is disappearing in Indonesia is probably unprecedented. Some organisations (e.g. the NGO CERD) support the collection and documentation of folk knowledge, which otherwise might
be lost over the coming decades. On the other hand, decentralisation has had a very positive impact on the use of local languages and cultural traits, which were formerly marginalised.
Pay-offs and trade-offsDespite some clear improvement of the core aspects of household wellbeing, the context has changed in a more ambivalent manner. While there are very obvious new economic and political opportunities, sustainability of all the dimensions discussed above is at risk and vulnerability has not been sufficiently reduced. In particular, the natural sphere, and increasingly the social sphere,54 have had to pay the trade-offs for achievements in the economic sphere, which puts the sustainability of Kutai Barat’s development at great risk.
Decentralisation has had its early winners and losers. It is the local government’s responsibility to better support the ones in need. Some initiatives are promising (as shown in Section 7), but there is much more to do. In the final section, we present a conceptual framework and practical actions for the local government to improve its poverty reduction strategy and to improve the wellbeing of its constituents.


��
CHapTer 9reCoMMendaTions
use nesP for more effeCTive PoverTy moniTorinG
NESP as a multidimensional local poverty monitoring system provides comprehensive and relevant information important for district and subdistrict planning. The core and context information can help planning agencies like Bappeda to:
Alert local government on poverty hotspots Alert responsible government sectorsIdentify needs for addressing acute poverty (basic needs)Anticipate future impoverishment caused by an unfavourable contextIdentify strategic entry points to reduce chronic povertyIdentify strategic entry points to strengthen the enabling environment (context)Identify priority areas for regionally more balanced developmentIdentify which poverty alleviation measures have worked and which have notTrack changes of poverty data over time.
Through these actions, the local government can get answers to the five questions asked in the introduction.
•
••
•
•
•
•
•
•
1. Who are the poor? Depending on the survey resolution,
we can identify poor households, poor villages, and poor subdistricts, or geographic regions with high levels of poverty. Poverty lists and maps help local governments to identify poverty hotspots and allocate their aid based on clear demand. Additional information on household structure shows whether poverty is especially related to ethnicity or certain clusters of households (e.g. those with only one adult, those with disabled family members).
2. How poor are they? The use of poverty indices quantifies
the nine poverty spheres, which helps in allocating government support and aid. Analysing core and context separately can shed some light on the differentiation of acute poverty, which becomes most visible in the core aspects, and chronic poverty or long-term constraints of development as reflected in the context. Long-term monitoring shows how poverty rates change and whether poverty alleviation programmes work.
3. Where do the poor live? The spatial information shown in

�� | Towards Wellbeing: Monitoring Poverty in Kutai Barat, Indonesia
poverty maps (see Section 5) helps the local government to identify hotspot areas. These areas can be poor for many different reasons. However, their identification is the first step to addressing the problem. Overlaying spatial information, such as infrastructure maps, can help identify patterns of poverty.
Identifying priority areas will also help the local government to create the budget ceiling per area. Establishing such budget ceilings is essential for any realistic planning at the community or the kecamatan level (Musrenbangdes and Musrenbangcam). By knowing the budget ceiling, people can select the priorities themselves based on their own analysis of the local condition guided by the district’s development strategy.
4. Why are they poor? Many poverty causes, such as natural
hazards, fluctuating world market prices, and national political and economic crises, are beyond the local government’s control. The analysis of multidimensional data sets and poverty maps can generate hypotheses and ideas on poverty causes. But the visualisation of poverty data is no substitute for in-depth analysis. Therefore, any index that shows a critical value is only a sign of alert that must trigger some serious discussion or more detailed studies about the underlying causes. A basic causal analysis that aims to improve planning can be conducted at the village level, with additional input from technical agencies, researchers or other civil society organisations.
This information can help Bappeda to establish the budget ceiling per sector and government programme. The current public finance laws and regulations obligate Bappeda to prepare the budget ceiling each government affair55 and local
government organisation. However, many local governments do not know how to calculate these ceilings on an objective basis. The prioritisation based on comprehensive poverty data will help local governments to mainstream their development strategy with their poverty reduction programme.
5. What are the changes over time? The poverty monitoring system
suggested above allows governments to track changes of poverty over time. NESP is not a static concept. The context spheres in particular can be extremely dynamic. Capturing changes of core poverty and the enabling environment requires regular repetition of monitoring surveys. Depending on available resources, annual to biennial cycles will provide decision makers with sufficiently updated information.
imProve PlAnninG
NESP flags critical conditions and helps identify priority areas and sectors. This can make development planning far more effective. The monitoring approach initiated in 2005/06 can be linked to the existing annual planning system (as shown in Figure 30).
Figure 30. Suggested monitoring and planning cycle in Kutai Barat.
NESP Monitoring
SubdistrictSubdistrict Planning
Village PlanningTechnical Agencies
Future Development

Recommendations | ��
The monitoring results should be distributed to subdistricts and villages, where the findings are checked for plausibility by comparing rankings of the NESP spheres at village level.
Using the poverty analysis at the district level, Bappeda should prepare draft priorities both by sector and by area. This prioritisation should become the basis for establishing budget ceilings by local government affair and organisation, as well as by area (village and subdistrict). By consulting additional data, Bappeda can then prepare standard costs and prices for government expenditures. Budget ceilings and price standards should be distributed to villages and subdistricts before the local planning sessions start.
Villages and subdistricts can then rank their own proposed activities and projects on the basis of the monitoring results (i.e. critical spheres) along with the cost estimates. For instance, if the health condition is critical in Village A and the villagers agree on this fact, it becomes a top priority for planning the development activities of the next year(s). As the monitoring system does not explain why health is critical, the village assembly conducts a basic causal analysis and elaborates suitable measures, which are then proposed to the subdistrict level. Here the proposals are collected from all villages and discussed by the subdistrict government, related technical agencies and the members of the district legislative assembly (DPRD) from the respective subdistrict. At the subdistrict planning session (where the villages are also represented), an annual development plan is prepared and submitted to the district government. In addition, information can be requested from other government agencies, or from researchers and civil society organisations familiar with the area.
Since all relevant stakeholders are present in the local planning sessions (including the local DPRD representative), all proposals can be finalised in subdistrict assembly.
By this approach, prioritisation will be more transparent and the likelihood that community proposals get accepted should increase.
If these steps are conducted properly, a revised poverty alleviation strategy should reflect the spatial and sectoral priorities that emerge from monitoring. Such a strategy would need to address basic needs, as well as contextual constraints and opportunities, in order to facilitate self-driven poverty alleviation.
imProve The enAblinG environmenT
What does it take to increase or maintain wellbeing? How can conditions in the different spheres of NESP be improved? Poverty and wellbeing are not static. They can change over time. Local governments should be interested in how to improve the wellbeing of the poor and sustain those gains.
Capabilities of the poor should be utilised and strengthened. These capabilities include five capitals that support people’s livelihoods: financial, human, social, physical and natural.56
The local government should assess existing local livelihood strategies and create an institutional framework that supports sustainable self-driven strategies for improving wellbeing.
Opportunities and support are needed to make the best use of people’s own capabilities. However, capabilities and assets are not enough. People also need a general environment that enables and supports their efforts. The poor need economic opportunities, such as jobs or markets, but also political opportunities for greater participation and empowerment. Local governments, working together with other levels of government and the private sector, have a clear role in providing these kinds of opportunities. Combined with the

�� | Towards Wellbeing: Monitoring Poverty in Kutai Barat, Indonesia
poor’s own strategies and political support, these kinds of opportunities can become a powerful driver of the pathway out of poverty.
In addition, vulnerability needs to be reduced. The pathway out of poverty can be steep and risky, and the poor need security. Some groups of the poor are vulnerable to falling back into poverty or getting trapped there chronically. Decision makers and the poor have to think about how to reduce this vulnerability. This can be through public safety net functions like free health insurance or free education and subsidised food, but also through private measures, such as family- or community-based safety nets, income diversification to avoid risk and dependence on reciprocity through extended social networks.
Finally, sustainability is required to ensure the long-term success of poverty reduction. Sacrificing the environment or social cohesion for short-term economic gains does not improve wellbeing. Balancing the trade-offs among the NESP spheres is an essential, though tough challenge for every local government.
Figure 31 illustrates how wellbeing can be improved, based on the principles of utilising and strengthening capabilities,
creating opportunities, providing support, reducing vulnerability and achieving sustainability.
ACTions for The disTriCT GovernmenT
Improve monitoring and planningSend monitoring findings (village charts) back to communitiesFacilitate community development planning (through subdistrict staff)Facilitate subdistrict development planningPrioritise budget and project allocation based on monitoring findings both by area (where to intervene) and by institution/sector (in what sector to intervene)Develop a more participative planning process (as set out above).
Improve infrastructure and services Improve extension services (community forestry, agriculture, manufacturing)Provide more capacity building (e.g. training courses) for the poorIncrease number and quality of teachers and open more middle schools (SLTP)Increase number and quality of health staff and facilitiesCreate better incentives for qualified health and education staff to work in remote areasMonitor presence and quality of education and health staffImprove access to remote communities, especially in the upper Mahakam and in Bentian BesarImprove economic infrastructure (roads and bridges, energy supply, communication)Improve vocational education.
Maintain subsidisation systemContinue free healthcare (Askes Gakin) for the poorContinue subsidised rice programme (Raskin)Continue free schooling, include high schools (SLTA)
•
•
•
•
•
•
•
•
•
•
•
•
•
•
•
•
•
Figure 31. Some principles for improving wellbeing. Wellbeing can be improved by utilising
and strengthening capabilities, creating opportunities,
providing support, reducing vulnerability and achieving
sustainability.
Wellbeing
Time
Opportunities Vulnerability
Sustainability
Capabilities

Recommendations | ��
Maintain subsidised flights to Hulu Riam.
Improve natural sphereProvide and enforce legal frame for sustainable forest resource use, including community-based natural resource and forest managementSupport conservation efforts Set incentives for reforestation effortsMediate conflict between customary and legal resource access rulesEnforce legal obligations of companies (concerning communities and the environment/pollution).
Improve economic sphereCreate a stable enabling environment for economic development Attract investorsSupport local entrepreneurs, e.g. through favourable taxation during start-up phaseEstablish a minimum wage for company employees to combat debt bounds Establish and enforce labour safety regulations and basic health requirements for workers Support small and medium-sized enterprises (e.g. through start-up services including reduced taxes)Strengthen financial management skills of local peopleAssess and support sustainable local
•
•
•••
•
•
••
•
•
•
•
•
livelihood strategies, e.g. extended subsistence systems based on cultivation of upland rice and off-farm income generationFacilitate access to capital and markets, also through further expansion of credit unions.
Improve social sphereIdentify and communicate with relevant social groupsOffer mediation for conflicts and disputes between villages or between villages and enterprisesEncourage social cohesionPromote collaboration among local interest groupsDistribute amount and quality of development more equally.
Improve political sphereEmpower villages and vulnerable/marginalised groups through more participationEstablish genuine two-way communication with the poorIncrease accountability of subdistrict and village leaders towards their constituentsProvide and enforce legal protection and securityStrengthen traditional land and resource use rightsIncrease transparency and fight corruption.
•
•
•
••
•
•
•
•
•
•
•


��
endnoTes
1 This is the official BPS figure; BKKBN data indicate a much higher poverty rate.
2 Such as the GSM movement in Kutai Barat.
3 The survey was part of a new poverty and wellbeing monitoring system developed by the project (e.g. Cahyat et al. 2007). One village out of 223 could not be monitored because of logistic problems.
4 Hulu Riam is the area above the Mahakam rapids. The area close to rivers and lakes is called Dataran Rendah, while all remaining areas are referred to as Dataran Tinggi.
5 GSM means ‘Prosperous Sendawar Movement’.
6 GSM had been promoted at the highest levels of the districts. It gained wide support among district officials for several years. In fact, GSM became so popular a term that officials referred to it to justify nearly any government action, without regard to the Movement’s original strategic objectives. In the end, GSM had become a vehicle for the various local government agencies to apply for new projects, often having mainly personal interests in mind.
7 In Kutai Barat, the KPK had no budget of its own.
8 There is no community level in urban areas (i.e. Sendawar).
9 This data deficiency was the main reason that our project developed a new poverty monitoring system.
10 The Nested Spheres of Poverty (NESP) model presented in this section has been developed by the whole project team (Gönner et al. 2007).
11 The capability approach was developed by Nobel Prize Laureate Amartya Sen (e.g. Sen 1993, 1997, 1999). The approach was also used by Narayan et al. (2000a, b) and Narayan and Petesch (2002) in the World Bank’s ‘Voices of the Poor’ study.
12 For a very thoughtful discussion of poverty traps and the links between natural resources and poverty, see Carter and Barrett (2006) and Barrett (2006).
13 The ‘Voices of the Poor’ study provides many examples of non-economic poverty (Narayan et al. 2000a, b; Narayan and Petesch 2002).
14 These villages were among the poorest according to both the BPS and the BKKBN data sets.
15 No data were provided by one village, Lendian Liang Nayuq (in Kecamatan Siluq Ngurai) due to logistic problems.
16 A detailed description of the monitoring, including preparation, training and logistics is given in Cahyat et al. (2007).
17 Some indicators did not include this condition.
18 If all indicators of an index cover the scores 1 (= critical), 2 (= intermediary) and 3 (= good), the boundary between red and yellow of the index is 0.333, and the one separating yellow from green is 0.666. If the indicators only offer choices of 1 (= critical) or 3 (= good), there is only red (up to 0.500) and green (above 0.500). For most indices, we used mixtures of indicators with scores 1, 2, 3 and indicators with scores 1 and 3. Thus, the boundaries between the three colours are slightly different for each index.

�� | Towards Wellbeing: Monitoring Poverty in Kutai Barat, Indonesia
19 The figures become less dramatic when the household data are aggregated at village or at subdistrict level. Due to the softening result of the mathematical averages, the extremes are partially hidden in the poverty maps and the subdistrict charts in Annex VI.
20 The range of the Gini Index is 0 to 100. The closer it is to 100 the greater the disparity.
21 Laham is below the Mahakan rapids, but still difficult to access.
22 One reason mentioned by Kutai villagers was that their lack of Benuaq (Dayak) language skills makes it more difficult to get meetings arranged with decision makers at the kabupaten level. In contrast, their Benuaq compatriots were often favoured by the Benuaq-speaking office staff.
23 Spearman’s Rank Correlation Tests: wealth vs. SWB r = 0.76, vs. health r = 0.70, vs. knowledge r = 0.54.
24 Four of the 5 villages with the best natural environment are on both top-5 lists (household data and satellite imagery analysis); similarly, 3 of 5 villages with the worst natural environment are on both bottom-5 lists.
25 More than 30% of all households said that there are no longer any hornbills or lesser adjutants near their village.
26 �?� The category also includes the establishment of forest gardens (e.g. rattan or rubber) within damaged forests.
27 Although there are no official data, many informants stated that in general at least 30% of project funds are misused.
28 A field trip in late 2006 revealed only one small sawmill between Tering and Ujoh Bilang on the Mahakam. On the other hand, there are still many (illegal) sawmills in neighbouring Kutai Kartanegara.
29 The survey showed a bias against households with ladangs, so the real figure is probably slightly higher.
30 Spearman’s Rank Correlation Tests: wealth vs. social sphere r = 0.68; natural vs. social sphere r = −0.22.
31 In fact, there are four programmes run under the reforestation programme: HRM (Hutan Rakyat Murni, people’s true forest), AUK (Aneka Usaha Kehutanan, various forestry businesses), HRPK (Hutan Rakyat Pola Kebun, people’s agroforest) and Reboisasi (reforestation).
32 A recent case study showed that some Kutai villages are more oriented towards Kutai Kartanegara and the
old capital Tenggarong compared to the more Dayak dominated Sendawar.
33 This could be an artefact due to poor data quality.
34 In the second half of 2004, many of these schools had been closed as a result of the handover of responsibility for education from the provincial level down to kabupaten level. These schools were officially supported by the nearest state SLTP school (teaching material and supervision), although in praxis, many SLTPT were left alone. Although this system offered better access to education in remote areas, the primary school teachers were usually not qualified for this additional job and were severely underpaid.
35 Askes Gakin is a central programme implemented by the districts with support from the province. One problem is the identification of the poor.
36 Askes Gakin is a central programme implemented by the districts with support from the province. One problem is the identification of the poor.
37 However not of all villages, as Hulu Riam and some areas of Dataran Rendah did not benefit from the location of the new kabupaten centre. It is still easier to fly to Hulu Riam from Samarinda than to access the areas directly from Sendawar, the district’s new capital.
38 Spearman’s Rank Correlation Test r = −0.498.
39 The figure is much higher for remote areas.
40 Kruskal–Wallis P = 0.000***. Note that there was no difference in the condition of the natural sphere for households led by widowers or widows and others.
41 People in Hulu Riam rely more on extended subsistence with relatively large rice fields and supplementary fishing and hunting.
42 The sample comprised 20 women’s groups, and 20 male village elite groups. Each group identified the five most relevant problems constraining wellbeing in its village.
43 1999: Rp 370 million; 2000: Rp 3500 million.
44 GSM stands for Gerakan Sendawar Makmur or ‘Prosperous Sendawar Movement’. It is a comprehensive trans-sectoral strategy for improving wellbeing throughout the district. Until 2006, GSM was coordinated by the district’s Dinas Pemberdayaan Masyarakat (Community Empowerment Service).
45 A realistic proposal means: (1) relevant to the priority (which has to be defined first), (2) the budget estimation is according to the standard, and (3) the total does not exceed the ceiling. So, the guidance should consist of: (1) clear priorities, (2) standard costs

Endnotes | ��
and expenditure categories, and (3) budget ceiling both per LG organisations and also per area (kecamatan or villages).
46 Mann–Whitney U-Test was used for comparing mean ranks of core wellbeing and the respective poverty spheres.
47 The Askes Gakin programme supports poor families with free healthcare.
48 Through its Raskin programme, the local government provides poor families with subsidised rice. It is currently sold at about 60–70% of the commercial price of rice.
49 Reform period following the downfall of former President Suharto.
50 See Bupati Kutai Barat (2003). The price increase ranged from 330% (only 66% if compared against rice) for Lai trees (a Durian species) to 3570% for Benggeris trees (an important tree for bee hives; 714% if compared against rice). Data from 1993 are from field notes (Gönner unpublished, see Annex 5).
51 See Colfer (2002) and Gönner (2000).
52 See Gönner and Seeland (2002)
53 This happened frequently in the case of HPHH, when local businessmen lined up with selected locals who officially applied for the mini concessions.
54 The declining social cohesion is not reflected by the monitoring data. This is possibly due to an underreporting of the often sensitive issues and conflicts. However, our in-depth case studies, some of which cover more than 15 years, suggest this trend.
55 ‘Government affair’ = urusan—an area in which the government intervenes or is otherwise involved, but no longer has absolute authority (cf. the pre-decentralisation state of kewenangen, i.e. authority or competence).
56 These capitals or assets are an essential element of the sustainable livelihoods approach (e.g. Chambers and Conway 1991; DFID 2001).
57 SWP = subjective wellbeing; H = health; W = wealth; K = knowledge; N = natural sphere; E = economic sphere; S = social sphere; P = political sphere; I&S = infrastructure and services.


��
referenCes
Andrianto, A. 2006 The role of district government in poverty alleviation: case studies in Malinau and West Kutai districts, East Kalimantan, Indonesia. CIFOR, Bogor, Indonesia. (Available at: http://www.cifor.cgiar.org/publications/pdf_files/Books/BAndrianto0601.pdf)
Andrianto, A., Wollenberg, E., Cahyat, A., Gönner, C., Moeliono, M., Limberg, G. and Iwan. R. 2006 District governments and poverty alleviation in forest areas in Indonesia. Governance Brief No. 30. CIFOR, Bogor, Indonesia. (Available at: http://www.cifor.cgiar.org/Publications/Detail?pid=2001)
Anon. 2006a Data soal Kemiskinan Diragukan: Wapres: Angka-angka Itu Benar. Kompas, 19 Agustus. http://www.kompas.com/kompas-cetak/0608/19/utama/2891993.htm.
Anon. 2006b Data Kemiskinan: Anggurnya Baru Kantongnya Lama... Kompas, 23 Agustus. http://www.kompas.com/kompas- cetak/0608/23/Politikhukum/2900103.htm.
Anon. 2006c Sajikan Data Sebenarnya: BPS Laporkan Mutasi Kemiskinan yang Terjadi Sejak Maret 2006. Kompas, 25 Agustus. http://www.kompas.com/kompas-cetak/0608/25/ekonomi/2903590.htm.
Barrett, C. 2006 Poverty traps and resource dynamics in smallholder agrarian systems. SAGA Working Paper. Cornell University, USA.
BKKBN Kutai Barat 2002 Laporan Pendataan Keluaraga Kabupaten Kutai Barat Tahun 2002. Badan Koordinasi Keluarga Berencana Nasional (BKKBN), Sedawar, Indonesia.
BPS Jakarta 2004a Data dan Informasi Kemiskinan Tahun 2003. Buku 1 Propinsi. Badan Pusat Statistik (BPS), Jakarta, Indonesia.
BPS Jakarta 2004b Data dan Informasi Kemiskinan Tahun 2003. Buku 2 Kabupaten: BPS Jakarta. Badan Pusat Statistik (BPS), Jakarta, Indonesia.
BPS Kutai Barat 2003a Kabupaten Kutai Barat Dalam Angka Tahun 2002. Sendawar, Indonesia. Badan Pusat Statistik (BPS), Sendawar, Indonesia.
BPS Kutai Barat 2003b Produk Domestik Regional Bruto Kutai Barat Tahun 1993-2003. Sendawar, Indonesia. Badan Pusat Statistik (BPS), Sendawar, Indonesia.
Bullinger, C. 2006 Comparison of local government’s policies on Kutai and Dayak Benuaq villages in Kutai Barat, Indonesia: factors influencing village life and household wellbeing since decentralisation. CIFOR, Bogor, Indonesia. (Available at: http://www.cifor.cgiar.org/Publications/Detail?pid=2140)
Bupati Kutai Barat 2003 Keputusan Bupati Kutai Barat Nomor 590/K43/2003 tentang Penetapan Harga Dasar Tanah dan Tanaman Tumbuh dalam Wilayah Kabupaten Kutai Barat.
Cahyat, A. 2004 Bagaimana kemiskinan diukur? Beberapa model penghitungan kemiskinan di Indonesia. Governance Brief No. 2. CIFOR, Bogor, Indonesia. 8p. (Available at: http://www.cifor.cgiar.org/publications/pdf_files/govbrief/GovBrief0402.pdf)
Cahyat, A., Iranon, B., Dalip, D., Tiaka, D., Haripuddin, Tugiono, K., Dau Himang, M.G., Muksin, S., Supiansyah, Yohanis and Gönner, C. 2005 Profil Kampung-Kampung di Kabupaten Kutai Barat: Kondisi Sosial Ekonomi Kampung-kampung. CIFOR, Bogor, Indonesia.
Cahyat, A., Gönner, C. and Haug, M. 2007 Assessing household poverty and wellbeing: a manual with examples from Kutai Barat, Indonesia. CIFOR, Bogor, Indonesia.
Carter, M.R. and Barrett, C.B. 2006 The economics of poverty traps and persistent poverty: an asset-based approach. Journal of Development Studies 42(2): 178–199.

�� | Towards Wellbeing: Monitoring Poverty in Kutai Barat, Indonesia
Chambers, R. and Conway, G.R. 1991 Sustainable rural livelihoods. Practical concepts for the 21st century. IDS Discussion Paper 296. Institute of Development Studies (IDS), Brighton, UK.
CIFOR 2007 Towards wellbeing in forest communities: a source book for local government. Center for International Forestry Research (CIFOR), Bogor, Indonesia.
Colfer, C.J.P. 2002 Ten propositions to explain Kalimantan’s fires. In: Colfer, C.J.P. and Resosudarmo, I.A.P. (eds.) Which way forward? People, forests, and policy making in Indonesia. Resources for the Future, Washington, DC; CIFOR, Bogor, Indonesia; and Institute of Southeast Asian Studies, Singapore.
DFID 2001 Sustainable livelihoods guidance sheets. Department for International Development (DFID), London, UK. (Available at: www.livelihoods.org)
Ediawan, A., Wells, A. and Shepherd, G. 2005 Keterkaitan Kemiskinan dan Kehutanan di Indonesia: Apa Buktinya? Bagaimana Menguatkan Targeting terhadap Masyarakat Miskin di Dalam dan Sekitar Hutan? Briefing Paper No.2. Center for Economic and Social Studies (CESS) and Overseas Development Institute (ODI), Jakarta, Indonesia.
Gönner, C. 2000 Causes and impacts of forest fires: a case study from East Kalimantan, Indonesia. International Forest Fire News 22: 35–40.
Gönner, C. and Seeland, K. 2002 A close-to-nature forest economy adapted to a wider world: a case study of local forest management strategies in East Kalimantan, Indonesia. Journal of Sustainable Forestry 15(4): 1–26.
Gönner, C., Haug, M., Cahyat, A., Wollenberg, L., de Jong, W., Limberg, G., Cronkleton, P., Moeliono, M. and Becker, M. 2007 Capturing nested spheres of poverty: a model for multidimensional poverty analysis and monitoring. Occasional Paper 46. CIFOR, Bogor, Indonesia.
Haug, M. (forthcoming) Poverty and change in East Kalimantan: the impacts of decentralisation on Dayak Benuaq wellbeing and livelihoods. Ph.D. Thesis (draft), Freiburg University, Germany.
Ivanovich, A. 2006. Kemiskinan dan Kebijakan. Opini. Kompas, 22 Agustus. http://www.kompas.com/kompas-cetak/0608/22/opini/2894551.htm.
Khomsan, A. 2006 Yang disebut orang miskin. Opini. Kompas, 25 Agustus. http://www.kompas.com/kompas-cetak/0608/25/opini/2903405.htm.
Komite Penanggulangan Kemiskinan (KPK) 2003 Dokumen Interim Strategi Penanggulangan Poverty, Sebuah Kerangka Proses Penyusunan Strategi Penanggulangan Poverty Jangka Panjang. Jakarta, Indonesia.
Lesmana, T. 2006 Tidak Ada Data Sahih di Republik Ini. Opini. Kompas, 24 Agustus. http://www.kompas.com/kompas-cetak/0608/24/opini/2895600.htm.
Mubyarto, Hamid, E.S., Hudiyanto, Indroyono, P. and Santosa, A. 2003 Laporan Final Penembangan Ekonomi Kerakyatan Kabupaten Kutai Barat. Pusat Studi Ekonomi Pancasila. Universitas Gadjah Mada (UGM), Yogyakarta, Indonesia.
Narayan, D. and Petesch, P. 2002 Voices of the poor: from many lands. Oxford University Press, New York, for the World Bank.
Narayan, D., Patel, R., Schafft, K., Rademacher, A. and Koch-Schulte, S. 2000a Voices of the poor: can anyone hear us? Oxford University Press, New York, for the World Bank.
Narayan, D., Chambers, R., Shah, M.K. and Petesch, P. 2000b Voices of the poor: crying out for change. New York. Oxford University Press, New York, for the World Bank.
Sen, A.K. 1993 Capability and wellbeing. In: Nussbaum, M.C. and Sen, A.K. (eds.) The quality of life, 30–53. Clarendon Press, Oxford, UK.
Sen, A.K. 1997 Editorial: Human capital and human capability. World Development 25 (12): 1959–1961.
Sen, A.K. 1999 Development as freedom. Oxford, Oxford University Press.
Sugema, I. 2006 Data yang Mematikan. Opini. Kompas, 22 Agustus. http://www.kompas.com/kompas-cetak/0608/22/opini/2894501.htm.
UNDP (United Nations Development Programme) 2005 Human development report. Oxford University Press, New York.
World Bank 2000/01 World development report (WDR) 2000/2001: attacking poverty. The World Bank, Washington, DC..
World Bank 2002 A sourcebook for poverty reduction strategies. The World Bank, Washington, DC.
World Bank 2006 World development indicators 2006. The World Bank, Washington, DC. (Available via: http://www.worldbank.org)
Most CIFOR–BMZ publications are available at: http://www.cifor.cgiar.org/Research/Governance/MainActivities/poverty_decentralisation.htm

annexes


��
Main Project Activities Date
Official start of the CIFOR–BMZ Poverty & Decentralization Project May 2003
First official contact between CIFOR and Pemkab Kutai Barat Jun 2003
Compiling poverty data Aug–Dec 2003
First workshop on poverty alleviation activities and poverty definitions in Kutai Barat
Sep 2003
Analysis of local government organisation (structure, budgeting, monitoring system, etc.)
Sep 2003 to Feb 2004
Baseline survey in 20 poor villages and data processing Oct–Dec 2003
Compiling Kutai Barat data (local regulations, budget, forestry trends, etc.) Nov 2003 to Mar 2004
Start of PhD research Jan 2004
Preparation of village profiles Feb–May 2004
Annual meeting of the Indonesia team in Bogor Apr 2004
Development of the NESP poverty and wellbeing concept Apr–Aug 2004
Initial discussion and workshop on monitoring concept Jun 2004
Integration of the poverty monitoring structure into KPK structure Jul 2004
Presentation of monitoring concept at the Bupati’s office Sep 2004
Training of monitoring team Oct 2004
Preparation of the monitoring manual Oct 2004 to Dec 2006
Participation in 5th anniversary celebration of Kutai Barat Nov 2004
First monitoring trial Nov–Dec 2004
Policy study on poverty alleviation efforts in Kutai Barat Nov 2004
MSc study on ethnicity and decentralisation Dec 2004 to Jan 2005
Analysis of first monitoring trial data and meta monitoring Jan 2005
Pilot study on LG programme implementation in Kecamatan Jempang Jan–Apr 2005
annex 1projeCT aCTiviTies

�� | Towards Wellbeing: Monitoring Poverty in Kutai Barat, Indonesia
GSM evaluation Feb 2005
Analysis of pilot study (Kecamatan Jempang) Mar 2005
Annual meeting of the Indonesia team in Bogor Mar 2005
Basic statistics and SPSS training of monitoring team Mar 2005
Meeting of CIFOR team and Bupati with signing of MoU Mar 2005
Training of monitoring team and team of trainers May–June 2005
Second monitoring trial Jun 2005
Data entry training Jul 2005
Preparation of draft Perda (LG Act) on poverty monitoring Jul 2005
Analysis of second monitoring trial data and reality check Jul–Aug 2005
Community monitoring workshop with JARI (an NGO) Aug 2005
Preparation of logistics for official monitoring Aug–Dec 2005
Training of monitoring team Aug 2005
KPK meeting Sep 2005
Training of monitoring team and team of trainers Oct 2005
Training of more than 200 assessors Jan 2006
Official poverty and wellbeing monitoring Feb–Mar 2006
Annual meeting of the Indonesia team in Bukit Bangkirai Mar 2006
Refresher course in SPSS and ArcView for Pemkab Apr 2006
Analysis of monitoring data Apr–Jun 2006
Presentation of monitoring results Jun 2006
New cooperation of CIFOR, GTZ ProBangkit and Pemkab Sep 2006
Presentation of new planning concept at Bappeda Sep 2006
Preparation of final site report Nov 2006 to Feb 2007
Project closing Oct 2007

��
annex 2QuesTionnaire for poverTy and wellbeing MoniToring
Name of Respondent
Name of Head of Household
Name of Village
Name of Subdistrict
Name of Assessor
Household Questionnaire Poverty Monitoring in Kutai Barat District
Household Number
Village Household
Household Number
Date
Village Code (Var 1)
Subdistrict Code (Var 2)
! All of these questions refer to conditions over the last 12 months, and apply only to your household or village. Please provide only one answer for each question.
! Household members include only those living together in one house or those being supported by the household.
Household Base DataCircle the appropriate answers below
Fill in a number in each of these boxes
Var 3 How many people are there in your household?
Var 4 How many families are there in the household?
Var 5 How many living adult males are there in the household?
Var 6 How many living adult females are there in the household?
Var 7 How many living male children (younger than 17 years) are there in the household?
Var 8 How many living female children (younger than 17 years) are there in the household?

�� | Towards Wellbeing: Monitoring Poverty in Kutai Barat, Indonesia
CIRCLE THE APPROPRIATE ANSWERS BELOW WRITE THE CIRCLED NUMBERS IN THE BOXES BELOW
Var 9 What is the ethnic majority of your household?
1 Benuaq, 2 Tunjung, 3 Bahau, 4 Kayan, 5 Kutai, 6 Bentian, 7 Kenyah, 8 Seputan, 9 Bukat, 10 Bakumpai, 11 Oheng, 12 Penihing, 13 Luangan, 14 Buginese, 15 Banjarese, 16 Javanese, 17 Batak, 18 Other
Var 10 Are there any orphans, single mothers or disabled persons in your household?
1 Yes, more than one
2 Yes, only one
3 No
Var 11 Is yours a prosperous household?
1 No, it is not prosperous
2 Fairly
3 Yes, it is prosperous
Health and Nutrition
Var 12 Have there been any shortages of food for more than 1 month during the past 12 months?
1 Yes
3 No
Var 13 Does your household have access to clean drinking water (not necessarily from PDAM)?
1 No
2 Yes, but only sometimes
3 Yes, always
Var 14 In the event of sickness, do members of your household always receive modern medical treatment from a doctor, nurse, midwife, or traditional care from a shaman or healer?
1 Never
2 Sometimes
3 Yes, always
3 Nobody has been sick during the last 12 months
Material Wealth
Var 15 (PLEASE ASSESS FOR YOURSELF, DO NOT ASK) What is the quality of the respondent’s house like?
1 Below standard
2 Standard
3 Above standard
Var 16 (PLEASE ASSESS FOR YOURSELF, DO NOT ASK) Does the household own a motorbike or an outboard engine?
1 No
3 Yes
Var 17 (PLEASE ASSESS FOR YOURSELF, DO NOT ASK) Does the household own a satellite dish or a refrigerator?
1 No
3 Yes
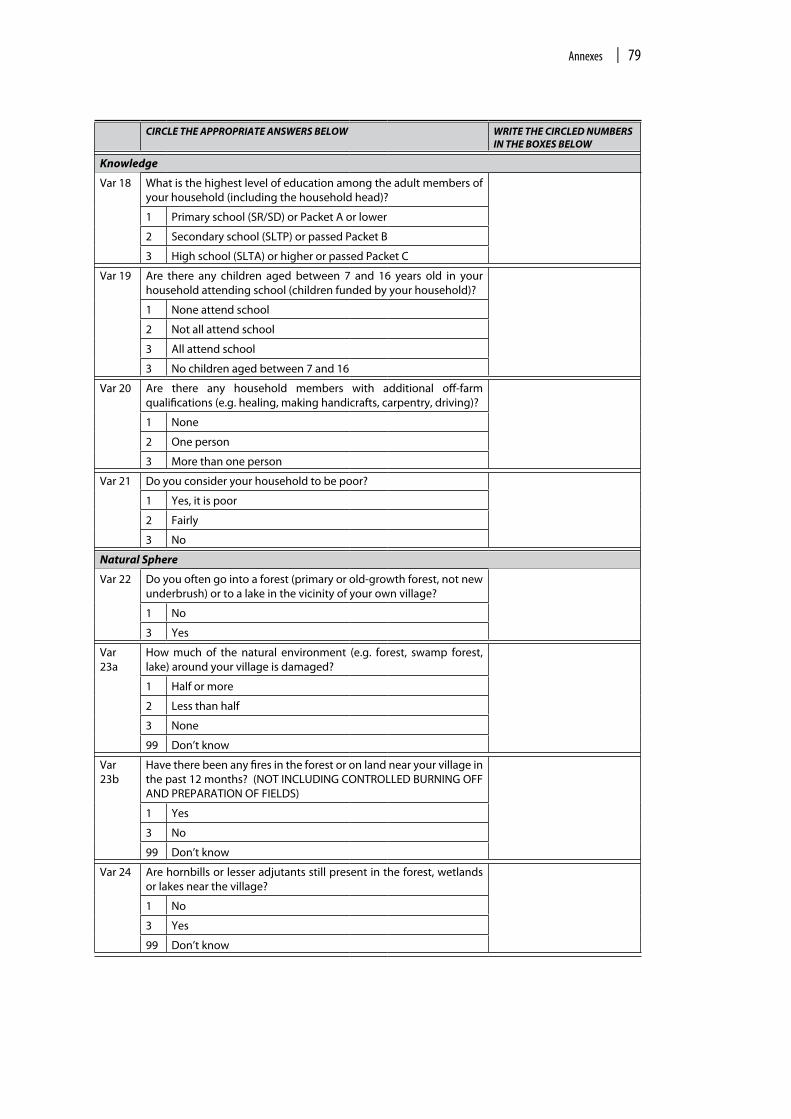
Annexes | ��
CIRCLE THE APPROPRIATE ANSWERS BELOW WRITE THE CIRCLED NUMBERS IN THE BOXES BELOW
Knowledge
Var 18 What is the highest level of education among the adult members of your household (including the household head)?
1 Primary school (SR/SD) or Packet A or lower
2 Secondary school (SLTP) or passed Packet B
3 High school (SLTA) or higher or passed Packet C
Var 19 Are there any children aged between 7 and 16 years old in your household attending school (children funded by your household)?
1 None attend school
2 Not all attend school
3 All attend school
3 No children aged between 7 and 16
Var 20 Are there any household members with additional off-farm qualifications (e.g. healing, making handicrafts, carpentry, driving)?
1 None
2 One person
3 More than one person
Var 21 Do you consider your household to be poor?
1 Yes, it is poor
2 Fairly
3 No
Natural Sphere
Var 22 Do you often go into a forest (primary or old-growth forest, not new underbrush) or to a lake in the vicinity of your own village?
1 No
3 Yes
Var 23a
How much of the natural environment (e.g. forest, swamp forest, lake) around your village is damaged?
1 Half or more
2 Less than half
3 None
99 Don’t know
Var 23b
Have there been any fires in the forest or on land near your village in the past 12 months? (NOT INCLUDING CONTROLLED BURNING OFF AND PREPARATION OF FIELDS)
1 Yes
3 No
99 Don’t know
Var 24 Are hornbills or lesser adjutants still present in the forest, wetlands or lakes near the village?
1 No
3 Yes
99 Don’t know

�0 | Towards Wellbeing: Monitoring Poverty in Kutai Barat, Indonesia
CIRCLE THE APPROPRIATE ANSWERS BELOW WRITE THE CIRCLED NUMBERS IN THE BOXES BELOW
Var 25 During the past 12 months, have any non-timber forest products (e.g. fish, birds, wild animals, birds’ nests, rattan, eaglewood) been extracted to the extent that they have virtually disappeared?
1 Yes, or there are almost no such products left in our area
3 No
99 Don’t know
Var 26 What is water quality like in the nearest river or lake?
1 Poor
2 Reasonable
3 Good
Economic Sphere
Var 27a, 27b & 27c
Which of the following have been the most reliable and important sources of income for your household over the past 12 months? (CHOOSE NO MORE THAN 3)
1 Trading 11 Other fees/compensation
2 Timber fees 12 Village organiser honorarium
3 Civil service or private salary 13 F a r m i n g ( v e g e t a b l e s , coffee, livestock, aquaculture)
4 Support from family
5 Rubber 14 Fish (from a river or lake)
6 Rattan 15 Eaglewood
7 Birds’ nests 16 Hunting
8 Timber 17 Other forest products
9 Handicrafts 18 S e r v i c e s ( t r a d e s m a n , workshop, etc.)
10 Store/shop/kiosk 19 Other (please specify)
Var 28a
How many sources of income do you have?
1 One
3 More than one
Var 28b
Is this/Are these stable sources of income?
1 No steady income source
3 Yes
Var 29 How is rice sufficiency in your household?
1 No provisions, sometimes we are unable to buy rice
2 No provisions, but we can always buy rice despite difficulties
3 We never have trouble buying rice
3 We have sufficient provisions to last until the next harvest

Annexes | ��
CIRCLE THE APPROPRIATE ANSWERS BELOW WRITE THE CIRCLED NUMBERS IN THE BOXES BELOW
Var 49 How difficult is it to secure business loans from DPM, a CU or a bank?
1 Impossible or extremely difficult
2 Difficult but possible
3 Easy
3 Never tried to apply and not interested
Social Sphere
Var 30 How willing are village community members to help each other (doing work or financially)?
1 Not very willing
2 Reasonably willing
3 Very willing
Var 31 How are feelings of mutual trust among community members in the village?
1 Low
2 Medium
3 High (most people are trustworthy)
Var 32 Do conflicts frequently arise between people or families in the village?
1 Yes, frequently
3 Rarely occur
Political Sphere
Var 33 Can you gather natural products (timber, fish, birds’ nests, gold, river rocks, sand, etc.) in the region around your village to sell?
1 Gathering natural products is prohibited
2 Yes, but with difficulty
3 Easily
Var 34 Does your household have daily access to news or information from TV, newspapers or radio?
1 No
2 Yes, from one source
3 Yes, from more than one news / information source
Var 35 Do you or other members of your household participate in decision-making processes in your village (not including decisions made by customary councils in resolving disputes)?
1 Never
2 Sometimes
3 Always
Var 36 Do you consider your household to be happy?
1 No, it is unhappy
2 Reasonably happy
3 Yes, it is happy

�� | Towards Wellbeing: Monitoring Poverty in Kutai Barat, Indonesia
CIRCLE THE APPROPRIATE ANSWERS BELOW WRITE THE CIRCLED NUMBERS IN THE BOXES BELOW
Forest Dependency
Var 37 Did you have any produce from last year’s harvest?
1 No, because we did not plant any crops (CHOOSE [1] IN VAR 38)
3 No, due to crop failure
3 Yes, we harvested this year
Var 38 What was the age of the forest cleared for your swidden field?
1 Do not farm
2 Less than 5 years
3 Between 5 and 10 years
4 Between 10 and 20 years
5 More than 20 years
6 Primary forest that has never been cleared
Var 39 In the past 12 months, have non-timber forest products (e.g. eaglewood, rattan, resin, honey, birds’ nests) been important for your household in terms of income or for your own needs?
1 Not important
2 Important
3 Very important
Var 40 In the past 12 months, has game (e.g. sambar deer, bearded pigs, birds, tortoises, terrapins, fish) been important for your household in terms of income or for your own needs?
1 Not important
2 Important
3 Very important
Infrastructure and Services
Var 41 How difficult is it to get to the nearest secondary school?
1 Very difficult / impossible
2 Difficult, but usually possible
3 Easy
Var 42 What are lessons like in the school that children in the village usually attend?
1 Poor
2 Reasonable
3 Good
Var 43 Are there any school- or college-aged children (6 to 24) in your household who receive scholarships/subsidised education from any source?
1 No
3 Yes
3 No children aged between 6 and 24
Var 44 How difficult is it to get to the nearest health facility (dispensary, community health centre, village birthing clinic, hospital, village midwife, etc.)?
1 Very difficult / impossible
2 Difficult, but usually possible
3 Easy

Annexes | ��
CIRCLE THE APPROPRIATE ANSWERS BELOW WRITE THE CIRCLED NUMBERS IN THE BOXES BELOW
Var 45 How good are the healthcare services where villagers in your community usually go for treatment?
1 Poor
2 Reasonable
3 Good
Var 46 Do you have an Askes Gakin or Askes Kin health insurance card?
1 No
3 Yes
Var 47 Do you have a fuel compensation card?
1 No
3 Yes
Var 48 How often has your household bought Raskin subsidised rice (not rice donated by a company or NGO) over the past 12 months?
1 We frequently buy it
2 We sometimes buy it
3 We never buy it
Var 50 Have any training, agricultural extension, courses or enterprise assistance activities been held in your village over the past 12 months?
1 No
3 Yes
Var 51 In what condition are the roads and bridges leading to the subdistrict town?
1 There are none
2 In bad repair
3 In good condition
Var 52 How difficult is it to get to the nearest market?
1 Very difficult/impossible
2 Difficult, but usually possible
3 Easy
Var 53 Have you received aid for uninhabitable housing in the last 12 months?
1 No
3 Yes
Var 54 In terms of quality and quantity, how have government support programmes been in your village over the last 12 months?
1 Poor
2 Reasonable
3 Good
Var 55 In terms of quality and quantity, how have nongovernment support programmes from companies, organisations, etc., been in your village over the last 12 months?
1 Poor
2 Reasonable
3 Good

�� | Towards Wellbeing: Monitoring Poverty in Kutai Barat, Indonesia
CIRCLE THE APPROPRIATE ANSWERS BELOW WRITE THE CIRCLED NUMBERS IN THE BOXES BELOW
Var 56 How is your access to communications facilities: telephone, cellular phone or radio (walkie-talkie, SSB)?
1 Very difficult / impossible
2 Difficult, but usually possible
3 Easy
Var 57 Can you get spiritual services appropriate to your beliefs or religion?
1 No
3 Yes
Var 58 Are there any sports facilities, tourist objects or other places considered suitable for recreation in the village?
1 No
3 Yes
Var 59 Have you ever heard of GSM?
1 Never
2 Yes, but am not sure what it is
3 I know about GSM and understand its objectives

��
subjeCTive WellbeinG
Do the household members in general have leisure time?
Are you afraid of theft in your village?
Are you afraid of physical violence in your village?
Do you feel your household is included in village life?
Is your household prosperous?
Do you feel your household is respected in your village?
heAlTh And nuTriTion
How often has your household consumed meat, chicken, fish or eggs during the last 12 months?
Has there been a shortage of meat, chicken, fish or eggs of more than 1 month during the last 12 months?
Does your household eat rice every day?
Has there been a shortage of rice of more than 1 month during the last 12 months?
Can your household get clean drinking water?
How many household members were seriously sick during the last 12 months?
Has there been any person with a chronic disease during the last 12 months?
If there are children below the age of 5 years in the household, has there been a child under the ‘garis merah’ [height–weight ratio]?
What kind of treatment is available to your household in case of a sickness?
Has there been any child below the age of 5 years who died during the last 12 months?
Has there been any woman in this household who has died during her pregnancy or while giving birthduring the last 12 months?
WeAlTh
What is the quality of the house like?
Does your household have electricity?
Is your house connected to a water pipe?
annex 3long lisT of wellbeing indiCaTors

�� | Towards Wellbeing: Monitoring Poverty in Kutai Barat, Indonesia
Do the members of your household own separate clothes for daily use and special activities (e.g. school, church/mosque, rituals)?
Does your household own a motorbike or a boat engine?
Does your household own a satellite antenna?
Does your household own a chainsaw or a refrigerator?
KnoWledGe
Are there any adult household members with formal school education?
What is the highest education level among the adult members of your household?
Are there any adult household members with school education higher than SLTA?
If there are children in the age of basic schooling (6 to 16 years), do they attend school?
Have there been children who missed school for more than 2 weeks during the last 12 months?
Are there any adult household members who can read?
Are there any household members with additional off-farm qualifications (e.g. healing, handicraft, carpentry, car driving)?
nATurAl sPhere
In what condition is the forest of your village?
Has there been any forest or vegetation fire (not fires to prepare swiddens!) over the last 12 months?
Do sambar deer (rusa) still occur in the
forest around your village?
If there are still sambar deer, what has been the assumed population change over the last 12 months?
Are there still hornbills in the forest around your village?
If there are still hornbills, what has been the assumed population change over the last 12 months?
What has been the assumed change of the fish population in the village’s rivers/lake over the last 12 months?
Is there still rotan manau (a large diameter rattan species that grows with single stems) in the forest around your village?
If there is still rotan manau, what has been the population change over the last 12 months?
Is the river water used for bathing and washing still clear?
Has there been any shortage of river water (for bathing and washing) during the last 12 months?
Has there been any extraction of non-timber forest products (e.g. fish, birds, wild animals, birds’ nests, rattan, gaharu) during the last 12 months up to a point that the respective resource has virtually disappeared?
How much of the traditionally used land/forest (e.g. swidden agriculture, forest gardens) has been converted to land managed by companies?
eConomiC sPhere
How did the financial income of your household change over the last 12 months? Does your household have other alternatives besides the currently used sources of income?

Annexes | ��
How many different buyers can you sell your produce/products to?
Has your household bought any assets/tools for your work during the last 12 months (e.g. motorbike for selling vegetable, for taxi services or to get to the office)?
Does the household have savings that can easily be exchanged for money?
How many relevant sources of income has your household had during the last 12 months?
Does the household have any income source that is deemed reliable/safe?
How long will your rice stock last from now?
If you did not have a rice field last year, was your household able to buy additional rice?
Does your household cultivate any cash crop or raise livestock (e.g. food crops, rubber, coffee, livestock, fish)?
How many forest gardens does your household own (e.g. rattan gardens, rubber gardens, mixed forest gardens/simpukng)?
If the household owns less than 5 forest gardens, is any of them larger than average?
Did your household prepare a rice field (ladang, sawah, rapak) this year?
If your household did not prepare a rice field (ladang, sawah, rapak) this year, what was the reason?
If your household prepared rice fields this year, how many did it prepare altogether?
If the rice harvest is not enough, is your household able to buy additional rice?
soCiAl sPhere
Can your household get (cash or rice; including help from family) in case of urgent demand?
Would you agree that people in this village are generally willing to help if someone is in need?
Has your household helped anyone else in the village during the last 12 months?
Has your household received any help from someone else in this village during the last 12 months?
How often has your household participated in gotong-royong (collective action) activities during the last 12 months?
What is the level of gotong-royong participation in your village?
Would you agree that people in this village can generally be trusted?
Are conflicts in your village usually settled in a good way?
How often did conflicts break out in your village during the last 12 months?
PoliTiCAl sPhere
Do you or any other household member participate in the decision making of your village?
Does your household feel safe regarding its land tenure?
Can you get timber from the forest for sale or your own use?
Can you get non-timber forest products from the forest (e.g. rattan, honey, gaharu, birds’ nests, game) for sale or your own use?

�� | Towards Wellbeing: Monitoring Poverty in Kutai Barat, Indonesia
If your household prepared rice fields this year, who owns the land used for the rice field?
Can your household get daily news/information?
Is there any dispute with a neighbouring village about the village boundaries?
Is there any official village regulation (Perkam) made by the representative body of the village (BPK)?
infrAsTruCTure And serviCes
Is the health staff always present when needed?
Can the nearest health facility (dispensary, primary healthcentre, clinic) be accessed within 30 minutes by using the locally most common transportation facilities?
Can the health facility be accessed on foot (in 30 minutes)?
Is there any health staff (doctor, nurse, midwife) permanently present in the village or nearby?
Can the nearest clinic (puskesmas/rumah sakit) be accessed within 30 minutes by using the locally most common transportation facilities?
Do the teachers teach all lessons according to the timetable?
Can the nearest secondary school (SLTP) be accessed within 30 minutes by using the locally most common transportation facilities?
Can the SLTP be accessed on foot (in 30 minutes)?
Can the nearest high school (SLTA) be accessed within 30 minutes by using the locally most common transportation facilities?
Do you have access to telecommunication (HT, SSB, HP, Wartel) in your village or close by?
What is the level of commitment of local government staff regarding the people in your village?
How difficult is the access to the Kabupaten (district) centre?
How many markets can be accessed within 30 minutes by using the locally most common transportation facilities?
Can the respective market be accessed on foot (within 30 minutes)?
Can you buy cloths, food or household equipment in the village or close by?

��
Wellbeing aspect Women Common men† Village elite‡
Education 16.35% 19.44% 15.46%
Health 12.50% 9.72% 15.46%
Disaster 10.58% 8.33% 11.34%
Jobs 6.73% 8.33% 6.19%
Clean water 5.77% 2.78% 1.03%
School costs 5.77% 1.39% 3.09%
Assets 5.77% 5.56% 2.06%
Income 5.77% 6.94% 6.19%
Access to natural resources 4.81% 1.39% 4.12%
LG assistance 4.81% 5.56% 10.31%
Market 4.81% 5.56% 3.09%
Awareness 3.85% 4.17% 4.12%
Transport 3.85% 5.56% 8.25%
Cooperation 1.92% 4.17% 0.00%
Housing 1.92% 5.56% 0.00%
Cultural issues 1.92% 1.39% 1.03%
Access to capital 0.96% 0.00% 3.09%
Uncertainty 0.96% 1.39% 0.00%
Electricity 0.96% 2.78% 5.15%
† Men who are not part of the village elite.‡ Members of formal or informal community leadership.
annex 4MosT relevanT ConsTrainTs To rural wellbeing

�0
Plant species 1993 2003 Change compared against change of rice price
Sega (rattan) 7,500 75,000 200%
Jepung (rattan) 4,500 75,000 333%
Semambu (rattan) 3,000 30,000 200%
Cempedak 25,000 101,250 81%
Lai 75,000 247,500 66%
Langsat 10,000 247,500 495%
Rambutan 25,000 118,125 95%
Salak 15,000 50,625 68%
Benggeris 42,000 1,500,000 714%
Rice price (Kecamatan Jempang)
600 3,000
Source: Bupati Kutai Barat (2003), field data from Kabupaten Kutai 1993 (unpublished).
annex 5offiCial CoMpensaTion fees (rp) for seleCTed planT speCies

��
annex 6poverTy and wellbeing bar diagraMs of subdisTriCTs
Long Pahangai
0.00
0.20
0.40
0.60
0.80
1.00
SWB H W K N E S P I & S
Long Apari
0.00
0.20
0.40
0.60
0.80
1.00
SWB H W K N E S P I & S
Long Bagun
0.00
0.20
0.40
0.60
0.80
1.00
SWB H W K N E S P I & S
Long Hubung
0.00
0.20
0.40
0.60
0.80
1.00
SWB H W K N E S P I & S
Long Iram
0.00
0.20
0.40
0.60
0.80
1.00
SWB H W K N E S P I & S
Melak
0.00
0.20
0.40
0.60
0.80
1.00
SWB H W K N E S P I & S
57

�� | Towards Wellbeing: Monitoring Poverty in Kutai Barat, Indonesia
Barong Tongkok
0.00
0.20
0.40
0.60
0.80
1.00
SWB H W K N E S P I & S
Damai
0.00
0.20
0.40
0.60
0.80
1.00
SWB H W K N E S P I & S
Muara Lawa
0.00
0.20
0.40
0.60
0.80
1.00
SWB H W K N E S P I & S
Muara Pahu
0.00
0.20
0.40
0.60
0.80
1.00
SWB H W K N E S P I & S
Jempang
0.00
0.20
0.40
0.60
0.80
1.00
SWB H W K N E S P I & S
Bongan
0.00
0.20
0.40
0.60
0.80
1.00
SWB H W K N E S P I & S
Penyinggahan
0.00
0.20
0.40
0.60
0.80
1.00
SWB H W K N E S P I & S
Bentian Besar
0.00
0.20
0.40
0.60
0.80
1.00
SWB H W K N E S P I & S

Annexes | ��
Linggang Bigung
0.00
0.20
0.40
0.60
0.80
1.00
SWB H W K N E S P I & S
Nyuatan
0.00
0.20
0.40
0.60
0.80
1.00
SWB H W K N E S P I & S
Siluq Ngurai
0.00
0.20
0.40
0.60
0.80
1.00
SWB H W K N E S P I & S
Manor Bulatn
0.00
0.20
0.40
0.60
0.80
1.00
SWB H W K N E S P I & S
Tering
0.00
0.20
0.40
0.60
0.80
1.00
SWB H W K N E S P I & S
Sekolaq Darat
0.00
0.20
0.40
0.60
0.80
1.00
SWB H W K N E S P I & S
Laham
0.00
0.20
0.40
0.60
0.80
1.00
SWB H W K N E S P I & S

CIFOR is a leading international forestry research organisation established in 1993 in response to global concerns about the social, environmental, and economic consequences of forest loss and degradation. CIFOR is dedicated to developing policies and technologies for sustainable use and management of forests, and for enhancing the well-being of people in developing countries who rely on tropical forests for their livelihoods. CIFOR is one of the 15 centres of the Consultative Group on International Agricultural Research (CGIAR). With headquarters in Bogor, Indonesia, CIFOR has offices in Brazil, Bolivia, Burkina Faso, Cameroon, Ethiopia, India, Zambia and Zimbabwe, and it works in over 30 other countries around the world.
DonorsCIFOR receives its major funding from governments, international organizations, private foundations and regional organizations. In 2006, CIFOR received financial support from Australia, Asian Development Bank (ADB), African Wildlife Foundation, Belgium, Canada, Carrefour, Cecoforma, China, Centre de coopération internationale en recherche agronomique pour le développement (CIRAD), Convention on Biological Diversity, Cordaid, Conservation International Foundation (CIF), European Commission, Finland, Food and Agriculture Organization of the United Nations (FAO), Ford Foundation, France, German Agency for Technical Cooperation (GTZ), German Federal Ministry for Economic Cooperation and Development (BMZ), German Foundation for International Cooperation, Global Forest Watch, Indonesia, Innovative Resource Management (IRM), International Institute for Environment and Development, International Development Research Centre (IDRC), International Fund for Agricultural Development (IFAD), International Tropical Timber Organization (ITTO), Israel, Italy, the World Conservation Union (IUCN), Japan, Korea, MacArthur Foundation, Netherlands, Norway, Netherlands Development Organization, Overseas Development Institute (ODI), Peruvian Secretariat for International Cooperation (RSCI), Philippines, Spain, Sweden, Swedish University of Agricultural Sciences (SLU), Switzerland, The Overbrook Foundation, The Tinker Foundation Incorporated, The Nature Conservancy (TNC), Tropical Forest Foundation, Tropenbos International, United States, United Kingdom, United Nations Environment Programme (UNEP), United Nations Educational, Scientific and Cultural Organization (UNESCO), United Nations Forum on Forests (UNFF), Wageningen International, World Bank, World Resources Institute (WRI) and World Wide Fund for Nature (WWF).
Towards Wellbeing: Monitoring Poverty in Kutai Barat, Indonesia
Poverty is a persistent problem throughout Indonesia. Seven years after decentralisation began there is little improvement in the wellbeing of rural people. Local governments have received new opportunities and responsibilities for development, but few districts have the necessary capacity and experience to effectively reduce poverty. This report provides a portrait of household poverty and wellbeing in Kutai Barat, a district that was only established in 1999. The results of a survey of more than 10,000 households from 222 villages, 6 in-depth community studies, remote sensing and several workshops, show which aspects of wellbeing are in critical condition and where interventions are most urgently needed.
The report analyses poverty causes and gives practical recommendations to help the local government improve its development planning and poverty reduction.
This publication is one of three site reports from the study ‘Making local government more responsive to the poor: Developing indicators and tools to support sustainable livelihood development under decentralization’, conducted by CIFOR and partners in the districts of Kutai Barat and Malinau, Indonesia, and in the department of Pando, Bolivia. The reports analyse the impact of decentralisation on human wellbeing in forest-dependent communities and provide practical suggestions to improve local governments’ poverty alleviation policies and actions. The site reports are peer reviewed and published simultaneously on the web in downloadable format (www.cifor.cgiar.org/publications). Contact the project at [email protected] to request a copy.
Review of poverty alleviation and its indicators of forest-dependent rural poor
Towards Wellbeing Monitoring Poverty in Kutai Barat, Indonesia
Towards Wellbeing: Monitoring Poverty in Kutai Barat, Indonesia
01
Towards Wellbeing: Monitoring Poverty in Malinau, Indonesia
02
Towards Wellbeing: Forest Governance and Rural Change in Sena, Bolivia
03
SERIES
Christian Gönner Ade Cahyat Michaela Haug Godwin Limberg
Tow
ards W
ellbein
g: M
on
itorin
g p
overty in
Ku
tai Barat, In
do
nesia
Ch
ristian G
ön
ner | A
de C
ahyat | M
ichaela H
aug
| Go
dw
in Lim
berg