towards thresholds of control flow complexity measures for...
TRANSCRIPT

Towards Thresholds of Control Flow Complexity Measures
for BPMN models Laura Sánchez-González, Francisco Ruiz, Félix
García, Alarcos Research Group, TSI Department, University
of Castilla La Mancha, Paseo de la Universidad, nº4, 13071,Ciudad Real, España
{Laura.Sanchez | Francisco.RuizG | Felix.Garcia}@uclm.es
Jorge Cardoso Dept. Engenharia Informática, University of Coimbra,
ABSTRACT
Business process models are considered to be a good mechanism
for communication among stakeholders and are a key instrument
in the analysis and design of information systems. It is therefore
important to design business process models with a high level of
quality, which can be discovered through measurement
application. Several measurement initiatives exist in the literature,
but these measures are only useful in real world decision making
if we also have criteria with which to establish the goodness of
models. We consider that measures with thresholds and decision
criteria form indicators. Indicators allow us to make decisions by
using the values of the measures which models should not exceed
to ascertain whether the model is good in practice. In this paper
we present the initial empirical results from which thresholds for
the Control-Flow Complexity measure applied in BPMN models
have been obtained according to the Bender method. Our findings
reveal that there are different levels of understandability
depending on the number of decision nodes: a very easily
understandable model would have no more than 6 xor nodes, 1 or
nodes and 1 and nodes, versus the 46 xor nodes, 14 or nodes and
7 and nodes which would constitute a model with a very difficult
level of understandability.
Categories and Subject Descriptors
D.2.8 [Software Engineering]: Metrics – Process metrics
General Terms
Measurement and Experimentation.
Keywords
Business process, measurement, thresholds, indicators.
1. INTRODUCTION Measurement is an important discipline in any type of
engineering, and measurement activities are a good means to
allow organizations to obtain useful information, and to help them
plan and carry out improvement efforts [1]. Measurement also
helps to provide objective information about process and project
performance, process capability and product and service quality.
Process capability is extremely important for organizations
because “the quality of products and services is largely
determined by the quality of the processes used to develop,
deliver and support them”[2].
Several measurement initiatives with which to obtain information
about process quality exist, most of which are shown in [3]. This
study reveals that the majority are applied to conceptual models
(approximately 77% of the initiatives studied) owing to the fact
that models are used for process reengineering and other business-
oriented tasks. The study also reveals that business process
measurement is still an immature subject as a result of limited
empirical validation and the lack of thresholds with which to
analyze measurement results.
In this paper we contribute towards resolving the lack of
thresholds for business process measures. Researchers have
worked on thresholds for others disciplines and all of them agree
on the importance of their definition. Henderson-Sellers
emphasizes the practical utility of thresholds by stating that “an
alarm would occur whenever the value of a specific internal
measure exceeded some predetermined value”[4]. The idea of
extracting thresholds is to use them to identify unsafe design
structures, thus enabling engineers to gauge the threshold values
to avoid obtaining hazardous structures [5]. The problem of
determining appropriate threshold values is made even more
difficult by many factors that may vary from experiment to
experiment [6]. The identification of such threshold values,
therefore, requires methods for quantitative risk assessment [7].
In order to deal with the issues identified above, in this paper we
use a quantitative methodology based on the logistic regression
curve (Bender methodology) [7] to extract thresholds for
Cardoso’s Control-Flow complexity measure (CFC) [8] when
applied to BPMN models [9]. This measure is described as
follows:
The value of CFCAND-split(a) is 1 for each and-split in the
process (since all the transitions from the gateway are executed in
parallel, thus reaching the same state space when they are
Permission to make digital or hard copies of all or part of this work for
personal or classroom use is granted without fee provided that copies
are not made or distributed for profit or commercial advantage and that
copies bear this notice and the full citation on the first page. To copy
otherwise, or republish, to post on servers or to redistribute to lists,
requires prior specific permission and/or a fee.
SAC’11, March 21-25, 2011, TaiChung, Taiwan.
Copyright 2011 ACM 978-1-4503-0113-8/11/03…$10.00.
1445

finalized), the value of CFCXOR-split(a) is calculated as the fan
out of the split (since only one transition can be executed from it
but could be any of the possibilities, so the reachable state space
is therefore the sum of all the transitions), and the value of
CFCOR-split(a) is the result of calculating 2n-1 where n is the fan
out of the split (since the execution of the transitions could
correspond to one, some, or all, so the state space corresponds to
all the possible combinations between the transitions to be
executed). The fan out of the split corresponds to the number of
transitions that start from it.
The statistical method used to extract threshold values is the
“Bender method” defined in [7]. As a result, we obtained
threshold values for the CFC measure, which constitutes an
indicator, as was described in [10]: “an indicator is a measure that
is derived from other measures using an analysis model with
associated decision criteria, which are used to determine the level
of confidence in a given result”.
This paper is organized as follows. In Section 2 we describe work
related to business process measurements and thresholds. In
Section 3 the work method, results and the main lessons learned
and implications regarding business process modeling, are
explained. In Section 4 we present a practical example of using
the thresholds discovered in BPMN models. Finally, in Section 5,
we close with some of the conclusions drawn from this research.
2. RELATED WORKS Various proposals concerning business process measurement can
be found in the literature (see Table 1), but to the best of our
knowledge there are, to date, no proposals in which threshold
values are defined.
Some of the measures shown in Table 1 have been validated, and
some practical usefulness has therefore been obtained. However,
it is also important to know more about the decisions that will be
made with the values of the measures.
This aspect is more mature in the field of software process
measurement, since some proposals concerning thresholds for
well known software engineering measures already exist.
However, there is no consensus on the threshold values for
software measures and perhaps not even for what the best
methods to use in extracting these values are. Some proposals for
thresholds are derived from experience [24-26], but the lack of
scientific support has led to disputes about their values. Some
authors, on the other hand, have used statistical techniques to
obtain thresholds. For example, Shatnawi [27] extracted
thresholds for Object Oriented (OO) measures in order to study
the relationship between OO and error-severity categories. In this
research the author identified thresholds for Coupling between
Objects (CBO), Response for Class (RFC), Weighted Methods
Complexity (WMC), Depth of Inheritance Hierarchy (DIT),
Number of Child Classes (NOC) and Lack of Cohesion of
Methods (LCOM), that can be used to differentiate high-risk
error-proneness classes in the ordinal categorization from the no-
error classes. The author also validated the Bender method, and
found that there are effective thresholds for the measures
analyzed.
Another piece of research was carried out by Benlarbi et al [28].
The authors’ purpose was to predict which classes were likely to
contain a fault through the use of Chidamber and Kemerer
measures [29]. Their findings indicate that there is no value for
the studied measures in which the fault-proneness changes from
being steady to rapidly increasing. However, these results are only
valid for the measures used by the authors, and other models may
potentially lead to different results. In [30], the authors have used
the Bender method and others to extract threshold values, and
have compared the results of each method. They conclude that
methods based on regression models are a useful tool with which
to extract threshold values. The use of this method or of others
depends on the available data.
Table 1. Measures for business process models
Source Measurable Concept Notation
Vanderfeesten et al
[11], [12]
Coupling, cohesion,
connectivity level
Petri net
Rolón et al. [13] Understandability and
modifiability
BPMN
Mendling [14] Error probability EPC
Cardoso [15] complexity Graph
Jung [16] Entropy Petri net
Gruhn and Laue
[17], [18]
complexity UML,
BPMN, EPC
Rozinat and van der
Aalst [19]
compliance model-logs Simulation
Logs
Laue and Mendling
[20]
Structuredness EPC
Meimandi and
Abdul Azim [21]
Activity, control-flow,
data-flow and resource
complexity
BPEL
Bisgaard and van
der Aalst [22]
Extended Control Flow
Complexity, extended
cyclomatic metric and
structuredness
WF-net
Huan and Kumar
[23]
Goodness of models’
respect execution logs
Simulation
logs
3. APPROXIMATION OF THE
THRESHOLD VALUES In this section, we describe the steps followed to obtain a first
approximation of threshold values for the CFC measure. The
experimental data used as input is that of the Bender method. The
results are then obtained. Finally, we show some of the
conclusions about the thresholds extracted in this work.
3.1 Experimental Data The data input used to extract thresholds values has been
generated in 3 experiments with the intention of evaluating which
model factors affect the understandability of models described
with BPMN. More details about these experiments are shown in
[31] and a summary is presented in Table 2.
The experimental material consisted of 15 BPMN models with a
set of comprehension tasks. Each subject was evaluated according
to the time taken, the number of correct answers and efficiency
(relation between time and correct answers) when carrying out
1446

these tasks. A personal opinion about how difficult it was to
understand each model was also requested, with the subjects using
a value of between 1 and 5, where 1 represented very easy and 5
very difficult. Table 3 shows the CFC values for all 15 models,
the median of personal opinion of all the subjects with regard to
each model, and the median value between experiments.
Table 2. Context of experiments
Exp 1 Exp 2 Exp 3
UCLM, Spain
22 subjects (pre
and post graduates)
UCLM, Spain
40 subjects
(pregraduates)
UCLM, Spain,
9 subjects
(postgraduates)
Table 3. CFC value and subjective opinion for each model
mo
del
CF
C
xo
r
CF
C o
r
CF
C
an
d
CF
C
tota
l
Ex
p 1
Ex
p 2
Ex
p 3
Med
ian
1 0 0 0 0 1 1 1 1
2 0 0 0 0 1 1 1 1
3 2 0 0 2 1 1 1 1
4 2 0 0 2 3 3 3 3
5 4 0 0 4 3 2 2.5 2,5
6 4 0 0 4 3 3 3 3
7 5 0 0 5 2.5 2 3 2,5
8 6 1 0 7 3 3 3 3
9 8 0 0 8 3 3 3 3
10 8 0 0 8 4 3.5 4 4
11 9 0 0 9 3 3 3 3
12 22 3 0 25 3 3 3 3
13 18 6 1 25 3 3 3 3
14 25 3 3 31 3 3 3 3
15 23 9 1 33 4 4 4 4
The personal opinion and the complexity of the models – using
CFC values - are directly related. That is to say, the experimental
subjects stated that the models were complex when these models
had a high value of CFC. This means that the CFC measure is
good at predicting the understandability of business process
conceptual models. These results were extracted from a
correlation analysis described in previous works [36].
3.2 Results of Bender Method The Bender Method has been used in “studies in which it is
interesting to assess whether an explanatory factor has a threshold
effect on a specific response variable” [7]. This method was
created to find thresholds in epidemiological studies, but it can
also be used in other fields, including software engineering [28,
32, 33]. It is additionally possible to obtain thresholds of
measures since this method assumes that the risk regarding an
event which has occurred is constant below the threshold value
and that it increases according to a logistic equation. For our
calculations we used the experimental data of the 3 experiments
defined previously in Table 3 in order to find threshold values that
characterize the understandability of BPMN models.
This method uses a logistic regression to determine (in this case)
whether there is a significant relationship between measures and
the understandability of conceptual models. A logistic regression
model is used to describe the association between a binary
response variable and a continuous risk factor [34]. The general
logistic regression model is shown as follows:
In this equation, g(x) is the logit (log odds) function (which is
represented as g(x) = alpha + beta * x), x is the measure (in this
case, CFC), and P(x) is the probability of a model being
understandable. In our case the continuous risk factor would be
the value of CFC in each model and the binary response would be
the average subjective opinion of how understandable the models
are. In our experiments this variable is not binary because it
fluctuates between 1 and 5 but it can be converted into a
dichotomous variable, signifying that it would be 1 when it was
higher than the median and 0 when it was lower [35].
Table 4. Alpha and Beta values of logistic regression equations
CFC Experiment 1 Experiment 2 Experiment 3
alpha beta alpha beta alpha Beta
XOR-
split
1.731 -0.094 2.471 -0.091 1.736 -0.090
OR-
split
1.255 -0.282 2.073 -0.296 1.232 -0.242
AND-
split
1.005 -0.580 1.653 -0.436 0.988 -0.427
CFC
total
1.622 -0.070 2.431 -0.071 1.630 -0.066
Table 5. VARL values for CFC
P0
%
Experiment
1 2 3
XOR-
SPLIT
30 9 18 10
50 18 27 51
90 10 19 44
OR-
SPLIT
30 1 4 2
50 4 7 5
90 12 14 14
AND-
SPLIT
30 1 2 1
50 2 4 2
90 6 9 7
CFC
TOTAL
30 11 22 12
50 23 34 25
90 54 65 58
The method defines a “value of an acceptable risk level (VARL)”.
This value is given by a probability p0. This means that when
measuring CFC values below VARL, the risk of the model being
1447
non-understandable is lower than p0 (for example, p0=0.2). This
value is calculated as follows:
After applying the logistic regression, we obtained alpha and beta
coefficients, which are needed to calculate thresholds. These
alpha and beta values allowed us to obtain VARL values for each
experiment through the application of the formula. Table 5 shows
the acceptable threshold for CFCXOR-split, CFCOR-split, CFCAND-split,
CFCtotal which can be interpreted as, for example, “if the CFCxor-
split value is lower than 9, the risk of the model being non-
understandable is lower than 30%” or “if the CFCOR-split value is
lower than 4, the risk of the model being non-understandable is
lower than 50%”.
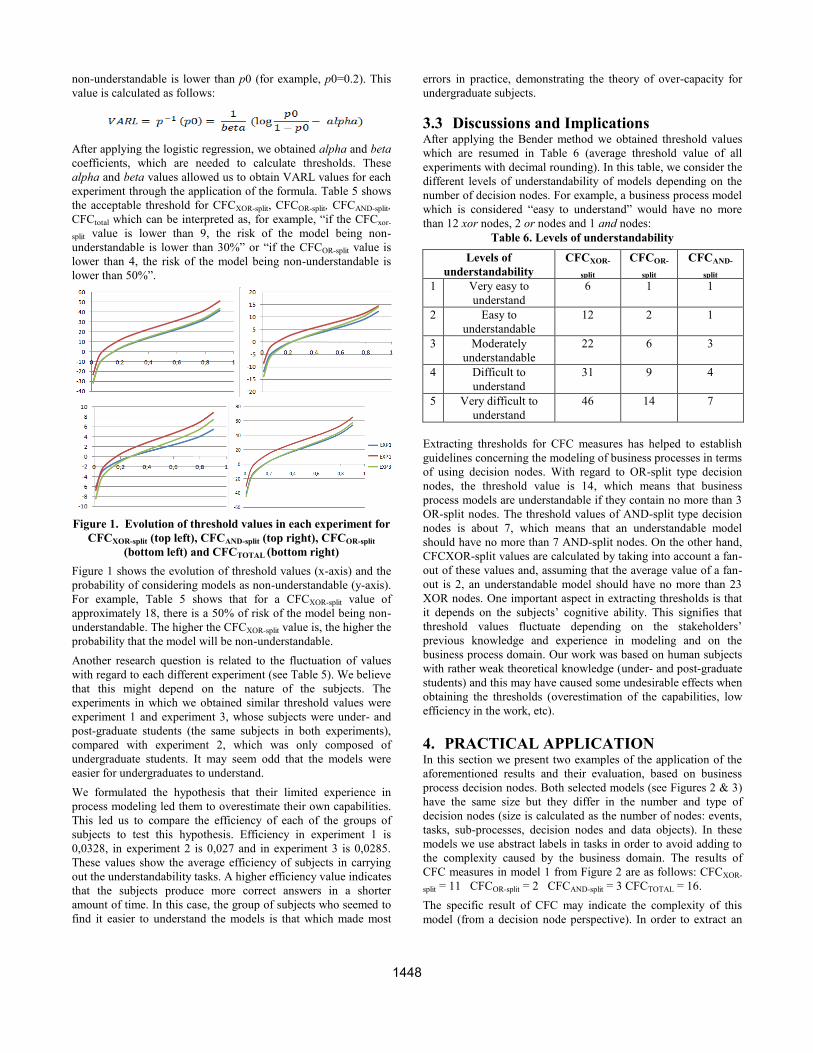
Figure 1. Evolution of threshold values in each experiment for
CFCXOR-split (top left), CFCAND-split (top right), CFCOR-split
(bottom left) and CFCTOTAL (bottom right)
Figure 1 shows the evolution of threshold values (x-axis) and the
probability of considering models as non-understandable (y-axis).
For example, Table 5 shows that for a CFCXOR-split value of
approximately 18, there is a 50% of risk of the model being non-
understandable. The higher the CFCXOR-split value is, the higher the
probability that the model will be non-understandable.
Another research question is related to the fluctuation of values
with regard to each different experiment (see Table 5). We believe
that this might depend on the nature of the subjects. The
experiments in which we obtained similar threshold values were
experiment 1 and experiment 3, whose subjects were under- and
post-graduate students (the same subjects in both experiments),
compared with experiment 2, which was only composed of
undergraduate students. It may seem odd that the models were
easier for undergraduates to understand.
We formulated the hypothesis that their limited experience in
process modeling led them to overestimate their own capabilities.
This led us to compare the efficiency of each of the groups of
subjects to test this hypothesis. Efficiency in experiment 1 is
0,0328, in experiment 2 is 0,027 and in experiment 3 is 0,0285.
These values show the average efficiency of subjects in carrying
out the understandability tasks. A higher efficiency value indicates
that the subjects produce more correct answers in a shorter
amount of time. In this case, the group of subjects who seemed to
find it easier to understand the models is that which made most
errors in practice, demonstrating the theory of over-capacity for
undergraduate subjects.
3.3 Discussions and Implications After applying the Bender method we obtained threshold values
which are resumed in Table 6 (average threshold value of all
experiments with decimal rounding). In this table, we consider the
different levels of understandability of models depending on the
number of decision nodes. For example, a business process model
which is considered “easy to understand” would have no more
than 12 xor nodes, 2 or nodes and 1 and nodes:
Table 6. Levels of understandability
Levels of
understandability
CFCXOR-
split
CFCOR-
split
CFCAND-
split
1 Very easy to
understand
6 1 1
2 Easy to
understandable
12 2 1
3 Moderately
understandable
22 6 3
4 Difficult to
understand
31 9 4
5 Very difficult to
understand
46 14 7
Extracting thresholds for CFC measures has helped to establish
guidelines concerning the modeling of business processes in terms
of using decision nodes. With regard to OR-split type decision
nodes, the threshold value is 14, which means that business
process models are understandable if they contain no more than 3
OR-split nodes. The threshold values of AND-split type decision
nodes is about 7, which means that an understandable model
should have no more than 7 AND-split nodes. On the other hand,
CFCXOR-split values are calculated by taking into account a fan-
out of these values and, assuming that the average value of a fan-
out is 2, an understandable model should have no more than 23
XOR nodes. One important aspect in extracting thresholds is that
it depends on the subjects’ cognitive ability. This signifies that
threshold values fluctuate depending on the stakeholders’
previous knowledge and experience in modeling and on the
business process domain. Our work was based on human subjects
with rather weak theoretical knowledge (under- and post-graduate
students) and this may have caused some undesirable effects when
obtaining the thresholds (overestimation of the capabilities, low
efficiency in the work, etc).
4. PRACTICAL APPLICATION In this section we present two examples of the application of the
aforementioned results and their evaluation, based on business
process decision nodes. Both selected models (see Figures 2 & 3)
have the same size but they differ in the number and type of
decision nodes (size is calculated as the number of nodes: events,
tasks, sub-processes, decision nodes and data objects). In these
models we use abstract labels in tasks in order to avoid adding to
the complexity caused by the business domain. The results of
CFC measures in model 1 from Figure 2 are as follows: CFCXOR-
split = 11 CFCOR-split = 2 CFCAND-split = 3 CFCTOTAL = 16.
The specific result of CFC may indicate the complexity of this
model (from a decision node perspective). In order to extract an
1448

evaluation of the complexity of this model we use the average
threshold values obtained in the previous sections:
CFCXOR-split = 11 there is a probability of 21% that the
model will be non-understandable
CFCOR-split = 3 there is a probability of 25% that the model
will be non-understandable
CFCAND-split = 3 there is a probability of 42% that the model
will be non-understandable
CFCTOTAL = 16 there is a probability of 24% that the model
will be non-understandable
Figure 2. Example model 1
Figure 3. Example model 2
The first model illustrates a low complexity related to decision
nodes, specifically in the second level of understandability (easily
understandable) and it is therefore possible that stakeholders will
find this model easy to understand. On the other hand, Figure 3
shows another example of a business process model in which the
CFC value is higher.
The CFC values for model 2 in Figure 3 are the following:
CFCXOR-split = 18 CFCOR-split = 7 CFCAND-split = 4 CFCTOTAL = 29
These values can be used to obtain the following conclusions
about the model:
CFCXOR-split = 18 there is a probability of 24% that the
model will be non-understandable
CFCOR-split = 7 there is a probability of 48% that the model
will be non-understandable
CFCAND-split = 4 there is a probability of 54% that the
model will be non-understandable
CFCTOTAL = 29 there is probability of 42% that the model
will be non-understandable
The second model is in third level of understandability,
“moderately understandable”. It has more decision nodes, and this
leads to an increase in the probability of finding the model non-
understandable. If both models are compared, then the first is
considered to be better because it has a lower level of difficulty of
understandability. In consequence, if the size is kept constant,
factors relating to complexity seem to be the most significant.
After analyzing these models we deduced that the number and
type of decision nodes are directly related to complexity.
Although other factors should also be considered, it is possible to
use the CFC measure to check the complexity of BPMN models,
which implies that there is a starting point for improvement.
5. CONCLUSIONS AND FUTURE WORKS In this paper we have investigated threshold values for business
process measures and Cardoso’s Control-Flow complexity
measure. We have used the Bender method to extract threshold
values. Our findings demonstrate that it is possible to obtain
thresholds for the CFC measure by following the Bender method.
We obtained different threshold values for each experiment but
we believe that this may have been as a result of the experimental
subjects’ different theoretical and practical backgrounds. In this
case, all the subjects received the same introductory course to the
BPMN notation, but their background in other similar modeling
languages may have affected the results. Our findings reveal that a
business process model should have no more than 31 decision
nodes if an increased difficulty in understanding is to be avoided.
There should be about 22 xor decision nodes, which are those
most frequently used in BPMN models, while no more than 6 or
decision nodes and no more than 3 and decision nodes should be
used.
In future research we will enlarge the validation of these threshold
values by applying them in new experiments with human subjects
with different backgrounds and knowledge. Moreover, it would be
interesting to apply this method to other business process
measures in order to obtain a group of indicators, because
measuring the complexity of models requires consideration of
many aspects that are not covered with a single measure, as in this
case is the analyzed measure, CFC. These indicators might serve
as a useful guide to obtain high-quality conceptual models.
6. ACKNOWLEDGMENTS This work was partially funded by projects INGENIO (Junta de
Comunidades de Castilla-La Mancha, PAC08-0154-9262),
ESFINGE (Ministerio de Educación y Ciencia, FEDER,
TIN2006-15175-C05-05) and PEGASO/MAGO (Ministerio de
Ciencia e Innovación, FEDER, TIN2009-13718-C02-01).
7. REFERENCES [1] Park, R.E., W.B. Goethert, and W.A. Florac, Goal-Driven
software Measurement: A Guidebook. HANDBOOK
CMU/SEI-96-HB-002, 1996.
[2] OMG. Business Process Maturity Model (BPMM), Beta 1
Adopted Specification. 2007; Available from:
http://www.omg.org/docs/dtc/07-07-02.pdf.
[3] Sánchez, L., F. García, F. Ruiz, and M. piattini,
Measurement in Business Processes: a Systematic Review.
Business process Management Journal, 2010. 16(1): p. 114-
134.
1449
[4] Henderson-Sellers, B., Object-Oriented Metrics: Measures
of Complexity. Prentice-Hall, 1996.
[5] Shatnawi, R., W. li, J. Swain, and T. Newman, Finding
Software Metrics Threshold values using ROC Curves.
Sofware Maintenance and Evolution: Research and Practice,
2009.
[6] Churchill, G.A. and R.W. Doerge, Empirical Threshold
Values for Quantitative Trait Mapping. Genetics Society of
America, 1995. 138: p. 963-971.
[7] Bender, R., Quantitative Risk Assessment in
Epidemiological Studies Investigatin Threshold Effects.
Biometrical Journal, 1999. 41(3): p. 305-319.
[8] Cardoso, J., Process control-flow complexity metric: An
empirical validation. SCC '06: Proceedings of the IEEE
International Conference on Services Computing, 2006: p.
167--173.
[9] OMG. Business Process Modeling Notation (BPMN), Final
Adopted Specification. 2006; Available from:
http://www.omg.org/bpm.
[10] García, F., M. Bertoa, C. Calero, A. Vallecillo, F. Ruiz, M.
Piattini, and M. Genero, Towards a Consistent Terminology
for Software Measurement. Information and Software
Technology, 2005. 48: p. pg 631-644.
[11] Vanderfeesten, I., H.A. Reijers, and W.M.P. van der Aalst,
Evaluating Workflow Process Designs using Cohesion and
Coupling Metrics. Computer in Industry, 2008.
[12] Vanderfeesten, I., H.A. Reijers, J. Mendling, W.M.P. van
der Aalst, and J. Cardoso, On a Quest for Good Process
models: the Cross Conectivity Metric. International
Conference on Advanced Information Systems Engineering,
2008.
[13] Rolón, E., F. García, and F. Ruiz, Evaluation Measures for
Business Process Models. Simposioum in Applied
Computing SAC06, 2006.
[14] Mendling, J., Testing Density as a complexity Metric for
EPCs, in Technical Report JM-2006-11-15. 2006.
[15] Cardoso, J., How to Measure the Control-Flow Complexity
of Web Processes and Workflows, in Workflow Handbook
2005. 2005.
[16] Jung, J.Y., Measuring entropy in business process models.
International Conference on Innovative Computing,
Information and Control, 2008. 0: p. 246-252.
[17] Gruhn, V. and R. Laue, Complexity Metrics for business
Process Models. International Conference on Business
Information Systems, 2006.
[18] Gruhn, V.a.L., R., Adopting the Cognitive Complexity
Measure for Business Process Models. Cognitive
Informatics, 2006. ICCI 2006. 5th IEEE International
Conference on, 2006. 1: p. 236--241.
[19] Rozinat, A. and W.M.P. van der Aalst, Conformance
checking of processes based on monitoring real behavior.
Information Systems, 2008. 33: p. 64--95.
[20] Laue, R. and J. Mendling, Structuredness and its
Significance for Correctness of Process Models.
Information Systems and E-Business Management, 2009.
[21] Meimandi Parizi, R. and A.A.A. Ghani, An Ensemble of
Complexity Metrics for BPEL Web Processes. Ninth ACIS
International Conference on Software Engineering,
Artificial Intelligence, Networking, and Parallel/Distributed
Computing, 2008: p. 753-758.
[22] Bisgaard Lassen, K. and W. Van der Aalst, Complexity
Metrics for Workflow Nets. Information and Software
Technology, 2008: p. 610-626.
[23] Huan, Z. and A. Kumar, New quality metrics for evaluating
process models. Business Process Intelligence workshop,
2008.
[24] McCabe, T.J., A Complexity Measure. IEEE Transactions
on Software Engineering, 1976. SE-2(4): p. 308-320.
[25] Nejmeh, B.A., NPATH: a Measure of Execuion Path
Complexity and its Applications. ACM, 1988. 31(2): p.
188-200.
[26] Coleman, D., B. Lowther, and P. Oman, The Application of
Software Maintainability Models in Industrial Software
Systems. Journal of Systems and Software, 1995. 29(1): p.
3-16.
[27] Shatnawi, R., A Quantitative Investigation of the
Acceptable Risk levels of Object-Oriented Metrics in Open-
Source Systems. IEEE Transactions on Software
Engineering, 2010. 36(2): p. 216-225.
[28] Benlarbi, S., K. El-Emam, N. Goel, and S. N.Rai,
Thresholds for Object-Oriented Measures. Institute for
Information Technology, National Research Council
Canada, 2000.
[29] Chidamber, S.R. and C.F. Kemerer, A Metrics Suite for
Object Oriented Design. IEEE Transactions on Software
Engineering, 1994. 20(6): p. 476-493.
[30] Grouven, U., H. Küchenhoff, P. Shräder, and R. Bender,
Flexible regression models are useful tools to calculate and
assess threshold values in the context of minimum provider
volumes. Journal of Clinical Epidemiology, 2007. 61: p.
1125-1131.
[31] ExperimentsURL,
http://alarcos.inf-cr.uclm.es/bpmnexperiments/. 2009.
[32] Shatnawi, R., An Investigation of CK Metrics Thresholds.
ISSRE Supplementary Conference Proceedings, 2006.
[33] Erni, K. and C. Lewerentz, Applying Design-metrics to
Object-Oriented Frameworks. Proceedings of METRICS,
96, 1996: p. 64-74.
[34] Hosmer, D. and S. Lemeshow, Applied Logistic Regression
(2nd edn). Wiley-InterScience, 2000.
[35] Royston, P., G.A. Douglas, and W. Sauerbrei,
Dichotomizing continuous predictors in multiple regression:
a bad idea. Statistics in Medicine, Wiley InterScience, 2005.
25: p. 127-141.
[36] Rolon, E., L. Sanchez, F. Garcia, F. Ruiz, M. Piattini, D.
Caivano, and G. Visaggio, Prediction Models for BPMN
Usability and Maintainability. BPMN 2009 - 1st
International Workshop on BPMN, 2009: p. 383-390
1450