towards the automatic selection of optimal seam line
TRANSCRIPT

This article was downloaded by: [Tsinghua University], [Le Yu]On: 02 November 2011, At: 03:22Publisher: Taylor & FrancisInforma Ltd Registered in England and Wales Registered Number: 1072954 Registeredoffice: Mortimer House, 37-41 Mortimer Street, London W1T 3JH, UK
International Journal of RemoteSensingPublication details, including instructions for authors andsubscription information:http://www.tandfonline.com/loi/tres20
Towards the automatic selection ofoptimal seam line locations whenmerging optical remote-sensing imagesLe Yu a , Eun-Jung Holden b , Michael Charles Dentith b & HankuiZhang aa Institute of Space Information Techniques, Department of EarthSciences, Zhejiang University, 310027, Hangzhou, PR Chinab Centre for Exploration Targeting, School of Earth andEnvironment, The University of Western Australia, Crawley,Western Australia, 6009, Australia
Available online: 02 Nov 2011
To cite this article: Le Yu, Eun-Jung Holden, Michael Charles Dentith & Hankui Zhang (2011):Towards the automatic selection of optimal seam line locations when merging optical remote-sensing images, International Journal of Remote Sensing, DOI:10.1080/01431161.2010.545083
To link to this article: http://dx.doi.org/10.1080/01431161.2010.545083
PLEASE SCROLL DOWN FOR ARTICLE
Full terms and conditions of use: http://www.tandfonline.com/page/terms-and-conditions
This article may be used for research, teaching, and private study purposes. Anysubstantial or systematic reproduction, redistribution, reselling, loan, sub-licensing,systematic supply, or distribution in any form to anyone is expressly forbidden.
The publisher does not give any warranty express or implied or make any representationthat the contents will be complete or accurate or up to date. The accuracy of anyinstructions, formulae, and drug doses should be independently verified with primarysources. The publisher shall not be liable for any loss, actions, claims, proceedings,

demand, or costs or damages whatsoever or howsoever caused arising directly orindirectly in connection with or arising out of the use of this material.
Dow
nloa
ded
by [
Tsi
nghu
a U
nive
rsity
], [
Le
Yu]
at 0
3:22
02
Nov
embe
r 20
11

International Journal of Remote SensingiFirst, 2011, 1–15
Towards the automatic selection of optimal seam line locations whenmerging optical remote-sensing images
LE YU∗†, EUN-JUNG HOLDEN‡, MICHAEL CHARLES DENTITH‡ andHANKUI ZHANG†
†Institute of Space Information Techniques, Department of Earth Sciences, ZhejiangUniversity, 310027 Hangzhou, PR China
‡Centre for Exploration Targeting, School of Earth and Environment, The University ofWestern Australia, Crawley, Western Australia 6009, Australia
(Received 16 November 2009; in final form 23 September 2010)
Image mosaicking is an important task in remote sensing due to the need forimagery with a greater spatial extent than provided by individual scenes. Mergingof images requires the selection of a seam line within their area of overlap alongwhich the scenes are merged. The seam line has a better chance of being invisibleif it lies in regions where the images to be merged are very similar. The automaticdetection of an optimal seam line is not a trivial task as it is difficult to find laterallycontinuous regions with high image similarity, and to identify image similaritieswhen there are variations in the images, for example due to different illumina-tions or viewing directions, or shadow differences of tall structures. This articlepresents an automatic seam line location technique for remote-sensing images andachieves the following three objectives: to trace along the locations with minimalimage difference so that the merged data set appears seamless; to avoid creating dis-continuities within salient features within the images; and to ensure that the moreaccurate radiometric values that are associated with the least distance from thenadir point are better preserved in the mosaic image. Therefore, our method usespixel-based image similarity measurement to choose the locations with high colour,edge and texture similarity; a region-based saliency map that is based on a humanattention model to identify and avoid the areas with visibly dominant foregroundobjects; and location preference to encourage the seam line to lie as close as pos-sible to an equal distance from the two nadir points of the images being merged.These measures are used as input to a cost function and the estimated costs areused to guide the tracing of the seam line in a dynamic programming algorithm.Our experiments demonstrate that the consideration of a combination of factorsproduces superior results to using just one or two of the variables as controls whenmerging high-resolution images containing complex structures.
1. Introduction
Automated seamless merging of several individual overlapping data sets to form alarger image is an active area of research in the fields of remote sensing, photogramme-try (Afek and Brand 1998, Kerschner 2001, Bielski et al. 2007, Pan et al. 2009a, b) and
*Corresponding author. Email: [email protected]. Now at: Center for EarthSystem Science, Institute for Global Change Studies, Tsinghua University, 100084 Beijing,PR China
International Journal of Remote SensingISSN 0143-1161 print/ISSN 1366-5901 online © 2011 Taylor & Francis
http://www.tandf.co.uk/journalshttp://dx.doi.org/10.1080/01431161.2010.545083
Dow
nloa
ded
by [
Tsi
nghu
a U
nive
rsity
], [
Le
Yu]
at 0
3:22
02
Nov
embe
r 20
11

2 L. Yu et al.
computer vision (Peleg 1981, Duplaquet 1998, Soille 2006, Zomet et al. 2006, Jia andTang 2008, Mills and Dudek 2009). The objective is to create a single large image bystitching together (mosaicking) a series of spatially overlapping images whilst ensuringthat the transition from one image to another image is invisible (Kerschner 2001). Theboundary line that exists at the junction between any two images is referred to as theseam line.
Ideally, the transition between regions originally comprising different data setsshould be invisible. If this is not the case it may be necessary to apply a feather-ing or blending process to conceal discontinuities in the merged data set. During theblending, the original radiometric values can be altered significantly, especially whena wide buffer zone is used to smooth the pixel values near the seam line. In manyremote-sensing applications, radiometric values are used to interpret scenes, for exam-ple, various spectral methods are used to identify geological units, vegetation or water.Thus, the altered radiometric values in the buffer zone can lead to a false interpreta-tion of the merged data set. Thus, such feathering and blending processes may not besuitable for applications where the preservation of original radiometric information isimportant (Bielski et al. 2007).
The location of the seam line critically influences how effectively (seamlessly) anytwo data sets can be merged and various methods have been proposed to automaticallydetermine the optimal position and geometry of the seam line. These methods arebased on identifying regions where the data sets to be merged are most similar interms of various characteristics (Zobrist et al. 1983, Hood et al. 1989, Hummer-Miller1989, Shiren et al. 1989, Afek and Brand 1998, Kerschner 2001, Bielski et al. 2007).These techniques measure the similarity of the relevant parts of each data set usingone or multiple image cue(s) such as colour, edge or texture. Also needing to be takeninto consideration is that within each scene, pixel quality decreases with distance fromthe data’s nadir point; thus a seam line within the overlapping area should be as closeas possible to the nadir points of the two images (Kerschner 2001).
Methods for locating seam lines using pixel-based information do not consider thesemantic meaning of the image content (Hwang and Chien 2008). As a result, manualintervention may be required for some data sets. For example, the same geographicallocation may appear differently in high-resolution images captured from aerial pho-tography if the images are captured from different viewing angles. A tall structure suchas a building may be photographed from directly overhead in one image, but the viewmay be oblique in an adjacent image such that the building’s shadow and a part ofthe exterior are visible. In this case, a seam line detection method based on image fea-ture similarity may trace the path along a building’s boundaries, which are commonto both images, but may cut through the adjacent shadow or the view of the building’swalls, resulting in a visually undesirable output.
Here we propose a seam line detection method that adapts and extends previouslydescribed approaches. This method combines pixel-scale similarities of image charac-teristics including colour, texture and edge strength; image saliency based on a humanattention model (Koch and Ullman 1985, Itti et al. 1998) that identifies and avoidsdistinct objects within the scene; and the distance between a pixel and the data set’snadir points. These constraints are combined to calculate a cost function to guide adynamic programming algorithm to trace the position of the seam line. Note that wedo not employ a feathering or blending process that changes the original radiometricinformation in the overlapping area.
Dow
nloa
ded
by [
Tsi
nghu
a U
nive
rsity
], [
Le
Yu]
at 0
3:22
02
Nov
embe
r 20
11
Automatic location of seam lines 3
2. Related work
Many methods have been reported to locate a suitable seam line between two mergeddata sets (Milgram 1977). One established approach is to have the seam line cuttingthrough regions with the same or similar data values in both images or following edgesthat are common to both images (Duplaquet 1998). A commonly used method is toidentify a line which lies within regions in which the colour similarity between the twoinput images is maximal (Milgram 1975, Peleg 1981, Efros and Freeman 2001). Inpractice, a continuous maximal similarity line does not always exist within the images(Suen et al. 2006), and this will result in the output containing some discontinuities,which will require feathering or blending to enhance the appearance of the mergeddata set (Uyttendaele et al. 2001, Zomet et al. 2006). Gradient information is alsowidely used during mosaicking (Zomet et al. 2006). The intention is to find com-mon edges to avoid the seam line cutting through salient objects in images (Soille2006). Various edge detectors, including well-known filters such as Sobel (Davis 1975)and Canny (Canny 1986), can be used to automatically identify structure boundaries.Yet another approach uses texture analysis to influence the location of seam lines.Recently, a mathematical morphology-based technique was proposed to automati-cally find texture boundaries (Soille 2006). This technique was used to mosaic over 800Landsat Enhanced Thematic Mapper Plus (ETM+) images covering Europe (Bielskiet al. 2007). The logical progression for such methods is to use multiple image featuresto locate seam lines. A weighted combination of colour and gradient similarities hasbeen used (e.g. Duplaquet 1998, Kerschner 2001) to trace along the locations withhigh similarity. Weights may be varied depending on the characteristics of the images.
Regardless of how image similarity is measured, to avoid artefacts in the mergeddata it is essential to trace a continuous line of pixels of high similarity across the over-lapping area (Duplaquet 1998). For this process, Dijkstra’s algorithm (Dijkstra 1959)has been used to detect the optimal seam line (Afek and Brand 1998, Davis 1998),which is denoted by the shortest path (minimal cost path) in a weighted graph/image.However, using Dijkstra’s algorithm for seam-line tracing is time consuming, becauseit needs to be used in an iterative way. Kerchner (2001) proposed a ‘two snake’ methodto determine an optimal seam line. In the ‘two snake’ algorithm, two active con-tours (called ‘snakes’) are created starting from the opposite edges of the overlappingarea. These lines are extrapolated across the overlapping area and change their shapeto attract each other until they are merged into one, when the maximum similarityis reached. The disadvantage of this method is the high computation load (Chonand Kim 2006). An alternative method is dynamic programming-based optimal pathsearching strategy, which has proved to be efficient for locating seam lines (Milgram1975, 1977, Davis 1998, Duplaquet 1998, Efros and Freeman 2001, Chon and Kim2006).
3. The proposed approach
Our aim is to generate a merged output that avoids discontinuities within salient fea-tures while following the conventional method in tracing the locations of high imagesimilarity in the overlapping regions, as well as keeping the seam line points as close aspossible to their nadir points to ensure the quality of the output image. Our approachuses a method which consists of three separate components: (1) an image similarityanalysis that measures image similarity in terms of colour, edge strength and tex-ture; (2) a saliency analysis that identifies the locations of features of significance; and
Dow
nloa
ded
by [
Tsi
nghu
a U
nive
rsity
], [
Le
Yu]
at 0
3:22
02
Nov
embe
r 20
11

4 L. Yu et al.
Input image pair
Post-processing
Output image
Appearance similarity constraint(colour, edge, texture)
Saliencyconstraint
Combinations
Seam-line tracing
Locationconstraint
Figure 1. An overview of the approach described in this study.
(3) a location preference analysis that encourages the seam line to be close to the nadirpoints of the data sets being merged. The proposed approach is illustrated in figures 1and 2. The ‘post-process’ mentioned in figure 1 refers to the two images being stitchedtogether along a selected seam line; other processes are described in the followingsubsections.
3.1 Input
Our study assumes that the input images have already been radiometrically correctedbased on an atmosphere radiation model or by other global correction methods (Duet al. 2001, Hewson et al. 2005, Scheidt et al. 2008, Bindschadler et al. 2008); and allimages are geometrically aligned into the same geo-reference frame using a geometricregistration technique (Afek and Brand 1998, Yu et al. 2008).
3.2 Image similarity constraints
The image similarity constraint is determined by considering of three factors: colour,edge and texture. Note that their similarities are measured by differences: the smallerthe differences in colour, edge or texture, the greater are the similarities.
3.2.1 Colour similarity. This process uses the IHS (intensity, hue and saturation)colour space to measure colour and intensity similarities. The RGB colour pixels areconverted to the IHS space where intensity is denoted as I I, hue as IH. Next, inten-sity difference (δI) and hue difference (δH) are calculated using equations (1) and (2),respectively.
δI(i, j) = abs(I I1(i, j) − I I
2(i, j)) (1)
δH(i, j) = min(abs(IH1 (i, j) − IH
2 (i, j)), 360 − abs(IH1 (i, j) − IH
2 (i, j))), (2)
where I1(i, j) and I2(i, j) refer to the intensities or hues at the location (i, j) of the twoinput images 1 and 2, respectively.
Dow
nloa
ded
by [
Tsi
nghu
a U
nive
rsity
], [
Le
Yu]
at 0
3:22
02
Nov
embe
r 20
11

Automatic location of seam lines 5
Input images
Image 1 (I1)
Saliency of I2
Saliency of I1
Image 2 (I2)
Colour Intensity Orientation Colour Intensity Orientation
Producesaliencymap
δ I δH δE δT δS δDδT
Produceimagesimilarities
Intensitysimilarity
Huesimilarity
Edgesimilarity
c C
Total cost image
Seam-linetracing by us-ing dynamicprogramming
Cost image after dynamicprogramming, overlappedwith a minimum cost line(seam line)
Texturesimilarity
Saliencyconstraint
Locationconstraint
I1
I1S I2
S
I2
Figure 2. The proposed seam-line detection process.
3.2.2 Edge similarity. Edges are calculated from the intensity component of eachimage. Various edge detectors were tested in this study, including Sobel (Davis 1975),Roberts (Roberts 1965), morphological edge detector (Owens 1997), the Canny edgedetector (Canny 1986) and the phase congruency edge detector of Kovesi (1993).However, the final seam line results did not differ significantly for the different edge-detection algorithms. We calculated edges for each intensity image denoted as IE usingthe Canny edge detector. Edge difference (δE) is calculated using equation (3):
δE(i, j) = abs(IE1 (i, j) − IE
2 (i, j)). (3)
3.2.3 Texture similarity. In our implementation, an entropy filter, with a neighbour-hood size of 3 × 3 pixels, is used to determine local textural characteristics (IT). Imageentropy (Gonzalez et al. 2003) is a measure of randomness of data values based on theimage histogram and is determined using equation (4):
Dow
nloa
ded
by [
Tsi
nghu
a U
nive
rsity
], [
Le
Yu]
at 0
3:22
02
Nov
embe
r 20
11
6 L. Yu et al.
IT = −∑
p log2 p, (4)
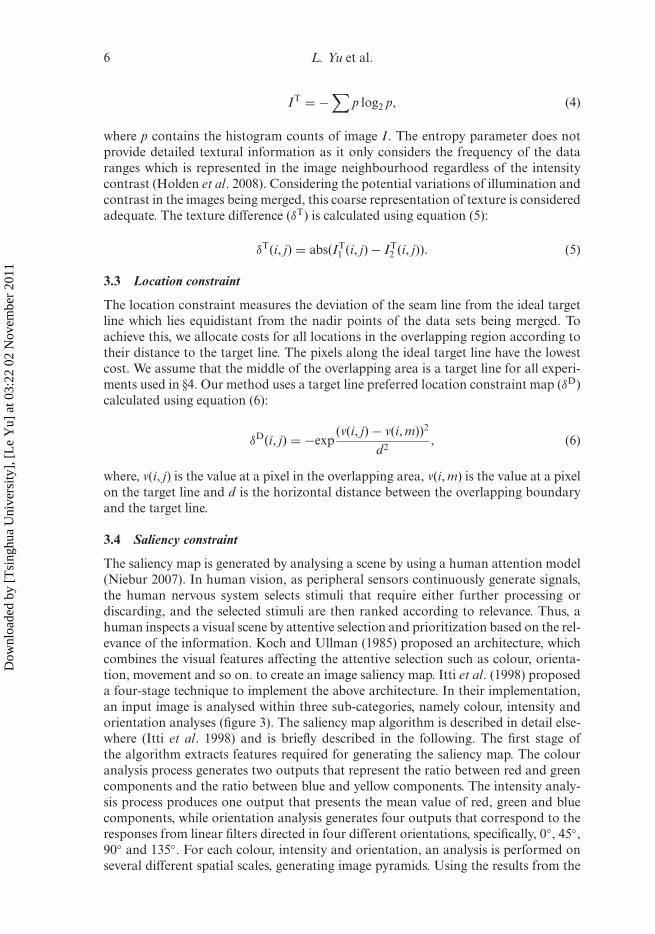
where p contains the histogram counts of image I . The entropy parameter does notprovide detailed textural information as it only considers the frequency of the dataranges which is represented in the image neighbourhood regardless of the intensitycontrast (Holden et al. 2008). Considering the potential variations of illumination andcontrast in the images being merged, this coarse representation of texture is consideredadequate. The texture difference (δT) is calculated using equation (5):
δT(i, j) = abs(IT1 (i, j) − IT
2 (i, j)). (5)
3.3 Location constraint
The location constraint measures the deviation of the seam line from the ideal targetline which lies equidistant from the nadir points of the data sets being merged. Toachieve this, we allocate costs for all locations in the overlapping region according totheir distance to the target line. The pixels along the ideal target line have the lowestcost. We assume that the middle of the overlapping area is a target line for all experi-ments used in §4. Our method uses a target line preferred location constraint map (δD)calculated using equation (6):
δD(i, j) = −exp(v(i, j) − v(i, m))2
d2, (6)
where, v(i, j) is the value at a pixel in the overlapping area, v(i, m) is the value at a pixelon the target line and d is the horizontal distance between the overlapping boundaryand the target line.
3.4 Saliency constraint
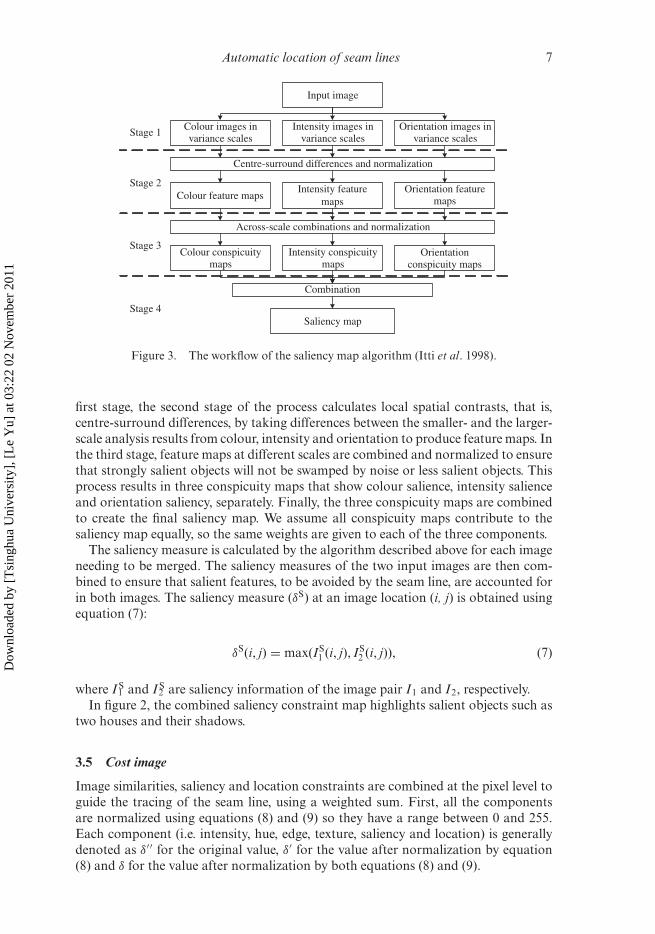
The saliency map is generated by analysing a scene by using a human attention model(Niebur 2007). In human vision, as peripheral sensors continuously generate signals,the human nervous system selects stimuli that require either further processing ordiscarding, and the selected stimuli are then ranked according to relevance. Thus, ahuman inspects a visual scene by attentive selection and prioritization based on the rel-evance of the information. Koch and Ullman (1985) proposed an architecture, whichcombines the visual features affecting the attentive selection such as colour, orienta-tion, movement and so on. to create an image saliency map. Itti et al. (1998) proposeda four-stage technique to implement the above architecture. In their implementation,an input image is analysed within three sub-categories, namely colour, intensity andorientation analyses (figure 3). The saliency map algorithm is described in detail else-where (Itti et al. 1998) and is briefly described in the following. The first stage ofthe algorithm extracts features required for generating the saliency map. The colouranalysis process generates two outputs that represent the ratio between red and greencomponents and the ratio between blue and yellow components. The intensity analy-sis process produces one output that presents the mean value of red, green and bluecomponents, while orientation analysis generates four outputs that correspond to theresponses from linear filters directed in four different orientations, specifically, 0◦, 45◦,90◦ and 135◦. For each colour, intensity and orientation, an analysis is performed onseveral different spatial scales, generating image pyramids. Using the results from the
Dow
nloa
ded
by [
Tsi
nghu
a U
nive
rsity
], [
Le
Yu]
at 0
3:22
02
Nov
embe
r 20
11
Automatic location of seam lines 7
Input image
Colour images invariance scales
Intensity images invariance scales
Orientation images invariance scales
Centre-surround differences and normalization
Colour feature mapsIntensity feature
mapsOrientation feature
maps
Across-scale combinations and normalization
Colour conspicuitymaps
Intensity conspicuitymaps
Orientationconspicuity maps
Combination
Saliency map
Stage 1
Stage 2
Stage 3
Stage 4
Figure 3. The workflow of the saliency map algorithm (Itti et al. 1998).
first stage, the second stage of the process calculates local spatial contrasts, that is,centre-surround differences, by taking differences between the smaller- and the larger-scale analysis results from colour, intensity and orientation to produce feature maps. Inthe third stage, feature maps at different scales are combined and normalized to ensurethat strongly salient objects will not be swamped by noise or less salient objects. Thisprocess results in three conspicuity maps that show colour salience, intensity salienceand orientation saliency, separately. Finally, the three conspicuity maps are combinedto create the final saliency map. We assume all conspicuity maps contribute to thesaliency map equally, so the same weights are given to each of the three components.
The saliency measure is calculated by the algorithm described above for each imageneeding to be merged. The saliency measures of the two input images are then com-bined to ensure that salient features, to be avoided by the seam line, are accounted forin both images. The saliency measure (δS) at an image location (i, j) is obtained usingequation (7):
δS(i, j) = max(IS1 (i, j), IS
2 (i, j)), (7)
where I1S and I2
S are saliency information of the image pair I1 and I2, respectively.In figure 2, the combined saliency constraint map highlights salient objects such as
two houses and their shadows.
3.5 Cost image
Image similarities, saliency and location constraints are combined at the pixel level toguide the tracing of the seam line, using a weighted sum. First, all the componentsare normalized using equations (8) and (9) so they have a range between 0 and 255.Each component (i.e. intensity, hue, edge, texture, saliency and location) is generallydenoted as δ′′ for the original value, δ′ for the value after normalization by equation(8) and δ for the value after normalization by both equations (8) and (9).
Dow
nloa
ded
by [
Tsi
nghu
a U
nive
rsity
], [
Le
Yu]
at 0
3:22
02
Nov
embe
r 20
11
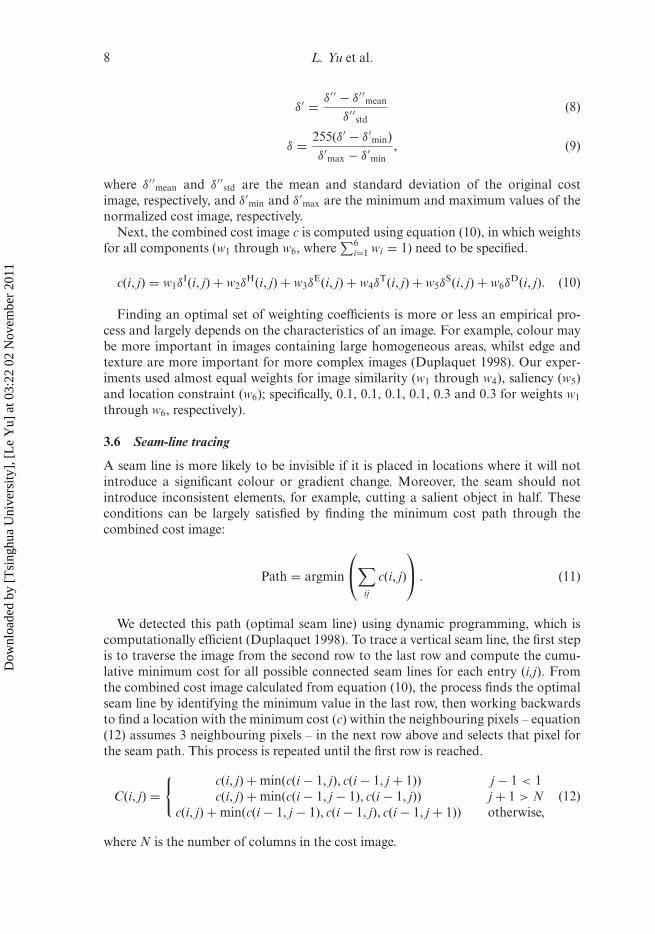
8 L. Yu et al.
δ′ = δ′′ − δ′′mean
δ′′std
(8)
δ = 255(δ′ − δ′min)
δ′max − δ′
min, (9)
where δ′′mean and δ′′
std are the mean and standard deviation of the original costimage, respectively, and δ′
min and δ′max are the minimum and maximum values of the
normalized cost image, respectively.Next, the combined cost image c is computed using equation (10), in which weights
for all components (w1 through w6, where∑6
i=1 wi = 1) need to be specified.
c(i, j) = w1δI(i, j) + w2δ
H(i, j) + w3δE(i, j) + w4δ
T(i, j) + w5δS(i, j) + w6δ
D(i, j). (10)
Finding an optimal set of weighting coefficients is more or less an empirical pro-cess and largely depends on the characteristics of an image. For example, colour maybe more important in images containing large homogeneous areas, whilst edge andtexture are more important for more complex images (Duplaquet 1998). Our exper-iments used almost equal weights for image similarity (w1 through w4), saliency (w5)and location constraint (w6); specifically, 0.1, 0.1, 0.1, 0.1, 0.3 and 0.3 for weights w1
through w6, respectively).
3.6 Seam-line tracing
A seam line is more likely to be invisible if it is placed in locations where it will notintroduce a significant colour or gradient change. Moreover, the seam should notintroduce inconsistent elements, for example, cutting a salient object in half. Theseconditions can be largely satisfied by finding the minimum cost path through thecombined cost image:
Path = argmin
⎛⎝∑
ij
c(i, j)
⎞⎠ . (11)
We detected this path (optimal seam line) using dynamic programming, which iscomputationally efficient (Duplaquet 1998). To trace a vertical seam line, the first stepis to traverse the image from the second row to the last row and compute the cumu-lative minimum cost for all possible connected seam lines for each entry (i,j). Fromthe combined cost image calculated from equation (10), the process finds the optimalseam line by identifying the minimum value in the last row, then working backwardsto find a location with the minimum cost (c) within the neighbouring pixels – equation(12) assumes 3 neighbouring pixels – in the next row above and selects that pixel forthe seam path. This process is repeated until the first row is reached.
C(i, j) ={ c(i, j) + min(c(i − 1, j), c(i − 1, j + 1)) j − 1 < 1
c(i, j) + min(c(i − 1, j − 1), c(i − 1, j)) j + 1 > Nc(i, j) + min(c(i − 1, j − 1), c(i − 1, j), c(i − 1, j + 1)) otherwise,
(12)
where N is the number of columns in the cost image.
Dow
nloa
ded
by [
Tsi
nghu
a U
nive
rsity
], [
Le
Yu]
at 0
3:22
02
Nov
embe
r 20
11

Automatic location of seam lines 9
4. Experimental results and discussion
Three image pairs (table 1 and figures 4–6) were tested to evaluate the performance ofthe proposed seam line location technique.
Table 1. Description of overlap images in three experiments.
Experiment Size for left image (pixels) Size for right image (pixels) Type
1 497 × 1000 497 × 1000 .jpg2 900 × 1500 900 × 1500 .jpg3 400 × 1500 400 × 1500 .jpg
(a) (b) (c) (d)
(e) (f) (g)
Figure 4. The seam line results from experiment 1. Results from using different combinationsof image similarity (A), saliency (S), location constraint (D) are presented in the parts (a) to (g):(a) A, (b) S, (c) D, (d) A+S, (e) A+D, (f ) S+D and (g) A+S+D.
Dow
nloa
ded
by [
Tsi
nghu
a U
nive
rsity
], [
Le
Yu]
at 0
3:22
02
Nov
embe
r 20
11
10 L. Yu et al.
(a) (b) (c) (d)
(e) (f) (g)
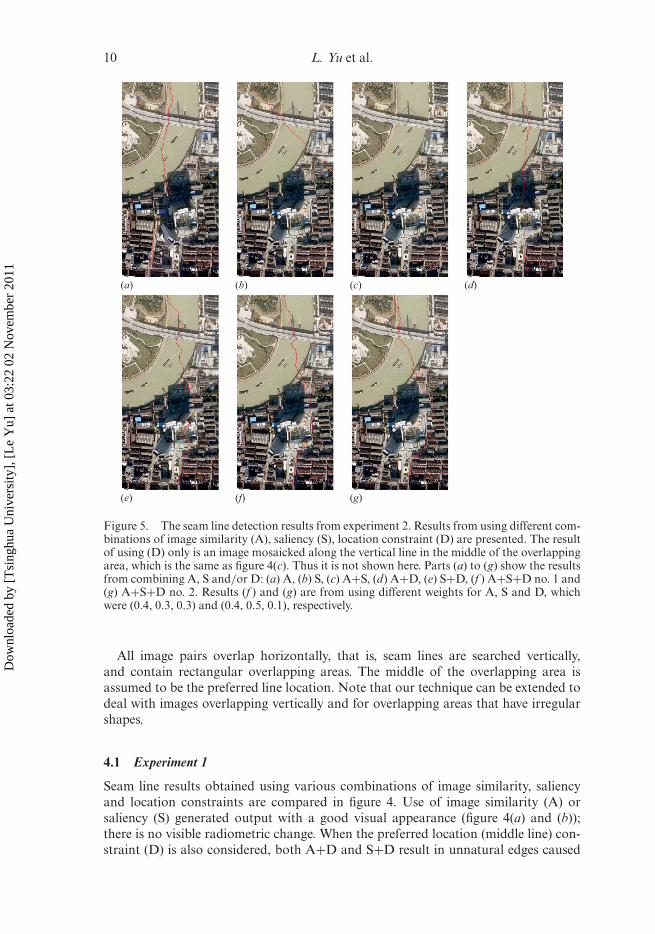
Figure 5. The seam line detection results from experiment 2. Results from using different com-binations of image similarity (A), saliency (S), location constraint (D) are presented. The resultof using (D) only is an image mosaicked along the vertical line in the middle of the overlappingarea, which is the same as figure 4(c). Thus it is not shown here. Parts (a) to (g) show the resultsfrom combining A, S and/or D: (a) A, (b) S, (c) A+S, (d) A+D, (e) S+D, (f ) A+S+D no. 1 and(g) A+S+D no. 2. Results (f ) and (g) are from using different weights for A, S and D, whichwere (0.4, 0.3, 0.3) and (0.4, 0.5, 0.1), respectively.
All image pairs overlap horizontally, that is, seam lines are searched vertically,and contain rectangular overlapping areas. The middle of the overlapping area isassumed to be the preferred line location. Note that our technique can be extended todeal with images overlapping vertically and for overlapping areas that have irregularshapes.
4.1 Experiment 1
Seam line results obtained using various combinations of image similarity, saliencyand location constraints are compared in figure 4. Use of image similarity (A) orsaliency (S) generated output with a good visual appearance (figure 4(a) and (b));there is no visible radiometric change. When the preferred location (middle line) con-straint (D) is also considered, both A+D and S+D result in unnatural edges caused
Dow
nloa
ded
by [
Tsi
nghu
a U
nive
rsity
], [
Le
Yu]
at 0
3:22
02
Nov
embe
r 20
11
Automatic location of seam lines 11
(a) (b) (c) (d) (e) (f) (g)
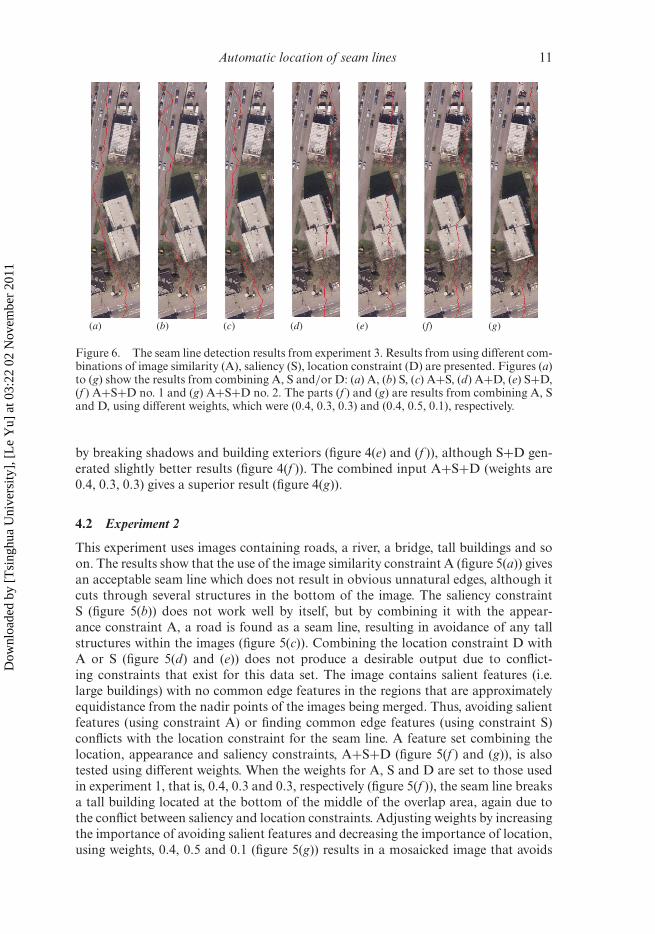
Figure 6. The seam line detection results from experiment 3. Results from using different com-binations of image similarity (A), saliency (S), location constraint (D) are presented. Figures (a)to (g) show the results from combining A, S and/or D: (a) A, (b) S, (c) A+S, (d) A+D, (e) S+D,(f ) A+S+D no. 1 and (g) A+S+D no. 2. The parts (f ) and (g) are results from combining A, Sand D, using different weights, which were (0.4, 0.3, 0.3) and (0.4, 0.5, 0.1), respectively.
by breaking shadows and building exteriors (figure 4(e) and (f )), although S+D gen-erated slightly better results (figure 4(f )). The combined input A+S+D (weights are0.4, 0.3, 0.3) gives a superior result (figure 4(g)).
4.2 Experiment 2
This experiment uses images containing roads, a river, a bridge, tall buildings and soon. The results show that the use of the image similarity constraint A (figure 5(a)) givesan acceptable seam line which does not result in obvious unnatural edges, although itcuts through several structures in the bottom of the image. The saliency constraintS (figure 5(b)) does not work well by itself, but by combining it with the appear-ance constraint A, a road is found as a seam line, resulting in avoidance of any tallstructures within the images (figure 5(c)). Combining the location constraint D withA or S (figure 5(d) and (e)) does not produce a desirable output due to conflict-ing constraints that exist for this data set. The image contains salient features (i.e.large buildings) with no common edge features in the regions that are approximatelyequidistance from the nadir points of the images being merged. Thus, avoiding salientfeatures (using constraint A) or finding common edge features (using constraint S)conflicts with the location constraint for the seam line. A feature set combining thelocation, appearance and saliency constraints, A+S+D (figure 5(f ) and (g)), is alsotested using different weights. When the weights for A, S and D are set to those usedin experiment 1, that is, 0.4, 0.3 and 0.3, respectively (figure 5(f )), the seam line breaksa tall building located at the bottom of the middle of the overlap area, again due tothe conflict between saliency and location constraints. Adjusting weights by increasingthe importance of avoiding salient features and decreasing the importance of location,using weights, 0.4, 0.5 and 0.1 (figure 5(g)) results in a mosaicked image that avoids
Dow
nloa
ded
by [
Tsi
nghu
a U
nive
rsity
], [
Le
Yu]
at 0
3:22
02
Nov
embe
r 20
11
12 L. Yu et al.
breaking salient structures while drawing the line to some extend towards the locationsequidistant from the nadir points.
4.3 Experiment 3
For this experiment, aerial photographic images containing many tall buildings withlarge shadows were used. A and S show a similar result (figure 6(a) and (b)) – andA+S performs better, as it finds the path along a road avoiding other objects, suchas buildings, cars, grassland and so on (figure 6(c)). The result from using S+D,however, cuts through two major structures (figure 6(e)). A comparison between theoutput from A+D and the output from A+S+D reveals that A+S+D results in lessunnatural edges (figure 6(c), (f ) and (g)). Similar to experiment 2, a trade-off betweenthe importance of S and D constraints improves the result.
4.4 Discussion
The examples demonstrate that image similarities can be an effective basis for locatinga seam line (figures 4(a), 5(a) and 6(a)) if there is no constraint on locations (figures4(e), 5(d) and 6(d)). Saliency information is able to produce a good seam line when thecontent of the image is simple (figures 4(b) and 6(b)) but fails in images with complexcontent (figure 5(b)), where the most salient objects (two very tall buildings located inthe middle of the image) are avoided but the seam line breaks into other less salientobjects (i.e. buildings in bottom right of the image). The combination of image similar-ities and a saliency map produced a better result than using either image appearanceor saliency constraints alone; compare figures 5(c) and 6(c) with figure 5(a) and (b)and figure 6(a) and (b), respectively.
The constraint on location preference requires a compromise between preservingdata quality and visual appeal. Adjustments of the weight for the target location canbe made to control the effect of the location preference constraint.
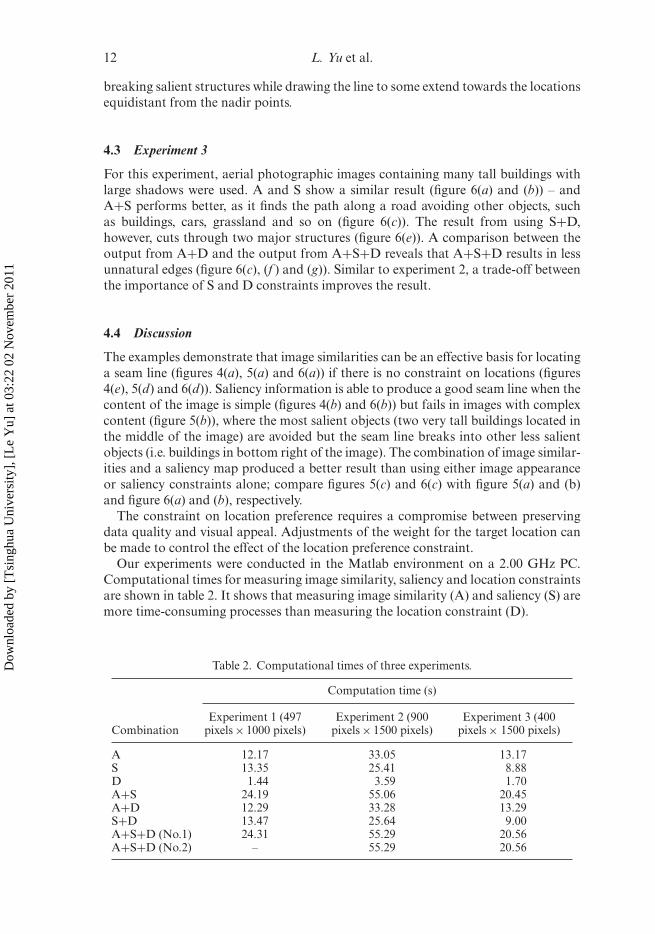
Our experiments were conducted in the Matlab environment on a 2.00 GHz PC.Computational times for measuring image similarity, saliency and location constraintsare shown in table 2. It shows that measuring image similarity (A) and saliency (S) aremore time-consuming processes than measuring the location constraint (D).
Table 2. Computational times of three experiments.
Computation time (s)
CombinationExperiment 1 (497
pixels × 1000 pixels)Experiment 2 (900
pixels × 1500 pixels)Experiment 3 (400
pixels × 1500 pixels)
A 12.17 33.05 13.17S 13.35 25.41 8.88D 1.44 3.59 1.70A+S 24.19 55.06 20.45A+D 12.29 33.28 13.29S+D 13.47 25.64 9.00A+S+D (No.1) 24.31 55.29 20.56A+S+D (No.2) – 55.29 20.56
Dow
nloa
ded
by [
Tsi
nghu
a U
nive
rsity
], [
Le
Yu]
at 0
3:22
02
Nov
embe
r 20
11

Automatic location of seam lines 13
5. Future work
This article presented an automatic seam line location technique which considersall of image appearance (i.e. colour, edge and texture), image saliency and locationconstraints to find the optimal seam lines for mosaicking optical remote sensing imagepairs. Note that while this work is designed to merge images in adjacent paths, whereeach image has a different nadir line, it can be adapted to merge images captured in thesame path where the nadir lines are identical by discarding the location constraints.
Furthermore, with many kinds of remote-sensing imagery, spectral informationconsists of more than the three bands comprising an RGB image. The data may bemultispectral, even hyperspectral. In such cases colour processing cannot be appliedto generate the saliency map; thus only intensity and orientation will be applied.Transformation of the image into an IHS color space is a limiting factor for earthimages, and an alternative would be to modify the saliency and colour constraints tooperate on individual multispectral bands rather than intensity and hue. However, forsome cases, such as producing preview images, mosaicking is still a task where theremote sensing imagery is in RGB form.
Our experiments demonstrated that the combination of constraints produces supe-rior results to using just one of these constraints for high-resolution images withcomplex structures. This method, however, could be improved in the following ways.
1. Improvement of the dynamic programming strategy. The main drawback of thedynamic programming strategy used in this article is that the search direc-tion can only be either horizontal or vertical, which might not be sufficientfor tracing an optimal seam line in complex conditions, for example, when itis necessary to go around backwards and forwards to avoid objects. A moresophisticated path searching method such as Dijkstra’s algorithm could be usedto make the search more flexible, although the computational complexity willbe increased.
2. Integration with other mosaic workflows. Since our work only focused on opti-mal seam line location, which is one step in a complete mosaic product chain,this work could be integrated with other steps (such as geometric correction,radiometric correction, seam line network generation, etc.) to create a com-prehensive workflow. Recently, Pan et al. (2009b) proposed an automatic seamline network generating approach using area Voronoi diagrams with overlap;this network is global and is also optimized after refinement using a bottleneckmodel (Fernandez et al. 1998) and simplified using the Douglas–Peuker algo-rithm (Douglas and Peucker 1973) for each individual seam line, which is timeconsuming. Our work on seam line detection is comparatively time efficientand could be easily integrated into the conventional mosaicking process.
AcknowledgementsWe thank the Chinese Scholarship Council (CSC) for a visiting scholarship forLe Yu at UWA. We thank Peter Kovesi, who provided Matlab codes for Cannyand phase congruency edge detection (http://www.csse.uwa.edu.au/∼pk/Research/
MatlabFns/index.html) and Jonathan Hareal for Matlab codes for the saliency mapalgorithm (http://www.klab.caltech.edu/∼harel/share/gbvs.php). Test images in fig-ures 2, 4 and 6 used in this article are clipped from demo images of INPHOInphoVistaTM, trial version (http://www.inpho.de). We also thank Mr. Gongbo Xufor providing test images used in figure 5.
Dow
nloa
ded
by [
Tsi
nghu
a U
nive
rsity
], [
Le
Yu]
at 0
3:22
02
Nov
embe
r 20
11
14 L. Yu et al.
ReferencesAFEK, Y. and BRAND, A., 1998, Mosaicking of orthorectified aerial images. Photogrammetric
Engineering and Remote Sensing, 64, pp. 115–125.BIELSKI, C., GRAZZINI, J. and SOILLE, P., 2007, Automated morphological image composition
for mosaicking large image data sets. In IEEE International Geoscience and RemoteSensing Symposium (IGARSS), pp. 4068–4071.
BINDSCHADLER, R., VORNBERGER, P., FLEMING, A., FOX, A., MULLINS, J., BINNIE, D.,PAULSEN, S.J., GRANNEMAN, B. and GORODETZKY, D., 2008, The Landsat imagemosaic of Antarctica. Remote Sensing of Environment, 112, pp. 4214–4226.
CANNY, J., 1986, A computational approach to edge detection. IEEE Transactions on PatternAnalysis and Machine Intelligence, 8, pp. 679–698.
CHON, J. and KIM, H., 2006, Determination of the optimal seam-lines in image mosaicking withthe dynamic programming (DP) on the converted cost space. Lecture Notes in ComputerScience, 4029, pp. 750–757.
DAVIS, J., 1998, Mosaics of scenes with moving objects. In IEEE Computer Society Conferenceon Computer Vision and Pattern Recognition (CVPR98), pp. 354–360.
DAVIS, L.S., 1975, A survey of edge detection techniques. Computer Graphics and ImageProcessing, 4, pp. 248–270.
DIJKSTRA, E.W., 1959, A note on two problems in connexion with graphs. NumerischeMathematik, 1, pp. 269–271.
DOUGLAS, D. and PEUCKER, T., 1973, Algorithms for the reduction of the number of pointsrequired to represent a digitized line or its caricature. The Canadian Cartographer, 10,pp. 112–122.
DU, Y., CIHLAR, J., BEAUBIEN, J. and LATIFOVIC, R., 2001, Radiometric normalization, com-positing, and quality control for satellite high resolution image mosaics over large areas.IEEE Transactions on Geoscience and Remote Sensing, 39, pp. 623–634.
DUPLAQUET, M.L., 1998, Building large image mosaics with invisible seam-lines. In Proceedingsof SPIE Aerosense, Orlando, FL, pp. 369–377.
EFROS, A. and FREEMAN, W., 2001, Image quilting for texture synthesis and transfer. InProceedings of SIGGRAPH 2001, pp. 341–346.
FERNANDEZ, E., GARFINKEL, R. and ARBIOL, R., 1998, Mosaicking of aerial photographicmaps via seams defined by bottleneck shortest paths. Operations Research, 46, pp. 293–304.
GONZALEZ, R.C., WOODS, R.E. and EDDINS, S.L., 2003, Digital Image Processing UsingMATLAB (Upper Saddle River, NJ: Prentice Hall).
HEWSON, R.D., CUDAHY, T.J., MIZUHIKO, S., UEDA, K. and MAUGER, A.J., 2005, Seamlessgeological map generation using ASTER in the Broken Hill-Curnamona province ofAustralia. Remote Sensing of Environment, 99, pp. 159–172.
HOLDEN, E.J., MOSS, S., RUSSELL, J.K. and DENTITH, M.C., 2008, An image analysis method todetermine crystal size distributions of olivine in kimberlite. Computational Geosciences,13, pp. 255–268.
HOOD, J., LADNER, L. and CHAMPION, R., 1989, Image processing techniques for orthophoto-quad production, Photogrammetric Engineering & Remote Sensing, 55, pp. 1323–1329.
HUMMER-MILLER, S., 1989, A digital mosaicking algorithm allowing for an irregular join ‘line’.Photogrammetric Engineering and Remote Sensing, 55, pp. 43–47.
HWANG, D. and CHIEN, S., 2008, Context-aware image resizing using perceptual seam carvingwith human attention model. In IEEE International Conference on Multimedia and Expo2008, pp. 1029–1032.
ITTI, L., KOCH, C. and NIEBUR, E., 1998, A model of saliency-based visual attention for rapidscene analysis. IEEE Transactions on Pattern Analysis and Machine Intelligence, 20,pp. 1254–1259.
JIA, J. and TANG, C., 2008, Image stitching using structure deformation. IEEE Transactions onPattern Analysis and Machine Intelligence. 30, pp. 617–631.
Dow
nloa
ded
by [
Tsi
nghu
a U
nive
rsity
], [
Le
Yu]
at 0
3:22
02
Nov
embe
r 20
11

Automatic location of seam lines 15
KERSCHNER, M., 2001, Seamline detection in colour orthoimage mosaicking by use of twinsnakes. ISPRS Journal of Photogrammetry & Remote Sensing, 56, pp. 53–64.
KOCH, C. and ULLMAN, S., 1985, Shifts in selective visual attention: towards the underlyingneural circuitry. Human Neurobiology, 4, pp. 219–277.
KOVESI, P.D., 1993, A dimensionless measure of edge significance from phase congruency calcu-lated via wavelets. In The First New Zealand Conference on Image and Vision Computing,16–18 August 1993, Auckland, pp. 87–94.
MILGRAM, D.L., 1975, Computer methods for creating photomosaics. IEEE Transactions onComputers, 24, pp. 1113–1119.
MILGRAM, D.L., 1977, Adaptive techniques for photo mosaicking. IEEE Transactions onComputers, 26, pp. 1175–1180.
MILLS, A. and DUDEK, G., 2009, Image stitching with dynamic elements. Image and VisionComputing, 27, pp. 1593–2602.
NIEBUR, E., 2007, Saliency map. Scholarpedia, 2, p. 2675. doi:10.4249/scholarpedia.2675.OWENS, R., 1997, Mathematical Morphology. Available online at: http://homepages.inf.ed.
ac.uk/rbf/CVonline/LOCAL_COPIES/OWENS/LECT3/node3.html (accessed 25 June2011).
PAN, J., WANG, M., LI, D. and FENG, T., 2009a, Repair approach for DMC images based onhierarchical location using edge curve. Science in China, Series F: Information Sciences.52, pp. 23–31.
PAN, J., WANG, M., LI, D. and LI, J., 2009b, Automatic generation of seamline network usingarea Vorinoi diagrams with overlap. IEEE Transactions on Geoscience and RemoteSensing, 47, pp. 1737–1744.
PELEG, S., 1981, Elimination of seams from photomosaics. Computer Graphics and ImageProcessing, 16, pp. 90–94.
ROBERTS, L.G., 1965, Machine perception of three-dimensional solids. Available online at:http://www.packet.cc/files/mach-per-3D-solids.html (accessed 25 June 2011).
SCHEIDT, S., RAMSEY, M. and LANCASTER, N., 2008, Radiometric normalization and imagemosaic generation of ASTER thermal infrared data: an application to extensive sandsheets and dune fields. Remote Sensing of Environment, 112, pp. 920–933.
SHIREN, Y., LI, L. and PENG, G., 1989, Two-dimensional seam-point searching in digital imagemosaicking. Photogrammetric Engineering and Remote Sensing, 55, pp. 49–53.
SOILLE, P., 2006, Morphological image compositing. IEEE Transactions on Pattern Analysis andMachine Intelligence, 28, pp. 673–683.
SUEN, S.T.Y., LAM, E.Y. and WONG, K.K.Y., 2006, Image mosaicking with optimized matchingof global and local contexts. In IEEE Region 10 Conference, TENCON 2006.
UYTTENDAELE, M., EDEN, A. and SZELISKI, R., 2001, Eliminating ghosting and exposureartifacts in image mosaics. Computer Vision and Pattern Recognition, 2, pp. 509–516.
YU, L., ZHANG, D. and HOLDEN, E.J., 2008, A fast and fully automatic registrationapproach based on point features for multi-source remote-sensing images. Computers& Geosciences, 34, pp. 838–848.
ZOBRIST, A.L., BRYANT, N.A. and MCLEAD, R.G., 1983, Technology for large digital mosaicsof Landsat data. Photogrammetric Engineering & Remote Sensing, 59, pp. 1325–1335.
ZOMET, A., LAVIN, A., PELEG, S. and WEISS, Y., 2006, Seamless image stitching by minimizingfalse edges. IEEE Transactions on Image Processing, 15, pp. 969–977.
Dow
nloa
ded
by [
Tsi
nghu
a U
nive
rsity
], [
Le
Yu]
at 0
3:22
02
Nov
embe
r 20
11