towards safety from toxic gases in underground mines using wireless sensor networks and
TRANSCRIPT

Hindawi Publishing CorporationInternational Journal of Distributed Sensor NetworksVolume 2013 Article ID 159273 15 pageshttpdxdoiorg1011552013159273
Research ArticleTowards Safety from Toxic Gases in Underground Mines UsingWireless Sensor Networks and Ambient Intelligence
Isaac O Osunmakinde
Semantic Computing Group School of Computing College of Science Engineering and Technology University of South Africa(UNISA) PO Box 392 Pretoria 0003 South Africa
Correspondence should be addressed to Isaac O Osunmakinde osunmakindeioyahoocom
Received 15 March 2012 Revised 13 December 2012 Accepted 4 January 2013
Academic Editor Andrea Acquaviva
Copyright copy 2013 Isaac O Osunmakinde This is an open access article distributed under the Creative Commons AttributionLicense which permits unrestricted use distribution and reproduction in any medium provided the original work is properlycited
The growing number of fatalities among miners caused by toxic gases puts pressure on the mining industry innovative approachesare required to improve underground minersrsquo health Toxic gases are very often released in underground mines and cannot easilybe detected by human senses This paper investigates the presence of the inherent types of toxic fumes in critical regions andtheir suspension and trends in the air and intends to generate knowledge that will assist in preventing miners from contractingdiseases The development of intelligent decision support systems is still in its infancy Knowledge of how to make them profitablein improving minersrsquo safety is largely lacking An autonomous remote monitoring framework of wireless sensor networks whichintegrates mobile sensing and Ohmrsquos law coupled with ambient intelligence governing decision-making for miners is developedThe framework has been investigated in indoor scenarios and successfully deployed for real-life application in an aeronautic enginetest cell environment such as those typically found in undergroundmines Useful demonstrations of the systemwere carried out toprovide similar knowledge to safeguard engineers from the inhalation of toxic gases This provides early warning for safety agentsThe system has proven to be suitable for deployment in underground mines
1 Introduction
Efficient monitoring of concentrations of toxic gases inrestricted areas such as those typically found in mines isregarded as a problem of special significance by the miningindustry [1] This challenge is significantly greater in anunstructured underground mining environment such as astope A mine stope is formed as a result of repeatedlyblasting hard rock from strategic sides with explosives Aftermine blasting or other mining activities such as drillingconstruction and barring the underground terrains becomerestricted unknown unstructured and particularly danger-ous owing to the presence of poisonous explosive gases Themine gases are highly concentrated and toxic become a threatto both minersrsquo health and the environment and also limitvisibility
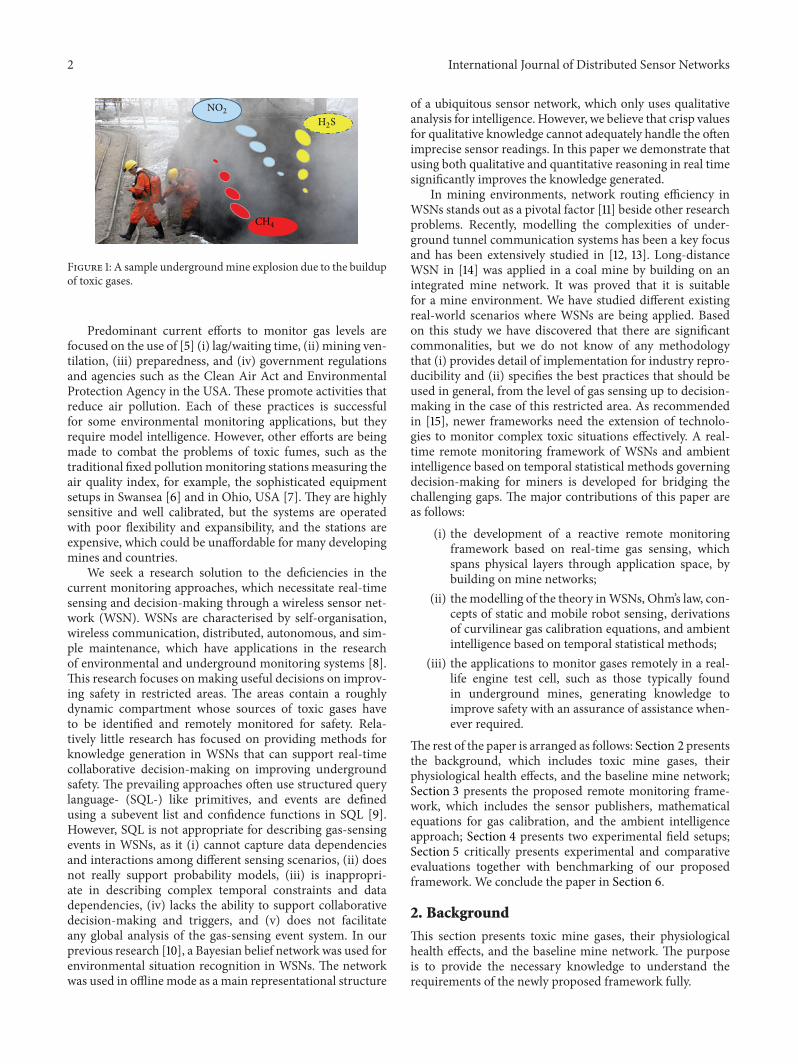
Figure 1 shows an example of a buildup and explosionof toxic gases such as methane (CH
4) nitrogen dioxide
(NO2) and hydrogen sulphide (H
2S) in an underground
mine The inhalation of an overlooked black damp in mineswhich is a mixture of dust carbon dioxide and nitrogen [2]gradually overcomes and destroys the bodyrsquos blood systemwhich may result in chronic diseases as a consequence ofexposure to toxic gases Research conducted in 2006 revealeda significantly elevated risk of leukaemia among Germanemployees with a long occupational career in undergroundmines [1] Several recent references to the incidence ofmining-related diseases can be found in [3 4]
It is therefore worth noting that after blasting minerscurrently have to wait outside themines for a specified periodof time for the poisonous gasesdust to dissipateThe questionremains whether the gasdust disappears completely in the airormerely reduces below thatwhich the humannose can sensebefore miners enter the unsafe areas Understanding of thedensity of the poisonous gases suspended in the air will assistin preventing miners from contracting dreaded diseases andis manifestly a sound basis for improving safety proceduresin mines
2 International Journal of Distributed Sensor Networks
NO2H2S
CH4
Figure 1 A sample undergroundmine explosion due to the buildupof toxic gases
Predominant current efforts to monitor gas levels arefocused on the use of [5] (i) lagwaiting time (ii) mining ven-tilation (iii) preparedness and (iv) government regulationsand agencies such as the Clean Air Act and EnvironmentalProtection Agency in the USA These promote activities thatreduce air pollution Each of these practices is successfulfor some environmental monitoring applications but theyrequire model intelligence However other efforts are beingmade to combat the problems of toxic fumes such as thetraditional fixed pollutionmonitoring stationsmeasuring theair quality index for example the sophisticated equipmentsetups in Swansea [6] and in Ohio USA [7] They are highlysensitive and well calibrated but the systems are operatedwith poor flexibility and expansibility and the stations areexpensive which could be unaffordable for many developingmines and countries
We seek a research solution to the deficiencies in thecurrent monitoring approaches which necessitate real-timesensing and decision-making through a wireless sensor net-work (WSN) WSNs are characterised by self-organisationwireless communication distributed autonomous and sim-ple maintenance which have applications in the researchof environmental and underground monitoring systems [8]This research focuses on making useful decisions on improv-ing safety in restricted areas The areas contain a roughlydynamic compartment whose sources of toxic gases haveto be identified and remotely monitored for safety Rela-tively little research has focused on providing methods forknowledge generation in WSNs that can support real-timecollaborative decision-making on improving undergroundsafety The prevailing approaches often use structured querylanguage- (SQL-) like primitives and events are definedusing a subevent list and confidence functions in SQL [9]However SQL is not appropriate for describing gas-sensingevents in WSNs as it (i) cannot capture data dependenciesand interactions among different sensing scenarios (ii) doesnot really support probability models (iii) is inappropri-ate in describing complex temporal constraints and datadependencies (iv) lacks the ability to support collaborativedecision-making and triggers and (v) does not facilitateany global analysis of the gas-sensing event system In ourprevious research [10] a Bayesian belief network was used forenvironmental situation recognition in WSNs The networkwas used in offlinemode as a main representational structure
of a ubiquitous sensor network which only uses qualitativeanalysis for intelligence However we believe that crisp valuesfor qualitative knowledge cannot adequately handle the oftenimprecise sensor readings In this paper we demonstrate thatusing both qualitative and quantitative reasoning in real timesignificantly improves the knowledge generated
In mining environments network routing efficiency inWSNs stands out as a pivotal factor [11] beside other researchproblems Recently modelling the complexities of under-ground tunnel communication systems has been a key focusand has been extensively studied in [12 13] Long-distanceWSN in [14] was applied in a coal mine by building on anintegrated mine network It was proved that it is suitablefor a mine environment We have studied different existingreal-world scenarios where WSNs are being applied Basedon this study we have discovered that there are significantcommonalities but we do not know of any methodologythat (i) provides detail of implementation for industry repro-ducibility and (ii) specifies the best practices that should beused in general from the level of gas sensing up to decision-making in the case of this restricted area As recommendedin [15] newer frameworks need the extension of technolo-gies to monitor complex toxic situations effectively A real-time remote monitoring framework of WSNs and ambientintelligence based on temporal statistical methods governingdecision-making for miners is developed for bridging thechallenging gaps The major contributions of this paper areas follows
(i) the development of a reactive remote monitoringframework based on real-time gas sensing whichspans physical layers through application space bybuilding on mine networks
(ii) the modelling of the theory inWSNs Ohmrsquos law con-cepts of static and mobile robot sensing derivationsof curvilinear gas calibration equations and ambientintelligence based on temporal statistical methods
(iii) the applications to monitor gases remotely in a real-life engine test cell such as those typically foundin underground mines generating knowledge toimprove safety with an assurance of assistance when-ever required
The rest of the paper is arranged as follows Section 2 presentsthe background which includes toxic mine gases theirphysiological health effects and the baseline mine networkSection 3 presents the proposed remote monitoring frame-work which includes the sensor publishers mathematicalequations for gas calibration and the ambient intelligenceapproach Section 4 presents two experimental field setupsSection 5 critically presents experimental and comparativeevaluations together with benchmarking of our proposedframework We conclude the paper in Section 6
2 Background
This section presents toxic mine gases their physiologicalhealth effects and the baseline mine network The purposeis to provide the necessary knowledge to understand therequirements of the newly proposed framework fully
International Journal of Distributed Sensor Networks 3
Table 1 Common mine gases
Gases Properties Health effects Concentration in the air
CO2Colourless odourless heavier than airacidic taste at high concentrations
At 5 stimulated respiration at 7 to 10unconsciousness after few minutes of exposure 280ndash390 ppm
CO Flammable colourless tastelessodourless lighter than air
At 200 ppm slight headache tirednessdizziness nausea after 2 to 3 hrs at gt200 ppmlife threatening after 3 hrs
0-trace ppm
H2
Colourless reacts easily with otherchemical substances explosivemixtures are easily formed lighterthan air
High concentration causes oxygen-deficientenvironment headaches ringing in earsdrowsiness nausea skin having blue colour
05 ppm
CH4
Colourless odourless tastelessflammable lighter than air largestcomponent of fire damp
Asphyxiation dizziness headache and nauseain high concentrations due to displacement ofoxygen
179ndash20 ppm
NO2
Reddish-brown colour in highconcentrations acrid or bleach odournonflammable heavier than air
At 1ndash13 ppm irritation of nose andthroatle80 ppm tightness in chest after 3 to 5minutes gt80 ppm pulmonary edema after 30minutes
003 ppm
21 Toxic Mine Gases and Physiological Health Effects Table 1presents some information about toxic gases commonlyfound in mine airThe knowledge is extracted from [16]Thisinformation benchmarks our intelligence system to guide theearly warning triggers
22 Baseline Mine Network for Remote Monitoring Theintegrated mine network proposed in [23] is intended foruse as a baseline to connect with the proposed frameworkThe integrated mine network is composed of optical fibre asthe main network through the shaft and uses WSNs in theroadwaywheremonitoring is neededTheWSNs also connectother networks via gateway nodes realising informationinteraction of aboveground and underground networks asshown in Figure 2 The benefits of this mine network are asfollows (1) full usage of the existing network in the minewhich implies low maintenance (2) no need for a WSN tolay lines for communication and power which makes it moreflexible (3) sensor nodes that could be positioned optionallyand compactly making it possible to monitor stopes and anyother areas in the mine and (4) expandability of the networkeven when nodes and roadways are modified making itconvenient tomonitormoving robot sensing in undergroundmines
In our approach the network is intended for deployingthe sensing nodes to identify toxic gases and sense what ishappening undergroundThe inclusion of fibre-optic cablingthrough the shaft alleviates the challenges of no networkcoverage in underground tunnel regions The fibre-opticcable communicates to a server or data-logger abovegroundwhich stores sensor readings for forward transmission to theInternet or network space as used in Figure 3
3 Proposed Remote Monitoring GasSensing Framework
This section introduces the new reactive framework inFigure 3 for remotely monitoring toxic gases in restricted
Internet
Mine localarea network
Dispatching center
Wireless sensor networks
Underground
Aboveground
Data loggerserver
Shaft
Opt
ical
fibr
e
Sink 1
Sink 2
Roadway
Roadway Sink 119899
Figure 2 Integrated mine network
areas such as those typically found in underground minesIt uses the WSN and ambient intelligence technology bybuilding on Figure 2 The goal of this framework is to guidethe monitoring of toxic gases in restricted areas througha set of well-defined nodes in its entire real-time systemAs shown the reactive system is divided into three majornodes sensor publishers in Section 31 gas calibration inSection 32 and intelligent decision support system (DSS)nodes in Section 33We expect the benefits of this frameworkto be numerous (i) mobile robot sensing balancing betweenmaximising the detection rate of gases and minimisingthe number of missed detectionsunit areas (ii) the timelydetection and early warning ofmany common problems suchas failing sensors toxic fume levels hazardous to health invarious regions and potential gas explosions (iii) an intelli-gent goal-directed decision-making process (iv) an increase
4 International Journal of Distributed Sensor Networks
Sensorpublishers
Network space
Network listener
Calibration
Monitoring base station
Gateway
DSS
Region 1
node 1
node 2
Pocketnode 119899
Region 119899
middot middot middot
4540353025201510
50
119883119884119885
Series1Series2
Series3
Figure 3 New remote gas monitoring framework
Networkspace101010001
111010001
001010011
001010011
(a) Mobile robot and static sensing (b) Our monitoring base station receiving gas packets
Figure 4 Mobile robot and static sensing publishing gas packets to the gateway for integration into Figure 3
in coordination between the different working nodes on theframework thanks to a clear division of responsibilities and(v) the reproducibility of knowledge gathered from real-world WSN applications
31 Sensor Publisher Nodes-Physical Layer The sensor pub-lishers implemented as shown at the top right of Figure 3collect gas data from different regions of an environmentwhich is necessary to understand the concentrations of thegases being monitored fully This physical layer consists ofan exhaustive design of the framework which could includemobile sensing shown in Figure 4(a)This is expatiated in thefollowing
Static and mobile robot sensing nodes provide an elec-tronic ldquonoserdquo on board which includes an SD card slot andGPRS capabilities for sending an sms and come in differentcommunication flavours of Zigbee using the Xbee protocol
Zigbee can operate on line-of-sight or use the direct-sequencespread spectrum to penetrate barriers The node uses alithium battery which can be recharged through a dedicatedsocket by a solar panel allows extra sensors and GPS onboard and can transmit over a distance of 75m Low-levelsoftware programming is embedded onto different boardcircuitry enabling wireless communication Tagging eachsensor board at this physical layer enables localisation of thesource of various toxic gases thereby making concurrent gaspublishing onto the network space identifiable in Figure 4(b)as separate packet voltage (V) valuesThus the network spacealigns our framework with the integrated mine networkwhere the network space represents the Internet
32 Mathematical Equations for Gas Calibration Nodes-Middle Layer Every sensor used in gas measurement can becharacterised by a specific response function or calibration
International Journal of Distributed Sensor Networks 5
equation relating the sensor output voltage (119881) to a gasconcentration normallymeasured in parts permillion (ppm)The goal of thismiddle layer is to input the voltage and empir-ically generate the ppm that subsequent nodes in Figure 3use The raw gas measurements captured over the sensorsare usually in millivolts (mV) and they are converted to 119881obviously by dividing by 1000 This needs to be convertedback to the resistance of the sensor using Ohmrsquos law [24] in
119877119904=
119881
119868
=
119881
119881119904119877119897
997904rArr
119881 lowast 119877119897
119881119904
(1)
where 119877119904is the resistance of the sensor 119881 is the voltage
supplied 119868 is the current over the sensor 119877119897is the constant
load resistance and 119881119904is the voltage over the sensor When a
sensor remains without power for a prolonged period of timeit possibly shows an unstable outputThis stability is regainedafter many consecutive cycles of power supply with a defined119877119897over the sensor leading the resistance of the sensor to
997904rArr 119877119904=
119881 lowast 119877119897
(119881119904minus 119877119897)
(2)
More information and the values of 119877119897and119881 can be found in
gas datasheets in [25]Therefore calibration of the gas sensorsinvolves two steps which are (i) deriving base resistance (zeropoint) and (ii) span calibration Since there is no establishedstandard that defines zero air a good reference point canbe an office area where air may be considered fresh Thesensors used here are relative no device gives the samereading for a certain concentration of gas but the relationshipbetween the readings for a particular sensor for differentconcentrations of readings is constant About ten readingscould be experimentally taken in fresh air and averaged togive the calibration point (1198770) of the gas sensor For the spancalibration subsequent readings using (2) will be comparedto 1198770 to form a ratio 119877
1199041198770 The calibration node collects
mathematical equations (3)ndash(9) and autonomously finds awell-fitted model for translating the ratio to correspondingppm depending on the known nature of the behaviour of thegas being measured and the measurement process itself Thisprocess minimises any sensor inaccuracies by regulating thereliability of its readings
The linear regression model is expressed in (3) as
= 119898 lowast 119903 + 119888 (3)
where
119898 =
(119899sum119909119910 minus sum119909sum119910)
(119899sum1199092minus (sum119909)
2)
119888 = 119910 minus 119898 lowast 119909
(4)
is the estimated ppm 119903 is the ratio and 119909 and 119910 are knownvolts and ppm The goodness of fit of the model is examinedusing the Pearson correlation coefficient 119877 in
119877 = 1 minus
sum119894((119909119894minus 119909) (119910
119894minus 119910))
radic(sum119894(119909119894minus 119909)2
) (sum119894(119910119894minus 119910)2
)
(5)
If 119909 and 119910 are linearly correlated 119877 would be strongly closeto +1 or minus1 then the system selects (4) for the calibrationOtherwise any of the four curvilinear models in (6)ndash(9) isselected depending on the highest value of 119877
Power series
119910 = 119886119909119887 (6)
Logarithmic
119910 = ln (119886119909119887) (7)
Exponential
119910 = 119886119890120572119909 (8)
Polynomial
119910 = 1198861199092minus 119887119909 + 120573 (9)
Parameters 119886 119887 120572 and 120573 are estimated by linearisingequations (6)ndash(9) which can be found in [26] In the presentcase the system selected is (i) power series for calibratinggases CO NO
2 H2 CH4 and NH
3 (ii) polynomial model
for calibrating H2S and (iii) exponential for calibrating CO
2
33 Ambient Intelligence Node for Decision Support System-Application Layer Sensors are generally believed to beimprecise and not completely accurate even after the cali-bration process To increase our confidence in the presenceof uncertainty in toxic gas sensing an intelligent DSS forreasoning over some periods of time is needed as shownin Figure 3 One of the important tasks in our remote gasmonitoring is sending early warning to safety officers throughthe real-time intelligence node based on temporal statisticalmodels for reasoning on the imprecise gas sensor readingsand allowing users interaction through the theory of situationawareness (SA) [10 27] We prefer the theory and the modelsbecause of ease in the interpretation of results fast executiontime and scalability for large multidimensional data sets
The objective of the SA was to guide safety officersthrough the decision-making process by detecting hiddenpatterns in the data captured over the WSN and revealingwhat is happening why it is happening to the environmentwhat can be done to avoid unwanted behaviour and whatwill happen next In consolidating SA we construct thetemporal statistical mean median mode standard deviationand skewness in Table 2 for describing the situation of thetoxic gases while chi-square inference based on contingencytable analyses relationships between parameters in multipleregions over time
As the toxic gases are observed over time the statisticalmodels change dynamically in values describing the locationand variability of situations based on what is intended tobe known in the regions observed Since skewness measuresthe shapes of distributions it characterises the degree ofasymmetry of a distribution around itsmean [28]Thismeansthat when skewness gt 0 or lt 0 the gas concentrations areclustered on one side and when skewness = 0 they aredistributed normally
6 International Journal of Distributed Sensor Networks
Table 2 Temporal statistical methods used in real time
Temporal statisticalmethods Their models
Mean (119909119905) and standard
deviation (SD119905)
119909119905=
1
119899
119899
sum
119894=1
119909119894
SD119905= radic
1
119899 minus 1
sum119899
119894=1(119909 minus 119909)
2
Skewness (119878119905) 119878
119905=
sum119899
119894=1(119909119894minus 119909)3
(119899 minus 1) 1199043
For analysing the relationships between gases the follow-ing five stages are required (i) a contingency table which is afrequency between two ormore variables is first constructedwhile independence between the variables is conducted bycomputing the expected values from the observed valuesusing (10) (ii) a chi-square test and degree of freedomare then computed as shown in (11) and (12) respectively(iii) a temporal probability (119901
119905) representing the degree of
independence is computed using an 1205942distribution function
as shown in (13) (iv) an inference on the relationship ismade by comparing the 119901
119905with a significant level often set
at 5 and (v) if 119901119905lt 005 the two variables thus have a
relationship otherwise no relationship can be concluded inthe contingency table as follows
119890119894119895=
sum119894119900119894119895lowast sum119895119900119894119895
sum119894sum119895119900119894119895
(10)
120594119905
2= sum
119894
sum
119895
(119900119894119895minus 119890119894119895)
2
119890119894119895
(11)
119889119891119905= (total rows minus 1) lowast (total columns minus 1) (12)
119901119905= 1205942DIST (120594
2 119889119891) (13)
It is believed that the theory of SA and the temporal statisticscan significantly minimise the number of false positivesas they combine qualitative and quantitative reasoning Tothe best of our knowledge no previous work on apply-ing decision-making to gas monitoring has considered theeffects of both theories on the accuracy of early warningThe contribution of this phase is an integration of the setof calibrated gases from multiple zones and building thetemporal statistical models for real-time decision-makingThe output of the ambient system is the provision of accurateearly warning for each zone taking into account cell phoneand E-mail communication with the safety officers
4 Experimental Field Setups
Hypothesis 1 Mobile sensing will not track the variability ofgas concentration in air as well as static sensing over WSNsindoors
(a) Static gas sensing
(b) Mobile gas sensing
Figure 5 (a) Static sensing node 1 on a filing cabinet in an aeratedoffice 5 metres away from the monitoring station (b) Sensingnode 2 on a mobile pioneer robot at the printing and networkserver section 10 metres and two doors (barriers) away from themonitoring station
R1
R2
R5
Figure 6 A mechanical engine test cell over 20 metres and fourwalls (barriers) away from Figure 4(b)
In other words it might not be necessary to implementmobile and static gas sensing overWSN indoors if it is knownahead of time that an environmental volume of air cannot bepolluted beyond absorbable levels To test the hypothesis itis necessary first to establish different fieldsrsquo setups such asFigure 5(a) showing a cross-ventilation area and Figure 5(b)with no free flow of fresh air
International Journal of Distributed Sensor Networks 7
Region Time Temp1 10 182 200 0038 251
Region Time Temp3 50 24 250 004 213
Region Time Temp2 20 22 300 003 32
Intelligence
CO
CO2 NO2 CH4 CO2 NO2 CH4
2NO2 CH4
Figure 7 Sample gases data model and the ambient intelligence
Hypothesis 2 The performance of remote monitoring ofgases in restricted areas over WSNs is not correlated toits performance in areas such as those typically found inunderground mines
An underground mine can be modelled in a more or lessdetailed fashion as a restricted area For a mine consistingof multiple features such as wall barriers the features wouldideally need to be modelled separately A real-life setup intwo aeronautic mechanical engine test cells with dimensions800m3 and 650m3 was used to test this hypothesis Althoughit will not be able to reveal whether more accurate setupsgive better results in all cases it will allow us to observethe effects of wall barriers encountered during transmissionof gas packets outside the enclosed test cell such as thosetypically found in underground mines The good news isthat our demonstrator does not rely only on line-of-sightfor transmission but also uses a direct-sequence spreadspectrum to penetrate the barriers
To assess the readiness of our system for undergroundmine deployment in terms of sensing some toxic gases andlocalising their sources the following objectives are set (i)performing ambient measurements assessing temperatureCO2 NO2 and CH
4buildup or distributions (ii) getting a
feel for the gas flow (iii) picking up other possible fumes and(iv) responding to environmental activitiesevents in the cellBecause of confidentiality in industries the real-life enginetest cell is presented as shown in Figure 6 A sensor node 119877
1
is located high up close to the inlet where fresh air enters thecell a sensor node 119877
2is located at the basement in front of
the engine and a sensor node 1198775is located behind the engine
close to the air extractor while the base monitoring station isoutside the cell
5 Experimental Results and Evaluations
From the ambient measurements the six variables capturedare quantitative data typeswhere temperature is thewarmnessof the region measured in degrees Celsius (∘C) and regionvalues are in integers while gases CO
2 CH4 and NO
2are
in ppm The time step on the 119909-axis of Figures 8 and 9 is inseconds and the interval between two time step units was setto 40 secondsThe last time step 80 on the figures implies thatthe sampling time or observations in the test cell took about
one hour The data model used in these experiments is in theform shown in Figure 7
Hypothesis 1 (indoor environments) The static and mobilesensor nodes in Figure 5 capture the concentration of gasesin the air publish a stream of gases in voltages over the WSNonto a gateway subscription and calibrate it into ppm asshown in Figure 4(b)
51 Situation Awareness for Indoors-Qualitative ReasoningThe objective here is to assess the qualitative performanceof the static sensing in a ventilated environment with theregion 1 results shown over time in Figure 8(a) whichexhibits noticeable differences when compared to the mobilesensing in an enclosed environment with region 2 results inFigure 8(b) In particular the SA questioning paradigm inthe following guides the safety officers through a decision-making process
Decision-Making Sample Qualitative Reasoning at TimeStep 90
Q1What is happening
A1 CH4concentration and temperature seem slightly
higher in 1198772than 119877
1 higher instability of CO
2in 1198771
than 1198772 slightly more NO
2concentration in 119877
1than
1198772
Q2Why is it happening
A2 Higher fresh air and noise dilution in 119877
1than 119877
2
suspicious clearer spikes in 1198772due to steady mobility
and of course machines in 1198772generate more heat
Q3What can we do about it
A3 Unwanted behaviours could be avoided if det-
onation of explosives is avoided and machines areserviced regularlyQ4What will happen next
A4 Since the concentrations approximately revolve
around the acceptable values shown in Table 1 thetwo regions seem relatively safe to health
Hypothesis 1 states that mobile sensing will not track thevariability of gas concentration in air as well as static sensingover WSNs indoors The qualitative results however show
8 International Journal of Distributed Sensor Networks
17518
18519
19520
20521
215
0 10 20 30 40 50 60 70 80 90Time steps
Temp
Tem
pera
ture
(∘C)
Monitoring toxic gases in region 1
0
1
2
3
4
5
6 Monitoring toxic gases in region 1
CH4
and
H2
gase
s(pp
m)
H2
0 10 20 30 40 50 60 70 80 90Time steps Time steps
CH4
0 10 20 30 40 50 60 70 80 90Time steps
Monitoring toxic gases in region 1
Monitoring toxic gases in region 1
0
200
400
600
800
1000
CO2
and
CO(p
pm)
CO2 CO
00360038
0040042004400460048
0050052
NO2
(ppm
)
NO2
0 10 20 30 40 50 60 70 80 90
(a) Changing in values over time within the aerated office environment in Figure 5(a)
0
100
200
300
400
500
600
700
0 10 20 30 40 50 60 70 80 90Time steps
0 10 20 30 40 50 60 70 80 90Time steps
003400350036003700380039
0040041
CO2
and
CO(p
pm)
CO2 CO
Monitoring toxic gases in region 2
Monitoring toxic gases in region 2
NO2
NO2
(ppm
)
18519
19520
20521
21522
225
0 10 20 30 40 50 60 70 80 90Time steps
Temp
01234567
0 10 20 30 40 50 60 70 80 90Time steps
Tem
pera
ture
(∘C)
Monitoring toxic gases in region 2
Monitoring toxic gases in region 2
CH4
and
H2
gase
s(pp
m)
CH4 H2
(b) Changing in values over time within an enclosed indoors area of printing environment in Figure 5(b)
Figure 8 (i) Temperature at the top left-hand corners (ii) CO2and CO expected at the top right-hand corners (iii) CH
4and H
2expected at
the bottom left-hand corners and (iv) NO2at the bottom right-hand corners of (a) and (b)
International Journal of Distributed Sensor Networks 9
0
200
400
600
800
1000
0 10 20 30 40 50 60 70 80
0 10 20 30 40 50 60 70 80
Time steps
Time steps
0
01
02
03
04
05
06
07
Monitoring toxic gases in region 1
Monitoring toxic gases in region 1
CO2
and
CO(p
pm)
NO2
(ppm
)
CO2CO
NO2
155
16
165
17
175
18
185
0 10 20 30 40 50 60 70 80Time steps
0 10 20 30 40 50 60 70 80Time steps
Temp
0
2
4
6
8
10
Tem
pera
ture
(∘C)
Monitoring toxic gases in region 1
Monitoring toxic gases in region 1
CH4H2
CH4
and
H2
gase
s(pp
m)
(a) Changing in values over time with high instability of concentrations at the fresh air inlet 1198771 in Figure 6
15516
16517
17518
18519
195
0
2
4
6
8
10
0 10 20 30 40 50 60 70 80Time steps
Tem
pera
ture
(∘C)
0 10 20 30 40 50 60 70 80Time steps
Temp
Monitoring toxic gases in region 2
Monitoring toxic gases in region 2
CH4
and
H2
gase
s(pp
m)
CH4H2
0
200
400
600
800
1000
0002004006008
01012014016
0 10 20 30 40 50 60 70 80Time steps
Monitoring toxic gases in region 2
Monitoring toxic gases in region 2
0 10 20 30 40 50 60 70 80Time steps
NO2
(ppm
)CO2
and
CO(p
pm)
CO2CO
NO2
(b) Changing in values over time within the testing region 1198772 of the engine in Figure 6Figure 9 Continued
10 International Journal of Distributed Sensor Networks
24
23
22
21
20
19
18
170 10 20 30 40 50 60 70 80
Time0 10 20 30 40 50 60 70 80
0 10 20 30 40 50 60 70 80
Time
Time
T
Tem
pera
ture
(∘C)
900
800
700
600
500
400
300
200
100
0
CO2
and
CO (p
pm)
CO2CO
0 10 20 30 40 50 60 70 80Time
12
10
8
6
4
2
0
CH4
and
H2
gase
s (pp
m)
CH4H2
016
014
012
01
008
006
004
002
0
NO2
(ppm
)
NO2
Monitoring toxic gases in region 5
(c) Changing in values over time at the air extractor region 1198775 shown in Figure 6
Figure 9 (i) Temperature at the top left-hand corners (ii) CO2and CO expected at the top right-hand corners (iii) CH
4and H
2expected at
the bottom left-hand corners and (iv) NO2at the bottom right-hand corners of (a) (b) and (c)
that it is not the case implying that mobile sensing accuratelycaptures the dynamism in region 2 as well as static sensingdoes in region 1
Hypothesis 2 (mechanical engine field test cell)
52 Situation Awareness of Engine Test Cell-Qualitative Rea-soning The objective here is to access the qualitative per-formance of a restricted engine test cell for an undergroundmine The underlying objectives are to assess (i) temperatureand get a feel for its flow (ii) CO
2and NO
2buildup and (iii)
other possible fumesDecision-Making Sample Qualitative Reasoning at Time
Step 80
Q1What is happening
A1 From 119877
1ndash1198775 at time step 80 NO
2reduces from
05 to 008 CO2from 400 to 300 ppm though the
engine emitsmoreCO2in1198772 H2fumeswere detected
in the cell around time step 20 but disappearedover time with CH
4 temperature gradually increases
across 1198771ndash1198775
Q2Why is it happening
A2 The air extractor proves effective as the concen-
tration drops towards the outlet 1198775 an event with fire
took place at step 20 giving rise to H2fumes
Q3What can we do about it
A3The air extractormust bemaintained anddeclared
effectively before testing any engine
Q4What will happen next
International Journal of Distributed Sensor Networks 11
Table 3 Quantitative results of region 1 shown in Figure 9(a)
1199050sdot sdot sdot 11987980
Temp CO2 NO2 CH4 H2
Mean 1702889 3692593 0208272 1301235 0223457Standard error 009528 2497194 0017473 0299694 0097962Median 17 360 018 0 0Mode 16 50 004 0 0Standard deviation 0857524 2247475 0157256 2697244 0881656Skewness minus009152 0917227 1269842 1814768 37771971205942= 39737 df = 340 Prob = 00173
A4 Staying away from 119877
2is recommended in view
of too high CO2concentration though the entire test
cell seems safe to engineers
53 Situation Awareness of Engine Test Cell-QuantitativeReasoning From the real-time monitoring of the engine testcell we specifically assess the quantitative performance of ourambient intelligence approach to consolidate the qualitativereasoning ranging from the use of temporal statistics tofinding dependencies between parametersWe set and imple-mented five research questions in the following These assistin sending early warning whenever hazardous observationsaremade over time as indicated in Figure 6Wewant to knowthe following over time
q1What is the level of health safety in each of the three
regions in the engine test cellq2 What concentrations of the gases are commonly
sensed in most regionsq3 At what temperature levels are the gasesrsquo concentra-
tions being sensedq4Are there any interesting events that could be picked
up from the gasesrsquo distributionsq5 Is there any relationship between CH
4concentra-
tions and the temperature of the region
Having implemented the temporal statistical models theresults obtained at time step 80 in Tables 2ndash4 provide answersto the research questions and substantiate the qualitativeresults reflected in Figure 9 It can be noted that all observedresults are quite accurate from a general standpoint as moststandard errors compared to themean values are less than 5in all regions
An interesting observation that can be made from theengine test cell is that the air extractor inlet (119877
1) and outlet
(1198775) are working perfectly The reason for this is that the
average of most of the gases suspended in air is more in 1198772
but lower in regions 1198771and 119877
5 In Table 3 119877
1is largely safe
when the mean values are compared to the normal gasesrsquovalues in Table 1 In Table 4 region 2 is where the engineis run the system becomes aware of the emission of moreCO2 that is increasing concentration to 900 ppm making
it unsafe unlike other gases For the outlet in 1198775 however
Table 5 shows a quick reduction in CO2to 300 ppm making
the region safe as it is for other gases This answers questionq1and autonomously sends an sms to safety agents
At the 80th time step concentrations commonly sensedin regions 119877
1 1198772 and 119877
5are shown on the modal rows
within temperature = 16∘C 17∘C and 21∘C respectively Thetemperature reveals the direction of heat flowThe tables showthat CH
4and H
2are rarely found in the cell while NO
2is
constantly low It is concluded that enough noise is present atthe inlet in region 1 with a low 50 ppm concentration of CO
2
compared with other regions This answers questions q2and
q3and autonomously sends a message to the mobile phones
of the safety agentsThe values of skewness in the three tables are greater or
less than 0 showing clearly that events took place in theengine test cell (i) three safety agents opened a door intooutof the cell and (ii) a fire was ignited from a nozzle for tracingwind direction in the cell leading to the detection of H
2
gas in the process This actually correlates with the results inFigure 9 and answers question q
4
Since the degrees of independence or probability (of 1198832in 1198771and 119877
2) lt 005 it implies that there is a relationship
between CH4and temperature However there may not be a
relationship between them in region 3 since the probability(= 09606) gt 005 It reveals that a higher temperature reflectsa high CH
4concentration and vice versa This interestingly
conforms to the properties of CH4shown in Table 1 This
answers question q5
There are diverse discoveries of knowledge that thesystem could reveal but our main questions q
119899are needed
in order to focus on the hypotheses Hypothesis 2 states thatthe performance of remote monitoring of gases in restrictedareas such as the engine test cell overWSNs is not correlatedto its performance in areas such as those typically found inunderground mines These experiments however showedthat this is not the case implying that they are correlated
54 Benchmarking Our Quantitative Reasoning with Pub-licly Available Observations and Methods One of the waysto substantiate the reliability of our demonstrator is tobenchmark its quantitative reasoning with publicly availableair observations and methods The Texas commission onenvironmental air quality captures hourly data collected inparticular in the CPS Pecan Valley C678 Heritage MiddleSchool C622 and Calaveras Lake C59 regions of San Antoniometropolitan area USA in [29] The information is updatedhourly and it is officially certified by the technical staff Theair gas pollutants considered in this study are CO SO
2 and
NO2 with different temperatures in an apparent one-hour
12 International Journal of Distributed Sensor Networks
Table 4 Quantitative results of region 2 shown in Figure 9(b)
1199050sdot sdot sdot 11987980
Temp CO2 NO2 CH4 H2
Mean 1750074 6129259 0080642 1230864 1033333Standard error 0077014 3235313 0003432 0194949 0212597Median 17 581 008 01 0Mode 17 999 004 0 0Standard deviation 0693128 2911782 003089 175454 1913374Skewness 0985312 0023658 0225995 1176821 24654371205942= 69699 df = 312 Prob = 200119864 minus 31
Table 5 Quantitative results of region 5 shown in Figure 9(c)
1199050sdot sdot sdot 11987980
Temp CO2 NO2 CH4 H2
Mean 2017654 3598519 006537 2447654 1174074Standard error 0214816 1580476 0011157 0285151 0214534Median 209 340 0046 22 0Mode 21 299 004 0 0Standard deviation 1933344 1422428 0100415 2566361 1930806Skewness minus027947 0982282 8174952 0706862 15699311205942= 80287 df = 875 Prob = 09606
time lag in the dataThe sample data for August 25 2012 wasintegrated into our temporal statistical models implementedin a Python distributed programming environment
The temporal quantitative results obtained at time step23 pm in Table 6 provide answers to most of the researchquestions especially question q
1on the level of health
safety in the metropolitan area which the Texas commissionprovides for benchmarking An interesting observation thatcan be made from the area is that the average of most ofthe gases suspended in air is fairly higher in the HeritageMiddle School C622 and Calaveras Lake C59 regions butlower in the CPS Pecan Valley C678 region In Table 6 ourtemporal quantitative reasoning shows that the top region(CPS Pecan) is fairly safe when the mean values of the gasesare compared to the acceptable values in air except for NO
2
which is 1896 ppm In themiddle region in Table 6 themeanvalues of SO
2and NO
2gases increase to concentrations of
2608 ppm and 1658 ppm respectively making itmanageableor fairly unsafe except CO which is within the acceptablerange For the bottom region however Table 6 shows rela-tively more NO
2with 1642 ppm making the region fairly
unsafemanageable though other gases are not recordedAlthough our early warning decision to the safety agents isvery meticulous one can see that our quantitative reasoningon the level of health safety is well correlated with the Texasair quality index (AQI) decisions This answers the mainquestion q
1 which benchmarks the two methods and shows
the reliability of our approach
55 Comparative Evaluations of the Proposed Framework withOther Related Methods The evaluation of the contributionto mine safety using our proposed framework indicates thatit is similar to the contributions derived from the relatedmethods A comparison of the related methods and the
proposed framework is summarised in Table 7The compari-son and application of the related methods and the proposedframework to achieve mine safety and monitoring of toxicgases in particular show that our approach is comparativelycomplementary and building on the related baselinemethodswith regard to the following aspects
(a) Methodology (i) the proposed system is a reactiveremote monitoring framework developed for real-time gas sensing which spans physical layers throughapplication space (ii) the modelling of the theory inWSNs Ohmrsquos law concepts of static andmobile robotsensing and derivations of curvilinear gas calibrationequations are intended to achieve autonomy (iii)our approach implements distributed sensors morecheaply than the big sophisticated sensors whichcould be laborious to set up or expensive for devel-oping minescountries Thus every methodology inTable 7 is obviously driven by the problem focus
(b) Decision support system (i) integrating intelligentDSS with distributed WSN for remotely monitoringtoxic gases builds on the baseline produced by therelated methods (ii) the ambient intelligence basedon temporal statistical methods governing decision-making for miners works well with both qualitativeas well as quantitative parameters (iii) this decision-making technique is comparatively easy to use as it islighter than using computationally time-consumingalgorithms that could be heavy weight affecting ourreal-time system with time lag
(c) Field work (i) our approach monitors gases remotelyin a real-life engine test cell such as those typicallyfound in underground mines generating knowledgeto improve safety with an assurance of assistance
International Journal of Distributed Sensor Networks 13
Table 6 Benchmarking our approach with USA San Antonio metropolitan regions and its AQI method determining the health safety status
Regions 1200sdot sdot sdot2300 Temp CO SO2 NO2 Our approach Texas AQIMean 82820833 0291667 0020833 1895833
Standard error 1185525 0005763 0020833 0129726Median 8205 03 0 195
CPS Pecan Valley c678 Mode 77 03 0 2 Fairly safe GoodStandard deviation 5807864 0028233 0102062 0635527
Kurtosis minus1002790 9123966 24 minus0701763Skewness 0368065 minus3219960 4898979 0265184Mean 83545833 04 2608333 1658333
Standard error 1112332 231498119864 minus 17 0859725 0441297Median 8265 04 02 06
Heritage Middle School Mode 771 04 0 0 Fairly unsafe ModerateStandard deviation 5449290 11341119864 minus 16 4211776 2161907
Kurtosis minus0947188 minus2190476 3683374 2008987Skewness 0473571 minus1067940 1889303 1575467Mean 8435 0 0 1641667
Standard error 1448200 0 0 0124516Median 835 0 0 145
Calaveras Lake C59 Mode 785 0 0 15 Fairly unsafe ModerateStandard deviation 7094701 0 0 0610001
Kurtosis minus0903842 0 0 1366540Skewness 0464159 0 0 1440687
whenever required (ii) knowledge of how to imple-ment DSS and WSN approaches and how to makethemprofitable in improvingminersrsquo safety is demon-strated (iii) the proposed model not only assistsmine managementcompanies in doing simulationslike most related methods but has also done real-lifefield work indoors and in an aeronautic engine testcell similar to those typically found in undergroundmines
6 Concluding Remarks
The study on remote monitoring of toxic gases targetingunderground mines has analysed various aspects of usinga WSN SA and temporal statistical models as ambientintelligence in an attempt to effect autonomous decision-making in real time Some of the main conclusions that canbe drawn from the experiments and analysis are as follows
(i) Every implementation node in our framework func-tions as well as the pioneer robot when all its param-eters are configured appropriately
(ii) The experiments confirmed some of the claims dis-covered in the literature survey about toxic gasesOhmrsquos law statistical methods the theory of SA anddirect correlation of the properties of the engine testcell and underground mines
(iii) Even the simple ambient intelligence proposed basedon the temporal statistics provides better results
than common qualitative decision-making throughconsolidation
(iv) The chosen gas calibration equations may have con-siderable effects on the accuracy of the ppm results
(v) It is assumed that the robot navigates moderately toadd extra airflow to the sensing node as it perceiveshigher evident peaks
While working on the research project a number of possiblevariations on the experimentswere considered yet not imple-mented These are listed here as topics for future research
(i) detecting redundant sensor nodes and optimal sensorplacement
(ii) autonomous determination of battery lifetime andremotely hibernating battery power
(iii) noise removal and alternative decision-making mod-els
(iv) integrating Figures 2 and 3 to improve safety in under-ground mines
The approach of defining hypotheses before performingexperiments has advanced researchersrsquo knowledge in anintriguing approach to studying problems and their potentialsolutions Thus this is a directed research project affectinglives by improving health safety and therefore ready fordeployment in underground mines
14 International Journal of Distributed Sensor Networks
Table 7 Comparative evaluations of mine safety methods for toxic gases
Related work Problemfocusobjective Methodology Results DSS Field work
Minming et al 2009 [17] Data aggregationmodelling
(i) Directeddiffusion(ii) Geographicalinformationmetrics
Addresses dataredundancy andtransmission delay
NA(i) NA(ii) Simulation
Yuan et al 2009 [18]High energyconsumption inlong-distanceroadway
Uneven fixedcluster and mixedrouting
Good networklifetime andconnectivity
NA(i) NA(ii) Simulation
Niu et al 2007 [19]Design WSN formine safetymonitoring
Overhearing-basedadaptive datacollecting scheme
Reduces traffic andcontrol overheads NA Real-life test
Shao et al 2008 [20] Safety monitoringsystem of mine Ad hoc technology
Design of physicalMAC and networklayers
Manual Not specified
Wu et al 2010 [21]Networkdeployment andmultihop routingpatterns
BRIT (bouncerouting in tunnels)algorithm
Hybrid signalpropagation modelinthree-dimensionalundergroundtunnels
NA(i) NA(ii) Simulation
Government practices [22] Monitoring toxicgases
(a) Trainings(b) Ventilation(c) Lag time(d) Big sensors
Laborious andinaccurate Manual Reallife
Proposed system modelDecision-makingin monitoring toxicgases
(i) Distributedportable sensors(ii) Calibrationalgorithm(iii) Regressionmodels(iv) Ohmrsquos law(v) Static andmobile sensing andphones
(i) Satisfactory(ii) Real-time andremote monitoring
(i) Autonomous(ii) Ambientintelligence(iii) Temporalstatistical models
(i) Real-life test(ii) Aeronauticengine test cell(iii) Indoors
Acknowledgments
The author gratefully acknowledges resources and financialsupport made available by the University of South Africa(UNISA) and the Council for Scientific and IndustrialResearch (CSIR) South Africa
References
[1] M Mohner M Lindtner H Otten and H G Gille ldquoLeukemiaand exposure to ionizing radiation among German uraniumminersrdquo American Journal of Industrial Medicine vol 49 no 4pp 238ndash248 2006
International Journal of Distributed Sensor Networks 15
[2] M C Betournary ldquoUnderground mining and its surfaceeffectsrdquo Interstate Technical Group on Abandoned Under-groundMines Fourth Biennial Abandoned UndergroundMineWorkshop Report MMSL 02-021 2010
[3] M Kreuzer L Walsh M Schnelzer A Tschense and BGrosche ldquoRadon and risk of extrapulmonary cancers results ofthe German uranium minersrsquo cohort study 1960ndash2003rdquo BritishJournal of Cancer vol 99 no 11 pp 1946ndash1953 2008
[4] MHSC httpwwwmhscorgza[5] R S Conti Fire-fighting resources and fire preparedness for
underground coal mines National Institute for OccupationalSafety and Health Pittsburgh Research Laboratory 1994
[6] Swansea Station httpwwwswanseaairqualitydatacomcgi-binfaqscgi1009
[7] Ohio Station httpwwwnytimescom20060927us27steub-envillehtml
[8] E R Musaloiu A Terzis K Szlavecz A Szalay J Cogan andJ Gray ldquoLife under your feet a wireless soil ecology sensor net-workrdquo in Proceedings of the 3rd IEEE Conference on EmbeddedNetworked Sensors (EmNetS rsquo06) 2006
[9] S Li S H Son and J A Stankovic ldquoEvent detection servicesusing data service middleware in distributed sensor networksrdquoin Proceedings of the 2nd International Conference on Infor-mation Processing in Sensor Networks (IPSN rsquo03) pp 502ndash517Springer Berlin Heidelberg 2003
[10] A B Bagula I Osunmakinde and M Zennaro ldquoOn therelevance of using Bayesian belief networks in wireless sensornetworks situation recognitionrdquo Sensors vol 10 no 12 pp11001ndash11020 2010
[11] T Melodia M C Vuran and D Pompili ldquoThe state-of-the-artin cross-layer design for wireless sensor networksrdquo in WirelessSystemNetwork Architect M Cesana and L Fratta Eds vol3883 of Lecture Notes in Computer Science pp 78ndash92 SpringerHeidelberg Germany 2006
[12] M G D Benedetto and G Giancola Understanding UltraWideband Radio Fundamentals Prentice Hall Upper SaddleRiver NJ USA 2004
[13] M Z Win and R A Scholtz ldquoUltra-wide bandwidth time-hopping spread-spectrum impulse radio for wireless multiple-access communicationsrdquo IEEE Transactions on Communica-tions vol 48 no 4 pp 679ndash691 2000
[14] Y Yuan Z Shen W Quan-Fu and S Pei ldquoLong distancewireless sensor networks applied in coalminerdquo Journal ProcediaEarth and Planetary Science vol 1 pp 1461ndash1467 2009
[15] K R Rogers S L Harper and G Robertson ldquoScreeningfor toxic industrial chemicals using semipermeable membranedevices with rapid toxicity assaysrdquo Analytica Chimica Acta vol543 no 1-2 pp 229ndash235 2005
[16] Inspectapedia httpinspectapediacomhazmatEnvironmentBuildingphp
[17] T Minming N Jieru W Hu and L Xiaowen ldquoA data aggre-gation model for underground wireless sensor networkrdquo inProceedings of theWRIWorld Congress on Computer Science andInformation Engineering (CSIE rsquo09) vol 1 pp 344ndash348 April2009
[18] Y Yuan Z Shen W Quan-Fu and S Pei ldquoLong distance wire-less sensor networks applied in coal minerdquo Journal of ProcediaEarth and Planetary Science vol 1 no 1 pp 1461ndash1467 2009
[19] X Niu X Huang Z Zhao Y Zhang C Huang and L CuildquoThe design and evaluation of a wireless sensor network formine safetymonitoringrdquo in Proceedings of the 50th Annual IEEE
Global Telecommunications Conference (GLOBECOM rsquo07) pp1291ndash1295 November 2007
[20] Q L Shao Z X Zhang and Z C Zhang ldquoResearch on safetymonitoring system of mine based on ad hoc technologyrdquo inProceedings of the International Conference on InformationMan-agement Innovation Management and Industrial Engineering(ICIII rsquo08) vol 2 pp 450ndash453 December 2008
[21] DWu L Bao and R Li ldquoA holistic approach to wireless sensornetwork routing in underground tunnel environmentsrdquo Journalof Computer Communications vol 33 no 13 pp 1566ndash15732010
[22] Centers for Disease Control and Prevention Atlanta USAhttpwwwcdcgovnioshminingtopicsVentilationhtml
[23] R Lin Z Wang and Y Sun ldquoWireless sensor networks solu-tions for real time monitoring of nuclear power plantrdquo inProceedings of the 5th World Congress on Intelligent Control andAutomation (WCICA rsquo04) pp 3663ndash3667 June 2004
[24] J Hashem T Liu Z Liang and J Ye ldquoUsing Ohmrsquos lawto calibrate a picoammeter to 04 pico-ampere precisionrdquoAmerican Journal of Undergraduate Research vol 10 no 1 9pages 2011
[25] httpwwwlibeliumcomproducts httpwwwfuturleccomGas Sensorsshtml
[26] C Sophocleous and R J Wiltshire ldquoOn linearizing systemsof diffusion equationsrdquo Journal of Symmetry Integrability andGeometry vol 2 article 004 11 pages 2006
[27] M R Endsley ldquoTheoretical underpinnings of situation aware-ness a critical reviewrdquo in Situation Awareness Analysis andMea-surement M R Endsley and D J Garland Eds LEA MahwahNJ USA 2000
[28] N Maxwell Data Matters Conceptual Statistics for a RandomWorld Key College Emeryville Calif USA 2004
[29] Texas Commission on Environmental Air Pollution Data Qual-ityUSA httpwwwtceqtexasgovairqualitymonopshourlydatahtml
International Journal of
AerospaceEngineeringHindawi Publishing Corporationhttpwwwhindawicom Volume 2014
RoboticsJournal of
Hindawi Publishing Corporationhttpwwwhindawicom Volume 2014
Hindawi Publishing Corporationhttpwwwhindawicom Volume 2014
Active and Passive Electronic Components
Control Scienceand Engineering
Journal of
Hindawi Publishing Corporationhttpwwwhindawicom Volume 2014
International Journal of
RotatingMachinery
Hindawi Publishing Corporationhttpwwwhindawicom Volume 2014
Hindawi Publishing Corporation httpwwwhindawicom
Journal ofEngineeringVolume 2014
Submit your manuscripts athttpwwwhindawicom
VLSI Design
Hindawi Publishing Corporationhttpwwwhindawicom Volume 2014
Hindawi Publishing Corporationhttpwwwhindawicom Volume 2014
Shock and Vibration
Hindawi Publishing Corporationhttpwwwhindawicom Volume 2014
Civil EngineeringAdvances in
Acoustics and VibrationAdvances in
Hindawi Publishing Corporationhttpwwwhindawicom Volume 2014
Hindawi Publishing Corporationhttpwwwhindawicom Volume 2014
Electrical and Computer Engineering
Journal of
Advances inOptoElectronics
Hindawi Publishing Corporation httpwwwhindawicom
Volume 2014
The Scientific World JournalHindawi Publishing Corporation httpwwwhindawicom Volume 2014
SensorsJournal of
Hindawi Publishing Corporationhttpwwwhindawicom Volume 2014
Modelling amp Simulation in EngineeringHindawi Publishing Corporation httpwwwhindawicom Volume 2014
Hindawi Publishing Corporationhttpwwwhindawicom Volume 2014
Chemical EngineeringInternational Journal of Antennas and
Propagation
International Journal of
Hindawi Publishing Corporationhttpwwwhindawicom Volume 2014
Hindawi Publishing Corporationhttpwwwhindawicom Volume 2014
Navigation and Observation
International Journal of
Hindawi Publishing Corporationhttpwwwhindawicom Volume 2014
DistributedSensor Networks
International Journal of
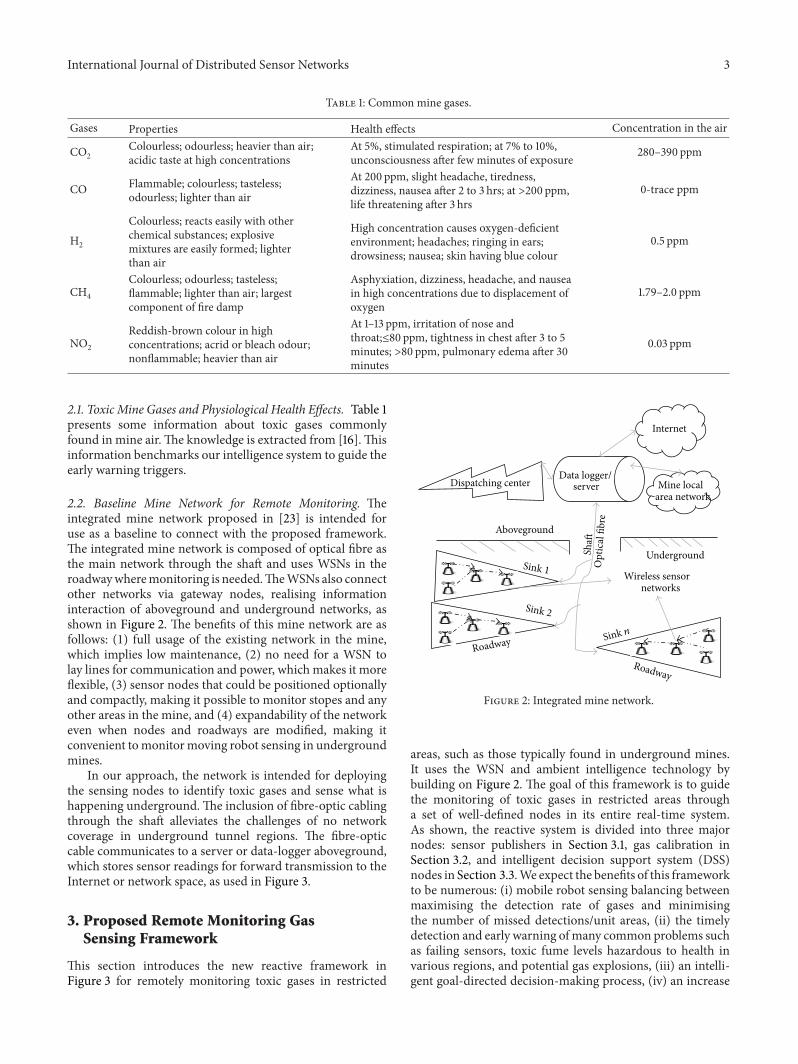
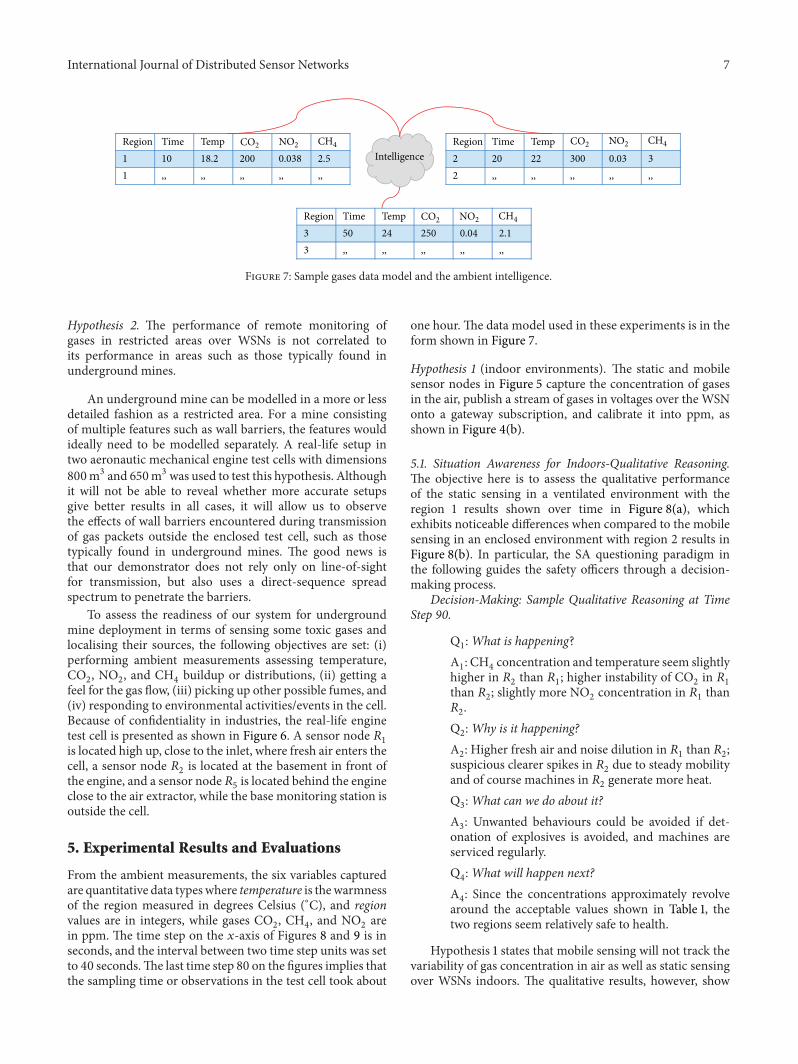
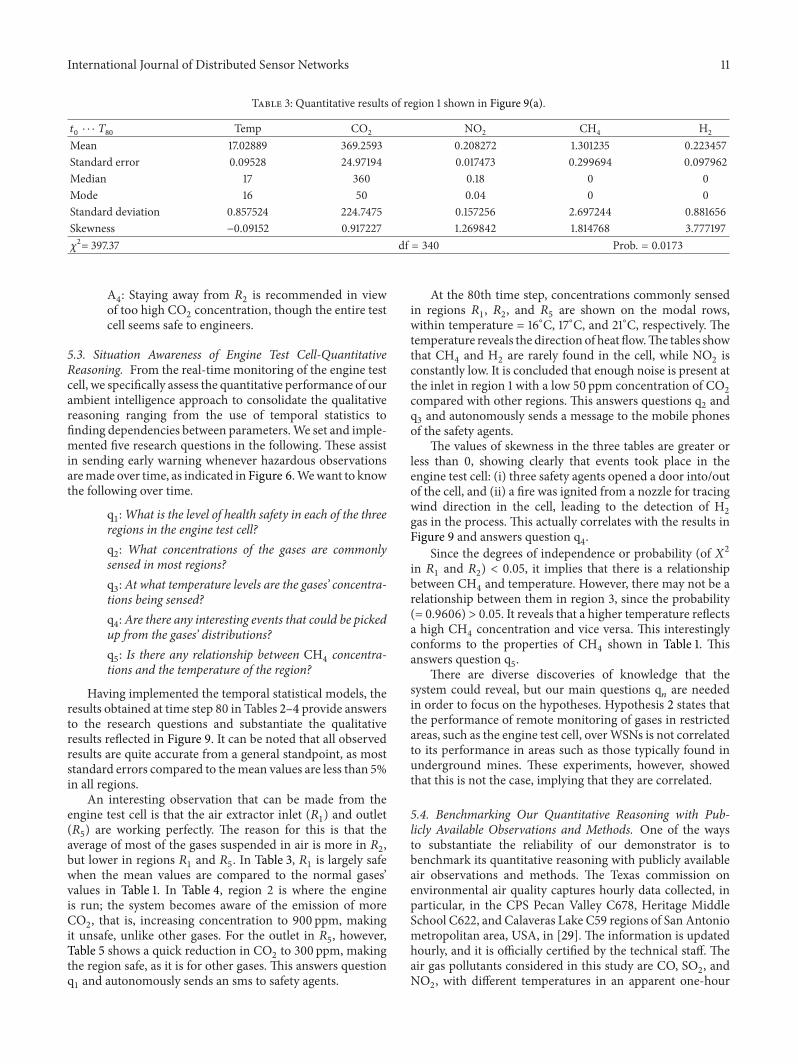
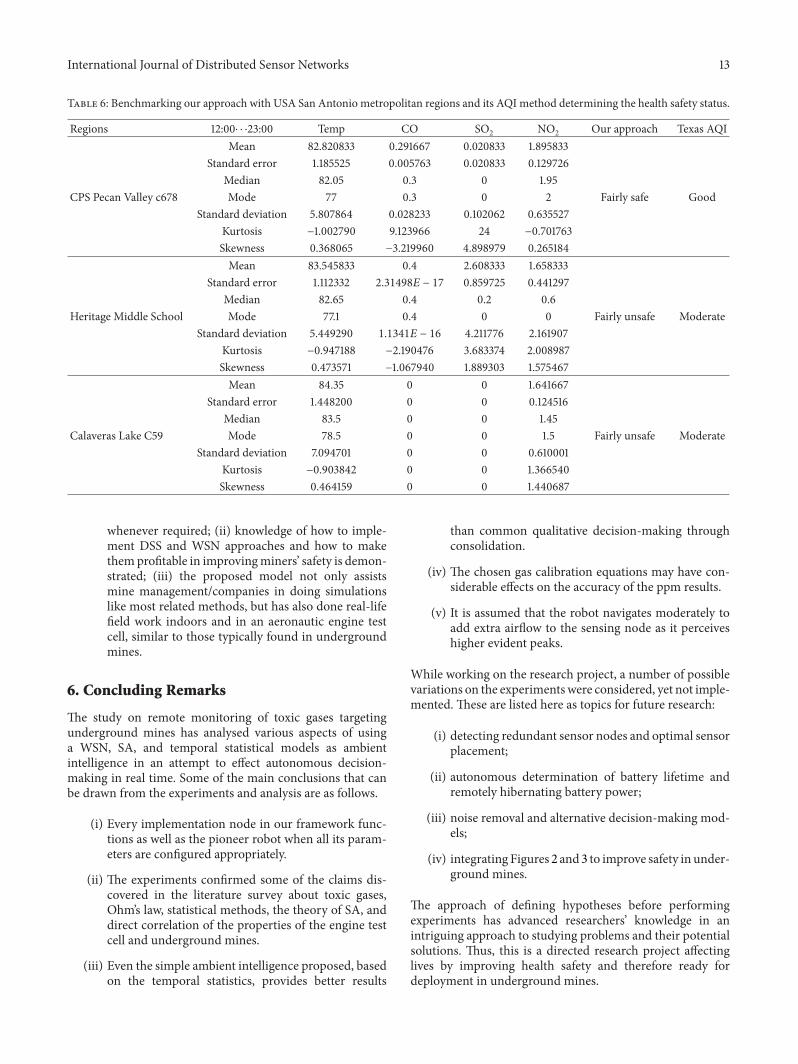

International Journal of
AerospaceEngineeringHindawi Publishing Corporationhttpwwwhindawicom Volume 2014
RoboticsJournal of
Hindawi Publishing Corporationhttpwwwhindawicom Volume 2014
Hindawi Publishing Corporationhttpwwwhindawicom Volume 2014
Active and Passive Electronic Components
Control Scienceand Engineering
Journal of
Hindawi Publishing Corporationhttpwwwhindawicom Volume 2014
International Journal of
RotatingMachinery
Hindawi Publishing Corporationhttpwwwhindawicom Volume 2014
Hindawi Publishing Corporation httpwwwhindawicom
Journal ofEngineeringVolume 2014
Submit your manuscripts athttpwwwhindawicom
VLSI Design
Hindawi Publishing Corporationhttpwwwhindawicom Volume 2014
Hindawi Publishing Corporationhttpwwwhindawicom Volume 2014
Shock and Vibration
Hindawi Publishing Corporationhttpwwwhindawicom Volume 2014
Civil EngineeringAdvances in
Acoustics and VibrationAdvances in
Hindawi Publishing Corporationhttpwwwhindawicom Volume 2014
Hindawi Publishing Corporationhttpwwwhindawicom Volume 2014
Electrical and Computer Engineering
Journal of
Advances inOptoElectronics
Hindawi Publishing Corporation httpwwwhindawicom
Volume 2014
The Scientific World JournalHindawi Publishing Corporation httpwwwhindawicom Volume 2014
SensorsJournal of
Hindawi Publishing Corporationhttpwwwhindawicom Volume 2014
Modelling amp Simulation in EngineeringHindawi Publishing Corporation httpwwwhindawicom Volume 2014
Hindawi Publishing Corporationhttpwwwhindawicom Volume 2014
Chemical EngineeringInternational Journal of Antennas and
Propagation
International Journal of
Hindawi Publishing Corporationhttpwwwhindawicom Volume 2014
Hindawi Publishing Corporationhttpwwwhindawicom Volume 2014
Navigation and Observation
International Journal of
Hindawi Publishing Corporationhttpwwwhindawicom Volume 2014
DistributedSensor Networks
International Journal of