towards an investment case for neglected tropical diseases documents/downloads/towards an... ·...
TRANSCRIPT
LANCET COMMISSION ON INVESTING IN HEALTH WORKING PAPER
Towards an Investment Case for Neglected Tropical Diseases
Including new analysis of the cost of intervening against preventable NTDs in sub-Saharan Africa
Anthony Seddoh1 Adiele Onyeze2
John Owusu Gyapong3 Janet Holt4
Donald Bundy4
July 29 2013 DRAFT
The findings, interpretations, and conclusions expressed in this document represent the views of the authors and do not
necessarily reflect the views of their organizations, or the governments they may represent.
1 Centre for Health and Social Services; Accra, Ghana; International Finance Corporation; Washington DC,USA.
2 World Health Organization, Regional Office for Africa; Brazzaville, Republic of the Congo
3 University of Ghana; Accra, Ghana
4 Human Development Network, Africa Region, The World Bank, Washington DC, 20433, USA
(Author for correspondence: [email protected])
1
Summary
Background
Neglected Tropical Diseases (NTDs) are most common among the poor and rural populations.
They are endemic in 149 countries and affect an estimated 1.4 billion people with insidious,
chronic and debilitating morbidity. WHO has proposed a roadmap for eradication and
elimination by 2020. Of the 17 NTDs recognized by WHO, five may be controlled by
preventive chemotherapy (PCT) based on mass drug administration, and five by intensified
disease management (IDM). Treatments for these ten have been donated through the London
Declaration by pharmaceutical manufacturers. This paper estimates the cost of delivering the
donated treatments, using a review of existing studies as well as a new analysis for PCT
NTDs in Africa. The cost of controlling the other seven NTDs is not discussed here, through
lack of data.
Methods and Findings
Previous cost estimates were collected from desk reviews of regional programs and from a
“top-down” funding gap analysis of the resources needed to achieve the global goals of the
London Declaration. We have conducted a new ‘bottom-up’ cost analysis, based on the
national plans for NTD programs developed with the support of WHO by the governments in
36 countries in sub-Saharan Africa. This estimates the elimination costs through 2040 for the
five PCT NTDs in Africa, which contribute 90% of the NTD burden on the continent, at
US$0.26 per capita annually. The “top-down” and “bottom-up” estimates suggest the annual
resource requirements in Africa for PCT NTDs are US$142 million and U$199 million
respectively, while the management of IDM NTDs is estimated at 6.3% and 8.4% of these
totals, respectively. There is considerable variation between the estimated costs for IDM
diseases, suggesting that further research is required into the costs of these diseases in
particular.
Conclusion
The elimination of the ten NTDs for which drugs have been donated by the pharmaceutical
industry, represents good value for money, given the very low per capita expenditure and the
high realism of the outcome based on well-documented experience. Much of the burden of
NTDs in 1.4 billion of the poorest people in South Asia and sub-Saharan Africa could be
prevented for an annual cost that is likely well under US$1 billion, and probably around
US$300 million to US$400 million per annum, through a combination of community based
MDA and case management. The investment would decline beyond 2020 as transmission is
interrupted and as the public health challenge reduces to a level that can be managed by the
public health system, adding to the aggregate cost-efficiency of this approach in the long run.
2
Contents Summary .................................................................................................................................... 1
1. Introduction ............................................................................................................................ 3
2. Background ............................................................................................................................ 4
2.1 The Burden of NTDs ....................................................................................................... 4
2.2 Availability of Treatment ................................................................................................. 7
2.3 Existing NTD Cost Estimates .......................................................................................... 9
3. New Analysis of NTD Costs for Sub-Saharan Africa ......................................................... 11
3.1 Methodology .................................................................................................................. 11
3.2 Cost Estimates ................................................................................................................ 14
4. Discussion ............................................................................................................................ 19
4.1 Limitations ..................................................................................................................... 19
4.2 Comparing Cost Estimates ............................................................................................. 20
5. Conclusion ........................................................................................................................... 22
References ................................................................................................................................ 23
Appendix. Projected Target Populations ................................................................................. 26
3
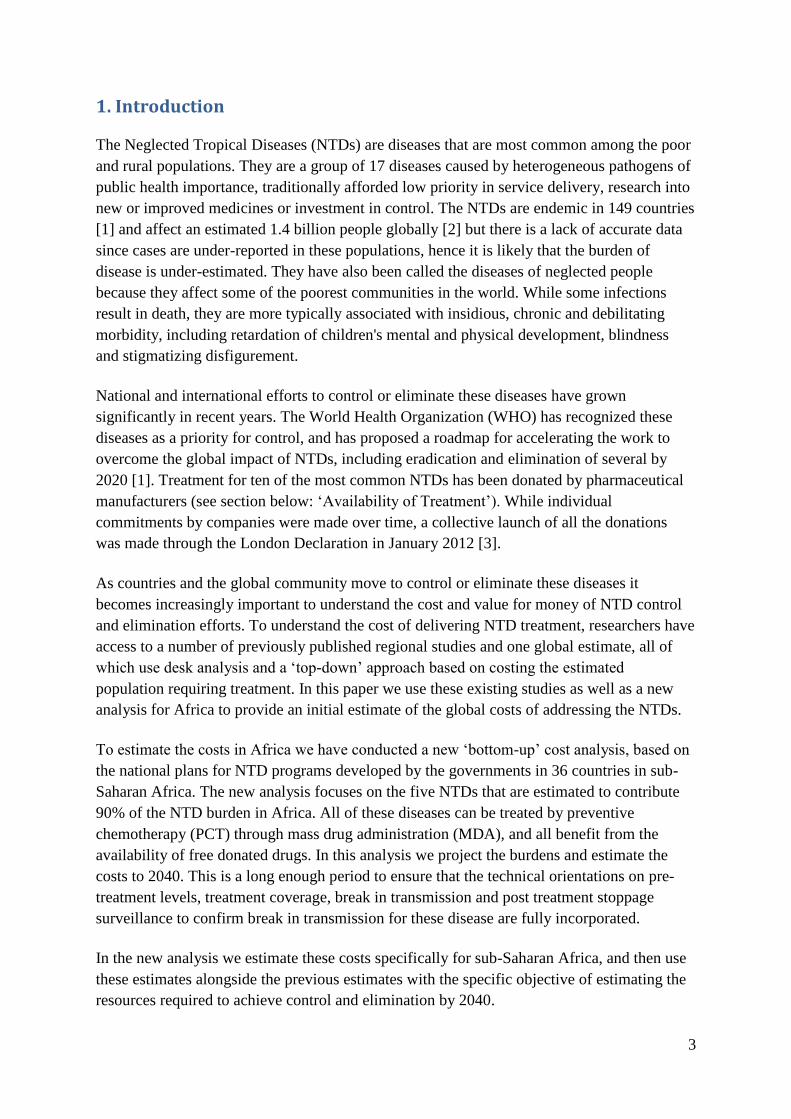
1. Introduction
The Neglected Tropical Diseases (NTDs) are diseases that are most common among the poor
and rural populations. They are a group of 17 diseases caused by heterogeneous pathogens of
public health importance, traditionally afforded low priority in service delivery, research into
new or improved medicines or investment in control. The NTDs are endemic in 149 countries
[1] and affect an estimated 1.4 billion people globally [2] but there is a lack of accurate data
since cases are under-reported in these populations, hence it is likely that the burden of
disease is under-estimated. They have also been called the diseases of neglected people
because they affect some of the poorest communities in the world. While some infections
result in death, they are more typically associated with insidious, chronic and debilitating
morbidity, including retardation of children's mental and physical development, blindness
and stigmatizing disfigurement.
National and international efforts to control or eliminate these diseases have grown
significantly in recent years. The World Health Organization (WHO) has recognized these
diseases as a priority for control, and has proposed a roadmap for accelerating the work to
overcome the global impact of NTDs, including eradication and elimination of several by
2020 [1]. Treatment for ten of the most common NTDs has been donated by pharmaceutical
manufacturers (see section below: ‘Availability of Treatment’). While individual
commitments by companies were made over time, a collective launch of all the donations
was made through the London Declaration in January 2012 [3].
As countries and the global community move to control or eliminate these diseases it
becomes increasingly important to understand the cost and value for money of NTD control
and elimination efforts. To understand the cost of delivering NTD treatment, researchers have
access to a number of previously published regional studies and one global estimate, all of
which use desk analysis and a ‘top-down’ approach based on costing the estimated
population requiring treatment. In this paper we use these existing studies as well as a new
analysis for Africa to provide an initial estimate of the global costs of addressing the NTDs.
To estimate the costs in Africa we have conducted a new ‘bottom-up’ cost analysis, based on
the national plans for NTD programs developed by the governments in 36 countries in sub-
Saharan Africa. The new analysis focuses on the five NTDs that are estimated to contribute
90% of the NTD burden in Africa. All of these diseases can be treated by preventive
chemotherapy (PCT) through mass drug administration (MDA), and all benefit from the
availability of free donated drugs. In this analysis we project the burdens and estimate the
costs to 2040. This is a long enough period to ensure that the technical orientations on pre-
treatment levels, treatment coverage, break in transmission and post treatment stoppage
surveillance to confirm break in transmission for these disease are fully incorporated.
In the new analysis we estimate these costs specifically for sub-Saharan Africa, and then use
these estimates alongside the previous estimates with the specific objective of estimating the
resources required to achieve control and elimination by 2040.
4
2. Background
Prevention, control, elimination and eradication of NTDs rely on five main public health
approaches: preventive chemotherapy (PCT) based on mass drug administration (MDA);
individual case management, commonly called intensified disease management (IDM);
vector control; safe water, sanitation and hygiene; and veterinary public health measures for
zoonotic diseases [1]. This paper will focus on the two major interventions, PCT and IDM.
We have made no attempt to be exhaustive in our review of the literature, as several
comprehensive reviews of NTDs have been published recently. Along with the two WHO
reports on NTDs [4,5], three technical literature reviews have been conducted: The Causes
and Impacts of Neglected Tropical and Zoonotic Diseases by the Institute of Medicine [6],
Social and Economic Impact Review on Neglected Tropical Diseases from the Hudson
Institute [7], and Why Neglected Tropical Diseases Matter in Reducing Poverty from the
Overseas Development Institute [8].
Seventeen NTDs are currently recognized by the World Health Organization (WHO). Of
these, five NTDs are controlled via PCT. These include the following infections: lymphatic
filariasis (LF), onchocerciasis (river blindness), schistosomiasis (bilharziasis), trachoma, and
soil-transmitted helminthiasis (STH). The latter includes ascariasis (roundworm), trichuriasis
(whipworm) and ancylostomiasis (hookworm). These five PCT NTDs make up over 90% of
the disease burden [7].
The other NTDs rely on interventions other than PCT, primarily innovative and intensified
disease management (IDM). The five IDM diseases addressed in this paper include: Buruli
ulcer disease (Mycobacterium ulcerans infection), Chagas disease (American
trypanosomiasis), human African trypanosomiasis (sleeping sickness or HAT), leishmaniasis,
and leprosy.
The remaining seven NTDs require other specific approaches, including vaccines, intensive
vector management, and veterinary public health. These diseases include: cysticercosis,
dengue, dracunculiasis (guinea-worm disease), echinococcosis, endemic treponematoses
(Yaws), foodborne trematode infections (including fascioliasis), and rabies. These are not
addressed in the results of this paper, but the cost implications of these diseases are discussed
in Table 3.
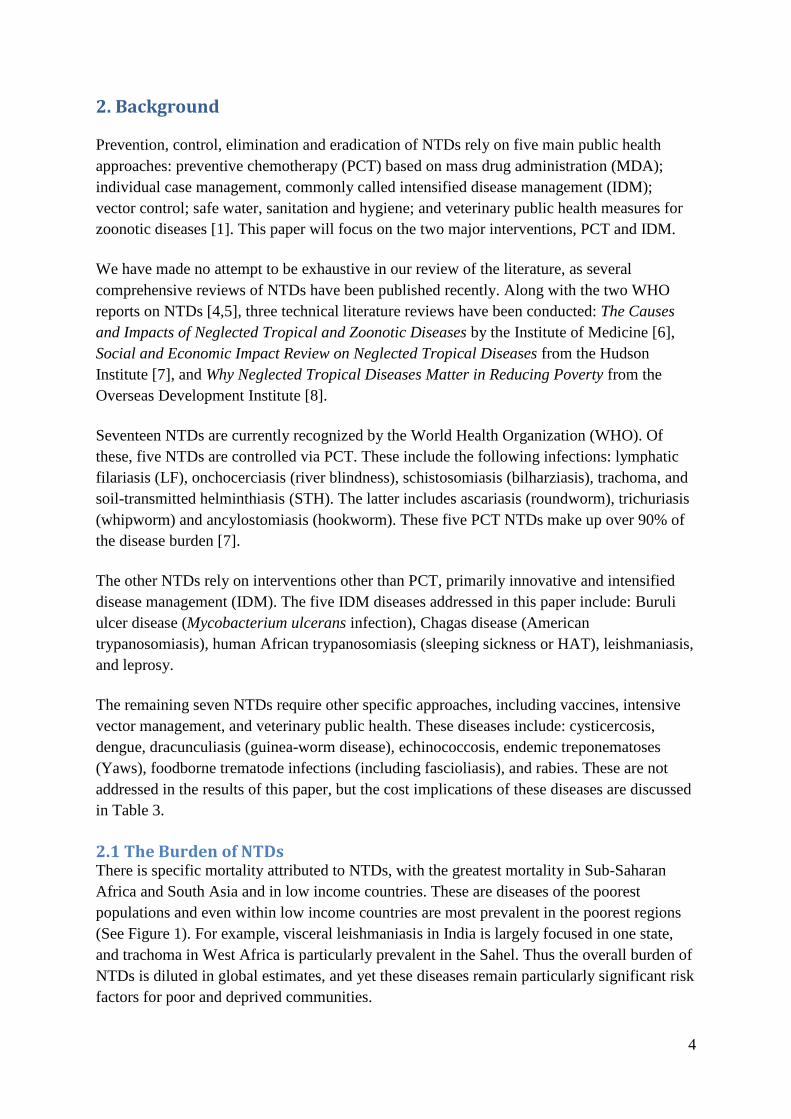
2.1 The Burden of NTDs There is specific mortality attributed to NTDs, with the greatest mortality in Sub-Saharan
Africa and South Asia and in low income countries. These are diseases of the poorest
populations and even within low income countries are most prevalent in the poorest regions
(See Figure 1). For example, visceral leishmaniasis in India is largely focused in one state,
and trachoma in West Africa is particularly prevalent in the Sahel. Thus the overall burden of
NTDs is diluted in global estimates, and yet these diseases remain particularly significant risk
factors for poor and deprived communities.
5
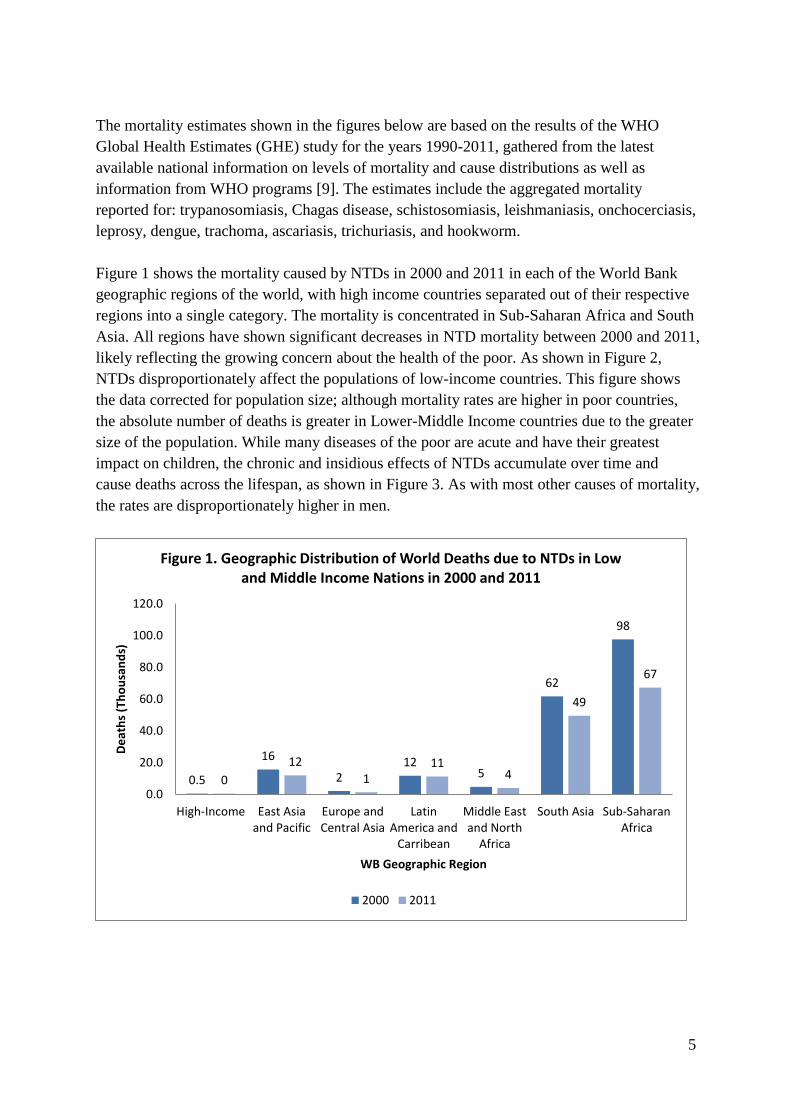
The mortality estimates shown in the figures below are based on the results of the WHO
Global Health Estimates (GHE) study for the years 1990-2011, gathered from the latest
available national information on levels of mortality and cause distributions as well as
information from WHO programs [9]. The estimates include the aggregated mortality
reported for: trypanosomiasis, Chagas disease, schistosomiasis, leishmaniasis, onchocerciasis,
leprosy, dengue, trachoma, ascariasis, trichuriasis, and hookworm.
Figure 1 shows the mortality caused by NTDs in 2000 and 2011 in each of the World Bank
geographic regions of the world, with high income countries separated out of their respective
regions into a single category. The mortality is concentrated in Sub-Saharan Africa and South
Asia. All regions have shown significant decreases in NTD mortality between 2000 and 2011,
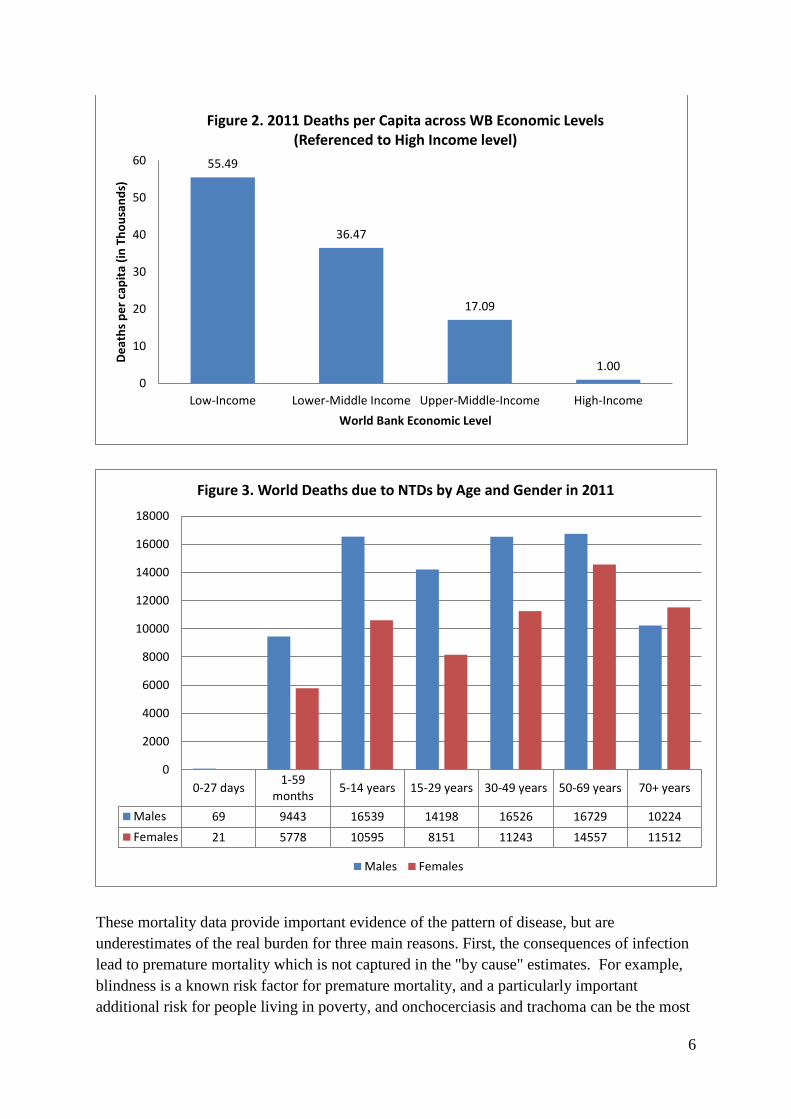
likely reflecting the growing concern about the health of the poor. As shown in Figure 2,
NTDs disproportionately affect the populations of low-income countries. This figure shows
the data corrected for population size; although mortality rates are higher in poor countries,
the absolute number of deaths is greater in Lower-Middle Income countries due to the greater
size of the population. While many diseases of the poor are acute and have their greatest
impact on children, the chronic and insidious effects of NTDs accumulate over time and
cause deaths across the lifespan, as shown in Figure 3. As with most other causes of mortality,
the rates are disproportionately higher in men.
0.5
16
2 12
5
62
98
0
12
1 11
4
49
67
0.0
20.0
40.0
60.0
80.0
100.0
120.0
High-Income East Asiaand Pacific
Europe andCentral Asia
LatinAmerica and
Carribean
Middle Eastand North
Africa
South Asia Sub-SaharanAfrica
De
ath
s (T
ho
usa
nd
s)
WB Geographic Region
Figure 1. Geographic Distribution of World Deaths due to NTDs in Low and Middle Income Nations in 2000 and 2011
2000 2011
6
These mortality data provide important evidence of the pattern of disease, but are
underestimates of the real burden for three main reasons. First, the consequences of infection
lead to premature mortality which is not captured in the "by cause" estimates. For example,
blindness is a known risk factor for premature mortality, and a particularly important
additional risk for people living in poverty, and onchocerciasis and trachoma can be the most
55.49
36.47
17.09
1.00
0
10
20
30
40
50
60
Low-Income Lower-Middle Income Upper-Middle-Income High-Income
De
ath
s p
er
cap
ita
(in
Th
ou
san
ds)
World Bank Economic Level
Figure 2. 2011 Deaths per Capita across WB Economic Levels
(Referenced to High Income level)
0-27 days1-59
months5-14 years 15-29 years 30-49 years 50-69 years 70+ years
Males 69 9443 16539 14198 16526 16729 10224
Females 21 5778 10595 8151 11243 14557 11512
0
2000
4000
6000
8000
10000
12000
14000
16000
18000
Figure 3. World Deaths due to NTDs by Age and Gender in 2011
Males Females

7
important causes of blindness in the communities in which they occur. Yet the “by cause”
estimates attribute no mortality to these diseases, or to secondary blindness as a cause of
mortality. Similarly, the gross effects of chronic elephantiasis are associated with significant
secondary infection and disability, yet no mortality is attributed causally to LF. In addition,
although NTDs are known to contribute to other important causes of mortality, such as
epilepsy (the cause of 233,000 deaths globally) and anaemia (90,000 deaths), the scale of the
NTD contribution is unknown.
The second burden that is not captured is the effect of these diseases on function. These
effects can be particularly consequential when they inhibit skills acquisition and
employability, and reduce earning capacity. It is in these areas that the insidious effects of
NTDs are particularly important: for example, IQ points are lost due to schistosomiasis and
STH infection; stigma and social rejection are sequelae of elephantiasis and of the
unremitting itching of onchocerciasis; and low vision is associated with onchocerciasis and
trachoma. Some estimates have been made: for example, with schistosomiasis and STH the
annual rate of absenteeism is equivalent to more than 200 million teaching years, and the
average IQ loss per worm infestation is 3.75 points, amounting to a total IQ loss of 633
million points for the world’s low income countries [10]. Globally the loss in terms of
economic productivity for trachoma sufferers is estimated at US$ 8 million when trichiasis is
included.
Finally, there is a third uncharacterized burden which is a consequence of the life-long health
costs of managing chronic, debilitating disease. These can expose the individual to
potentially catastrophic health care costs: for example the management costs of Chagas
disease are estimated at US$474 per person per annum [11].
2.2 Availability of Treatment While many of the consequences of NTD infection are irreversible, much of the burden can
be prevented with the available interventions. Based on the projections here that assume the
achievement of the WHO 2020 goals, more than 80% of the disease and mortality attributed
to NTDs could be avoided.
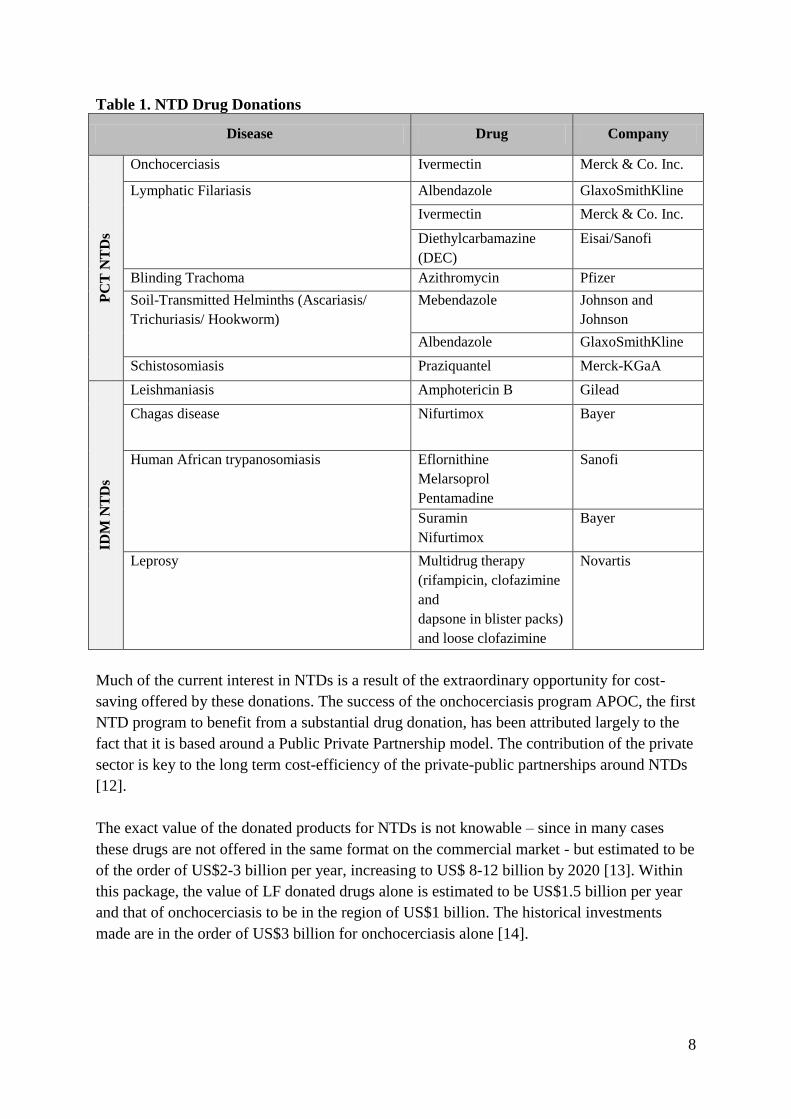
Effective treatment is available for all the PCT NTDs, and sufficient donated drugs have been
pledged by their manufacturers to supply the needs for PCT in endemic countries (See Table
1). Some IDM NTDs lack effective therapies, but where treatments exist they too have been
donated, and elimination is estimated to be achievable for several of these. The control or
elimination of PCT NTDs is implemented through various delivery systems, including
schools, the cost of which may not be fully incurred by the health sector. IDM depends on the
primary health care system, including mobile teams in some instances.
8
Table 1. NTD Drug Donations
Disease Drug Company
PC
T N
TD
s
Onchocerciasis Ivermectin Merck & Co. Inc.
Lymphatic Filariasis Albendazole GlaxoSmithKline
Ivermectin Merck & Co. Inc.
Diethylcarbamazine
(DEC)
Eisai/Sanofi
Blinding Trachoma Azithromycin Pfizer
Soil-Transmitted Helminths (Ascariasis/
Trichuriasis/ Hookworm)
Mebendazole Johnson and
Johnson
Albendazole GlaxoSmithKline
Schistosomiasis Praziquantel Merck-KGaA
IDM
NT
Ds
Leishmaniasis Amphotericin B Gilead
Chagas disease Nifurtimox Bayer
Human African trypanosomiasis Eflornithine
Melarsoprol
Pentamadine
Sanofi
Suramin
Nifurtimox
Bayer
Leprosy Multidrug therapy
(rifampicin, clofazimine
and
dapsone in blister packs)
and loose clofazimine
Novartis
Much of the current interest in NTDs is a result of the extraordinary opportunity for cost-
saving offered by these donations. The success of the onchocerciasis program APOC, the first
NTD program to benefit from a substantial drug donation, has been attributed largely to the
fact that it is based around a Public Private Partnership model. The contribution of the private
sector is key to the long term cost-efficiency of the private-public partnerships around NTDs
[12].
The exact value of the donated products for NTDs is not knowable – since in many cases
these drugs are not offered in the same format on the commercial market - but estimated to be
of the order of US$2-3 billion per year, increasing to US$ 8-12 billion by 2020 [13]. Within
this package, the value of LF donated drugs alone is estimated to be US$1.5 billion per year
and that of onchocerciasis to be in the region of US$1 billion. The historical investments
made are in the order of US$3 billion for onchocerciasis alone [14].
9
2.3 Existing NTD Cost Estimates
Prior to 2012, efforts to estimate the cost associated with delivering NTD treatment have
been largely regional, limited to a sub-set of NTDs, and disease-specific. One large-scale,
global estimate of NTD control costs has been undertaken, based on global targets set out in
the London Declaration [3] and the WHO NTD Roadmap through 2020 [1]. All the existing
estimates are based on desk-studies using the population at risk and the cost of treatment per
capita as the basis for estimation.
Local and regional estimates In the Asia Pacific region it is estimated that the control or elimination of STH, lymphatic
filariasis and schistosomiasis by 2020 will require US$243 million, at a cost from US$0.02 to
US$ 0.19 per person treated when treated in disease-specific campaigns [15]. Analysis for
Latin America and the Caribbean suggests that lymphatic filiariasis, onchocerciasis, and
trachoma together can be eliminated by 2020, at a per capita cost of US$0.51, and a total cost
of US$128 million, of which STH will cost $41 million [16]. There is considerable regional
variation in the size of at risk populations. For instance in Latin America and the Caribbean
about 350,000 persons are targeted for MDA for onchocerciasis compared to about 150
million in the Africa region [16].
Global estimate The first major NTD cost estimate comes from a top-down, funding gap analysis of the
resources needed to achieve the goals of the London Declaration, to control and eliminate 10
NTDs in line with the WHO goals by 2020 [17]. The study estimated disease burden based
on a combination of sources including regional epidemiological projections from WHO,
modelled using historical trends, literature reviews and in-depth interviews. Unit costs were
calculated for MDA for PCT diseases and screening/case detection and treatment for IDM
diseases. These costs include personnel, infrastructure, supplies, transportation and overhead
but exclude the cost of drugs, as they are donated.
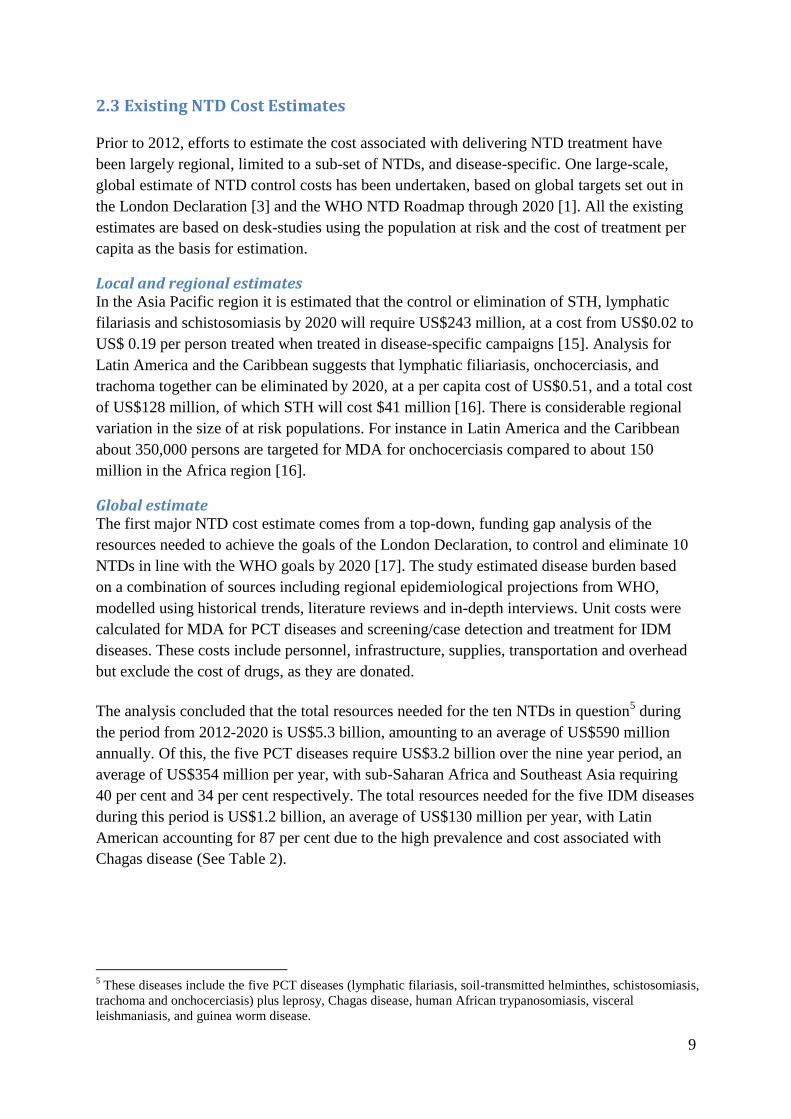
The analysis concluded that the total resources needed for the ten NTDs in question5 during
the period from 2012-2020 is US$5.3 billion, amounting to an average of US$590 million
annually. Of this, the five PCT diseases require US$3.2 billion over the nine year period, an
average of US$354 million per year, with sub-Saharan Africa and Southeast Asia requiring
40 per cent and 34 per cent respectively. The total resources needed for the five IDM diseases
during this period is US$1.2 billion, an average of US$130 million per year, with Latin
American accounting for 87 per cent due to the high prevalence and cost associated with
Chagas disease (See Table 2).
5 These diseases include the five PCT diseases (lymphatic filariasis, soil-transmitted helminthes, schistosomiasis,
trachoma and onchocerciasis) plus leprosy, Chagas disease, human African trypanosomiasis, visceral
leishmaniasis, and guinea worm disease.
10
Table 2. NTD Cost Estimates from Global ‘Top-Down’ Funding Gap Analysis
Disease Activity Unit
Cost
(US$)
Total Cost
(2012-2020)
Average Cost
per year
Preventive Chemotherapy (PCT)
diseases
Mass Drug
Administration 0.49
US$3.2 billion US$354 million
Intensified
Disease
Management
(IDM)
diseases
Chagas Disease Vector control6 31.62
US$1.2 billion US$130 million
Screening 13.71
Treatment 1,657.63
Leprosy Case detection 201.35
Treatment 149.41
Human African
Trypanosomiasis
Screening 1.64
Treatment 605.75
Visceral
Leishmaniasis
Case detection 129.11
Treatment 47.39
PCT and IDM diseases
US$4.4 billion US$484 million
All of these estimates were intended to provide a broad idea of the likely costs. They are
“top-down” or overview estimates and are not grounded in the actual plans of the individual
countries. It was therefore decided to use the example of sub-Saharan Africa, which is
estimated to suffer 50% of the burden of NTDs, to prepare a more detailed estimate of costs,
based on a “bottom-up” approach starting from national plans.
6 The cost of vector control for Chagas’ disease, as well as surgery for trachoma were not included in the total
cost estimates. Costs for guinea worm were also excluded because the disease is on track for elimination in 2015
and no further resources are expected to be required.
11
3. New Analysis of NTD Costs for Sub-Saharan Africa
Starting in 2012, and with the support of the WHO/AFRO NTD Programme, most countries
in sub-Saharan Africa have developed national level “NTD Master Plans” for controlling
NTDs. WHO/AFRO commissioned a report of the resource requirements for eliminating
NTDs as diseases of public health significance by 2020, utilizing Master Plan budgets [18].
This analysis, Financial Resource Requirements for Neglected Tropical Diseases in the WHO
African Region: 2013-2020, concluded that the total cost for the African region from 2013 to
2020 is estimated at US$2.57 billion, 51% of which would go to MDA activities. The average
cost required annually is US$321.7 million to cover an estimated average population of 512
million people. The cost per person on the average is US$0.62. An estimated 13% of the total
budget would be driven by the costs associated with non-PCT NTD interventions (i.e. IDM,
vector control, case management, etc.). This total amount however excludes financial
requirements of the African Programme for Onchocerciasis Control (APOC) whose estimated
budget for 2016 – 2020 is put at US$88.4million.
This analysis offered the first ‘bottom-up’ estimate of NTD costs but had some limitations.
The analysis involved a simple projection calculated on Microsoft Excel and extended only to
2020. While many of the NTDs in question are expected to be controlled by 2020, full
elimination and the diseases surveillance required to certify it may realistically not be
achieved for many more years. Furthermore, the budgets attached to these plans were
developed by the country teams, and reflect their individual perspectives on the costs of
implementing control over a 5 year period. The budget estimates have not been independently
validated and exhibit considerable variation in unit costs.
For the new analysis, we have used the national NTD plans to calculate a new cost analysis,
with some specific changes. The analysis focuses on the five PCT NTDs in the Africa region,
which make an estimated 90% of the burden on the continent [7]. Later analyses will seek to
address the IDM diseases as well. The analysis has been extended through 2040, which more
realistically captures the cost of not only controlling and eliminating these diseases, but also
the necessary years of mapping and surveillance once these goal have been achieved.
Here we present this new analysis, beginning with an explanation of the methodology used,
followed by our calculations of the target populations for each of the five diseases,
estimations of the costs of drugs and activities, and finally the estimated total cost of
elimination of the five PCT NTDs from 2014-2040.
3.1 Methodology
Estimating the target population The data used to estimate target populations comes from NTD Master Plans developed by the
Ministries of Health of the WHO Africa region [18]. Each of the 36 countries undertook a
country by country analysis of the targeted NTDs led by the country program managers. Each
country used their own population growth rates and pyramids to determine the target
population based on WHO guidance on how each disease target population is derived. The

12
main demographic categories were Pre-School Age Child (Pre-SAC), School Age Child
(SAC) and Adults, corresponding to each disease treatment protocol. Where women of child-
bearing age were targeted, the population figure was added to the adult population. Minimal
adjustments to data were made where they were missing or where obvious errors were
identified. In some instances the country managers were contacted to clarify the data. The
analysis focused only on the five PCT NTDs, as these constitute almost 90% of the burden of
NTDs in the Africa region [7].
The base year population adopted for this analysis was 2014 for all countries, which was
extrapolated through to 2040 using an average population growth rate of 2.3% based on the
36 countries that provided data. None of the countries had estimated declines in target
population due to systematic elimination. For all the diseases there is a matrix correlation
among levels of pre-treatment prevalence, geographic and therapeutic coverage, the
population cohort and the number of years of treatment to achieve break in transmission. For
the purpose of this analysis each country was considered a transmission zone. The rate of
decline of target population was thus calculated based on published literature or expert
opinion on the period probabilities towards attaining elimination for each of the diseases in
each country [5,19,20,21]. The target population estimates were grouped into periods, with
the first period running until 2020, following the WHO NTD Roadmap to coincide with the
first period of rapid decline and disease elimination, and the subsequent grouped in five year
periods.
Based on the projected target population figures for each of the diseases, a logarithmic trend
line was developed using Microsoft Excel. The target population figures generated by the
logarithmic trend served as a proxy to compensate for various recommendations in each of
the disease areas to lower the threshold for mass treatment towards elimination so that all
those infected can receive treatment [21,22]. This was used to forecast drug needs and cost.
For each person in the target population, the WHO treatment protocol was used to calculate
the quantity of drugs required [5].
Estimating drug costs A standardized unit drug delivery cost was adopted: praziquantel at US$0.08, albendazole/
mebendazole 500 mg U$0.002, Diethylcabamazine US$0.004 and TEO US$0.164 [18].
Donated drugs were not included in the cost estimates. These were held constant throughout
the estimate and multiplied by the projected targeted population. Program unit cost estimates
were derived from the plans based on the base year aggregated cost per component and
extrapolated over time. It is assumed that there is no inflation or deflation and items are
stated at their nominal cost from any prior date. For capital equipment and vehicle
replacement, costs were modified by the revaluation of assets as held at current price.
Recurrent expenditure was treated in unadjusted equivalents paid in the normal course of
business. This method was used and adapted because of limitations to deal with the effects of
changing prices over time.
13
Estimating activity costs The estimate of activity costs in this analysis includes costs associated with the delivery of
treatment using standard community-directed intervention (CDI) delivery approach as the
main delivery mechanism, as defined by the WHO Africa region [23]. The strategy of
Community Direction Interventions (CDI) is considered more effective than other delivery
approaches used to deliver mass products to communities [24,25]. It does not include cost for
incidental engagements such as provision of water, sanitation or hygiene maintenance, and
vector control and case management. The various components were added up to form
estimates per year and grouped into periods. The per capita cost of treatment was then
determined through the simple equation of total cost including drugs divided by the target
population.
It was noted that to understand the activities involved in treating the PCT NTDs, country
specific orientations had to be followed [26]. Tasks such as policy development, planning and
logistics management, health sensitization, education and advocacy activities, training and
personnel, and data collection and information management were integrated.
The case for integrated approaches to mass drug administration has been made in several
publications [27]. Based on the published literature, attention was paid to technical detail in
sequencing when and how to integrate activities [28]. For instance while ivermectin may be
safely administered at the same time as albendazole, praziquantel can only be added after at
least one separate treatment round with both medicines. Combining these drugs with
azithromycin for trachoma control is currently not recommended [29,30]. With this
understanding, integrated delivery may be carried out in areas endemic for onchocerciasis, LF,
and STH, or for STH and Schistosomiasis, and in communities that have previously received
ivermectin or praziquantel. This had implications for planning integrated activities and
estimating the cost of service delivery for the lead introductory drugs before combined
delivery. Other publications have emphasised the need to continue some levels of targeted
surveillance and mapping before integrated activities are introduced [31].
Cost estimates for mapping and surveillance activities were estimated based on the status of
current mapping levels for each of the conditions presented in the country plans. Information
from the country plans suggests that 55% of lymphatic filariasis, 61% of schistosomiasis, 50%
of STH and 50% of trachoma is unmapped. Onchocerciasis is the only condition that is fully
mapped. The standard activities for pre- and post-treatment stoppage surveillance were
introduced based on established protocols. For both onchocerciasis and lymphatic filariasis
the principle of transmission zones assessment and the standard steps and input requirements
are well established [32]. WHO had also established a stepwise approach for determining
when elimination or break in transmission has been achieved for schistosomiasis [33] and
STHs. Based on a proper understanding of the mapping, monitoring and surveillance
activities, it is possible to integrate mapping, monitoring and surveillance activities within a
specified framework [34]. These provided good guides and were used to forecast the timing
and cost of mapping and surveillance activities.
14
Based on the new cost estimates, spurt scenarios were used to show per capita cost trend over
the period. A two-cost scenario was adopted to vary slightly the assumptions used in the first
case. The evidence in this paper on value for money was drawn from published literature to
show cost effectiveness and return on investment including brief comparisons in terms of
total cost with other diseases such as HIV/AIDS investment. The value for money framework
used is defined as the optimum combination of whole-of-life costs with emphasis on
effectiveness, quality or fit for purpose goods and service design to achieve outcomes for
which the investment partners are interested in. Value for money therefore is not the choice
of goods and services based on the lowest cost bid among competing needs [35].
3.2 Cost Estimates
For each of the five PCT NTDs, we surveyed the available data to calculate projected target
populations for intervention. Detailed results from this analysis are presented in the Appendix.
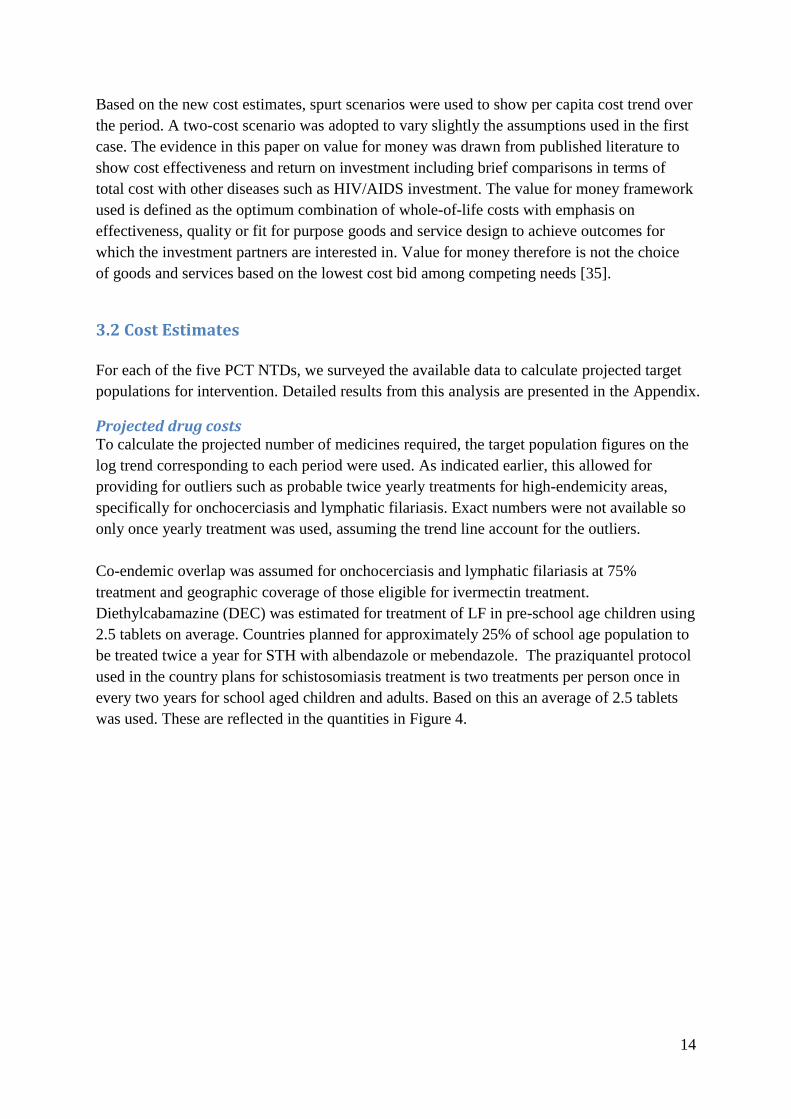
Projected drug costs To calculate the projected number of medicines required, the target population figures on the
log trend corresponding to each period were used. As indicated earlier, this allowed for
providing for outliers such as probable twice yearly treatments for high-endemicity areas,
specifically for onchocerciasis and lymphatic filariasis. Exact numbers were not available so
only once yearly treatment was used, assuming the trend line account for the outliers.
Co-endemic overlap was assumed for onchocerciasis and lymphatic filariasis at 75%
treatment and geographic coverage of those eligible for ivermectin treatment.
Diethylcabamazine (DEC) was estimated for treatment of LF in pre-school age children using
2.5 tablets on average. Countries planned for approximately 25% of school age population to
be treated twice a year for STH with albendazole or mebendazole. The praziquantel protocol
used in the country plans for schistosomiasis treatment is two treatments per person once in
every two years for school aged children and adults. Based on this an average of 2.5 tablets
was used. These are reflected in the quantities in Figure 4.
15
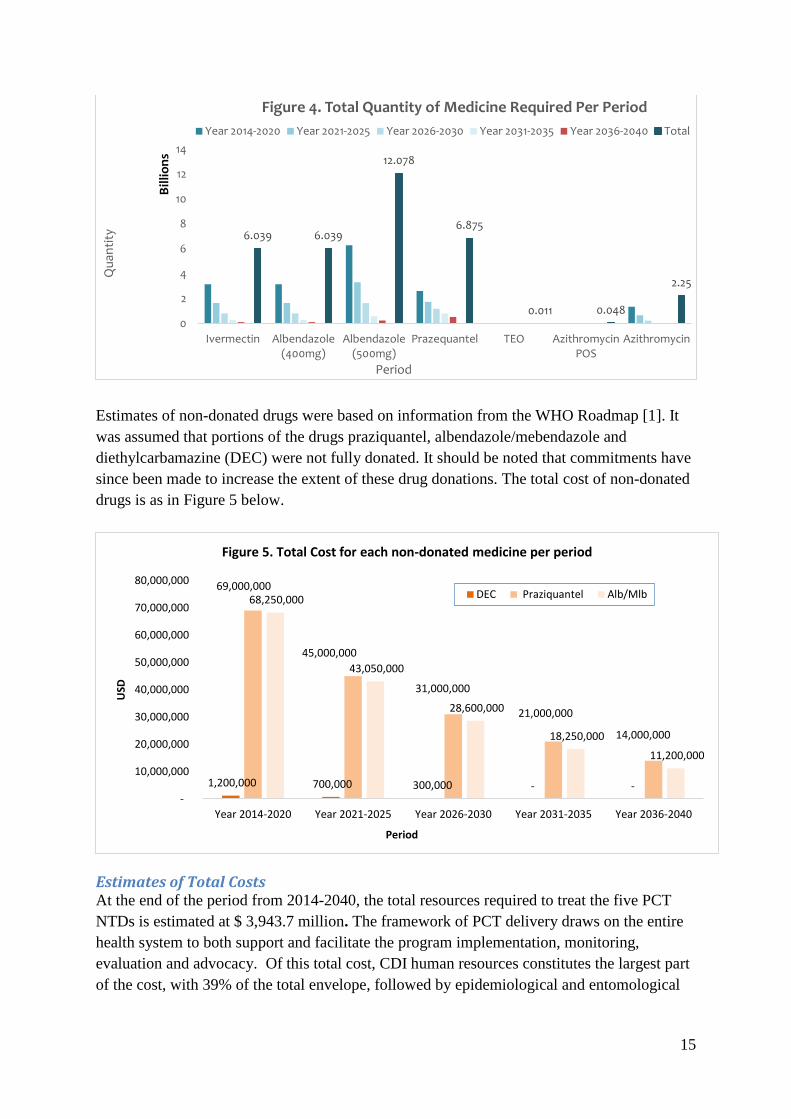
Estimates of non-donated drugs were based on information from the WHO Roadmap [1]. It
was assumed that portions of the drugs praziquantel, albendazole/mebendazole and
diethylcarbamazine (DEC) were not fully donated. It should be noted that commitments have
since been made to increase the extent of these drug donations. The total cost of non-donated
drugs is as in Figure 5 below.
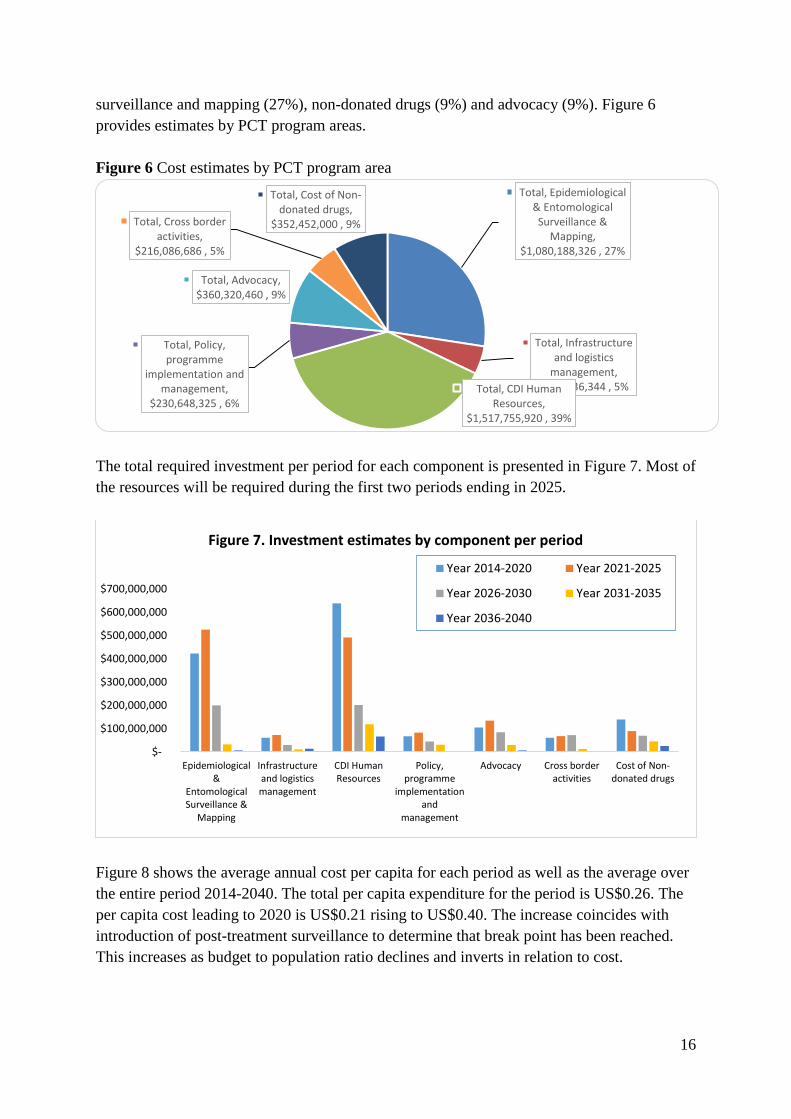
Estimates of Total Costs At the end of the period from 2014-2040, the total resources required to treat the five PCT
NTDs is estimated at $ 3,943.7 million. The framework of PCT delivery draws on the entire
health system to both support and facilitate the program implementation, monitoring,
evaluation and advocacy. Of this total cost, CDI human resources constitutes the largest part
of the cost, with 39% of the total envelope, followed by epidemiological and entomological
6.039 6.039
12.078
6.875
0.011 0.048
2.25
0
2
4
6
8
10
12
14
Ivermectin Albendazole(400mg)
Albendazole(500mg)
Prazequantel TEO AzithromycinPOS
Azithromycin
Qu
anti
ty
Bil
lio
ns
Period
Figure 4. Total Quantity of Medicine Required Per Period
Year 2014-2020 Year 2021-2025 Year 2026-2030 Year 2031-2035 Year 2036-2040 Total
1,200,000 700,000 300,000 - -
69,000,000
45,000,000
31,000,000
21,000,000
14,000,000
68,250,000
43,050,000
28,600,000
18,250,000
11,200,000
-
10,000,000
20,000,000
30,000,000
40,000,000
50,000,000
60,000,000
70,000,000
80,000,000
Year 2014-2020 Year 2021-2025 Year 2026-2030 Year 2031-2035 Year 2036-2040
USD
Period
Figure 5. Total Cost for each non-donated medicine per period
DEC Praziquantel Alb/Mlb
16
surveillance and mapping (27%), non-donated drugs (9%) and advocacy (9%). Figure 6
provides estimates by PCT program areas.
Figure 6 Cost estimates by PCT program area
The total required investment per period for each component is presented in Figure 7. Most of
the resources will be required during the first two periods ending in 2025.
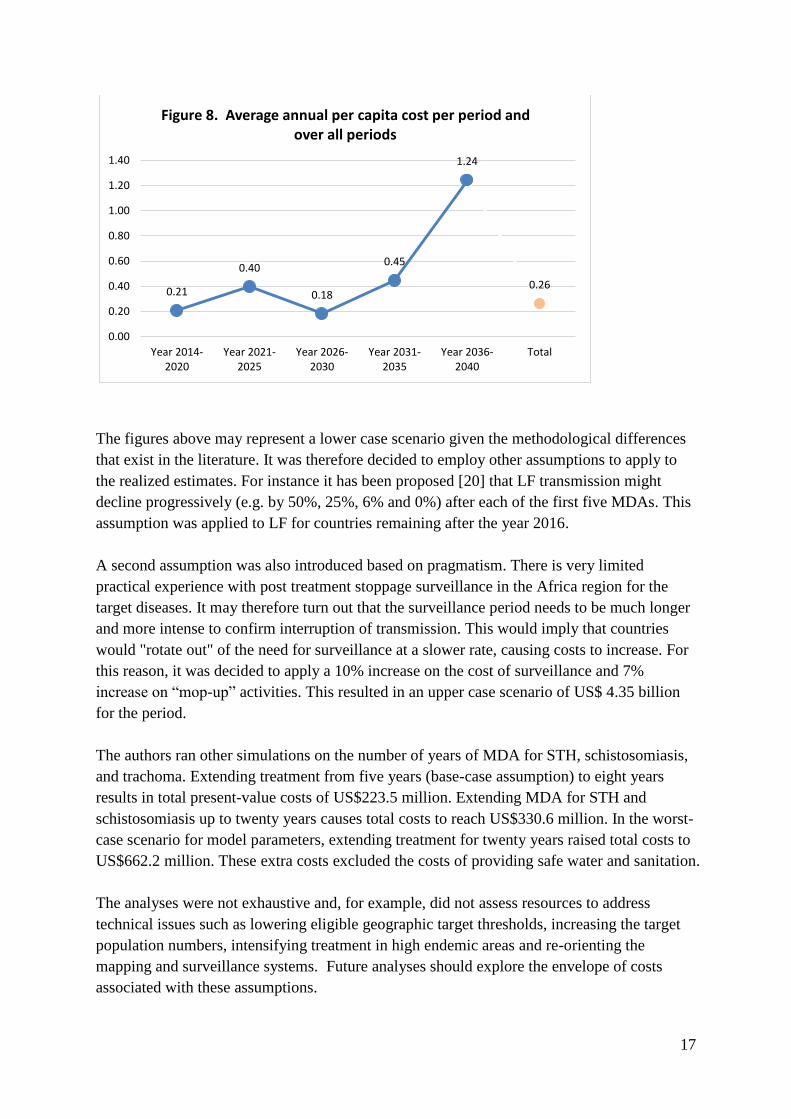
Figure 8 shows the average annual cost per capita for each period as well as the average over
the entire period 2014-2040. The total per capita expenditure for the period is US$0.26. The
per capita cost leading to 2020 is US$0.21 rising to US$0.40. The increase coincides with
introduction of post-treatment surveillance to determine that break point has been reached.
This increases as budget to population ratio declines and inverts in relation to cost.
Total, Epidemiological & Entomological
Surveillance & Mapping,
$1,080,188,326 , 27%
Total, Infrastructure and logistics
management, $186,336,344 , 5% Total, CDI Human
Resources, $1,517,755,920 , 39%
Total, Policy, programme
implementation and management,
$230,648,325 , 6%
Total, Advocacy, $360,320,460 , 9%
Total, Cross border activities,
$216,086,686 , 5%
Total, Cost of Non-donated drugs,
$352,452,000 , 9%
$-
$100,000,000
$200,000,000
$300,000,000
$400,000,000
$500,000,000
$600,000,000
$700,000,000
Epidemiological&
EntomologicalSurveillance &
Mapping
Infrastructureand logisticsmanagement
CDI HumanResources
Policy,programme
implementationand
management
Advocacy Cross borderactivities
Cost of Non-donated drugs
Figure 7. Investment estimates by component per period
Year 2014-2020 Year 2021-2025
Year 2026-2030 Year 2031-2035
Year 2036-2040
17
The figures above may represent a lower case scenario given the methodological differences
that exist in the literature. It was therefore decided to employ other assumptions to apply to
the realized estimates. For instance it has been proposed [20] that LF transmission might
decline progressively (e.g. by 50%, 25%, 6% and 0%) after each of the first five MDAs. This
assumption was applied to LF for countries remaining after the year 2016.
A second assumption was also introduced based on pragmatism. There is very limited
practical experience with post treatment stoppage surveillance in the Africa region for the
target diseases. It may therefore turn out that the surveillance period needs to be much longer
and more intense to confirm interruption of transmission. This would imply that countries
would "rotate out" of the need for surveillance at a slower rate, causing costs to increase. For
this reason, it was decided to apply a 10% increase on the cost of surveillance and 7%
increase on “mop-up” activities. This resulted in an upper case scenario of US$ 4.35 billion
for the period.
The authors ran other simulations on the number of years of MDA for STH, schistosomiasis,
and trachoma. Extending treatment from five years (base-case assumption) to eight years
results in total present-value costs of US$223.5 million. Extending MDA for STH and
schistosomiasis up to twenty years causes total costs to reach US$330.6 million. In the worst-
case scenario for model parameters, extending treatment for twenty years raised total costs to
US$662.2 million. These extra costs excluded the costs of providing safe water and sanitation.
The analyses were not exhaustive and, for example, did not assess resources to address
technical issues such as lowering eligible geographic target thresholds, increasing the target
population numbers, intensifying treatment in high endemic areas and re-orienting the
mapping and surveillance systems. Future analyses should explore the envelope of costs
associated with these assumptions.
0.21
0.40
0.18
0.45
1.24
0.26
0.00
0.20
0.40
0.60
0.80
1.00
1.20
1.40
Year 2014-2020
Year 2021-2025
Year 2026-2030
Year 2031-2035
Year 2036-2040
Total
Figure 8. Average annual per capita cost per period and over all periods
18
From the new analysis, it is estimated that over the period from 2014-2040, the total
resources required to treat the five PCT NTDs in sub-Saharan Africa is US$3.9billion,
ranging up to US$4.35billion in the upper case scenario. The total per capita expenditure for
the period is US$0.26, with average per capita cost leading up to 2020 US$0.21, and rising to
an average of US$0.40 subsequently.
19
4. Discussion
The combination of the new analysis with the previous estimates allows for an attempt to
analyze the global cost of controlling and eliminating NTDs. Before making this attempt, it
is important to consider the limitations to these analyses.
4.1 Limitations
The aim of NTD programs is to eliminate the need for further treatment through standalone
programs, either by permanently interrupting transmission or by reducing the public health
significance of the diseases so that it can be managed by the national health system. National
health systems will still need to be well-resourced to take on the challenge. For example,
lymphatic filariasis, even once eliminated by PCT, will require on-going surveillance, as well
as the management of disability and morbidity among remaining cases. Similarly, the future
management of human African trypanosomiasis will likely depend on the availability of new
diagnostic tools and treatments which are appropriate for use at the peripheral level.
We do not yet have sufficient data to include all 17 of the WHO defined NTDs in our
estimations. There are seven NTDs for which further analyses will be required. Some of the
relevant issues for costing these are addressed in Table 3.
In estimating costs we have necessarily had to separate the PCT and IDM diseases. This is a
consequence of the very different health systems approaches required for MDA versus case
management. There are also important differences in the epidemiology of these diseases.
PCT infections are much more common and cheaper per capita to treat, and on average have
less clinical consequences. IDM cases are relatively rare and expensive to treat, by
comparison, but have potentially much greater per capita health consequences, and while
control is relatively low cost, the management of IDM NTDs in the absence of control is
substantial; for example, US$627million per annum for Chagas disease [11]. Deciding on the
appropriate mix will require assessment of the national situation. Here we can only set out
the generic case.
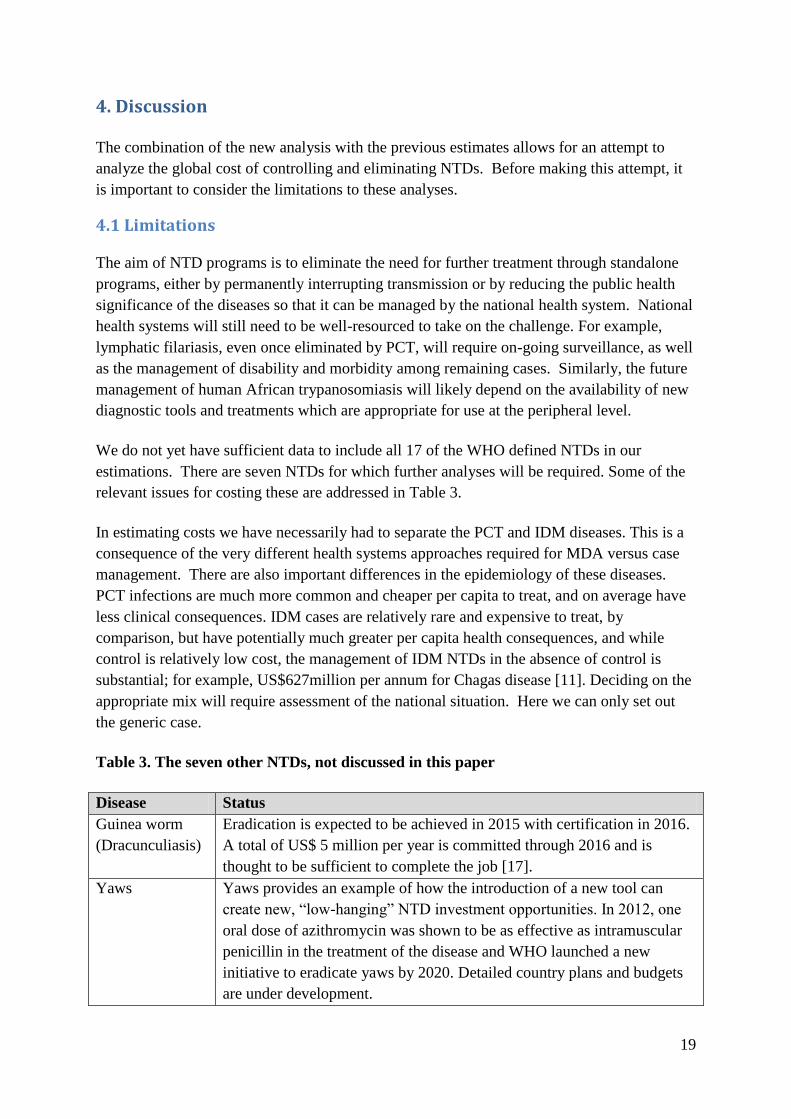
Table 3. The seven other NTDs, not discussed in this paper
Disease Status
Guinea worm
(Dracunculiasis)
Eradication is expected to be achieved in 2015 with certification in 2016.
A total of US$ 5 million per year is committed through 2016 and is
thought to be sufficient to complete the job [17].
Yaws Yaws provides an example of how the introduction of a new tool can
create new, “low-hanging” NTD investment opportunities. In 2012, one
oral dose of azithromycin was shown to be as effective as intramuscular
penicillin in the treatment of the disease and WHO launched a new
initiative to eradicate yaws by 2020. Detailed country plans and budgets
are under development.
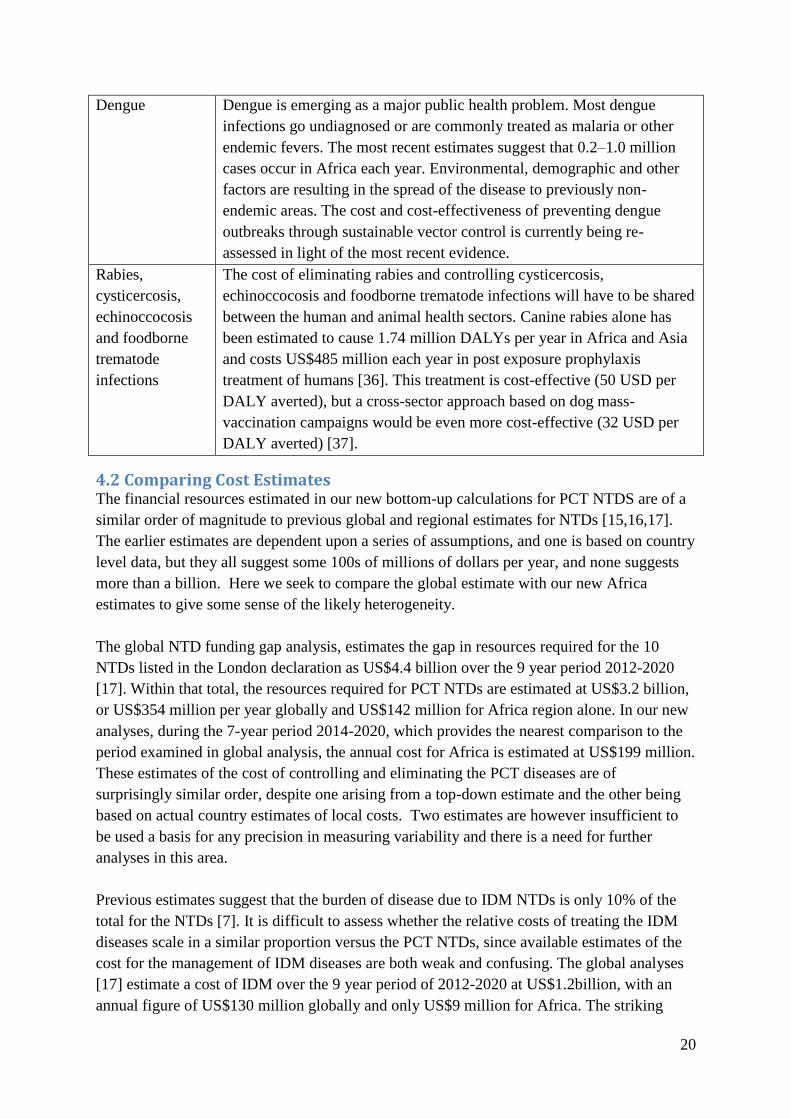
20
Dengue Dengue is emerging as a major public health problem. Most dengue
infections go undiagnosed or are commonly treated as malaria or other
endemic fevers. The most recent estimates suggest that 0.2–1.0 million
cases occur in Africa each year. Environmental, demographic and other
factors are resulting in the spread of the disease to previously non-
endemic areas. The cost and cost-effectiveness of preventing dengue
outbreaks through sustainable vector control is currently being re-
assessed in light of the most recent evidence.
Rabies,
cysticercosis,
echinoccocosis
and foodborne
trematode
infections
The cost of eliminating rabies and controlling cysticercosis,
echinoccocosis and foodborne trematode infections will have to be shared
between the human and animal health sectors. Canine rabies alone has
been estimated to cause 1.74 million DALYs per year in Africa and Asia
and costs US$485 million each year in post exposure prophylaxis
treatment of humans [36]. This treatment is cost-effective (50 USD per
DALY averted), but a cross-sector approach based on dog mass-
vaccination campaigns would be even more cost-effective (32 USD per
DALY averted) [37].
4.2 Comparing Cost Estimates The financial resources estimated in our new bottom-up calculations for PCT NTDS are of a
similar order of magnitude to previous global and regional estimates for NTDs [15,16,17].
The earlier estimates are dependent upon a series of assumptions, and one is based on country
level data, but they all suggest some 100s of millions of dollars per year, and none suggests
more than a billion. Here we seek to compare the global estimate with our new Africa
estimates to give some sense of the likely heterogeneity.
The global NTD funding gap analysis, estimates the gap in resources required for the 10
NTDs listed in the London declaration as US$4.4 billion over the 9 year period 2012-2020
[17]. Within that total, the resources required for PCT NTDs are estimated at US$3.2 billion,
or US$354 million per year globally and US$142 million for Africa region alone. In our new
analyses, during the 7-year period 2014-2020, which provides the nearest comparison to the
period examined in global analysis, the annual cost for Africa is estimated at US$199 million.
These estimates of the cost of controlling and eliminating the PCT diseases are of
surprisingly similar order, despite one arising from a top-down estimate and the other being
based on actual country estimates of local costs. Two estimates are however insufficient to
be used a basis for any precision in measuring variability and there is a need for further
analyses in this area.
Previous estimates suggest that the burden of disease due to IDM NTDs is only 10% of the
total for the NTDs [7]. It is difficult to assess whether the relative costs of treating the IDM
diseases scale in a similar proportion versus the PCT NTDs, since available estimates of the
cost for the management of IDM diseases are both weak and confusing. The global analyses
[17] estimate a cost of IDM over the 9 year period of 2012-2020 at US$1.2billion, with an
annual figure of US$130 million globally and only US$9 million for Africa. The striking
21
difference between the global and Africa estimates – the estimated IDM NTD cost in Africa
is only 6.3% of the total - is because managing Chagas’ disease, which occurs only in the
Americas, is estimated at a disproportionate 83% of global IDM NTD costs.
The new analyses reported here for Africa did not attempt to estimate the cost of treating
IDM NTDs, but these costs were briefly examined in the preliminary WHO/AFRO report,
Financial Resource Requirements for Neglected Tropical Diseases in the WHO African
Region: 2013-2020 [18]. That analysis concluded that the additional costs of case
management and drug purchases for IDM NTDs would together add US$216 million to the
total NTD costs for the Africa region, an addition of only 8.4%. The global [17] and
preliminary Africa [18] estimates, neither of which can be considered strongly-grounded,
imply that the relative costs of treating IDM versus PCT NTDs in Africa may indeed be in
line with the relative scale of the disease burden. However, this conclusion would apparently
not apply to the Americas, and would also suggest that the cost of treating Chagas’ disease is
a highly significant outlier versus the other IDM diseases. Until this confusion is resolved it
is difficult to provide useful guidance on the policy implications of the available cost data.
This is clearly an area which requires further analysis.
In summary, the available estimates do not yet provide an opportunity for precise estimation,
but the independent global and regional estimates are of a similar order of magnitude and
suggest a median cost of around US$300 million to US$400 million per year to eliminate or
control 10 of the 17 NTDs. The upper bound of available estimates suggests that the cost
might range up to US$500 million to US$600 million per year. It may be much more,
depending on the importance of costly longer-term surveillance and on the need for other
potentially important (and potentially expensive) interventions such as vector control,
sanitation and morbidity management. The huge variation between the estimated costs for
managing the different IDM diseases suggests that the cost of controlling and eliminating
these diseases are particularly poorly understood.

22
5. Conclusion
The control/elimination of the ten NTDs for which drugs have been donated under the
London Declaration, represents good value for money. The cost of controlling the full range
of 17 NTDs is not discussed here, through lack of data.
Much of the burden of NTDs in 1.4 billion of the poorest people in South Asia and sub-
Saharan Africa could be prevented for an annual cost that is likely well under US$1 billion,
and probably around US$300 million to US$400 million per annum, through a combination
of community based MDA and case management. The investment in treatment would be
expected to decline significantly over the next decade as transmission is interrupted or as the
public health challenge is reduced to a level that can be managed by the more traditional
public health system. This reduction will add to the aggregate cost-efficiency of this
approach in the long run.
The analyses suggest that for this cost, and with the available technology, all the PCT
diseases can likely be eliminated from some 80% of foci within the next 20 years. This is
value-for-money, given a low per capita expenditure of US$ 0.26 and a high realism of the
outcome given the documented experience.
The value for money of this approach is further enhanced by the donation of the necessary
drugs, given in sufficient quantities at least for the affected population of sub-Saharan Africa.
The investment case is further improved by the cost-efficiency of prevention versus the
economic consequences of the significant disability, social costs and loss of earnings
resulting from continuing infection.
23
References
1 World Health Organization (WHO). Accelerating work to overcome the global impact of
neglected tropical diseases: A roadmap for implementation. Geneva: WHO; 2010.
2 Hotez PJ, Fenwick A, Savioli L, et al. Rescuing the bottom billion through control of neglected
tropical diseases. Lancet 2009; 373: 1570–75.
3 London Declaration on neglected tropical diseases: uniting to combat the neglected tropical
diseases; ending the neglect and reaching goal 2020.
http://unitingtocombatntds.org/downloads/press/ntd_event_london_declaration_on_ntds.pdf
4 WHO. First WHO report on neglected tropical diseases: working to overcome the global impact
of neglected tropical diseases. Geneva: WHO; 2010.
5 WHO. Sustaining the drive to overcome the global impact of neglected tropical diseases: second
WHO report on nelgected diseases. Geneva: WHO; 2013.
6 National Research Council. The Causes and Impacts of Neglected Tropical and Zoonotic
Diseases: Opportunities for Integrated Intervention Strategies - Workshop Summary.
Washington, DC: The National Academies Press, 2011.
7 Hudson Institute. Social and Economic Impact Review on Neglected Tropical Diseases.
Unpublished, 2012.
http://www.hudson.org/files/publications/Social%20and%20Economic%20Impact%20Revie
w%20on%20Neglected%20Tropical%20Diseases%20Hudson%20Institute%20and%20Sabin
%20Institute%20November%202012.pdf
8 Samuels F, Rodríguez Pose R. Why Neglected Tropical Disease Matter in Reducing Poverty.
Development Progress Working Paper, 2013. http://www.developmentprogress.org/why-
neglected-tropical-diseases-matter-reducing-poverty
9 WHO. Global Health Estimates Summary Tables: Deaths by Cause, Age and Sex, by World Bank
Income Group. Geneva: Unpublished, June 2013.
10 Remme JHF et al. Tropical Diseases Targeted for Elimination: Chagas Disease, Lymphatic
Filariasis, Onchocerciasis, and Leprosy. Disease Control Priorities in Developing Countries
(2nd Edition). New York : Oxford University Press, 2006, pp. 433-450.
11 Lee BY, Bacon KM, Bottazzi ME, and Hotez PJ. Global economic burden of Chagas disease: a
computational simulation model. Lancet Infectious Diseases 2013, 13(4):342-8. doi:
10.1016/S1473-3099(13)70002-1
12 Heukelbauch J, Walter B, Wicke T, Muehlen M, Albrecht S, de Oliveira SFA et al. Selective
mass treatment with ivermectin control intestinal helminthiasis and parasitic skin diseases in a
severely affected population. Bulletin of World Health Organisation 2004; 82: 563 -569
13 Diawara L, Traore MO, Badji A, Bissan Y, Doumbia K, Goita SF, Kanote L, et al. Feasibility of
onchocerciasis elimination with ivermectin treatment in endemic foci in Africa: first evidence
from studies in Mali and Senegal. PLoS Neglected Tropical Diseases 2009, 3: e497.
14 African Programme for Onchocerciasis Control (APOC). APOC Mid-term evaluation: Phase II
and phasing out period and addendum for the plan of action and budget 2008-2015.
Ouagadougou: WHO/AFRO; 2010.
15 WHO. Addressing Diseases of Poverty: An Initiative to Reduce the Unacceptable Burden of
Neglected Tropical Diseases in the Asia Pacific. Geneva: WHO; 2012.
16 Bitran R, Martorell B, Escobar L, Munoz R and Glassman A. Controlling and eliminating
neglected diseases in Latin America and the Caribbean. Health Affairs 2009, 28(6):1707-1719.
http://content.healthaffairs.org/content/28/6/1707.full.html
17 Abt Associates. Preliminary neglected tropical diseases funding gap analysis. December 2012.
18 WHO/AFRO data base of Master Plans of 36 member states of the WHO Africa Region;
Brazzaville: World Health Organisation, 2013 unpublished.

24
19 APOC. Strategic Plan of Action and Budget 2015-2025: Eliminating onchocerciasis in the Africa
region. Ouagadougou: WHO; 2012.
20 Personal communication with Munkaila Noma of Africa Programme on Onchocerciasis Control
21 Ottesen EA, Hooper PH, Bradely M and Biswas G. The Global Programme to Eliminate
Lymphatic Filariasis: Health Impact after 8 years. PLoS Neglected Tropical Diseases October
2008, 2(10), e317
22 Chen MG. Schistosomiasis control program in the People’s Republic of China: a review. South
Asian Journal of Tropical Medicine and Public Health, 1989, 20(4):511-517.
23 The CDI Study Group. Community-directed interventions for priority health problems in Africa:
results of a multicountry study. Bulletin of the World Health Organization 2010; 88:509-518.
http://www.who.int/bulletin/volumes/88/7/09-069203/en/
24 Reich MR. Introduction: Public Private Partnerships for Public Health. In Reich MR, ed., Public-
Private Partnerships for Public Health. Cambridge: Harvard Center for Population and
Development Studies, distributed by Harvard University Press, 2002.
25 Liese B and Schubert L. Official development assistance for health – how neglected are neglected
tropical diseases? An analysis of health financing. Int Health 2009; 1:141-147
26 Njenga SM, Mwandawiro CS, Muniu E, Mwanje MT, Haji FM, Bockarie MJ. Adult population as
potential reservoir of NTD infections in rural villages of Kwale district, Costal Kenya:
Implications for preventive chemotherapy interventions policy. Parasites and Vectors 2011.
14; 4 (1): 175 accessed March 2013.
27 Homeida M, Braide E, Elhassan E, Amazigo UV, Liese B, Benton B et al. APOC’s strategy of
community-directed treatment with ivermectin (CDTI) and its potential for providing
additional health services to the poorest population. Ann Trop Med Parasitol 2002; 96 (suppl
1): S93-S104
28 WHO. Preventive chemotherapy in human helminthiasis. Coordinated use of anthelminthic drugs
in control interventions: a manual for health professionals and programme managers. Geneva:
WHO; 2006.
29 Kabatereine NB, Malecela M, Lado M, Zaramba S, Amiel O, et al. How to (or Not to) Integrate
Vertical Programmes for the Control of Major Neglected Tropical Diseases in Sub-Saharan
Africa. PLoS Neglected Tropical Diseases 2010. 4(6): e755.
doi:10.1371/journal.pntd.0000755 accessed December 2012
30 Kelly-Hipe LA, Bockarie MJ, Molynew HD. Lymphatic filariasis in the Democratic Republic of
Congo: micro-stratification overlap mapping (MOM) as a prerequisite for control and
surveillance. Parasites and Vectors, 2011, 4, 178
31 Diawara L et al. Feasibilty of onchocerciasis elimination with ivermectin treatment in endemic
foci in Africa: first evidence from studies in Mali and Senegal. PLoS Neglected Tropical
Diseases 2009. 3: e497
32 WHO. Schistosomiasis: Progress report 2001-2011 and strategic plan 2012-2020; Geneva: WHO;
2013.
33 Barker MC, Mathieu E, Fleming FM, et al. Mapping, monitoring and surveillance of neglected
tropical diseases: towards a policy framework. Lancet 2010; 375: 231-38
34 Gyapong JO, Gyapong M, Yellu N, Anakwa K, Amofah G, Bockarie M and Adjei S. Integration
of control of neglected tropical diseases into health-care systems: challenges and
opportunities. Lancet 2010: 160-65.
35 Chu BK, Hooper PJ, Bradley MH, MacFarland DA and Ottesen EA, The economic benefits
resulting from first 8 years of the Global Programme to Eliminate Lymphatic Filariasis –
2000-2007. PLoS Neglected Tropical Diseases 2010, 4(6):e708.
36 Knobel DL et al. Re-evaluating the burden of rabies in Africa and Asia. Bulletin of the World
Health Organization 2005, 83(5), 360-8.
25
37 World Bank. People, Pathogens and Our Planet, Volume 2: The Economics of One Health.
Economic and Sector Work. Report No. 69145-GLB. June 2012.
https://openknowledge.worldbank.org/bitstream/handle/10986/11892/691450ESW0whit0D0E
SW120PPPvol120web.pdf?sequence=1
38 Hotez PJ, Molyneux DH, FenwickA, Ottesen E, Sachs S Ehrlich, Sachs JD. Incorporating a rapid-
impact package for neglected tropical diseases with programs for HIV/AIDS, tuberculosis,
and malaria: a comprehensive pro-poor health policy and strategy for the developing world.
PLoS Med 2006; 3: e102.
39 Morallos D, Amekudzi A. The State of the Practice of Value for Money Analysis in Comparing
Public Private Partnerships to Traditional Procurements. Public Works Management & Policy
2008. 13(3):114-125.
40 Crompton D, Ollier L. External review of DFID’s support to the lymphatic filariasis support
centre of the Liverpool School of Tropical Medicine. London: DFID, April 2009.
41 Bockarie M, Molyneux D. The end of lymphatic filariasis? BMJ 338/7709: 1470-1472.
42 Dhunputh J. Progress in the control of Schistosomiasis in Mauritius. Transactions of the Royal
Society of Tropical Medicine and Hygiene 1994. 88(5): 507-522.
43 Richter J. The impact of chemotherapy on morbidity due to Schistosomiasis, Acta Tropica, 2003
86(2-3): 161-183.
26
Appendix. Projected Target Populations
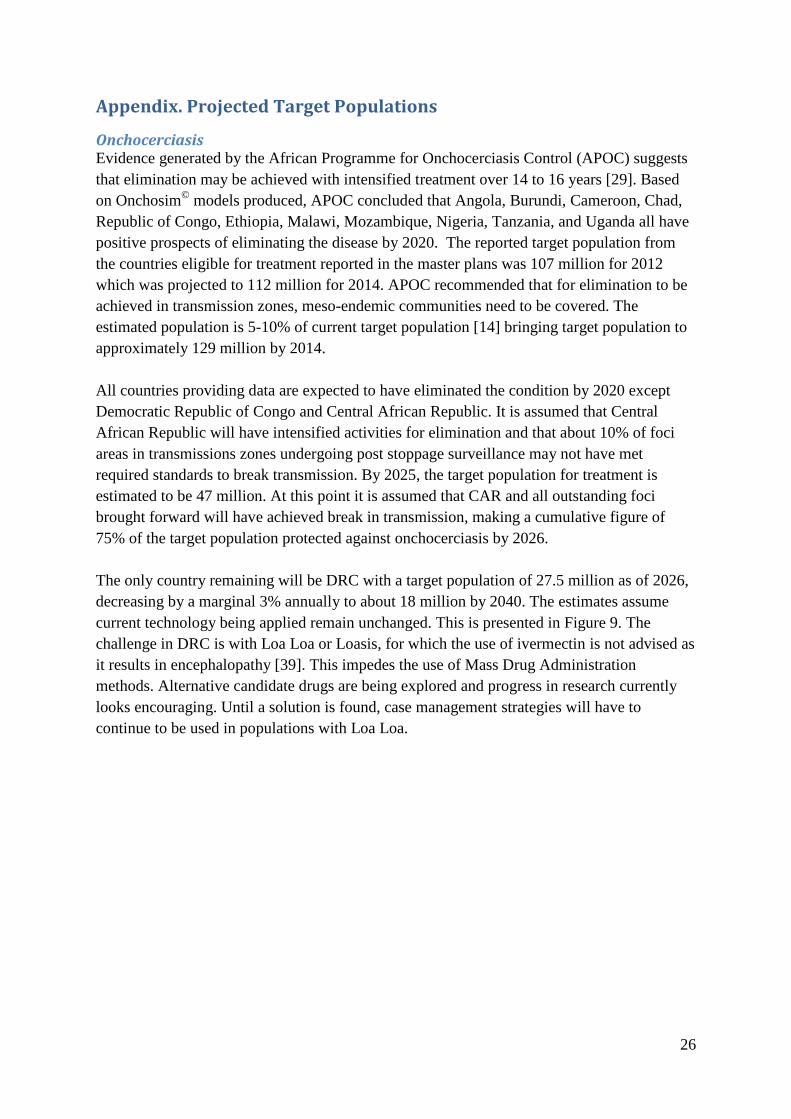
Onchocerciasis Evidence generated by the African Programme for Onchocerciasis Control (APOC) suggests
that elimination may be achieved with intensified treatment over 14 to 16 years [29]. Based
on Onchosim©
models produced, APOC concluded that Angola, Burundi, Cameroon, Chad,
Republic of Congo, Ethiopia, Malawi, Mozambique, Nigeria, Tanzania, and Uganda all have
positive prospects of eliminating the disease by 2020. The reported target population from
the countries eligible for treatment reported in the master plans was 107 million for 2012
which was projected to 112 million for 2014. APOC recommended that for elimination to be
achieved in transmission zones, meso-endemic communities need to be covered. The
estimated population is 5-10% of current target population [14] bringing target population to
approximately 129 million by 2014.
All countries providing data are expected to have eliminated the condition by 2020 except
Democratic Republic of Congo and Central African Republic. It is assumed that Central
African Republic will have intensified activities for elimination and that about 10% of foci
areas in transmissions zones undergoing post stoppage surveillance may not have met
required standards to break transmission. By 2025, the target population for treatment is
estimated to be 47 million. At this point it is assumed that CAR and all outstanding foci
brought forward will have achieved break in transmission, making a cumulative figure of
75% of the target population protected against onchocerciasis by 2026.
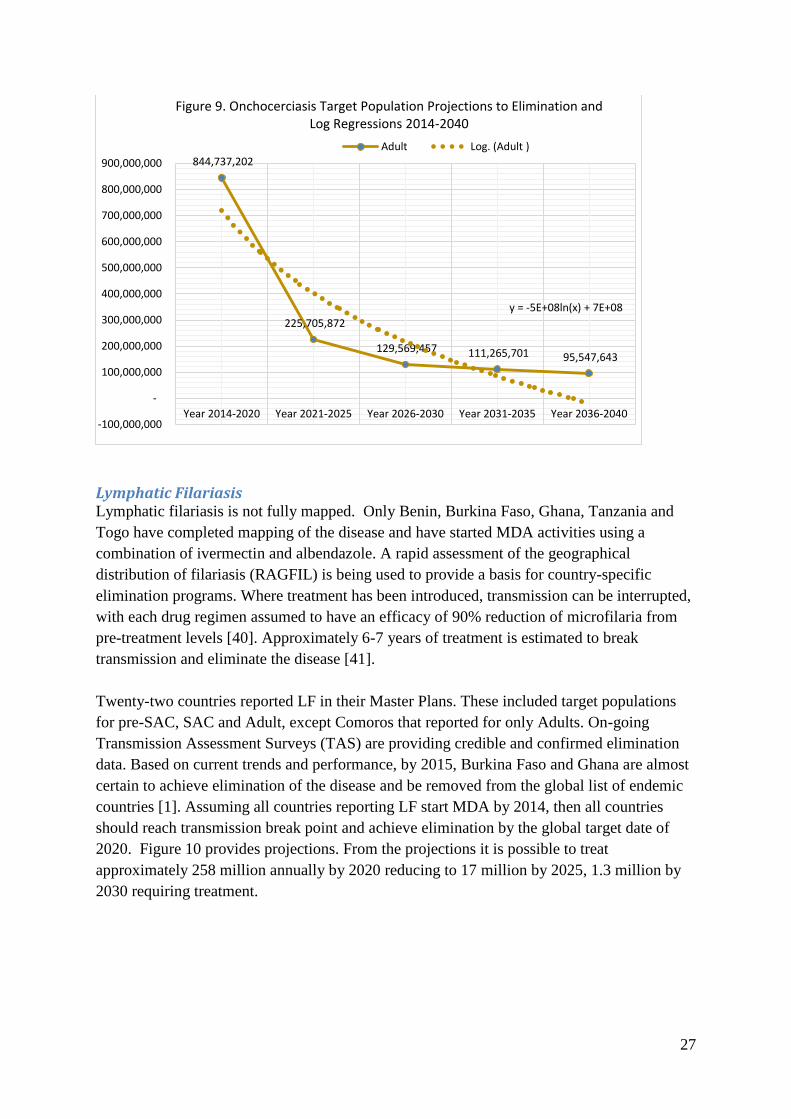
The only country remaining will be DRC with a target population of 27.5 million as of 2026,
decreasing by a marginal 3% annually to about 18 million by 2040. The estimates assume
current technology being applied remain unchanged. This is presented in Figure 9. The
challenge in DRC is with Loa Loa or Loasis, for which the use of ivermectin is not advised as
it results in encephalopathy [39]. This impedes the use of Mass Drug Administration
methods. Alternative candidate drugs are being explored and progress in research currently
looks encouraging. Until a solution is found, case management strategies will have to
continue to be used in populations with Loa Loa.
27
Lymphatic Filariasis Lymphatic filariasis is not fully mapped. Only Benin, Burkina Faso, Ghana, Tanzania and
Togo have completed mapping of the disease and have started MDA activities using a
combination of ivermectin and albendazole. A rapid assessment of the geographical
distribution of filariasis (RAGFIL) is being used to provide a basis for country-specific
elimination programs. Where treatment has been introduced, transmission can be interrupted,
with each drug regimen assumed to have an efficacy of 90% reduction of microfilaria from
pre-treatment levels [40]. Approximately 6-7 years of treatment is estimated to break
transmission and eliminate the disease [41].
Twenty-two countries reported LF in their Master Plans. These included target populations
for pre-SAC, SAC and Adult, except Comoros that reported for only Adults. On-going
Transmission Assessment Surveys (TAS) are providing credible and confirmed elimination
data. Based on current trends and performance, by 2015, Burkina Faso and Ghana are almost
certain to achieve elimination of the disease and be removed from the global list of endemic
countries [1]. Assuming all countries reporting LF start MDA by 2014, then all countries
should reach transmission break point and achieve elimination by the global target date of
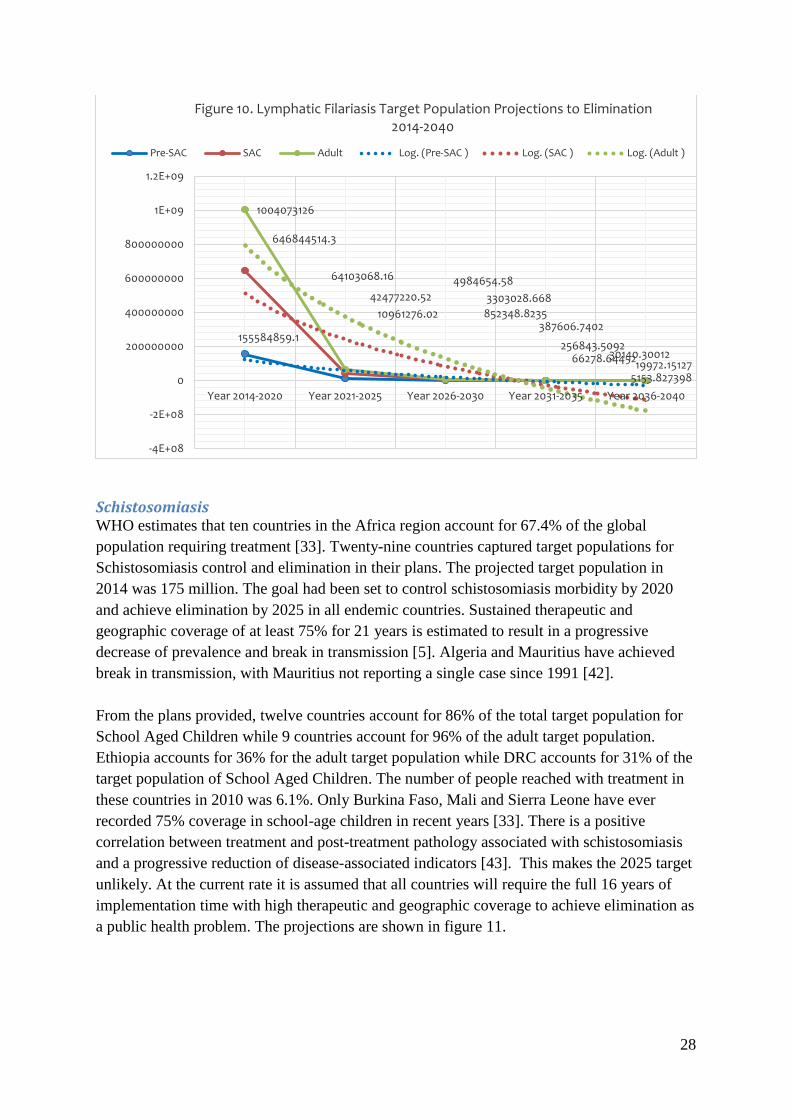
2020. Figure 10 provides projections. From the projections it is possible to treat
approximately 258 million annually by 2020 reducing to 17 million by 2025, 1.3 million by
2030 requiring treatment.
844,737,202
225,705,872
129,569,457 111,265,701 95,547,643
y = -5E+08ln(x) + 7E+08
-100,000,000
-
100,000,000
200,000,000
300,000,000
400,000,000
500,000,000
600,000,000
700,000,000
800,000,000
900,000,000
Year 2014-2020 Year 2021-2025 Year 2026-2030 Year 2031-2035 Year 2036-2040
Figure 9. Onchocerciasis Target Population Projections to Elimination and Log Regressions 2014-2040
Adult Log. (Adult )
28
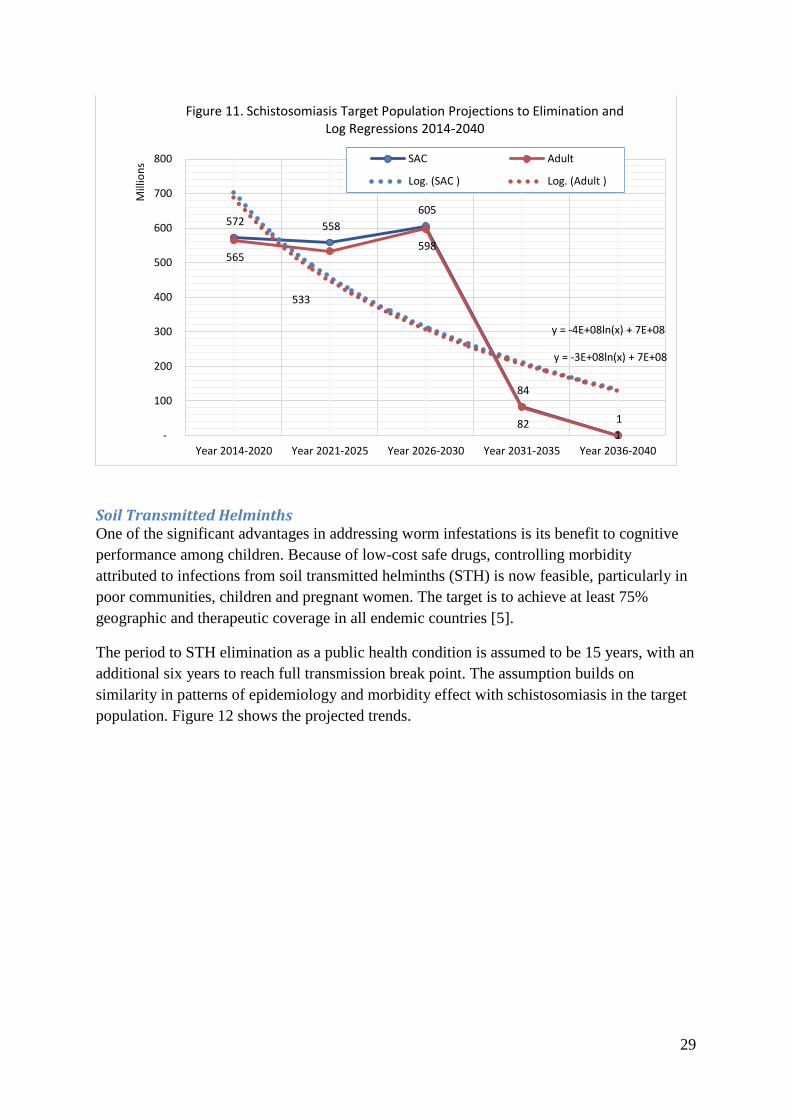
Schistosomiasis WHO estimates that ten countries in the Africa region account for 67.4% of the global
population requiring treatment [33]. Twenty-nine countries captured target populations for
Schistosomiasis control and elimination in their plans. The projected target population in
2014 was 175 million. The goal had been set to control schistosomiasis morbidity by 2020
and achieve elimination by 2025 in all endemic countries. Sustained therapeutic and
geographic coverage of at least 75% for 21 years is estimated to result in a progressive
decrease of prevalence and break in transmission [5]. Algeria and Mauritius have achieved
break in transmission, with Mauritius not reporting a single case since 1991 [42].
From the plans provided, twelve countries account for 86% of the total target population for
School Aged Children while 9 countries account for 96% of the adult target population.
Ethiopia accounts for 36% for the adult target population while DRC accounts for 31% of the
target population of School Aged Children. The number of people reached with treatment in
these countries in 2010 was 6.1%. Only Burkina Faso, Mali and Sierra Leone have ever
recorded 75% coverage in school-age children in recent years [33]. There is a positive
correlation between treatment and post-treatment pathology associated with schistosomiasis
and a progressive reduction of disease-associated indicators [43]. This makes the 2025 target
unlikely. At the current rate it is assumed that all countries will require the full 16 years of
implementation time with high therapeutic and geographic coverage to achieve elimination as
a public health problem. The projections are shown in figure 11.
155584859.1
10961276.02 852348.8235
66278.64452
5153.827398
646844514.3
42477220.52 3303028.668
256843.5092
19972.15127
1004073126
64103068.16 4984654.58
387606.7402
30140.30012
-4E+08
-2E+08
0
200000000
400000000
600000000
800000000
1E+09
1.2E+09
Year 2014-2020 Year 2021-2025 Year 2026-2030 Year 2031-2035 Year 2036-2040
Figure 10. Lymphatic Filariasis Target Population Projections to Elimination 2014-2040
Pre-SAC SAC Adult Log. (Pre-SAC ) Log. (SAC ) Log. (Adult )
29
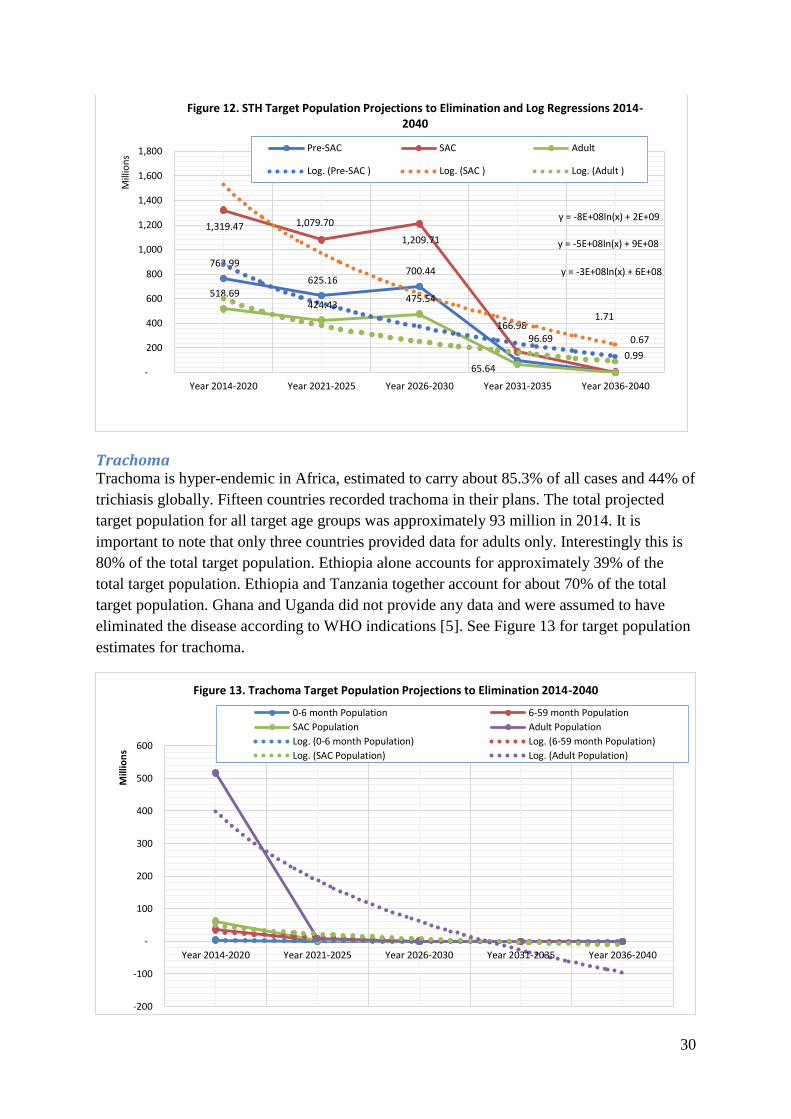
Soil Transmitted Helminths One of the significant advantages in addressing worm infestations is its benefit to cognitive
performance among children. Because of low-cost safe drugs, controlling morbidity
attributed to infections from soil transmitted helminths (STH) is now feasible, particularly in
poor communities, children and pregnant women. The target is to achieve at least 75%
geographic and therapeutic coverage in all endemic countries [5].
The period to STH elimination as a public health condition is assumed to be 15 years, with an
additional six years to reach full transmission break point. The assumption builds on
similarity in patterns of epidemiology and morbidity effect with schistosomiasis in the target
population. Figure 12 shows the projected trends.
572 558
605
84
1
565
533
598
82 1
y = -4E+08ln(x) + 7E+08
y = -3E+08ln(x) + 7E+08
-
100
200
300
400
500
600
700
800
Year 2014-2020 Year 2021-2025 Year 2026-2030 Year 2031-2035 Year 2036-2040
Mill
ion
s
Figure 11. Schistosomiasis Target Population Projections to Elimination and Log Regressions 2014-2040
SAC Adult
Log. (SAC ) Log. (Adult )
30
Trachoma Trachoma is hyper-endemic in Africa, estimated to carry about 85.3% of all cases and 44% of
trichiasis globally. Fifteen countries recorded trachoma in their plans. The total projected
target population for all target age groups was approximately 93 million in 2014. It is
important to note that only three countries provided data for adults only. Interestingly this is
80% of the total target population. Ethiopia alone accounts for approximately 39% of the
total target population. Ethiopia and Tanzania together account for about 70% of the total
target population. Ghana and Uganda did not provide any data and were assumed to have
eliminated the disease according to WHO indications [5]. See Figure 13 for target population
estimates for trachoma.
763.99
625.16 700.44
96.69
0.99
1,319.47 1,079.70
1,209.71
166.98 1.71
518.69 424.43
475.54
65.64
0.67
y = -5E+08ln(x) + 9E+08
y = -8E+08ln(x) + 2E+09
y = -3E+08ln(x) + 6E+08
-
200
400
600
800
1,000
1,200
1,400
1,600
1,800
Year 2014-2020 Year 2021-2025 Year 2026-2030 Year 2031-2035 Year 2036-2040
Mill
ion
s
Figure 12. STH Target Population Projections to Elimination and Log Regressions 2014-2040
Pre-SAC SAC Adult
Log. (Pre-SAC ) Log. (SAC ) Log. (Adult )
-200
-100
-
100
200
300
400
500
600
Year 2014-2020 Year 2021-2025 Year 2026-2030 Year 2031-2035 Year 2036-2040
Mill
ion
s
Figure 13. Trachoma Target Population Projections to Elimination 2014-2040
0-6 month Population 6-59 month Population
SAC Population Adult Population
Log. (0-6 month Population) Log. (6-59 month Population)
Log. (SAC Population) Log. (Adult Population)
30
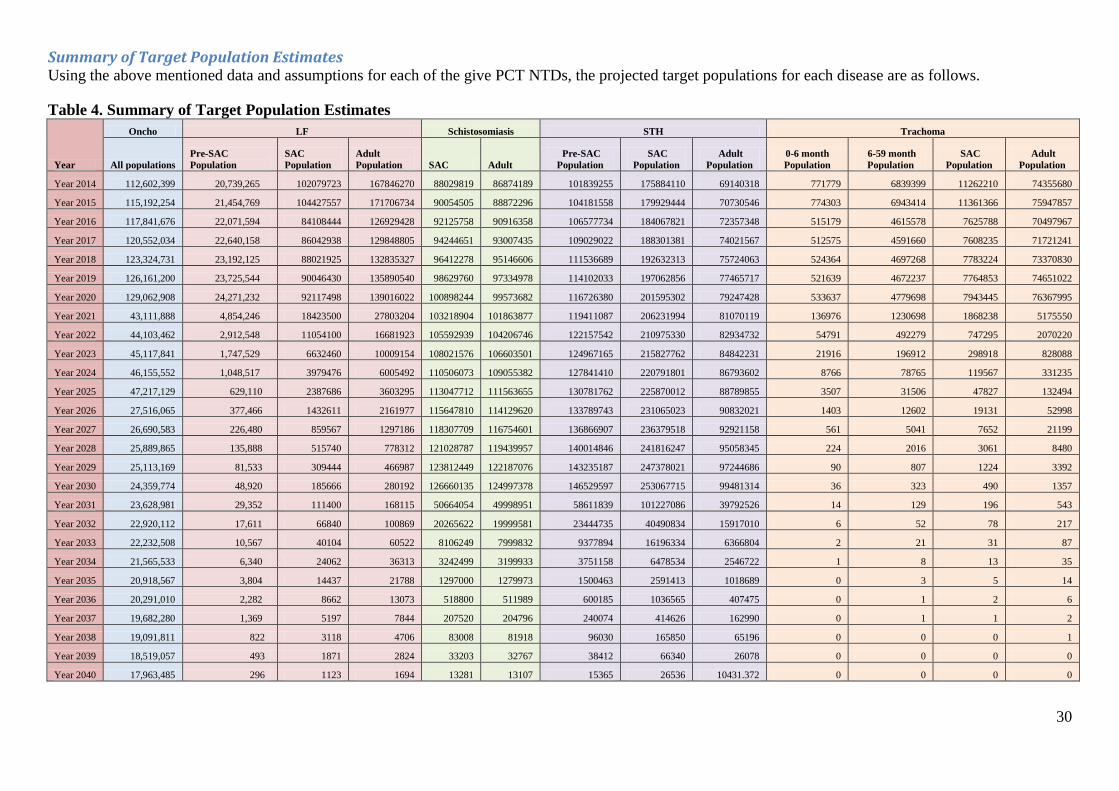
Summary of Target Population Estimates Using the above mentioned data and assumptions for each of the give PCT NTDs, the projected target populations for each disease are as follows.
Table 4. Summary of Target Population Estimates
Year
Oncho LF Schistosomiasis STH Trachoma
All populations
Pre-SAC
Population
SAC
Population
Adult
Population SAC Adult
Pre-SAC
Population
SAC
Population
Adult
Population
0-6 month
Population
6-59 month
Population
SAC
Population
Adult
Population
Year 2014 112,602,399 20,739,265 102079723 167846270 88029819 86874189 101839255 175884110 69140318 771779 6839399 11262210 74355680
Year 2015 115,192,254 21,454,769 104427557 171706734 90054505 88872296 104181558 179929444 70730546 774303 6943414 11361366 75947857
Year 2016 117,841,676 22,071,594 84108444 126929428 92125758 90916358 106577734 184067821 72357348 515179 4615578 7625788 70497967
Year 2017 120,552,034 22,640,158 86042938 129848805 94244651 93007435 109029022 188301381 74021567 512575 4591660 7608235 71721241
Year 2018 123,324,731 23,192,125 88021925 132835327 96412278 95146606 111536689 192632313 75724063 524364 4697268 7783224 73370830
Year 2019 126,161,200 23,725,544 90046430 135890540 98629760 97334978 114102033 197062856 77465717 521639 4672237 7764853 74651022
Year 2020 129,062,908 24,271,232 92117498 139016022 100898244 99573682 116726380 201595302 79247428 533637 4779698 7943445 76367995
Year 2021 43,111,888 4,854,246 18423500 27803204 103218904 101863877 119411087 206231994 81070119 136976 1230698 1868238 5175550
Year 2022 44,103,462 2,912,548 11054100 16681923 105592939 104206746 122157542 210975330 82934732 54791 492279 747295 2070220
Year 2023 45,117,841 1,747,529 6632460 10009154 108021576 106603501 124967165 215827762 84842231 21916 196912 298918 828088
Year 2024 46,155,552 1,048,517 3979476 6005492 110506073 109055382 127841410 220791801 86793602 8766 78765 119567 331235
Year 2025 47,217,129 629,110 2387686 3603295 113047712 111563655 130781762 225870012 88789855 3507 31506 47827 132494
Year 2026 27,516,065 377,466 1432611 2161977 115647810 114129620 133789743 231065023 90832021 1403 12602 19131 52998
Year 2027 26,690,583 226,480 859567 1297186 118307709 116754601 136866907 236379518 92921158 561 5041 7652 21199
Year 2028 25,889,865 135,888 515740 778312 121028787 119439957 140014846 241816247 95058345 224 2016 3061 8480
Year 2029 25,113,169 81,533 309444 466987 123812449 122187076 143235187 247378021 97244686 90 807 1224 3392
Year 2030 24,359,774 48,920 185666 280192 126660135 124997378 146529597 253067715 99481314 36 323 490 1357
Year 2031 23,628,981 29,352 111400 168115 50664054 49998951 58611839 101227086 39792526 14 129 196 543
Year 2032 22,920,112 17,611 66840 100869 20265622 19999581 23444735 40490834 15917010 6 52 78 217
Year 2033 22,232,508 10,567 40104 60522 8106249 7999832 9377894 16196334 6366804 2 21 31 87
Year 2034 21,565,533 6,340 24062 36313 3242499 3199933 3751158 6478534 2546722 1 8 13 35
Year 2035 20,918,567 3,804 14437 21788 1297000 1279973 1500463 2591413 1018689 0 3 5 14
Year 2036 20,291,010 2,282 8662 13073 518800 511989 600185 1036565 407475 0 1 2 6
Year 2037 19,682,280 1,369 5197 7844 207520 204796 240074 414626 162990 0 1 1 2
Year 2038 19,091,811 822 3118 4706 83008 81918 96030 165850 65196 0 0 0 1
Year 2039 18,519,057 493 1871 2824 33203 32767 38412 66340 26078 0 0 0 0
Year 2040 17,963,485 296 1123 1694 13281 13107 15365 26536 10431.372 0 0 0 0