towards a taxonomy of cognitive task analysis … a taxonomy … · cognitive task analysis (cta)...
TRANSCRIPT

TOWARDS A TAXONOMY OF COGNITIVE TASK ANALYSIS METHODS:
A SEARCH FOR COGNITION AND TASK ANALYSIS INTERACTIONS
by
Kenneth Anthony Yates
A Dissertation Presented to the
FACULTY OF THE ROSSIER SCHOOL OF EDUCATION
UNIVERSITY OF SOUTHERN CALIFORNIA
In Partial Fulfillment of the
Requirements for the Degree
DOCTOR OF EDUCATION
May 2007
Copyright 2007 Kenneth Anthony Yates
ii
DEDICATION
This work is a capstone of a program of study that I could not have
completed without the love and support of two very special women.
To my mother, Marie Yates-Reinburg, who taught me that it is never too late
to reinvent yourself. Without her inspiration and encouragement, my particular
transformation from executive to educator would not have been possible.
And to my Katharine, who shares this achievement with me. During this
journey, her love and patience have always been matched by her intellect. Through
the peaks and valleys of academic pursuit, she forces me to see the humor in
everything, yet somehow always knows exactly where to put the commas.

iii
ACKNOWLEDGEMENTS
I would like to take this opportunity to thank the faculty, without whom I
could not have completed this dissertation:
To Dr. Richard Clark who continues to amaze me with the depth and breath
of his knowledge. Because of his incisive guidance and superior tutelage, I was able
to not just survive the rigors of the program – I was also given the opportunity to
actually add to the body of knowledge of human learning with this study. If I have
succeeded in this effort on any level, it is due in no small part to his outstanding
scholarship, his good fellowship and his unreasonable patience.
To Dr. Allen Munro, whose infinite calm, gentle humor and unflagging
support made the writing of this dissertation a labor of love and allowed me to
experience the thrill of learning for the sake of learning.
To Dr. David Feldon, who from the very first time I sat in his classroom, set
high performance standards, yet offered me the kind of academic guidance that
would open up a whole world of learning for me. Through countless discussions,
phone calls and emails, he helped me see a totally new path to the learning of
educational psychology and convinced me of the true power of scholarly research.
Throughout the entire academic process, I have been extraordinarily fortunate to be
able to call him my mentor, champion and friend.

iv
TABLE OF CONTENTS
Dedication ii
Acknowledgements iii
List of Tables vi
List of Figures vii
Abstract viii
Chapter 1: Review of the Literature 1
Statement of the Problem 1
Purpose of the Study 9
Review of the Literature 10
Chapter 2: Method 40
Research Question 1 42
Research Question 2 49
Research Question 3 49
Research Question 4 51
Research Question 5 51
Chapter 3: Results 53
Co-coding and Inter-coder Reliability 53
Results for Coding of CTA Methods 53
Analysis for CTA Method Pairings 56
Results of Matching CTA Method Pairings with Formal Methods 58
Analysis for Declarative and Procedural Knowledge Types 58
Analysis for Declarative and Procedural Knowledge Subtypes 59
Results for Sensitivity to Automated Knowledge 60
Results for the Classification of Method Pairings by Application 62
Chapter 4: Conclusions 64
Research Questions 65
Research Question 1 65
Research Question 2 68
Research Question 3 69
Research Question 4 73
Research Question 5 74
Summary 77

v
Implications 78
Cognitive Task Analysis 78
Instructional Design 83
Conclusion 84
References 85
Appendices 91
Appendix A 91
Appendix B 103
Appendix C 106
Appendix D 110

vi
LIST OF TABLES
Table 1: Comparison of Reviews of CTA Techniques 14
Table 2: Additional CTA Methods for the Classification of Studies 44
Table 3: Studies in Phase One 46
Table 4: Most Frequently Cited Methods 48
Table 5: Frequency of Individual Methods 54
Table 6: Most Frequent CTA Method Pairings 57
Table 7: Method Pairings by Declarative and Procedural Knowledge 58
Table 8: Method Pairings by Knowledge Subtypes 59
Table 9: Method Pairings Associated with Automated Knowledge 61
Table 10: Classification of CTA Method Pairings by Application 62
Table 11: Knowledge Types Associated with CTA Applications 63
vii
LIST OF FIGURES
Figure 1: Performance-Content Matrix 35
Figure 2: Knowledge Types and Activities 39
Figure 3: Study Sample Methodology 42
Figure 4: Frequency of CTA Method Pairings 56

viii
ABSTRACT
Experts are often called upon to provide their knowledge and skills for curriculum
and materials development, teaching, and training. Experts also provide information
to develop knowledge-based expert computer systems that facilitate problem-solving
tasks in a wide range of fields. Cognitive task analysis (CTA) is a family of
knowledge elicitation techniques that have been shown to effectively capture the
unobservable cognitive processes, decisions, and judgments involved in expert
performance. Over 100 types of CTA methods have been identified and classified.
However, existing classification schemes primarily sort CTA techniques by process
rather than desired outcome or application. Consequently, it is difficult for
practitioners to choose an optimal method for their purposes. A more effective and
efficient method to elicit, analyze, and represent expert knowledge would be to apply
CTA methods known to be appropriate to the desired knowledge outcome.
However, no taxonomy of CTA methods and knowledge types currently exists. The
purpose of this study is to identify the most frequently used CTA techniques in the
literature and identify which knowledge types are associated with their methods and
outcomes. The results indicate that (a) the most frequently used CTA methods
include both standardized and informal methods, (b) pairings of CTA methods are
used in practice rather an individual methods, and (c) CTA methods have been
associated more with declarative knowledge than procedural knowledge.
Implications for future CTA research and instructional design are discussed.

1
CHAPTER 1: REVIEW OF THE LITERATURE
Statement of the Problem
Unless one can decompose the particular task, in terms of desired learning
outcomes and cognitive-process elements, there is almost no point to
understanding knowledge structures, and unless one can gain access to those
knowledge structures, in both the particular and the generic learners (expert,
novice, or whatever), there is no dependable way to translate theory into
practice. In short, one must know not only what learning operations the task
requires, but also what operations the learner is and should be executing at
each stage of the learning process. (Howell & Cooke, 1989, p. 160)
This claim provides a succinct argument for the benefits of utilizing cognitive
task analysis (CTA) methods to capture accurate and complete descriptions of the
performance objectives, equipment, conceptual and procedural knowledge, and
performance standards that experts use to perform complex tasks (Clark, Feldon,
Van Merriënboer, Yates, & Early, in press). Experts are often called upon to provide
their knowledge and skills for curriculum and materials development, teaching, and
training. They also provide information for the development of knowledge-based
computer systems that attempt to address undefined and ill-structured problems
(McTear & Anderson, 1990).
Historically, behavioral task analysis methods have served as the primary
approach to capturing experts’ observable actions for these purposes. However,
replicating expert performance originating from behavioral analysis is problematic.
Expertise, by its nature, is acquired as a result of continuous and deliberate practice
in solving problems in a domain (Ericsson, Krampe, & Tesch-Römer, 1993). As
new knowledge is acquired and practiced, it becomes automated and unconscious

2
(Anderson & Lebiere, 1998). Thus, when called upon, experts are often unable to
completely and accurately recall the knowledge and skills that comprise their
expertise, resulting in significant omissions that can negatively impact in
instructional efficacy and lead to subsequent difficulties for learners (Chao &
Salvendy, 1994; Feldon, in press; Hinds, 1999).
During the past 25 years, advances in human performance technology have
resulted in the development of cognitive task analysis (CTA) as a group of
knowledge elicitation methods, which capture the unobserved knowledge, cognitive
processes, and goal structures that underlie human behavior (Chipman, Schraagen, &
Shalin, 2000; Cooke, 1992). By capturing the decision steps and other cognitive
processes, in addition to the action steps experts use in problem solving, instruction
and expert systems can be developed that have the potential of replicating expert
performance (Clark, 1999).
Evidence for the Impact of CTA on Learning and Performance
A number of studies reveal the effectiveness of CTA methods to improve the
accuracy and completeness of information elicited from experts. They also
demonstrate that learners’ performance improves, as a result of training based on
CTA methods.
For example, knowledge elicited by CTA methods improves performance in
medical procedures, for which the consequences of incorrect or inaccurate training
are potentially life threatening. Maupin (2003) and Velmahos et al. (2004)

3
documented higher levels of competence for medical interns who received training
based on expert information elicited using cognitive task analysis methods. The
study compared the skills of 24 surgical interns on the placement of the central
venous catheter between training based on knowledge elicited using CTA methods
and traditional instruction. Interns in the control group received instruction using the
traditional Halsteadian (i.e., “see one, do one, teach one”) method, in which a
trainee watches a senior resident perform the procedure, performs the procedure
under supervision himself, and lastly, instructs another trainee. Interns assigned to
the experimental condition received training based on knowledge elicited from
individual cognitive task analyses conducted with two senior surgeons that were
combined and converted into a training program. Analyses of the results showed
that the experimental group had higher mean scores on a post-training declarative
knowledge test, required fewer attempts to insert the catheter into the vein
successfully, and made fewer mistakes when performing the procedure. Qualitative
analysis of the types of errors made by interns indicated that those tasks requiring
non-observable decision making, such as selection of the appropriate type of catheter
and the placement location, were more likely to be made by participants in the
control group.
The accuracy and completeness of medical textbooks is critical in training
nurses and other health care professionals; however, textbooks may not contain
essential practical knowledge that is learned by on-the-job experience. Hoffman,
Crandall, and Shadbolt (1998) reported studies that compared the tacit knowledge of

4
nurses working in a neonatal intensive care unit with information found in textbooks
and found that the indicators detailed in the literature were not a good reflection of
realistic clinical practice in the unit. The researchers conducted CTA interviews with
22 highly experienced neonatal nurses who gave accounts of critical case incidents,
such as preparatory failure and cardiac arrest. An analysis of the interviews resulted
in a number of diagnostic indicators. Compared with the text and manuals, the
indicators elicited from the nurses was more elaborate and related more to perceptual
judgments and alertness of shifts in the patients’ conditions.
Similar to the health care domain, diagnosing or troubleshooting complex
computer systems, such as those found in military applications, has high stake
consequences, and often must be performed under severe time constraints in
operational conditions. Consequently, training for troubleshooting in these contexts
must achieve a high degree of speed and accuracy. Schaafstal, Schraagen and van
Berlo (2000) conducted a series of cognitive task analyses to develop and test a
structured troubleshooting training method consisting of teaching (a) a system
independent strategy for troubleshooting, (b) functional models of the system, (c)
and system specific domain knowledge. An experimental evaluation was conducted
with 21 officers. Ten assigned to a control group received the regular course, and the
remaining participants received the training in structured troubleshooting (ST). The
variables measured were scores on the knowledge test, and blind ratings of the
subjects’ verbal protocols on solution accuracy, systematic reasoning, and functional
understanding of the system. Although not a statistically reliable difference, the ST

5
group outscored the controls on the knowledge test (63% versus 55%). However,
statistical analysis confirmed a significant effect in favor of the ST group on all
verbal protocol ratings for percentage of problems solved (86% versus 40%),
systematic reasoning (4.64 versus 2.60, scale = 1-5), and functional understanding
(4.59 versus 2.87, scale = 1-5). Moreover, the results showed that the ST group
solved the problems in at least 50% less time, providing an additional operational
advantage.
Lee (2004) conducted a meta-analysis to determine the generalizability of
CTA methods to improve training performance across a broad spectrum of
disciplines. Meta-analysis is a technique of quantitative research synthesis
incorporating the findings of different research studies that can be meaningfully
compared using the size of the statistical effect. The use of effect size standardizes
the studies’ findings as to make them interpretable and consistent across all variables
and measures (Lipsey & Wilson, 2001). A search of the literature in 10 major
databases in a variety of domains (Dissertation Abstracts International, Article First,
ERIC, ED Index, APA/PsycInfo, Applied Science Technology, INSPEC, CTA
Resource, IEEE, Elsevier/AP/Science Direct), using keywords such as “cognitive
task analysis,” knowledge elicitation,” and “task analysis,” yielded 318 studies.
Seven studies qualified, based on the qualifications of: training based on CTA
methods with an analyst, conducted between 1985 and 2003, and reported pre- and
post-test measures of training performance. A total of 39 comparisons of mean
effect sizes for pre- and posttest differences were computed from the seven studies.
6
Analysis of the studies resulted in effect sizes of between .91 and 1.45, all considered
“large” (Cohen, 1992), and an mean effect size of d=+1.72 and an overall percentage
of post-training performance gain of 75.2%. Results of a chi-square test of
independence on the outcome measures of the pre- and posttests (2=6.50, p<0.01)
indicated that CTA was most likely the cause of the performance gain.
Taxonomies
Taxonomies are classifications systems that organize objects or phenomena
into categories (Jonassen, Tessmer, & Hannum, 1999). Although taxonomies are
often hierarchical, they can also be a simple organization of objects or phenomena
into groups or categories. Taxonomies represent a classificatory perspective. For
example, a customer, dealer, or repair shop might classify automobiles differently.
Chulef, Read, and Walsh (2001) suggest that taxonomies play three
fundamental roles in a domain of study in that they (a) provide a common
vocabulary and language system to aid communication among researchers, (b)
support the integration and systemization of findings and theories, and (c) facilitate
theory development. For the practitioner in a domain, taxonomies and classifications
are indispensable guides to identify appropriate methods, outcomes, and other
relationships among the members of the system.

7
The Current Study
CTA methods have evolved through specific knowledge elicitation
applications, mostly in the development of expert systems and in laboratory and
military settings. As a result, over 100 variations of CTA methods have been
identified (Cooke, 1994). Numerous classifications of CTA methods exist that
categorize methods by technique and analytic focus. Technique classifications are
those that concern mechanisms for eliciting, analyzing, and representing knowledge.
Classifications by analytic focus categorize methods by the domain in which tasks
are performed and the social and organizational context of practice in that domain
(e.g., CTA Resource, 2006). Classifications of CTA methods by the type of
knowledge to be elicited have also been developed (Essens, Fallesen, McCann,
Cannon-Bowers, & Dorfel, 1995). Although they differ in overall theoretical
approach, these classifications are similar, in that they assign classifications based on
the process of conducting CTA and the mechanisms of the individual methods. As a
result, there remain no clear guidelines for the practitioner to choose the appropriate
combination of methods to apply to a specific task or intended results, “nor is it clear
that an orderly relation exists between knowledge elicitation techniques and the type
of knowledge that results” (Cooke, 1994, p. 804).
In real world applications, CTA is a toolkit consisting of multiple techniques
that elicit knowledge, facilitate data analysis, and those that represent the content and
structure of knowledge. This present study requires that these terms be clearly
defined.

8
Crandall, Klein, and Hoffman (2006) describe CTA as encompassing three
sets of activities: knowledge elicitation, data analysis, and knowledge representation.
Knowledge elicitation methods are defined as those used to collect information about
“what people know and how they know it: the judgments, strategies, knowledge,
and skills that underlie performance” (p. 10). Data analysis is “the process of
structuring data, identifying findings, and discovering meaning. Knowledge
representation includes the critical tasks of displaying data, presenting findings, and
communicating meaning” (p. 21). Although data analysis and knowledge
representation are two distinct aspects of CTA, they are often linked with elicitation
methods (e.g., concept maps, repertory grid). Furthermore, analysis and
representation tools often share common characteristics so that they are frequently
combined into a single category in classification schemes, as found, for example, on
the CTA Resource (2006) Web site. As reflected in actual practice, then, it would
appear more appropriate to examine CTA as a pairing of knowledge elicitation and
analysis/representation techniques.
Maximally effective approaches to CTA tend to be those that are organized
around and guided by the desired knowledge results (Chipman et al., 2000), and, as
such, it would be helpful “to define a taxonomy of tasks, that, in effect, would
classify tasks into types for which the same abstract knowledge representation and
the same associated knowledge-elicitation methods are appropriate” (p. 7).
Therefore, in contrast with previous classifications of methods that focus on
the CTA process, the current study incorporates a product approach that explores the
9
association between knowledge types as outcomes of the CTA process and the
pairing of CTA methods.
Purpose of the Study
The purpose of this exploratory study is to examine the interactions between
cognition and task analysis activities. The following research questions frame the
study:
• What are the most frequently used pairings of knowledge elicitation and
analysis/representation methods found in the CTA literature?
• To what extent do the pairings of these knowledge elicitation and
analysis/representation methods match with formal CTA methods found
in the literature?
• What knowledge types are associated with these knowledge elicitation
and analysis/representation pairings? How consistent are the
associations?
• To what extent do publications containing pairings of CTA methods
include a statement that the methods incorporate activities addressing
automated, tacit, or implicit knowledge?
• How can the applications of the most frequently used pairings of CTA
methods be categorized?

10
Review of the Literature
Among the various definitions found in the literature, knowledge elicitation
has been characterized as the process of acquiring knowledge from an expert within
a particular problem domain (McTear & Anderson, 1990), and the process of
explicating domain-specific knowledge underlying human performance ( Cooke,
1999). Representing a wide range of applications, CTA has broadened the focus of
knowledge elicitation to include other aspects of cognition, including perception,
planning, and decision-making processes. Chipman et al. (2000) define CTA as an
“extension of traditional task analysis techniques to yield information about the
knowledge, thought processes, and goal structures that underlie observable task
performance” (p. 3).
CTA methods are often referred to as a “practitioner’s tool kit” ( Cooke,
1999, p. 4). Included in this tool kit are techniques that elicit knowledge, facilitate
data analysis, and those that represent the content and structure of knowledge
(Crandall et al., 2006). Knowledge elicitation methods are defined as those used to
collect information about “what people know and how they know it: the judgments,
strategies, knowledge, and skills that underlie performance” (p. 10). Data analysis is
“the process of structuring data, identifying findings, and discovering meaning.
Knowledge representation includes the critical tasks of displaying data, presenting
findings, and communicating meaning” (p. 21). Although data analysis and
knowledge representation are two distinct aspects of CTA, they are sometimes

11
integrated with elicitation, for example, creating a concept map or constructing a
repertory grid.
As with any took kit, the achievement of the desired outcome depends on the
practitioner’s understanding of what each tool accomplishes. To assist the
practitioner in choosing the appropriate method for the desired outcome, numerous
classification schemes have been developed. A review of these classifications and
their limitations provide the context for the current study.
Knowledge, in its broadest form, is the raw material that the CTA practitioner
extracts, analyzes, and formats, and as such, provides the fundamental reason for
conducting CTA. The representation or output of CTA gives a view of expertise in
the performance of a task in context that can be used for the design of instruction,
expert systems, and other applications (Militello, 2001). Although classifications by
knowledge representation offer a level of understanding of the application of CTA
methods, empirical research in cognitive science has resulted in a more fundamental
and useful method to comprehend and classify the content, structure and application
of knowledge. This cognitive view of knowledge types and uses provides the
framework for the current study.
Classifications of CTA Methods
During the 1980s, CTA and other labels for knowledge elicitation emerged as
a result of a convergence of an emphasis on the study of cognition, the
computerization of work, and the shift to more cognitive tasks in the workplace.

12
There was a tendency to conduct CTA studies in context to examine the interactions
of cognition, work environments, and complex communication; however, this
resulted in fragmented, single-purpose studies from which various cognitive task
analysis methodological approaches and labels emerged (Hoffman & Woods, 2000).
One of the first classification systems was developed by Bainbridge (1979)
who, responding to the criticism of self-report and “awareness” studies, examined
the conditions in which verbal reports could be used as evidence, namely, when it is
determined that verbal reports are sufficiently correlated with observable behavior.
She proposed a classification matrix of types of desired information versus elicitation
techniques. Bainbridge classified desired information into seven categories: (a)
general information on the effects of variables, (b) general information on control
strategy, (c) numerical information on control strategy, (d) technical aspects of
process, (e) decision sequences, (f) general types of cognitive processes, and (g) full
range of behaviors. The elicitation techniques in the matrix included the
questionnaire, interview, static simulation, on-line interview, verbal protocol, and
observation. Bainbridge cautioned that the appropriate technique depends on the
task being performed. Additionally, although verbal reports can be inaccurate,
verbal data can be both interesting and useful. Bainbridge was one of the first of
many researchers who have recommended using a combination of techniques, as
different types of cognitive processing are most likely reported in different ways, and
“we are far from being clear about either the different types of cognitive process
which exist or the best methods to use” (p. 432).

13
Researchers have since identified over 100 types of CTA methods due
primarily to the diverse paths that the development of CTA has taken (Cooke, 1994).
With origins in behavioral task analysis, early work in specifying computer system
interfaces, and in military applications – each with its own demands, uses, and
research base – the growing body of CTA literature continues to reflect the diverse
application of CTA methods. This has resulted in a growing interest to categorize
CTA methods in an attempt to understand what methods are appropriate under
specific conditions. However, many of these categorizations have focused on the
mechanics, such as the elicitation method used and the training required (Militello,
2001), while others have organized the various methods according to the type of
outcome and application of the results (Schraagen, Chipman, & Shute, 2000).
Schraagen et al. (2000) conducted a “review of reviews” in which they
briefly described 20 reviews of CTA methods published from 1990 through 2000.
When the reviews are compared (see Table 1, as cited in Schraagen et al., 2000),
they reveal, as expected, the predominate focus of CTA on the development of
expert systems and instructional design. Also, it is not surprising that the typical
review is intended to guide the practice of conducting CTA, given the number and
diversity of methods available to the practitioner. The description of the
classification scheme presented in the review, on the other hand, further
demonstrates the challenge of not only choosing the appropriate individual method,
but also choosing classification system to guide the choice of a method.

14
Table 1.
Comparison of Reviews of CTA Techniques
Reference Focus Classification Type
Grant and Mayes
(1991)
Expert systems Task analysis
relating to human
cognition
Theories and
models
Observations
Theory
Development
Olson and Biolsi
(1991)
Elicitation,
analysis, and
representation
Direct (e.g.,
interview, think
aloud)
Indirect (e.g.,
repertory grid,
judgments of
similarity or
relatedness)
Practice
Wilson and Cole
(1991)
Instructional design Cognitive
apprenticeship
framework
Practice
Alm (1992) Meta-analysis Context, tasks,
structure, mental
representations
Practice
Kirwan and
Ainsworth (1992)
Organizations Behavioral task
analysis
CTA
Practice
Redding (1992) Instructional design CTA process and
deliverables
Practice
Benysh, Koubek,
and Calvez (1993)
Expert systems Verbal reports
Clustering
techniques
Scaling methods
Practice
Means (1993) Instructional design Case studies Practice
Williams and
Kotnur (1993)
Expert systems Manual, machine-
aided, machine-
learning
Practice

15
Table 1, Continued
Cooke (1994) Elicitation process Observations and
interviews
Process tracing
Conceptual
techniques
Practice
John and Kieras
(1994)
Expert systems GOMS Practice
Essens, Fallesen,
McCann,
Cannon-Bowers
and Dorfel (1994)
Human-computer
interaction
Declarative
Procedural
Strategic
Practice
Merkelbach and
Schraagen (1994)
None specified Task modeling
Knowledge
modeling
Cognitive modeling
Theory
Development
Whitefield and
Hill (1994)
Expert systems Hierarchical task
analysis
Task knowledge
structures
GOMS
Cognitive task
analysis
Practice
Dehoney (1995) Instructional design Domain knowledge
Focus problems
Knowledge
elicitation
Practice
DuBois and
Shalin (1995)
Assessment None specified Practice
Hall, Gott and
Pokorny (1995)
Instructional
Design
PARI Practice
Hoffman,
Shadbolt, Burton
and Klein (1995)
Instructional design
Expert systems
Familiar tasks
Interviews
Contrived
techniques
Practice
Crandall, Klein,
Militello and
Wolf (1997)
Instructional design ACTA Practice
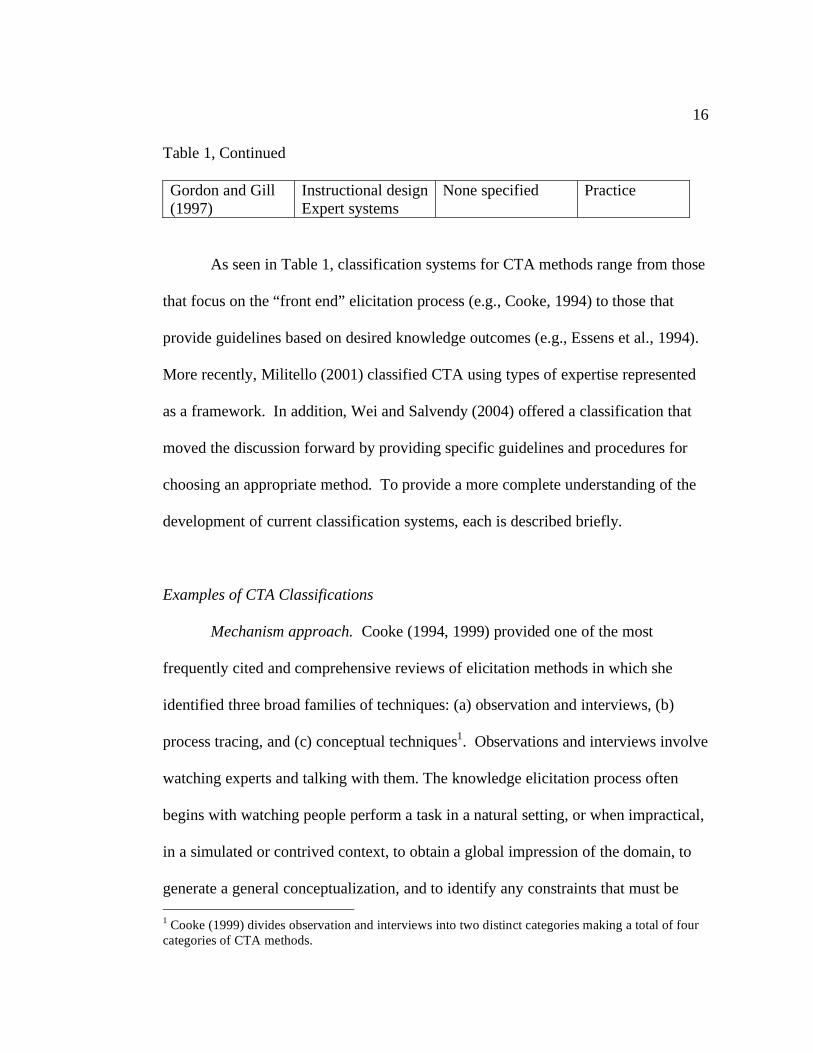
16
Table 1, Continued
Gordon and Gill
(1997)
Instructional design
Expert systems
None specified Practice
As seen in Table 1, classification systems for CTA methods range from those
that focus on the “front end” elicitation process (e.g., Cooke, 1994) to those that
provide guidelines based on desired knowledge outcomes (e.g., Essens et al., 1994).
More recently, Militello (2001) classified CTA using types of expertise represented
as a framework. In addition, Wei and Salvendy (2004) offered a classification that
moved the discussion forward by providing specific guidelines and procedures for
choosing an appropriate method. To provide a more complete understanding of the
development of current classification systems, each is described briefly.
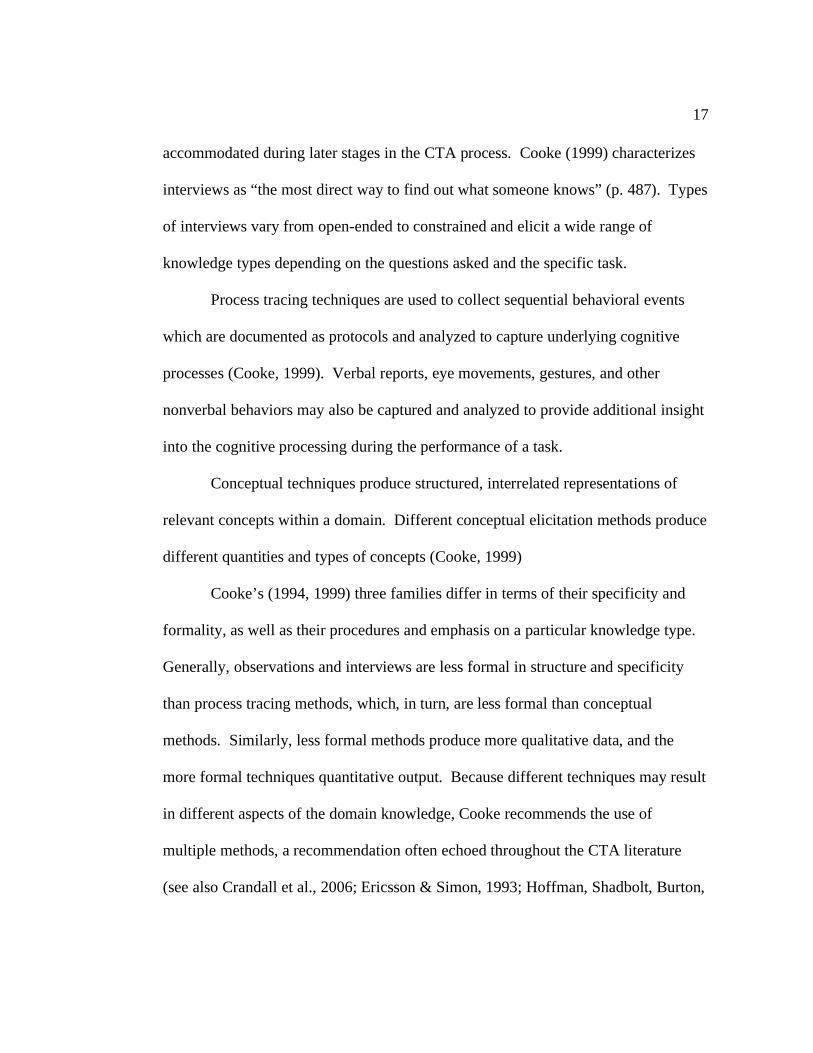
Examples of CTA Classifications
Mechanism approach. Cooke (1994, 1999) provided one of the most
frequently cited and comprehensive reviews of elicitation methods in which she
identified three broad families of techniques: (a) observation and interviews, (b)
process tracing, and (c) conceptual techniques1. Observations and interviews involve
watching experts and talking with them. The knowledge elicitation process often
begins with watching people perform a task in a natural setting, or when impractical,
in a simulated or contrived context, to obtain a global impression of the domain, to
generate a general conceptualization, and to identify any constraints that must be
1 Cooke (1999) divides observation and interviews into two distinct categories making a total of four
categories of CTA methods.
17
accommodated during later stages in the CTA process. Cooke (1999) characterizes
interviews as “the most direct way to find out what someone knows” (p. 487). Types
of interviews vary from open-ended to constrained and elicit a wide range of
knowledge types depending on the questions asked and the specific task.
Process tracing techniques are used to collect sequential behavioral events
which are documented as protocols and analyzed to capture underlying cognitive
processes (Cooke, 1999). Verbal reports, eye movements, gestures, and other
nonverbal behaviors may also be captured and analyzed to provide additional insight
into the cognitive processing during the performance of a task.
Conceptual techniques produce structured, interrelated representations of
relevant concepts within a domain. Different conceptual elicitation methods produce
different quantities and types of concepts (Cooke, 1999)
Cooke’s (1994, 1999) three families differ in terms of their specificity and
formality, as well as their procedures and emphasis on a particular knowledge type.
Generally, observations and interviews are less formal in structure and specificity
than process tracing methods, which, in turn, are less formal than conceptual
methods. Similarly, less formal methods produce more qualitative data, and the
more formal techniques quantitative output. Because different techniques may result
in different aspects of the domain knowledge, Cooke recommends the use of
multiple methods, a recommendation often echoed throughout the CTA literature
(see also Crandall et al., 2006; Ericsson & Simon, 1993; Hoffman, Shadbolt, Burton,
18
& Klein, 1995; Jonassen et al., 1999; Russo, Johnson, & Stephens, 1989; Schraagen,
Chipman, & Shalin, 2000).
It is important to note that Cooke (1994) makes the distinction among
knowledge elicitation, knowledge acquisition, and knowledge engineering.
Elicitation is the “process of collecting from a human source of knowledge,
information that is thought to be relevant to that knowledge” (p. 802). Elicitation is
part of acquisition, which is defined as the “explication and formalization of that
knowledge,” and has, as its goal, “to externalize knowledge in a form that can be
implemented in a computer” (p. 802). Both are part of knowledge engineering,
which refers to building an expert system or a knowledge base system. Analysis
techniques are included in Cooke’s classification, thus placing them on the same
level as elicitation techniques. Knowledge representation, as defined by Crandall et
al. (2006), would appear to fall more within the Cooke’s definition of acquisition,
rather than elicitation. Thus, it could be that the specificity of terms used in
individual studies has been compromised by the general reference to “CTA methods”
in the literature.
Cooke, Roth and Freeman (CTA Resource, 2006) expanded on Cooke’s
(1994) classifications by categorizing techniques primarily associated with
knowledge elicitation and knowledge analysis and representation. As defined in the
CTA Methods Summary Table (see Appendix A), elicitation methods are used to
acquire data, while analysis/representation refers to methods that produce an analytic
product or representation. Their classification scheme also evaluates methods

19
against various attributes according to the strength of the association (high or low).
Attributes of elicitation include observation, text analysis, interview, and
psychometrics. Attributes of analysis/representation include descriptive,
tables/graphs, qualitative models, simulation and numeric models, in addition to the
focus of the analysis as domain, operations, cognition, and social/organizational.
Knowledge type approach. Essens et al. (1994) define CTA as seeking to
describe, in cognitive terms, how goals and tasks are accomplished. Accordingly,
they approached classifying CTA methods from the perspective of capturing the
cognitive requirements of task performance. CTA plays a critical role in providing
information to decide which aspects of task performance need to be supported. For
example, to support a decision-making process, knowing that a decision has to be
made is less important then knowing how that decision is made. The authors refer to
knowledge elicitation as techniques that tap an expert’s knowledge and differentiate
these techniques by the type of knowledge that defines the decision-maker’s
performance. Thus, they distinguish three classifications; those that elicit
declarative, procedural, and strategic knowledge.
According to Essens et al. (1994), declarative knowledge describes facts,
rules, concepts, and attributes of a domain. Procedural knowledge pertains to the
steps, transformations, and operations applied to knowledge in reaching a decision,
such as rules, actions, heuristics, strategies, and processes. Strategic knowledge is
closely associated with meta-cognitive processes, such as external monitoring of
demands, internal monitoring of capabilities, and control of cognitive processes.

20
Although the focus of Essens et al.’s (1994) classification is on desired
outcomes, it is interesting to note that they recognize the variety of approaches found
in the literature “reflect different views of cognition and the lack of firmly
established theoretical principles for analysis” (p. 114).
Representation approach. As many CTA methods link elicitation with
analysis/representation techniques, only a few studies are found in the literature that
focuses specifically on analysis/representation (Crandall, et al., 2006). Recently,
Militello (2001) suggested that the representation or output of CTA is a view of
expertise in the context of a specific task. Accordingly, she proposed a
categorization scheme centered around the types of expertise elicited and represented
by various CTA methods that includes four categories: expertise in context,
conceptual links, operation sequences, and simulations of expert performance.
Methods that elicit expertise on context (e.g., Critical Decision Method)
capture cues, judgments, and problem-solving strategies in a dynamic setting.
Conceptual links (e.g., concept maps) provide a static representation of the abstract
mental models of how the expert organizes information. Methods that capture
operation sequences, such as goals, timelines, and interactions, include hierarchical
task analysis, timeline analysis, and workflow analysis. Simulations of expert
performance use computer models to represent human performance of a task in a
software environment.
Because each representation of expertise captures different aspects of the
behavior and cognition, Militello (2001) recommends a combination of methods that

21
result in two dimensions of expertise (a) that relate to the level of contextual detail
(rich versus abstract) and (b) that concern the view of expertise in time (static versus
dynamic).
Guidelines approach. Wei and Salvendy (2004) extended the classification
of CTA methods based on the mechanisms of the techniques – observations and
interviews, process tracing, and conceptual techniques – by the addition of a fourth
family – formal models. The authors also classified each family according to the
degree to which the technique is formally specified, with observations and interviews
being less formal and specified and formal models more formal and well specified.
Methods are also compared based on appropriate application characteristics, inputs,
outputs, and processes, which are then summarized as general weaknesses and
advantages for each method. Wei and Salvendy’s review differs from other
classifications in that it provides guidelines to select CTA methods in practical
applications.
Wei and Salvendy (2004) further analyzed CTA methods in the context of
task and job design, and concluded that “based on the summarized literature reviews
…the current methods are only found to capture part of the human performance
aspect in the cognitive domain” (p. 289). They based their analysis on a human-
centered information-processing (HCIP) model designed to capture the cognitive
attributes of tasks and their influence on task performance. Cognitive attributes of
task performance are classified within 11 modules that fall in three broad categories:
functional, resource, and affect, and are claimed to be “the most complete cognitive

22
capability requirements for job design” (p. 293). Using the HCIP model as the
standard, they evaluated 26 task analysis methods to determine whether the methods
(a) generally covered, (b) somewhat covered, or (c) extensively captured and
represented the cognitive attributes within the 11 modules. Wei and Salvendy found
that the attributes, such as generate ideas, intervene, human learning, cognitive
attention, sensory memory, ability and skills, and social environment, are not, or are
rarely, addressed by the 26 methods reviewed.
Wei and Salvendy’s (2004) review and analysis of CTA methods using the
HCIP model is important for two reasons. First, it validates the suggestion made by
Hoffman et al. (1995) that two or more CTA methods should be combined to ensure
complete and accurate results. Known as the “differential access hypothesis,”
Hoffman et al. proposed that different elicitation techniques capture different types
of knowledge, and that the characteristics of the domain and task should be
considered when choosing a technique. To compensate for the differential access
effect, Wei and Salvendy recommend either combining CTA methods with
traditional task analysis, or combining CTA methods from the same or different CTA
family to capture all the cognitive attributes of task performance. Wei and
Salvendy’s study also demonstrates how a cognitive model can be used to
systematically evaluate the characteristics CTA methods based on an objective
standard, in this case the HPIC model, to identify commonalities and differences
among the methods.

23
In sum, existing classification systems examine CTA through unique lenses
representing diverse theoretical and application approaches. Although generally
helpful for the practitioner, the narrow focus of these systems, as shown in the next
section, limits research in and progress toward a unified theory of CTA and a
simplified taxonomy that can apply over a wide range of domains.
Limitations of Existing Classification Systems
The diverse development and application of CTA has led to many conflicting
and confusing definitions. The term “cognitive task analysis,” for example, refers to
both the general process of conducting CTA (Chipman et al., 2000) and an explicit
set of knowledge elicitation techniques to identify the knowledge, goals, strategies,
and decisions that underlie observable task performance (CTA Resource, 2006).
Crandall et al. (2006) describe three critical components of CTA: knowledge
elicitation, data analysis, and knowledge representation. They note, however, that
many knowledge elicitation methods have analytical processes and representational
formats embedded within the method. Such vague distinctions within the process of
CTA make classification and comparisons of methods difficult.
The absence of clear definitions among individual methods also makes
classification difficult. As an example, interviews are commonly used for
knowledge elicitation, because they are easy to conduct. However, the CTA
literature refers to three types of interviews: unstructured, semi-structured, and
structured. Based on actual usage, there is no clear distinction between them. The

24
characteristics and uses of interviews for knowledge elicitation appear to fall along a
continuum of three attributes of (a) formality from "structured" (predetermined,
often closed questions with no follow up questions) to "semi-structured"
predetermined outline of questions and opportunistic follow up questions to
"unstructured" (free flowing, uninterrupted request to the expert to "tell me
everything you know about...."), (b) content ranging from a broad domain to a
specific situation, incident, or task, and (c) knowledge type desired, whether
declarative, procedural, or both. However, the outcomes of some types of structured
interviews, such as those that involve functional diagrams, charts, and the generation
of if-then rules, are more characteristic of knowledge representation. As in this case
with interviews, classifications of the full range of elicitation methods are difficult
and of limited use when they focus solely on descriptive features.
Cooke (1994, 1999), for example, classified knowledge elicitation methods
along one or more dimensions by focusing on the description of the mechanics of the
techniques. One dimension centered on verbal reports and the conditions that
determine their accuracy and completeness. Another dimension Cooke incorporated
characterized elicitation methods as direct or indirect. Direct methods include those
in which knowledge can be verbalized, such as interviews, questionnaires, and
observations. Indirect methods, on the other hand, rely more on knowledge inferred
from other behavior and include methods such as hierarchical clustering and
repertory analysis. Using these underlying dimensions, Cooke (1994) initially
classified knowledge elicitation methods into three families: observation and
25
interviews, process tracing, and conceptual techniques, and subsequently (1999)
divided observations and interviews into separate categories.
Given the different research and development paths CTA methods have taken
within expert systems, human factors, and cognitive science, it is difficult to
consolidate the literature around one methodological theme. To date, the
classification of CTA methods has been largely dependent on the theoretical
approaches taken and the goals and purposes of the classification system (Hoffman
et al., 1995). For example, in expert systems, emphasis is placed on generating
knowledge representations that can be easily formatted for computer systems,
whereas human factors applications call for more ecologically valid methods
appropriate for elicitation in naturalistic settings.
Typically, classification systems focus either on the processes and
mechanisms of knowledge elicitation or on knowledge representations as the product
of analyzing elicited information (Cooke, 1994). A cursory review of classification
schemes from either method clearly indicates that there are many differently labeled
CTA methods that are similar in both their elicitation technique and their
analysis/representation of data. Therefore, current classification systems appear to
have characteristics more associated with typologies, than with true taxonomies.
According to Patton (2002) typologies classify some aspect of the world into parts
along a continuum. In contrast, taxonomies classify items into mutually exclusive
and exhaustive categories.
26
Well-developed and widely accepted taxonomies have conceptual and
theoretical benefits that play a significant role in the development of a domain
(Chulef et al., 2001). They provide a common vocabulary and language among
researchers, which enables studies to utilize shared conceptual meanings.
Taxonomies also afford the integration and systemization of findings and theories in
a domain. When phenomena appear to be related, they can then be studied in the
context of a taxonomy to determine if they are, in fact, related and which
characteristics might be expected of that relationship. Through this facilitation of
comparative analysis, taxonomies enhance the development of theoretical and causal
models within a domain (e.g., the periodic table of elements, Bloom’s taxonomy, the
Linnean system of biological classification, etc.).
Hempel (1965) analyzed the logical and methodological aspects of
classifications and the progress of science as background for the development of the
taxonomy of mental disorders. Hempel defined a classification system as a division
of a set or class of objects into subclasses or members of a given set. Each subclass
is an extension of an underlying concept. Scientific concepts have two functions:
First, they describe things and events within the domain of investigation. They also
enable the establishment of general theories to predict and understand observable
phenomena. As advances are made in a field of study, scientific concepts (a) give
way to the formulation and systemization of principles that refer to unobservable
entities, (b) are expressed in theoretical terms, and (c) explain observable
phenomena. According to Hempel, scientific progress is made when a broader
27
spectrum of observable phenomena in a domain can be explained and predicted by
increasingly generalized covering laws, and, in turn, when this theoretical
development results in a reduction of taxonomic categories.
The issues involved in advancing classification systems toward the
development of theory can be exemplified by the controversy surrounding the
Diagnostic and Statistical Manual of Mental Disorders (DSM; American Psychiatric
Association, 1994). In their critique, Follette and Houts (1996) argue that the DSM
is a flawed classification system, because it neither demonstrates taxonomic progress
nor facilitates the development of theory within the domain of clinical psychiatry.
Although the DSM claims to be atheoretical to promote widespread adoption in the
medical community, it is, in reality, based on a weakly stated medical model easily
deducible from the content. Follette and Houts argue that this claim of
atheoreticality is not only an illusion, but it also impedes the progress of research in
mental disorders. Moreover, as judged by the principles of Hempel (1965), the
history of the DSM does not meet the standards of scientific progress. As evidence,
they offer, one only needs to observe the proliferation of diagnostic categories in
subsequent editions of the DSM.
Follett and Houts (1996) argue that the proliferation of DSM categories
demonstrates that “the taxonomy is not flourishing but foundering, because a system
that merely enumerates symptoms and then syndromes cannot exhibit simplification
by the application of an organizing theory” (p. 1126); as a result, there is no
possibility of collapsing categories. According to the Hempel (1965) model,

28
categories are instances of theoretical generalizations, rather than socially consensual
labels. Thus, the addition of categories represents a slippage in taxonomic stability,
whereas a reduction in categories represents the development of an organizing theory
and scientific progress.
There are strikingly similarities between the developmental history of the
DSM and the challenges CTA researchers face to move current CTA classification
systems toward theoretically driven taxonomies. As the review of the CTA literature
in the previous section illustrates, the number of CTA methods has proliferated
dramatically. Although there are now many different CTA classification schemes, in
contrast to the overarching DSM, these classifications have remained mostly at the
descriptive stage, supported by broad theoretical and methodological approaches to
knowledge elicitation, analysis, and representation. Moreover, research in and
application of CTA methods traverse a variety of domains, mainly within expert
systems, human factors, and training design. Consequently, CTA lacks a common
vocabulary and language making systematic taxonomic research difficult. Thus, it is
unlikely that an organizing theory that facilitates a reduction in categories will
emerge, unless common definitions and measures of probative data for specific goals
of CTA are found.
Cooke’s (1994, 1999) classification system of knowledge elicitation methods
is widely accepted and represents one of the seminal works most frequently cited in
the CTA literature. However, in the context of this discussion, it would appear to
have two limitations. First, the methods classified within the system represent
29
techniques associated not only with knowledge elicitation, but also with data analysis
and knowledge representation. For example, protocol analysis, as defined by
Ericsson and Simon (1993) incorporates both elicitation (primarily think aloud) and
data analysis techniques (coding verbatim statements in specific categories).
Repertory grid (as a matrix of constructs ranked in importance by the informant), as
another example, integrates all three components of CTA: elicitation, analysis, and
knowledge representation methods. In this respect, the three families of methods
Cooke proposed represent a collection of methods according to methodological
similarities, rather than of a well-developed taxonomy in which theoretical
development leads to increasingly generalized covering laws and a reduction of
taxonomic categories, in accordance with Hempelian ideals.
This leads to the second limitation of Cooke’s classification system that
concerns the lack of a central organizing theory. By choosing to focus on the
mechanics or “how” elicitation is conducted as the organization of the classification,
Cooke limits the exploration of relationships between the methods and their
outcomes, or the “why” component that promotes the development of theory.
The point here is not to disparage Cooke’s or any other classification scheme.
These systems have provided a useful means to compare and contrast techniques to
better understand the appropriate conditions and expectations for their results. In
short, current classifications have helped to organize and otherwise make sense out
of the number and diversity of knowledge elicitation, analysis, and representation
methods, as well as providing helpful guidelines for practitioners. The issue in

30
question is whether existing CTA classifications are attenuating or augmenting
scientific progress according to Hempelian ideals. For progress to be made, the
theories underlying current classifications need to be further developed and
articulated. Before this can happen, however, researchers, as previously stated, need
to agree on common definitions, goals, and measures to conduct their research.
Toward that end, it has been noted that the common objective among all CTA
methods is to reveal the knowledge, cognitive processes, and goal structures that
underlie observable behavior (Chipman et al., 2000). Regardless of the application,
the requirements for knowledge outcomes of CTA most often include a model of
expertise for problem solving within a domain. There is an overwhelming body of
empirical research identifying the cognitive properties of expertise that cross a wide
range of domains (see Feldon, in press, for an extensive review). These properties
center on experts’ broad conceptual and strategic knowledge that facilitates the
evaluation of problem states and alternative solutions, combined with automated
procedures for effective and efficient decision-making. Thus, if the common goal
among CTA methods is to capture the cognitive properties of expertise at varying
levels, a potentially productive line of taxonomic research and theory development
should focus on common measures and methods to identify the types and functions
of knowledge that ultimately produce models of expertise. Based on existing
theories of cognition that are well-developed and articulated, a taxonomy of CTA
methods and cognition could possibly achieve the desired reduction in taxonomic

31
categories, while providing clearly explicated guidelines for conducting the CTA
enterprise.
To summarize, there are numerous classifications of CTA methods in
the literature that, for the most part, classify methods based on an methodological or
theoretical approach. However, Cooke (1994) noted that it is not clear that an
orderly relation exists between knowledge elicitation techniques and the type of
knowledge that results. According to Hoffman et al. (1995), a classification scheme
for analyzing and comparing various methods needs to reflect cognitive
functionality, that is, tasks that are good for eliciting tacit knowledge and perceptual
judgments, and tasks that are good for eliciting procedural knowledge.
Knowledge Taxonomies
Declarative and Procedural Knowledge
Anderson (1983; Anderson et al., 2004; Anderson & Lebiere, 1998) made the
distinction between declarative knowledge, which refers to what we know, and
procedural knowledge, which refers to skills we know how to perform. This
distinction became the foundation for his original theory of cognitive architecture
and knowledge called Adaptive Control of Thought (ACT*), and subsequent
iterations, including the most recent ACT-R 5.0. The foundation for this distinction
lies in defining the critical “atomic” components of the system – chunks and
productions. Anderson (1996) claims the following:
32
All that there is to intelligence is the simple accrual and tuning of many small
units of knowledge that in total produce complex cognition. The whole is no
more than the sum of its parts, but it has a lot of parts. (p. 356)
Declarative knowledge. Declarative knowledge consists as a hierarchy of
cognitive units, with each unit comprised of no more than five cognitive elements, or
chunks (Miller, 1956) that encode elements in a particular relationship.2 Cognitive
units are propositions, temporal strings, or spatial images (Anderson, 1983). In the
information processing system, the basic unit of information is the proposition (E. D.
Gagné, 1985), and corresponds basically to an idea containing two elements: a
relation and a set of arguments. The arguments are the subject of the proposition and
normally consist of nouns and pronouns; the relation of a proposition is a verb,
adjective, or adverb that constrains the relationship. Thus, in the example, “John is a
graduate student,” John is unconstrained (There are many things we can know about
John); graduate student is unconstrained (There are many things we can know about
graduate students); however, with the addition of “is” the proposition is constrained
to only one meaning about John being a graduate student. Declarative knowledge,
then, corresponds to things we are aware we know and can usually describe to others
(Anderson & Lebiere, 1998).
Other cognitive psychologists have defined declarative knowledge in a
variety of ways. For example, Ormrod (2004) describes declarative knowledge
acquired through textbooks and teachers, experience and about the world around us,
and how things were or are. Schunk (2000) states that declarative knowledge refers
2 Cowan (2000) argues that working memory is limited to three (plus or minus one) cognitive
elements.
33
to “knowing that,” or facts, subjective beliefs, scripts (events), and organized
passages. Finally, declarative knowledge is factual knowledge; it is “knowing what”
(Bruning, Schraw, Norby, & Ronning, 2004).
Procedural knowledge. Procedural knowledge consists of condition-action
(IF-THEN) pairs called productions which are activated according to rules relating to
a goal structure (Anderson, 1983). Within the ACT framework, all knowledge is
initially declarative and is interpreted by general procedures. Productions, then,
connect declarative knowledge with behavior. Procedural knowledge represents
“how to do things.” It is knowledge that is displayed in our behavior, but that we do
not hold consciously (Anderson & Lebiere, 1998).
As a task is performed, interpretive applications are gradually replaced with
productions that perform the task directly, a process called proceduralization. For
example, rehearsing how to manually shift gears in a car is gradually replaced by a
production that recognizes and executes the production. In other words, explicit
declarative knowledge is replaced by direct application of procedural knowledge
(Anderson, 2005). Sequences of productions may be combined into a single
production, a process called composition. Together, proceduralization and
composition are called knowledge compilation, which creates task-specific
productions during practice. The process of proceduralization affects working
memory by reducing the load resulting from information being retrieved from long-
term memory.

34
Gagné (1985) makes two distinctions between declarative knowledge and
procedural knowledge. Although declarative knowledge varies tremendously in
topic and scope, it is relatively static, whereas procedural knowledge is dynamic.
Procedural knowledge is transformational, in that the output is quite different than
the input. Second, the activation of declarative knowledge is slower and more
conscious, whereas the activation of procedural knowledge increases with practice,
until it becomes fast and automatic.
Component Display Theory
Merrill (1983; 1994) defined Component Display Theory (CDT) as a set of
prescriptive relationships that can be used to guide the design and development of
learning activities. According to CDT, the degree to which these relationships are
included is directly correlated to the achievement of the learning objectives.
Objectives are categorized using a two-dimensional classification system, with
performance as one dimension and content type as the other dimension. CDT is
strongly influenced by Gagné’s (1965) conditions of learning which describes the
conditions necessary for the acquisition of specific outcome categories. Both CDT
and Gagné’s conditions of learning assume that different categories of outcomes
require a different means of promoting and assessing achievement of the outcome.
However, CDT extends Gagné one-dimensional classification to a two-dimensional
performance-content matrix. For the purposes of this study, the performance-content
matrix of knowledge types and uses is further described, as it will be used to classify
35
CTA methods. The instructional design component of CDT is excluded from the
study and therefore, is not considered.
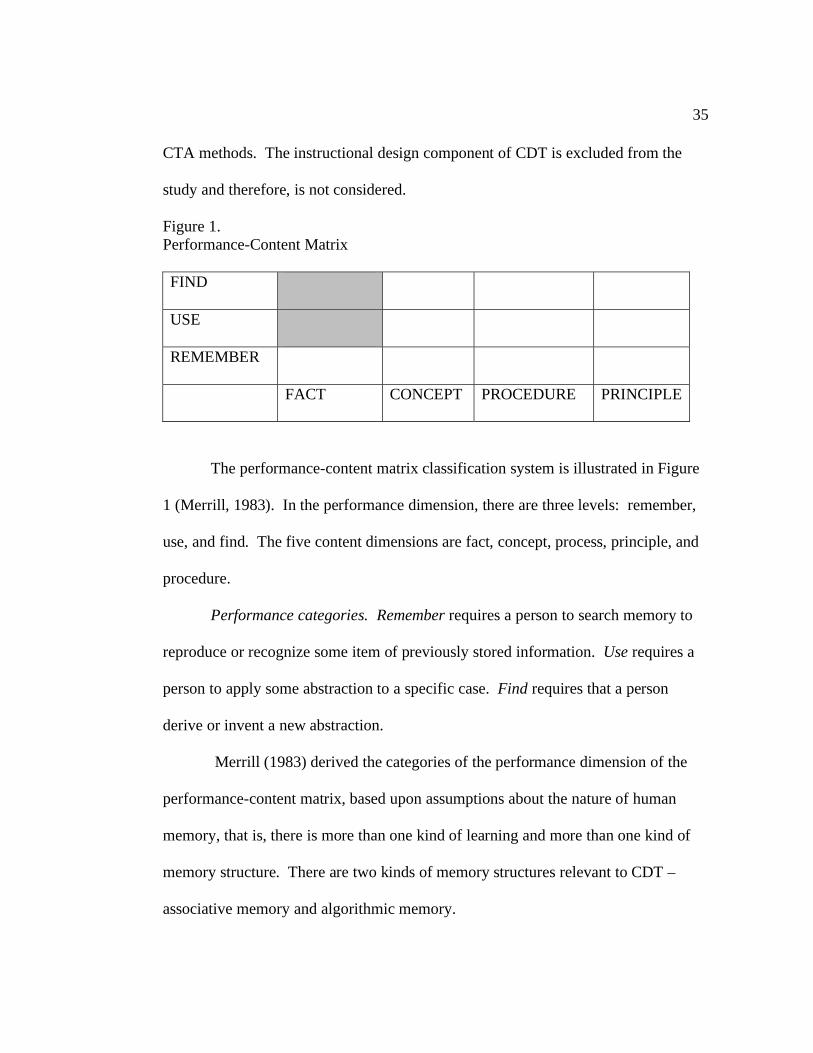
Figure 1.
Performance-Content Matrix
FIND
USE
REMEMBER
FACT CONCEPT PROCEDURE PRINCIPLE
The performance-content matrix classification system is illustrated in Figure
1 (Merrill, 1983). In the performance dimension, there are three levels: remember,
use, and find. The five content dimensions are fact, concept, process, principle, and
procedure.
Performance categories. Remember requires a person to search memory to
reproduce or recognize some item of previously stored information. Use requires a
person to apply some abstraction to a specific case. Find requires that a person
derive or invent a new abstraction.
Merrill (1983) derived the categories of the performance dimension of the
performance-content matrix, based upon assumptions about the nature of human
memory, that is, there is more than one kind of learning and more than one kind of
memory structure. There are two kinds of memory structures relevant to CDT –
associative memory and algorithmic memory.
36
Associative memory consists of a hierarchical network structure, which is
accessed for information storage and retrieval. Associative memory is used in
knowledge stating. According to CDT, when a person stores information in
associative memory and then retrieves it in the same form, there is minimal structural
change. In recalling the information, then, there should be no error, as no derivative
or thought processes are involved. In CDT, the performance of literal storing and
retrieving information is called remember-verbatim. Associative memory is also
used when information is integrated and stored with other information in memory.
However, recall of this information may lead to error, as other non-relevant
information may be retrieved along with the target information. In CDT, the
performance level for the integration of information into associative memory is
called remember-paraphrase. Although Merrill combines both forms of associative
memory performance under the level remember, the distinction between verbatim
and paraphrase may become important in this study to distinguish between CTA
methods that are intended to elicit one or the other of these knowledge uses.
Algorithmic memory is involved when information, in the form of processing
strategies or schemas, is modified, as it is integrated and stored with existing
processing structures. Merrill (1983) distinguishes between two ways that
information can be incorporated in algorithmic memory. The first is called
integration, which occurs when schema is retrieved to accommodate the new
information. When a possible schema is identified, an attempt is made to instantiate
the variables of the schemas. When information is retrieved, it is the product of the

37
integration. This is an active process that often takes some time and is prone to
error. Although a person may have a correct schema, there may be error in
recognizing an instance of that schema. Or, in the case of a procedure, a correct
knowledge schema may not guarantee the correct application of that schema. In
CDT, integrative processing is called use and refers to a general rule to process
specific information, whether concepts, principles, or procedures.
Merrill (1983) describes a second way to use algorithmic memory by
reorganizing information. Reorganization is an inductive process of examining
phenomena and creating new schema internally, rather than reacting to external
stimuli. This type of processing is called find, which refers to finding new
generalities or higher-level processes. Merrill characterizes find as an iterative
process involving trial and error, that is, creating and testing schemas, often resulting
in following wrong paths. In CDT, find has similar applications, as does use. For
example, concept use involves identifying an instance of the concept, whereas
finding a concept requires that a person choose a beginning schema to make the first,
albeit possibly incorrect or incomplete, classification. As such, for the purposes of
classifying CTA methods by use, the find performance level is subsumed into the use
level.
Content categories. Facts are described as arbitrarily associated pieces of
information, such as names, dates, and events. Concepts are objects, events, or
symbols that share common attributes and that are identified by the same name.
Process is a series of events (Merrill, 1994). Principles are cause and effect or

38
correlational relationships that are used to interpret events or circumstances.
Procedures are an ordered sequence of steps necessary to accomplish a goal, solve a
problem, or produce a product.
Merrill (1983) suggested that the content categories are based on an
assumption that humans impose an organization on their world by classifying things
by subject matter. Concepts, then, are formed when things are grouped together into
classes that share common attributes. Subject matter emerges when a relationship
between two or more concepts is discovered.
Reigeluth (1983) describes several distinguishing features of CDT over
previous taxonomies. First, CDT is highly integrative, in that it builds on well-
researched components and models developed by other researchers and theorists.
Second, CDT classifies objectives on two dimensions, by the type of content and the
desired level of performance, and thus, builds on and extends Gagné’s (1965) one-
dimensional classification. Finally, Reigeluth states that CDT has an extensive base
of empirical support, in both formal research and real-world field-testing.
During the last decade, conceptions of Merrill’s (1983) system have been
adjusted to further distinguish nature and function of declarative and procedural
knowledge (R. Clark, personal communication, July 24, 2006). The adjustment
centers on the question: How do you apply a concept, process, or principle, other
than with a procedure? In adapting Merrill’s system to accommodate this question,
knowledge types are associated with two activities: remember/say and use/apply.
For example, a person is able to recall and say concepts, processes, principles, and

39
procedures. However, when applied as procedures, concepts are used to classify,
processes to debug or troubleshoot, principles to create a new instance of something,
and procedures to perform the steps in a task. Figure 2 summarizes the two uses of
the four knowledge types within this cognitive framework.
Figure 2.
Knowledge Types and Activities
Type Remember/Say Use/Apply
Concept Define an object, event, or
symbol
Classify objects,
events, or symbols
Process Describe the stages Troubleshoot a system
Principle Identify cause and effect Create a new instance
Procedure List steps Perform steps
In sum, declarative and procedural knowledge work together to solve
problems. As declarative knowledge is applied to task performance, it becomes
procedural. The nature of procedural knowledge is that it becomes automated and
unconscious. Merrill’s CDT is a method to classify knowledge according to type
and application, and, as such, provides guidance for the elicitation of knowledge,
thought processes, and goal structures that underlie observable task performance.

40
CHAPTER 2: METHOD
The research questions posed in this study represent a multi-dimensional
review of the existing research to explore interactions between CTA activities,
knowledge types, and knowledge applications. As such, this study represents the
first step in an ongoing series of studies to establish generalized causal inference
among the variables. Shadish, Cook, and Campbell (2002) suggest that generalized
causal inference is established through two tasks: (a) identifying construct labels for
persons, settings, treatments, and outcomes, and (b) exploring the extent to which a
causal relationship generalizes over variations in persons, settings, treatments, and
outcomes. Generalizable studies, they posit, result from scientists applying five
principles:
1. Assess surface similarity between study operations and target
generalization.
2. Rule out irrelevancies that do not change a generalization.
3. Make discriminations that limit generalizations.
4. Interpolate within samples and extrapolate beyond samples
5. Develop and test causal theories about the target of generalization.
Although no one principle, alone, is sufficient, knowledge of generalized causal
inference is not complete unless all five components are addressed.
“Qualitative methods provide an important avenue for discovering and
exploring causal explanations” (Shadish et al., 2002, p. 389). In the form of
descriptive reviews, qualitative methods are useful to find clues about generalized

41
causal factors and potential moderators of intervention effects, and are common as an
initial phase of a strategy to conduct increasingly generalizable studies. The strength
of descriptive review lies in its ability to generate hypotheses, provide dense
accounts of the literature, and develop theories with qualitative categories and
relationships among the variables. The disadvantages are the difficulty of tracking
these relationships and analyzing the complexity of the moderators and outcomes, as
the number of studies under examination increases.
In this study, the five research questions provided the framework for
determining the methods for data collection. Figure 3 shows an overview of the
process. A search of the literature provided the initial sample of studies. The CTA
methods in the sample were classified by name and type (elicitation,
analysis/representation, or both) and ranked by frequency. A sample representing
the most frequently cited CTA methods was selected and the studies in this sample
were reviewed further to identify and classify all CTA methods reported within each
study. Statistical analysis was then used to find the most frequent pairings of CTA
methods. Studies in which these pairings occurred were then examined to identify
and classify the results as to the type and subtypes of knowledge outcomes. The
studies were also reviewed to categorize how the results were applied, and whether
statements pertaining to methods sensitive to eliciting automated knowledge were
included. A detailed description of the methods to collect data for each research
question is provided in the sections that follow.

42
Figure 3.
Study Sample Methodology
Research Question 1:
What are the most frequently used pairings of knowledge elicitation and
analysis/representation methods found in the CTA literature?
As shown in Figure 3 and in the previous overview, an iterative process was
used to supply the data for this question. In this section, the operational definitions
for CTA methods and CTA method pairings used in the study are provided. The
classification scheme and method for classifying the CTA methods identified in the
literature search is described next, followed by a detailed description of the two-stage
process to determine the most frequent CTA method pairs.
Literature Search
Most Frequent CTA Methods
Most Frequent CTA
Method Pairs

43
Operational Definitions
CTA is often referred to as a “toolkit,” a term that reflects the number and
variety of methods available to the practitioner. Included in this toolkit are
techniques that elicit knowledge, facilitate data analysis, and those that represent the
content and structure of knowledge. This present study requires that these terms be
clearly defined.
CTA methods. Crandall et al. (2006) describe CTA as encompassing three
sets of activities: knowledge elicitation, data analysis, and knowledge representation.
Knowledge elicitation methods are defined as those used to collect information about
“what people know and how they know it: the judgments, strategies, knowledge,
and skills that underlie performance” (p. 10). Data analysis is “the process of
structuring data, identifying findings, and discovering meaning. Knowledge
representation includes the critical tasks of displaying data, presenting findings, and
communicating meaning” (p. 21). Although data analysis and knowledge
representation are two distinct aspects of CTA, they are often linked with elicitation
methods (e.g. concept maps, repertory grid). Furthermore, analysis and
representation tools often share common characteristics, so that they are frequently
combined into a single category in classification schemes. Therefore, as an
operational definition for this study, CTA methods refer to individual knowledge
elicitation methods and individual analysis/representation methods.
CTA method pairings. In practice, many CTA studies incorporate multiple
elicitation and analysis/representation methods, as often recommended in the

44
literature. However, components of both knowledge elicitation and
analysis/representation must be present for a successful CTA study (Crandall et al.,
2006). For the purposes of this study, then, the operational definition of CTA
method pairings refers to a pairing of an individual elicitation method with an
individual analysis/representation method.
Classification Scheme
The CTA Methods Summary Table based on Cooke’s (1994) extensive
review can be found at the CTA Resource (2006) Web site and is attached as
Appendix A. This table describes over 100 methods and classifies the methods as
elicitation (E), analysis/representation (A), or both elicitation and
analysis/representation (E & A). The methods listed in the CTA Methods Summary
Table were adapted and used as the primary resource for classifying the publications
in this study. When knowledge elicitation and analysis/representation methods not
listed in CTA Methods Summary were encountered during the classification process,
they were added. Table 2 contains a list of the methods and their corresponding
classifications that were added to the classification scheme in this study.
Table 2.
Additional CTA Methods for the Classification of Studies
Name and Description Elicitation Analysis/
Representation
Document Analysis - The analyst seeks out
information from texts based on a priori types
of information. E A

45
Table 2, Continued
Card Sorting – The analyst has the informant
sort cards containing information into different
categories. In studies, where a specific card
sorting techniques is not specified, the generic
Card Sort was used as a classification.
E A
Concept Map – The analyst has the informant
write information as a graph of nodes and the
relations that connect them.
E A
Structured Interview – The analyst asks the
informant pre-determined questions requiring
closed responses.
E
Semi-structured Interview – The analyst uses an
outline of questions to ask the informant
leaving opportunity for follow up and branching
questions.
E
The coding form, attached as Appendix B, was developed to record the classification
of the studies, according to CTA method, knowledge types and subtypes, sensitivity
to automated knowledge, and application of the final results.
Two-Stage Process To Determine The Most Frequent CTA Method Pairings
The selection of the study sample was an iterative process of first “casting a
wide net,” and then applying increasingly constraining selection criteria. The
process consisted of the two stages. In the first stage, a literature search was
conducted and abstracts of studies meeting the search criteria were collected. The
abstracts were reviewed for inclusion or exclusion from the sample, based on pre-
established criteria. CTA methods cited in the abstracts of the included studies were
recorded and ranked by frequency. In the second stage, based on availability, the

46
complete text of each study in the “most frequent” sample was reviewed, and all
CTA methods used in the study were classified. In addition, the studies were coded
as to knowledge types represented in the results, and whether the study addressed
issues relating to automated knowledge. Based on analysis of the collected data, the
most frequent pairings of CTA methods were identified as the final study sample.
The method and results for each stage are described in the next section.
Stage One. Using keywords “knowledge elicitation” and “cognitive task
analysis,” a search was conducted in seven publication databases: ArticleFirst,
Engineering Village (INSPEC/Compendex), ERIC, IEEE, ISI Web of Science,
PsycINFO, and Elsevier ScienceDirect. Knowledge elicitation was included as a
keyword, because it is a term generally associated with the knowledge acquisition
process, appears early in the literature, and, in the early literature, refers to both
observable behaviors and cognitive processes. No constraints were placed on the
date of publication in the search criteria, which provided an additional advantage for
using both terms as keywords. The search returned a total of 1065 studies after
duplicate studies were removed. The number of unduplicated studies in the search
results for each database is listed in Table 3.
Table 3.
Studies in Phase One
Database Search Results Excluded Remaining
ArticleFirst 34 8 26 Engineering Village
(INSPEC/Compendex) 728 181 547
ERIC 31 27 4
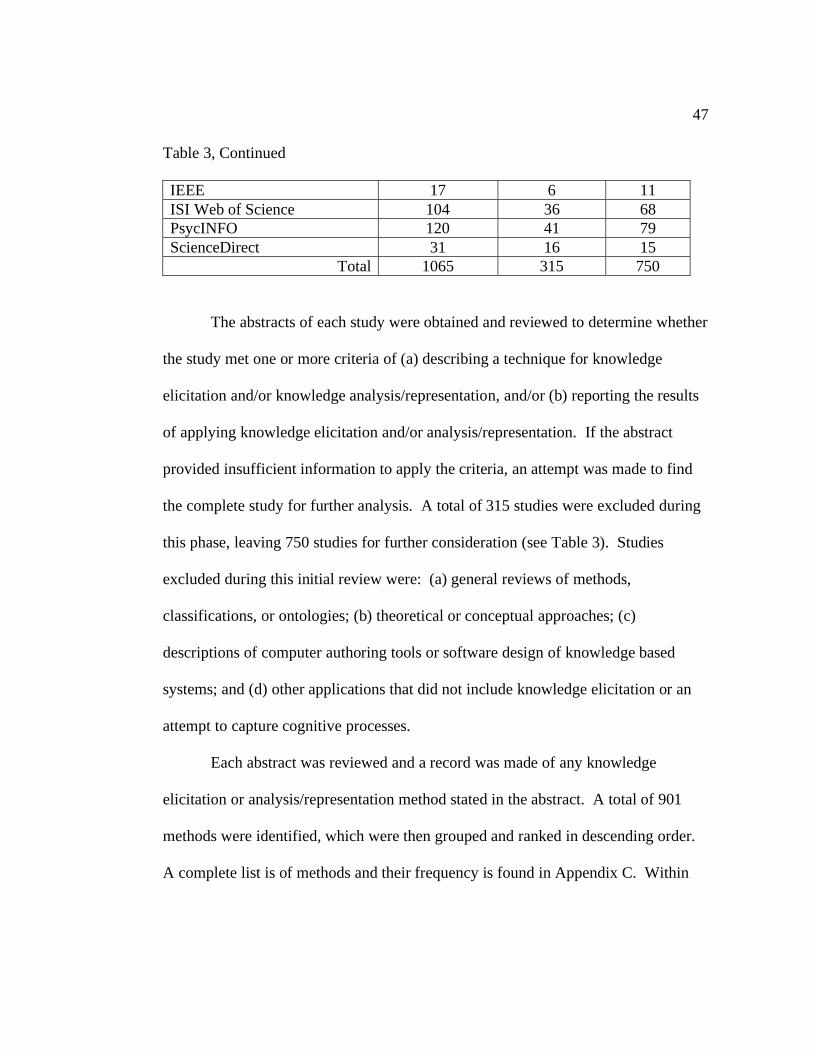
47
Table 3, Continued
IEEE 17 6 11 ISI Web of Science 104 36 68 PsycINFO 120 41 79 ScienceDirect 31 16 15
Total 1065 315 750
The abstracts of each study were obtained and reviewed to determine whether
the study met one or more criteria of (a) describing a technique for knowledge
elicitation and/or knowledge analysis/representation, and/or (b) reporting the results
of applying knowledge elicitation and/or analysis/representation. If the abstract
provided insufficient information to apply the criteria, an attempt was made to find
the complete study for further analysis. A total of 315 studies were excluded during
this phase, leaving 750 studies for further consideration (see Table 3). Studies
excluded during this initial review were: (a) general reviews of methods,
classifications, or ontologies; (b) theoretical or conceptual approaches; (c)
descriptions of computer authoring tools or software design of knowledge based
systems; and (d) other applications that did not include knowledge elicitation or an
attempt to capture cognitive processes.
Each abstract was reviewed and a record was made of any knowledge
elicitation or analysis/representation method stated in the abstract. A total of 901
methods were identified, which were then grouped and ranked in descending order.
A complete list is of methods and their frequency is found in Appendix C. Within

48
the ranked frequency groups, the eleven methods listed in Table 4 represented
approximately 60% of the 901 methods identified in the abstracts.
Table 4.
Most Frequently Cited Methods
Method Number Percentage
Structured Interview 135 14.98
Concept Map 79 8.77
Verbal Think-aloud 65 7.21
Process Tracing 54 5.99
Repertory Grid/laddered grid 50 5.55
Observation 33 3.66
Hierarchical analysis 28 3.11
Card Sorting 27 3.00
Document analysis 26 2.89
CDM/CIM 25 2.77
Unstructured Interview 24 2.66
Stage Two. An attempt was made to locate each study that utilized the
methods listed in Table 4. A total of 154 studies were located and reviewed to
classify all the knowledge elicitation and analysis/representation methods utilized in
each study, according to the CTA Methods Summary Table (Appendix A)
supplemented by the methods in Table 2. Statistical analysis was then applied to
determine the CTA method pairings represented within the study sample. The CTA
method pairings were ranked by frequency, and those that were clustered within the
highest frequency were selected. The studies that utilized the most frequent CTA
method pairings were identified as the final study sample, and included 154 studies.

49
Research Question 2:
To what extent do the most frequent CTA method pairings of knowledge elicitation
and analysis/representation methods match with formal CTA methods found in the
literature?
The most frequent CTA method pairings were examined and categorized as
either formal or informal based on Cooke’s (1994, 1999) general description of the
three families of CTA methods. The mechanisms of formal CTA methods are well
specified, standardized, and intended to be applied systematically. In contrast,
informal techniques are less structured and more adaptable to meet the constraints of
the task and domain. As an example, observations and interviews are less formal in
structure and specificity than protocol analysis and conceptual methods, such as
repertory grid and card sorting. CTA method pairings were considered formal, when
a formal elicitation method was paired with a formal analysis/representation method,
for example, the pairing of protocol analysis – protocol analysis, or card sort – card
sort. Conversely, an example of an informal paring would that of semi-structured
interview with diagram drawing.
Research Question 3:
What knowledge types are associated with the most frequent CTA method pairings of
knowledge elicitation and analysis/representation methods? How consistent are the
associations?

50
Each study in the final study sample was reviewed to identify the types of
knowledge outcomes that resulted from the application of CTA methods. The
criteria for classifying the outcomes of the 154 studies identified in Stage Two of the
study sample selection process are described next.
Declarative and procedural knowledge. The results identified in each study
were classified as declarative knowledge and procedural knowledge and recorded on
the coding form. For the purposes of this study, declarative knowledge was defined
as knowledge about some thing, event, or symbol, commonly described as “knowing
that.” Procedural knowledge was defined as knowledge about how to do something
(to use or apply), or an ordered sequence of steps necessary to accomplish a goal,
solve a problem, or produce a product, commonly described as “knowing how,” and
often represented as “If-THEN” statements.
Declarative knowledge subtypes. When sufficient data was available in the
studies, the results were further classified according to knowledge subtypes
according to pre-determined definitions. For declarative knowledge subtypes,
concepts were defined as objects, events, or symbols that shared common attributes
and that were identified by the same name. Processes were defined as a sequence of
stages that describe how something works or a series of events. Principles were
defined as cause and effect or correlational relationships that are used to create a new
instance or interpretation of events or circumstances.
Procedural knowledge subtypes. When sufficient information was available,
the results were also classified as to procedural subtypes. Classify procedures were
51
defined as the grouping of things, events, or symbols according to attributes.
Change procedures were associated with an ordered sequence of steps necessary to
accomplish a goal, solve a problem, or produce a product.
Research Question 4:
To what extent do studies containing the most frequent CTA method pairings include
a statement that the methods incorporate activities addressing automated, tacit, or
implicit knowledge?
For each publication, an analysis was made as to whether the methods used
were sensitive to eliciting automated knowledge. To be classified as sensitive to
automated knowledge, the method must have met at least one of the following
criteria: (a) recommended or used method(s) with more than one subject matter
expert; (b) called for an iterative approach, in which the subject matter expert had the
opportunity to correct and supplement previous results; or (c) recommended or used
multiple methods.
Research Question 5:
How can the applications of the most frequent CTA method pairings be categorized?
The final application of the CTA outcomes in each study was identified and
recorded. The criteria outline by Patton (2002) of internal homogeneity, or the
extent that data can be grouped meaningfully, and external heterogeneity, or the

52
extent to which differences among categories are bold and clear (p. 465), were
applied to determine the final categories.

53
CHAPTER 3: RESULTS
Co-coding and Inter-coder Reliability
A random sample of approximately 17% of the publications (26 publications)
was selected from the 154 studies in the sample. A doctoral student in education
with knowledge and experience in knowledge types and CTA methods
independently coded the random sample with respect to CTA methods, knowledge
types and subtypes, and sensitivity to automated knowledge. The CTA Methods
Summary Table, supplemented by Table 2, and a Coding Guide was provided to the
co-coder. Upon completion of the co-coding, a meeting was held to discuss the
discrepancies.
Co-coding of CTA methods resulted in an inter-coder reliability of 68%.
Co-coding for declarative knowledge resulted in an inter-coder reliability of 88%,
and for procedural knowledge a reliability of 94%. Reliabilities for declarative
knowledge subtypes were 86% for concepts, 70% for processes, and 33% for
principles. Reliabilities for procedural knowledge subtypes were 71% for classify
and 45% for change procedures. Coding for sensitivity to automated knowledge
resulted in an inter-coder reliability of 92%.
Results for Coding of CTA Methods
The review and coding of each of the 154 studies identified in Stage Two of
the study sample selection yielded the knowledge elicitation and
analysis/representation methods and frequencies listed in Table 5.

54
Table 5.
Frequency of Individual Methods
Method Type Frequency
20 Questions E 2
Card Sort E & A 13
Clustering Routines A 8
COGNET A 2
Cognitive Function Model E & A 2
Cognitive Task Analysis E 22
Cognitive Work Analysis A 1
Comparing Two or More Representations A 1
Concept Listing E 5
Concept Map E & A 20
Conceptual Graph Analysis A 8
Content Analysis A 37
Correlation/covariance A 3
Critical Decision E 9
Critical retrospective E 2
Design Storyboarding E 1
Diagram Drawing A 47
Document Analysis E & A 32
Eliciting Estimations of Probability E 1
Event Co-occurrence E 1
Event Trees A 1
Failure Models and Effects Analysis A 1
Fault Trees A 2
Field Observations/Ethnography E 13
Focused Observation E 9
Free association E & A 1
Functional Abstraction Hierarchy A 2
GOMS A 1
Graph Construction E & A 4
Grounded Theory A 5
Group Discussion E 2
Group Interview E 17
Hierarchical Sort A 3
Hierarchical Task Analysis A 11
Identifying Aspects of the Representation E & A 7
Influence Diagrams A 3
Information Flow Analysis A 9
Interaction Analysis A 1

55
Table 5, Continued
Interruption Analysis E 3
Job Analysis A 1
Laddering E & A 6
Likert Scale Items E 8
Multidimensional Card Sorting E & A 4
Multidimensional Scaling E & A 5
Network Scaling A 4
Nonverbal Reports E 2
Operational Sequence Analysis A 2
Operator Function Model E & A 1
Paired Comparison E & A 4
PARI E 1
Process Tracing/Protocol Analysis E & A 44
Q Sort E 2
Questionnaires E 9
Repeated Sort E & A 2
Repertory Grid E &A 18
Retrospective/Aided Recall E 14
Semi-structured Interview E 45
Simulators/Mockups E 7
SOAR A 1
Statistical Modeling/Policy Capturing A 12
Strategies Analysis A 3
Structural Analysis Techniques A 6
Structured Interview E 24
Structured Observation E 1
Table-top Analysis E 1
Task analysis E 1
Teach-back E 2
Think-aloud E 33
Timeline Analysis A 1
Triad Comparison E 1
Unstructured Interview E 13
Work Domain Analysis A 1
Workflow Model A 4
E = Knowledge Elicitation A = Analysis/Representation

56
Analysis for CTA Method Pairings
Crosstabulation analysis of the methods identified in Table 5 resulted in 1010
coded pairings of elicitation and analysis/representation methods identified in the
154 publications. The summary list of CTA method pairing frequency results and
the complete results of the Crosstabulation analysis is found in Appendix D and E
respectively. Figure 4 represents the frequency distribution of the CTA method
pairings, and shows a cluster of high frequency of CTA method pairings.
Figure 4.
Frequency of CTA Method Pairings
A review of the frequency distribution data revealed that 276 (27%) CTA
method pairings were clustered around 15 elicitation and analysis/representation
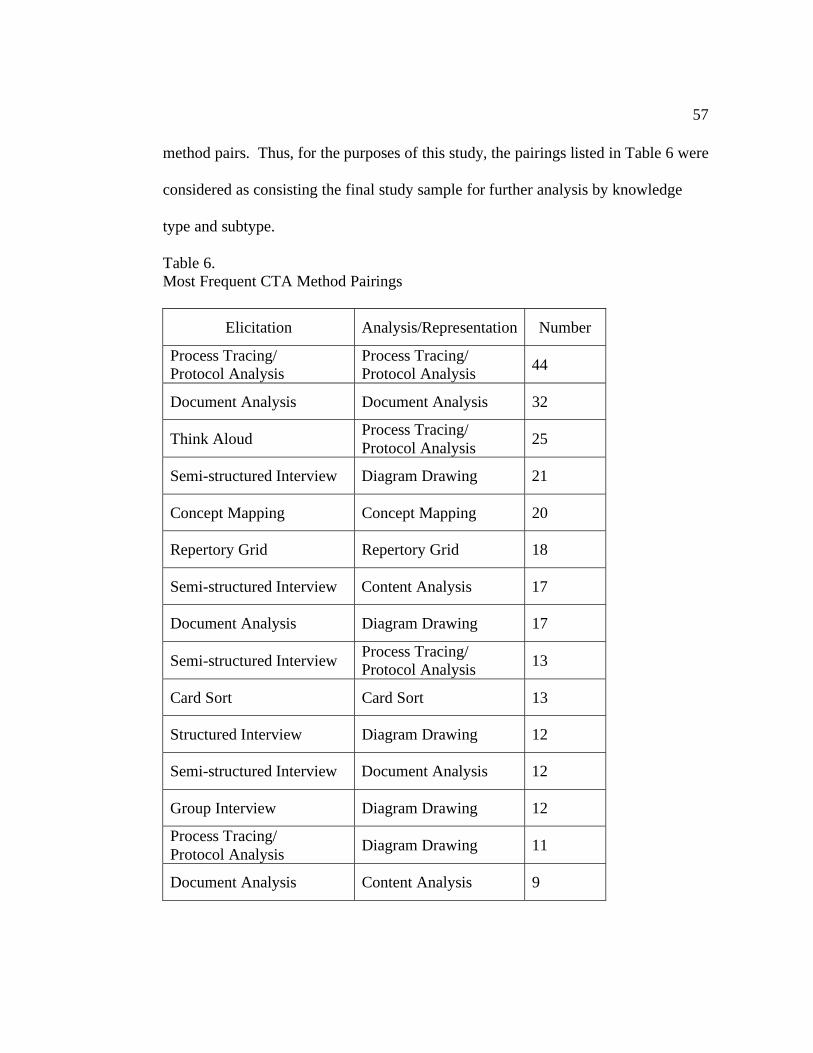
57
method pairs. Thus, for the purposes of this study, the pairings listed in Table 6 were
considered as consisting the final study sample for further analysis by knowledge
type and subtype.
Table 6.
Most Frequent CTA Method Pairings
Elicitation Analysis/Representation Number
Process Tracing/
Protocol Analysis
Process Tracing/
Protocol Analysis 44
Document Analysis Document Analysis 32
Think Aloud Process Tracing/
Protocol Analysis 25
Semi-structured Interview Diagram Drawing 21
Concept Mapping Concept Mapping 20
Repertory Grid Repertory Grid 18
Semi-structured Interview Content Analysis 17
Document Analysis Diagram Drawing 17
Semi-structured Interview Process Tracing/
Protocol Analysis 13
Card Sort Card Sort 13
Structured Interview Diagram Drawing 12
Semi-structured Interview Document Analysis 12
Group Interview Diagram Drawing 12
Process Tracing/
Protocol Analysis Diagram Drawing 11
Document Analysis Content Analysis 9

58
Results of Matching CTA Method Pairings with Formal Methods
Applying the criteria set forth previously to match CTA method pairings with
formal CTA methods to the results in Table 6, resulted in the identification of four
formal methods: (a) Process Tracing/Protocol Analysis, (b) Concept Mapping, (c)
Repertory Grid, and (d) Card Sort.
Analysis for Declarative and Procedural Knowledge Types
Crosstabulation analysis of the 276 method pairings in Table 6 with the
coding results for declarative and procedural knowledge resulted in 89 (32.25%)
associations with declarative knowledge, 17 (6.16%) with procedural knowledge,
and 170 (61.59%) associations with both declarative and procedural knowledge.
Table 7 lists the number of associations among declarative and procedural
knowledge types and CTA method pairs.
Table 7.
Method Pairings by Declarative and Procedural Knowledge
Elicitation Analysis/
Representation Decl Proc
Decl &
Proc.
Process Tracing/
Protocol Analysis
Process Tracing/
Protocol Analysis 7 3 34
Document Analysis Document Analysis 14 2 16
Think Aloud Process Tracing/
Protocol Analysis 2 2 21
Semi-structured
Interview Diagram Drawing 4 2 15
Concept Mapping Concept Mapping 14 0 6
Repertory Grid Repertory Grid 7 2 9

59
Table 7, Continued
Semi-structured
Interview Content Analysis 6 1 10
Document Analysis Diagram Drawing 5 1 11
Semi-structured
Interview
Process Tracing/
Protocol Analysis 2 1 10
Card Sort Card Sort 7 1 5
Structured
Interview Diagram Drawing 8 0 4
Semi-structured
Interview Document Analysis 2 1 9
Group Interview Diagram Drawing 5 0 7
Process Tracing/
Protocol Analysis Diagram Drawing 3 0 8
Document Analysis Content Analysis 3 1 5
Decl = Declarative Proc = Procedural
Analysis for Declarative and Procedural Knowledge Subtypes
For each CTA method pairing in Table 6, the results of frequency counts for
declarative knowledge subtypes (concept, process, principle) and procedural
subtypes (classify, change) are listed in Table 8.
Table 8.
CTA Method Pairings by Knowledge Subtypes
Elicitation Analysis/
Representation Con Pro Prin Class Chan
Process Tracing/
Protocol Analysis
Process Tracing/
Protocol Analysis 35 20 4 16 14
Document
Analysis
Document
Analysis 24 15 1 9 10

60
Table 8, Continued
Think Aloud Process Tracing/
Protocol Analysis 19 11 3 10 7
Semi-structured
Interview Diagram Drawing 18 12 1 6 5
Concept Mapping Concept Mapping 18 5 1 0 1
Repertory Grid Repertory Grid 13 3 1 6 2
Semi-structured
Interview Content Analysis 14 6 1 3 3
Document
Analysis Diagram Drawing 14 10 1 6 7
Semi-structured
Interview
Process Tracing/
Protocol Analysis 10 7 2 5 5
Card Sort Card Sort 8 2 0 2 1
Structured
Interview Diagram Drawing 11 8 0 1 0
Semi-structured
Interview
Document
Analysis 7 7 0 6 5
Group Interview Diagram Drawing 9 7 1 1 0
Process Tracing/
Protocol Analysis Diagram Drawing 11 7 2 3 4
Document
Analysis Content Analysis 7 3 1 3 3
Con = Concept; Pro = Process; Prin = Principle; Class = Classify; Chan = Change
Results for Sensitivity to Automated Knowledge
Table 9 lists the CTA method pairings in Table 6, and the results for applying
the criteria for sensitivity to eliciting automated knowledge to the studies from which
the CTA method pairings were derived.

61
Table 9.
Method Pairings associated with Automated Knowledge
Sensitive to
Automated Knowledge Elicitation
Analysis/
Representation Number
Yes No
Process Tracing/
Protocol Analysis
Process Tracing/
Protocol Analysis 44 40 4
Document
Analysis
Document
Analysis 32 27 5
Think Aloud Process Tracing/
Protocol Analysis 25 22 3
Semi-structured
Interview Diagram Drawing 21 19 2
Concept Mapping Concept Mapping 20 18 2
Repertory Grid Repertory Grid 18 14 4
Semi-structured
Interview Content Analysis 17 15 2
Document
Analysis Diagram Drawing 17 14 3
Semi-structured
Interview
Process Tracing/
Protocol Analysis 13 12 1
Card Sort Card Sort 13 11 2
Structured
Interview Diagram Drawing 12 12 0
Semi-structured
Interview
Document
Analysis 12 11 1
Group Interview Diagram Drawing 12 12 0
Process Tracing/
Protocol Analysis Diagram Drawing 11 9 2
Document
Analysis Content Analysis 9 7 2

62
Results for the Classification of Method Pairings by Application
The 154 studies from which the CTA method pairings in Table 6 were
derived were classified according to the application of the results. Four application
categories emerged: (a) human factors (23, 14.94%), (b) expert systems (75,
48.70%), (c) theoretical and experimental (30, 19.48%), and (d) instructional design
and training (26, 16.88%). The number of studies that were classified in each
application category for the most frequent CTA method pairings is listed in Table 10.
Table 10.
Classification of CTA Method Pairings by Application
Elicitation Analysis/
Representation HF ES T/E ID/T
Process Tracing/
Protocol Analysis
Process Tracing/
Protocol Analysis 1 17 11 17
Document
Analysis
Document
Analysis 4 20 5 3
Think Aloud Process Tracing/
Protocol Analysis 0 11 7 7
Semi-structured
Interview Diagram Drawing 2 14 2 3
Concept Mapping Concept Mapping 4 7 4 5
Repertory Grid Repertory Grid 2 10 5 1
Semi-structured
Interview Content Analysis 1 7 5 4
Document
Analysis Diagram Drawing 2 12 1 2
Semi-structured
Interview
Process Tracing/
Protocol Analysis 1 4 3 5
Card Sort Card Sort 3 7 2 1
Structured
Interview Diagram Drawing 4 7 1 0
Semi-structured
Interview
Document
Analysis 1 8 2 1

63
Table 10, Continued
Group Interview Diagram Drawing 5 7 0 0
Process Tracing/
Protocol Analysis Diagram Drawing 1 7 1 2
Document
Analysis Content Analysis 0 5 2 2
HF = Human Factors; ES = Expert Systems; T/E = Theoretical Experimental;
ID/T = Instructional Design & Training
The four application categories derived in the previous analysis were further
analyzed to identify the knowledge type classifications associated with each
category. The results of this analysis are listed in Table 11 and provided additional
data to examine the interactions among the CTA applications, knowledge outcomes,
and methods. The results show, for example, that the proportion of declarative
knowledge to procedural knowledge outcomes is about 55% for both expert systems
and ID/training, whereas the proportion in human factors and theoretical
experimental are 79% and 67%, respectively.
Table 11.
Knowledge Types Associated with CTA Applications
HF ES T/E ID/T
Declarative 22 62 29 24
Concept 16 51 22 23 Process 8 23 10 14
Principle 1 1 1 4
Procedural 6 50 14 20
Classify 0 16 3 10
Change 0 13 4 10
HF = Human Factors; ES = Expert Systems; T/E = Theoretical Experimental;
ID/T = Instructional Design & Training

64
CHAPTER 4: CONCLUSIONS
The purpose of this study was to explore the interactions between cognition
and task analysis methods. Specifically, it first sought to identify, without regard to
the date of publication, studies that utilized knowledge elicitation and cognitive task
analysis methods, and then to examine and classify a sample of these studies by
applying various criteria. Although, as an exploratory study, no formal hypotheses
were stated, five research questions guided the study. As the initial search of the
literature returned a large number of knowledge elicitation and CTA studies, the first
part of the study concerned the selection of a study sample of the most frequently
used individual elicitation and analysis/representation methods. The second part of
the selection process identified the most frequent pairings of knowledge elicitation
and analysis/representation methods, as reflected in the actual practice of CTA.
A review of the description of the CTA methods that were used to classify
the sample studies revealed that the mechanisms of some methods could be
categorized as well specified, formal, and intended to be applied systematically,
while others were less structured, and able to be adapted to meet the constraints of
the task and domain. Therefore, the study sought to determine whether the formal
methods were applied consistently and produced consistent knowledge outcomes.
Contrasted with previous CTA classification schemes that assigned labels to
CTA methods, based on their process, technique or theoretical approach, this current
study sought, as the third research question, to determine whether the product or
outcomes of the application of CTA methods could be classified as either declarative
65
or procedural knowledge, and, if sufficient data were available, further classified as
to declarative knowledge subtypes (concept, process, principle) and procedural
knowledge subtypes (classify, change). It was thought that such a classification
might lead to additional studies toward creating an evidence-based taxonomy of
CTA methods based on desired knowledge outcomes.
The fourth research question concerned whether the studies in the sample
included statements that addressed the elicitation of automated knowledge.
Because the literature often refers to the context and intended application of
the output of CTA as factors for choosing CTA methods, the last research question
concerned the categorization of the sample studies according to the intended
application of the results to provide additional interpretive data.
Research Questions
Research Question 1:
What are the most frequently used pairings of knowledge elicitation and
analysis/representation methods found in the CTA literature?
Consistent with the recommendation found frequently in the literature, the
initial data gathered for this study confirmed that, in practice, CTA studies often
incorporated more than one individual knowledge elicitation and
analysis/representation method. However, because the success of the CTA
enterprise depends upon the effective use of both elicitation and
analysis/representation methods, this study sought to identify and examine the
66
pairing of these methods within each study and their associations with knowledge
type outcomes.
The findings of this study indicate that there are 15 most frequently used
pairings of elicitation and analysis/representation techniques, and that the
characteristics of the pairings are similar in several aspects.
Four methods - Process Tracing/Protocol Analysis, Concept Mapping,
Repertory Grid, and Card Sort – are relatively formalized and specific in their
methodology. The methods integrate the components of knowledge elicitation and
analysis/representation. Further, the techniques are well documented, and there is a
considerable body of literature for each method.
Document Analysis was not listed in the CTA Methods Summary Table;
however, it was encountered early in the coding process and added to the coding
form. Document Analysis was labeled as both an elicitation and
analysis/representation technique, which reflected the actual use of the technique in
the studies.
Process Tracing/Protocol Analysis was also paired with other individual
methods. As an elicitation method, it was paired with Diagram Drawing, which was
frequently used to represent results in tables, flow charts, and system state diagrams.
As a technique to analyze and represent results, Process Tracing/Protocol Analysis
was paired with Think Aloud and Semi-structured Interview, two elicitation
methods. The pairing with Think Aloud is expected, as it is a technique in which a
person verbalizes perceptions, decisions, and actions while performing a task, and an

67
essential element of both the theory and technique of Process Tracing/Protocol
Analysis. Semi-structured Interview was also paired with Process Tracing/Protocol
Analysis. This was an unexpected result, as interviewing is not a component of this
formal and standardized method, and raises the question whether formal CTA
methods are being applied systematically and consistently.
In addition to being paired with Process Tracing/Protocol Analysis, the Semi-
structured Interview was paired with Diagram Drawing, Content Analysis, and
Document Analysis. The pervasive use of the Semi-structured interview
demonstrates the relative ease with which this elicitation method can be applied, and
its results analyzed and represented by tables, diagram, or in the case of Content
Analysis, a priori or emergent categories. The pairing of Semi-structured Interview
with Document Analysis demonstrates that multiple methods were frequently used in
the study sample, and that Document Analysis is often a preliminary step to
familiarize the analyst with the domain and/or task under investigation and to design
the remaining knowledge elicitation and analysis/representation process.
It was also found that Diagram Drawing, in which the analyst represents
processes in or states of an informant’s domain by charts and diagrams, for example,
was paired with five elicitation methods, thus demonstrating the critical task of
displaying data and presenting findings when conducting CTA.

68
Research Question 2:
To what extent do pairings of knowledge elicitation and analysis/representation
methods match with formal CTA methods found in the literature?
The current study’s method of pairing individual knowledge elicitation and
analysis/representation methods provided the opportunity to examine whether the
individual method pairings match the standardized methods and systematic
procedures established for formal CTA methods described in the literature.
For the most part, CTA method pairings of elicitation and
analysis/representation techniques in the final study sample were matched with the
formal CTA methods, as in the case of Concept Mapping – Concept Mapping,
Repertory Grid – Repertory Grid, and Card Sort – Card Sort.
Process Tracing/Protocol Analysis, however, was paired not only with itself,
as expected, but also with Think Aloud, Semi-structured Interview, and Diagram
Drawing. Think Aloud, or verbalizing one’s thoughts while performing a task, is a
major component of Process Tracing/Protocol Analysis. A Semi-structured
interview, however, involves a dialog between the informant and the analyst.
Fundamental to Process Tracing/Protocol Analysis is the theory that a person can
only verbalize that which is attended to in working memory. Thus, it would seem
that interrupting the informant during task performance with questions would
diminish or modify the results of the elicitation process and the precise application of
the Process Tracing/Protocol Analysis techniques that follow.

69
Additional review of the studies corresponding to these method pairings may
reveal a trend toward the adaptation or generalization of Process Tracing/Protocol
Analysis as a generic process of recording, transcribing, and categorizing
informants’ verbal interviews as they describe how they performed a task. In the
event that such a trend exists with this or other more formal methods, important
questions arise concerning the consistency and validity of the results from their use,
and whether the formal names and descriptions of the protocols have relevant
meaning. In other words, the more that the practice of these methods departs from
the formal protocols, which have empirically supported theoretical foundations, the
less likely the results will be valid and reliable.
Research Question 3:
What knowledge types are associated with the knowledge elicitation and
analysis/representation pairings? How consistent are these associations?
Declarative and Procedural Knowledge
The findings of the current study show that the most frequent elicitation and
analysis/representation method pairings associated with declarative knowledge only
are (a) Document Analysis-Document Analysis (14), (b) Concept Mapping-Concept
Mapping (14), (c) Structured Interview-Diagram Drawing (8), (d) Card Sort-Card
Sort (7), (e) Repertory Grid-Repertory Grid (7), and (f) Process Tracing/Protocol
Analysis - Process Tracing/Protocol Analysis (7). Overall, these results were
expected and consistent with the intended use of the methods found in the literature.

70
The literature indicates that Document Analysis has been widely used for
“bootstrapping” early in the CTA process, and also has been the focus of knowledge-
based systems, intended to apply data elicited from printed format. Concept
Mapping, Card Sort, and Repertory Grid are formal methods that have been strongly
and consistently associated in the literature with eliciting and representing
conceptual knowledge. Similarly, the constraining nature of the Structured Interview
facilitates elicitation of specific information. The results for Process
Tracing/Protocol Analysis may be attributed to techniques of this methodology to
aggregate solution steps and processes by comparing and summarizing task
sequences between subjects with process knowledge as the outcome.
The most frequent method pairings associated with procedural knowledge
only are (a) Process Tracing/Protocol Analysis – Process Tracing/Protocol Analysis
(3), Document Analysis – Document Analysis (2), (c) Think Aloud – Process
Tracing/Protocol Analysis (2), Semi-Structured Interview – Diagram Drawing (2),
and (d) Repertory Grid – Repertory Grid (2). Repertory Grid would appear to be an
outlier within this group; however, in the studies, this method was occasionally used
in the development of expert systems, in which concepts are represented as IF-THEN
statements, and thus, coded as procedures.
The most frequent method pairings that were coded as resulting in both
declarative and procedural knowledge include: (a) Process Tracing/Protocol Analysis
– Process Tracing/Protocol Analysis (34), (b) Think Aloud – Process
Tracing/Protocol Analysis (21), (c) Document Analysis – Document Analysis (16),
71
(d) Semi-Structured Interview - Diagram Drawing (15), and (e) Document Analysis
– Diagram Drawing (11). These were expected results for three reasons: (1) Think
Aloud or Retrospective Recall, essential components of Process Tracing/Protocol
Analysis, are most often used to capture actions during or after the performance of a
task; (2) Process Tracing/Protocol Analysis techniques not only capture actions, but
also goals, plans, states, and other kinds of information; and (3) Although Process
Tracing/Protocol Analysis consists of a specified set of techniques, the studies
indicate that some of these techniques , such as the coding and categorizing of verbal
transcripts, have been broadly interpreted and applied. Other frequent method
pairings that resulted in both declarative and procedural knowledge are Semi-
Structured Interview, Diagram Drawing, and Document Analysis. These are also
broadly interpreted and widely utilized methods, as their methods are less specified,
and often determined by the desired outcomes.
Declarative and Procedural Knowledge Subtypes
Within the 154 documents in the final study sample, declarative knowledge
subtype associations were: 218 method pairings associated with concepts, 123
pairings with processes, and 19 with principles. The associations with procedural
knowledge subtypes consisted of 77 associated with classify and 46 with change
functions. In general, the results show a substantial weighting of declarative
knowledge outcomes (75%) over procedural knowledge outcomes (25%).
As expected from the results already reported, Process Tracing/Protocol
Analysis, alone and paired with other methods, represented the most frequent

72
association with declarative concepts (75), processes (45), and principles (11), and
with classify (34) and change (30) procedures. In particular, this method accounted
for 11 out of 19 total method pairings for principles. Also as anticipated, methods
normally associated with conceptual knowledge (i.e., Concept Mapping, Repertory
Grid, Card Sort) were less represented in the procedural subtype classifications,
although Repertory Grid had a greater frequency in the classify category, due to its
use for knowledge base systems. Whereas, the knowledge subtype outcomes for
Document Analysis, Semi-structured Interview, Diagram Drawing, and Content
Analysis, as highly adaptable and less structured methods, extended over concepts,
processes, classify, and change. However, the Semi-structured Interview method
accounted for 38 associations with classify and change procedures, second only to
Process Tracing/Protocol Analysis.
These findings suggest that although less formal methods provide the
advantage of flexibility and ease of use, their inconsistency with respect to
knowledge results suggests that an in depth analysis of their actual use may reveal
mechanisms that are consistency associated with specific knowledge types. An
examination of studies using semi-structured interviews, for example, may show that
the structure and content of the questions posed in these interviews consistency elicit
specific types of knowledge and that this knowledge might be easily analyzed and
best represented in a particular manner. Such data might lead to establishing new
standardized protocols, which, in turn, could be subject to further research to
establish their validity and reliability.

73
Research Question 4:
To what extent do publications containing pairings of CTA methods include a
statement that the methods incorporate activities addressing automated, tacit, or
implicit knowledge?
To be classified as sensitive to automated knowledge, the study must have
met at least one of the following criteria: (a) Recommended or used method(s) with
more than one subject matter expert; (b) Called for an iterative approach, in which
the subject matter expert had the opportunity to correct and supplement previous
results; or (c) Recommended or used multiple methods.
A review of the studies resulted in 132 studies that met the criteria and 22
studies that did not. This was an unexpected result, as it was generally thought that
efforts to capture automated knowledge have been applied relatively recently. It may
be that this data is associated with the substantial weighting of declarative
knowledge outcomes (75%) over procedural knowledge outcomes (25%).
The literature reviewed for this study revealed other interesting trends.
During the 1979s and 1980s, expert systems sometimes relied on a single expert for
the knowledge required to design and develop the system, because only one expert
was available or “easier to work with” than multiple experts. Considerations for the
use of multiple experts included availability, degree of cooperation between experts
and developers, and mechanisms to resolve ideological and factual conflicts among
the experts. In the 1990s the use of multiple experts and a more iterative approach
increased in parallel with research in cognition and CTA methods.

74
The recommendation to use multiple methods to capture different aspects of
knowledge appeared early and consistently throughout the literature.
Research Question 5:
How can the applications of the most frequently used pairings of CTA methods be
categorized?
The studies in the final sample were categorized as to the application of the
outcomes. As reflected in the literature, it was expected that a large number of
applications of knowledge acquisition techniques would be for the development of
expert systems. The results indicated that 75 (48.70%) of 154 studies reviewed
applied the results to expert systems. Since the early 1980s, computer applications
have been developed to replicate the knowledge and skills that experts use in
problem solving. However, as reported throughout the literature reviewed for this
study, the initial stage of knowledge acquisition has been the most difficult in the
development process for expert systems.
There were 30 studies in the theoretical and experimental category. The
diversity of the subject domains and applications of CTA methods found in the
literature account for this number, as well as the relatively recent advances in
cognitive science, the origins of CTA in behavioral task analysis, and interest in
applying CTA methods to areas beyond expert systems.
Instructional Design and Training was the next emergent category with 26
studies. A significant number of these studies were funded and conducted in military

75
settings to report the effectiveness of using CTA methods for developing training
systems for troubleshooting, situation awareness, and weapons. In addition, a large
number of studies applied to training medical diagnosis and procedure skills.
The human factors category consisted of 23 studies and included those that
researched human-computer interaction, manufacturing processes, organizational
performance, and team CTA.
Representation Bias
An examination of the interactions among applications, methods, and
knowledge type outcomes in the CTA process is complicated by the possible effect
of representation bias in knowledge acquisition for expert systems, in which the
analyst’s choice of elicitation methods is influenced by the final representation and
use of the results (Cooke, 1992; Cooke & McDonald, 1986). The development of
expert systems requires that knowledge be represented as condition-action pairs.
This requirement influences the choice of CTA methods and the final representation
of expertise, including declarative knowledge (concepts, processes, principles), as
procedural IF-THEN rules.
Because the development of expert systems accounts for about 49% of the
applications of CTA in the study sample, the influences of a representation-driven
knowledge acquisition would be expected, for example, in the greater use of formal
conceptual elicitation and analysis/representation pairings, which results can be more
easily converted to production rules. The data in Table 5 provides some evidence for
76
this, in that, when sorted by frequency, the cluster of the most frequently cited
individual CTA methods includes Concept Map, Repertory Grid, Cord Sort, and
Process Tracing/Protocol Analysis, all of which are classified as both elicitation and
analysis/representation methods. Another indication of representation bias at work
may be, as previously noted, the unexpected association between the Repertory Grid
method, typically associated with conceptual knowledge elicitation, and procedural
knowledge outcomes.
In addition, the data in Table 11, which shows associations in the study
sample between the applications of CTA and knowledge type outcomes, approaches
the issue differently. The data in the table shows that the percentage of general
declarative and procedural knowledge outcomes, 55% and 45% respectively, are
identical for both expert systems and instructional design/training. This result would
be expected, as declarative and procedural knowledge are required for both
applications. However, the CTA process may be different. Knowledge acquisition
for expert systems appears to assume that expertise can be represented by conditional
rules and seeks to capture declarative knowledge as an intermediate step.
Development of training and other instructional programs, on the other hand, require
the representation of both declarative and procedural knowledge that underlie expert
performance of a task.

77
Summary
This study examined the interactions among cognitive task analysis methods
and cognition identified in a sample of studies (n=154) chosen through an iterative
review process. Individual CTA methods found in the studies were classified as
either elicitation or analysis/representation using a system adapted from CTA
Resources (2006). The results showed that, in practice, pairings of elicitation and
analysis/representation methods are used, rather than individual methods. Because
the success of CTA relies upon the effective use of both elicitation and
analysis/representation methods, the remainder of the study then focused on
examining the most frequent pairings of these methods and their knowledge
outcomes. The results demonstrate that (a) The most frequently used CTA method
pairings include both standardized methods and informal methods, (b) the
application of the methods have been associated more with declarative knowledge
than procedural knowledge, (c) standardized methods appear to provide greater
consistency in the results than informal models, (d) through a variety of techniques,
most studies have addressed issues concerning automated knowledge, and (e) the
analysis of interactions among applications, methods, and knowledge types is
influenced by possible effects of representation bias.

78
Implications
The implications of this study apply to two areas of research. The first relates
to research in cognitive task analysis, and the second pertains to research in
instructional design.
Cognitive Task Analysis
It is not difficult to acquire a basic theoretical understanding of cognitive task
analysis, as there are many definitions in the literature, each providing a different
perspective. For example, Crandall et al. (2006) recently unpacked CTA as: (a)
cognitive, in that it seeks to capture the reasoning and knowledge required for
complex problem solving; (b) task, referring to the outcomes people are trying to
achieve; and (c) analysis, as breaking something down into its parts, understanding
each part, and the relation each part has to the whole task.
On the other hand, the practice of CTA continues to present challenges even
for the experienced user, primarily centered on choosing the appropriate CTA
method for the domain and intended application. As shown in this current study, a
number of classification systems are available to guide the practitioner; however,
each has its own theoretical and methodological approach, which also must be taken
into consideration. In addition, the findings show that only four of the top 15 CTA
method pairings are formal methods supported by empirical evidence and
standardized procedures that, if followed, predict knowledge outcomes. The
remaining method pairings lack this specificity, and are, therefore, less predictable.
79
For the moment, it appears, CTA exists in an area of tension between basic research
in psychology and cognitive science and the applied purposes and needs that drive it
(Chipman et al., 2000). While some research focuses on the appropriate application
and sequencing of individual CTA methods, there are calls for alternative
approaches.
Clark et al. (in press) suggest applying Merrill’s (2002) “first principles”
approach to CTA research. Merrill examined the key cognitive components of well-
known research-based instructional design methods and identified their similarities,
which he compiled as “first principles.” For example, Merrill suggested that the
most effective learning models are problem centered, and demonstrate what is to be
learned, rather than telling information about what is to be learned. The goal of a
“first principles” approach to CTA methods would be to identify the active
ingredients in key CTA methods.
How might a “first principles” research approach be pursued? Clark et al. (in
press) recommend more studies that systematically compare different CTA methods
on similar outcome goals and measures. Previous comparison studies have provided
valuable insights in this area. For example, Chao and Salvendy (1994) conducted a
study to determine the optimum number of experts for acquiring procedural
knowledge using different CTA methods and tasks. They found that the percentage
of strategies and sequential operations used by a single expert for a diagnosis task
were approximately equal for protocol analysis (41%), interview (40%), induction
(40%), and repertory grid (40%). For the debugging task, the interview and

80
induction were higher (53%, 50% respectively) than protocol and repertory grid
(37% each). For the interpretation task, the percentage of procedures were, again,
about equal, albeit lower, ranging from 21% -29%. The overall finding and primary
purpose of the study demonstrated significant increases in the percentage of
procedures as a result of using multiple experts, with three experts as their final
recommendation; however, the study also provided insights about the impact of
different CTA methods for different tasks.
As another example, Hodgkinson, Maule, and Bown (2004) compared two
causal mapping techniques, pairwise comparisons and freehand drawings, designed
to systematically elicit and represent a person’s causal beliefs concerning an issue or
event. The pairwise technique resulted in much greater complexity than the freehand
method, although participants found pairwise comparisons more difficult and less
engaging.
Hoffman, Coffey, Carnot, and Novalk (2002), on the other hand, find
empirical comparisons of CTA methods problematic for several reasons. First, some
studies have used college age participants and assessments of familiar topics. The
generalizability of these finding may not transfer to genuine experts in domains of
significant interest. Second, the dependant variables have not been carefully selected
and clearly defined in that established metrics for one domain or application may not
be suitable for another. Another factor that clouds results is that procedures and
qualities that define a specific method are not followed in some studies. Those who
are unpracticed and not complete familiar with the underlying theory and constructs

81
of a method sometimes fail to avoid common pitfalls than undermine a method’s
validity. As a final factor, Hoffman et al. suggest that some studies compare “apples
and oranges” that result in findings that are difficult to interpret. When comparing
methods, they must all be suited for a specific purpose. In short, a comparison of
methods must involve a level playing field.
The evidence from this current study would seem to support this analysis.
With exception of the formal methods, the findings indicate numerous haphazard
pairings of methods that are ill-defined and result in the same knowledge type
outcomes. Further research that examines the activities and their respective
knowledge outcomes of these methods in depth may reveal method pairings that
could be tested for validity and reliability, and thus become new standard
elicitation/analysis/representation methods.
Another major area of CTA research is expertise. Eliciting and representing
expert knowledge is the primary purpose of CTA, yet “the state of the art is lacking
specification of just those kinds of knowledge [that are] most characteristic of
expertise” (Chipman et al., 2000).
More or less reflecting the classification by technique approach, Hoffman et
al. (1995) proposed a methodology for revealing, representing, preserving, and
disseminating expert knowledge based three categories CTA methods: (a) analysis of
tasks that experts perform, (b) various types of interviews, and (c) contrived
techniques. They paraphrase the categories as: What do experts usually do? What
82
do experts say they do? And what do they do when they are constrained in some new
way?
In a review of the literature on expertise, Feldon (in press) presents a four-
part framework to examine the process elements that shape expertise through: (a) the
role of knowledge, (b) the role of strategy, (c) the role of working memory, and (d)
the role of skill automaticity. The overwhelming evidence is that experts and
novices differ considerably, when viewed within the framework. However, the
characteristics of expertise that provide the advantages experts demonstrate in task
performance also present the challenge to the accuracy and validity of CTA methods.
Further research on CTA methods within this framework might be paraphrased as:
What do experts know, what type of knowledge is it, and how is it organized? And
how do experts apply their knowledge, how does declarative and procedural
knowledge work together, and what procedures do experts use to make decisions?
The findings of this current study contain apparent inconsistencies that
warrant further investigation. Although the most of the applications described in the
studies reviewed were categorized as expert systems, which rely on procedural rules
for programming, the study shows that declarative knowledge was the dominant
knowledge type associated with the methods used in the studies. Moreover, 85% of
the studies were coded as being sensitive to automated knowledge. Clearly, further
research is needed to sort out the working relationship between declarative and
procedural knowledge.

83
Instructional Design
The implications of the study for research in instructional design can be
viewed from two perspectives. The first concerns an understanding of the risks
involved when task analysis is not considered the most important component of
instructional design. Poorly executed task analysis leads to gaps that often are not
obvious, until learners are asked to perform the tasks, and they cannot (Jonassen et
al., 1999). The second perspective is the growing body of evidence demonstrating
the benefits of CTA to improve learning and performance.
The job of the instructional designer is to analyze the knowledge that is
required to perform a task. Most instructional design models advocate a mix of
declarative and procedural knowledge, but the process of classifying and
inventorying tasks can be challenging, given the numerous choice within some
systems. The framework of the current study includes only three types of declarative
knowledge: concepts, processes, and principles, and two types of procedural
knowledge: classify and change. Further research is needed to generalize whether
this classification system is adequate to define expert declarative and procedural
knowledge across domains and applications.
Another area of research pertains to the integration of CTA methods and
instructional design models into one system. Optimal instructional results are
achieved when there is an alignment of learning objectives, types of knowledge
required to achieve the objectives, and appropriate methods to acquire that
knowledge (Clark et al., in press) . Only three examples of this model exist: the

84
Integrated Task Analysis Model (Ryder & Redding, 1993); Guided Experiential
Learning (Clark, 2004; Clark & Elen, 2006), and the Four Component Instructional
Design System (van Merriënboer, 1997; van Merriënboer, Clark, & de Croock,
2002). Additional research is needed to demonstrate the effectiveness of these
systems, the sufficiency of the CTA methods, and the interaction among the
components.
Conclusion
In conclusion, the current study is only a fist step in exploring the interactions
between cognition and task analysis activities. Further studies will continue to
investigate the “first principles” approach to cognitive task analysis. Based on
existing theories of cognition that are well-developed and articulated, a taxonomy of
CTA methods and cognition could possibly achieve the desired reduction in
taxonomic categories, while providing clearly explicated guidelines for conducting
the CTA enterprise.

85
REFERENCES
American Psychiatric Association. (1994). Diagnostic and statistical manual of
mental disorders. Washington, DC: Author.
Anderson, J. R. (1983). The architecture of cognition. Cambridge, MA: Harvard
University Press.
Anderson, J. R. (1996). ACT: A simple theory of complex cognition. American
Psychologist, 51(4), 355-365.
Anderson, J. R. (2005). Cognitive psychology and its implications (6th ed.). New
York: Worth Publishers.
Anderson, J. R., Bothell, D., Byrne, M. D., Douglass, S., Lebiere, C., & Qin, Y.
(2004). An integrated theory of the mind. Psychological Review, 111(4),
1036-1060.
Anderson, J. R., & Lebiere, C. (1998). The atomic components of thought. Mahwah,
NJ: Lawrence Erlbaum Associates.
Bainbridge, L. (1979). Verbal reports as evidence of the process operator's
knowledge. International Journal of Man-Machine Studies, 11, 411-436.
Bruning, R. H., Schraw, G. J., Norby, M. M., & Ronning, R. R. (2004). Cognitive
psychology and instruction. Upper Saddle River, NJ: Pearson Prentice Hall.
Chao, C.-J., & Salvendy, G. (1994). Percentage of procedural knowledge acquired as
a function of the number of experts from whom knowledge is acquired for
diagnosis, debugging, and interpretation tasks. International Journal of
Human-Computer Interaction, 6(3), 221-233.
Chipman, S. F., Schraagen, J. M., & Shalin, V. L. (2000). Introduction to cognitive
task analysis. In J. M. Schraagen, S. F. Chipman & V. L. Shalin (Eds.),
Cognitive task analysis (pp. 3-23). Mahwah, NJ: Lawrence Erlbaum
Associates.
Chulef, A. S., Read, S. J., & Walsh, D. A. (2001). A hierarchical taxonomy of human
goals. Motivation and Emotion, 25(3), 191-232.
Clark, R. E. (1999). The cognitive sciences and human performance technology. In
H. D. Stolovitch & E. J. Keeps (Eds.), Handbook of Human Performance
Technology. San Francisco: Jossey-Bass/Pfeiffer.

86
Clark, R. E. (2004). Design document for a Guided Experiential Learning course:
Final report on contract DAAD 19-99-D-0046-0004 from TRADOC to the
Institute for Creative Technologies to the Center for Cognitive Technology,
University of Southern California.
Clark, R. E., & Elen, J. (2006). When less is more: Research and theory insights
about instruction for complex learning. In J. Elen & R. E. Clark (Eds.),
Handling complexity in learning environments: Research and theory (pp.
283-297). Oxford: Elsevier Science Limited.
Clark, R. E., Feldon, D. F., Van Merriënboer, J. J. G., Yates, K. A., & Early, S. (in
press). Cognitive task analysis. In J. M. Spector, M. D. Merrill, J. J. G. Van
Merrienboer & M. P. Driscoll (Eds.), Handbook of research on educational
communications and technology (3rd ed.). Mahwah, NJ: Lawrence Erlbaum
Associates.
Cohen, J. (1992). A power primer. Psychological Bulletin, 112(1), 155-159.
Cooke, N. J. (1992). Modeling human expertise in expert systems. In R. R. Hoffman
(Ed.), The psychology of expertise: Cognitive research and empirical AI (pp.
29-60). Mahwah, NJ: Lawrence Erlbaum Associates.
Cooke, N. J. (1994). Varieties of knowledge elicitation techniques. International
Journal of Human-Computer Studies, 41, 801-849.
Cooke, N. J. (1999). Knowledge elicitation. In F. T. Durso (Ed.), Handbook of
applied cognition (pp. 479-509). New York: Wiley.
Cooke, N. M., & McDonald, J. E. (1986). A formal methodology for acquiring and
representing expert knowledge. Proceedings of the IEEE, 74(10), 1422-1430.
Cowan, N. (2000). The magical number 4 in short-term memory: A reconsideration
of mental storage capacity. Behavioral and Brain Sciences, 24, 87-185.
Crandall, B., Klein, G., & Hoffman, R. R. (2006). Working minds: A practitioner's
guide to cognitive task analysis. Cambridge, MA: MIT Press
CTA Resource. (2006). Retrieved January 25, 2006, from
http://www.ctaresource.com

87
Ericsson, K. A., Krampe, R. T., & Tesch-Römer, C. (1993). The role of deliberate
practice in the acquisition of expert performance. Psychological Review,
100(3), 363-406.
Ericsson, K. A., & Simon, H. A. (1993). Protocol analysis: Verbal reports as data.
Cambridge, MA: MIT Press.
Essens, P. J., Fallesen, J. J., McCann, C. A., Cannon-Bowers, J. A., & Dorfel, G.
(1995). COADE: A framework for cognitive analysis, design, and evaluation.
Brussels, Belgium: NATO: Defence Research Group.
Feldon, D. F. (in press). The implications of research on expertise for curriculum and
pedagogy. Educational Psychology Review.
Follette, W. C., & Houts, A. C. (1996). Models of scientific progress and the role of
theory in taxonomy development: A case study of the DSM. Journal of
Consulting and Clinical Psychology, 64(6), 1120-1132.
Gagné, E. D. (1985). The cognitive psychology of school learning. Boston: Little,
Brown and Company.
Gagné, R. M. (1965). The conditions of learning. New York: Holt, Rinehart &
Winston.
Hempel, C. G. (1965). Fundamentals of taxonomy. In C. G. Hempel (Ed.), Aspects of
scientific explanation (pp. 137-154). New York: Free Press.
Hinds, P. J. (1999). The curse of expertise: The effects of expertise and debiasing
methods on predictions of novice performance. Journal of Experimental
Psychology: Applied, 5(2), 205-221.
Hodgkinson, G. P., Maule, A. J., & Bown, N. J. (2004). Causal cognitive mapping in
the organizational strategy field: A comparison of alternative elicitation
procedures. Organizational Research Methods, 7(1), 3-26.
Hoffman, R. R., Coffey, J. W., Carnot, M. J., & Novak, J. D. (2002). An empirical
comparison of methods for eliciting and modeling expert knowledge. In
Proceedings of the 46th meeting of the Human Factors and Ergonomics
Society. Santa Monica, CA: Human Factors and Ergonomics Society.
Hoffman, R. R., Crandall, B., & Shadbolt, N. (1998). Use of the critical decision
method to elicit expert knowledge: A case study in the methodology of
cognitive task analysis. Human Factors, 40(2), 254-276.

88
Hoffman, R. R., Shadbolt, N. R., Burton, A. M., & Klein, G. (1995). Eliciting
knowledge from experts: A methodological analysis. Organizational
Behavior and Human Decision Process, 62(2), 129-158.
Hoffman, R. R., & Woods, D. D. (2000). Studying cognitive systems in context:
Preface to the special section. Human Factors, 42(1), 1-7.
Howell, W. C., & Cooke, N. J. (1989). Training the human information processor: A
look at cognitive models. In I. Goldstein (Ed.), Training and development in
work organizations: Frontier series of industrial and organizational
psychology (Vol. 3, pp. 121-182). New York: Jossey Bass.
Jonassen, D. H., Tessmer, M., & Hannum, W. H. (1999). Task analysis methods for
instructional design. Mahwah, NJ: Lawrence Erlbaum.
Lee, R. L. (2004). The impact of cognitive task analysis on performance: A meta-
analysis of comparative studies. Unpublished Doctoral Dissertation,
University of Southern California, Los Angeles.
Lipsey, M. W., & Wilson, D. B. (2001). Practical meta-analysis. Thousand Oaks,
CA: Sage Publications.
Maupin, F. G. (2003). Comparing cognitive task analysis to behavior task analysis in
training first year interns to place central venous catheters. An unpublished
doctoral dissertation presented to the faculty of the Rossier School of
Education, University of Southern California.
McTear, M. F., & Anderson, T. J. (1990). Introduction. In M. R. McTear & T. J.
Anderson (Eds.), Understanding knowledge engineering (pp. 7-11).
Chichester, UK: Ellis Harwood.
Merrill, M. D. (1983). Component Display Theory. In C. M. Reigeluth (Ed.),
Instructional-design theories and models: An overview of their current status
(pp. 279-333). Hillsdale, NJ: Lawrence Erlbaum Associates.
Merrill, M. D. (1994). Instructional Design Theory. Englewood Cliffs: Educational
Technology Publications.
Merrill, M. D. (2002). First Principles of Instruction. Educational Technology
Research & Development, 50(3), 43-59.

89
Militello, L. (2001). Representing expertise. In E. Salas & G. Klein (Eds.), Linking
expertise and naturalistic decision making. Mahwah, NJ: Lawrence Erlbaum.
Miller, G. A. (1956). The magical number seven, plus or minus two: Some limits on
our capacity for processing information. Psychological Review, 63, 81-97.
Ormrod, J. E. (2004). Human learning (4th ed.). Upper Saddle River, NJ: Pearson
Prentice Hall.
Patton, M. Q. (2002). Qualitative research & evaluation methods. Thousand Oaks:
Sage Publications.
Reigeluth, C. M. (1983). Foreword to Component Display Theory. In C. M.
Reigeluth (Ed.), Instructional-design theories and models: An overview of
their current status (pp. 281-282). Hillsdale, NJ: Lawrence Erlbaum
Associates.
Russo, J. E., Johnson, E. J., & Stephens, D. L. (1989). The validity of verbal
protocols. Memory & Cognition, 17(6), 759-769.
Ryder, J. M., & Redding, R. E. (1993). Integrating cognitive task analysis into
instructional design systems development. Educational Technology Research
& Development, 41(2), 75-96.
Schaafstal, A., Schraagen, J. M., & van Berlo, M. (2000). Cognitive task analysis
and innovation of training: The case of structured troubleshooting. Human
Factors, 42(1), 75-86.
Schraagen, J. M., Chipman, S. F., & Shalin, V. L. (2000). Cognitive task analysis.
Mahwah, NJ: Lawrence Erlbaum Associates.
Schraagen, J. M., Chipman, S. F., & Shute, V. (2000). State-of-the-art review of
cognitive task analysis techniques. In J. M. Schraagen, S. F. Chipman & V.
L. Shalin (Eds.), Cognitive task analysis. Mahwah, NJ: Lawrence Erlbaum.
Schunk, D. H. (2000). Learning theories: An educational perspective. Upper Saddle
River, NJ: Prentice-Hall.
Shadish, W. R., Cook, T. D., & Campbell, D. T. (2002). Experimental and quasi-
experimental designs for generalized causal inference. Boston: Houghton
Mifflin Company.

90
van Merriënboer, J. J. G. (1997). Training complex cognitive skills: A four-
component instructional design model for technical training. Englewood
Cliffs, NY: Educational Technology Publications.
van Merriënboer, J. J. G., Clark, R. E., & de Croock, M. B. M. (2002). Blueprints for
complex learning: The 4C/ID Model. Educational Technology Research &
Development, 50(2), 39-64.
Velmahos, G. C., Toutouzas, K. G., Sillin, L. F., Chan, L., Clark, R. E., Theodorou,
D., et al. (2004). Cognitive task analysis for teaching technical skills in an
inanimate surgical skills laboratory. The American Journal of Surgery, 187,
114-119.
Wei, J., & Salvendy, G. (2004). The cognitive task analysis methods for job and task
design: Review and reappraisal. Behaviour & Information Technology,
23(4), 273-299.

91
APPENDIX A: CTA METHODS SUMMARY TABLE
Name and Description Elicitation
Analysis/
Representation
20 Questions - The analyst provides the
informant with a situation, problem or solution.
The informant determines the concept that the
analyst has in mind by asking yes/no questions.
The analyst derives information about the
informant’s problem solving process by noting
the questions asked.
E
ACTA - Applied Cognitive Task Analysis
method uses task diagrams, knowledge audits,
and simulated interviews to elicit and represent
the cognitive aspects of a task. Computer-based
training software is available from Klein
Associates, Inc.
E A
Active Participation - The informant performs a
task or solves a problem in the domain. The
analyst collaborates with the informant while
observing and recording the informant’s actions
and environment.
E
Activity Sampling - The analyst observes and
records samples of the informants? actions at
predetermined intervals.
E
ACT-R - Hybrid architecture for modeling
human cognitive tasks with considerable
learning strengths and a large user community.
A
Barrier and Work Safety Analysis - The analyst
identifies what hazards in the domain could lead
to an accident. For each hazard, barriers are
identified to prevent potential accidents.
A
Close Experimental/Minimal Scenario
Technique - The analyst presents the informant
with a scenario missing essential information.
The informant the fills in the gaps in the
scenario.
E
Clustering Routines - A mathematical technique
in which domain concepts are grouped based on
ratings of similarity or conceptual distance.
A

92
COGNET - COGnition as a NETwork of Tasks
is a theoretically based set of tools and
techniques for performing cognitive task
analyses and building models of human-
computer interaction in real-time, multitasking
environments. It provides an integrated
representation of the knowledge, behavioral
actions, strategies and problem solving skills
used in a domain or task situation.
A
Cognitive Function Model - CFM combines the
hierarchical graph structure of the Operator
Function Model with a technique to assess the
cognitive complexity of nodes to capture
operations and cognitive challenges within
complex systems. Software application
developed by Klein Associates and Aptima, Inc.
E A
Cognitive Task Analysis - The analyst explicitly
identifies the knowledge, goals, strategies, and
decisions that underlie observable task
performance.
E
Cognitive Work Analysis - The analyst employs
five different frameworks (control tasks, work
domain, social organization, strategies, and
worker competencies) to characterize the
demands of the domain and the knowledge,
skills, strategies, and control actions required to
operate effectively in the domain. It is used to
define requirements for new support systems.
A
Comparing Two or More Representations - The
analyst compares structural aspects of domain
representations, aspects such as number of
clusters and connectivity of graphs. INDSCAL is
an available software tool.
A
Concept Listing - In a structured interview, the
informant lists the key concepts of his or her
domain.
E
Conceptual Graph Analysis - The analyst
represents the informant’s domain knowledge by
graphically representing domain concepts using a
pre-defined syntax.
A
Content Analysis - The analyst organizes the
informant’s verbal report into a priori or
emergent categories of interest.
A

93
Control Task Analysis - The analyst identifies
the control tasks that need to be performed to
achieve system goals, independent of how they
are to be performed or by whom.
A
Controlled Association - The analyst presents the
informant with a concept. The informant
indicates all related concepts and assigns
relatedness values.
E
Controlled Simulated Observations - The analyst
presents the informant with a concept to which
the informant indicates all other related concepts.
Each selected pair is then assigned a relatedness
value.
E
Correlation/Covariance - Informants? ratings of
different concepts are correlated to estimate the
similarity of the concepts.
A
Critical Decision - The informant recalls a
challenging past experience and describes the
decisions made and actions taken. The analyst
elicits a timeline, background knowledge,
environmental cues, decision options, novice
errors, and other factors.
E
Critical Incident - The informant recalls a
challenging past experience and describes the
actions taken. The analyst’s probes (questions)
and line of questioning are pre-planned.
E
Critical Retrospective - The informant provides a
verbal report regarding another informant’s prior
performance of a task.
E
Crystal Ball/Stumbling Block - The informant
describes a challenging assessment or decision.
The analyst insists that the assessment is wrong,
and that there are alternative interpretations of
events, missing information, or assumptions. The
informant generates these.
E
Design Storyboarding - The analyst or the
informant generates a sequence of sketches or
graphics that represent candidate design concepts
and how they would operate in a simulated
scenario. It enables system developers to receive
user input and feedback early in the concept
development phase.
E

94
Diagram Drawing - The analyst draws a diagram
representing processes in or states of the
informant’s-9 domain. Possible formats include
flow charts, activity charts, and system
state/action state diagrams.
A
Discourse/Conversation/Interaction Analysis -
The interaction between the informant and the
analyst is parsed into statements and categorized.
A
Discrete Event Simulation - A simulation
technique in which system state changes occur
only at event nodes (not continuously). Toolkits
may support network diagramming,
programming, and data analysis. It is often used
to model human tasks. MicroSaint and IPME are
available software tools for this method.
A
Distinguishing Goals - The analyst presents all
pairwise combinations of domain goals to the
informant. The informant lists the characteristics
that distinguish every two goals. The analyst
derives a list of the minimal distinguishing
features of each goal.
E A
Dividing the Domain - The informant describes
evidence or symptoms used in reasoning over
domain problems. The analyst helps group these
to define goals.
E
Drawing Closed Curves - The informant
diagrams the domain by circling concepts to
group them together.
E
Eliciting Estimations of Probability and Utility -
The analyst derives the expected worth of a
decision from the informant’s definition of the
possible consequences of a decision, the value of
the consequences, and the probability of their
occurrence. Bayesian techniques can be applied
to model decision making using these data.
E
EPIC-Executive Process - Interactive Control is
a cognitive architecture for modeling human
performance. Its focus is to improve man-
machine systems by accounting for the timing of
human perceptual, motor, and cognitive activity.
A

95
Event Co-Occurrence/Transition Probabilities -
The analyst estimates the relatedness of events
by examining the frequency with which events
co-occur.
E
Event Trees - The analyst graphs the chain of
events in the informant? s domain. Events can
involve either hardware or humans actions.
A
Exploratory Sequential Data Analysis - ESDA
uses a variety of data analysis techniques for the
empirical analysis of recorded observational
data. The method is focused on research where
the sequence of the informant’s actions is of
primary importance. MacShapa is an available
software tool.
A
Failure Modes and Effects Analysis - The
analyst determines what errors might occur in the
informant’s domain and what the consequences
of such errors would be to the system.
A
Fault Trees - The analyst develops a fault tree
that decomposes an undesired event into causal
events and errors.
A
Field Observations/Ethnographic Methods -
Practitioners are observed and interviewed in the
actual work environment as they perform their
regular work activities.
E
Focus Groups/Joint Application Development -
The analyst acts as a facilitator bringing experts
and end users together in a workshop focused on
solving a given problem. This is conducted in
five phases; project definition, research,
workshop preparation, the workshop, and final
documentation.
E
Focused Observation - The informant performs a
task or solves a problem in the domain. The
analyst observes and documents a specific aspect
of the behavior and environment.
E
Free Association - The informant free-associates
to concepts presented by the analyst. The analyst
groups concepts based on patterns of recall.
E A
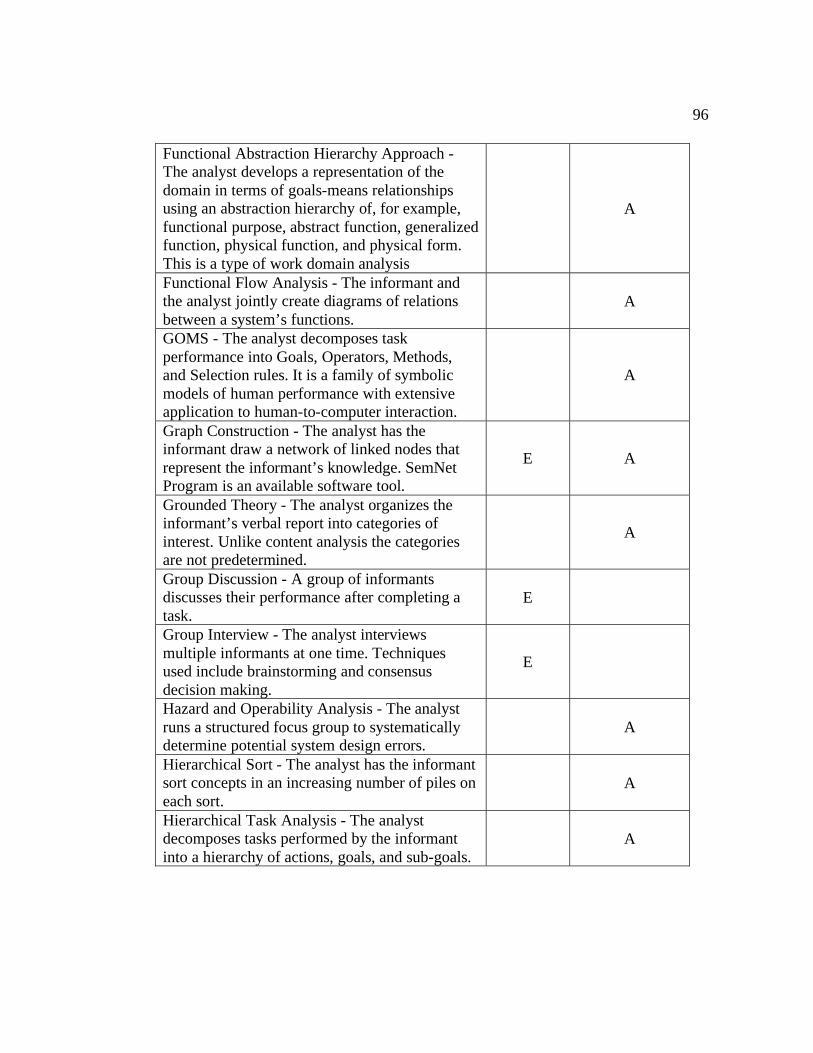
96
Functional Abstraction Hierarchy Approach -
The analyst develops a representation of the
domain in terms of goals-means relationships
using an abstraction hierarchy of, for example,
functional purpose, abstract function, generalized
function, physical function, and physical form.
This is a type of work domain analysis
A
Functional Flow Analysis - The informant and
the analyst jointly create diagrams of relations
between a system’s functions.
A
GOMS - The analyst decomposes task
performance into Goals, Operators, Methods,
and Selection rules. It is a family of symbolic
models of human performance with extensive
application to human-to-computer interaction.
A
Graph Construction - The analyst has the
informant draw a network of linked nodes that
represent the informant’s knowledge. SemNet
Program is an available software tool.
E A
Grounded Theory - The analyst organizes the
informant’s verbal report into categories of
interest. Unlike content analysis the categories
are not predetermined.
A
Group Discussion - A group of informants
discusses their performance after completing a
task.
E
Group Interview - The analyst interviews
multiple informants at one time. Techniques
used include brainstorming and consensus
decision making.
E
Hazard and Operability Analysis - The analyst
runs a structured focus group to systematically
determine potential system design errors.
A
Hierarchical Sort - The analyst has the informant
sort concepts in an increasing number of piles on
each sort.
A
Hierarchical Task Analysis - The analyst
decomposes tasks performed by the informant
into a hierarchy of actions, goals, and sub-goals.
A

97
Identifying Aspects of the Representation - The
analyst generates a structural model. The
informant helps to interpret it by labeling
dimensions, identifying useful levels of
hierarchical cluster diagrams, etc.
E A
Influence Diagrams - The analyst maps the
informant’s domain knowledge as a node-link
graph with concepts on nodes and inter-node
influence on links. Available software tools are
Analytica and DEMOS.
A
Information Flow Analysis - The analyst
develops a flow chart of the information and
decisions required to carry out the system’s
functions. The informant reviews and corrects
the diagram.
A
Interaction Analysis - The informant and analyst
identify the interactions between tasks or events
that impose a constraint on a system
A
Interruption Analysis - The informant thinks
aloud while performing a task. The analyst
interrupts the informant for clarification as
needed. Job Analysis - The analyst identifies the
tasks associated with a specific job.
E A
Laddering - The analyst asks the informant
questions to systematically build a taxonomy of
domain concepts. Likert Scale Items - The
analyst presents the informant with statements
about a task. The informant then rates the
statements on a semantically anchored scale.
E A
Link Analysis - The analyst defines the
relationships or links within and between
informants and system components. The method
is used to optimize these relationships.
A
Magnitude Estimation - The analyst presents the
informant with pairs of concepts. The informant
rates the relatedness of the pair with respect to a
standard reference pair.
E A
Management Oversight Risk Tree Technique -
The analyst uses fault tree diagrams and a
structured accident investigation auditing system
to assess the adequacy of safety management
structures.
A

98
MIDAS - The Man-machine Integration Design
and Analysis System is a computer simulation of
human cognitive and perceptual processes for
modeling human performance and interactions
with systems.
A
Minimal Scenario Technique - The analyst
provides minimal (e.g. a few sentences) about a
scenario or mission and then the informant
requests the information needed to fully
understand the situation.
E
Multidimensional Card Sorting - The analyst has
the informant sort concepts into piles and assign
attributes and labels to each pile.
E A
Multidimensional Scaling - The analyst presents
all combinations of concept pairs for the
informant to rate in terms of proximity. Using
this data the analyst computes a multi-
dimensional spatial layout of the presented
concepts.
E A
Network Scaling - The analyst computationally
generates a graph representing proximities
between concepts. Pathfinder is an available
software tool.
A
Nonverbal Reports - The analyst collects data
concerning an informant’s nonverbal actions
(eye movement, facial expressions, and gestures)
during the performance of a task.
E
OMAR - The Operator Model Architecture is a
set of software tools used to model human
performance and team performance. It has an
agent-based architecture with extensive toolkit
for model creation.
A
Operational Sequence Analysis - The informant
creates diagrams of the system’s functions at a
level of detail that includes decisions and
actions.
A
Operational Sequence Diagrams - The analyst
represents the informant’s domain as a flow chart
that links operations in the order that they are
carried out. The diagram is also supported by a
text description.
A

99
Operator Function Model - OFM describes
and/or prescribes the role of the operator in a
complex system by building a hierarchical and
dynamic visual representation (graph network) of
operator activities and triggering events.
OFMSpert is an executable version of the OFM.
CFM has an OFMBuild component for static
graphs.
E A
P Sort - The analyst has the informant sort
concepts into a fixed number of categories with
limitations on the number of concepts per
category.
E A
Paired Comparison - The informant rates pairs of
concepts with respect to their relatedness or
similarity.
E A
PARI - Informants present problem solving
scenarios to one another. The analyst identifies
the knowledge, information acquisition strategies
and decision-making process that underlie
performance using Precursors, Actions, Results,
and Interpretations to structure observations.
E
Process Tracing/Protocol Analysis - A set of
techniques that attempt to trace the cognitive and
decision-making process of an individual or team
as they work through a problem or scenario.
E A
Q Sort - The analyst presents the informant with
concepts. The informant sorts them into piles
based on relatedness.
E
Questionnaires - The analyst provides the
informant with a list of open-ended questions
regarding concepts, attributes, and relations in
the domain.
E
Reclassification/ Goal Decomposition - The
informant describes goals or outcomes in the
domain. The analyst and informant work
backward to define the events, evidence, or
symptoms that lead to each goal or outcome.
E A
Repeated Sort - The analyst performs a Q sort
multiple times with the requirement that one or
more piles differ from the previous sort
E A
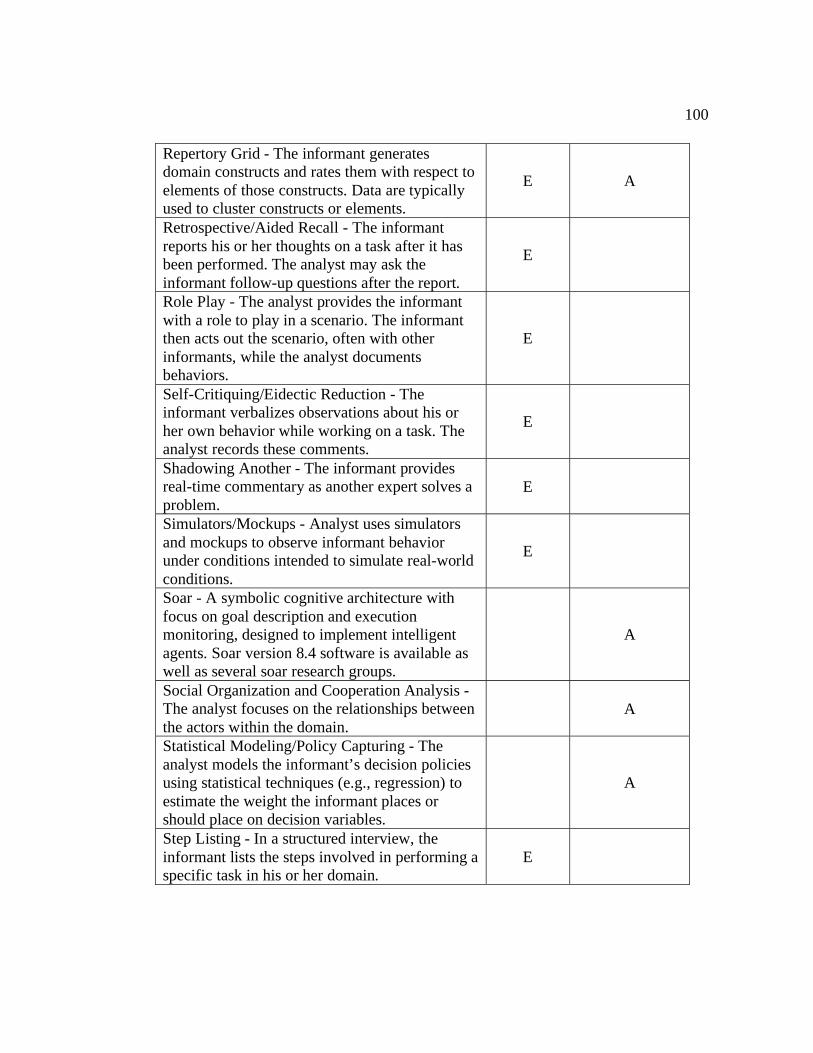
100
Repertory Grid - The informant generates
domain constructs and rates them with respect to
elements of those constructs. Data are typically
used to cluster constructs or elements.
E A
Retrospective/Aided Recall - The informant
reports his or her thoughts on a task after it has
been performed. The analyst may ask the
informant follow-up questions after the report.
E
Role Play - The analyst provides the informant
with a role to play in a scenario. The informant
then acts out the scenario, often with other
informants, while the analyst documents
behaviors.
E
Self-Critiquing/Eidectic Reduction - The
informant verbalizes observations about his or
her own behavior while working on a task. The
analyst records these comments.
E
Shadowing Another - The informant provides
real-time commentary as another expert solves a
problem.
E
Simulators/Mockups - Analyst uses simulators
and mockups to observe informant behavior
under conditions intended to simulate real-world
conditions.
E
Soar - A symbolic cognitive architecture with
focus on goal description and execution
monitoring, designed to implement intelligent
agents. Soar version 8.4 software is available as
well as several soar research groups.
A
Social Organization and Cooperation Analysis -
The analyst focuses on the relationships between
the actors within the domain.
A
Statistical Modeling/Policy Capturing - The
analyst models the informant’s decision policies
using statistical techniques (e.g., regression) to
estimate the weight the informant places or
should place on decision variables.
A
Step Listing - In a structured interview, the
informant lists the steps involved in performing a
specific task in his or her domain.
E

101
Strategies Analysis - The analyst focuses on the
strategies used to achieve goals in the domain.
These strategies are independent of individual
actors.
A
Structural Analysis Techniques - he analyst uses
a mathematical algorithm to transform the
informant’s concept relatedness measures into a
graphical representation of the
domain.(Knowledge Network Organizing Tool ,
KNOT)
A
Structured Observation - The informant performs
a task or solves a problem in the domain. The
analyst interprets the actions using a taxonomy
or classification scheme developed a priori.
E
Table-Top Analysis - The analyst presents a
group of informants with a scenario to play out
or discuss. The team derives a solution to the
problem presented.
E
Task Analysis - The analyst breaks tasks down
into a series of external, observable behaviors. E
Teachback - The informant explains a concept to
the analyst. The analyst then explains the
concept back to the informant. This continues
until the informant is satisfied with the analyst’s
understanding of the concept.
E
Think-Aloud - The informant introspects about
perceptions, decisions, and actions while
performing a task. The analyst records these
statements.
E
Time Line Analysis - The analyst determines
time critical sequences of tasks using the
informant’s definition of the temporal
relationships of tasks.
A
Triad Comparison - The analyst elicits domain
constructs by presenting the informant with three
concepts to be compared. The informant selects
the concept most unlike the other two and states
a construct that characterizes the two similar
concepts.
E

102
Unstructured Interview - The informant is
interviewed, typically concerning a given
scenario or personal past experience. The
analyst? s questions are ad hoc and lines of
questioning are opportunistic.
E
Walk-Throughs and Talk-Throughs - The
informant demonstrates a task in situ or in a
realistic mock-up for the analyst. When
performing a talk-through the informant is
removed from realistic surroundings and merely
verbalizes the demonstration.
E
Work Domain Analysis - The analyst examines
the system controlled by the informant to
understand the work domain (independent of the
worker and any events, tasks, goals, or
interfaces).
A
Worker Competency Analysis - The analyst
focuses on the knowledge and skills required of
an individual to act effectively within the
domain.
A
Workflow Model - The analyst sets up a scenario
and the informant works or talks it through to
completion. The analyst elicits terms, processes,
and concepts.
A
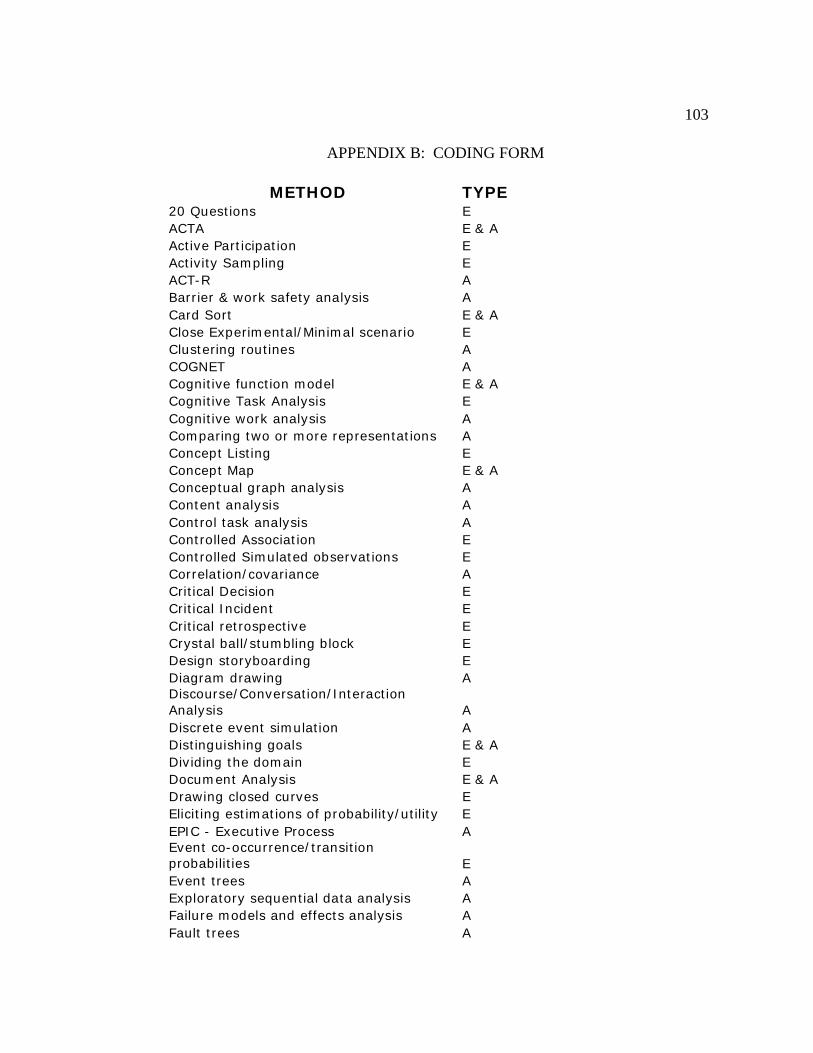
103
APPENDIX B: CODING FORM
METHOD TYPE
20 Questions E
ACTA E & A
Active Participation E
Activity Sampling E
ACT-R A
Barrier & work safety analysis A
Card Sort E & A
Close Experimental/Minimal scenario E
Clustering routines A
COGNET A
Cognitive function model E & A
Cognitive Task Analysis E
Cognitive work analysis A
Comparing two or more representations A
Concept Listing E
Concept Map E & A
Conceptual graph analysis A
Content analysis A
Control task analysis A
Controlled Association E
Controlled Simulated observations E
Correlation/covariance A
Critical Decision E
Critical Incident E
Critical retrospective E
Crystal ball/stumbling block E
Design storyboarding E
Diagram drawing A
Discourse/Conversation/Interaction
Analysis A
Discrete event simulation A
Distinguishing goals E & A
Dividing the domain E
Document Analysis E & A
Drawing closed curves E
Eliciting estimations of probability/utility E
EPIC - Executive Process A
Event co-occurrence/transition
probabilities E
Event trees A
Exploratory sequential data analysis A
Failure models and effects analysis A
Fault trees A
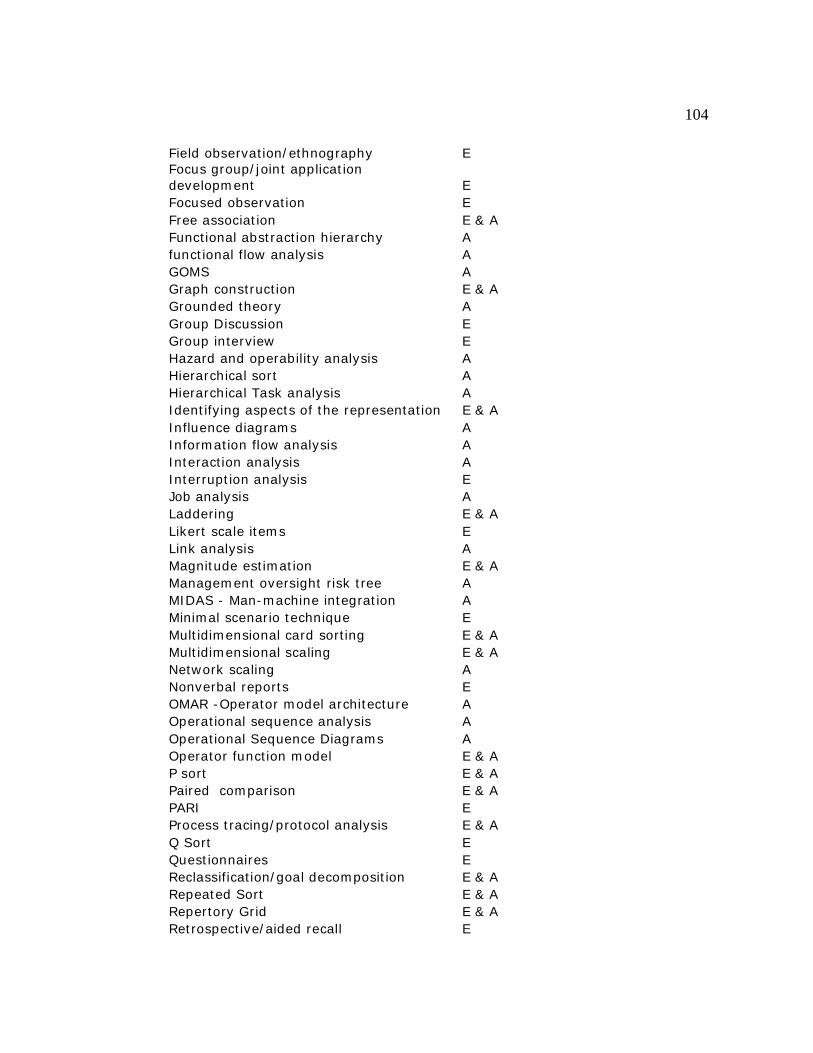
104
Field observation/ethnography E
Focus group/joint application
development E
Focused observation E
Free association E & A
Functional abstraction hierarchy A
functional flow analysis A
GOMS A
Graph construction E & A
Grounded theory A
Group Discussion E
Group interview E
Hazard and operability analysis A
Hierarchical sort A
Hierarchical Task analysis A
Identifying aspects of the representation E & A
Influence diagrams A
Information flow analysis A
Interaction analysis A
Interruption analysis E
Job analysis A
Laddering E & A
Likert scale items E
Link analysis A
Magnitude estimation E & A
Management oversight risk tree A
MIDAS - Man-machine integration A
Minimal scenario technique E
Multidimensional card sorting E & A
Multidimensional scaling E & A
Network scaling A
Nonverbal reports E
OMAR -Operator model architecture A
Operational sequence analysis A
Operational Sequence Diagrams A
Operator function model E & A
P sort E & A
Paired comparison E & A
PARI E
Process tracing/protocol analysis E & A
Q Sort E
Questionnaires E
Reclassification/goal decomposition E & A
Repeated Sort E & A
Repertory Grid E & A
Retrospective/aided recall E

105
Role play E
Self-critiquing E
Semi-structured Interview E
Shadowing another E
Simulators/Mockups E
SOAR A
Social organization A
Statistical modeling/policy capturing A
Step listing E
Strategies analysis A
Structural analysis techniques A
Structured Interview E
Structured observation E
Table-top analysis E
Task analysis E
Teach back E
Think-aloud E
Time line analysis A
Triad comparison E
Unstructured interview E
Walk-throughs/talk-throughs E
Work domain analysis A
Worker competency analysis A
Workflow model A
Declarative Knowledge (X)
Concept (X)
Process (X)
Principle (X)
Procedural Knowledge (X)
Classify (X)
Change (X)
Sensitivity to Automated knowledge (Y or N)
Application of final results:

106
APPENDIX C: FEQUENCY RANKINGS OF CTA METHODS
Method Frequency % Cum %
Structured interview 135 14.98% 14.98%
Concept map 79 8.77% 23.75%
Verbal Think-aloud 65 7.21% 30.97%
Process tracing 54 5.99% 36.96%
Repertory/laddered Grid 50 5.55% 42.51%
Observation 33 3.66% 46.17%
Hierarchical analysis 28 3.11% 49.28%
Card sorting 27 3.00% 52.28%
Document analysis 26 2.89% 55.16%
Cdm/cim 25 2.77% 57.94%
Unstructured interview 24 2.66% 60.60%
Case based scenarios 21 2.33%
Kads/kat 21 2.33%
Neural network 17 1.89%
Model-based approaches 16 1.78%
Fuzzy logic/cognitive map/rule analysis 15 1.66%
Machine induction/learning 14 1.55%
Simulation 14 1.55%
Prototype analysis 11 1.22%
Questionnaire 11 1.22%
Goms 10 1.11%
Workshop/group collaboration 10 1.11%
Induction 9 1.00%
Structural analysis 9 1.00%
Acta 7 0.78%
Computer modeling 7 0.78%
Content analysis 7 0.78%
Linguistic analysis 7 0.78%
Simulation 6 0.67%
Hypermedia/hypertext 5 0.55%
Information processing cognitive modeling
based 4 0.44%
Mapping - causal or other 4 0.44%
Pathfinder 4 0.44%
Process tracing with eye movements 4 0.44%
COGENT; macshapa; cognitive models 3 0.33%
Computer learning 3 0.33%
Decision table/trees 3 0.33%
Grounded theory 3 0.33%

107
Semantic networks; 3 0.33%
20 questions 2 0.22%
Artificial intelligence methods 2 0.22%
Exception graphs/to rules 2 0.22%
Itam 2 0.22%
Matrices 2 0.22%
Natural language processing 2 0.22%
Pairwise comparisons 2 0.22%
Rating and sorting 2 0.22%
Teachback 2 0.22%
Ternary grid 2 0.22%
Abstract object types 1 0.11%
Active software 1 0.11%
Agent ontology 1 0.11%
AI techniques; data mining 1 0.11%
Anthropological interview 1 0.11%
Appreciative inquiry method (aim) 1 0.11%
Apt 1 0.11%
Artefact ananlysis 1 0.11%
Automated graphical knowledge acquisition
tool 1 0.11%
Automatic rule induction 1 0.11%
Checking software using different data 1 0.11%
C-KAT; self-administered 1 0.11%
Cognitive mapping 1 0.11%
Coherence method 1 0.11%
Computer aided knowledge elicitation
(CAKE) 1 0.11%
Computer assisted failure gathering data 1 0.11%
Computer-aided software engineering
(CASE) 1 0.11%
Computer-assisted (EID) ecological
interface design 1 0.11%
Computer-assisted expert systems 1 0.11%
Computer-based knowledge acquisition 1 0.11%
Computer-expert interaction 1 0.11%
Concurrent conceptual design (CCD) 1 0.11%
Consultation reviews 1 0.11%
Core 1 0.11%
Critiquing novices processes 1 0.11%
CTAT (cognitive tutor authoring tools); 1 0.11%
Data mining 1 0.11%
Decision support system (dss) 1 0.11%

108
Distributed knowledge elicitation 1 0.11%
DKA; diagrammatic knowledge acquisition 1 0.11%
DNA; computer-assisted semi-structured
dialog 1 0.11%
Ellipsoids 1 0.11%
Enterprise model 1 0.11%
Ethnography 1 0.11%
Expert critiquing 1 0.11%
Expert-machine interaction 1 0.11%
FMS status data 1 0.11%
Genetic algorithm generates the rules, 1 0.11%
Graphical knowledge editing. 1 0.11%
Graphs for statistical object models 1 0.11%
HAZOP, CCA and FMEA techniques 1 0.11%
ID3 rule generation system; decision tree 1 0.11%
Interactive argument 1 0.11%
Interactive computer for constructs 1 0.11%
Interactive computer graphics 1 0.11%
Interactive computer-based aid for
knowledge elicitation 1 0.11%
Journal entries 1 0.11%
KAVE: computer-assisted interactive rule
acquisition 1 0.11%
Kept 1 0.11%
Knowledge importance evaluation 1 0.11%
KSM (knowledge specification modeller);
linguistic engineering 1 0.11%
Language modeling and simulation 1 0.11%
Learner-machine-expert interaction 1 0.11%
Logical spreadsheet 1 0.11%
Logs; 1 0.11%
Madam; 1 0.11%
Maps of spatial hypertext; reconfigurable
information spaces 1 0.11%
Matching scores of templates created 1 0.11%
Mathematical simulation and inductive
machine learning 1 0.11%
Mental models 1 0.11%
Multi-attribute decision-making; DECMAK 1 0.11%
Naturalistic decision making 1 0.11%
Naturalistic decision making (NDM) 1 0.11%
Notation in AI 1 0.11%
Object-oriented framework 1 0.11%

109
Ordered beliefs 1 0.11%
Pattern recognition 1 0.11%
PCS, participant construct system 1 0.11%
Perceptual control theory (pct) 1 0.11%
Peski 1 0.11%
Point estimation, interval estimation 1 0.11%
Position analysis questionnaire (paq) 1 0.11%
Purdue; questionnaire; PAQ 1 0.11%
RAKES using artificial intelligence 1 0.11%
Reciprocal knowledge exchange through
structured argumentative discourses 1 0.11%
RPD- Recognition Primed Decision-making 1 0.11%
Sakas 1 0.11%
Schema-based hierarchy of templates 1 0.11%
Self-report paired comparison response
latency 1 0.11%
Service constraints in telecommunications
services 1 0.11%
Skill-based CTA 1 0.11%
TACOS; tactics acquisition and
operationalization system 1 0.11%
Tagging images; classifying 1 0.11%
Time-scale oriented approach 1 0.11%
TMS; truth maintenance system 1 0.11%
VEGAN a form of associated networks 1 0.11%
Visual knowledge elicitation technique 1 0.11%
Total 901

110
APPENDIX D: SUMMARY OF CTA METHOD PAIRINGS
Method Pairing Frequency Cum Freq Percentage
E_PA * A_PA 44 44 4.4%
E_DocAnl * A_DocAnl 32 76 7.5%
E_Think * A_PA 25 101 10.0%
E_Semi * A_Diag 21 122 12.1%
E_ConMap * A_ConMap 20 142 14.1%
E_RpGrid * A_RpGrid 18 160 15.8%
E_DocAnl * A_Diag 17 177 17.5%
E_Semi * A_ConAnl 17 194 19.2%
E_Card * A_Card 13 207 20.5%
E_Semi * A_PA 13 220 21.8%
E_GrpInt * A_Diag 12 232 23.0%
E_Semi * A_DocAnl 12 244 24.2%
E_Struct * A_Diag 12 256 25.3%
E_PA * A_Diag 11 267 26.4%
E_DocAnl * A_ConAnl 9 276 27.3%
E_CDM * A_PA 8 284 28.1%
E_DocAnl * A_PA 8 292 28.9%
E_PA * A_ConAnl 8 300 29.7%
E_PA * A_DocAnl 8 308 30.5%
E_Think * A_ConAnl 8 316 31.3%
E_Think * A_DocAnl 8 324 32.1%
E_cta * A_ConAnl 7 331 32.8%
E_Ident * A_Ident 7 338 33.5%
E_PA * A_Htask 7 345 34.2%
E_Retro * A_PA 7 352 34.9%
E_Semi * A_InfFlo 7 359 35.5%
E_Struct * A_ConAnl 7 366 36.2%
E_cta * A_DocAnl 6 372 36.8%
E_cta * A_PA 6 378 37.4%
E_Field * A_DocAnl 6 384 38.0%
E_GrpInt * A_ConAnl 6 390 38.6%
E_Ladd * A_Ladd 6 396 39.2%
E_Quest * A_Diag 6 402 39.8%
E_Retro * A_Diag 6 408 40.4%
E_Struct * A_PA 6 414 41.0%
E_Think * A_Diag 6 420 41.6%
E_UnIntv * A_Diag 6 426 42.2%
E_UnIntv * A_DocAnl 6 432 42.8%
E_cta * A_Diag 5 437 43.3%

111
E_Field * A_PA 5 442 43.8%
E_GrpInt * A_DocAnl 5 447 44.3%
E_MDS * A_MDS 5 452 44.8%
E_Semi * A_ConMap 5 457 45.2%
E_Semi * A_Htask 5 462 45.7%
E_Struct * A_Ident 5 467 46.2%
E_Struct * A_RpGrid 5 472 46.7%
E_Card * A_MCS 4 476 47.1%
E_ConLis * A_Diag 4 480 47.5%
E_ConMap * A_Diag 4 484 47.9%
E_DocAnl * A_ConGra 4 488 48.3%
E_Field * A_ConAnl 4 492 48.7%
E_Focus * A_DocAnl 4 496 49.1%
E_Graph * A_Graph 4 500 49.5%
E_GrpInt * A_PA 4 504 49.9%
E_Likert * A_Diag 4 508 50.3%
E_MCS * A_Card 4 512 50.7%
E_MCS * A_MCS 4 516 51.1%
E_Pair * A_Pair 4 520 51.5%
E_PA * A_RpGrid 4 524 51.9%
E_Quest * A_ConAnl 4 528 52.3%
E_RpGrid * A_PA 4 532 52.7%
E_Retro * A_ConAnl 4 536 53.1%
E_Semi * A_Card 4 540 53.5%
E_Struct * A_DocAnl 4 544 53.9%
E_Think * A_Htask 4 548 54.3%
E_UnIntv * A_PA 4 552 54.7%
E_Card * A_Clust 3 555 55.0%
E_Card * A_DocAnl 3 558 55.2%
E_Card * A_RpGrid 3 561 55.5%
E_cta * A_InfFlo 3 564 55.8%
E_ConLis * A_ConGra 3 567 56.1%
E_ConMap * A_ConAnl 3 570 56.4%
E_ConMap * A_DocAnl 3 573 56.7%
E_DocAnl * A_Card 3 576 57.0%
E_DocAnl * A_ConMap 3 579 57.3%
E_DocAnl * A_WkFlow 3 582 57.6%
E_Field * A_Diag 3 585 57.9%
E_Focus * A_ConAnl 3 588 58.2%
E_GrpInt * A_WkFlow 3 591 58.5%
E_Ident * A_Diag 3 594 58.8%
E_Ladd * A_RpGrid 3 597 59.1%
E_Likert * A_ConAnl 3 600 59.4%

112
E_Likert * A_Net 3 603 59.7%
E_PA * A_ConGra 3 606 60.0%
E_RpGrid * A_Card 3 609 60.3%
E_RpGrid * A_Ladd 3 612 60.6%
E_Semi * A_RpGrid 3 615 60.9%
E_Semi * A_Stat 3 618 61.2%
E_Simul * A_Diag 3 621 61.5%
E_Struct * A_ConMap 3 624 61.8%
E_Struct * A_WkFlow 3 627 62.1%
E_Think * A_RpGrid 3 630 62.4%
E_20Q * A_ConAnl 2 632 62.6%
E_Card * A_ConAnl 2 634 62.8%
E_Card * A_Graph 2 636 63.0%
E_Card * A_Ladd 2 638 63.2%
E_Card * A_MDS 2 640 63.4%
E_Card * A_Repeat 2 642 63.6%
E_Card * A_Stat 2 644 63.8%
E_cogfn * A_cogfn 2 646 64.0%
E_cta * A_Htask 2 648 64.2%
E_cta * A_Ident 2 650 64.4%
E_ConLis * A_ConAnl 2 652 64.6%
E_ConMap * A_Clust 2 654 64.8%
E_ConMap * A_Stat 2 656 65.0%
E_ConMap * A_StruAn 2 658 65.1%
E_CDM * A_DocAnl 2 660 65.3%
E_DocAnl * A_Clust 2 662 65.5%
E_DocAnl * A_Ground 2 664 65.7%
E_DocAnl * A_Htask 2 666 65.9%
E_DocAnl * A_InfFlo 2 668 66.1%
E_DocAnl * A_MDS 2 670 66.3%
E_DocAnl * A_StruAn 2 672 66.5%
E_Field * A_ConMap 2 674 66.7%
E_Focus * A_Diag 2 676 66.9%
E_Focus * A_Ident 2 678 67.1%
E_Graph * A_Card 2 680 67.3%
E_GrpInt * A_ConMap 2 682 67.5%
E_GrpInt * A_Ident 2 684 67.7%
E_GrpInt * A_StruAn 2 686 67.9%
E_Ident * A_WkFlow 2 688 68.1%
E_Interp * A_PA 2 690 68.3%
E_Ladd * A_Card 2 692 68.5%
E_Ladd * A_cor 2 694 68.7%
E_Ladd * A_Diag 2 696 68.9%

113
E_Ladd * A_PA 2 698 69.1%
E_Likert * A_ConMap 2 700 69.3%
E_Likert * A_InfFlo 2 702 69.5%
E_Likert * A_PA 2 704 69.7%
E_MCS * A_MDS 2 706 69.9%
E_MDS * A_Card 2 708 70.1%
E_MDS * A_DocAnl 2 710 70.3%
E_MDS * A_MCS 2 712 70.5%
E_PA * A_COGNE 2 714 70.7%
E_PA * A_Ground 2 716 70.9%
E_PA * A_InfFlo 2 718 71.1%
E_PA * A_Ladd 2 720 71.3%
E_PA * A_WkFlow 2 722 71.5%
E_Qsort * A_ConAnl 2 724 71.7%
E_Qsort * A_Diag 2 726 71.9%
E_Quest * A_ConMap 2 728 72.1%
E_Quest * A_InfFlo 2 730 72.3%
E_Quest * A_Stat 2 732 72.5%
E_Repeat * A_Card 2 734 72.7%
E_Repeat * A_Repeat 2 736 72.9%
E_RpGrid * A_Diag 2 738 73.1%
E_RpGrid * A_InfFlo 2 740 73.3%
E_RpGrid * A_Stat 2 742 73.5%
E_RpGrid * A_StruAn 2 744 73.7%
E_Retro * A_ConMap 2 746 73.9%
E_Retro * A_Htask 2 748 74.1%
E_Semi * A_Clust 2 750 74.3%
E_Semi * A_ConGra 2 752 74.5%
E_Semi * A_Ground 2 754 74.7%
E_Semi * A_Ladd 2 756 74.9%
E_Simul * A_ConAnl 2 758 75.0%
E_Simul * A_InfFlo 2 760 75.2%
E_Struct * A_Card 2 762 75.4%
E_Struct * A_Clust 2 764 75.6%
E_Struct * A_Ground 2 766 75.8%
E_Teach * A_ConAnl 2 768 76.0%
E_Teach * A_Diag 2 770 76.2%
E_UnIntv * A_Card 2 772 76.4%
E_UnIntv * A_ConAnl 2 774 76.6%
E_UnIntv * A_Ident 2 776 76.8%
E_UnIntv * A_WkFlow 2 778 77.0%
E_20Q * A_Card 1 779 77.1%
E_20Q * A_Diag 1 780 77.2%
114
E_20Q * A_PA 1 781 77.3%
E_Card * A_Diag 1 782 77.4%
E_Card * A_Ground 1 783 77.5%
E_Card * A_Hsort 1 784 77.6%
E_Card * A_Htask 1 785 77.7%
E_Card * A_InfFlo 1 786 77.8%
E_Card * A_PA 1 787 77.9%
E_cogfn * A_cwa 1 788 78.0%
E_cogfn * A_ConMap 1 789 78.1%
E_cogfn * A_ConAnl 1 790 78.2%
E_cogfn * A_Diag 1 791 78.3%
E_cogfn * A_DocAnl 1 792 78.4%
E_cogfn * A_Funct 1 793 78.5%
E_cta * A_Card 1 794 78.6%
E_cta * A_ConMap 1 795 78.7%
E_cta * A_Ground 1 796 78.8%
E_cta * A_Pair 1 797 78.9%
E_cta * A_Stat 1 798 79.0%
E_cta * A_StraAn 1 799 79.1%
E_ConLis * A_cor 1 800 79.2%
E_ConLis * A_DocAnl 1 801 79.3%
E_ConLis * A_EvTree 1 802 79.4%
E_ConLis * A_Ground 1 803 79.5%
E_ConLis * A_InfDia 1 804 79.6%
E_ConLis * A_IntAna 1 805 79.7%
E_ConLis * A_Ladd 1 806 79.8%
E_ConLis * A_PA 1 807 79.9%
E_ConLis * A_StruAn 1 808 80.0%
E_ConMap * A_cogfn 1 809 80.1%
E_ConMap * A_ConGra 1 810 80.2%
E_ConMap * A_Fault 1 811 80.3%
E_ConMap * A_Funct 1 812 80.4%
E_ConMap * A_GOMS 1 813 80.5%
E_ConMap * A_Hsort 1 814 80.6%
E_ConMap * A_Ident 1 815 80.7%
E_ConMap * A_InfDia 1 816 80.8%
E_ConMap * A_Net 1 817 80.9%
E_ConMap * A_PA 1 818 81.0%
E_ConMap * A_WkFlow 1 819 81.1%
E_CDM * A_Card 1 820 81.2%
E_CDM * A_ConMap 1 821 81.3%
E_CDM * A_ConGra 1 822 81.4%
E_CDM * A_Diag 1 823 81.5%

115
E_CDM * A_Ground 1 824 81.6%
E_CDM * A_Htask 1 825 81.7%
E_crit * A_ConAnl 1 826 81.8%
E_crit * A_PA 1 827 81.9%
E_design * A_cogfn 1 828 82.0%
E_design * A_ConMap 1 829 82.1%
E_DocAnl * A_cogfn 1 830 82.2%
E_DocAnl * A_cwa 1 831 82.3%
E_DocAnl * A_cor 1 832 82.4%
E_DocAnl * A_Funct 1 833 82.5%
E_DocAnl * A_Graph 1 834 82.6%
E_DocAnl * A_Ident 1 835 82.7%
E_DocAnl * A_MCS 1 836 82.8%
E_DocAnl * A_OpSqAn 1 837 82.9%
E_DocAnl * A_OFM 1 838 83.0%
E_DocAnl * A_RpGrid 1 839 83.1%
E_DocAnl * A_Stat 1 840 83.2%
E_DocAnl * A_StraAn 1 841 83.3%
E_Elict * A_ConAnl 1 842 83.4%
E_Elict * A_Diag 1 843 83.5%
E_Event * A_ConMap 1 844 83.6%
E_Event * A_Stat 1 845 83.7%
E_Event * A_StruAn 1 846 83.8%
E_Field * A_Ground 1 847 83.9%
E_Field * A_Htask 1 848 84.0%
E_Field * A_MDS 1 849 84.1%
E_Field * A_Net 1 850 84.2%
E_Field * A_OpSqAn 1 851 84.3%
E_Field * A_SOAR 1 852 84.4%
E_Field * A_StraAn 1 853 84.5%
E_Field * A_WkFlow 1 854 84.6%
E_Focus * A_ConMap 1 855 84.7%
E_Focus * A_InfFlo 1 856 84.8%
E_Focus * A_OFM 1 857 84.9%
E_Focus * A_WkDoAn 1 858 85.0%
E_Focus * A_WkFlow 1 859 85.0%
E_Free * A_Free 1 860 85.1%
E_Free * A_InfDia 1 861 85.2%
E_Free * A_Pair 1 862 85.3%
E_Graph * A_DocAnl 1 863 85.4%
E_Graph * A_Hsort 1 864 85.5%
E_Graph * A_Htask 1 865 85.6%
E_Graph * A_MCS 1 866 85.7%
116
E_Graph * A_MDS 1 867 85.8%
E_Graph * A_Stat 1 868 85.9%
E_GrpDis * A_ConMap 1 869 86.0%
E_GrpDis * A_ConAnl 1 870 86.1%
E_GrpDis * A_Diag 1 871 86.2%
E_GrpDis * A_DocAnl 1 872 86.3%
E_GrpDis * A_PA 1 873 86.4%
E_GrpInt * A_Ground 1 874 86.5%
E_GrpInt * A_Htask 1 875 86.6%
E_GrpInt * A_InfDia 1 876 86.7%
E_GrpInt * A_InfFlo 1 877 86.8%
E_GrpInt * A_RpGrid 1 878 86.9%
E_GrpInt * A_Stat 1 879 87.0%
E_GrpInt * A_TimeLn 1 880 87.1%
E_Ident * A_Clust 1 881 87.2%
E_Ident * A_ConMap 1 882 87.3%
E_Ident * A_ConAnl 1 883 87.4%
E_Ident * A_DocAnl 1 884 87.5%
E_Ident * A_Htask 1 885 87.6%
E_Ident * A_MDS 1 886 87.7%
E_Ident * A_RpGrid 1 887 87.8%
E_Interp * A_ConAnl 1 888 87.9%
E_Interp * A_Diag 1 889 88.0%
E_Interp * A_DocAnl 1 890 88.1%
E_Interp * A_Ground 1 891 88.2%
E_Interp * A_StraAn 1 892 88.3%
E_Ladd * A_ConGra 1 893 88.4%
E_Ladd * A_ConAnl 1 894 88.5%
E_Ladd * A_Ground 1 895 88.6%
E_Ladd * A_Stat 1 896 88.7%
E_Likert * A_Card 1 897 88.8%
E_Likert * A_cor 1 898 88.9%
E_Likert * A_DocAnl 1 899 89.0%
E_Likert * A_Htask 1 900 89.1%
E_Likert * A_Ident 1 901 89.2%
E_Likert * A_Ladd 1 902 89.3%
E_Likert * A_MDS 1 903 89.4%
E_Likert * A_RpGrid 1 904 89.5%
E_Likert * A_Stat 1 905 89.6%
E_Likert * A_WkFlow 1 906 89.7%
E_MCS * A_Clust 1 907 89.8%
E_MCS * A_ConAnl 1 908 89.9%
E_MCS * A_DocAnl 1 909 90.0%

117
E_MCS * A_Graph 1 910 90.1%
E_MCS * A_Repeat 1 911 90.2%
E_MDS * A_Clust 1 912 90.3%
E_MDS * A_Graph 1 913 90.4%
E_MDS * A_Htask 1 914 90.5%
E_MDS * A_Ident 1 915 90.6%
E_MDS * A_Net 1 916 90.7%
E_MDS * A_OpSqAn 1 917 90.8%
E_MDS * A_RpGrid 1 918 90.9%
E_Nonver * A_PA 1 919 91.0%
E_OFM * A_DocAnl 1 920 91.1%
E_OFM * A_OFM 1 921 91.2%
E_Pair * A_ConAnl 1 922 91.3%
E_Pair * A_Free 1 923 91.4%
E_Pair * A_Hsort 1 924 91.5%
E_Pair * A_InfDia 1 925 91.6%
E_Pair * A_RpGrid 1 926 91.7%
E_PARI * A_COGNE 1 927 91.8%
E_PARI * A_PA 1 928 91.9%
E_PA * A_Card 1 929 92.0%
E_PA * A_ConMap 1 930 92.1%
E_PA * A_cor 1 931 92.2%
E_PA * A_Stat 1 932 92.3%
E_Qsort * A_ConGra 1 933 92.4%
E_Qsort * A_Ground 1 934 92.5%
E_Qsort * A_Ladd 1 935 92.6%
E_Qsort * A_PA 1 936 92.7%
E_Quest * A_Fail 1 937 92.8%
E_Quest * A_Fault 1 938 92.9%
E_Quest * A_Ident 1 939 93.0%
E_Quest * A_Net 1 940 93.1%
E_Quest * A_OpSqAn 1 941 93.2%
E_Quest * A_WkFlow 1 942 93.3%
E_Repeat * A_Clust 1 943 93.4%
E_Repeat * A_MCS 1 944 93.5%
E_RpGrid * A_cor 1 945 93.6%
E_RpGrid * A_DocAnl 1 946 93.7%
E_RpGrid * A_Htask 1 947 93.8%
E_RpGrid * A_Ident 1 948 93.9%
E_RpGrid * A_MDS 1 949 94.0%
E_RpGrid * A_Net 1 950 94.1%
E_RpGrid * A_Pair 1 951 94.2%
E_Retro * A_DocAnl 1 952 94.3%
118
E_Retro * A_Ground 1 953 94.4%
E_Retro * A_InfFlo 1 954 94.5%
E_Retro * A_Stat 1 955 94.6%
E_Semi * A_cogfn 1 956 94.7%
E_Semi * A_cwa 1 957 94.8%
E_Semi * A_comp2 1 958 94.9%
E_Semi * A_Funct 1 959 95.0%
E_Semi * A_Hsort 1 960 95.0%
E_Semi * A_Ident 1 961 95.1%
E_Semi * A_Job 1 962 95.2%
E_Semi * A_Net 1 963 95.3%
E_Semi * A_OFM 1 964 95.4%
E_Semi * A_Pair 1 965 95.5%
E_Semi * A_StraAn 1 966 95.6%
E_Semi * A_TimeLn 1 967 95.7%
E_Simul * A_Card 1 968 95.8%
E_Simul * A_DocAnl 1 969 95.9%
E_Simul * A_Ground 1 970 96.0%
E_Simul * A_MDS 1 971 96.1%
E_Simul * A_Net 1 972 96.2%
E_Struct * A_cor 1 973 96.3%
E_Struct * A_Fault 1 974 96.4%
E_Struct * A_GOMS 1 975 96.5%
E_Struct * A_Htask 1 976 96.6%
E_Struct * A_InfFlo 1 977 96.7%
E_Struct * A_Ladd 1 978 96.8%
E_Struct * A_MDS 1 979 96.9%
E_Struct * A_Net 1 980 97.0%
E_Struct * A_StraAn 1 981 97.1%
E_StObvs * A_ConAnl 1 982 97.2%
E_Table * A_Diag 1 983 97.3%
E_Table * A_InfDia 1 984 97.4%
E_TaskAn * A_Diag 1 985 97.5%
E_TaskAn * A_Ground 1 986 97.6%
E_Teach * A_comp2 1 987 97.7%
E_Teach * A_Stat 1 988 97.8%
E_Think * A_Card 1 989 97.9%
E_Think * A_COGNE 1 990 98.0%
E_Think * A_ConGra 1 991 98.1%
E_Think * A_cor 1 992 98.2%
E_Think * A_Graph 1 993 98.3%
E_Think * A_Ground 1 994 98.4%
E_Think * A_Ladd 1 995 98.5%

119
E_Think * A_MCS 1 996 98.6%
E_Think * A_MDS 1 997 98.7%
E_Think * A_Net 1 998 98.8%
E_Think * A_Stat 1 999 98.9%
E_Think * A_WkDoAn 1 1000 99.0%
E_Think * A_WkFlow 1 1001 99.1%
E_Traid * A_RpGrid 1 1002 99.2%
E_Traid * A_StruAn 1 1003 99.3%
E_UnIntv * A_ConMap 1 1004 99.4%
E_UnIntv * A_Graph 1 1005 99.5%
E_UnIntv * A_Ground 1 1006 99.6%
E_UnIntv * A_InfFlo 1 1007 99.7%
E_UnIntv * A_MCS 1 1008 99.8%
E_UnIntv * A_MDS 1 1009 99.9%
E_UnIntv * A_WkDoAn 1 1010 100.0%
E_20Q * A_Clust 0
E_20Q * A_COGNE 0
E_20Q * A_cogfn 0
E_20Q * A_cwa 0
E_20Q * A_comp2 0
E_20Q * A_ConMap 0
E_20Q * A_ConGra 0
E_20Q * A_cor 0
E_20Q * A_DocAnl 0
E_20Q * A_EvTree 0
E_20Q * A_Fail 0
E_20Q * A_Fault 0
E_20Q * A_Free 0
E_20Q * A_Funct 0
E_20Q * A_GOMS 0
E_20Q * A_Graph 0
E_20Q * A_Ground 0
E_20Q * A_Hsort 0
E_20Q * A_Htask 0
E_20Q * A_Ident 0
E_20Q * A_InfDia 0
E_20Q * A_InfFlo 0
E_20Q * A_IntAna 0
E_20Q * A_Job 0
E_20Q * A_Ladd 0
E_20Q * A_MCS 0
E_20Q * A_MDS 0
E_20Q * A_Net 0
120
E_20Q * A_OpSqAn 0
E_20Q * A_OFM 0
E_20Q * A_Pair 0
E_20Q * A_Repeat 0
E_20Q * A_RpGrid 0
E_20Q * A_SOAR 0
E_20Q * A_Stat 0
E_20Q * A_StraAn 0
E_20Q * A_StruAn 0
E_20Q * A_TimeLn 0
E_20Q * A_WkDoAn 0
E_20Q * A_WkFlow 0
E_Card * A_COGNE 0
E_Card * A_cogfn 0
E_Card * A_cwa 0
E_Card * A_comp2 0
E_Card * A_ConMap 0
E_Card * A_ConGra 0
E_Card * A_cor 0
E_Card * A_EvTree 0
E_Card * A_Fail 0
E_Card * A_Fault 0
E_Card * A_Free 0
E_Card * A_Funct 0
E_Card * A_GOMS 0
E_Card * A_Ident 0
E_Card * A_InfDia 0
E_Card * A_IntAna 0
E_Card * A_Job 0
E_Card * A_Net 0
E_Card * A_OpSqAn 0
E_Card * A_OFM 0
E_Card * A_Pair 0
E_Card * A_SOAR 0
E_Card * A_StraAn 0
E_Card * A_StruAn 0
E_Card * A_TimeLn 0
E_Card * A_WkDoAn 0
E_Card * A_WkFlow 0
E_cogfn * A_Card 0
E_cogfn * A_Clust 0
E_cogfn * A_COGNE 0
E_cogfn * A_comp2 0

121
E_cogfn * A_ConGra 0
E_cogfn * A_cor 0
E_cogfn * A_EvTree 0
E_cogfn * A_Fail 0
E_cogfn * A_Fault 0
E_cogfn * A_Free 0
E_cogfn * A_GOMS 0
E_cogfn * A_Graph 0
E_cogfn * A_Ground 0
E_cogfn * A_Hsort 0
E_cogfn * A_Htask 0
E_cogfn * A_Ident 0
E_cogfn * A_InfDia 0
E_cogfn * A_InfFlo 0
E_cogfn * A_IntAna 0
E_cogfn * A_Job 0
E_cogfn * A_Ladd 0
E_cogfn * A_MCS 0
E_cogfn * A_MDS 0
E_cogfn * A_Net 0
E_cogfn * A_OpSqAn 0
E_cogfn * A_OFM 0
E_cogfn * A_Pair 0
E_cogfn * A_PA 0
E_cogfn * A_Repeat 0
E_cogfn * A_RpGrid 0
E_cogfn * A_SOAR 0
E_cogfn * A_Stat 0
E_cogfn * A_StraAn 0
E_cogfn * A_StruAn 0
E_cogfn * A_TimeLn 0
E_cogfn * A_WkDoAn 0
E_cogfn * A_WkFlow 0
E_cta * A_Clust 0
E_cta * A_COGNE 0
E_cta * A_cogfn 0
E_cta * A_cwa 0
E_cta * A_comp2 0
E_cta * A_ConGra 0
E_cta * A_cor 0
E_cta * A_EvTree 0
E_cta * A_Fail 0
E_cta * A_Fault 0
122
E_cta * A_Free 0
E_cta * A_Funct 0
E_cta * A_GOMS 0
E_cta * A_Graph 0
E_cta * A_Hsort 0
E_cta * A_InfDia 0
E_cta * A_IntAna 0
E_cta * A_Job 0
E_cta * A_Ladd 0
E_cta * A_MCS 0
E_cta * A_MDS 0
E_cta * A_Net 0
E_cta * A_OpSqAn 0
E_cta * A_OFM 0
E_cta * A_Repeat 0
E_cta * A_RpGrid 0
E_cta * A_SOAR 0
E_cta * A_StruAn 0
E_cta * A_TimeLn 0
E_cta * A_WkDoAn 0
E_cta * A_WkFlow 0
E_ConLis * A_Card 0
E_ConLis * A_Clust 0
E_ConLis * A_COGNE 0
E_ConLis * A_cogfn 0
E_ConLis * A_cwa 0
E_ConLis * A_comp2 0
E_ConLis * A_ConMap 0
E_ConLis * A_Fail 0
E_ConLis * A_Fault 0
E_ConLis * A_Free 0
E_ConLis * A_Funct 0
E_ConLis * A_GOMS 0
E_ConLis * A_Graph 0
E_ConLis * A_Hsort 0
E_ConLis * A_Htask 0
E_ConLis * A_Ident 0
E_ConLis * A_InfFlo 0
E_ConLis * A_Job 0
E_ConLis * A_MCS 0
E_ConLis * A_MDS 0
E_ConLis * A_Net 0
E_ConLis * A_OpSqAn 0

123
E_ConLis * A_OFM 0
E_ConLis * A_Pair 0
E_ConLis * A_Repeat 0
E_ConLis * A_RpGrid 0
E_ConLis * A_SOAR 0
E_ConLis * A_Stat 0
E_ConLis * A_StraAn 0
E_ConLis * A_TimeLn 0
E_ConLis * A_WkDoAn 0
E_ConLis * A_WkFlow 0
E_ConMap * A_Card 0
E_ConMap * A_COGNE 0
E_ConMap * A_cwa 0
E_ConMap * A_comp2 0
E_ConMap * A_cor 0
E_ConMap * A_EvTree 0
E_ConMap * A_Fail 0
E_ConMap * A_Free 0
E_ConMap * A_Graph 0
E_ConMap * A_Ground 0
E_ConMap * A_Htask 0
E_ConMap * A_InfFlo 0
E_ConMap * A_IntAna 0
E_ConMap * A_Job 0
E_ConMap * A_Ladd 0
E_ConMap * A_MCS 0
E_ConMap * A_MDS 0
E_ConMap * A_OpSqAn 0
E_ConMap * A_OFM 0
E_ConMap * A_Pair 0
E_ConMap * A_Repeat 0
E_ConMap * A_RpGrid 0
E_ConMap * A_SOAR 0
E_ConMap * A_StraAn 0
E_ConMap * A_TimeLn 0
E_ConMap *
A_WkDoAn 0
E_CDM * A_Clust 0
E_CDM * A_COGNE 0
E_CDM * A_cogfn 0
E_CDM * A_cwa 0
E_CDM * A_comp2 0
E_CDM * A_ConAnl 0

124
E_CDM * A_cor 0
E_CDM * A_EvTree 0
E_CDM * A_Fail 0
E_CDM * A_Fault 0
E_CDM * A_Free 0
E_CDM * A_Funct 0
E_CDM * A_GOMS 0
E_CDM * A_Graph 0
E_CDM * A_Hsort 0
E_CDM * A_Ident 0
E_CDM * A_InfDia 0
E_CDM * A_InfFlo 0
E_CDM * A_IntAna 0
E_CDM * A_Job 0
E_CDM * A_Ladd 0
E_CDM * A_MCS 0
E_CDM * A_MDS 0
E_CDM * A_Net 0
E_CDM * A_OpSqAn 0
E_CDM * A_OFM 0
E_CDM * A_Pair 0
E_CDM * A_Repeat 0
E_CDM * A_RpGrid 0
E_CDM * A_SOAR 0
E_CDM * A_Stat 0
E_CDM * A_StraAn 0
E_CDM * A_StruAn 0
E_CDM * A_TimeLn 0
E_CDM * A_WkDoAn 0
E_CDM * A_WkFlow 0
E_crit * A_Card 0
E_crit * A_Clust 0
E_crit * A_COGNE 0
E_crit * A_cogfn 0
E_crit * A_cwa 0
E_crit * A_comp2 0
E_crit * A_ConMap 0
E_crit * A_ConGra 0
E_crit * A_cor 0
E_crit * A_Diag 0
E_crit * A_DocAnl 0
E_crit * A_EvTree 0
E_crit * A_Fail 0

125
E_crit * A_Fault 0
E_crit * A_Free 0
E_crit * A_Funct 0
E_crit * A_GOMS 0
E_crit * A_Graph 0
E_crit * A_Ground 0
E_crit * A_Hsort 0
E_crit * A_Htask 0
E_crit * A_Ident 0
E_crit * A_InfDia 0
E_crit * A_InfFlo 0
E_crit * A_IntAna 0
E_crit * A_Job 0
E_crit * A_Ladd 0
E_crit * A_MCS 0
E_crit * A_MDS 0
E_crit * A_Net 0
E_crit * A_OpSqAn 0
E_crit * A_OFM 0
E_crit * A_Pair 0
E_crit * A_Repeat 0
E_crit * A_RpGrid 0
E_crit * A_SOAR 0
E_crit * A_Stat 0
E_crit * A_StraAn 0
E_crit * A_StruAn 0
E_crit * A_TimeLn 0
E_crit * A_WkDoAn 0
E_crit * A_WkFlow 0
E_design * A_Card 0
E_design * A_Clust 0
E_design * A_COGNE 0
E_design * A_cwa 0
E_design * A_comp2 0
E_design * A_ConGra 0
E_design * A_ConAnl 0
E_design * A_cor 0
E_design * A_Diag 0
E_design * A_DocAnl 0
E_design * A_EvTree 0
E_design * A_Fail 0
E_design * A_Fault 0
E_design * A_Free 0
126
E_design * A_Funct 0
E_design * A_GOMS 0
E_design * A_Graph 0
E_design * A_Ground 0
E_design * A_Hsort 0
E_design * A_Htask 0
E_design * A_Ident 0
E_design * A_InfDia 0
E_design * A_InfFlo 0
E_design * A_IntAna 0
E_design * A_Job 0
E_design * A_Ladd 0
E_design * A_MCS 0
E_design * A_MDS 0
E_design * A_Net 0
E_design * A_OpSqAn 0
E_design * A_OFM 0
E_design * A_Pair 0
E_design * A_PA 0
E_design * A_Repeat 0
E_design * A_RpGrid 0
E_design * A_SOAR 0
E_design * A_Stat 0
E_design * A_StraAn 0
E_design * A_StruAn 0
E_design * A_TimeLn 0
E_design * A_WkDoAn 0
E_design * A_WkFlow 0
E_DocAnl * A_COGNE 0
E_DocAnl * A_comp2 0
E_DocAnl * A_EvTree 0
E_DocAnl * A_Fail 0
E_DocAnl * A_Fault 0
E_DocAnl * A_Free 0
E_DocAnl * A_GOMS 0
E_DocAnl * A_Hsort 0
E_DocAnl * A_InfDia 0
E_DocAnl * A_IntAna 0
E_DocAnl * A_Job 0
E_DocAnl * A_Ladd 0
E_DocAnl * A_Net 0
E_DocAnl * A_Pair 0
E_DocAnl * A_Repeat 0

127
E_DocAnl * A_SOAR 0
E_DocAnl * A_TimeLn 0
E_DocAnl * A_WkDoAn 0
E_Elict * A_Card 0
E_Elict * A_Clust 0
E_Elict * A_COGNE 0
E_Elict * A_cogfn 0
E_Elict * A_cwa 0
E_Elict * A_comp2 0
E_Elict * A_ConMap 0
E_Elict * A_ConGra 0
E_Elict * A_cor 0
E_Elict * A_DocAnl 0
E_Elict * A_EvTree 0
E_Elict * A_Fail 0
E_Elict * A_Fault 0
E_Elict * A_Free 0
E_Elict * A_Funct 0
E_Elict * A_GOMS 0
E_Elict * A_Graph 0
E_Elict * A_Ground 0
E_Elict * A_Hsort 0
E_Elict * A_Htask 0
E_Elict * A_Ident 0
E_Elict * A_InfDia 0
E_Elict * A_InfFlo 0
E_Elict * A_IntAna 0
E_Elict * A_Job 0
E_Elict * A_Ladd 0
E_Elict * A_MCS 0
E_Elict * A_MDS 0
E_Elict * A_Net 0
E_Elict * A_OpSqAn 0
E_Elict * A_OFM 0
E_Elict * A_Pair 0
E_Elict * A_PA 0
E_Elict * A_Repeat 0
E_Elict * A_RpGrid 0
E_Elict * A_SOAR 0
E_Elict * A_Stat 0
E_Elict * A_StraAn 0
E_Elict * A_StruAn 0
E_Elict * A_TimeLn 0

128
E_Elict * A_WkDoAn 0
E_Elict * A_WkFlow 0
E_Event * A_Card 0
E_Event * A_Clust 0
E_Event * A_COGNE 0
E_Event * A_cogfn 0
E_Event * A_cwa 0
E_Event * A_comp2 0
E_Event * A_ConGra 0
E_Event * A_ConAnl 0
E_Event * A_cor 0
E_Event * A_Diag 0
E_Event * A_DocAnl 0
E_Event * A_EvTree 0
E_Event * A_Fail 0
E_Event * A_Fault 0
E_Event * A_Free 0
E_Event * A_Funct 0
E_Event * A_GOMS 0
E_Event * A_Graph 0
E_Event * A_Ground 0
E_Event * A_Hsort 0
E_Event * A_Htask 0
E_Event * A_Ident 0
E_Event * A_InfDia 0
E_Event * A_InfFlo 0
E_Event * A_IntAna 0
E_Event * A_Job 0
E_Event * A_Ladd 0
E_Event * A_MCS 0
E_Event * A_MDS 0
E_Event * A_Net 0
E_Event * A_OpSqAn 0
E_Event * A_OFM 0
E_Event * A_Pair 0
E_Event * A_PA 0
E_Event * A_Repeat 0
E_Event * A_RpGrid 0
E_Event * A_SOAR 0
E_Event * A_StraAn 0
E_Event * A_TimeLn 0
E_Event * A_WkDoAn 0
E_Event * A_WkFlow 0
129
E_Field * A_Card 0
E_Field * A_Clust 0
E_Field * A_COGNE 0
E_Field * A_cogfn 0
E_Field * A_cwa 0
E_Field * A_comp2 0
E_Field * A_ConGra 0
E_Field * A_cor 0
E_Field * A_EvTree 0
E_Field * A_Fail 0
E_Field * A_Fault 0
E_Field * A_Free 0
E_Field * A_Funct 0
E_Field * A_GOMS 0
E_Field * A_Graph 0
E_Field * A_Hsort 0
E_Field * A_Ident 0
E_Field * A_InfDia 0
E_Field * A_InfFlo 0
E_Field * A_IntAna 0
E_Field * A_Job 0
E_Field * A_Ladd 0
E_Field * A_MCS 0
E_Field * A_OFM 0
E_Field * A_Pair 0
E_Field * A_Repeat 0
E_Field * A_RpGrid 0
E_Field * A_Stat 0
E_Field * A_StruAn 0
E_Field * A_TimeLn 0
E_Field * A_WkDoAn 0
E_Focus * A_Card 0
E_Focus * A_Clust 0
E_Focus * A_COGNE 0
E_Focus * A_cogfn 0
E_Focus * A_cwa 0
E_Focus * A_comp2 0
E_Focus * A_ConGra 0
E_Focus * A_cor 0
E_Focus * A_EvTree 0
E_Focus * A_Fail 0
E_Focus * A_Fault 0
E_Focus * A_Free 0
130
E_Focus * A_Funct 0
E_Focus * A_GOMS 0
E_Focus * A_Graph 0
E_Focus * A_Ground 0
E_Focus * A_Hsort 0
E_Focus * A_Htask 0
E_Focus * A_InfDia 0
E_Focus * A_IntAna 0
E_Focus * A_Job 0
E_Focus * A_Ladd 0
E_Focus * A_MCS 0
E_Focus * A_MDS 0
E_Focus * A_Net 0
E_Focus * A_OpSqAn 0
E_Focus * A_Pair 0
E_Focus * A_PA 0
E_Focus * A_Repeat 0
E_Focus * A_RpGrid 0
E_Focus * A_SOAR 0
E_Focus * A_Stat 0
E_Focus * A_StraAn 0
E_Focus * A_StruAn 0
E_Focus * A_TimeLn 0
E_Free * A_Card 0
E_Free * A_Clust 0
E_Free * A_COGNE 0
E_Free * A_cogfn 0
E_Free * A_cwa 0
E_Free * A_comp2 0
E_Free * A_ConMap 0
E_Free * A_ConGra 0
E_Free * A_ConAnl 0
E_Free * A_cor 0
E_Free * A_Diag 0
E_Free * A_DocAnl 0
E_Free * A_EvTree 0
E_Free * A_Fail 0
E_Free * A_Fault 0
E_Free * A_Funct 0
E_Free * A_GOMS 0
E_Free * A_Graph 0
E_Free * A_Ground 0
E_Free * A_Hsort 0
131
E_Free * A_Htask 0
E_Free * A_Ident 0
E_Free * A_InfFlo 0
E_Free * A_IntAna 0
E_Free * A_Job 0
E_Free * A_Ladd 0
E_Free * A_MCS 0
E_Free * A_MDS 0
E_Free * A_Net 0
E_Free * A_OpSqAn 0
E_Free * A_OFM 0
E_Free * A_PA 0
E_Free * A_Repeat 0
E_Free * A_RpGrid 0
E_Free * A_SOAR 0
E_Free * A_Stat 0
E_Free * A_StraAn 0
E_Free * A_StruAn 0
E_Free * A_TimeLn 0
E_Free * A_WkDoAn 0
E_Free * A_WkFlow 0
E_Graph * A_Clust 0
E_Graph * A_COGNE 0
E_Graph * A_cogfn 0
E_Graph * A_cwa 0
E_Graph * A_comp2 0
E_Graph * A_ConMap 0
E_Graph * A_ConGra 0
E_Graph * A_ConAnl 0
E_Graph * A_cor 0
E_Graph * A_Diag 0
E_Graph * A_EvTree 0
E_Graph * A_Fail 0
E_Graph * A_Fault 0
E_Graph * A_Free 0
E_Graph * A_Funct 0
E_Graph * A_GOMS 0
E_Graph * A_Ground 0
E_Graph * A_Ident 0
E_Graph * A_InfDia 0
E_Graph * A_InfFlo 0
E_Graph * A_IntAna 0
E_Graph * A_Job 0

132
E_Graph * A_Ladd 0
E_Graph * A_Net 0
E_Graph * A_OpSqAn 0
E_Graph * A_OFM 0
E_Graph * A_Pair 0
E_Graph * A_PA 0
E_Graph * A_Repeat 0
E_Graph * A_RpGrid 0
E_Graph * A_SOAR 0
E_Graph * A_StraAn 0
E_Graph * A_StruAn 0
E_Graph * A_TimeLn 0
E_Graph * A_WkDoAn 0
E_Graph * A_WkFlow 0
E_GrpDis * A_Card 0
E_GrpDis * A_Clust 0
E_GrpDis * A_COGNE 0
E_GrpDis * A_cogfn 0
E_GrpDis * A_cwa 0
E_GrpDis * A_comp2 0
E_GrpDis * A_ConGra 0
E_GrpDis * A_cor 0
E_GrpDis * A_EvTree 0
E_GrpDis * A_Fail 0
E_GrpDis * A_Fault 0
E_GrpDis * A_Free 0
E_GrpDis * A_Funct 0
E_GrpDis * A_GOMS 0
E_GrpDis * A_Graph 0
E_GrpDis * A_Ground 0
E_GrpDis * A_Hsort 0
E_GrpDis * A_Htask 0
E_GrpDis * A_Ident 0
E_GrpDis * A_InfDia 0
E_GrpDis * A_InfFlo 0
E_GrpDis * A_IntAna 0
E_GrpDis * A_Job 0
E_GrpDis * A_Ladd 0
E_GrpDis * A_MCS 0
E_GrpDis * A_MDS 0
E_GrpDis * A_Net 0
E_GrpDis * A_OpSqAn 0
E_GrpDis * A_OFM 0

133
E_GrpDis * A_Pair 0
E_GrpDis * A_Repeat 0
E_GrpDis * A_RpGrid 0
E_GrpDis * A_SOAR 0
E_GrpDis * A_Stat 0
E_GrpDis * A_StraAn 0
E_GrpDis * A_StruAn 0
E_GrpDis * A_TimeLn 0
E_GrpDis * A_WkDoAn 0
E_GrpDis * A_WkFlow 0
E_GrpInt * A_Card 0
E_GrpInt * A_Clust 0
E_GrpInt * A_COGNE 0
E_GrpInt * A_cogfn 0
E_GrpInt * A_cwa 0
E_GrpInt * A_comp2 0
E_GrpInt * A_ConGra 0
E_GrpInt * A_cor 0
E_GrpInt * A_EvTree 0
E_GrpInt * A_Fail 0
E_GrpInt * A_Fault 0
E_GrpInt * A_Free 0
E_GrpInt * A_Funct 0
E_GrpInt * A_GOMS 0
E_GrpInt * A_Graph 0
E_GrpInt * A_Hsort 0
E_GrpInt * A_IntAna 0
E_GrpInt * A_Job 0
E_GrpInt * A_Ladd 0
E_GrpInt * A_MCS 0
E_GrpInt * A_MDS 0
E_GrpInt * A_Net 0
E_GrpInt * A_OpSqAn 0
E_GrpInt * A_OFM 0
E_GrpInt * A_Pair 0
E_GrpInt * A_Repeat 0
E_GrpInt * A_SOAR 0
E_GrpInt * A_StraAn 0
E_GrpInt * A_WkDoAn 0
E_Ident * A_Card 0
E_Ident * A_COGNE 0
E_Ident * A_cogfn 0
E_Ident * A_cwa 0

134
E_Ident * A_comp2 0
E_Ident * A_ConGra 0
E_Ident * A_cor 0
E_Ident * A_EvTree 0
E_Ident * A_Fail 0
E_Ident * A_Fault 0
E_Ident * A_Free 0
E_Ident * A_Funct 0
E_Ident * A_GOMS 0
E_Ident * A_Graph 0
E_Ident * A_Ground 0
E_Ident * A_Hsort 0
E_Ident * A_InfDia 0
E_Ident * A_InfFlo 0
E_Ident * A_IntAna 0
E_Ident * A_Job 0
E_Ident * A_Ladd 0
E_Ident * A_MCS 0
E_Ident * A_Net 0
E_Ident * A_OpSqAn 0
E_Ident * A_OFM 0
E_Ident * A_Pair 0
E_Ident * A_PA 0
E_Ident * A_Repeat 0
E_Ident * A_SOAR 0
E_Ident * A_Stat 0
E_Ident * A_StraAn 0
E_Ident * A_StruAn 0
E_Ident * A_TimeLn 0
E_Ident * A_WkDoAn 0
E_Interp * A_Card 0
E_Interp * A_Clust 0
E_Interp * A_COGNE 0
E_Interp * A_cogfn 0
E_Interp * A_cwa 0
E_Interp * A_comp2 0
E_Interp * A_ConMap 0
E_Interp * A_ConGra 0
E_Interp * A_cor 0
E_Interp * A_EvTree 0
E_Interp * A_Fail 0
E_Interp * A_Fault 0
E_Interp * A_Free 0

135
E_Interp * A_Funct 0
E_Interp * A_GOMS 0
E_Interp * A_Graph 0
E_Interp * A_Hsort 0
E_Interp * A_Htask 0
E_Interp * A_Ident 0
E_Interp * A_InfDia 0
E_Interp * A_InfFlo 0
E_Interp * A_IntAna 0
E_Interp * A_Job 0
E_Interp * A_Ladd 0
E_Interp * A_MCS 0
E_Interp * A_MDS 0
E_Interp * A_Net 0
E_Interp * A_OpSqAn 0
E_Interp * A_OFM 0
E_Interp * A_Pair 0
E_Interp * A_Repeat 0
E_Interp * A_RpGrid 0
E_Interp * A_SOAR 0
E_Interp * A_Stat 0
E_Interp * A_StruAn 0
E_Interp * A_TimeLn 0
E_Interp * A_WkDoAn 0
E_Interp * A_WkFlow 0
E_Ladd * A_Clust 0
E_Ladd * A_COGNE 0
E_Ladd * A_cogfn 0
E_Ladd * A_cwa 0
E_Ladd * A_comp2 0
E_Ladd * A_ConMap 0
E_Ladd * A_DocAnl 0
E_Ladd * A_EvTree 0
E_Ladd * A_Fail 0
E_Ladd * A_Fault 0
E_Ladd * A_Free 0
E_Ladd * A_Funct 0
E_Ladd * A_GOMS 0
E_Ladd * A_Graph 0
E_Ladd * A_Hsort 0
E_Ladd * A_Htask 0
E_Ladd * A_Ident 0
E_Ladd * A_InfDia 0

136
E_Ladd * A_InfFlo 0
E_Ladd * A_IntAna 0
E_Ladd * A_Job 0
E_Ladd * A_MCS 0
E_Ladd * A_MDS 0
E_Ladd * A_Net 0
E_Ladd * A_OpSqAn 0
E_Ladd * A_OFM 0
E_Ladd * A_Pair 0
E_Ladd * A_Repeat 0
E_Ladd * A_SOAR 0
E_Ladd * A_StraAn 0
E_Ladd * A_StruAn 0
E_Ladd * A_TimeLn 0
E_Ladd * A_WkDoAn 0
E_Ladd * A_WkFlow 0
E_Likert * A_Clust 0
E_Likert * A_COGNE 0
E_Likert * A_cogfn 0
E_Likert * A_cwa 0
E_Likert * A_comp2 0
E_Likert * A_ConGra 0
E_Likert * A_EvTree 0
E_Likert * A_Fail 0
E_Likert * A_Fault 0
E_Likert * A_Free 0
E_Likert * A_Funct 0
E_Likert * A_GOMS 0
E_Likert * A_Graph 0
E_Likert * A_Ground 0
E_Likert * A_Hsort 0
E_Likert * A_InfDia 0
E_Likert * A_IntAna 0
E_Likert * A_Job 0
E_Likert * A_MCS 0
E_Likert * A_OpSqAn 0
E_Likert * A_OFM 0
E_Likert * A_Pair 0
E_Likert * A_Repeat 0
E_Likert * A_SOAR 0
E_Likert * A_StraAn 0
E_Likert * A_StruAn 0
E_Likert * A_TimeLn 0

137
E_Likert * A_WkDoAn 0
E_MCS * A_COGNE 0
E_MCS * A_cogfn 0
E_MCS * A_cwa 0
E_MCS * A_comp2 0
E_MCS * A_ConMap 0
E_MCS * A_ConGra 0
E_MCS * A_cor 0
E_MCS * A_Diag 0
E_MCS * A_EvTree 0
E_MCS * A_Fail 0
E_MCS * A_Fault 0
E_MCS * A_Free 0
E_MCS * A_Funct 0
E_MCS * A_GOMS 0
E_MCS * A_Ground 0
E_MCS * A_Hsort 0
E_MCS * A_Htask 0
E_MCS * A_Ident 0
E_MCS * A_InfDia 0
E_MCS * A_InfFlo 0
E_MCS * A_IntAna 0
E_MCS * A_Job 0
E_MCS * A_Ladd 0
E_MCS * A_Net 0
E_MCS * A_OpSqAn 0
E_MCS * A_OFM 0
E_MCS * A_Pair 0
E_MCS * A_PA 0
E_MCS * A_RpGrid 0
E_MCS * A_SOAR 0
E_MCS * A_Stat 0
E_MCS * A_StraAn 0
E_MCS * A_StruAn 0
E_MCS * A_TimeLn 0
E_MCS * A_WkDoAn 0
E_MCS * A_WkFlow 0
E_MDS * A_COGNE 0
E_MDS * A_cogfn 0
E_MDS * A_cwa 0
E_MDS * A_comp2 0
E_MDS * A_ConMap 0
E_MDS * A_ConGra 0

138
E_MDS * A_ConAnl 0
E_MDS * A_cor 0
E_MDS * A_Diag 0
E_MDS * A_EvTree 0
E_MDS * A_Fail 0
E_MDS * A_Fault 0
E_MDS * A_Free 0
E_MDS * A_Funct 0
E_MDS * A_GOMS 0
E_MDS * A_Ground 0
E_MDS * A_Hsort 0
E_MDS * A_InfDia 0
E_MDS * A_InfFlo 0
E_MDS * A_IntAna 0
E_MDS * A_Job 0
E_MDS * A_Ladd 0
E_MDS * A_OFM 0
E_MDS * A_Pair 0
E_MDS * A_PA 0
E_MDS * A_Repeat 0
E_MDS * A_SOAR 0
E_MDS * A_Stat 0
E_MDS * A_StraAn 0
E_MDS * A_StruAn 0
E_MDS * A_TimeLn 0
E_MDS * A_WkDoAn 0
E_MDS * A_WkFlow 0
E_Nonver * A_Card 0
E_Nonver * A_Clust 0
E_Nonver * A_COGNE 0
E_Nonver * A_cogfn 0
E_Nonver * A_cwa 0
E_Nonver * A_comp2 0
E_Nonver * A_ConMap 0
E_Nonver * A_ConGra 0
E_Nonver * A_ConAnl 0
E_Nonver * A_cor 0
E_Nonver * A_Diag 0
E_Nonver * A_DocAnl 0
E_Nonver * A_EvTree 0
E_Nonver * A_Fail 0
E_Nonver * A_Fault 0
E_Nonver * A_Free 0

139
E_Nonver * A_Funct 0
E_Nonver * A_GOMS 0
E_Nonver * A_Graph 0
E_Nonver * A_Ground 0
E_Nonver * A_Hsort 0
E_Nonver * A_Htask 0
E_Nonver * A_Ident 0
E_Nonver * A_InfDia 0
E_Nonver * A_InfFlo 0
E_Nonver * A_IntAna 0
E_Nonver * A_Job 0
E_Nonver * A_Ladd 0
E_Nonver * A_MCS 0
E_Nonver * A_MDS 0
E_Nonver * A_Net 0
E_Nonver * A_OpSqAn 0
E_Nonver * A_OFM 0
E_Nonver * A_Pair 0
E_Nonver * A_Repeat 0
E_Nonver * A_RpGrid 0
E_Nonver * A_SOAR 0
E_Nonver * A_Stat 0
E_Nonver * A_StraAn 0
E_Nonver * A_StruAn 0
E_Nonver * A_TimeLn 0
E_Nonver * A_WkDoAn 0
E_Nonver * A_WkFlow 0
E_OFM * A_Card 0
E_OFM * A_Clust 0
E_OFM * A_COGNE 0
E_OFM * A_cogfn 0
E_OFM * A_cwa 0
E_OFM * A_comp2 0
E_OFM * A_ConMap 0
E_OFM * A_ConGra 0
E_OFM * A_ConAnl 0
E_OFM * A_cor 0
E_OFM * A_Diag 0
E_OFM * A_EvTree 0
E_OFM * A_Fail 0
E_OFM * A_Fault 0
E_OFM * A_Free 0
E_OFM * A_Funct 0
140
E_OFM * A_GOMS 0
E_OFM * A_Graph 0
E_OFM * A_Ground 0
E_OFM * A_Hsort 0
E_OFM * A_Htask 0
E_OFM * A_Ident 0
E_OFM * A_InfDia 0
E_OFM * A_InfFlo 0
E_OFM * A_IntAna 0
E_OFM * A_Job 0
E_OFM * A_Ladd 0
E_OFM * A_MCS 0
E_OFM * A_MDS 0
E_OFM * A_Net 0
E_OFM * A_OpSqAn 0
E_OFM * A_Pair 0
E_OFM * A_PA 0
E_OFM * A_Repeat 0
E_OFM * A_RpGrid 0
E_OFM * A_SOAR 0
E_OFM * A_Stat 0
E_OFM * A_StraAn 0
E_OFM * A_StruAn 0
E_OFM * A_TimeLn 0
E_OFM * A_WkDoAn 0
E_OFM * A_WkFlow 0
E_Pair * A_Card 0
E_Pair * A_Clust 0
E_Pair * A_COGNE 0
E_Pair * A_cogfn 0
E_Pair * A_cwa 0
E_Pair * A_comp2 0
E_Pair * A_ConMap 0
E_Pair * A_ConGra 0
E_Pair * A_cor 0
E_Pair * A_Diag 0
E_Pair * A_DocAnl 0
E_Pair * A_EvTree 0
E_Pair * A_Fail 0
E_Pair * A_Fault 0
E_Pair * A_Funct 0
E_Pair * A_GOMS 0
E_Pair * A_Graph 0

141
E_Pair * A_Ground 0
E_Pair * A_Htask 0
E_Pair * A_Ident 0
E_Pair * A_InfFlo 0
E_Pair * A_IntAna 0
E_Pair * A_Job 0
E_Pair * A_Ladd 0
E_Pair * A_MCS 0
E_Pair * A_MDS 0
E_Pair * A_Net 0
E_Pair * A_OpSqAn 0
E_Pair * A_OFM 0
E_Pair * A_PA 0
E_Pair * A_Repeat 0
E_Pair * A_SOAR 0
E_Pair * A_Stat 0
E_Pair * A_StraAn 0
E_Pair * A_StruAn 0
E_Pair * A_TimeLn 0
E_Pair * A_WkDoAn 0
E_Pair * A_WkFlow 0
E_PARI * A_Card 0
E_PARI * A_Clust 0
E_PARI * A_cogfn 0
E_PARI * A_cwa 0
E_PARI * A_comp2 0
E_PARI * A_ConMap 0
E_PARI * A_ConGra 0
E_PARI * A_ConAnl 0
E_PARI * A_cor 0
E_PARI * A_Diag 0
E_PARI * A_DocAnl 0
E_PARI * A_EvTree 0
E_PARI * A_Fail 0
E_PARI * A_Fault 0
E_PARI * A_Free 0
E_PARI * A_Funct 0
E_PARI * A_GOMS 0
E_PARI * A_Graph 0
E_PARI * A_Ground 0
E_PARI * A_Hsort 0
E_PARI * A_Htask 0
E_PARI * A_Ident 0

142
E_PARI * A_InfDia 0
E_PARI * A_InfFlo 0
E_PARI * A_IntAna 0
E_PARI * A_Job 0
E_PARI * A_Ladd 0
E_PARI * A_MCS 0
E_PARI * A_MDS 0
E_PARI * A_Net 0
E_PARI * A_OpSqAn 0
E_PARI * A_OFM 0
E_PARI * A_Pair 0
E_PARI * A_Repeat 0
E_PARI * A_RpGrid 0
E_PARI * A_SOAR 0
E_PARI * A_Stat 0
E_PARI * A_StraAn 0
E_PARI * A_StruAn 0
E_PARI * A_TimeLn 0
E_PARI * A_WkDoAn 0
E_PARI * A_WkFlow 0
E_PA * A_Clust 0
E_PA * A_cogfn 0
E_PA * A_cwa 0
E_PA * A_comp2 0
E_PA * A_EvTree 0
E_PA * A_Fail 0
E_PA * A_Fault 0
E_PA * A_Free 0
E_PA * A_Funct 0
E_PA * A_GOMS 0
E_PA * A_Graph 0
E_PA * A_Hsort 0
E_PA * A_Ident 0
E_PA * A_InfDia 0
E_PA * A_IntAna 0
E_PA * A_Job 0
E_PA * A_MCS 0
E_PA * A_MDS 0
E_PA * A_Net 0
E_PA * A_OpSqAn 0
E_PA * A_OFM 0
E_PA * A_Pair 0
E_PA * A_Repeat 0

143
E_PA * A_SOAR 0
E_PA * A_StraAn 0
E_PA * A_StruAn 0
E_PA * A_TimeLn 0
E_PA * A_WkDoAn 0
E_Qsort * A_Card 0
E_Qsort * A_Clust 0
E_Qsort * A_COGNE 0
E_Qsort * A_cogfn 0
E_Qsort * A_cwa 0
E_Qsort * A_comp2 0
E_Qsort * A_ConMap 0
E_Qsort * A_cor 0
E_Qsort * A_DocAnl 0
E_Qsort * A_EvTree 0
E_Qsort * A_Fail 0
E_Qsort * A_Fault 0
E_Qsort * A_Free 0
E_Qsort * A_Funct 0
E_Qsort * A_GOMS 0
E_Qsort * A_Graph 0
E_Qsort * A_Hsort 0
E_Qsort * A_Htask 0
E_Qsort * A_Ident 0
E_Qsort * A_InfDia 0
E_Qsort * A_InfFlo 0
E_Qsort * A_IntAna 0
E_Qsort * A_Job 0
E_Qsort * A_MCS 0
E_Qsort * A_MDS 0
E_Qsort * A_Net 0
E_Qsort * A_OpSqAn 0
E_Qsort * A_OFM 0
E_Qsort * A_Pair 0
E_Qsort * A_Repeat 0
E_Qsort * A_RpGrid 0
E_Qsort * A_SOAR 0
E_Qsort * A_Stat 0
E_Qsort * A_StraAn 0
E_Qsort * A_StruAn 0
E_Qsort * A_TimeLn 0
E_Qsort * A_WkDoAn 0
E_Qsort * A_WkFlow 0

144
E_Quest * A_Card 0
E_Quest * A_Clust 0
E_Quest * A_COGNE 0
E_Quest * A_cogfn 0
E_Quest * A_cwa 0
E_Quest * A_comp2 0
E_Quest * A_ConGra 0
E_Quest * A_cor 0
E_Quest * A_DocAnl 0
E_Quest * A_EvTree 0
E_Quest * A_Free 0
E_Quest * A_Funct 0
E_Quest * A_GOMS 0
E_Quest * A_Graph 0
E_Quest * A_Ground 0
E_Quest * A_Hsort 0
E_Quest * A_Htask 0
E_Quest * A_InfDia 0
E_Quest * A_IntAna 0
E_Quest * A_Job 0
E_Quest * A_Ladd 0
E_Quest * A_MCS 0
E_Quest * A_MDS 0
E_Quest * A_OFM 0
E_Quest * A_Pair 0
E_Quest * A_PA 0
E_Quest * A_Repeat 0
E_Quest * A_RpGrid 0
E_Quest * A_SOAR 0
E_Quest * A_StraAn 0
E_Quest * A_StruAn 0
E_Quest * A_TimeLn 0
E_Quest * A_WkDoAn 0
E_Repeat * A_COGNE 0
E_Repeat * A_cogfn 0
E_Repeat * A_cwa 0
E_Repeat * A_comp2 0
E_Repeat * A_ConMap 0
E_Repeat * A_ConGra 0
E_Repeat * A_ConAnl 0
E_Repeat * A_cor 0
E_Repeat * A_Diag 0
E_Repeat * A_DocAnl 0

145
E_Repeat * A_EvTree 0
E_Repeat * A_Fail 0
E_Repeat * A_Fault 0
E_Repeat * A_Free 0
E_Repeat * A_Funct 0
E_Repeat * A_GOMS 0
E_Repeat * A_Graph 0
E_Repeat * A_Ground 0
E_Repeat * A_Hsort 0
E_Repeat * A_Htask 0
E_Repeat * A_Ident 0
E_Repeat * A_InfDia 0
E_Repeat * A_InfFlo 0
E_Repeat * A_IntAna 0
E_Repeat * A_Job 0
E_Repeat * A_Ladd 0
E_Repeat * A_MDS 0
E_Repeat * A_Net 0
E_Repeat * A_OpSqAn 0
E_Repeat * A_OFM 0
E_Repeat * A_Pair 0
E_Repeat * A_PA 0
E_Repeat * A_RpGrid 0
E_Repeat * A_SOAR 0
E_Repeat * A_Stat 0
E_Repeat * A_StraAn 0
E_Repeat * A_StruAn 0
E_Repeat * A_TimeLn 0
E_Repeat * A_WkDoAn 0
E_Repeat * A_WkFlow 0
E_RpGrid * A_Clust 0
E_RpGrid * A_COGNE 0
E_RpGrid * A_cogfn 0
E_RpGrid * A_cwa 0
E_RpGrid * A_comp2 0
E_RpGrid * A_ConMap 0
E_RpGrid * A_ConGra 0
E_RpGrid * A_ConAnl 0
E_RpGrid * A_EvTree 0
E_RpGrid * A_Fail 0
E_RpGrid * A_Fault 0
E_RpGrid * A_Free 0
E_RpGrid * A_Funct 0

146
E_RpGrid * A_GOMS 0
E_RpGrid * A_Graph 0
E_RpGrid * A_Ground 0
E_RpGrid * A_Hsort 0
E_RpGrid * A_InfDia 0
E_RpGrid * A_IntAna 0
E_RpGrid * A_Job 0
E_RpGrid * A_MCS 0
E_RpGrid * A_OpSqAn 0
E_RpGrid * A_OFM 0
E_RpGrid * A_Repeat 0
E_RpGrid * A_SOAR 0
E_RpGrid * A_StraAn 0
E_RpGrid * A_TimeLn 0
E_RpGrid * A_WkDoAn 0
E_RpGrid * A_WkFlow 0
E_Retro * A_Card 0
E_Retro * A_Clust 0
E_Retro * A_COGNE 0
E_Retro * A_cogfn 0
E_Retro * A_cwa 0
E_Retro * A_comp2 0
E_Retro * A_ConGra 0
E_Retro * A_cor 0
E_Retro * A_EvTree 0
E_Retro * A_Fail 0
E_Retro * A_Fault 0
E_Retro * A_Free 0
E_Retro * A_Funct 0
E_Retro * A_GOMS 0
E_Retro * A_Graph 0
E_Retro * A_Hsort 0
E_Retro * A_Ident 0
E_Retro * A_InfDia 0
E_Retro * A_IntAna 0
E_Retro * A_Job 0
E_Retro * A_Ladd 0
E_Retro * A_MCS 0
E_Retro * A_MDS 0
E_Retro * A_Net 0
E_Retro * A_OpSqAn 0
E_Retro * A_OFM 0
E_Retro * A_Pair 0

147
E_Retro * A_Repeat 0
E_Retro * A_RpGrid 0
E_Retro * A_SOAR 0
E_Retro * A_StraAn 0
E_Retro * A_StruAn 0
E_Retro * A_TimeLn 0
E_Retro * A_WkDoAn 0
E_Retro * A_WkFlow 0
E_Semi * A_COGNE 0
E_Semi * A_cor 0
E_Semi * A_EvTree 0
E_Semi * A_Fail 0
E_Semi * A_Fault 0
E_Semi * A_Free 0
E_Semi * A_GOMS 0
E_Semi * A_Graph 0
E_Semi * A_InfDia 0
E_Semi * A_IntAna 0
E_Semi * A_MCS 0
E_Semi * A_MDS 0
E_Semi * A_OpSqAn 0
E_Semi * A_Repeat 0
E_Semi * A_SOAR 0
E_Semi * A_StruAn 0
E_Semi * A_WkDoAn 0
E_Semi * A_WkFlow 0
E_Simul * A_Clust 0
E_Simul * A_COGNE 0
E_Simul * A_cogfn 0
E_Simul * A_cwa 0
E_Simul * A_comp2 0
E_Simul * A_ConMap 0
E_Simul * A_ConGra 0
E_Simul * A_cor 0
E_Simul * A_EvTree 0
E_Simul * A_Fail 0
E_Simul * A_Fault 0
E_Simul * A_Free 0
E_Simul * A_Funct 0
E_Simul * A_GOMS 0
E_Simul * A_Graph 0
E_Simul * A_Hsort 0
E_Simul * A_Htask 0

148
E_Simul * A_Ident 0
E_Simul * A_InfDia 0
E_Simul * A_IntAna 0
E_Simul * A_Job 0
E_Simul * A_Ladd 0
E_Simul * A_MCS 0
E_Simul * A_OpSqAn 0
E_Simul * A_OFM 0
E_Simul * A_Pair 0
E_Simul * A_PA 0
E_Simul * A_Repeat 0
E_Simul * A_RpGrid 0
E_Simul * A_SOAR 0
E_Simul * A_Stat 0
E_Simul * A_StraAn 0
E_Simul * A_StruAn 0
E_Simul * A_TimeLn 0
E_Simul * A_WkDoAn 0
E_Simul * A_WkFlow 0
E_Struct * A_COGNE 0
E_Struct * A_cogfn 0
E_Struct * A_cwa 0
E_Struct * A_comp2 0
E_Struct * A_ConGra 0
E_Struct * A_EvTree 0
E_Struct * A_Fail 0
E_Struct * A_Free 0
E_Struct * A_Funct 0
E_Struct * A_Graph 0
E_Struct * A_Hsort 0
E_Struct * A_InfDia 0
E_Struct * A_IntAna 0
E_Struct * A_Job 0
E_Struct * A_MCS 0
E_Struct * A_OpSqAn 0
E_Struct * A_OFM 0
E_Struct * A_Pair 0
E_Struct * A_Repeat 0
E_Struct * A_SOAR 0
E_Struct * A_Stat 0
E_Struct * A_StruAn 0
E_Struct * A_TimeLn 0
E_Struct * A_WkDoAn 0

149
E_StObvs * A_Card 0
E_StObvs * A_Clust 0
E_StObvs * A_COGNE 0
E_StObvs * A_cogfn 0
E_StObvs * A_cwa 0
E_StObvs * A_comp2 0
E_StObvs * A_ConMap 0
E_StObvs * A_ConGra 0
E_StObvs * A_cor 0
E_StObvs * A_Diag 0
E_StObvs * A_DocAnl 0
E_StObvs * A_EvTree 0
E_StObvs * A_Fail 0
E_StObvs * A_Fault 0
E_StObvs * A_Free 0
E_StObvs * A_Funct 0
E_StObvs * A_GOMS 0
E_StObvs * A_Graph 0
E_StObvs * A_Ground 0
E_StObvs * A_Hsort 0
E_StObvs * A_Htask 0
E_StObvs * A_Ident 0
E_StObvs * A_InfDia 0
E_StObvs * A_InfFlo 0
E_StObvs * A_IntAna 0
E_StObvs * A_Job 0
E_StObvs * A_Ladd 0
E_StObvs * A_MCS 0
E_StObvs * A_MDS 0
E_StObvs * A_Net 0
E_StObvs * A_OpSqAn 0
E_StObvs * A_OFM 0
E_StObvs * A_Pair 0
E_StObvs * A_PA 0
E_StObvs * A_Repeat 0
E_StObvs * A_RpGrid 0
E_StObvs * A_SOAR 0
E_StObvs * A_Stat 0
E_StObvs * A_StraAn 0
E_StObvs * A_StruAn 0
E_StObvs * A_TimeLn 0
E_StObvs * A_WkDoAn 0
E_StObvs * A_WkFlow 0
150
E_Table * A_Card 0
E_Table * A_Clust 0
E_Table * A_COGNE 0
E_Table * A_cogfn 0
E_Table * A_cwa 0
E_Table * A_comp2 0
E_Table * A_ConMap 0
E_Table * A_ConGra 0
E_Table * A_ConAnl 0
E_Table * A_cor 0
E_Table * A_DocAnl 0
E_Table * A_EvTree 0
E_Table * A_Fail 0
E_Table * A_Fault 0
E_Table * A_Free 0
E_Table * A_Funct 0
E_Table * A_GOMS 0
E_Table * A_Graph 0
E_Table * A_Ground 0
E_Table * A_Hsort 0
E_Table * A_Htask 0
E_Table * A_Ident 0
E_Table * A_InfFlo 0
E_Table * A_IntAna 0
E_Table * A_Job 0
E_Table * A_Ladd 0
E_Table * A_MCS 0
E_Table * A_MDS 0
E_Table * A_Net 0
E_Table * A_OpSqAn 0
E_Table * A_OFM 0
E_Table * A_Pair 0
E_Table * A_PA 0
E_Table * A_Repeat 0
E_Table * A_RpGrid 0
E_Table * A_SOAR 0
E_Table * A_Stat 0
E_Table * A_StraAn 0
E_Table * A_StruAn 0
E_Table * A_TimeLn 0
E_Table * A_WkDoAn 0
E_Table * A_WkFlow 0
E_TaskAn * A_Card 0

151
E_TaskAn * A_Clust 0
E_TaskAn * A_COGNE 0
E_TaskAn * A_cogfn 0
E_TaskAn * A_cwa 0
E_TaskAn * A_comp2 0
E_TaskAn * A_ConMap 0
E_TaskAn * A_ConGra 0
E_TaskAn * A_ConAnl 0
E_TaskAn * A_cor 0
E_TaskAn * A_DocAnl 0
E_TaskAn * A_EvTree 0
E_TaskAn * A_Fail 0
E_TaskAn * A_Fault 0
E_TaskAn * A_Free 0
E_TaskAn * A_Funct 0
E_TaskAn * A_GOMS 0
E_TaskAn * A_Graph 0
E_TaskAn * A_Hsort 0
E_TaskAn * A_Htask 0
E_TaskAn * A_Ident 0
E_TaskAn * A_InfDia 0
E_TaskAn * A_InfFlo 0
E_TaskAn * A_IntAna 0
E_TaskAn * A_Job 0
E_TaskAn * A_Ladd 0
E_TaskAn * A_MCS 0
E_TaskAn * A_MDS 0
E_TaskAn * A_Net 0
E_TaskAn * A_OpSqAn 0
E_TaskAn * A_OFM 0
E_TaskAn * A_Pair 0
E_TaskAn * A_PA 0
E_TaskAn * A_Repeat 0
E_TaskAn * A_RpGrid 0
E_TaskAn * A_SOAR 0
E_TaskAn * A_Stat 0
E_TaskAn * A_StraAn 0
E_TaskAn * A_StruAn 0
E_TaskAn * A_TimeLn 0
E_TaskAn * A_WkDoAn 0
E_TaskAn * A_WkFlow 0
E_Teach * A_Card 0
E_Teach * A_Clust 0
152
E_Teach * A_COGNE 0
E_Teach * A_cogfn 0
E_Teach * A_cwa 0
E_Teach * A_ConMap 0
E_Teach * A_ConGra 0
E_Teach * A_cor 0
E_Teach * A_DocAnl 0
E_Teach * A_EvTree 0
E_Teach * A_Fail 0
E_Teach * A_Fault 0
E_Teach * A_Free 0
E_Teach * A_Funct 0
E_Teach * A_GOMS 0
E_Teach * A_Graph 0
E_Teach * A_Ground 0
E_Teach * A_Hsort 0
E_Teach * A_Htask 0
E_Teach * A_Ident 0
E_Teach * A_InfDia 0
E_Teach * A_InfFlo 0
E_Teach * A_IntAna 0
E_Teach * A_Job 0
E_Teach * A_Ladd 0
E_Teach * A_MCS 0
E_Teach * A_MDS 0
E_Teach * A_Net 0
E_Teach * A_OpSqAn 0
E_Teach * A_OFM 0
E_Teach * A_Pair 0
E_Teach * A_PA 0
E_Teach * A_Repeat 0
E_Teach * A_RpGrid 0
E_Teach * A_SOAR 0
E_Teach * A_StraAn 0
E_Teach * A_StruAn 0
E_Teach * A_TimeLn 0
E_Teach * A_WkDoAn 0
E_Teach * A_WkFlow 0
E_Think * A_Clust 0
E_Think * A_cogfn 0
E_Think * A_cwa 0
E_Think * A_comp2 0
E_Think * A_ConMap 0

153
E_Think * A_EvTree 0
E_Think * A_Fail 0
E_Think * A_Fault 0
E_Think * A_Free 0
E_Think * A_Funct 0
E_Think * A_GOMS 0
E_Think * A_Hsort 0
E_Think * A_Ident 0
E_Think * A_InfDia 0
E_Think * A_InfFlo 0
E_Think * A_IntAna 0
E_Think * A_Job 0
E_Think * A_OpSqAn 0
E_Think * A_OFM 0
E_Think * A_Pair 0
E_Think * A_Repeat 0
E_Think * A_SOAR 0
E_Think * A_StraAn 0
E_Think * A_StruAn 0
E_Think * A_TimeLn 0
E_Traid * A_Card 0
E_Traid * A_Clust 0
E_Traid * A_COGNE 0
E_Traid * A_cogfn 0
E_Traid * A_cwa 0
E_Traid * A_comp2 0
E_Traid * A_ConMap 0
E_Traid * A_ConGra 0
E_Traid * A_ConAnl 0
E_Traid * A_cor 0
E_Traid * A_Diag 0
E_Traid * A_DocAnl 0
E_Traid * A_EvTree 0
E_Traid * A_Fail 0
E_Traid * A_Fault 0
E_Traid * A_Free 0
E_Traid * A_Funct 0
E_Traid * A_GOMS 0
E_Traid * A_Graph 0
E_Traid * A_Ground 0
E_Traid * A_Hsort 0
E_Traid * A_Htask 0
E_Traid * A_Ident 0

154
E_Traid * A_InfDia 0
E_Traid * A_InfFlo 0
E_Traid * A_IntAna 0
E_Traid * A_Job 0
E_Traid * A_Ladd 0
E_Traid * A_MCS 0
E_Traid * A_MDS 0
E_Traid * A_Net 0
E_Traid * A_OpSqAn 0
E_Traid * A_OFM 0
E_Traid * A_Pair 0
E_Traid * A_PA 0
E_Traid * A_Repeat 0
E_Traid * A_SOAR 0
E_Traid * A_Stat 0
E_Traid * A_StraAn 0
E_Traid * A_TimeLn 0
E_Traid * A_WkDoAn 0
E_Traid * A_WkFlow 0
E_UnIntv * A_Clust 0
E_UnIntv * A_COGNE 0
E_UnIntv * A_cogfn 0
E_UnIntv * A_cwa 0
E_UnIntv * A_comp2 0
E_UnIntv * A_ConGra 0
E_UnIntv * A_cor 0
E_UnIntv * A_EvTree 0
E_UnIntv * A_Fail 0
E_UnIntv * A_Fault 0
E_UnIntv * A_Free 0
E_UnIntv * A_Funct 0
E_UnIntv * A_GOMS 0
E_UnIntv * A_Hsort 0
E_UnIntv * A_Htask 0
E_UnIntv * A_InfDia 0
E_UnIntv * A_IntAna 0
E_UnIntv * A_Job 0
E_UnIntv * A_Ladd 0
E_UnIntv * A_Net 0
E_UnIntv * A_OpSqAn 0
E_UnIntv * A_OFM 0
E_UnIntv * A_Pair 0
E_UnIntv * A_Repeat 0

155
E_UnIntv * A_RpGrid 0
E_UnIntv * A_SOAR 0
E_UnIntv * A_Stat 0
E_UnIntv * A_StraAn 0
E_UnIntv * A_StruAn 0
E_UnIntv * A_TimeLn 0