toward indonesia’s agroindustries competitiveness: the … · toward indonesia’s agroindustries...
TRANSCRIPT

1st Annual International Interdisciplinary Conference, AIIC 2013, 24-26 April, Azores, Portugal - Proceedings-
491
TOWARD INDONESIA’S AGROINDUSTRIES COMPETITIVENESS: THE CASE OF BIOETHANOL DEVELOPMENT FROM SUGARCANE
BASED INDUSTRIES
Gita K. Indahsari Graduate School of Management and Business, Bogor Agricultural University, Indonesia
Rudi Wibowo Agricultural Economics Professor at Jember University,
Lecturer of Business Mangement At Bogor Agricultural University
Abstract: World oil price has been fluctuating throughout the years, however the trend continues to increase. Due to limited sources of oil production and high demand for world oil, it is predicted in ten years from 2010, world oil price could even reach as high as triple digit per barrel. Countries around the world had continuously tried to produce alternative energy, including Indonesia. The Indonesian government had tried to develop this industry, with roadmaps and targets for alternative energy production, reduce dependency on fossil fuel until the next ten years to come. The objective of this paper is to study the bioethanol industry developed by PTPN X. The bioethanol industry is still at its early stage in Indonesia. Problems to develop this industry includes finding the most potential raw materials used, availability of the industry, stage of competition with other uses of the raw materials until end product and marketing. From many potential raw materials, sugarcane is one of the most potential source of bioethanol. PTPN X case study shows how bioethanol can be competitive if there are supporting factors such resources, technology and company size. The comparative advantage of PTPN X is the ability of PTPN X to incorporate problems from upstream to downstream of the supply chain of bioethanol. Methods such as the EPC, ANP, Diamond Porter Model and case study of PTPN X are used to demonstrate the potential of sugarcane as an alternative energy and the ability of PTPN X to develop a competitive agroindustry.
Key Words: Competitiveness, bioethanol, PTPN X Introduction
As Indonesia became the world’s fourth most populous country in the world in 2011, the demand for fossil fuel continues to increase. Indonesian have been used to the cheap oil price, government policy which heavily subsidized this sector had become a boomerang for the government, causing the country to be a net importer for fuel. In 2005, Indonesia along with other countries in the world started to find other alternative energy sources, such as biofuel. As a renewable energy from plants, biofuel could be categorized into biodiesel and bioethanol. Bioethanol are eco-friendly energy which are derived carbohydrate and sugar components from plants, such as sugarcane, sweet sorghum, cassava, sweet potato and also sorghum. A study carried out by Indahsari et al (2012) shows that the current bioethanol industry in Indonesia has been stagnant. Problems arise from upstream until downstream of the bioethanol supply chain. Potential problems include availability of raw materials, competition with other plants, marketing and consumption.
Finding the most potential type of raw materials for bioethanol is also not an easy challenge, because the plant needs to contain either starch or sugar to later be fermented. Potential raw materials have direct competition use with other industries. Examples are cassava which can also be used for tapioca, corn for feed and fed, sugarcane with black ketchup industries. Thus, bioethanol products could also be processed as ethanol, such as alcohol, either for the pharmacy uses or for the beverages. Ethanol export products are also priced higher. Therefore, in order to develop the bioethanol industry,

1st Annual International Interdisciplinary Conference, AIIC 2013, 24-26 April, Azores, Portugal - Proceedings-
492
there should be other factors to induce the development. An example is that the company does not only produce mainly bioethanol but could also the waste for other uses, such as fertilizer.
Considering the depletion of oil reserves of Indonesia, the government through Government Regulation No. 05/2006 targeted to be able to replace the 1.48 billion liters of gasoline with bioethanol for the period 2007-2010. where the figure percentage was planned to increased by ten percent in 2011-2015, and 15 percent in 2016-2025 (Ircham, 2008). Figure 17 shows previous government plans to develop the bioethanol sector in Indonesia. The plan was targeted for 25 years of program development which had commenced since 2000 (BPPT, 2000). Bioethanol was part of the renewable energy plan which was concluded in the general energy selection by the government. Figure 1 shows the country’s national plan to reduce dependence on imported fossil fuel.
Figure 1 National Energy Plan, 2000 - 2025 (BPPT, 2005) Figure 1 shows how potential renewable energy, including bioethanol, is. In order to fulfill demand for energy, government had planned to develop the renewable energy. It has been predicted that fossil fuel in Indonesia will be depleted in 10 to 20 years to come, while imported fossil fuel has increased to 30 percent and continues to grow. Therefore, the government has tried to develop other alternative energy strategy. In 2005, the Indonesian government has tried to develop the bioethanol industry. Figure 2 shows the government’s target for national energy mix for the year 2025. The government intends to increase the portion of alternative energy from 0.1% to 0.2% to 0.4% in 2025. Bioethanol as a part of the biofuel program was targeted at 1.335% for the whole program in 2025, which compared to other energy program, is high (solar energy 0.020%, wind power 0.028%, fuel cell 0.000%). Only nuclear target energy power which has a higher percentage value (1.993%) compared to biofuel. In 2006 Indonesian government policy to reach 2 percent of biofuel in the National energy consumption by the year 2010 with 5.29 million kilolitres at target and at least 5 percent by the year 2025 with 22.26 million kilolitres
Population Growth Economic Growth Living Standard Growth
Increase Energy Demand (200%) Increase Electricity Demand (350%)
Environment Problems: Global Warming, Pollution Acid Rain,Health Issue
Energy Selection
Technology Based
Natural Resources Based
Environment Infrastructure Energy Resource Social Welfare Politics Economics
Fossil Energy
Oil Coal Natural Gas
Renewable Energy
Nuclear Hydro Solar, Wind, Biofuel

1st Annual International Interdisciplinary Conference, AIIC 2013, 24-26 April, Azores, Portugal - Proceedings-
493
TARGET OF NATIONAL ENERGY MIX 2025
NATIONAL ENERGY MIX OF THE YEAR 2025(The SCENARIO of BaU)
Oil41.7%
Natural gas 20.6%
Coal 34.6%
PLTA (Hydroelectric power generators) 1.9%
Geothermal power 1.1%
PLTMH 0.1%
NATIONAL ENERGY MIX OF THE YEAR 2025(OPTIMIZING SCENARIO)
PLTMH 0.216%
Bio-fuel 1.335%Solar energy0.020%
Wind power0.028%Fuel cell 0.000%
Biomass 0.766%
Nuclear 1.993%
Natural gas 30.6%
Oil 26.2%
Other 4.4%Geothermal 3.8%
PLTA 2.4%
Coal: 32.7%
OPTIMIZINGENERGY
MANAGEMENT
NATIONAL (PRIMARY) ENERGY MIX OF THE YEAR 2003
Oil 54.4%
Natural gas 26.5%Coal14.1%
PLTA (Hydroelectric power generators) 3.4%Geothermal power 1.4%
Other New and Renewable Energy 0.2%
Figure 2 Government’s Target for National Energy Mix 2025 (ESDM, 2006) The government had planned to increase bioethanol uses until the year 2005, from 1% per year to around 5% in the year 2025. The government had also planned to increase the number of gasoline station to sell bioethanol from East Java, to whole part of Java island and later to Sumatra. The aim is to introduce and familiarized people with bioethanol as a substitute for fossil fuel. The road map for gasohol or mixture between bioethanol and gasoline can been seen in Figure 3. The government had planned to increase the number of bioethanol plants from 17 plants in 2006 with a capacity of 60kL per day to a target of 25 pants in the year 2016.

1st Annual International Interdisciplinary Conference, AIIC 2013, 24-26 April, Azores, Portugal - Proceedings-
494
55
ROADMAP FOR BIOETHANOL
Promoting Gasohol E-10 in Jakarta and other big
cities ( 2%)
Gasohol E-10(Bio-ethanol from molasses & starch)
Strain Yeast improvement
Fermentation process
technology
Development of Membrane for dehydration
Dehydration of bio-ethanol
with zeolite 3A
Production of bio-ethanol 99,5% with chemical dehydration technique and
molecular sieving with molasses and starch as raw materials on the scale of 8 KL/ day up to the commercial scale of 60 KL/ day
Production of bio-ethanol 99,5% with rate of production and high energy ratio with starch and palm sap as raw materials on
the commercial scale of 60 KL/ day
Carbohydrate resources as raw materials for bio-
ethanol
Development of cellulose fibers as raw
materials for bio-ethanol & fuel
Production of bio-ethanol from lignocellulose on the commercial
scale of 60 KL/ day
Product
Technology
R & D
Market
Year 2005 – 2010 2011-2015 2016-2025
Utilization of Gasohol accounts for 3% of
gasoline consumption
Utilization of Gasohol Accounts for 5% of
gasoline consumption
Gasohol (Bio-ethanol from starch and palm sap)
Gasohol (Bio-ethanol from lignocellulose, starch, palm sap)
NASIONAL GASOHOL STANDARDS
Figure 3 Indonesian Government Roadmap for Bioethanol (ESDM, 2006)
In 2008, the government planned to utilize 5 to 5.5 million hectares of cassava and 750 thousand hectares of sugar cane to increase the productivity of these alternative fuels. The government expected to add a minimum budget of Rp 100 billion, of which the interest subsidy of Rp 1 trillion will be allocated for the farmers as well as Rp 2 trillion for the initial capital of establishing financing institutions for biofuel development (Ircham, 2008)
The government is aware of the need for a replacement of fossil fuels, as proven by the various policies that have been issued by the government to support the development of national biofuel industry. Therefore it is important to identify factors that influence the competitiveness of industry in the development of biofuel in order to avoid the worst possibilities when Indonesia would have to import biofuels in the future. Data And Methodology
Study conducted for a year in 2010 and also in 2011. This study uses primary and secondary data collected from the experts, interview with various sources, including private companies, government officers, association and Universities. The secondary data were used to determine the availability of the raw materials before and after it is used as bioetanol as well information related to the bioethanol industry. Porter Diamond Model
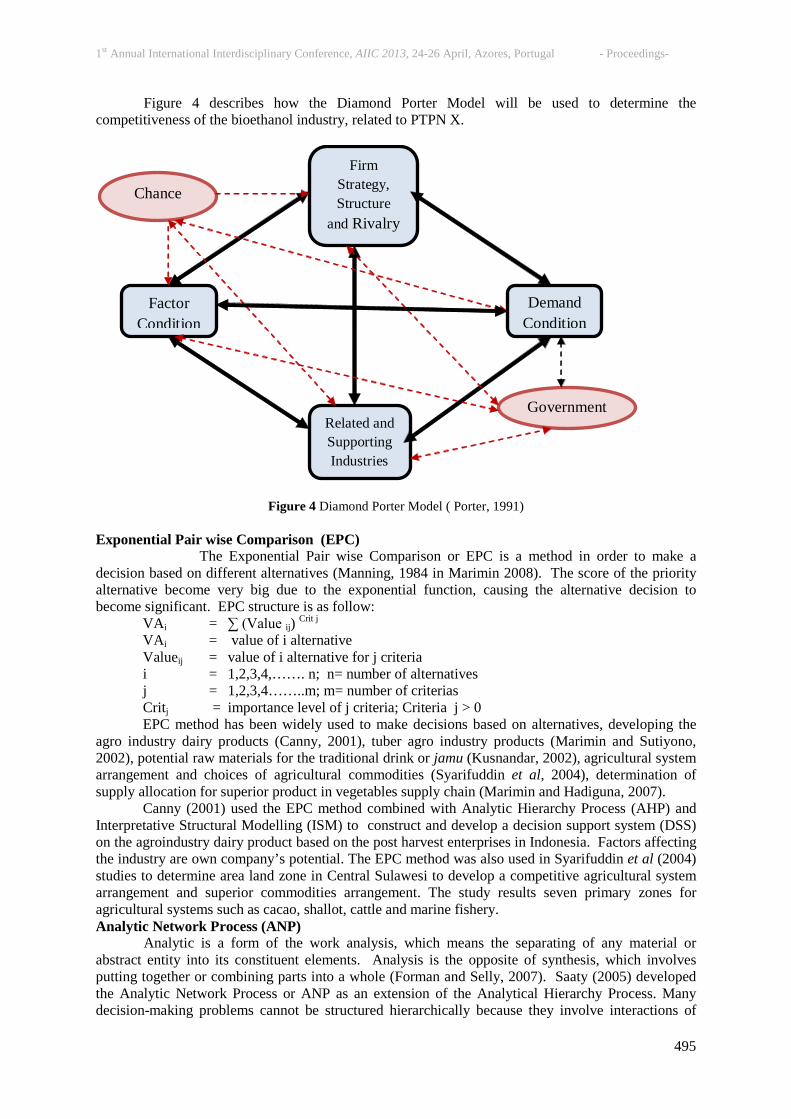
According to Porter (1991), the competitiveness of an industry could be developed through the interaction of several factors, such as the demand factor condition, firm’s strategy, structure and rivalry, related and supporting industries and the demand factor (Figure 4). The Diamond Porter Model investigates the strength and weakness of an industry and how competitive is the industry. However, opportunities and chances, along with the government play important roles to the overall competitiveness of the industry.
1st Annual International Interdisciplinary Conference, AIIC 2013, 24-26 April, Azores, Portugal - Proceedings-
495
Figure 4 describes how the Diamond Porter Model will be used to determine the competitiveness of the bioethanol industry, related to PTPN X.
Figure 4 Diamond Porter Model ( Porter, 1991)
Exponential Pair wise Comparison (EPC) The Exponential Pair wise Comparison or EPC is a method in order to make a decision based on different alternatives (Manning, 1984 in Marimin 2008). The score of the priority alternative become very big due to the exponential function, causing the alternative decision to become significant. EPC structure is as follow:
VAi = ∑ (Value ij) Crit j VAi = value of i alternative Valueij = value of i alternative for j criteria i = 1,2,3,4,……. n; n= number of alternatives j = 1,2,3,4……..m; m= number of criterias Critj = importance level of j criteria; Criteria j > 0 EPC method has been widely used to make decisions based on alternatives, developing the
agro industry dairy products (Canny, 2001), tuber agro industry products (Marimin and Sutiyono, 2002), potential raw materials for the traditional drink or jamu (Kusnandar, 2002), agricultural system arrangement and choices of agricultural commodities (Syarifuddin et al, 2004), determination of supply allocation for superior product in vegetables supply chain (Marimin and Hadiguna, 2007).
Canny (2001) used the EPC method combined with Analytic Hierarchy Process (AHP) and Interpretative Structural Modelling (ISM) to construct and develop a decision support system (DSS) on the agroindustry dairy product based on the post harvest enterprises in Indonesia. Factors affecting the industry are own company’s potential. The EPC method was also used in Syarifuddin et al (2004) studies to determine area land zone in Central Sulawesi to develop a competitive agricultural system arrangement and superior commodities arrangement. The study results seven primary zones for agricultural systems such as cacao, shallot, cattle and marine fishery. Analytic Network Process (ANP)
Analytic is a form of the work analysis, which means the separating of any material or abstract entity into its constituent elements. Analysis is the opposite of synthesis, which involves putting together or combining parts into a whole (Forman and Selly, 2007). Saaty (2005) developed the Analytic Network Process or ANP as an extension of the Analytical Hierarchy Process. Many decision-making problems cannot be structured hierarchically because they involve interactions of
Demand Condition
Factor Condition
Firm Strategy, Structure
and Rivalry
Related and Supporting Industries
Chance
Government
1st Annual International Interdisciplinary Conference, AIIC 2013, 24-26 April, Azores, Portugal - Proceedings-
496
various factors, with high-level factors occasionally depending on low-level factors (Saaty, 1996; Lee and Kim, 2000). Results And Discussions
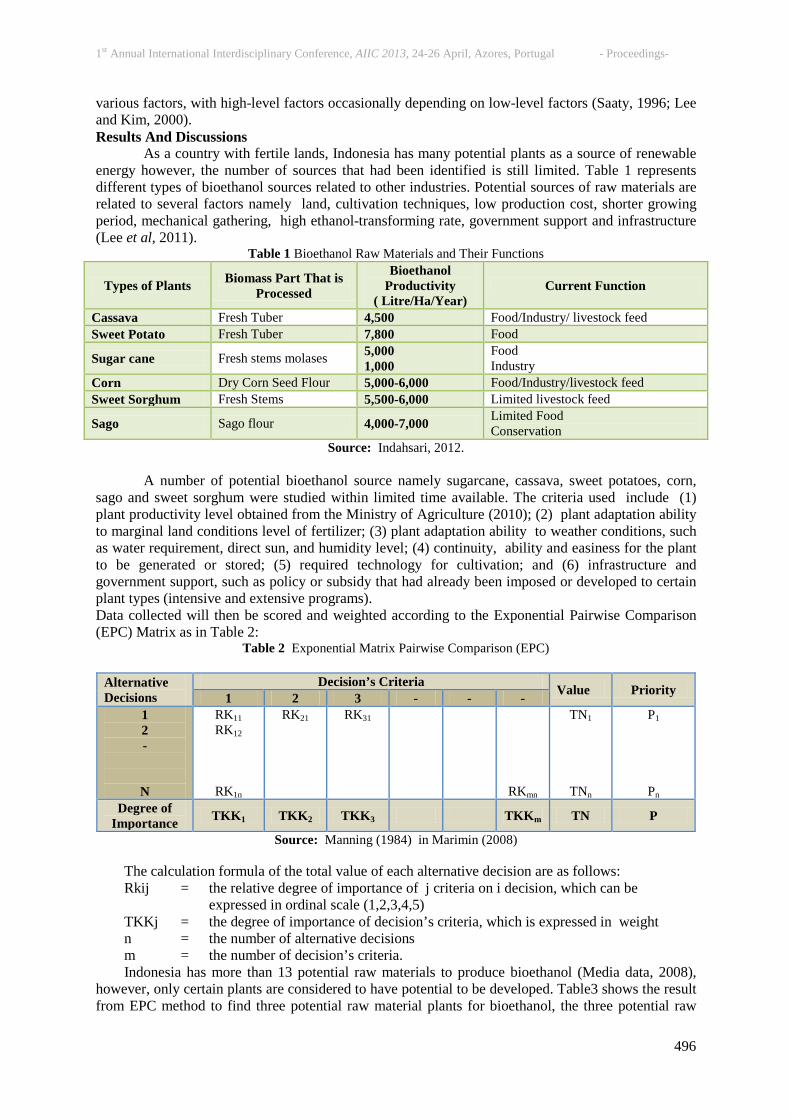
As a country with fertile lands, Indonesia has many potential plants as a source of renewable energy however, the number of sources that had been identified is still limited. Table 1 represents different types of bioethanol sources related to other industries. Potential sources of raw materials are related to several factors namely land, cultivation techniques, low production cost, shorter growing period, mechanical gathering, high ethanol-transforming rate, government support and infrastructure (Lee et al, 2011).
Table 1 Bioethanol Raw Materials and Their Functions
Types of Plants Biomass Part That is Processed
Bioethanol Productivity
( Litre/Ha/Year) Current Function
Cassava Fresh Tuber 4,500 Food/Industry/ livestock feed Sweet Potato Fresh Tuber 7,800 Food
Sugar cane Fresh stems molases 5,000 1,000
Food Industry
Corn Dry Corn Seed Flour 5,000-6,000 Food/Industry/livestock feed Sweet Sorghum Fresh Stems 5,500-6,000 Limited livestock feed
Sago Sago flour 4,000-7,000 Limited Food Conservation
Source: Indahsari, 2012.
A number of potential bioethanol source namely sugarcane, cassava, sweet potatoes, corn, sago and sweet sorghum were studied within limited time available. The criteria used include (1) plant productivity level obtained from the Ministry of Agriculture (2010); (2) plant adaptation ability to marginal land conditions level of fertilizer; (3) plant adaptation ability to weather conditions, such as water requirement, direct sun, and humidity level; (4) continuity, ability and easiness for the plant to be generated or stored; (5) required technology for cultivation; and (6) infrastructure and government support, such as policy or subsidy that had already been imposed or developed to certain plant types (intensive and extensive programs). Data collected will then be scored and weighted according to the Exponential Pairwise Comparison (EPC) Matrix as in Table 2:
Table 2 Exponential Matrix Pairwise Comparison (EPC)
Alternative Decisions
Decision’s Criteria Value Priority 1 2 3 - - - 1 2 -
N
RK11 RK12
RK1n
RK21 RK31
RKmn
TN1
TNn
P1
Pn Degree of
Importance TKK1 TKK2 TKK3 TKKm TN P
Source: Manning (1984) in Marimin (2008)
The calculation formula of the total value of each alternative decision are as follows: Rkij = the relative degree of importance of j criteria on i decision, which can be expressed in ordinal scale (1,2,3,4,5) TKKj = the degree of importance of decision’s criteria, which is expressed in weight n = the number of alternative decisions m = the number of decision’s criteria. Indonesia has more than 13 potential raw materials to produce bioethanol (Media data, 2008),
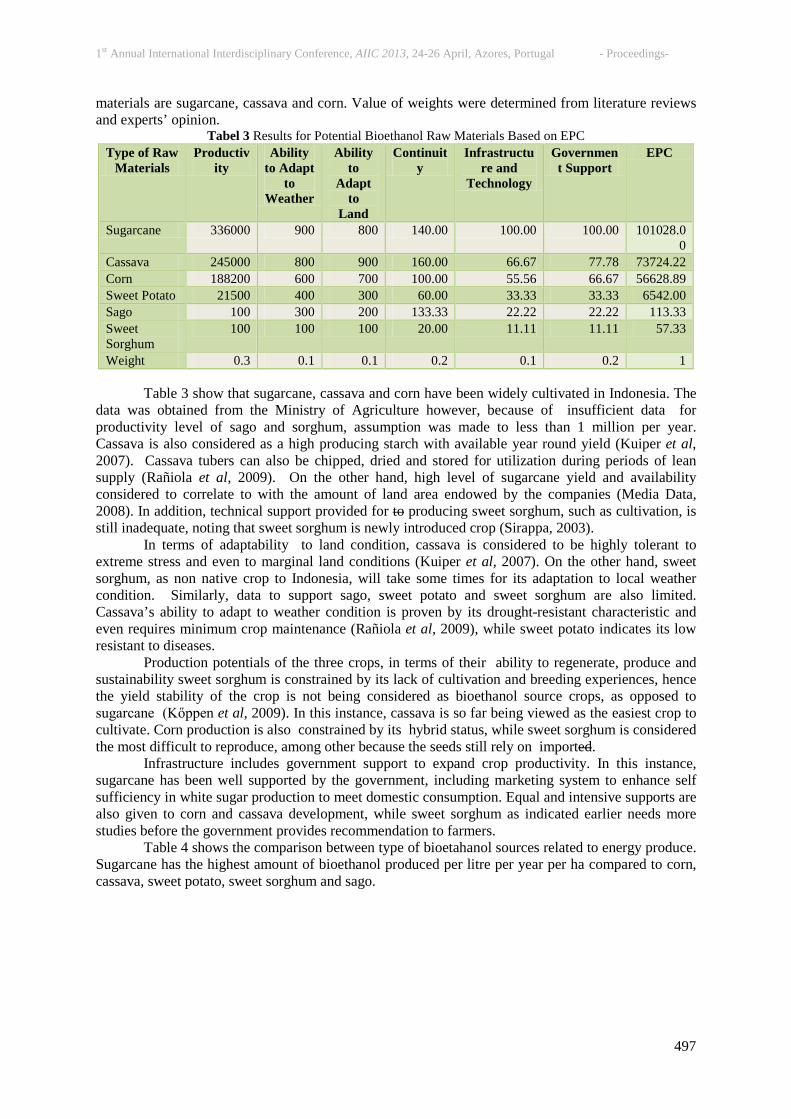
however, only certain plants are considered to have potential to be developed. Table3 shows the result from EPC method to find three potential raw material plants for bioethanol, the three potential raw
1st Annual International Interdisciplinary Conference, AIIC 2013, 24-26 April, Azores, Portugal - Proceedings-
497
materials are sugarcane, cassava and corn. Value of weights were determined from literature reviews and experts’ opinion.
Tabel 3 Results for Potential Bioethanol Raw Materials Based on EPC Type of Raw
Materials Productiv
ity Ability
to Adapt to
Weather
Ability to
Adapt to
Land
Continuity
Infrastructure and
Technology
Government Support
EPC
Sugarcane 336000 900 800 140.00 100.00 100.00 101028.00
Cassava 245000 800 900 160.00 66.67 77.78 73724.22 Corn 188200 600 700 100.00 55.56 66.67 56628.89 Sweet Potato 21500 400 300 60.00 33.33 33.33 6542.00 Sago 100 300 200 133.33 22.22 22.22 113.33 Sweet Sorghum
100 100 100 20.00 11.11 11.11 57.33
Weight 0.3 0.1 0.1 0.2 0.1 0.2 1 Table 3 show that sugarcane, cassava and corn have been widely cultivated in Indonesia. The
data was obtained from the Ministry of Agriculture however, because of insufficient data for productivity level of sago and sorghum, assumption was made to less than 1 million per year. Cassava is also considered as a high producing starch with available year round yield (Kuiper et al, 2007). Cassava tubers can also be chipped, dried and stored for utilization during periods of lean supply (Rañiola et al, 2009). On the other hand, high level of sugarcane yield and availability considered to correlate to with the amount of land area endowed by the companies (Media Data, 2008). In addition, technical support provided for to producing sweet sorghum, such as cultivation, is still inadequate, noting that sweet sorghum is newly introduced crop (Sirappa, 2003).
In terms of adaptability to land condition, cassava is considered to be highly tolerant to extreme stress and even to marginal land conditions (Kuiper et al, 2007). On the other hand, sweet sorghum, as non native crop to Indonesia, will take some times for its adaptation to local weather condition. Similarly, data to support sago, sweet potato and sweet sorghum are also limited. Cassava’s ability to adapt to weather condition is proven by its drought-resistant characteristic and even requires minimum crop maintenance (Rañiola et al, 2009), while sweet potato indicates its low resistant to diseases.
Production potentials of the three crops, in terms of their ability to regenerate, produce and sustainability sweet sorghum is constrained by its lack of cultivation and breeding experiences, hence the yield stability of the crop is not being considered as bioethanol source crops, as opposed to sugarcane (Kőppen et al, 2009). In this instance, cassava is so far being viewed as the easiest crop to cultivate. Corn production is also constrained by its hybrid status, while sweet sorghum is considered the most difficult to reproduce, among other because the seeds still rely on imported.
Infrastructure includes government support to expand crop productivity. In this instance, sugarcane has been well supported by the government, including marketing system to enhance self sufficiency in white sugar production to meet domestic consumption. Equal and intensive supports are also given to corn and cassava development, while sweet sorghum as indicated earlier needs more studies before the government provides recommendation to farmers.
Table 4 shows the comparison between type of bioetahanol sources related to energy produce. Sugarcane has the highest amount of bioethanol produced per litre per year per ha compared to corn, cassava, sweet potato, sweet sorghum and sago.

1st Annual International Interdisciplinary Conference, AIIC 2013, 24-26 April, Azores, Portugal - Proceedings-
498
Table 4 Comparison of Bioethanol Energy Crops Type of Raw Materials Ratio Of Biomass to
Bioethanol Bioethanol
(litre/yr/ha) Corn 1-6 400-2,500 Cassava 10-50 2,000-7,000 Sugarcane 40-120 3,000-8,500 Sweet Potato 10-40 1,200-5,000 Sweet Sorghum 20-60 2,000-6,000 Sago na* na*
Source: Prihandana and Hendroko (2007) Note: na* or not available
Expanding agriculture land area through the extension of commodities in unfavorable
agroecology will result in non-optimal production and productiivty, with higher risk and more input (Kartono, 2006). Therefore, it is important to identify the type of resources and raw materials that could be used to develop the bioethanol industry competitiveness. Sugarcane produces the highest bioethanol (3,000 to 8,000 litre/year/ha) followed by cassava (2,000 to 7,000 litre/year/ha) and sweet sorghum (2,000 to 6,000 litre/yr/ha). About 60% of world bioethanol production comes from sugarcane and 40% are from other crops (Balat and Balat, 2009). Sweet potato still produces almost twice bioethanol production (lt/yr/ha) as corn, while data for sago is still unavailable.
The government is carrying on-going research to develop superior varieties for sugarcane and cassava. In addition, supports has continued to further develop infrastructure to in the bioethanol system, including investment tax deduction allowance such as supporting capital seed for biofuel fund at the amount of US$ 220 million and provide incentives for farmers by subsidy interest rate as much as US$ 110 million per year (Media Data, 2008). Again, supporting data for sago and sweet potato have been very difficult to obtain, mostly because of research done in these material sources are inadequate. Sago is more developed locally by farmers in Maluku and Papua. Moreover, even sweet sorghum has the potential to produce bioethanol, this new crop has its limitation for mass cultivation due to the fact that sweet sorghum’s is not Indonesia origin (Prihandana and Hendroko, 2007). Figure 5 shows the productivity level for sugarcane, cassava and corn has increased in six years.
Figure 5 Comparison of Productivity Levels Between Cassava, Corn and Sugarcane (BPS, 2011)
Figure 6 compares production growth between corn, cassava and sugarcane. Corn has negative production growth rate in 2006 and has the tendency to decrease compared to production growth of cassava and sugarcane in 2010.
1st Annual International Interdisciplinary Conference, AIIC 2013, 24-26 April, Azores, Portugal - Proceedings-
499
Figure 6 Comparison of Production Growth Rate (%) Between Corn, Sugarcane and Cassava (BPS, 2011)
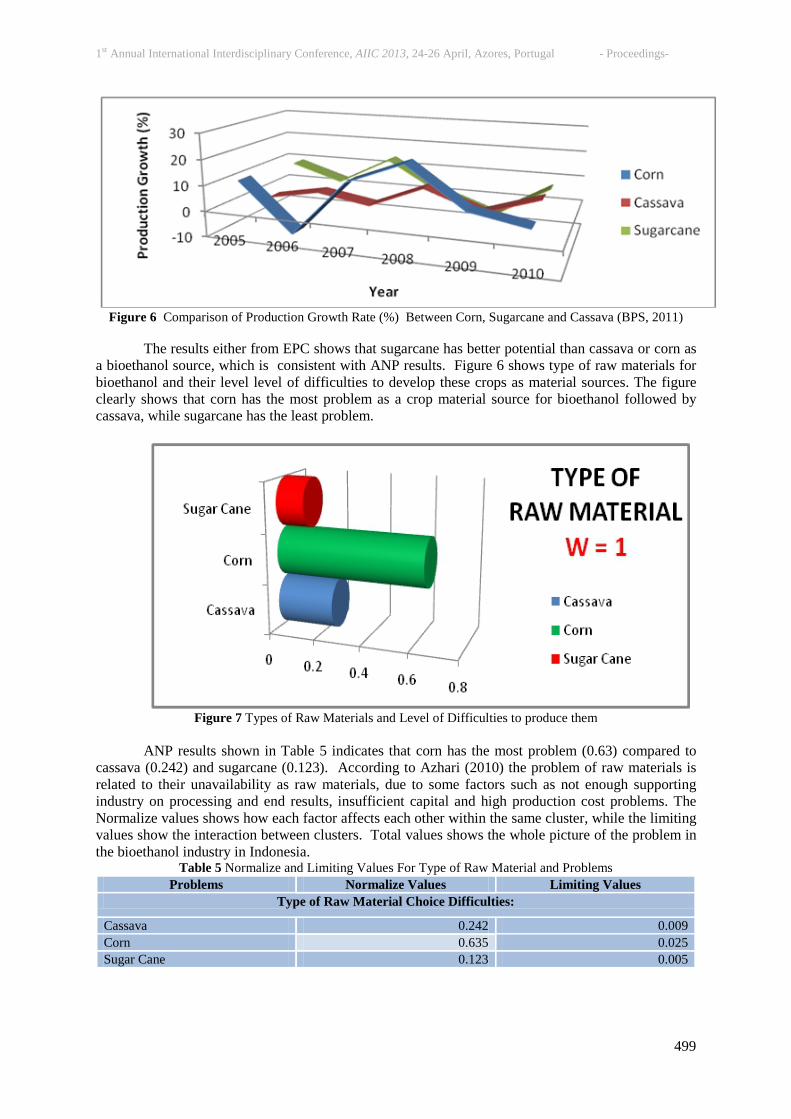
The results either from EPC shows that sugarcane has better potential than cassava or corn as
a bioethanol source, which is consistent with ANP results. Figure 6 shows type of raw materials for bioethanol and their level level of difficulties to develop these crops as material sources. The figure clearly shows that corn has the most problem as a crop material source for bioethanol followed by cassava, while sugarcane has the least problem.
Figure 7 Types of Raw Materials and Level of Difficulties to produce them
ANP results shown in Table 5 indicates that corn has the most problem (0.63) compared to
cassava (0.242) and sugarcane (0.123). According to Azhari (2010) the problem of raw materials is related to their unavailability as raw materials, due to some factors such as not enough supporting industry on processing and end results, insufficient capital and high production cost problems. The Normalize values shows how each factor affects each other within the same cluster, while the limiting values show the interaction between clusters. Total values shows the whole picture of the problem in the bioethanol industry in Indonesia.
Table 5 Normalize and Limiting Values For Type of Raw Material and Problems Problems Normalize Values Limiting Values
Type of Raw Material Choice Difficulties:
Cassava 0.242 0.009 Corn 0.635 0.025 Sugar Cane 0.123 0.005
1st Annual International Interdisciplinary Conference, AIIC 2013, 24-26 April, Azores, Portugal - Proceedings-
500
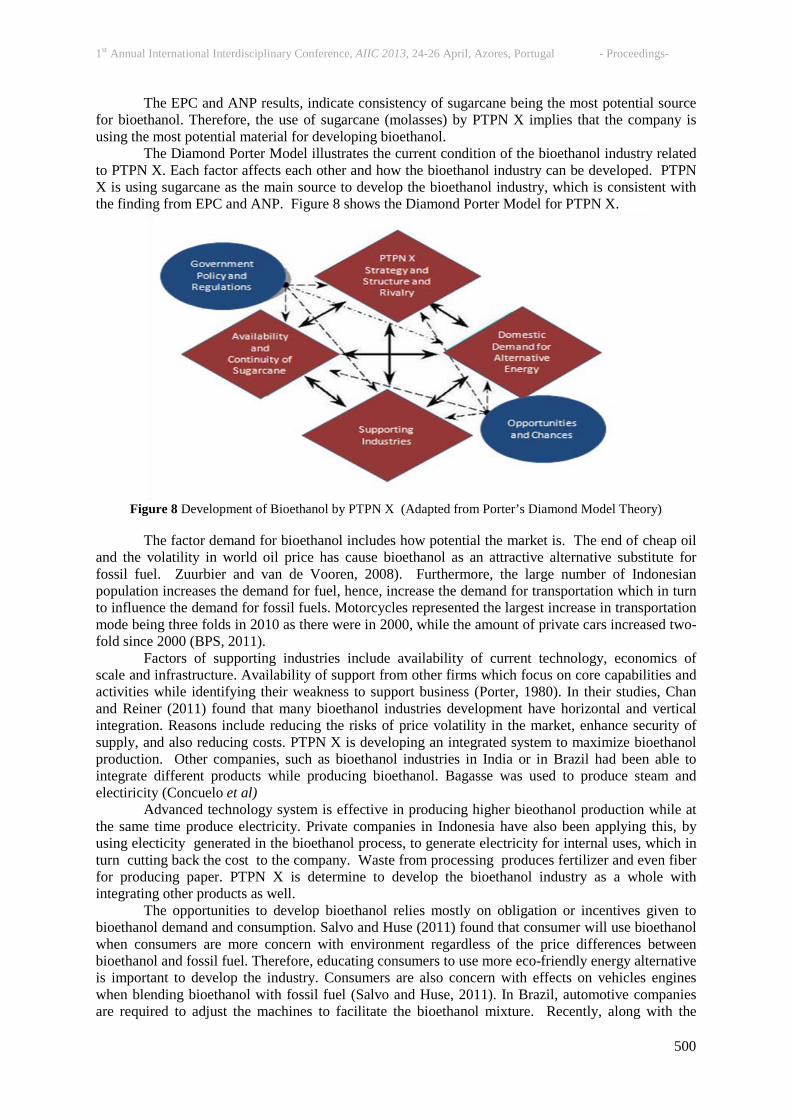
The EPC and ANP results, indicate consistency of sugarcane being the most potential source for bioethanol. Therefore, the use of sugarcane (molasses) by PTPN X implies that the company is using the most potential material for developing bioethanol. The Diamond Porter Model illustrates the current condition of the bioethanol industry related to PTPN X. Each factor affects each other and how the bioethanol industry can be developed. PTPN X is using sugarcane as the main source to develop the bioethanol industry, which is consistent with the finding from EPC and ANP. Figure 8 shows the Diamond Porter Model for PTPN X.
Figure 8 Development of Bioethanol by PTPN X (Adapted from Porter’s Diamond Model Theory)
The factor demand for bioethanol includes how potential the market is. The end of cheap oil
and the volatility in world oil price has cause bioethanol as an attractive alternative substitute for fossil fuel. Zuurbier and van de Vooren, 2008). Furthermore, the large number of Indonesian population increases the demand for fuel, hence, increase the demand for transportation which in turn to influence the demand for fossil fuels. Motorcycles represented the largest increase in transportation mode being three folds in 2010 as there were in 2000, while the amount of private cars increased two-fold since 2000 (BPS, 2011).
Factors of supporting industries include availability of current technology, economics of scale and infrastructure. Availability of support from other firms which focus on core capabilities and activities while identifying their weakness to support business (Porter, 1980). In their studies, Chan and Reiner (2011) found that many bioethanol industries development have horizontal and vertical integration. Reasons include reducing the risks of price volatility in the market, enhance security of supply, and also reducing costs. PTPN X is developing an integrated system to maximize bioethanol production. Other companies, such as bioethanol industries in India or in Brazil had been able to integrate different products while producing bioethanol. Bagasse was used to produce steam and electiricity (Concuelo et al)
Advanced technology system is effective in producing higher bieothanol production while at the same time produce electricity. Private companies in Indonesia have also been applying this, by using electicity generated in the bioethanol process, to generate electricity for internal uses, which in turn cutting back the cost to the company. Waste from processing produces fertilizer and even fiber for producing paper. PTPN X is determine to develop the bioethanol industry as a whole with integrating other products as well.
The opportunities to develop bioethanol relies mostly on obligation or incentives given to bioethanol demand and consumption. Salvo and Huse (2011) found that consumer will use bioethanol when consumers are more concern with environment regardless of the price differences between bioethanol and fossil fuel. Therefore, educating consumers to use more eco-friendly energy alternative is important to develop the industry. Consumers are also concern with effects on vehicles engines when blending bioethanol with fossil fuel (Salvo and Huse, 2011). In Brazil, automotive companies are required to adjust the machines to facilitate the bioethanol mixture. Recently, along with the

1st Annual International Interdisciplinary Conference, AIIC 2013, 24-26 April, Azores, Portugal - Proceedings-
501
commitment of the National Oil Company, Petrobras, automobile engines have been developed to receive any mixture of ethanol and fossil fuel (0 to 100% ethanol), called ‘flex fuel vehicles’. The US Alternative Motor Fuel Acts of 1998 credits automobile producers when producing automobiles that are capable to blend bioethanol 85% to petroleum based gasoline of 15% (Zhang and Wetztein, 2008). Bioethanol has lower energy content than fossil fuel, implying that bioethanol perform less miles per gallon compared to fossil fuel, however results in similar power and performance (Anderson, 2008). Therefore, bioethanol is more efficient and as effective as fossil fuel.
Indonesian government has produced policies and regulations to support the development of bioethanol, which provide energy security, reduce the greenhouse gas emissions while increasing and diversifying income of farmers and rural communities as a potential factors to support bioethanol industry (Zuurbier and van de Vooren, 2008). Presidential Regulation No. 5 of 2006 contains several directions of the national energy policy, such as the composition of a balanced source of energy of 54% petroleum, 26% natural gas and 14% coal. In 2025, which was expected that there would be a reduction in the contribution of oil to 20%, of natural gas to 30%, of coal to 2% , and increase of renewable energy (biomass, water, wind, solar and nuclear) to more than 5%, of geothermal to more than 5% , and of vegetable fuels (biofuels) equal to 5% in every national energy needed (BPPT, 2008). The Presidential Instruction No. 5 of 2006 mentioned the supply and use of biofuel. Therein, it has been instructed to a number of Ministries and local governments to take any measure in encouraging the supply and use of Bioethanol (Krisnamurthi, 2007). The roadmap for gasohol or mixture between bioethanol and gasoline can been seen in Figure 9. The government had planned to increase the number of bioethanol plants from 17 plants in 2006 with a capacity of 60kL per day to a target of 25 pants in the year 2016.
Figure 9 Government’s Plan for Bioethanol (ESDM, 2006)
Concluding Remarks
Large scale bioethanol industry such as the one being operated by the PTPN X has a comparative advantage compared to others being run by small scale companies, from the viewpoints of integrating upstream through downstream factors, conditional to government policy to support the production of molasses. For example, sugar companies are still producing single final product, that is white sugar with molasses as side product. The main reason for the PTPN X being able to develop an integrated bioethanol industry with reduced costs is that electricity produced can be internally utilized while also producing steam and fertilizer.
Favorable conditions for the PTPN X to use sugarcane as the most potential raw material is its adoption of vertical integration which ensure optimum supply of the stock and technology used. In addition, the government has also been trying to stimulate the bioethanol industry, which proven that opportunity and support are equally important.
It is important that government policies related to the scale of bioethanol industry must be followed up with government and financial support for research and development, equipments and facilities, land use and market system. Further studies should be conducted on factors affecting cluster concentration development.
2005 2006 2008 2011 2016 2025
year
Development/expansion of demo plant 8kL/day
Construction of 8 plants @ 60kL/day
Construction of 13 plants @ 60kL/day
Construction of 25 plants @ 60kL/day
Construction of 17 plants @ 60kL/day

1st Annual International Interdisciplinary Conference, AIIC 2013, 24-26 April, Azores, Portugal - Proceedings-
502
References:
Anderson ST. he Demand for Ethanol as a Gasoline Substitute. Journal of Transport Economics and Policy 36 (1):1-26. Accessed on June, 2012. 2008.
Azahari DH. Seminar Pengembangan Industri Biofuel (Tantangan Baru untuk Sektor Pertanian). Bogor. Pusat Analisis Sosial Ekonomi dan Kebijakan Pertanian. Badan Litbang Pertanian, Departemen Pertanian. 2008
Badan Pusat Statistik (BPS). Data on Consumption, Production, Import and Export of Fuel. 2011
BPPT. Energy. Where Do We Go From Here? 2005 Chan JH and Reiner D. Vertical Integration in Growing Industry: Security of Supply and Market Access in Fuel-Ethanol Value Chain. Strategic Management Journal 5: 171-180. Accessed on June, 2012.. Canny AH. Rekayasa SIstem Pengembangan Agroindustri Susu Berbasis Usaha Lepas Panen Susu. Dissertation. Bogor Agricultural University. 2001 ESDM (Ministy of Energy and Mineral Resources). Blueprint of National Energy Management 2005-2025. www.esdm.go.id. Accessed May 2009 at 22.35 WIB. 2006 Forman E and Selly MA. Decision by Objectives. George Washington University. Expert Choice Inc. Washington DC 2007. Ircham M. Bioetanol Dongkrak Pamor Singkong. Jurnal Bogor. 2008 Indahsari GK. 2Strategy to Enhance Competitiveness of Indonesia’s Bioethanol Industry. Bogor Agricultural University. Dissertation. 2012 Kartono G. 2006. Role of AEZ (Agroecology Zone) and LQ (Location Quotient) in Extension of Horticulture in East Java. Bulletin Teknologi dan Informasi Pertanian BPTP Jawa Timur 9:23-32. 2006 Kőppen S, Reinhardt G and Gärtner S. Assesment of Energy and Greenhouse Gas Inventories of Sweet Sorghum for First and Second Generation Bioethanol. FAO Environmental and Natural Resources Service Series No.30. 83pp. 2009 Kuiper L, Ekmekci B, Hamelinck C, Hettinga W, Meyer S and Koop K. Bioethanol from Cassava. Paper ECOFYS. Netherlands. 44pp. 2007 Kusnandar. Rekayasa Model Pengembangan Industri Kecil Jamu. Universitas Sebelas Maret. Surakarta. 2002 Lee SR, Shin HH, Jeong JH, Hwang KT and Kim TY. Effet of Ethanol Concentrations and Extaction Time on Acanthoside-D and Total Polyphenol Contents and Antioxidant Activities in Ethanol Extracts of Eleuthero. Journal of Medicine Plant Reserch 5(24): 5700-5705. 2011 Lee JW and Kim SH. Using Analytic Network Process and Goal Progamming for Interdependent Information System Project Selection. Computers and Operations Research 27:367-382. 2000. Manning WA. Decision Making: How a Microcomputer Aids the Process Portland State University. 1984 Marimin dan Sutiyono A. Model Sistem Manajemen Ahli Perencanaan Investasi 2002. Produk Agroindustri Komoditas Umbi-umbian. Proceeding, Komputern dan Sistem Intelijen (Kommit). Jakarta. 10 pages. Media Data. Biofuel. Media Data Publ. Jakarta. 2008. Ministry of Agriculture. peluang Agribisnis Menjadi Sumber Devisa Negara yang Utama. Direktorat Jenderal Pengolahan dan Pemasaran Hasil Pertanian Kementrian Pertanian Republik Indonesia. http://pphp.deptan.go.id accessed February 2009 (21.05 WIB). 2008. Consuelo L, Pereira F and Ortega. Sustainability Assessment of Ehtanol Production from Sugarcane. 1st International Workshop. Advanced in Cleaner Production. The Diamond Porter Model investigates the strength and weakness of an industry and how competitive is the industry. Accessed June 7th 2012. Porter ME. Toward a Dynamic Theory of Strategy. Strategy Management. New York: The Free Press. 1991 Prihandana R, Noerwijat K, Adinurani PG, Setyaningsih D, Setiadi S dan Hendroko R. Bioetanol Ubi Kayu: Bahan Bakar Masa Depan. AgroMedia Pustaka. Tangerang. 194 hal. 2007 Rañiola RFJ, Demafelis RB, Rosario EDS and Batalier BG. Enhancing the Viability of Cassava Feedstock for Bioethanol in the Phillippines. Journal ISSAS Vol. 2. Pp 147-158. 2009. Saaty TL. Theory and Applications of the Analytic Network Process. Decision Making with Benefits, Opportunities, Costs and Risks. RWS Publications, PA 2005.

Reproduced with permission of the copyright owner. Further reproduction prohibited withoutpermission.