tourist motivation to use homestays in thailand …thesis entitled tourist motivation to use...
TRANSCRIPT
TOURIST MOTIVATION TO USE HOMESTAYS IN THAILAND
AND THEIR SATISFACTION BASED ON
THE DESTINATION’S CULTURAL AND HERITAGE-BASED ATTRIBUTE
A Thesis presented to the Faculty of the Graduate School
University of Missouri
In Partial Fulfillment
of the Requirements for the Degree
Master of Science
by
KANOKNON SEUBSAMARN
Dr. Seonghee Cho, Thesis Supervisor
DECEMBER 2009
The undersigned, appointed by the Dean of the Graduate School, have examined the
thesis entitled
TOURIST MOTIVATION TO USE HOMESTAYS IN THAILAND
AND THEIR SATISFACTION BASED ON
THE DESTINATION’S CULTURAL AND HERITAGE-BASED ATTRIBUTE
Presented by Kanoknon Seubsamarn
a candidate for the degree of Master of Science
and hereby certify that in their opinion it is worthy of acceptance.
Dr. Seonghee Cho, Hotel & Restaurant Management
Dr. Dae-Young Kim, Hotel & Restaurant Management
Dr. Carla Barbieri, Parks, Recreation & Tourism

ii
ACKNOWLEDGEMENTS
This master thesis is written in the hospitality management program in the
department of Food and Hospitality System at the University of Missouri. The thesis has
been written during the winter and fall of 2009. This period of hard work has been very
interesting and has provided me with a deeper knowledge regarding the field of customer
relationship management in the tourism industry.
While I have been working on this thesis, many people have supported me and
contributed in different ways. First of all, I want to thank Dr. Seonghee Cho, my thesis
advisor, for her guidance throughout the process and her support over the years. I also
want to thank Dr. Dae-Young Kim and Dr. Carla Barbieri for their advice that helped me
improve the quality of this thesis.
In addition, this thesis would never been accomplished without cooperation from
the industry. Therefore, I am deeply grateful to all homestay owners and homestay
managers that helped me and supported me during the data collection process.
Finally, I want to express my appreciation to my parents for their support during
all my years of academic studies.

iii
TABLE OF CONTENTS
ACKNOWLEDGEMENTS ................................................................................................ ii
LIST OF TABLES .............................................................................................................. v
LIST OF FIGURES ........................................................................................................... vi
ABSTRACT ...................................................................................................................... vii
Chapter
1. INTRODUCTION ...................................................................................................... 1 1.1 Background ......................................................................................................... 1
1.2 Problem Statement .............................................................................................. 5 1.3 Purpose of Study ................................................................................................. 5
1.4 Objectives of the study........................................................................................ 6 1.5 Hypotheses .......................................................................................................... 7 1.6 Significance of the Study .................................................................................... 8
1.7 Definitions........................................................................................................... 9 1.8 Limitations ........................................................................................................ 10
1.9 Outline of Subsequent Chapters........................................................................ 11
2. REVIEW OF LITERATURE ................................................................................... 12
2.1 Introduction ....................................................................................................... 12
2.2 Tourists’ Demographic Characteristic .............................................................. 12 2.3 Homestay .......................................................................................................... 14 2.4 Tourists’ Satisfaction ........................................................................................ 16
2.5 Culture and Heritage Attributes ........................................................................ 18 2.6 Tourists’ Motivation ......................................................................................... 20 2.7 Summary ........................................................................................................... 24
3. METHODOLOGY ................................................................................................... 25 3.1 Introduction ....................................................................................................... 25 3.2 Purpose of the Study ......................................................................................... 26 3.3 Research Design................................................................................................ 26
3.4 Population and Sampling .................................................................................. 27 3.4.1 Population .............................................................................................. 27
3.4.2 Sample frame ......................................................................................... 27 3.4.3 Sample and Data Collection ................................................................... 27 3.4.4 Sampling error ....................................................................................... 28 3.4.5 Selection error and frame error .............................................................. 29
3.5 Institutional Review Board ............................................................................... 29

iv
3.6 Instrumentation ................................................................................................. 29
3.6.1 Validity .................................................................................................. 29 3.6.2 Measurement .......................................................................................... 30 3.6.2 Reliability ............................................................................................... 32
3.7 Data Analysis .................................................................................................... 33 3.8 Preliminary Evaluation of Data ........................................................................ 34
3.8.1 Data screening and Missing Analysis Procedures ................................. 34 3.8.2 Statistic Assumptions ............................................................................. 34
3.9 Summary ........................................................................................................... 35
4. RESULTS ................................................................................................................. 36 4.1 Introduction ....................................................................................................... 36 4.2 Demographic Characteristics of Subjects ......................................................... 36
4.3 Tourists’ Overall Level of Satisfaction with Homestays in Thailand............... 39 4.4 Testing the Hypotheses ..................................................................................... 40
4.4.1 Hypothesis 1........................................................................................... 40 4.4.2 Hypothesis 2........................................................................................... 45
4.4.3 Hypothesis 3........................................................................................... 52 4.6 Summary ........................................................................................................... 58
5. DISCUSSION ........................................................................................................... 59 5.1 Introduction ....................................................................................................... 59
5.2 Conclusion ........................................................................................................ 59 5.3 Implications....................................................................................................... 62 5.4 Recommendation for Future Study ................................................................... 65
5.5 Limitations ........................................................................................................ 65
APPENDIX
A. Signed Permission Letter ................................................................................... 67
B. Informed Consent Form ..................................................................................... 69 C. Survey Questionnaire ......................................................................................... 71
REFERENCES ................................................................................................................. 75

v
LIST OF TABLES
Table Page
1. Variables of the study……………………………………………........................31
2. Demographic characteristics of the tourists
who visited homestay in Thailand…………………………………….............38
3. Tourists’ Overall Level of Satisfaction with
the Homestays in Thailand…….………………….…………………………..39
4. Results on t-test between overall satisfaction
with Gender and Country of Resident……………….…….……...……..........42
5. The overall tourists’ satisfaction in terms of
tourists’ demographic characteristics (e.g., age,
marital status, education levels, and total household incomes………………..44
6. The result of factor analysis on destination attributes………...…………………47
7. Correlation between Overall Satisfaction and Four Factors………...…………...48
8. Regression results of tourists’ overall satisfaction level
based on the dimension attributes………………………………………..…..51
9. The result of factor analysis on tourists’ motivation for travel……….…….……54
10. Correlation between Overall Satisfaction and Two Factors…………………..… 55
11. Regression results of tourists’ overall satisfaction level
based on the dimension……………………………..……………………….. 57

vi
LIST OF FIGURES
Figure Page
1. Cultural tourism proportion of tourist surveyed
who were on a cultural holiday 1997-2007………………………………….2

vii
A STUDY OF TOURIST MOTIVATION TO USE HOMESTAYS
IN THAILAND AND THEIR SATISFACTION BASED ON
THE DESTINATION’S CULTURAL AND HERITAGE-BASED ATTRIBUTE
Kanoknon Seubsamarn
Seonghee Cho Ph.D., Thesis Supervisor
ABSTRACT
This research explores the motivations and demographic characteristics of
tourists and investigates which attributes satisfy tourists who visit cultural destinations. It
is hypothesized that tourists’ overall satisfaction of a destination is a function of attribute
and tourists’ motivation. Homestays in Thailand, serving as a cultural and heritage
vacation destination, were used as the study site for this research. The data of this study
was collected from homestays in the central part of Thailand during July-August 2009.
Descriptive analysis, correlation analysis, and multiple regression analysis were
employed according to respective objectives in this study. The results revealed that
demographic characteristic, cultural/heritage attributes, tourists’ motivation, were
correlated with tourists’ overall satisfaction. Tourists’ motivation and cultural/heritage
attribute on personal satisfaction of tourists who visited homestays in Thailand are key
indicators of tourists’ overall satisfaction.

1
CHAPTER 1
INTRODUCTION
1.1 Background
Cultural and heritage tourism focuses on the characteristics of tourists who visit
cultural and heritage destinations. It has become a major new area in the tourism industry
because of people’s inclination to seek adventure, traditional culture, history,
archaeology and interaction with local people (Hollinshead, 1993). Tourists seek out
adventures that could immerse them in a culture or a place (Thompson, 1998). According
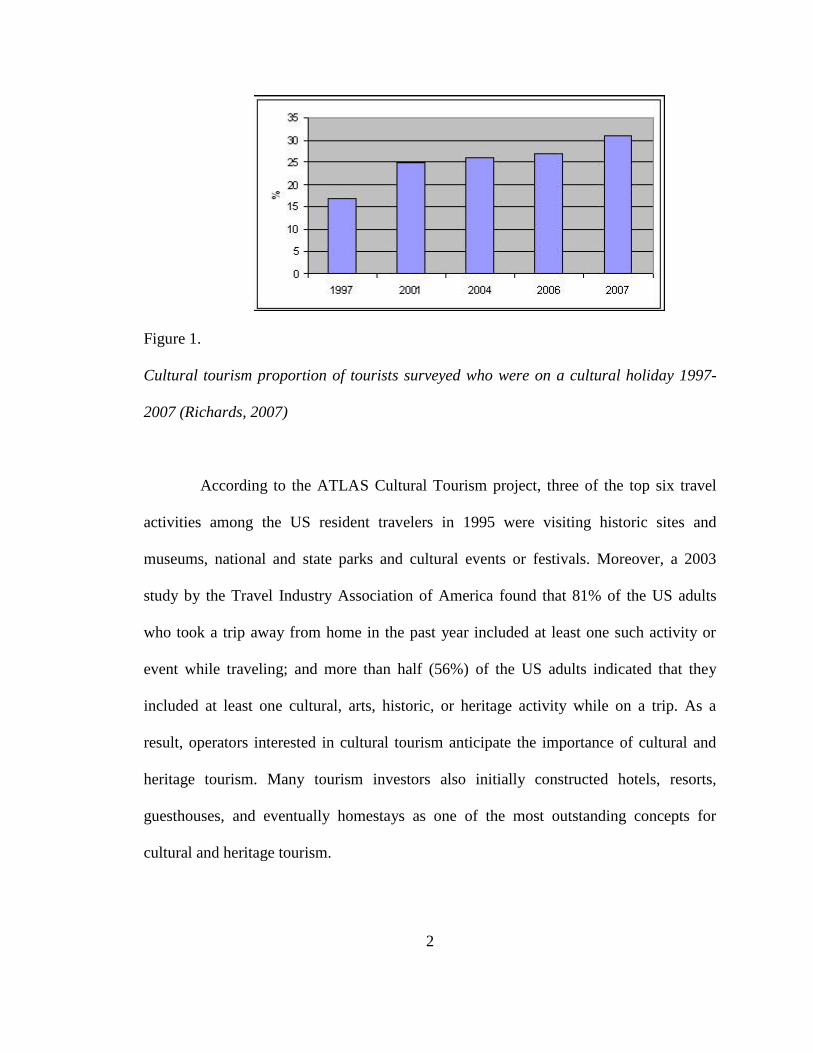
to the Argonne Tandem Linear Accelerator System (ATLAS) Cultural Tourism visitor
surveys in eight countries in 2007, cultural tourism continued to grow in importance.
Figure 1 shows that the cultural tourism proportion of respondents from their holiday has
doubled in 2007 compared to 1997. This increase of cultural tourism indicates that
cultural tourism has become important in the worldwide destination market (Richards,
2007).
2
Figure 1.
Cultural tourism proportion of tourists surveyed who were on a cultural holiday 1997-
2007 (Richards, 2007)
According to the ATLAS Cultural Tourism project, three of the top six travel
activities among the US resident travelers in 1995 were visiting historic sites and
museums, national and state parks and cultural events or festivals. Moreover, a 2003
study by the Travel Industry Association of America found that 81% of the US adults
who took a trip away from home in the past year included at least one such activity or
event while traveling; and more than half (56%) of the US adults indicated that they
included at least one cultural, arts, historic, or heritage activity while on a trip. As a
result, operators interested in cultural tourism anticipate the importance of cultural and
heritage tourism. Many tourism investors also initially constructed hotels, resorts,
guesthouses, and eventually homestays as one of the most outstanding concepts for
cultural and heritage tourism.

3
The homestay which refers to a stay at a residence by a traveler or a visiting
foreign student is viewed as a mean of culture and heritage tourism emerging with
traditional houses and culture of residents achieving two goals at the same time:
increasing the income of host country families and encouraging them to preserve their
cultural heritage by presenting their traditional houses (Wang, 2007). Many tourists
believe that the homestays they participate in represent a unique living in a new culture.
Tourists seek authentic experience and architecture of the host culture. Homestays could
provide the cultural experience and the sense of being at home. This allows them to
behave more freely and feel comfortable and relaxed in a foreign culture. The search for
an authentic experience among travelers also increases the construction of cultural and
heritage based tourism in order to provide a more authentic encounter for tourists.
Through homestays, these cultural attributes often provide participants - with such staged
authenticity and acceptable satisfaction while hosts seek to offer tourists a genuine
connection to the community. Residents desire tourists to visit their houses because
travelers bring economic benefits to their community while they are still maintain their
traditional culture and heritage (Cole, 2007).
Homestays in Thailand have become increasingly popular in the Thai tourism
industry since 2004, and their development is expected to continue according to the
economic and social developing plan of the Thai government 8th
edition. From 2004 to
2009, Thailand’s Ministry of Tourism helped construct homestays in 98 villages
throughout Thailand; 30 villages in the northern part, 32 villages in the north-eastern
part, 8 villages in the midwest part, 17 villages in the central part, and 11 villages in the
south part (Anonymous, 2007). Previous researchers studied the relevance of Thailand’s

4
heritage-based attractions to both international and domestic tourism, and provided
several attributes to these attractions such as traditional villages, temples, and
monuments (Peleggi, 1996). According to Thailand’s Ministry of Tourism researches,
the researchers of Thai tourism examined the hosts’ satisfaction on homestay business
and cultural attribute constructions. The results showed that the hosts were very satisfied
in turning their houses into homestays. Thailand’s Ministry of Tourism also agreed to
support and help the hosts to develop their business (Anonymous, 2008). Therefore, the
cultural and heritage attributes such as food, shopping places, and accommodations were
built into villages in Thailand for homestays in order to attract travelers who searched for
a mix of activities in an area. Travelers frequently seek adventures that immerse them in
the culture or a place and search for small groups and personalized services. Tourism
investors can learn about tourist interests and help shape the presentation of cultural and
heritage attributes as well as the growing number of homestays in Thailand. The
homestay is a new concept in Thai tourism and it lacks studies providing the homestay
information. Thus, this study was created in order to provide more information to
homestay investors and homestay managers. This study investigated which attributes
satisfy tourists who participate in homestays and what motivates tourists to choose
homestay in Thailand.

5
1.2 Problem Statement
Homestays are viewed as a means of cultural and heritage tourism. During
1998-1999, Thailand’s government announced these two years to be the year of Thai
tourism by using the slogan of Amazing Thailand that has been used several times.
Because of this trend, the government helped cultural tourism investors to develop their
business and supported Thailand’s homestay programs since 2004. Therefore, the sector
of cultural tourism and the sector of homestay tourism were interested by tourism
investor (Anonymous, 2007). To develop this market, desirable cultural and heritage
attributes should be considered. Homestay managers need to consider which attributes
influence tourist destination choice and satisfaction in order to develop strategies in
attracting and satisfying the homestay participants. Although several researchers have
studied the cultural and heritage tourism, they did not certainly provide homestay issues,
especially homestays in Thailand. The homestay is a new concept of Thai tourism but it
is expected to continue. Thus, this study could be applied to investigate what factors
would motivate tourists to choose homestays in Thailand and to predict tourists’ overall
satisfaction based on cultural and heritage attributes.
1.3 Purpose of Study
The purpose of this study is (1) to explore demographic profiles of tourists who
visited homestays in Thailand, (2) to explore factors which influence tourists’ choice of
homestays, (3) to investigate which attributes satisfy tourists who chose a homestay, (4)
to investigate motivation factors which influence tourists’ satisfaction. Addressing these

6
questions will assist homestay operators in developing strategies to attract more travelers.
The tourists within the homestay industry in Thailand are considered to be a target group
because the program has become increasingly popular with foreign travelers, and it is
expected to continue to increase.
1.4 Objectives of the Study
The objectives of this study are:
1. To describe the demographic characteristics (age, gender, country of residence,
marital status, education level, and total household income) of travelers within the
homestay industry in Thailand,
2. To determine attributes affecting the tourist’s overall satisfaction in order to
enhance the attractiveness of the homestay offerings,
3. To identify the motivations driving tourists to choose homestays as a lodging
option in Thailand,
4. To investigate satisfaction of tourists towards the homestay industry in Thailand,
and
5. To examine a relationship between tourists’ motivation, the destination’s cultural
and heritage attributes and overall satisfaction of tourists who visited homestays
in Thailand.

7
1.5 Hypotheses
Hypothesis 1: There will be relationships between the overall satisfaction and
the the tourists’ demographic characteristic.
Hypothesis 1a: There will be a relationship between the overall satisfaction and
gender.
Hypothesis 1b: There will be a relationship between the overall satisfaction and
the tourist’s age groups.
Hypothesis 1c: There will be a relationship between the overall satisfaction and
the tourist’s country of resident.
Hypothesis 1d: There will be a relationship between the overall satisfaction and
tourist tourist’s marital status.
Hypothesis 1e: There will be a relationship between the overall satisfaction and
tourist’s education levels.
Hypothesis 1f: There will be a relationship between the overall satisfaction and
tourist’s total household incomes.
Hypothesis 2: Cultural and heritage attributes of homestay in Thailand will
predict overall satisfaction of tourists who visited homestays in Thailand.
Hypothesis 3: Tourists’ motivation will predict the overall satisfaction of
tourists who visited homestays in Thailand.
8
1.6 Significance of the Study
Culture and heritage tourism trends have particular relevance for rural areas
when they are accompanied by abundant natural resources. Traditional ways of earning
on stocks provide the primary source of income. But, to stimulate rural economies, it has
become unavoidable for rural regions to seek alternative uses for local resources (Liu,
2006). Cultural heritage tourism is an option for enhancing rural lifestyles and
distributing income in the region. As a result, tourism has become the priority tool of
rural orthodoxy (Augustyn, 1998).
Homestay programs play the main role in cultural tourism and are the fastest
growing segments of the tourism market (Wang, 2007). The culture and heritage that has
been preserved in a location causes the local people’s everyday lives to infiltrate the
everyday lives of travelers and thus, makes a homestay more attractive. Because of this,
homestay tourism is a rapidly growing niche market, utilized by an increasing number of
domestic and international tourists. As an attraction, it also continues to grow due to
word-of-mouth. Therefore, to expand this market, the desirable cultural and heritage
attributes should be considered in order to raise the number of travelers and thus,
increase the local resident income. In addition, operators need to regard which attributes
influence tourist satisfaction and their destination choice in order to formulate the
strategies that attract and better satisfy customers. Although several researchers have
studied the cultural and heritage tourism, they did not provide homestay issues,
especially homestays in Thailand. The homestay is a new concept of Thai tourism but it
is expected to continue. In this regard, this study could be applied to investigate what

9
factors would motivate tourists to choose homestays in Thailand and to predict tourists’
overall satisfaction based on cultural and heritage attributes.
1.7 Definitions
Travel motivation
Motivation is defined as “A need or desire that energizes behavior and directs it
towards a goal” (Myers, 2004, p.345). Travel motivation refers to a set of needs that
predisposes a person towards a certain tourist activity (Pizam, Neumann, & Reichel,
1979)
Homestay
Homestay refers to a visit to somebody’s home in a foreign country which
allows visitors to rent a room from a local family in order to learn local culture, lifestyle,
or language. It is a living arrangement offered by a host or host family that involves
staying in their furnished house or suite. The guest of a homestay would be staying in
home-like accommodation with shared living spaces, facilities, and amenities. Utilities
and meals are usually included and the length of stay could be daily, weekly, monthly, or
unlimited unless specified otherwise by the host (Rivers, 1998). Frederick (2003) also
defined the homestay as a stay by a tourists or a visiting foreign student who is hosted by
a local family. Homestay can occur in any destination worldwide; residents of homestay
countries encourage homestays in order to develop their tourism industry. The concept of
the home may be perceived to distinguish homestay establishments from other forms of
accommodation. Rhodri (2004) stated that the distinction between homestay and hotel is
10
boundaries of private area. The private space of homestay is opened to visitors that
would not fall under the term of hotel. In other words, it may refer to a sector of
homestay accommodation to distinguish the accommodation from other types which do
not share all the characteristics to the same degree.
Host/family
The associations between visitors and hosts may be described as linked by the
concept of the home which may be perceived to distinguish homestay establishments
from other forms of accommodation. Homestay refers to types of accommodation where
visitors or guests pay directly or indirectly to stay in private homes. Host of homestay is
described as family who live on the premises, sharing their space which becomes public
while other forms of accommodation, such as hotels where the host’s (the manager or
staff) private home is not on the premises and the boundaries of the private space are
open to staff only (Lynch, 2003).
1.8 Limitations
According to the data collection method of the study, the data was not collected
at different points in time (a longitudinal data), but it was collected at one point in time (a
cross sectional data). Thus, the result of this study was from a one-time measurement
from the data collection. The study could not distinguish between new tourists coming
and long-staying condition. The motivation issues and the attributes chosen as
independent variables could be a limitation because other motivation issues and other
attributes, which were not used in this study, could affect tourists’ satisfaction. In
11
addition, the research data were collected on only homestays in the central part of
Thailand, which limited the generalization of the research findings.
1.9 Outline of Subsequent Chapters
The following chapters include literature review, methodology, results, and
conclusion.
- Chapter 2 literature review contains previous literature on homestay, cultural and
heritage attributes, the tourists’ motivation, and tourists’ satisfaction, including
hypotheses are developed based on the findings and theories from previous studies.
- Chapter 3 methodology consists of detailed information on the methodology of this
study.
- Chapter 4 results consists of the data from the empirical study are analyzed and the
results are presented.
- Chapter 5 conclusion contains a brief summary of the study, discussion of the results,
and the managerial implication.

12
CHAPTER 2
REVIEW OF LITERATURE
2.1 Introduction
The theoretical framework of the study focused on the tourists’ demographic
characteristic, tourists’ motivation and the attributes affecting tourists’ satisfaction with
cultural and heritage destinations.
First, this chapter discusses the demographic of tourists on cultural and heritage
destinations. Second, the chapter provides the definition of homestay, as well as explains
the narrative of homestays in Thailand. Third, the chapter provides the literature of
tourists’ satisfaction on cultural and heritage destinations. Fourth, the chapter discusses
previous cultural and heritage tourism, including such issues as the attributes of cultural
and heritage destinations. Finally, the chapter identifies tourists’ motivation and the
relationship among the attributes of cultural and heritage destinations on tourists’
satisfaction.
2.2 Tourists’ Demographic Characteristics
The characteristics demographic of tourists are important factors when the
researcher analyzed tourists’ motivation and tourists’ satisfaction with cultural and
heritage destination. The previous studies about cultural and heritage tourism have
focused on identifying the characteristics, development, and management of cultural and

13
heritage tourism, as well as on investigating demographic characteristics of tourists who
visit cultural and heritage destinations. For example, Silberberg (1995) provided a
common pattern of cultural and heritage tourists by analyzing age, gender, income, and
education level. His study identified the cultural and heritage tourists who earn more
money and spends more money while vacation, are more educated, are more likely to be
female than male, spends more time in a destination while vacation. Formica and Uysal
(1998) explored the cultural festival with historical settings and examined the motivation
and demographic characteristics of festival visitors. The results of the study showed
statistically significant differences between the group in terms of age, income, and
marital status. Mastr and Predeaux (2000) analyzed the variance by age, gender,
occupation. Overseas travel of Taiwanese cultural and heritage tourists also determined
the influence of responses on the importance of attributes and satisfaction levels by their
demographic characteristic.
According to the previous studies, demographic characteristics (e.g., gender,
income, marital status, education, and occupation) are commonly used in tourism
research to investigate tourists’ satisfaction. This study provides tourists’ demographic
characteristics in order to explain the relationship between tourists’ satisfaction and
cultural and heritage destination. Therefore, it is hypothesized that:
Hypothesis 1: There will be relationships between the overall satisfaction and
the tourists’ demographic characteristic.
Hypothesis 1a: There will be a relationship between the overall satisfaction and
gender.

14
Hypothesis 1b: There will be a relationship between the overall satisfaction and
the tourist’s age groups.
Hypothesis 1c: There will be a relationship between the overall satisfaction and
the tourist’s country of resident
Hypothesis 1d: There will be a relationship between the overall satisfaction and
tourist tourist’s marital status.
Hypothesis 1e: There will be a relationship between the overall satisfaction and
tourist’s education levels.
Hypothesis 1f: There will be a relationship between the overall satisfaction and
tourist’s total household incomes.
2.3 Homestay
Homestay accommodation is a term with specific cultural associations such as
private homes, interaction with a host or host-family, sharing of space which thereby
becomes public (Lynch & MacWhannell, 2000). The associations of homestay
establishments which link to the concept of the home can be distinguished from other
forms of accommodation. In homestay accommodations, the boundaries of private homes
are opened to public space, distinguishing from other accommodations which private
space open to staff only (Lynch, 2000b). Thus, one may refer to the sector of homestay
accommodations to distinguish the accommodation from other types which do not share
all characteristics to visitors. Homestay accommodation types include farmstay
accommodation, some small hotels, host families, and bed and breakfasts. It is used to

15
refer to types of accommodation where tourists or guests pay directly or indirectly to stay
in private homes (Lashley & Morrison, 2000). Wang (2007) has shown an increased
demand of homestays in China. This study focused on a cultural growth of tourism in
Lijiang after its inscription into UNESCO’s prestigious World Heritage Sites List in
1997. Lijang’s growth as a destination began in 1986, and the number of tourists
increased from 200,000 in 1992 to 3.1 million in 1999. Lynch (2000a) studied
networking in the homestay sector which found the particular nature of the homestay was
the interaction between guests and hosts/family. Thus, this study stated that the family
has a key role to play in setting the norms of behavior which impact the guest while
staying in the home.
According to the economic and social developing plan of the Thai government
8th
edition which decentralized power into local community, local organizations began to
take interest in community income. Thailand’s Ministry of Tourism stated that one of the
important ways to increase community income is raising local tourism by using various
tourist attractions (Anonymous, 2009). Homestays are outstanding attractions which pull
for the attention from operators. Moreover, homestay activities develop communities and
increase community income while still maintaining the culture and environment of the
local area. Simple lifestyles of local residents have become an important attraction which
gains the attention of tourists. Thai homestays are established in every part of Thailand
(northeastern, midwestern, central, and the southern part). Thailand’s Ministry of
Tourism revealed that current homestays in Thailand began to appear in early 2004. The
number of homestays is continually increasing to 93 villages recently, and most of the
16
homestays were constructed in 2007-2008. Tourists became interested in these
homestays where another distinctive tourism feature of Thailand became.
2.4 Tourists’ Satisfaction
Tourist satisfaction is considered to be an important element to maintain
competitive business in the tourism industry because it affects the choice of destination,
and the consumption of products and services (Kozak & Rimmington, 2000). Tourist
satisfaction became an important tool to measure the cultural and heritage sector
(Peleggi, 1996). Therefore, homestay tourism is considered to use the tourist satisfaction
measuring tool by revealing how tourists react to or benefit from the experiences they
gain through their associations with traditional places and local culture. Measuring
satisfaction of cultural and heritage places provides information related to how well a
homestay destination meets the tourists’ needs and therefore, helps homestay destination
marketers develop their products and services which are really appealing to tourists.
Several researchers have studied customer satisfaction and provided theories on
the subject: expectancy-disconfirmation, assimilation or cognitive dissonance, contrast,
assimilation contrast, equity, attribution, comparison level, generalized negativity, and
value perception (Oh & Parks, 1997). In particular, expectancy-disconfirmation has
received the widest acceptance among these theories.
The expectation-disconfirmation model suggests that satisfaction is the
comparison of the product expectation to the actual performance of the product (Oliver,
1980). Pizam and Millman (1993) developed this model to improve the predictive power

17
of travelers’ satisfaction and introduced this model into hospitality research. They
employed a regression model with a single expectation-met measure as the dependent
variable, and 21 difference-score measure as the independent variables. In the tourism
industry, Chon and Olsen (1991) used a “goodness of fit” between tourist expectation for
their destination (previous destination image), and tourist satisfaction (the perceived
evaluative experience in the destination). Then, after tourists have bought the travel
products and services, if the evaluation of the tourist experience with the travel products
and services is better than their expectation, they will be satisfied with their travel
experience.
Kozak and Rimmington (2000) reported the impact of overall satisfaction levels
of tourists based on destination attributes. Pizam, Neumann, and Reichel (1978)
supported this and stated that it is important to measure tourists’ satisfaction with each
attribute of the destination because satisfaction or dissatisfaction of each attribute leads to
satisfaction or dissatisfaction of the tourists’ travel experience. Since tourists may vary in
motivation for visiting a destination and they may have different satisfaction levels, the
evaluation of tourist satisfaction needs to be considered in multiple dimensions using
integrated approaches in order to involve the complex nature of satisfaction evaluation
and the theories of measuring satisfaction (Yoon & Uysal, 2005).
Based on the literature provided, tourist satisfaction is an important measuring
tool for the tourist destination including cultural and heritage sectors. Therefore,
homestay tourism is considered to use the tourist satisfaction to be a measuring tool.
Measuring satisfaction of cultural and heritage places provides information related to

18
how well a homestay destination meets the tourists’ needs and therefore, helps homestay
managers develop their products and services.
2.5 Culture and Heritage Attributes
A destination attribute is an important factor for evaluating tourists’ satisfaction
of a destination. To satisfy guests, accommodation providers need to understand their
guests in terms of the experiences they seek. It is important to evaluate the experiences
provided, both tangible and intangible, by mainstream accommodations in contrast to
homestays (Howell, Moreo, & De Micco, 1993). Previous has shown an increased
demand for accommodations in private homes or hosted accommodations, especially
homestays or nature lodges, which represent a rapidly growing sector of the tourism
industry (Morrision et al., 1996). Therefore, it is important for homestay providers to
understand which attributes satisfy guests in order to develop better business strategies
and gain the attraction of more customers.
Researchers recognize the contextual value of the importance construct,
especially within the context of the importance-performance (IPA) framework which was
introduced as a useful technique for evaluating the different elements of a marketing
program (Crompton & Love, 1995). To create this framework, product or destination
attributes are first indentified; then, consumers or tourists are asked to rate the
importance level of the attribute or services and also are asked for a performance rating
on each attribute; lastly, the importance-performance scores for each attribute are
calculated and formed into four strategies: concentrate here (high importance/low
19
performance), keep up the good work (high importance/high performance), low priority
(low importance/low performance), and possible overkill (low importance/high
performance) (Martilla & James, 1977). However, both the influence of importance and
the implied effect of attribute performance on perceived importance require further
exploration with respect to pre- and post-visit experiences. Additionally, Matzler and
Sauerwein (2002) integrated the performance-importance response (PIR) function as an
acknowledgement of the hierarchy of attribute importance and identified three categories
of factors that influence PIR: basic factor (dissatisfiers), excitement factors (satisfiers),
and performance factors (hybrid factor).
Previous research has addressed the issue of the importance-performance
analysis to examine cultural and heritage destination attributes. Crouch and Ritchie
(1999) stated that the destination’s attractiveness attributes with the industry level
attributes such as human resources and infrastructure contribute to the tourists overall
satisfaction of a destination. Enright and Newton (2004) suggested that the tourists’
overall satisfaction depends on both destination-specific attributes and factors
influencing tourists’ satisfaction of tourism products and services providers. This study
seeks to identify cultural and heritage destination attributes which satisfy tourists when
they visit these destinations. Therefore, after investigating pervious research related to
this topic, the researcher decided to select several attributes of cultural and heritage
tourism. Peleggi (1996) explored the relevance of Thailand’s heritage attractions to both
international and domestic tourism. The results showed several attributes which satisfied
tourists who visited Thailand, such as traditional villages and temples. Sofield & Li
(1998) studied the cultural tourism of China. They investigated which cultural and

20
heritage attributes satisfy tourists. The results showed that cultural and historical events,
traditional festivals, historical sites, beautiful scenic locations, architecture, and culture
villages as the satisfied attributes. Moreover, Janiskee (1996) identified the importance of
events though several attributes such as festivals, traditional ceremonies, music, dancing,
craftwork, food, historic houses, and direct experiences of traditional life. The results
showed the cultural and heritage attributes which satisfied tourists were art, handicrafts,
shopping places, traditional scenery, and food.
Based on the literature provided, the researcher decided to select several
attributes of cultural and heritage, and it is hypothesized that:
Hypothesis 2: Cultural and heritage attributes of homestay in Thailand will
predict overall satisfaction of tourists who visited homestays in Thailand.
2.6 Tourists’ Motivation
Another important aspect of tourists’ satisfaction is the motivation of tourists.
Although, the issue of tourist motivation is widely examined, it has been limitedly
conducted. Tourist motivation is the combination of needs and desires that affect the
tendency to travel in a general sense (O’Leary & Deegan, 2005). Although other factors
obviously influence tourist behavior, motivation is still considered to be an indicator and
explains why tourists behave in certain ways.
Motivation refers to a need that drives an individual to act in a certain way to
achieve to the desired satisfaction (Crompton, 1979). Tourist motivation is regarded as
the combination of needs and desires that affect the propensity to travel in a general

21
sense (O’Leary & Deegan, 2005). In addition, motivation influences the effective
component of the images, or the feelings aroused by a place or people, who may assess a
tourist destination based on varying motives of travel (Baloglu, 1997).
Previous research has stated tourist motivation is a result of internal driving
needs to get away from the ordinary environment (Iso-Ahola, 1982). Individuals escape
routine environments and seek their choice of recreational opportunities such as meeting
new people, visiting new places, and having new experiences (Mannell & Iso-Ahola,
1997). Thus, push-pull travel motivation theory was developed as an important model for
individuals to determine tourists’ motivations and how they influence travel destination
choices (Dann, 1997). Push factors are the internal drivers that motivate people to travel,
while the pull factor is concerned about the external drives that determine where, when,
and how they travel (Jang & Cai, 2002). Crompton and McKay (1997) used a push and
pull model to study travel motivations and developed six push and pull motivation
factors: cultural exploration, novelty/regression, recover equilibrium (rest and
relaxation/escape), known group socialization, external socialization and interaction, and
family togetherness. Likewise, Pearce, Philip and Lee (2005) found that escape,
relaxation, relation enhancement, and self-development were major push travel
motivations. On the other hand, pull factors refer to the attractiveness of destination that
attract people to travel. For example, specific attributes of a cultural destination such as a
relaxed atmosphere, cultural events, and friendliness of the local people were important
pull factors in attracting tourists. Based on the literature of push-pull motivation, the
tourists’ motivation items were created.

22
Previous studies have found relevant relationships between tourists’ motivation
and their satisfaction of destination. Ross and Iso-Ahola (1991) found the correlation
between motivation and satisfaction of sightseeing tourists. This correlation indicated the
similarity of motivation and satisfaction dimensions which brings tourist overall
satisfaction. Yoon and Uysal (2005) studied the relationship among the push and pull
motivation, satisfaction, and destination. The results showed that tourists are more likely
to choose destinations which are believed to fulfill their internal needs or push factors.
The model also revealed structural relationship between motivation and satisfaction.
Uysal and Williams (2004) tested a model looking at tourist satisfaction with destination
attributes and tourist type based on travel motivation which moderates the relationship
between satisfaction and attribute factors. It was indicated that motivation in the model
influences relative importance of the two kinds of attributes to tourist satisfaction.
Although a number of studies have examined tourist motivation involved in travel, a
limited number of tourism studies have addressed and examined the constructs of
motivation and satisfaction in the same context. Given the literature on tourists’
motivation, it is predicted that tourists’ motivation will add significant variance of
tourists’ satisfaction on destination.
Homestays are viewed as culture and heritage tourism, which emerged with the
culture of local residents. Homestay tourists believe that the homestay represent a unique
way of living in a new culture. They need an authentic experience, to see the architecture
of the host culture and a sense of being at home. Understanding motivation is therefore a
starting point to understand homestay tourists and how they satisfy their needs. Although
several researchers have studied the cultural and heritage tourism, they did not certainly

23
provide homestay issues, especially homestays in Thailand. The homestay concept seems
to be the new type of tourism in Thailand and the examination of motivation is still
needed for homestay tourism in Thailand. Thus, this study could be applied to investigate
what factors would motivate tourists to choose homestays in Thailand and to predict
tourists’ overall satisfaction based on cultural and heritage attributes. In order to
investigate satisfaction of cultural and heritage tourists such as homestay’s tourists, the
investigation of tourist satisfaction is needed.
Based on the literature provided, the motivation of tourists is a main factor to
predict the tourists’ satisfaction. Therefore it is hypothesized that:
Hypothesis 3: Tourists’ motivation will predict the overall satisfaction of
tourists who visited homestays in Thailand.

24
2.7 Summary
This chapter discussed the increase of interests in cultural and heritage
destinations, including the homestay sector. First, the demographic characteristic of the
tourist was provided. Second, homestay definitions and the narrative of homestays in
Thailand were provided. Then, tourists’ satisfaction was defined and earlier research in
this sector was acknowledged in order to explore which areas required further study.
Lastly, this chapter provided the literature of cultural and heritage attribute destination
and viewed the literature of tourists’ motivation affecting tourists’ satisfaction. From
these previous studies, the attributes of this study were decided. Furthermore, this chapter
discussed the relevant literature on the importance-performance (IPA), the push-pull
travel motivation theory and the customer satisfaction (expectation-disconfirmation
theory). These theories were analyzed in order to guide this study.

25
CHAPTER 3
METHODOLOGY
3.1 Introduction
This chapter addresses the methodology used to conduct this study. The second
section of this chapter restates the purposes of the study. The third section presents the
research design. Section 4 presents the population and sampling procedure, followed by
the review procedure of this study through the Campus Institutional Review Board in
Section 5. Then, Section 6 discusses the instrumentation and presents the measurement
development, description of the measurement, validity and reliability procedures. Section
7 includes the procedures of data collection, followed by the statistical procedures
adopted in the data analysis in Section 8. In Section 9, the data is evaluated preliminarily
by using data screening and missing analysis procedure and statistical assumptions such
as outliers, multivariate normality, linearity, and multicollinearity.

26
3.2 Purpose of the Study
The purposes of this study are as follows:
(1) To explore demographic profiles of tourists who visited homestays in Thailand,
(2) To explore factors which influenced tourists’ choice of homestay,
(3) To investigate which attributes satisfied tourists who chose a homestay.
(4) To investigate motivation factors which influence tourists’ satisfaction
Addressing these questions would assist homestay operators in developing
strategies to attract more travelers. The tourists within the homestay industry in Thailand
are considered to be a target group because the program has become increasingly popular
with foreign travelers.
3.3 Research Design
This study utilized a relational research design to examine the predicting effects
of tourist’s motivation and cultural and heritage attributes on tourists’ satisfaction, as
well as the relationship between tourist’s motivation, cultural and heritage attributes and
tourists’ overall satisfaction.

27
3.4 Population and Sampling
3.4.1 Population
The target population of this study was tourists who visit homestay and use
homestays in Thailand as their travel destination.
3.4.2 Sample frame
The sample frame of this study consisted of tourists who visited homestay
villages in the central part of Thailand over a two-month period from July to August,
2009.
3.4.3 Sample and Data Collection
This study employed an accidental sampling which is a form of non-
probabilistic sampling. The questionnaire packages were distributed to managers of all
the homesatys in the central part of Thailand. In this study, the sample frame consisted of
tourists who were given a survey package by one of the managers during their check-out.
Homestay managers were informed about the purpose of the survey in advance before
they were given the questionnaire packages. They were asked to distribute the
questionnaires to only to tourists who are least 18 years old.
The survey was conducted over two-month period (July-August) at 17 different
homestay villages (119 total homestays) in the central part of Thailand which have the
highest density of homstay villages: Samutsongkhram, Singburi, Angthong, Ayutthaya,

28
Samutprakan, Samutsakhon, and Supunburi. The questionnaire packages were distributed
to managers of the homestay villages. The questionnaire package contained a cover letter
and a copy of the survey. Respondents were the first completed stayed tourist groups
who stayed in each homestay. The homestay managers were approached and were
informed about the purpose of the survey in person before they were given the
questionnaire packages. The respondents were informed of the purpose by the
explanation in the cover letters, which included the request for voluntary permission and
for the return of the questionnaires to the managers after they completed it. A gift, which
was an incentive for this study, was given to the homestay manager, and candies were
given to the respondents. In addition, the results of this study were reported to the
participating homestay managers and the respondents who requested them. A total of 500
questionnaires were distributed through 17 homestay managers. Of 500, 300 were in Thai
language and 200 in English. A total of 293 useable responses were received (276 from
Thai tourists and 17 from other countries), giving a response rate of over 58% (293/500).
3.4.4 Sampling error
Sampling Error could not be avoided because accidental sampling was used,
which is a form of non-probabilistic sampling.

29
3.4.5 Selection error and frame error
To ensure that respondents do not participate more than once, the survey was
given only on the check out date. In addition, a cross check of the collected data based on
demographic information was also conducted to purge possible duplicates.
3.5 Institutional Review Board
In order to construct this study, federal regulations and the University of Missouri
policy require a proper review and approval of all research studies that involve human
subjects. This review was required by the University of Missouri in order to protect the
rights of those participating in the survey. In compliance with the above-mentioned
policy, this study received the proper review and was granted permission to continue and
was assigned the following project number 1137617.
3.6 Instrumentation
3.6.1 Validity
Validity is defined as “the extent to which a measure actually taps the
underlying concept that it purports to measure” (Ary, Jacobs, Razavieh, & Sorensen,
2006). For this study, validity was determined through utilizing a panel of experts. The
panel was comprised of 5 graduate students who were considered experienced in the
study’s content and instrumentation. They were informed and were trained on the topic

30
of this study. After the training, they correctively came up with the item of survey. They
were asked individually to assess content, format, wording, and overall appearance. The
questionnaire was translated into Thai for domestic tourists. The Thai questionnaire was
double-checked by five investigators who speak Thai to ensure that the exact meaning of
the questions was captured in the English-to-Thai translation.
3.6.2 Measurement
The purpose of this study was to analyze which destination attributes were
important in satisfying tourists who visited homestays in Thailand and indentify a
relationship between tourists’ motivation, cultural and heritage attributes, and tourists’
overall satisfaction. For tourist’s motivation items, the preliminary questionnaire was
developed based upon previous studies of Kao, Patterson, & Li (2008), Beerli & Martin
(2004), and Ngamsom (2007). Cultural and heritage attribute items were selected from
previous instrumentations by Kozak & Rimmington (2000) and Heung & Cheng (2000).
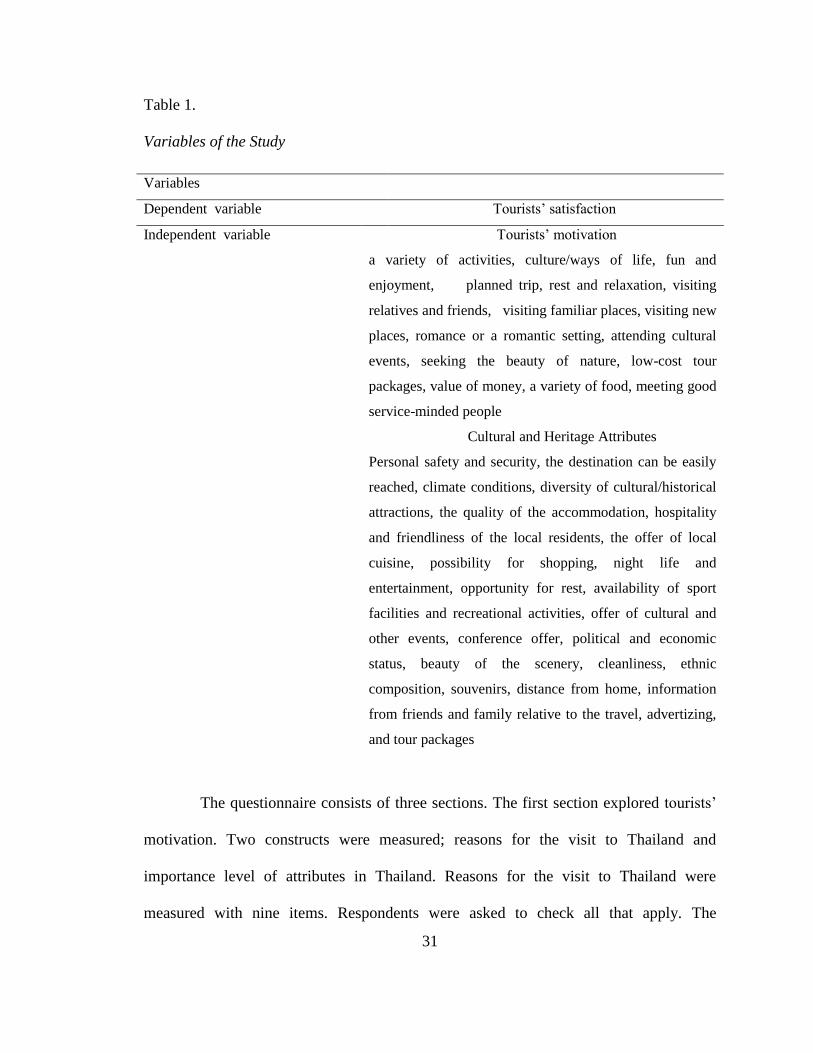
Table 1 shows the variables which was used in this study. The dependent variable was
the tourist’s overall satisfaction. The independent variables were the tourist’s motivation
and cultural and heritage attributes.
31
Table 1.
Variables of the Study
The questionnaire consists of three sections. The first section explored tourists’
motivation. Two constructs were measured; reasons for the visit to Thailand and
importance level of attributes in Thailand. Reasons for the visit to Thailand were
measured with nine items. Respondents were asked to check all that apply. The
Variables
Dependent variable Tourists’ satisfaction
Independent variable Tourists’ motivation
a variety of activities, culture/ways of life, fun and
enjoyment, planned trip, rest and relaxation, visiting
relatives and friends, visiting familiar places, visiting new
places, romance or a romantic setting, attending cultural
events, seeking the beauty of nature, low-cost tour
packages, value of money, a variety of food, meeting good
service-minded people
Cultural and Heritage Attributes
Personal safety and security, the destination can be easily
reached, climate conditions, diversity of cultural/historical
attractions, the quality of the accommodation, hospitality
and friendliness of the local residents, the offer of local
cuisine, possibility for shopping, night life and
entertainment, opportunity for rest, availability of sport
facilities and recreational activities, offer of cultural and
other events, conference offer, political and economic
status, beauty of the scenery, cleanliness, ethnic
composition, souvenirs, distance from home, information
from friends and family relative to the travel, advertizing,
and tour packages

32
importance of the attributes was measured with 16 items which were measured on a 7-
point Likert-type scale which ranges from strongly unimportant (1) to strongly important
(7).
The second section explored tourists’ satisfaction with the destination’s cultural
and heritage attributes. The first construct asked the respondents’ satisfaction with 22
items which were developed from the previous researches. The second construct asked
respondents’ overall level satisfaction level with homestay in Thailand (1 = very
dissatisfied, 7 = very satisfied). The final section of the questionnaire contained
demographic items such as age, gender, income, and country of residence.
3.6.2 Reliability
Reliability is defined as “the extent to which a measure yields consistent results;
the extent to which scores are free of random error” (Ary, Jacobs, Razavieh, & Sorensen,
2006). To establish the reliability of this study measurement used in the survey
instrument, the reliability coefficient (Cronbach alpha) was verified. Therefore, the
reliability of this study was accomplished. The constructs in the measurement had the
estimated reliability-coefficient of .88 from 16 motivation items and .93 from 22
cultural/heritage attribute items. The alpha should ideally be around .90 and never be
below .70. According to this rule, all of the constructs in the measurement of this study
therefore fulfilled this requirement.

33
3.7 Data Analysis
After sorting the questionnaires, data was coded, entered, and analyzed using the
Statistical Package for Social Sciences (SPSS). Statistical analyses such as descriptive
analysis (frequencies) was used according to the respective objectives of the study.
Descriptive analysis was conducted to evaluate tourists who visited homestays in
Thailand. Testing differences between means (t-test) and analysis of variance (ANOVA)
were used to identify the differences in the overall tourists’ satisfaction in terms of
tourists’ demographic characteristics (e.g., age, gender, country of resident, marital
status, education level, and total household income).
Exploratory Factor analysis was conducted to create correlated variable
composites from an original 16 motivation items and 22 attributes and to identify a set of
dimensions, or factors. The derived factor scores were then applied in subsequent
regression analysis. Multiple regression analysis was used to examine tourists’ overall
levels of satisfaction with the tourists’ motivation destination and culture/heritage
attribute dimension. The dependent variable (tourists’ overall satisfaction levels with
destination) will be regressed against each independent variable (tourists’ motivation
dimensions and culture/heritage attribute dimensions) derived from the factor analysis.

34
3.8 Preliminary Evaluation of Data
3.8.1 Data screening and missing analysis procedures
A cross check of the collected data based on demographic information was
conducted to purge possible duplicates. Two hundred ninety three participants completed
the survey. The Missing Value Analysis program from SPSS 17.0 was used to assess
missing values. Listwise deletion was used, which resulted in the removal of 88 surveys.
Two hundred five surveys were included in the future analyses.
3.8.2 Statistic assumptions
The data were screened for: (a) outliers, (b) multivariate normality, (c) linearity,
and (d) multicollinearity. Outliers are cases with extreme values on one or a combination
of variables that influence the size of correlation coefficients, the average value for a
group, or the variability of scores within a group (Tabachnick & Fidell, 1983). In this
study, outliers were identified by examining the standardized z-scores of each score.
Through this procedure, no cases were deleted because their z-scores were between ±
3.29 SD, which suggested that the data had no outliers (Tabachnick & Fidell, 2007; Field,
2005). To assess for multivariate normality, descriptive statistics were conducted to
examine skewness and kurtosis. In the assumption of multivariate normality, values ≥
1.96 for skewness and kurtosis indicate a violation of multivariate normality (Field,
2005). In addition, given the large samples in this study, the shape of the distribution was

35
also visually inspected. The results indicated that none of the variables violated the
multivariate normality.
Linearity was then tested by inspection of bivariate scatterpolts and no violation
was indicated given the oval-shaped depiction (Tabacknick & Fidell, 2007). Lastly,
assumption of multicollinearity was tested using Variance Inflation Faction (VIF) and
Tolerance values. According to Kline (2005) and Field (2005), VIF greater than 10 and
Tolerance values below .10 indicate collinearity in the data. Based on these criteria, no
collinearity exists among the variables of interest. To summarize, after statistically
screening the data, none of the cases were removed. Therefore, 205 cases remaining from
data missing removal remained for further analyses.
3.9 Summary
This chapter addressed the methodology used to conduct this study. The second
section of this chapter restated the purpose of the study, and presented the research
design in Section 3. Population and sampling procedures in the study were discussed in
Section 4, followed by the review procedure of this study though the Campus
Institutional Review Board in Section 5. The sixth section discussed the instrumentation
including measurement development, validity, and reliability. Section 7 included the
procedures of data collection for this study. Section 8 presented the statistical procedures
adopted in the data analysis. In Section 9, the data were evaluated preliminarily by using
data screening and missing analysis procedure and statistical assumptions such as
outliers, multivariate normality, linearity, and multicollinearity.

36
CHAPTER 4
RESULTS
4.1 Introduction
This chapter presents results of statistical analysis of the data. First, the
demographic characteristics of subjects are presented to address research objective 1.
Second, the satisfaction of tourists towards the homestay industry in Thailand is
presented. Research objective 4 is addressed. Then, the results of the relationship
between tourists’ motivation, cultural and heritage attributes, and tourists’ overall
satisfaction with homestays in Thailand are presented to address research objective 2 and
5. Finally, hypotheses are tested though Independent-Samples T-test (t-test), Analysis of
Variance (ANOVA), Factor analysis, Correlation analysis and Multiple regression
analysis.
4.2 Demographic Characteristics of Subjects
Research objective 1 was proposed to describe the demographic characteristics
of tourists within the homestay industry in Thailand, by age, gender, country of
residence, marital status, education level, and total household income.
The demographic characteristics of the respondents are shown in Table 2. The
gender distribution of the respondents was quite even, with 48.8% male respondents and
51.2% female respondents. The dominant age group of the respondents was 25 years or

37
under (55.1%), followed by 26 to 40 years (29.8%), 41 to 60 years (14.1%), whereas 60
years or older (1%) was the smallest group. Most of the respondents (96.1%) reported
that they live in Thailand, whereas only 3.9% of the respondents were international
tourists. Moreover, the homestays in Thailand mainly attracts single tourists as the major
market. The results showed that 80.5% of the tourists were single; only 17.6% of the
respondents were married.
In terms of the level of education, most respondents had college degrees
(65.4%); 52.7% with a bachelor’s degree, 12.7% with a graduate’s degree. Meanwhile,
22.4% of the respondents had a high school degree, and 12.2% of respondents had an
associate’s degree. The results show the relatively high educational attainment of the
respondents.
In term of respondents’ annual household income, the largest group was the
approximate total household income of US $19,999 or below (58.5%), followed by US
$20,000 to $39,999 (30.7%) and US $40,000 or more (10.7%) was the smallest group
(Table 2).

38
Table 2.
Demographic Characteristics of the tourists who visited homestays in Thailand
Variable Frequency Percentage (%)
Gender
Male 100 48.8
Female 105 51.2
Age (years)
25 or under 113 55.1
26 - 40 61 29.8
41-60 29 14.1
60 or older 2 1.0
Country of residence
Thailand 197 96.1
Others 8 3.9
Marital status
Single 165 80.5
Married 36 17.6
Divorced - -
Widowed 4 2.0
Education levels
High school 46 22.4
Associate’s degree 25 12.2
Bachelor’s degree 108 52.7
Graduate’s degree 26 12.7
Total household income (USD)
Less $19,999 120 58.5
$20,000 - $39,999 63 30.7
$40,000 or more 22 10.7

39
4.3 Tourists’ Overall Level of Satisfaction with Homestays in Thailand
Objective 4 sought to investigate the satisfaction of tourists towards the
homestay in Thailand. Respondents were questioned about their overall level of
satisfaction with the homestays. The results are summarized in Table 3. From the
research findings, 67.8% of the respondents indicated that they were somewhat satisfied,
satisfied, or strongly satisfied with homestays in Thailand; 28.3% were neither satisfied
nor dissatisfied and 3.9% of the respondents were somewhat dissatisfied, dissatisfied, or
strongly dissatisfied. The mean value of respondents’ overall level of satisfaction was
5.02.
Table 3.
Tourists’ Overall Level of Satisfaction with the Homestays in Thailand (N=205)
Variable n %
Strongly Dissatisfied 0 0
Dissatisfied 2 1.0
Somewhat Dissatisfied 6 2.9
Neither Satisfied nor
Dissatisfied
58 28.3
Somewhat Satisfied 66 32.2
Satisfied 65 31.7
Strongly Satisfied 8 3.9
Note: Overall satisfaction mean ranges from 1(strongly dissatisfied) to 7 (strong
satisfied)

40
4.4 Testing the Hypotheses
Based on the purpose of this study, three hypotheses were proposed. Each
hypothesis was reiterated below and then the results of statistical analysis for testing
them were reported. Hypothesis 1 was tested to address the relationship of demographic
characteristic of respondents and their overall satisfaction. Hypothesis 1a and 1c were
tested by using Independent Sample-Test (t-test), and hypothesis 1b, 1d, 1e and 1f) were
tested by using Analysis of Variance (ANOVA). Factor analysis and multiple regression
analysis were conducted to address hypothesis 2 and 3.
4.4.1 Hypothesis 1
Hypothesis 1: There will be relationships between the overall satisfaction and
the tourists’ demographic characteristic.
Hypothesis 1a: There will be a relationship between the overall satisfaction and
gender.
Hypothesis 1b: There will be a relationship between the overall satisfaction and
the tourist’s age groups.
Hypothesis 1c: There will be a relationship between the overall satisfaction and
the tourist’s country of resident.
Hypothesis 1d: There will be a relationship between the overall satisfaction and
tourist tourist’s marital status.
Hypothesis 1e: There will be a relationship between the overall satisfaction and
tourist’s education levels.

41
Hypothesis 1f: There will be a relationship between the overall satisfaction and
tourist’s total household incomes.
4.4.1.1 Independent-Samples T-test
Independent t-test was used to compare the difference between different groups to
determine whether that difference is statistically significant. The T-test was used to
determine the difference of tourists’ gender (male and female) to address hypothesis 1a.
It was also used to identify the difference of tourists’ country of residence (Thai or other)
affecting tourists’ overall satisfaction. Thus, hypothesis 1b was addressed. The results are
summarized in Table 4.
The results of the t-test revealed that there was no significant difference between
male (M = 5.04, SD = 1.014) and female (M = 5.01, SD = .956); t (203) = .222, p = .825.
The results suggest that the gender of the respondents had no effect on their overall
satisfaction. In other words, on average, tourists’ overall satisfaction had no significant
difference between gender. Thus, hypothesis 1a was rejected.
An independent-samples t-test was also conducted to analyze hypothesis 1c.
There was no significant difference of country of residence between Thai (M = 5.04, SD
= .989) and the others (M = 4.63, SD = .744); t (203) = 1.174, p = .242. These results
suggest that, on average, tourists’ overall satisfaction had no significant difference
between country of residence. Thus, there was no relationship between the overall
satisfaction and country of residence. The hypothesis 1c was rejected.

42
Table 4.
Results on t-test between overall satisfaction with Gender and Country of Residence
Overall Satisfaction t df
M SD
Gender .222 203
Male 5.04 1.014
Female 5.01 .956
Country of Resident 1.174 203
Thai 5.04 .989
Other 4.63 .744
Note: p < .05
4.5.1.2 Analysis of Variance (ANOVA)
Analysis of Variance (ANOVA) was used to identify the differences in the
overall tourists’ satisfaction in terms of tourists’ demographic characteristics (e.g., age,
marital status, education levels, and total household income). Thus, ANOVA was used to
analyze hypotheses 1b, 1c, 1e, and 1f. The results are summarized in Table 5.
A one-way between subjects ANOVA was conducted to identify the effect of
overall satisfaction by age of respondents (25 or under, 26 to 40, 41 to 60, and 61 to
older), marital status (single, married, divorced, and widowed), education level (high
school, associate’s degree, bachelor’s degree, master’s degree, and doctor’s degree) and
total household incomes (less than $19,999, $20,000-$39,999, $40,000 or more). The
results revealed that there was no significant effect of overall satisfaction at the p<.05
level for age [F (3, 201) = .225, p = .857] and marital status [F (2, 202) = .652, p = .522.
Thus, hypotheses 1b and 1d were rejected. However, tourists’ education levels and
tourists’ total household income were statistically significant at the p< .05[F (3, 201) =

43
7.006, p = .000)] and [F (2, 202) = 3.427, p = .034]. Thus, hypotheses 1e and 1f were
accepted. There was a relationship between the overall satisfaction, tourists’ education
level and tourists’ household income. Post hoc comparisons using the Tukey HSD test
indicated that the mean score for the bachelor’s degree (M = 5.19, SD = .908), graduate’s
degree (M = 5.15, SD = .834), and high school diploma (M = 5.00, SD = .989) were
significantly different than the associate’s degree (M = 4.24, SD = 1.091); the mean score
for the bachelor’s degree (M = 5.19, SD = .908) was significantly different than the
associate’s degree (M = 4.24, SD = 1.091). Taken together, these results suggest that the
education levels that affected the overall satisfaction were high school, associate’s
degree, graduate’s degree. A bachelor’s degree really had an effect on the overall
satisfaction.
Post hoc comparisons using the Tukey HSD test also indicated that the mean
score for the total household income of less than $19,999 (M = 5.13, SD = .940) was
significantly different than the total household income of $20,000 to $ 39,999 (M = 4.76,
SD = 1.043). Therefore, the results suggest that the total household income of less than
$19,999 really affected the overall satisfaction. However, it should be noted that the total
household income that affected overall satisfaction were a total household income of less
than $19,999 and the total household income of $20,000 to $ 39,999. The total household
income of $40,000 or more did not appear to significantly affect overall satisfaction.

44
Table 5.
The overall tourists’ satisfaction in terms of tourists’ demographic characteristics
(e.g., age, marital status, education levels, and total household income)
Mean SD Sum of
Squares
df Mean
Square
F
Age
25 or under 5.05 .943
26 to 40 5.02 .991
41 to 60 4.97 1.149
60 or older 4.50 .707
Between Groups .748 3 .249 .255
Within Groups
196.131 201 .976
Marital Status
Single 4.99 .969
Married 5.19 1.064
Widowed 5.00 .816
Between Groups 1.263 2 .632 .652
Within Groups
195.615 202 .968
Education levels
High school 5.00 .989
Associate’s degree 4.24 1.091
Bachelor’s degree 5.19 .908
Graduate’s degree 5.15 .834
Between Groups 18.637 3 6.212 7.006*
Within Groups
178.241 201 .887
Total household incomes
Less than $19,999 5.13 .940
$20,000 to $ 39,999 4.76 1.043
$40,000 or more 5.23 .922
Between Groups 6.461 2 3.230 3.427*
Within Groups 190.417 202 .943
*p < 0.05

45
4.4.2 Hypothesis 2
Hypothesis 2: Cultural and heritage attributes of homestay in Thailand will
predict overall satisfaction of tourists who visited homestays in Thailand.
4.4.2.1 Factor Analysis (Underlying Dimensions of the Destination Attribute)
The principal components factor analysis was used to underline the dimensions
of the destination attributes. The eigenvalues suggested that a four-factor solution
explained 60.89% of the overall variance. The factors with eigenvalues greater than or
equal to 1.0 and attributes with factor loadings greater than .5 were reported. Table 6
illustrates the results of the factor analysis. The four factors were: Location/Lodging,
General Tour Attraction, Offering/Information, and Local Services.
The overall significance of the correlation matrix was .000, with a Bartlett test
of sphericity value of 2397.25. The Kaiser-Meyer-Olkin overall measure of sampling
adequacy was .902. Table 6 shows the results from the varimax-rotated factor matrix.
Three variables (Diversity of cultural attractions, Sport facilities/recreational activities,
and Information from friends/family relative) were dropped due to the failure of loading
on any factor at the level of .5. The factor analysis yielded four factors with 19 variables.
To test the reliability and internal consistency of each factor, the Cronbach’s
alpha of each was determined. The results showed that the alpha coefficients ranged from
.673 to .849 for the four factors.
The four factors underlying of cultural and heritage attributes in homestays in
Thailand were as follows.

46
Location/Lodging (Factor 1) contained 6 attributes and explained 41.021% of
the variance in the data, with an eigenvalue of 9.025 and a reliability coefficient of .849.
These attributes were cleanliness, the quality of the accommodation, climate condition,
beauty of the scenery, the destination can be easily reached, and personal safety and
security.
General Tour Attraction (Factor 2) accounted for 9.006% of the variance, with
an eigenvalue of 1.981, and reliability coefficient of .845. These attributes were
possibility for shopping, night life and entertainment, souvenirs, opportunity for rest, and
distance from home.
Offering/Information (Factor 3) loaded with 7 attributes. This factor accounted
for 5.935% of the variance, with an eigenvalue of 1.306, and reliability coefficient of
.848. These attributes were conference offer, political and economic status, tour
packages, ethnic composition, advertizing, and offer of cultural and other events.
Local Service (Factor 4) contained 2 attributes. The factor explained 4.924% of
the variance, with an eigenvalue of 1.083, and a reliability coefficient of .673. These
attributes were the offer of local cuisine and hospitality and friendliness of local
residents.

47
Tabel 6.
The result of factor analysis on destination attributes
Factor Factor
loading
Eigenvalue Explained
variance
Reliability
coefficient
Factor 1: Location and Lodging 9.025 41.021% .849
Cleanliness .744
The quality of the accommodation .741
Climate condition .616
Beauty of the scenery .612
Personal safety and security .606
The destination can be easily reached
.526
Factor 2: General Tour Attraction 1.981 9.006% .845
Possibility for shopping .822
Night life and entertainment .677
Souvenirs .656
Opportunity for rest .626
Distance from home
.603
Factor 3: Offering and Information 1.306 5.935% .848
Conference offer .740
Political and economic status .677
Offer of cultural and other events .643
Ethnic composition .605
Information from friends/family
relative
.436
Advertizing .574
Tour packages
.556
Factor 4: Local Services 1.083 4.924% .673
The offer of local cuisine .850
Hospitality and friendliness of local
residents
.642
Total variance explained 60.89%
Note: Cultural and Heritage Attributes: 1= Strongly Dissatisfied and 7= Strongly
Satisfied
Extraction method: Principle component analysis
Rotation method: Varimax with Kaiser normalization
KMO(Kaiser-Meyer-Olkin measure of sampling adequacy) = .902
Bartlett’s test of sphericity: p = .000

48
4.4.2.2 Correlation Analysis
A correlation analysis indicates the strength and direction of a linear relationship
between two random variables. In the study, a correlation coefficient measured the
strength of a linear between overall satisfaction of the respondents and four factors -
Location/Lodging, General Tour Attraction, Offering/Information, and Local Services.
The correlation between overall satisfaction and four factors was positive and was
significant at the 0.01 level (2-tailed). The correlation between overall satisfaction and
Location/Lodging was .233; the correlation between overall satisfaction and General
Tour Attraction was .518, and the correlation between overall satisfaction and
Offering/Information was .352 (Table 7). Thus, the study indicated that the correlation
between overall satisfaction and General Tour Attraction was higher than that between
overall satisfaction and Offering/Information. It was also higher than the correlation
between overall satisfaction and Location/Lodging.
Table 7.
Correlations between Overall Satisfaction and Four Factors
Note: N = 205, * p < .05. ** p < .01.
Location/
Lodging
General
Tour
Attraction
Offering/
Information
Local
Services
Overall
Satisfaction
Pearson
Correlation
.233**
.518**
.352**
.036
Sig.
(2-tailed)
.000
.000
.000
.609
N 205 205 205 205

49
4.4.2.3 Multiple Regression Analysis
In order to analyze hypothesis 2, the factors that influenced tourists’ overall
levels of satisfaction, the four orthogonal factors were used in a multiple regression
analysis. The multiple regression procedure was employed in this study because it
provided the most accurate interpretation of the independent variables. It predicts one
variable on the basis of several other variables.
The equation for tourists’ overall satisfaction was expressed in the following
equation:
Y = β0 + β1X1 + β2X2 + β3X3 + β4X4 (1)
Where,
Y = Tourists’ overall satisfaction with homestay in Thailand
β = Coefficient
X1 = Location/Lodging
X2 = General Tour Attraction
X3 = Offering/Information
X4 = Friendly Service/Quality
The four independent variables (factors 1, 2, 3, and 4) were expressed in terms
of the standardized regression coefficients (Beta). Beta value is a measure of how
strongly each predictor variable (independent variable) influences the criterion variable
(dependent variable). The predictor variable that remained in the regression equation was
shown in order of importance based on the beta coefficients. The predictor variables
which consisted of four factors (Location/Lodging, General Tour Attraction,
Offering/Information, and Local Services) were used as the indicators of tourists’

50
evaluation of the overall satisfaction in homestay in Thailand. The summary of the
results is presented in Table 8.
The regression analysis results showed that 43.7% (Adjusted R2 = 0.437) of the
variation in overall satisfaction was explained by the variables included in the model
(Table 8). The F ratio, which explained whether the results of the regression model could
have occurred by chance, had a value of 40.528 (p = .000) and was considered
significant. General Tour Attraction, Offering and Information, and Location and
Lodging indicated statistical significance at p = .000, whereas Local Services has p value
of .495, which was not significant. Therefore, General Tour Attraction, Offering
/Information, and Location/Lodging were considered to be the important indicators
determining the overall satisfaction level of tourists.
Based on statistically significant results of this study, the highest beta
coefficient scores were General tour attraction, β = .509, indicating that general tour
attraction attributes would significantly impact tourists’ overall satisfaction toward the
homestay destination, followed by Offering/Information, β = .346, and
Location/Lodging, β =.229.
According to the multiple regression analysis results, three factors affected
overall satisfaction of tourists who visited homestays in Thailand. Thus, hypothesis 2 was
accepted that cultural and heritage attributes of homestay in Thailand would be the
predictors of tourists’ overall satisfaction.

51
Table 8.
Regression results of tourists’ overall satisfaction level based on the dimension attributes
(N=205)
Dependent variable: Tourists’ overall satisfaction with homestays in Thailand
Independent variable: Four factors
Model summary
R R2 Adjusted R
2 SE
.669 .448 .437 .737
Analysis of Variance
Sum of
square
df Mean square F
p
Regression 88.139 4 22.035 40.528 .000
Residual 108.739 200 .544
Total 196.878 204
Regression Analysis
Independent variable
Std. Error Beta t-value p
Constant .051 97.5663 .000
General Tour Attraction .052 .509 9.855 .000
Offering and information .052 .346 6.693 .000
Location and Lodging .052 .229 4.441 .000 Local Services .052 .035 .684 .495
Note: *p < 0.05
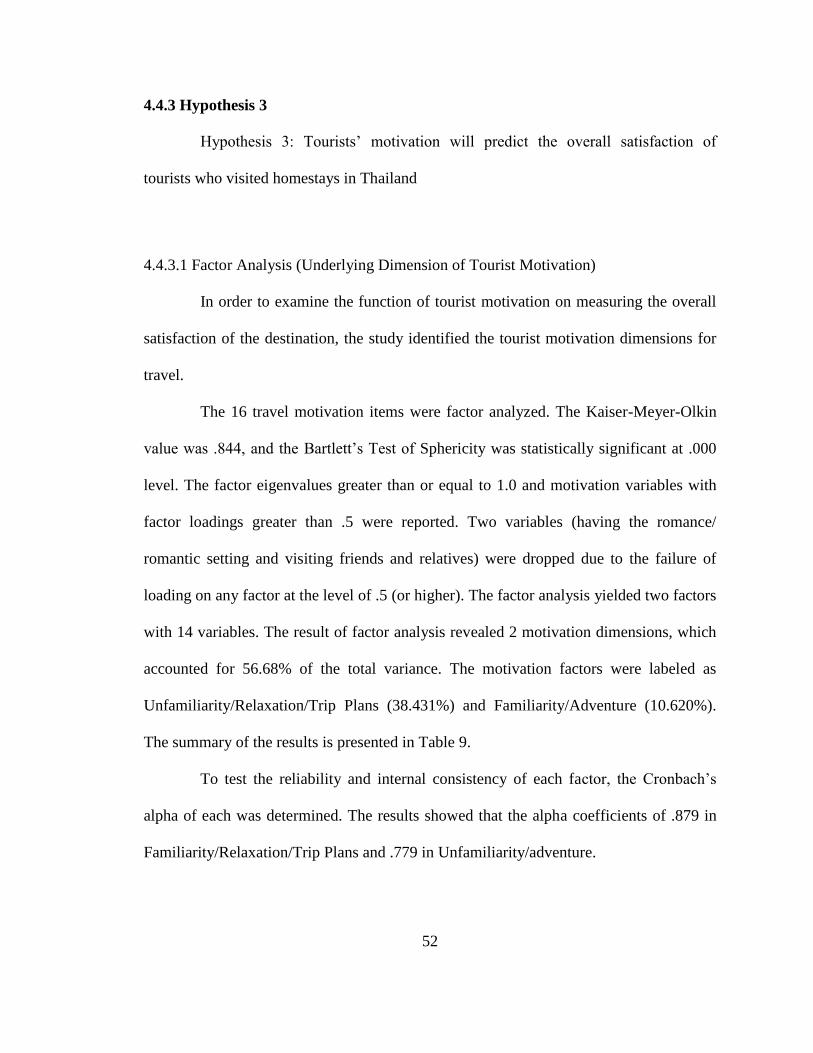
52
4.4.3 Hypothesis 3
Hypothesis 3: Tourists’ motivation will predict the overall satisfaction of
tourists who visited homestays in Thailand
4.4.3.1 Factor Analysis (Underlying Dimension of Tourist Motivation)
In order to examine the function of tourist motivation on measuring the overall
satisfaction of the destination, the study identified the tourist motivation dimensions for
travel.
The 16 travel motivation items were factor analyzed. The Kaiser-Meyer-Olkin
value was .844, and the Bartlett’s Test of Sphericity was statistically significant at .000
level. The factor eigenvalues greater than or equal to 1.0 and motivation variables with
factor loadings greater than .5 were reported. Two variables (having the romance/
romantic setting and visiting friends and relatives) were dropped due to the failure of
loading on any factor at the level of .5 (or higher). The factor analysis yielded two factors
with 14 variables. The result of factor analysis revealed 2 motivation dimensions, which
accounted for 56.68% of the total variance. The motivation factors were labeled as
Unfamiliarity/Relaxation/Trip Plans (38.431%) and Familiarity/Adventure (10.620%).
The summary of the results is presented in Table 9.
To test the reliability and internal consistency of each factor, the Cronbach’s
alpha of each was determined. The results showed that the alpha coefficients of .879 in
Familiarity/Relaxation/Trip Plans and .779 in Unfamiliarity/adventure.

53
The two factors underlying the motivation of tourists to visit homestays in
Thailand are as follows:
Familiarity/Relaxation/Trip Plan contained 9 motivation items with an
eigenvalue of 6.149. These motivation items were Good value for money, Having variety
of foods, Having time by myself, Having fun and enjoyment, and Having a low-cost tour
package, Meeting good service-minded people, Visiting familiar places, Being careful
and completely planned trip, and Having a restful and relaxing trip.
Unfamiliarity/Adventure loaded with 5 motivation items with an eigenvalue of
1.699. These attributes were Learning different cultures/ways of life, Attending cultural
events, Having a variety of activities, Visiting new places, and Seeking the beauty of
nature.

54
Table 9.
The result of factor analysis on tourists’ motivation for travel
Factor Factor
loading
Eigenvalue Explained
variance
Reliability
coefficient
Factor 1: Familiarity/Relaxing/Trip plans 6.149 38.431% .879
Good value for money .818
Having variety of foods .743
Having time by myself .699
Having a restful and relaxing trip .699
Having a low-cost tour package .672
Meeting good service-minded people .662
Visiting familiar places .618
Being careful and completely planned
trip
.617
Having fun and enjoyment
.549
Factor 2: Unfamiliarity/Adventure 1.699 10.620% .779
Learning different cultures/ways of life .779
Attending cultural events .705
Having a variety of activities .669
Visiting a new places .619
Seeking the beauty of nature
.528
Total variance explained 56.68%
Note: Tourists’ motivation: 1 = Strongly Unimportant and 7 = Strongly Important
Extraction method: Principle component analysis
Rotation method: Varimax with Kaiser normalization
KMO(Kaiser-Meyer-Olkin measure of sampling adequacy) = .844
Bartlett’s test of sphericity: p = .000
4.4.3.2 Correlation Analysis
A correlation coefficient measured the strength of a linear between overall
satisfaction of the respondents and two factors - Familiarity/Relaxing/Trip plans and
Unfamiliarity/Adventure. The correlation between overall satisfaction and two factors
was positive and was significant at the 0.01 level (2-tailed). The correlation between
overall satisfaction and Familiarity/Relaxing/Trip plans was .532, and the correlation

55
between overall satisfaction and Unfamiliarity/Adventure was .210 (Table 10). Thus, the
study indicated that the correlation between overall satisfaction and Familiarity/Relaxing/
Trip plans was higher than that between overall satisfaction and
Unfamiliarity/Adventure.
Table 10.
Correlations between Overall Satisfaction and Two Factors
Note: N = 205, * p < .05. ** p < .01.
4.4.3.3 Multiple Regression Analysis
In order to analyze hypothesis 3, the two orthogonal factors that influenced
tourists’ overall levels of satisfaction were used in a multiple regression analysis. The
dependent variable, tourists’ overall satisfaction, was measured on a 7-point Likert-type
scale. The independent variables were Familiarity/ Relaxation/Trip Plans and
Unfamiliarity/Adventure.
Table 11 shows the results of the regression analysis. To predict the goodness-
of-fit of the regression model, the multiple correlation coefficient (R), coefficient of
determination (R2), and F ratio were examined. First, the R of independent variables on
Familiarity/Relaxing/
Trip plans
Unfamiliarity/
Adventure
Overall Satisfaction Pearson
Correlation
.532**
.210**
Sig.
(2-tailed)
.000
.003
N 205 205

56
the dependent variable was .572, which showed that the tourists had positive and high
overall satisfaction levels with the two dimensions. Second, the R2
was .327, suggesting
that more than 32% of the variation of tourists’ overall satisfaction was explained by the
two factors, Last, the F ratio, which explained whether the results of the regression
model could have occurred by chance, had a value of 49.155 (p = .000) and was
considered significant. Therefore, the regression model satisfied level of goodness-of-fit
in predicting the variance of tourists’ overall satisfaction.
In the results, the highest beta coefficient scores were Familiarity/ Relaxation/
Trip Plans, β = 0.532, p = .000, followed by Unfamiliarity/Adventure, β = .210, p =
.000). The results indicated that familiarity, relaxation, and trip plans (Factor 1) and
unfamiliarity and adventure would significantly impact tourists’ overall satisfaction
toward the homestay destination.
According to the multiple regression analysis results, two underlying
dimensions significantly affected overall satisfaction of tourists. Thus, hypothesis 3 was
accepted, that tourists’ motivation could be a predictor of tourists’ overall satisfaction.

57
Table 11.
Regression results of tourists’ overall satisfaction level based on the dimension (N=205)
Dependent variable: Tourists’ overall satisfaction with homestays in Thailand
Independent variable: Two factors
Model summary
R R2 Adjusted R
2 SE
.572 .327 .321 .810
Analysis of Variance
Sum of square df Mean square F p
Regression 64.450 2 32.225 49.155 .000
Residual 132.428 202 .656
Total 196.878 204
Regression Analysis
Independent variable
Std.
Error
Beta t-value p
Constant .057 88.848 .000
Familiarity/Relaxation/Trip plans .057 .532 9.223 .000 Unfamiliarity/Adventure .057 .210 3.639 .000
Note: *p < 0.05

58
4.6 Summary
This chapter presented the results of statistical analysis of the data. First, the
demographic characteristics of subjects were presented to address the research objective
1. Second, the satisfaction of tourists towards the homestay industry in Thailand was
presented. Research objective 4 is addressed. Then, the results of the relationship
between tourists’ motivation, cultural and heritage attributes, and tourists’ overall
satisfaction with homestays in Thailand were presented to address research objective 2
and 5. Finally, hypotheses were tested though Independent-Samples T-test (t-test),
Analysis of Variance (ANOVA), Factor analysis, Correlation analysis, and Multiple
regression analysis.

59
CHAPTER 5
DISCUSSION
5.1 Introduction
This chapter covers the discussion, implications, and limitations of the study.
The findings of the study are discussed in tourists’ demographic characteristics, tourists’
motivation, cultural and heritage attributes of homestays in Thailand, and the relationship
between tourists’ demographic characteristic, tourists’ motivation, cultural and heritage
attributes and tourists’ overall satisfaction with homestays in Thailand. Implications are
drawn based on the discussion. Finally, the limitation of the study is discussed.
5.2 Conclusion
The purposes of this study were to explore demographic characteristic, tourists’
motivation, cultural and heritage attributes, and identify the relationship between them
and tourists’ overall satisfaction with homestays in Thailand.
Two hundred ninety three surveys were collected and 205 final surveys were
utilized for the study. In general, almost 85% of respondents tended to be under 40 years
old and 80.5% of respondents were single. Most respondents were Thai, whereas only
3.9% of respondents were from other countries. Moreover, most of respondents had a
high level of education (65.4%), especially, bachelor’s degree (52.7%). Although the
results showed that most of respondents were Thai who had a high level of education,

60
around 59% of them had a low total household income level (less than $19,999). To
identify the income level of respondents, this study used US dollars to be the measure
instrument in the survey. The value of Thai’s currency (Bath) is also lower than the value
of US dollars (1 Dollar = 35 Bath). Therefore, value of money may distinguish between
education levels and total income levels in this study.
The finding of the study by descriptive analysis revealed that the mean value of
the respondents’ overall level of satisfaction was 5.02, which tended toward high
satisfaction. This suggests that the homestays in Thailand provides tourists with a
satisfactory experience. The results of correlation analysis revealed that tourists’
motivation and cultural/heritage attributes collectively provide some measurement of the
overall satisfaction of homestays in Thailand. The study also found that there seems to be
a moderate correlation between tourists’ overall satisfaction and tourists’ motivation and
cultural and heritage attributes.
Based on the objectives of the study, three main hypotheses were presented and
tested. Independent Sample T-test, Analysis of Variance (ANOVA), Factor Analysis,
Correlation analysis, and Multiple Regression Analysis were performed for hypothesis
testing.
First, Independent Sample T-test and Analysis of Variance (ANOVA) were used
in order to analyze the difference in the level of overall satisfaction in relation to the
demographic characteristic. The results of the two-tailed independent t-test and ANOVA
revealed that there was a significant difference between the overall satisfaction and
tourists’ education level (F = 7.006, p = .000), and the overall satisfaction and tourists’
household income (F = 3.427, p = .034). Moreover, the results suggest education levels
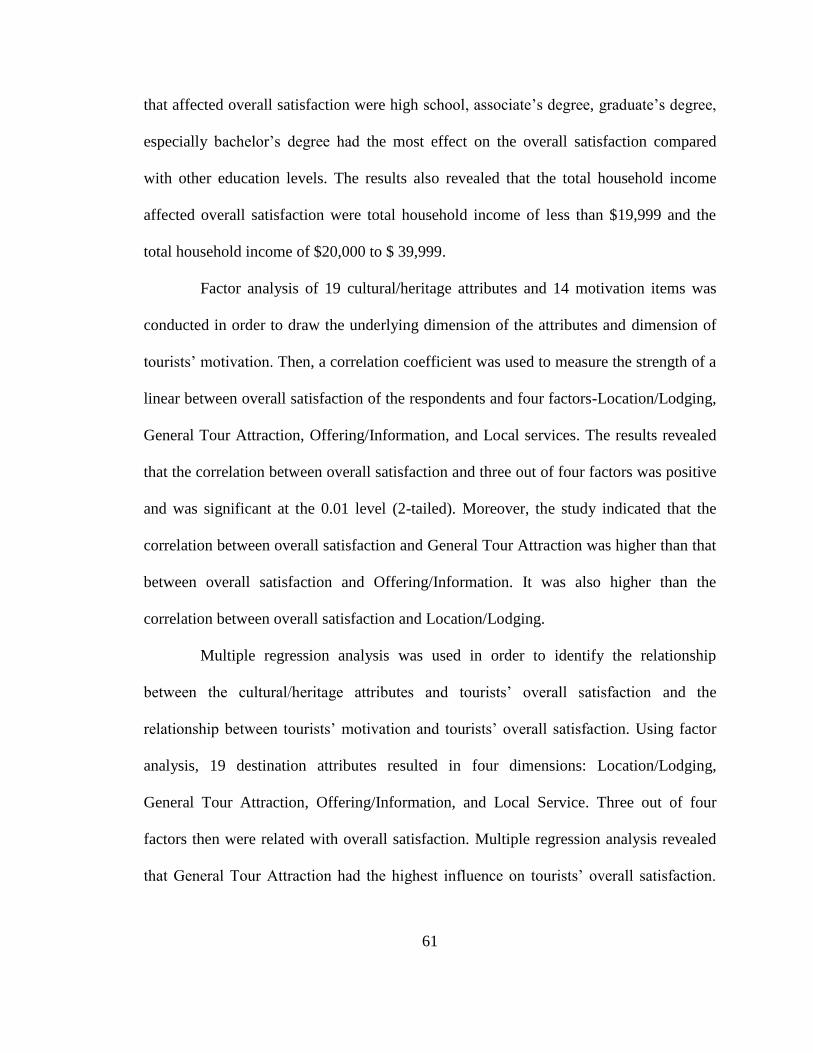
61
that affected overall satisfaction were high school, associate’s degree, graduate’s degree,
especially bachelor’s degree had the most effect on the overall satisfaction compared
with other education levels. The results also revealed that the total household income
affected overall satisfaction were total household income of less than $19,999 and the
total household income of $20,000 to $ 39,999.
Factor analysis of 19 cultural/heritage attributes and 14 motivation items was
conducted in order to draw the underlying dimension of the attributes and dimension of
tourists’ motivation. Then, a correlation coefficient was used to measure the strength of a
linear between overall satisfaction of the respondents and four factors-Location/Lodging,
General Tour Attraction, Offering/Information, and Local services. The results revealed
that the correlation between overall satisfaction and three out of four factors was positive
and was significant at the 0.01 level (2-tailed). Moreover, the study indicated that the
correlation between overall satisfaction and General Tour Attraction was higher than that
between overall satisfaction and Offering/Information. It was also higher than the
correlation between overall satisfaction and Location/Lodging.
Multiple regression analysis was used in order to identify the relationship
between the cultural/heritage attributes and tourists’ overall satisfaction and the
relationship between tourists’ motivation and tourists’ overall satisfaction. Using factor
analysis, 19 destination attributes resulted in four dimensions: Location/Lodging,
General Tour Attraction, Offering/Information, and Local Service. Three out of four
factors then were related with overall satisfaction. Multiple regression analysis revealed
that General Tour Attraction had the highest influence on tourists’ overall satisfaction.

62
The second highest influential dimension was Offering/Information. The last influential
dimension was Location/Lodging.
Based on the results of factor analysis, two factors of 14 motivation items were
Familiarity/Relaxation/Trip plans and Unfamiliarity/Adventure. The study indicated that
that the correlation between overall satisfaction and two factors was positive and was
significant at the 0.01 level (2-tailed). The results also suggested that the correlation
between overall satisfaction and Familiarity/Relaxing/ Trip plans was higher than that
between overall satisfaction and Unfamiliarity/Adventure. In addition, the results of
multiple regression revealed that two factors were related with overall satisfaction.
Familiarity/ Relaxation/Trip plans had the highest influence on tourists’ overall
satisfaction, followed by Unfamiliarity/Adventure.
According to the results of the study, the variables represented a judgment about
demographic, cultural/heritage attributes and tourists’ motivation on the tourists’ overall
satisfaction. Demographic characteristic (education level and total household income)
would be a key indicator of tourists’ overall satisfaction. Cultural/heritage attributes and
tourists’ motivation would be the predictors of overall satisfaction of tourists who visited
homestays in Thailand.
5.3 Implications
Based on the results of this study, several recommendations can be made to
increase tourists’ satisfaction with homestays in Thailand. The results of the study
revealed that although three factors (Location/Lodging, General Tour Attraction, and

63
Offering/Information) have a significant relationship with the tourists’ overall
satisfaction, General Tour Attraction was a more important factor that influenced
tourists’ overall satisfaction than Offering/Information and Location/Lodging. This
finding can be useful to the marketers of homestay tourism in developing strategies to
enhance their competitiveness. They should focus more on maintaining or improving
factors that contribute to tourists’ overall satisfaction. For example, homestay managers
and marketers should provide quality service with their General Tour Attractions such as
possibility for shopping, some entertainments, souvenirs, opportunity for rest, and
recreational activities, and Offering/Information factor such as culture and other events
and information from friends or family relative to the travel. Although Location/Lodging
was not demonstrating a high statistical significance at this point, it still indicated
considerable practical importance with regards to the nature of the study. The results
implied that tourists’ satisfaction at homestays in Thailand might not necessarily depend
upon other elements such as the offering of local cuisine and hospitality.
The study findings indicated that two factors of tourists’ motivation
(Familiarity/ Relaxation/Trip plans and Unfamiliarity/Adventure) were the important
indicators of the tourists’ overall satisfaction. The results revealed that Familiarity/
Relaxation /Trip plans were more important factors that influenced tourists’ overall
satisfaction than Unfamiliarity/Adventure. This observation provides some insights on
the importance of motivation factors and will be help for the homestay planners and
promoters when proposing the marketing strategies to the potential and current tourists
publicly. To gain more tourists’ motivation, marketing and management may require
more attention on Familiarity/Relaxation/Trip plans such as good service-minded people,

64
tour package, familiarity of places, variety of foods, and fun and relaxing trip. Although
Unfamiliarity/Adventure had a lower statistical significance than Familiarity/
Relaxation/Trip plans at this point, it still indicated considerable practical importance.
Thus, homestay marketing should be aware of Unfamiliarity/Adventure such as a variety
of activities, culture or ways of life, and cultural events in order to motivate tourists. It is
suggested that the degree to which managers control the various types of motivation
items will eventually influence tourists’ overall satisfaction and the development of
successful programs, facilities, and management.
Because this study revealed that there were differences in the overall satisfaction
of tourists in term of education levels, it is hoped that the results of the study will provide
some insights that may help homestay marketers develop specific promotional strategies.
The study revealed that most of tourists were Thai, 85% of respondents tended to be
under 40 years old and 80.5% of respondents were single. The study also revealed that
tourists who earned bachelor’s degree and had total household income less than $19,999
had the most effect on overall satisfaction. Thus, these findings can be useful to
homestay planners to improve and create key attributes to attract target tourists. Also,
homestay planners may develop the special services and products such as promotional
packages for target tourists in order to induce and maintain their interest in the
destinations and attract potential tourists to homestay destinations.
This study hopefully will give homestay destination marketing managers a
better picture of tourists’ satisfaction on both motivation and attribute issues and they
should be given attention and consideration. Also, homestays need to combine all kinds
of factors to achieve tourist satisfaction. In order to create effective marketing strategies
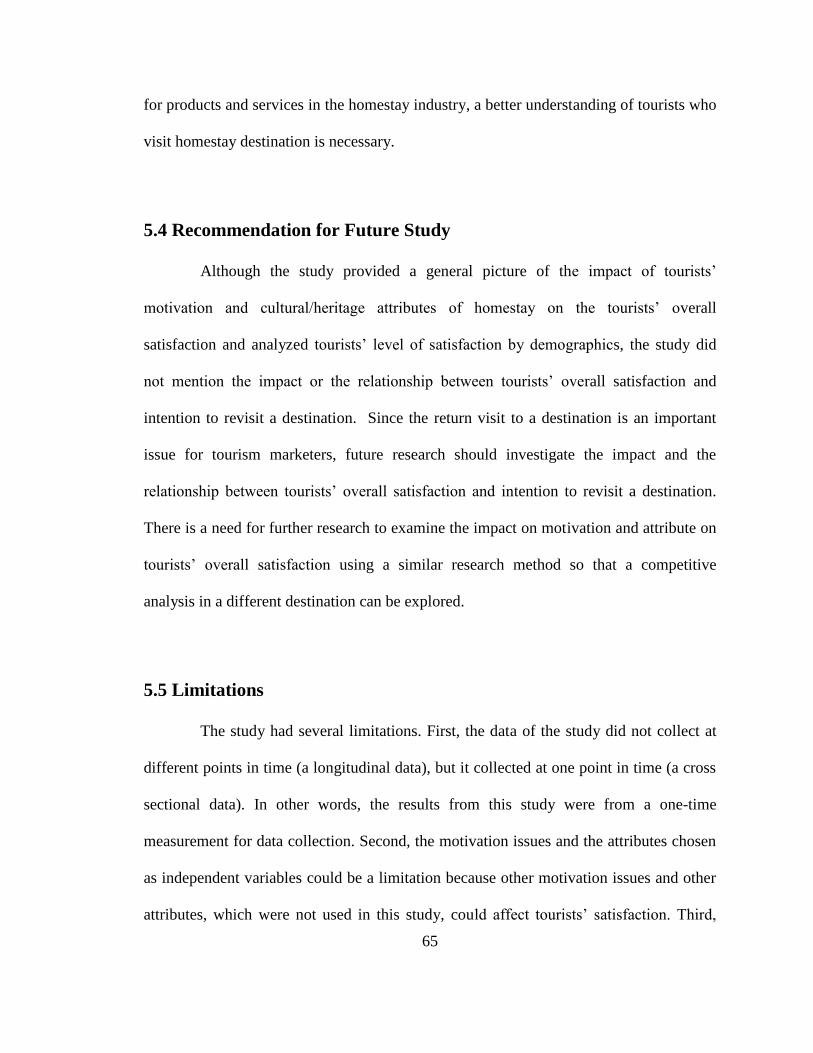
65
for products and services in the homestay industry, a better understanding of tourists who
visit homestay destination is necessary.
5.4 Recommendation for Future Study
Although the study provided a general picture of the impact of tourists’
motivation and cultural/heritage attributes of homestay on the tourists’ overall
satisfaction and analyzed tourists’ level of satisfaction by demographics, the study did
not mention the impact or the relationship between tourists’ overall satisfaction and
intention to revisit a destination. Since the return visit to a destination is an important
issue for tourism marketers, future research should investigate the impact and the
relationship between tourists’ overall satisfaction and intention to revisit a destination.
There is a need for further research to examine the impact on motivation and attribute on
tourists’ overall satisfaction using a similar research method so that a competitive
analysis in a different destination can be explored.
5.5 Limitations
The study had several limitations. First, the data of the study did not collect at
different points in time (a longitudinal data), but it collected at one point in time (a cross
sectional data). In other words, the results from this study were from a one-time
measurement for data collection. Second, the motivation issues and the attributes chosen
as independent variables could be a limitation because other motivation issues and other
attributes, which were not used in this study, could affect tourists’ satisfaction. Third,

66
respondents perhaps provided similar answers between their motivation and their
satisfaction because the study did not conduct pre- and post-evaluation. Finally, the
research data were collected in a specific setting - homestays in the central part of
Thailand, which limited the generalization of the research findings.
The limitation could suggest directions and guidelines for future study. The
generalization issue could be better solved with further research in other settings that
have different destination attributes and motivation perspectives.

67
Appendix A. Signed Permission Letter

68
Dear Homestay managers,
I am a graduate student in Hotel and Restaurant Management at University of Missouri.
I am conducting a study of tourists’ motivation to participate homestays in Thailand and their satisfaction
on homestay attributes.
This study’s aim is to explore the motivations and demographics of tourists who participate in homestay
programs in Thailand. It is also intended to investigate which attributes satisfy tourists who visit cultural
destinations in order to assist homestay operators in developing strategies to attract travelers.
I would like your permission to distribute the questionnaires to the first completed tourist groups who use
your homestays; please also ask the tourists to complete the questionnaire enclosed in the envelope and
return it to you. Results of this study will be summarized in an executive report, and will be shared with
you upon request. Please provide your e-mail address if you would like to receive the report.
Please indicate your approval of this permission by signing the letter where indicated below and returning
it to me as soon as possible.
Thank you very much. Your help will greatly contribute to the study.
Sincerely,
Kanoknon Seubsamarn
Hotel & Restaurant Management
Food & Hospitality System
222 Eckles Hall, University of Missouri-Columbia
Columbia, MO 65211
573-882-0563
Signature Date

69
Appendix B. Informed Consent Form

70
Dear Respondent,
I am a graduate student in Hotel and Restaurant Management at University of Missouri.
I am conducting a study of tourists’ motivation to participate homestays in Thailand and their satisfaction
on homestay’s attributes. I am writing this letter to invite you to participate in research in the form of a
questionnaire.
This study is aimed to explore the motivations and demographic of tourist who participated in homestay
programs in Thailand. It is also intended to investigate which attributes satisfy tourists who visit cultural
destinations in order to assist homestay operators in developing strategies to attract travelers.
Please complete the questionnaire enclosed in the envelope and return it to a distributer. The questionnaire
takes about 10-15 minutes to be completed. Your participation is anonymous and voluntary. Results of this
study will be summarized in an executive report, and will be shared with you upon request. Please provide
your mail address if you would like to receive the report.
For questions regarding the rights of research subjects, any complaints or comments regarding the manner
in which the study is being conducted you may contact the MU Office for the Protection of Research
Subjects at 573-882-9585 or [email protected].
Thank you very much for your participation. Your help will greatly contribute to the study.
Sincerely,
Kanoknon Seubsamarn
Hotel & Restaurant Management
Food & Hospitality System
222 Eckles Hall,
University of Missouri-Columbia
Columbia, MO 65211
573-882-0563

71
Appendix C. Survey Questionnaire

72
Section 1: Tourist’s Motivations
1. What are the main reasons for your visit to this tourist destination?
( ) Rest and relaxation
( ) Visiting relatives and friends
( ) Business reasons
( ) Attending a conference, congress, seminar, and other forms of educations
( ) Culture
( ) Fun
( ) Sport and recreation
( ) Health
( ) Religious reasons
( ) Other, what: ___________________________________________
2. Briefly reflect on how you feel about your motivation that prompts you to choose
homestays in Thailand to be your travel destination and respond to the following
statements. Please indicate the extent of your opinion how important it is with the
following statements on 7-point scale. (Please circle one for each item)
7 6 5 4 3 2 1
Strongly
Important Important
Somewhat
Important
Neither
Important nor
Unimportant
Somewhat
Unimportant
Unimportant Strongly
Unimportant
I want to have a variety of activities. 7 6 5 4 3 2 1
I want to know different cultures/ways of life. 7 6 5 4 3 2 1
I want to have fun and enjoyment. 7 6 5 4 3 2 1
I like to be careful and complete planned trip. 7 6 5 4 3 2 1
I want to have a restful and relaxing trip. 7 6 5 4 3 2 1
I want to have time by myself. 7 6 5 4 3 2 1
I want to visit familiar places. 7 6 5 4 3 2 1
I want to visit friends and relatives. 7 6 5 4 3 2 1
I want to visit new places. 7 6 5 4 3 2 1 I want to have the romance or a romantic setting. 7 6 5 4 3 2 1 I want to attend cultural events. 7 6 5 4 3 2 1 I want to seek the beauty of nature. 7 6 5 4 3 2 1 I want a low-cost tour package. 7 6 5 4 3 2 1 It is good value for money. 7 6 5 4 3 2 1 I want to seek variety of foods. 7 6 5 4 3 2 1 I want to meet good service-minded people. 7 6 5 4 3 2 1

73
Section 2: Tourists’ Satisfaction
1. Please indicate the extent of your satisfaction with the following item on a 7-point
scale. (Please circle one for each item)
7 6 5 4 3 2 1
Strongly
Satisfied Satisfied
Somewhat
Satisfied
Neither
Satisfied nor
Dissatisfied
Somewhat
Dissatisfied Dissatisfied
Strongly
Dissatisfied
3. Overall, how satisfied were you with your trip at homestays in Thailand?
Very satisfied Very dissatisfied
Personal safety and security 7 6 5 4 3 2 1 The destination can be easily reached 7 6 5 4 3 2 1 Climate conditions 7 6 5 4 3 2 1 Diversity of cultural/historical attractions
(Architecture, Tradition and Customs…) 7 6 5 4 3 2 1
The quality of the accommodation 7 6 5 4 3 2 1 Hospitality and friendliness of the local residents 7 6 5 4 3 2 1 The offer of local cuisine 7 6 5 4 3 2 1 Possibility for shopping 7 6 5 4 3 2 1 Night life and entertainment 7 6 5 4 3 2 1 Opportunity for rest 7 6 5 4 3 2 1 Availability of sport facilities and recreational
activities 7 6 5 4 3 2 1
Offer of cultural and other events 7 6 5 4 3 2 1 Conference offer 7 6 5 4 3 2 1 Political and economic status 7 6 5 4 3 2 1 Beauty of the scenery 7 6 5 4 3 2 1 Cleanliness 7 6 5 4 3 2 1 Ethnic composition 7 6 5 4 3 2 1 Souvenirs 7 6 5 4 3 2 1 Distance from home 7 6 5 4 3 2 1 Information from friends and family relative to the
travel 7 6 5 4 3 2 1
Advertizing 7 6 5 4 3 2 1 Tour packages 7 6 5 4 3 2 1
7 6 5 4 3 2 1

74
Section 3: General Information
1. What is your gender?
Male Female
2. What is your age?
25 or under 41-55
26-40 56 or older
3. Please, name your country of residence: _____________________________
4. What is your marital status?
Single Divorced
Married Widowed
5. What is the highest level of education you have completed?
High school Bachelor’s degree
Some college experience Master’s degree
Associate’s degree Doctor’s degree
6. What is your approximate total household income in U.S. dollars?
Less $19,999 $60,000 - $79,999
$20,000 - $39,999 $80,000 or more
$40,000 - $59,999
Thank you very much!

75
REFERENCES
Anonymous. (2007). Thai Stand Homestay Directory. Homestay Thailand, from
http://www.homestaythai.org/en/homestay.php.
Anonymous. (2008). Review of homestay business. Research and Development team of
Changmai University, Thailand, from http://www.tourismthailand.org/news/.
Anonymous. (2009). Update Thailand Tourism Situation. Tourism Authority of
Thailand, from http://www.tourismthailand.org/news/.
Ary, D., Jacobs, L., Razavieh, A., & Sorensen, C. (2006). Introduction to Research in
Education. Belmont, CA: Wadsworth-Thompson Learning.
Augustyn, M. (1998). National strategies for rural tourism development and
sustainability: The Polish experience. Journal of Sustainable Tourism, 6(3), 191-209.
Baloglu, S. (1997). The relationship between the destination images and
sociodemographic and trip characteristics of international travelers. Journal of Vacation
Marketing, 3(3), 221-223.
Beerli, A. & Martin, J.D. (2004). Tourists’ characteristics and the perceived image of
tourist destinations: a quantitative analysis-a case study of Lanzarote, Spain. Tourism
Management, 25, 623-636.
Chon, K.S. & Olsen, M.D. (1991). Functional and Symbolic Approaches to Consumer
Satisfaction/Dissatisfaction. Journal of the International Academy of Hospitality
Research, 28, 1-20.
Cole, S. (2007). Beyond authenticity and co modification. Annals of Tourism Research,
34(4), 943-960.
Crompton, J.L. (1979). Motivation for Pleasure Vacation. Annals of Tourism Research,
6(4),408-424.
Crompton, J.L. & Love, L.L. (1995). The predictive value of alternative approaches to
evaluating quality of a festival. Journal Travel Research, 34(1), 11-24.
Crompton, J.L. & Mckay, S.L. (1997). Motivation of Visitors Attending Festival
Events. Festival Management and Event Tourism, 1(1), 5-10.

76
Crouch, G.I. & Ritchie, J.R.B. (1999). Tourism, Competitiveness and Social Prosperity.
Journal of Business Research, 44, 137-152.
Dann, G. (1997). Anomie, Ego-enhancement and Tourism. Annals of Tourism
Research, 4(4), 184-194.
Enright, M.J. & Newton, J. (2004). Tourism Destination Competitiveness: A
Quantitative Approach. Tourism Management, 25(6), 777-788.
Field, A.P. (2005). Discovering statistics using SPSS. London: Thousand Oaks, Calif.
Formica, S. & Uysal, M. (1998). Market Segmentation of an International Cultural-
Historical Event in Italy. Journal of Travel Research. 36, 16-24.
Frederick, C.M. (2003). Merriam-Webster’s collegiate dictionary. Merriam-Webster.
595.
Heung, V.C.S. & Cheng, E. (2000). Assessing tourists’ satisfaction with shopping in
the Hong Kong special administrative region of China. Journal of Travel Research, 38,
396-404.
Hollinshead, K. (1993). Encounters in Tourism. VNR’ s Encyclopedia of Hospitality
and Tourism. 636-651.
Howell, R. A., P.J. Moreo, & F.J. De Micco. (1993). A Qualitative Analysis of Hotel
Services Desired by Female Business Travelers. Journal of Travel and Tourism
Marketing, 1(4), 115-132.
Iso-Ahola, S.E. (1982). Toward a Social Psychological Theory of Tourism Motivation:
A Rejoinder. Annals of Tourism Research, 9, 256-262.
Jang, S. S., & Cai, L., A. (2002). Travel motivations and destination choice: A study of
British outbound market. Journal of Travel and Tourism Marketing, 4(1/2), 23-45.
Janiskee, R.L. (1996). Historic Houses and Special Events. Annals of Tourism
Research, 23(2), 398-414.
Kao, M.C., Patterson, L., & Li, Chungi Kai. (2008). Motivations and Satisfactions of
Taiwanese Who Visit Australia. Journal of Travel & Tourism Marketing, 24(1), 17-33.
Kozak, M. & Rimmington, M. (2000). Tourist Satisfaction with Mallorca, Spain, as an
Off-Season Holiday Destination. Journal of Travel Research, 38(3), 260-269.
Lashley, C. & Morrison, A. (2000). In Search of Hospitality: Theoretical Perspectives
and Debates, Oxford: Butterworth-Heinemann.

77
Liu, A. (2006). Tourism in rural areas: Kedah, Malaysia. Tourism Management, 27(5),
878-889.
Lynch, P.A. (2000a). Networking in the Homestay Sector. The service Industries
Journal, 20(3), 95-115.
Lynch, P.A. (2000b). Setting and its Significance in the Homestay Sector: Explorations.
Proceedings of CHME 9th
Annual Hospitality Research Conference, Huddersfield, 319-
333.
Lynch, P. (2003). Homestay Accommodation Sector. LTSN Hospitality, Leisure, Sport
& Tourism, 1-6.
Lynch, P.A. & MacWhannell, D. (2000). Home and Commercialised Hospitality. In
Search of Hospitality: Theoretical Perspectives and Debates, Oxford:
Butterworth_Heinemann, 100-117.
Mannell, R.C. & Iso-Ahola, S. (1997). Psychological Nature of Leisure and Tourism
Experience. Annals of Tourism Research, 14, 314-331.
Martilla, J.A. & James. J.C. (1997). Importance-Performance Analysis. Journal of
Marketing, 41, 77-79.
Mastr, H. & Prideaux, B. (2000). Culture and Vacation Satisfaction: a Study of
Taiwanese tourists in South East Queensland. Tourism Management, 21, 445-449.
Matzler, K. & Sauerwein, (2002). E. The factor structure of customer satisfaction: an
empirical test of the performance grid and the penalty-reward-contrast analysis.
International Journal Service Industrial Management, 13(4), 317-332.
Morrison, A.M., Pearce, P.L., Moscardo, G. Nadkarni, N. & O’Leary, J.T. (1996).
Specialist Accommodation: Definition, Markets Served, and Roles in Tourism
Development. Journal of Travel Research, 35(1), 18-26.
Meyers, L.S., Gamst, G., & Guarino, A.J. (2006). Applied Multivariate Research:
Design and interpretation. Thousand Oaks, CA: Sage Publications.
Myers, D. G. (2004). Psychology. New York: Worth publishers.
Ngamsom, R. (2007). Thai and Scandinavian Tourists’ Motivation to Visit Phuket,
Thailand. Journal of Travel Research, 46, 422-433.

78
Oh, H. & Parks, S. (1997). Customer Satisfaction and Service Quality: A critical
Review of the Literature and Research Implication for the Hospitality Industry.
Hospitality Research Journal, 20(3), 35-62.
O’Leary, S. & Deegan, J. (2005). Ireland’s Image as a Tourism Destination in France:
Attribute Importance and Performance. Journal of Travel Research, 43(3), 247-256.
Oliver, R. L. (1980). A cognitive Model for the Antecedents and Consequences of
Satisfaction Decisions. Journal of Marketing Research, 27, 460-469.
Pearce, Philip L., & Lee, U.T. (2005). Developing the Travel Career Approach to
Tourist Motivation. Journal of Travel Research, 43(3), 226-237.
Peleggi , M. (1996). National heritage and global tourism in Thailand. Annals of
Tourism Research, 23(2), 340-364.
Pizam, A. & Millman, A. (1993). Predicting satisfaction among first-time visitors to a
destination by using the expectancy-disconfirmation theory. International Journals of
Hospitality Management, 12(2), 197-209.
Pizam, A., Neumann, Y. & Reichel, A. (1978). Dimensions of tourist satisfaction with a
destination. Annals of Tourism Research, 5, 314-322.
Pizam, A., Neumann, Y., & Reichel, A. (1979). Tourist satisfaction: Uses and misuses.
Annals of Tourism Research, 6(2), 195-197.
Rhodri, T. (2004). Small firms in tourism: international perspectives. Boston:
Elsevier.
Richards, G. (2007). ATLAS Cultural Tourism Survey Summary Report 2007. ATLAS
Cultural Tourism, from http://www.dipalme.org.
Rivers, W. P. (1998). Is Being There Enough? The Effects of Homestay Placement on
Language Gain During Study Abroad. Foreign Language Annals, 31(4), 492-500.
Ross, E.L.D. & Iso-Ahola, S.E. (1991). Sightseeing Tourists’ Motivation and
Satisfaction. Annals of Tourism Research, 18(2), 226-237.
Silberberg, T. (1995). Cultural tourism and business opportunities for museums and
heritage sites. Tourism Management, 16(5), 361-365.
Sofield, T.H.B. & Li, F.M.S. (1998). Tourism development and cultural policies in
Chana. Annals of Tourism Research, 25(2), 362-392.
79
Tabachnick, B.G. & Fidell, L.S. (1983). Using Multivariate Statistics. New York:
Harper and Row.
Tabachnick, B.G. & Fidell, L.S. (2007). Using Multivariate Statistics. Boston: Allyn
and Bacon.
Thompson, M. (1998). Cultural Tourism. Washington Heritage Bulletin, 20(4).
Uysal, M. & Williams, J. (2004). The Role of Expressive and Instrumental Factors in
Measuring Visitor Satisfaction. London: CABI.
Wang, Y. (2007). Customized authenticity begins at home. Annals of Tourism
Research, 34(3), 789-804.
Yoon, Y. & Uysal, M. (2005). An Examination of the Effects of Motivation and
Satisfaction on Destination Loyalty. Tourism Management, 26(1), 45-56.