tourism report ii final - florida taxwatch > home tourism means business visitors help maintain...
TRANSCRIPT

THE IMPACT OF TOURISM ON FLORIDA’S ECONOMY: TELLING A MORE COMPLETE STORY
Executive Summary
Florida Tourism Means Business
Visitors Help Maintain and Grow a Healthy, Competitive Economy
Impacts in Brief
• Recovery from 9/11. Overcoming a slump that began after September 11, 2001, 85.8 million tourists visited Florida in 2005, an all-time high. Despite anticipated hurricane fears, visits for the third quarter of 2005 exceeded the same period in 2004 by 9.3%. By 2010, an estimated 97 million tourists will visit Florida.
• Air Travel Decline. The ratio of air to non-air visitors to Florida began declining after 1998. Before the decline, air visitors exceeded other visitors by 25%. Since 9/11, more visitors came by non-air than by air, but by 2004, air and other visitors were equal in proportion. In 2005, air visitors slightly exceeded other visitors.
• Average Tourist Stays Five Nights. The average tourist stays five nights and spends from $107 (non air traveler) to $163 (air traveler) per day in Florida.
• Double Benefit from Foreign Tourists Threatened. A foreign tourist spends twice as much as a domestic tourist. Florida TaxWatch noted that the state’s economic well-being stands at great risk from the unintended consequences of national security policies and procedures imposed in reaction to terrorist attacks of 9/11. These measures have had greater effect on foreign tourists and others who arrive by air and who, according to surveys, stay longer and spend more.1
• Future is Bright and Pays Well. Econometric models predict that by 2010 direct, indirect, and induced benefits of travel will generate from $103 to $136 billion in economic output and 1.5 million to 1.8 million jobs for Florida. Econometric modeling
1 Florida TaxWatch, Termites in Florida’s Basement: The Economic Impact of National Security Policy on Florida’s Economy, December 2005. To download: http://www.floridataxwatch.org/resources/pdf/BRIEFINGSDec2005Security.pdf
Research Report
March 2006
Center for Tourism
106 N. Bronough St. ♦ P. O. Box 10209 ♦ Tallahassee, FL 32302 ♦ (850) 222-5052 ♦ FAX (850) 222-7476
“Improving taxpayer value, citizen understanding and government accountability.”

ii
puts the average compensation, including wages and fringe benefits, of all direct and indirect tourism-related employment at $42,000.
• Tourism Creates Jobs. Businesses directly related to tourism account for 12% of all non-agricultural jobs in Florida—a percentage that has remained the same since 2000. This sector’s employment in 2005 of 944,500 rebounded from 863,000 in 2002. Strong employment growth by eating and drinking establishments made up for shrinkage in lodging and a substantial loss of air transportation jobs.
• Tourism Exports Some of Tax Burden. Tourism and recreational activities of all Floridians and visitors generated $57 billion in taxable transactions in 2004 compared to $43.8 billion in 1998. The estimated tourism-related taxable transaction for 2005 is around $62 billion. As a state where destination tourism is well-established and significant (along with such states as Hawaii, California, Nevada, New York, Maine, Vermont, as well as the District of Columbia), Florida is able to export consumption taxes to non-residents to a greater extent than states that have less tourism. Florida tourists, for example, pay sales taxes into the state general fund that support programs that benefit residents almost exclusively, such as public education. Econometric models estimate that tourism and recreational activities will generate between $12 and $13.8 billion from residents and non-residents in cumulative general state taxes from 2005 through 2010.
• Theme Parks and Sunshine Attract Tourists. Visitors surveyed reported they sought Florida because of theme parks and a variety of attractions, warm weather, and nature activities.
• Timeshares Hold Tourists. Timeshare visitors stay longer. Timeshare sales nationwide grew by 21.4% from 2003 to $7.87 billion in 2004. Florida accounted for over a fourth of total annual timeshare sales nationwide. Florida had 366 timeshare resorts with 27,700 individual units in 2002.
• Crime. Florida’s crime rate has declined steadily over the same period that tourism has substantially increased. However, a University of North Florida study estimated that the cost of tourist-related incarcerations was nearly $200 million per year. A portion of the growing population of tourists will have criminal intentions. Tourists carry valuable personal property subject to theft. Population density increases in tourist areas and enhances opportunities for crime.
• Traffic Congestion. Tourism does contribute to traffic congestion in tourist-affected areas and is clearly evident in south Florida where temporary residents converge in the winter. National data show that congestion is higher in Orlando and Miami but that Florida’s other urban areas endure less congestion than those in other states. A 2001 University of North Florida study concluded that only a small portion of Florida’s overall congestion costs was attributable to visitors.
The number of visitors to Florida reached a new record-breaking level in 2005 with nearly 86 million visitors. This number is estimated to reach between 97 million (median estimate) and 104 million (optimistic estimate) by 2010. Two econometric models used in this study estimate that, by 2010, tourist expenditures will support between 1.5−1.8 million jobs and contribute between $102 and $135 billion to Florida’s economy in terms of increase in the state’s output.

iii
In 2000, Florida TaxWatch produced a study entitled The Benefits and Costs of Tourism to Florida. The following report updates and expands on that study by describing and analyzing: ► Historic and forecasted trends concerning tourism’s benefits to Florida’s economy including jobs, transportation improvements, and tax collections; ► Costs and impacts of tourism on public safety, traffic congestion, transportation, and the environment; ► Tourism’s impact on the timeshare industry.
Figure 1. Florida’s Historical and Forecasted Numbers of Tourists Continue to Trend Upward (1976−2014)
0
20,000,000
40,000,000
60,000,000
80,000,000
100,000,000
120,000,000
140,000,000
1976
1978
1980
1982
1984
1986
1988
1990
1992
1994
1996
1998
2000
2002
2004
2006
2008
2010
2012
2014
Optimistic Pessimistic Median
Source: Historic DataVISIT FLORIDA and Center for Economic Forecasting and Analysis (CEFA), Florida State University. Forecast DataCEFA, FSU. Note: Some of the sharp increase between 1999 and 2000 resulted from a change in the methodology used by VISIT FLORIDA to calculate the number of tourists. The new method was recommended by George Washington University and University of North Florida experts as more accurate than the previous approach. Figure 1 shows historical and forecasted numbers of tourists visiting Florida between 1976 and 2014. Some of the sharp increase between 1999 and 2000 resulted from a change in the methodology used by VISIT FLORIDA, the state’s tourism marketing agency, to calculate tourism.2 2 The new method, reported in VISIT FLORIDA’S Florida Visitor Study 2000, was recommended by George Washington University and University of North Florida experts as being more accurate than the previous approach.

iv
Warfare, the Economy, and Tourism
The economic recession beginning early in 2001, the tightening of airport security after 9/11, and the wars in Afghanistan and Iraq pushed the U.S. tourism sector into its worst slump since World War II.3 The number of visitors to Florida declined by 3.3 million in 2001 compared to the previous year. The number of visitors from all EU countries except the U.K. dropped 28% between 1999 and 2004, accounting for a quarter of a million fewer visitors. Severely declining number of affordable hotels on the beaches, rising competition from other tourist destinations such as Spain and Caribbean countries, and tight border regulations are the leading factors contributing to the decline in the number of international visitors to Florida.4 However, the overall upward trend resumed in 2002 and reached a record level in 2004. Economic recovery, a weak U.S. dollar, and the absence of another terrorist attack on U.S. soil are fueling tourism growth. A recent study estimates that visitors to Orlando alone will reach 55.2 million in 2007.5 A preliminary estimate indicates that Florida reached a new record in 2005 in visitation to the state with nearly 86 million visitors.
According to a preliminary estimate from VISIT FLORIDA, the state’s tourism marketing agency, 85.8 million people visited Florida in 2005 (Table 1).6 This is 37 million more than in 1998. However, some of this increase resulted from a change in the methodology used by VISIT FLORIDA to calculate tourism. Median estimates have the number of visitors growing 16% to 92.5 million by 2010.
Table 1. Visitors to Florida (in millions)
Source: VISIT FLORIDA, 1998, 2003, and 2004 Florida Visitor Study and 2002-2005 Florida Visitor Analysis
A survey conducted in November 2004 by YPB&R, an independent communication
3 Wilkerson, Chad: Travel and Tourism: An overlooked Industry in the U.S. and Tenth District, Economic Review, Federal Reserve Bank of Kansas City; Third Quarter 2003. 4 Werner, Johannes: Obstacles, Florida Trend, October 2005. 5 New research forecasts local tourism, Orlando Business Journal, March 22, 2005. 6 The visitor data used in this study are from Florida Visitor Studies published by VISIT FLORIDA, which quarterly conducts a survey to gather air traveler information at Florida’s 14 largest airports. VISIT FLORIDA estimates non-air visitors based on data received from the Travel Industry Association’s Travel Scope, which provides the ratio of domestic air and non-air visitors to Florida. VISIT FLORIDA’s estimates and profiles of overseas visitors to Florida are derived from re-tabulation of data collected by the Tourism Industries Office of the U.S. Department of Commerce. Similarly, VISIT FLORIDA’s analyses of Canadian visitors are derived from custom re-tabulations of data collected by the Canadian government through Statistics Canada.
1998
1999
2000
2001
2002
2003
2004
2005
Total Visitors
48.7
58.9
72.8
69.5
73.9
74.6
79.7
85.8

v
advertising and public relations company, estimated a 5−20% decrease in the number of visitors during the hurricane season between July and September 2005.7 However, the preliminary visitor estimate by VISIT FLORIDA for the third quarter of 2005 indicates that the number of visitors to Florida reached 21.9 million during this period, a 9.3% increase over that same period in 2004. Perhaps, by presenting inviting images of Florida’s availability for spring and summer vacationers in 2005, the hurricane marketing response by VISIT FLORIDA helped to lessen the projected impact of hurricanes on Florida’s tourism.8
Looking Ahead Assuming continued state support, Table 2 presents three forecasts of tourism growth (as measured by number of tourists) in Florida between 2006 and 2014: optimistic (4% annual growth), median (2.5% growth) and pessimistic (1% growth).
Although projected 22% cumulative growth from 2006 to 2014 may seem high, these median estimates are based on 2.5% annual growth of tourism. The projected growth tracks closely with forecasted U.S. and Florida Gross Regional Product and personal income projections.9
Table 2. Florida Tourists, 2006-2014 Forecasts (in millions)
Year Optimistic Pessimistic Median 2006 89.2 86.6 87.9 2007 92.8 87.5 90.1 2008 96.5 88.4 92.4 2009 100.4 89.3 94.7 2010 104.4 90.2 97.1 2011 108.6 91.1 99.5 2012 112.9 92.0 102.0 2013 117.4 92.9 104.5 2014 122.1 93.8 107.1
Source: Projection based on 2004 Florida Visitor Study, VISIT FLORIDA.
Econometric Analysis
7 http://www.ypb.com/page_loader.php?tid=v4&sid=news&pid=pressrelease&id=10, retrieved on November 10, 2004. 8 Pitegoff, Barry, Research Guides Florida’s Marketing Response to Hurricanes, Travel and Tourism Research Association News, Winter 2005. 9 See Appendix C for comparative projections.

vi
Telling a more complete story about Florida tourism requires consideration of indirect and induced impacts,10 which contribute to Florida’s Gross State Product via a “multiplier” effect. Indirect impacts are benefits to businesses that supply goods and services to the tourism sector; induced impacts are benefits from consumption expenditures by industry employees. Money that circulates through Florida’s economy in cyclical rounds of spending comprises the total impact of tourism.
To capture tourism’s indirect and induced benefits over time, this study employs a dynamic scoring model—the REMI (Regional Economic Models, Inc.). This tool captures both ongoing and prospective impacts of tourism on our economy. For comparative analysis, a more conservative annual econometric model—IMPLAN— is also used.10
Employment Whereas 2005 direct tourism-related employment in Florida was 944,500 jobs, the REMI model estimates that the number was 1.7 million in 2005 and will be 1.8 million by 2010, adding indirect and induced employment (Table 3). The more conservative IMPLAN model shows 1.5 million tourism and tourism-related jobs by 2010.
Table 3. Estimates of Florida Tourism Impacts by 2010
REMI Model IMPLAN ModelJobs 1.8 million 1.5 millionCompensations $86.9 billion $63.1 billionAverage Compensation $47,904 $42,074Output (GSP) $135.7 billion $102.8 billion
Source: Center for Economic Forecasting and Analysis, Florida State University.
State Revenue
Florida’s tax revenues are generated by the purchase of goods by consumers, by corporate profits, and by other economic transactions. Table 4 shows that tourism and travel-related activities are expected to generate between $12 and $13.8 billion general state tax revenue through 2010 as a function of direct and indirect earnings.
Table 4. Impact of Tourism on Tax Revenue
10 Appendix D of the full report describes the REMI and IMPLAN models.

vii
Forecasting Model Taxes Forecasted to be Paid on Tourism-Related Compensations
2005 through 2010 (in billions of 2005 dollars) REMI $13.8
IMPLAN $12.0
Source: Florida TaxWatch REMI and IMPLAN Analysis.
Estimating Tourist Expenditures Despite the importance of tourism for Florida’s economy, a scientifically unreliable method is used to estimate tourism expenditures. VISIT FLORIDA uses tourism/recreation taxable sales as a proxy for that purpose. However, the tourism/recreation category includes all sales by hotels and motels, bars and restaurants, liquor stores, photo and art stores, gift shops and jewelry stores plus admissions, sporting goods and rentals to visitors and residents. Florida TaxWatch, in an upcoming Briefings, explains and strongly recommends the use of a method called tourism satellite account (TSA) which is the official international standard for estimating tourism expenditures.11 TSA was developed by the World Tourism Organization. It is used by the U.S. Bureau of Economic Analysis (BEA) at the national level, and by a growing number of states.12 ________________________________________________________________________
Recommendation A scientifically reliable method for estimating tourism expenditures called Tourism Satellite Account (TSA) is the official international standard for estimating tourism expenditures. It should be used by the State of Florida to more accurately assess and monitor the tourism sector, and establish policies to mitigate problems and seize opportunities to grow this economic sector.
Table of Contents Introduction............................................................................................................................ 1
11 Blake, A., Durbarry, R., Sinclair, M., and G. Sugiyarto, “Modelling Tourism and Travel using Tourism Satellite Accounts and Tourism Policy and Forecasting Models”, TTRI Discussion Paper 2001/4. 12 Kuhbach, P., Planting, M., and E. Strassner , “Travel and Tourism Satellite Accounts for 1998–2003”, Survey of Current Business, September 2004.

viii
Impacts in Brief...................................................................................................................... 1 Historic and Future Trends .................................................................................................... 3 Tourism Forecasts .................................................................................................................. 4 Tourism Expenditures ............................................................................................................ 6 Tourism and Timeshares ........................................................................................................ 7 Static Analysis of Tourism’s Impact on Florida’s Economy................................................. 8
Increased Employment ....................................................................................................... 8 Spending and Consumption Taxes ..................................................................................... 9 Estimating Tourist Expenditures ........................................................................................ 9 Transportation Benefits .................................................................................................... 11
Econometric Analysis of Tourism’s Dynamic Impact on Florida’s Economy.................... 12 Indirect and Induced Impacts............................................................................................ 12 Impact of Tourism on State Revenue ............................................................................... 16
Tourism Costs ...................................................................................................................... 16 Seasonality of Employment .............................................................................................. 16 Public Safety..................................................................................................................... 17 Traffic Congestion ............................................................................................................ 21 The Environment .............................................................................................................. 22 The EPA Model ................................................................................................................ 23
Conclusion ........................................................................................................................... 24 Recommendation.................................................................................................................. 25 Appendix A: Tourists Arriving In Florida by Air and by Other Means of Transportation ....... 26 Appendix B: Limitations of Cost-Benefit Analysis ............................................................. 34 Appendix C: REMI Estimate of Florida GSP..................................................................... 36 Appendix D: REMI and IMPLAN Models.......................................................................... 37 Appendix E: SICs and IMPLAN Codes .............................................................................. 39 Appendix G: List of Websites Consulted ............................................................................ 51 Other Sources Referenced.................................................................................................... 52
Figures Figure 1. Florida’s Historical and Forecasted Numbers of Tourists Continue to Trend
Upward (1976−2014) .................................................................................................... iii Figure 2. Florida’s Historical and Forecasted Numbers of Tourists Continue to Trend
Upward (1976–2014) ......................................................................................................5 Figure 3. Annual Average Wage in Tourism-Related Sectors.............................................13 Figure 4. Eight-Year Cumulative Comparison of IMPLAN and REMI Florida Tourist
Economic Impacts (2005–2012)....................................................................................14 Figure 5. IMPLAN and REMI-Based Net Present Value of Eight-Year Cumulative Impact
of Tourism on Compensations and Output (Gross State Product), 2005−2012............15 Figure 6. Crime Rate per 100,000 and Growth of Tourism (1989–2003) ...........................18 Figure 7. The Six States with High Disbursements for Highways ......................................19 Figure 8. The States with Highest Average Daily Traffic Per Lane on All Principal
Arterials in 2004............................................................................................................20

ix
Figure 9. Historic and Forecast Number of Florida Air and Non-Air Tourists, 1976–2014 (Scenario A, Median View)...........................................................................................27
Figure 10. Length of Stay for Domestic Visitors.................................................................28 Figure 11. Annual Tourist Expenditures by Category, 1976–2014 (Scenario A, Median
View) .............................................................................................................................30 Figure 12. Florida Tourist Expenditures, Historic and Forecast Trends (Scenario A,
Median View)................................................................................................................31 Figure 13. Historic and Median Forecasted Number of Florida Air and Non-Air Tourists
1976–2014 (Scenario B)................................................................................................32 Figure 14. Annual Tourist Expenditures by Category, 1976–2014 (Scenario B, Median
View) .............................................................................................................................33 Figure 15. Florida Tourist Expenditures, Historic and Forecast Trends..............................33
Tables Table 1. Visitors to Florida (in millions) ............................................................................. iv Table 2. Florida Tourists, 2006-2014 Forecasts (in millions) ...............................................v Table 3. Visitors to Florida (in thousands) ............................................................................3 Table 4. Florida Tourists, 2006-2014 Forecasts (in millions) ...............................................4 Table 5. Activities Florida Visitors Want to Participate in During Their Trip*....................6 Table 6. Domestic Tourists’ Average Daily Spending in 2004 .............................................6 Table 7. Tourists Arriving in Florida by Air and Other Means of Transportation 1998–
2005 (Visitor numbers in millions) .................................................................................7 Table 8. Tourism’s Contribution to Florida Travel-Related Employment* ..........................9 Table 9. Taxable Transactions from Tourism/Recreation ...................................................10 Table 10. Median Estimates of Cumulative Tourism-Induced Impacts by 2010 ................12 Table 11. Net Present Value of Eight-Year Comparison of IMPLAN and REMI Florida
Cumulative Tourist Economic Impacts (2005–2012, billions) .....................................15 Table 12. Impact of Tourism on Tax Revenues...................................................................16 Table 13. Unemployment Rate ............................................................................................17 Table 14. Lane Miles Added by States 1994–2004 .............................................................21 Table 15. Traffic Congestion Costs, 2002 ...........................................................................22 Table 16. Domestic Tourists’ Average Daily Spending in 2004 .........................................29 Table 17. Tourist Expenditures by Category (in millions) ..................................................30 Table 18. Tourist Expenditures by Category -Million Dollars- (Scenario B, Median View)
.......................................................................................................................................32

1
Introduction
The number of visitors to Florida reached a new record breaking level in 2005 with nearly 86 million visitors. This number is estimated to reach between 97 million (median estimate) and 104 million (optimistic estimate) by 2010. Two econometric models used in this study estimate that, by 2010, tourist expenditures will support between 1.5 and 1.8 million jobs and contribute between $102 and $135 billion to Florida’s economy in terms of increase in the state’s output.
In 2000, Florida TaxWatch produced a study entitled The Benefits and Costs of Tourism to Florida. The following report updates and expands on that study, examining a three-part question: How has Florida tourism fared in the past, what is its status today, and what may the future hold in store for it? This report describes and analyzes
Historic and future trends concerning benefits of tourism to Florida’s economy that are associated with tourist expenditures, payment of state consumption taxes, and job creation.
Tourism’s impact on the timeshare industry
Costs of tourism including seasonality of employment, traffic congestion, public
safety, transportation, and the environment. The forecasting and simulation models used in this study project significant ongoing, direct, and indirect benefits from Florida tourism regarding jobs, wages, output, and tax revenues. These benefits will result from increasing numbers of tourists spending more on entertainment, shopping, lodging, food, and transportation.
Impacts in Brief
• Recovery from 9/11. Overcoming a slump that began after September 11, 2001, 85.8
million tourists visited Florida in 2005, an all-time high. Despite anticipated hurricane fears, visits for the third quarter of 2005 exceeded the same period in 2004 by 9.3%. By 2010, an estimated 97 million tourists will visit Florida.
• Air Travel Decline. The ratio of air to non-air visitors to Florida began declining after 1998. Before the decline, air visitors exceeded other visitors by 25%. Since 9/11, more visitors came by non-air than by air, but by 2004 air and other visitors were equal in proportion. In 2005, air visitors slightly exceeded other visitors.
• Average Tourist Stays Five Nights. The average tourist stays five nights and spends from $107 (non-air traveler) to $163 (air traveler) per day in Florida.
• Double Benefit from Foreign Tourists Threatened. A foreign tourist spends twice as much as a domestic tourist. Florida TaxWatch noted that the state’s economic well-being stands at great risk from the unintended consequences of national security policies and procedures imposed in reaction to terrorist attacks of 9/11. These

2
measures have had greater effect on foreign tourists and others who arrive by air and who, according to surveys, stay longer and spend more.13
• Future is Bright and Pays Well. Econometric models predict that by 2010 direct, indirect, and induced benefits of travel will generate from $103 to $136 billion in economic output and 1.5 million to 1.8 million jobs for Florida. Econometric modeling puts the average compensation, including wages and fringe benefits, of all direct and indirect all tourism-related employment at $42,000.
• Tourism Creates Jobs. Businesses directly related to tourism account for 12% of all non-agricultural jobs in Florida—a percentage that has remained the same since 2000. This sector’s employment in 2005 of 944,500 rebounded from 863,000 in 2002. Strong employment growth by eating and drinking establishments made up for shrinkage in lodging and a substantial loss of air transportation jobs.
• Tourism Exports Some of Tax Burden. Tourism and recreational activities of all Floridians and visitors generated $57 billion in taxable transactions in 2004 compared to $43.8 billion in 1998. The estimated tourism-related taxable transaction for 2005 is around $62 billion. As a state where destination tourism is well-established and significant (along with such states as Hawaii, California, Nevada, New York, Maine, Vermont, as well as the District of Columbia), Florida is able to export consumption taxes to non-residents to a greater extent than states that have less tourism. Florida tourists, for example, pay sales taxes into the state general fund that support programs that benefit residents almost exclusively, such as public education. Econometric models estimate that tourism and recreational activities will generate between $12 and $13.8 billion from residents and non-residents in cumulative general state taxes from 2005 through 2010.
• Theme Parks and Sunshine Attract Tourists. Visitors surveyed reported they sought Florida because of theme parks and a variety of attractions, warm weather, and nature activities.
• Timeshares Hold Tourists. Timeshare visitors stay longer. Timeshare sales nationwide grew by 21.4% from 2003 to $7.87 billion in 2004. Florida accounted for over a fourth of total annual timeshare sales nationwide. Florida had 366 timeshare resorts with 27,700 individual units in 2002.
• Crime. Florida’s crime rate has declined steadily over the same period that tourism has substantially increased. However, a University of North Florida study estimated that the cost of tourist-related incarcerations was nearly $200 million per year. A portion of the growing population of tourists will have criminal intentions. Tourists carry valuable personal property subject to theft. Population density increases in tourist areas and enhances opportunities for crime.
• Traffic Congestion. Tourism does contribute to traffic congestion in tourist-affected areas and is clearly evident in south Florida where temporary residents converge in the winter. National data show that congestion is higher in Orlando and Miami but that Florida’s other urban areas endure less congestion than urban areas in other states. A
13 Florida TaxWatch, Termites in Florida’s Basement: The Economic Impact of National Security Policy on Florida’s Economy, December 2005. To download: http://www.floridataxwatch.org/resources/pdf/BRIEFINGSDec2005Security.pdf

3
2001 University of North Florida study concluded that only a small portion of Florida’s overall congestion costs was attributable to visitors.
Historic and Future Trends
The economic recession beginning early in 2001, the tightening of airport security after 9/11, and the wars in Afghanistan and Iraq pushed the U.S. tourism sector into its worst slump since World War II.14 The number of visitors to Florida declined by 3.3 million in 2001 compared to the previous year. The number of visitors from all EU countries except the U.K. dropped 28% between 1999 and 2004, accounting for a quarter of a million fewer visitors. The severely declining number of affordable hotels on the beaches, rising competition from other tourist destinations such as Spain and Caribbean countries, and tight border regulations are the leading factors contributing to the decline in the number of international visitors to Florida.15 However, the overall upward trend resumed in 2002 and reached a record level in 2004. Economic recovery, a weak U.S. dollar, and the absence of another terrorist attack on U.S. soil are fueling tourism growth. A recent study estimates that visitors to Orlando alone will reach 55.2 million in 2007.16 A preliminary estimate indicates that Florida reached a new record level in 2005 in visitation to the state with nearly 86 million visitors.17 According to a preliminary estimate from VISIT FLORIDA, the state’s tourism marketing agency, 85.8 million people visited Florida in 2005 (Table 1).18 This is 37 million more than in 1998. However, some of this increase resulted from a change in the methodology used by VISIT FLORIDA to calculate tourism. Median estimates have the number of visitors growing 16% to 92.5 million by 2010.
Table 3. Visitors to Florida (in thousands)
Source: VISIT FLORIDA, 1998, 2003, and 2004 Florida Visitor Study and 2002–2005 Florida Visitor Analysis.
14 Wilkerson, Chad: Travel and Tourism: An Overlooked Industry in the U.S. and Tenth District, Economic Review, Federal Reserve Bank of Kansas City; Third Quarter 2003. 15 Werner, Johannes: Obstacles, Florida Trend, October 2005. 16 New Research Forecasts Local Tourism, Orlando Business Journal, March 22, 2005. 17 VISIT FLORIDA, Preliminary Visitor Estimates, Resident Pleasure Travel and Industry Trend Indicators For 2005Q4 and CY2005, February 15, 2006. 18 The visitor data used in this study are from Florida Visitor Studies published by VISIT FLORIDA, which quarterly conducts a survey to gather air traveler information at Florida’s 14 largest airports. VISIT FLORIDA estimates non-air visitors based on data received from the Travel Industry Association’s Travel Scope, which provides the ratio of domestic air and non-air visitors to Florida. VISIT FLORIDA’s estimates and profiles of overseas visitors to Florida are derived from re-tabulation of data collected by the Tourism Industries Office of the U.S. Department of Commerce. Similarly, VISIT FLORIDA’s analyses of Canadian visitors are derived from custom re-tabulations of data collected by the Canadian government through Statistics Canada.
1998
1999
2000
2001
2002
2003
2004
2005
Total Visitors
48.7
58.9
72.8
69.5
73.9
74.6
79.7
85.8
4
A survey conducted in November 2004 by YPB&R, an independent communication advertising and public relations company, estimated 5-20% decrease in the number of visitors during the hurricane season between July and September 2005.19 However, the preliminary visitor estimate by VISIT FLORIDA for the third quarter of 2005 indicates that the number of visitors to Florida reached 21.9 million during this period, a 9.3% increase over that same period in 2004. Perhaps, by presenting inviting images of Florida’s availability for spring and summer vacationers in 2005, the hurricane marketing response by VISIT FLORIDA helped to lessen the projected impact of hurricanes on Florida’s tourism.20 This is an indication that the state money used for tourism promotion helped the state recover from the 2004 hurricanes. Indeed, a study on the return of $20 million recovery fund allocated to VISIT FLORIDA after 9-11 to promote tourism found a $3.29: $1.00 gross return on the state investment.21
Tourism Forecasts
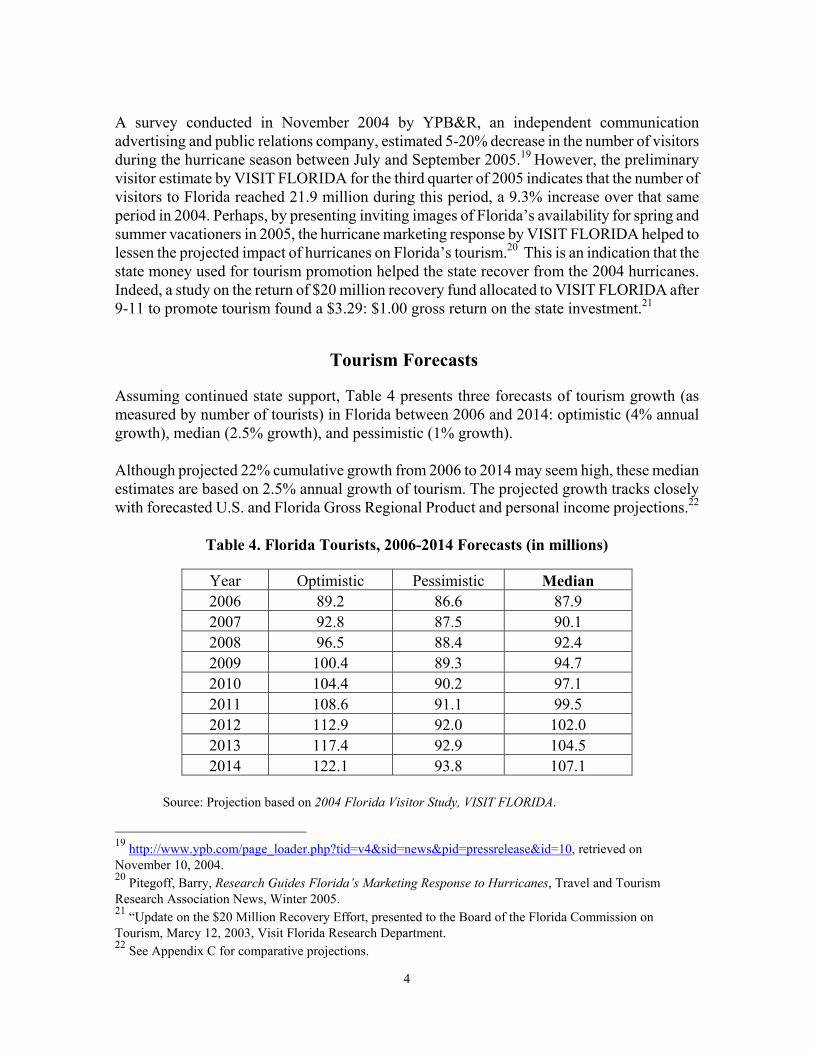
Assuming continued state support, Table 4 presents three forecasts of tourism growth (as measured by number of tourists) in Florida between 2006 and 2014: optimistic (4% annual growth), median (2.5% growth), and pessimistic (1% growth).
Although projected 22% cumulative growth from 2006 to 2014 may seem high, these median estimates are based on 2.5% annual growth of tourism. The projected growth tracks closely with forecasted U.S. and Florida Gross Regional Product and personal income projections.22
Table 4. Florida Tourists, 2006-2014 Forecasts (in millions)
Year Optimistic Pessimistic Median 2006 89.2 86.6 87.9 2007 92.8 87.5 90.1 2008 96.5 88.4 92.4 2009 100.4 89.3 94.7 2010 104.4 90.2 97.1 2011 108.6 91.1 99.5 2012 112.9 92.0 102.0 2013 117.4 92.9 104.5 2014 122.1 93.8 107.1
Source: Projection based on 2004 Florida Visitor Study, VISIT FLORIDA.
19 http://www.ypb.com/page_loader.php?tid=v4&sid=news&pid=pressrelease&id=10, retrieved on November 10, 2004. 20 Pitegoff, Barry, Research Guides Florida’s Marketing Response to Hurricanes, Travel and Tourism Research Association News, Winter 2005. 21 “Update on the $20 Million Recovery Effort, presented to the Board of the Florida Commission on Tourism, Marcy 12, 2003, Visit Florida Research Department. 22 See Appendix C for comparative projections.

5
The median estimate of Florida visitors is 97 million in 2010 and 107 million in 2014, representing increases of 10% and 22%, respectively, compared to 2005.
Figure 2 shows historical and forecasted numbers of tourists visiting Florida between 1976 and 2014.
Figure 2. Florida’s Historical and Forecasted Numbers of Tourists
Continue to Trend Upward (1976–2014)
0
20,000,000
40,000,000
60,000,000
80,000,000
100,000,000
120,000,000
140,000,000
1976
1978
1980
1982
1984
1986
1988
1990
1992
1994
1996
1998
2000
2002
2004
2006
2008
2010
2012
2014
Optimistic Pessimistic Median
Source: Historic Data—VISIT FLORIDA and Center for Economic Forecasting and Analysis (CEFA), Florida State University. Forecast Data—CEFA, FSU. Note: Some of the sharp increase between 1999 and 2000 resulted from a change in the methodology used by VISIT FLORIDA to calculate the number of tourists. The new method was recommended by George Washington University and University of North Florida experts as more accurate than the previous approach. There are many things attracting visitors to Florida. It is fair to sum them up in two words: sun and fun. As seen in Table 5, most of Florida’s visitors come to see attractions such as theme parks, to participate in nature and cultural activities, to enjoy general sightseeing, and to join in fun activities and nightlife. To keep bringing more visitors to Florida, it is important to understand the factors making Florida an attractive destination and to retain and enhance those factors.

6
Table 5. Activities Florida Visitors Want to Participate in During Their Trip*
Source: VISIT FLORIDA website, http://www.visitflorida.com/tools/advertising/vacact.php, retrieved January 3, 2006.
* The survey was conducted among the VISIT FLORIDA consumer website users.
Tourism Expenditures
Tourism spending and economic impacts vary according to whether visitors arrive in Florida by air and by other means of transportation (Table 6).
Table 6. Domestic Tourists’ Average Daily Spending in 2004
Air Travelers Non-Air Travelers Average daily expenditures per person: $163.10
Average daily expenditures per person: $107.30
Transportation $59.70 Transportation $19.70 Food $30.50 Food $27.40 Accommodations $23.80 Accommodations $18.20 Shopping $21.10 Shopping $17.00 Entertainment $9.80 Entertainment $19.40 Misc. $8.10 Misc. $5.50 Average length of stay: 5.2 nights Average length of stay: 5.0 nights
Source: VISIT FLORIDA 2004 Florida Visitors Study.
Table 7 shows that the ratio of air to non-air visitors began declining after 1998. By 2002, primarily due to 9/11 and the 2001–02 recession, the ratio reversed as the number of non-air
Visit attractions 87.5% Nature activities 76.6%
Cultural activities 74.9% General sightseeing 63.4%
Nightlife 57.9% Play sports 48.1%
Visit friends and family 32.8% Shopping 31.6%
Dining 26.6% General entertainment 22.9%

7
visitors exceeded air visitors for two years. In 2004, the number of air visitors was virtually the same as non-air visitors. In 2005, the number of air visitors was slightly higher than the number of other visitors.
Table 7. Tourists Arriving in Florida by Air and Other Means of Transportation 1998–2005 (Visitor numbers in millions)
1998 1999 2000 2001 2002 2003 2004 2005 Air/Non-Air
1.25 1.193 1.102 1.16 0.911 0.978 0.995 1.019
Air 27.1 32.0 38.1 37.3 36.1 36.9 39.8 43.3 Non-Air 21.6 26.8 34.6 32.2 37.8 37.7 40.0 42.5 Total 48.7 58.9 72.7 69.5 73.9 74.6 79.7 85.8
Source: VISIT FLORIDA, 1998–2004 VISIT FLORIDA Study. Whether the 2002–2003 reversal of air to non-air visitors will reoccur depends on many factors such as economic conditions and the continued threat of terrorism. Scenarios presented in Appendix A are based on the majority of visitors continuing to arrive by air versus a return to the majority arriving by other means of transportation as was the case in 2002–2003. Both scenarios show that, absent a terrorist attack, a new war or natural disaster such as a hurricane, tourism should continue to grow, resulting in a positive benefit to Florida’s economy and residents’ lives.
Tourism and Timeshares
Double-digit annual growth in Florida timeshare resorts over the last two decades is a substantial factor driving tourism.23 Indeed, our state has fully one-fourth of the total annual timeshare sales nationwide.
A 2004 study by the American Resort Development Association (ARDA) stated that Florida had 366 timeshare resorts with 27,700 individual units in 2002.24 Despite the economic recession and aftermath of 9/11, the U.S. timeshare industry increased more than 14% in 2002. In the Orlando metro area, timeshares increased 40% between 1999 and 2002.25 A recent ARDA study found that sales of U.S. timeshare resorts reached $7.87 billion in 2004, a 21.4% gain over the 2003 sales.26 23 Woods, Robert H: Important Issues for a Growing Timeshare Industry, Cornell Hotel and Restaurant Administration Quarterly, February 2001. 24 Economic Impact of the Timeshare Industry on the Florida Economy, American Resort Development Association and Price Water House Coopers, 2004. 25 Orlando State of Market, PowerPoint presentation prepared by Orlando/Orange County Convention and Visitors Bureau, March 2005. 26 State of Vacation Ownership Industry, 2005, United States Study, American Resort Development Association.

8
Timeshare visitors stay longer, therefore spending more than other tourists. The 2004 ARDA study found that one million Florida timeshare vacations were taken during 2002, with average spending of $2,397 per trip. The study estimated that the timeshare industry created $7.9 billion in output, 99,500 full- and part-time jobs, and $1.1 billion in tax revenues.27
Static Analysis of Tourism’s Impact on Florida’s Economy
Studies historically have taken into account only the direct, short-term impacts of tourism on Florida’s economy. Although such “snapshots” provide useful insights at given points in time, they artificially freeze the economy and tourism’s relationship to it. By contrast, this study incorporates econometric tools that account for direct, indirect, and induced economic impacts of tourism’s “imported funds” on Florida’s economy.28 Indirect effects include purchases of inputs made by firms that are supplying goods and services to the tourism sector. Induced tourism effects result from “re-spending” wages—that is, new employees have money to spend as a result of Florida tourism.
The following sections highlight direct, static impacts that tourism has on Floridians’ employment, personal and business income, and on tax revenue generated by tourism that helps finance public and private infrastructure, cultural, recreational, and entertainment activities. These activities clearly could not be supported at current levels by the state’s non-tourist economy.
Increased Employment
Increased employment is a primary benefit of tourism.29 Table 8 shows that total travel-related employment in Florida increased by 4.4% (from 852,300 to 889,600) between 2000 and 2001. After decreasing by 3% (from 889,600 to 863,000) in late 2001 and 2002, employment increased to 874,700 (0.8%) between 2002 and 2003 and reached to 912,700 in 2004. The preliminary estimate indicates travel-related employment reached 944,500 in 2005.30 The annual increase of 4.3% between 2003 and 2004 indicates that tourism employment has recovered its pre-recession 2001 and pre-9/11 robustness. The static near-term benchmarks indicate that tourism-related employment will continue making an important contribution to
27 Economic Impact of the Timeshare Industry on the Florida Economy, American Resort Development Association and Price Waterhouse Coopers, 2004. 28 There are three types of economic impact: 1) Direct impact is the amount of economic activity generated by the event, or events, in question. 2) Indirect impact is the amount of economic activity generated in an economy as a result of the event. 3) Induced impact represents business activity, including increased employment to meet the demand generated by direct and indirect impacts. An aggregate multiplier determined by these three impacts measures the total economic impact of an event. For example, an aggregate economic multiplier of $3.5 would mean that for $1 spending at an event, $3.50 is generated in the economy. Subtracting the original $1.00 spent on the event (direct impact) leaves $2.50 of additional spending in economy (indirect and induced impacts). 29 Mathieson, A. & Wall, G. (1996). Tourism: Economic and Social Impacts.. Essex, U.K.: Longman, Group Limited. 30 VISIT FLORIDA, Preliminary Visitor Estimates, Resident Pleasure Travel and Industry Trend Indicators For 2005Q4 and CY2005, February 15, 2006.

9
our economy.
Table 8. Tourism’s Contribution to Florida Travel-Related Employment*
Employment Category 2000 2001
2002 2003 2004
% Change 2000–
04
% Change 2003–
04
Air Transportation 77,600 76,600
37,300 33,300 30,800 -60.3 -7.5Eating and Drinking Establishments
452,300 476,900
487,300 504,100 536,200 18.5 6.4
Hotels and Lodging 158,200 156,700
150,000 151,100 154,500 -2.3 2.3Amusement and Recreation 156,800 159,900
160,000 157,800 162,800 3.8 3.2
Total Travel-Related Employment 852,300 889,600
863,000 874,700 912,700 7.1 4.3
Total Non-Agricultural Employment
7,080,600
7,197,800
7,179,700 7,261,100 7,504,000 6.0 3.3
Total Travel-Related Employment as % of All Non-Agricultural Employment
12.0% 12.1% 12.0% 12.00% 12.00%
Source: VISIT FLORIDA, 1998–2004 VISIT FLORIDA Studies. * Employment category names and data were changed in January 2003 when the Agency for Workforce Innovation switched from SIC codes to NAICS codes. Part of the change between 2002 and 2003 is due to this switch. Spending and Consumption Taxes
According to the Department of Revenue, 2004 tourism and recreational activities of Florida residents and visitors generated $57 billion in taxable transactions (sales and use tax) compared to $43.8 billion in 1998. The estimated tourism-related taxable transaction for 2005 is around $62 billion. Taxable sales from tourism and recreational activities were up just $61.6 million between 2000 and 2001, and $7.4 million between 2001 and 2002, due to the recession and 9/11. Between 2002 and 2003, however, sales increased by $2.8 billion.
Estimating Tourist Expenditures Despite the importance of tourism for Florida’s economy, a scientifically unreliable method is used to estimate tourism expenditures. VISIT FLORIDA uses tourism/recreation taxable sales as a proxy for that purpose. However, the tourism/recreation category includes all sales by hotels and motels, bars and restaurants, liquor stores, photo and art stores, gift shops and

10
jewelry stores plus admissions, sporting goods, and rentals to visitors and residents. Florida TaxWatch, in an upcoming Briefings, explains and strongly recommends the use of a method called tourism satellite account (TSA) which is the official international standard for estimating tourism expenditures.31 TSA was developed by the World Tourism Organization. It is used by the U.S. Bureau of Economic Analysis (BEA) at the national level, and by a growing number of states.32
Table 9 shows, by sales category, the portions of taxable sales most influenced by tourism between 1999 and 2003.
Table 9. Taxable Transactions from Tourism/Recreation
Source: Florida Department of Revenue, Office of Tax Research Data as reported in VISIT FLORIDA, 1998, 2002, 2003, and 2004 Florida Visitor Studies. *The sales data for the category of Jewelry and Leather were not released after 2001 because the category code was reallocated to the general category that is not considered to be a tourism/recreation category.
31 Blake, A., Durbarry, R., Sinclair, M., and G. Sugiyarto, “Modelling Tourism and Travel using Tourism Satellite Accounts and Tourism Policy and Forecasting Models”, TTRI Discussion Paper 2001/4. 32 Kuhbach, P., Planting, M., and E. Strassner , “Travel and Tourism Satellite Accounts for 1998–2003”, Survey of Current Business, September 2004.
Sales Category 1999 2000 2001 2002 2003 2004 Restaurants / Lunchrooms $17,718,673,722 $17,976,272,377 $18,734,051,124 $20,439,269,903 $21,795,877,560 $24,128,380,867
Taverns, Nightclubs 2,225,285,398 2,231,517,758 2,284,357,332 2,394,666,506 2,371,754,069 2,529,948,563
Jewelry, Leather* 2,587,756,143 2,330,807,876 2,030,228,911 Hotels, Apartment Houses, etc 11,349,152,183 11,593,711,527 11,232,626,604 10,878,657,744 11,975,808,186 13,678,117,005Cigar Stands, Tobacco Supplies 94,059,485 96,593,755 105,436,944 121,404,200 123,154,399 133,799,121Photographers, Photo Supplies 942,859,951 892,392,889 840,445,504 841,478,220 812,784,729 743,598,226Gift, Card, Novelty Shops 2,120,048,145 2,012,381,541 2,039,639,421 2,071,340,485 2,112,645,361 2,148,015,048
Newsstands 60,066,772 54,565,960 44,791,389 44,379,944 26,512,248 26,869,324Admissions 4,954,686,543 5,693,912,363 5,501,399,541 5,791,937,148 6,081,743,513 6,808,657,665Holiday Season Vendors 12,942,654 13,426,557 15,764,516 16,101,467 16,199,797 21,160,773Rental of Tangible Property 4,724,602,335 5,187,926,397 5,405,833,079 5,590,241,960 5,691,682,532 6,314,464,272Parking Lots, Boat Dockings 386,466,670 402,391,000 412,925,635 465,447,609 473,780,546 499,139,215
TOTAL $47,176,600,000 $48,485,900,000 $48,647,500,000 $48,654,925,186 $51,481,942,940 $57,032,150,079

11
An important benefit of tourism to Florida residents is tax revenue that exceeds tourist-related public service expenditures. This net revenue permits a higher level of government services to be enjoyed by residents than would be available without increased taxes. In effect, a portion of residents’ government services burden is exported to tourists.
The general sales and use tax is by far the most important tax levied on tourist and resident expenditures alike. In 2003–2004, fully 65% ($17.6 billion) of the $27 billion of state revenue collected was from the sales and use tax, a significant portion of which was paid by tourists.
Gas tax revenue collected from visitors is also substantial. Assuming that nearly all gas used by residents is for in-state driving, VISIT FLORIDA estimates that non-resident driver demand for gasoline in 2001 was more than 750 million gallons or 9.8% of residents’ demand of nearly seven billion gallons,33 which generated $1.1 billion revenues based on the average price of $1.44 per gallon in 2001. State fuel tax revenues increased from $1.7 billion in 2002 to $2.1 billion in 2004.34 Therefore, tourist-related gas tax revenue exceeded $200 million in 2004. Transportation Benefits
Long-term benefits to Floridians result from state and local investments in transportation that are prompted, in part, by seasonal peak-load tourist traffic. Residents benefit during off-peak seasons from roads that have been upgraded to carry peak-load tourist traffic.
The most comprehensive measure of return on transportation investments is user benefits such as improved safety, time-savings, and reduced vehicle operating costs. A Florida TaxWatch 2000 report35 cited research conducted by the Center for Urban Transportation Research at the University of South Florida showing user benefits of $2.86 for each dollar invested to maintain current conditions on state and local roads. Absent tourism-specific data, it is not possible to isolate the portion of those benefits attributable to visitor -related improvements. However, these are benefits that flow to every part of the economy, creating improved productivity and business competitiveness, higher real wages, and stronger overall economic expansion. Focusing on increased transportation-related business productivity, the research shows that each $1.00 invested in capital improvements to transportation facilities results in annual growth of $0.35 in Florida’s Gross State Product—a rate of return of 35%. A significant but indeterminate amount of these benefits clearly are attributable to Florida tourism.
33 FLA USA VISIT FLORIDA, Visitor Demand for Passenger Vehicle Gasoline, presentation, 2003. 34 State of Florida, Department of Revenue’s Website, http://sun6.dms.state.fl.us/dor/taxes/distannual.html, retrieved on August 15, 2005. 35 The Benefits and Costs of Tourism to Florida, August 2000, Florida TaxWatch. http://www.floridataxwatch.org/resources/pdf/VisitFloridafinalexsumAug2000.pdf

12
Econometric Analysis of Tourism’s Dynamic Impact on Florida’s Economy
Telling a more complete story about Florida tourism requires consideration of indirect and induced impacts, which contribute to Florida’s Gross State Product via a “multiplier” effect. Indirect impacts are benefits to businesses that supply goods and services to the tourism sector; induced impacts are benefits from consumption expenditures by industry employees.17 Money that circulates through Florida’s economy in cyclical rounds of spending comprises the total impact of tourism.
To capture tourism’s indirect and induced benefits over time, this study employed a dynamic scoring model—the REMI (Regional Economic Models, Inc.). This tool captures both ongoing and prospective impacts of tourism on our economy. For comparative analysis, a more conservative econometric model—IMPLAN— was also used.36
Indirect and Induced Impacts
Although 2005 direct tourism-related employment in Florida was 944,500 jobs, the IMPLAN model estimates that the number was 1.3 million in 2005 and will be 1.5 million by 2010, adding indirect and induced employment (Table 10). The REMI model shows 1.8 million tourism and tourism-related jobs by 2010.
Table 10. Median Estimates of Cumulative Tourism-Induced Impacts by 2010
REMI IMPLAN Employment 1,815,000 1,499,475Compensation $86,945,230,766 $63,088,628,277Average Compensation Rate $47,904 $42,074Output (GSP) $135,730,082,783$102,830,377,135
Source: Center for Economic Forecasting and Analysis, Florida State University.
The projected compensations that each model attributes to tourism (direct/indirect and induced) by 2010 are substantial—$87.0 billion (REMI) and $63.1 billion (IMPLAN) respectively. Likewise, the average compensation, including wages and fringe benefits, of all direct and indirect tourism-related employment is projected to be $47,904 (REMI) and $42,074 (IMPLAN) by 2010. The REMI estimate is higher because it includes total labor and proprietor's income, personal contributions to social insurance, the net residence adjustment, dividends, interest and rent, and transfer payments. Output (Gross State Product) from tourism
36 See Appendix D for a description of the REMI and IMPLAN models.

13
is projected to be $135.8 billion (REMI) and $102.8 billion (IMPLAN) by 2010. If the state economy grows 4% annually, the total state output will reach $688 billion in 2010, 15–20% of which will be generated by tourism.37
According to U.S. Census data (Figure 3), the average 2003 wage of workers in the accommodations and food services sector in 2003 was $17,892; for the retail trade sector, $26,868; for the arts, entertainment and recreation sector, $28,800; and for the air, rail and water transportation sector, $40,545. The $28,526 average for these tourism-related sectors in 2003 is lower than averages estimated by REMI and IMPLAN, which include wages and fringe benefits in sectors that are directly and indirectly affected by tourism expenditures.38
Figure 3. Annual Average Wage in Tourism-Related Sectors
$17,892
$26,868$28,800
$40,545
$0
$5,000
$10,000
$15,000
$20,000
$25,000
$30,000
$35,000
$40,000
$45,000
Accomodation andFood Services
Retail Trade Arts, Entertainmentand Recreation
Air, Rail and WaterTransportations
Sectors
Ave
rage
Wag
e
Source: U.S. Bureau of Census, LEHD Florida Labor Reports, http://lehd.dsd.census.gov/led/datatools/qwiapp.html, retrieved on April 12, 2005. Annual estimate is based on 2003 fourth quarter data.
37 Florida GSP was $543.8 billion in 2004 according to the U.S. Bureau of Economic Analysis. http://www.bea.gov/bea/newsrel/GSPNewsRelease.htm 38 A listing of industry sectors included in REMI and IMPLAN analyzes is in Appendix F. IMPLAN and REMI wage estimates for 2003 were $41,800 and $43,900, respectively.

14
Figure 4 shows the projected cumulative economic impact of Florida tourism on tourist-related jobs from 2005 through 2012. Because these measures are cumulative over the period, care must be taken in interpreting the data. On average, annual employment in tourist and tourist-related jobs is estimated to be 1.2 million (IMPLAN) and approximately 1.4 million (REMI). Both estimates are based on the same cumulative annual average shown in Table 11 (net present value in 2005 dollars) and Figure 5 (wages and outputGross State Product).
Figure 4. Eight-Year Cumulative Comparison of IMPLAN and REMI Florida Tourist Economic Impacts (2005–2012)
0
2,000,000
4,000,000
6,000,000
8,000,000
10,000,000
12,000,000
14,000,000
16,000,000
IMPLAN REMI
Tour
ist R
elat
ed J
obs
Source: Center for Economic Forecasting and Analysis, FSU and Florida TaxWatch, 2005.

15
Table 11. Net Present Value of Eight-Year Comparison of IMPLAN and REMI Florida Cumulative Tourist Economic Impacts (2005–2012, billions)
IMPLAN REMI
Compensations $544.9 $751.3 Output $888.0 $1000.2
Source: Center for Economic Forecasting and Analysis, Florida State University. 2005 dollars. Figure 5. IMPLAN and REMI-Based Net Present Value39 of Eight-Year Cumulative Impact of Tourism on Compensations and Output (Gross State Product), 2005−2012
$0
$200
$400
$600
$800
$1,000
$1,200
$1,400
IMPLAN REMI
Con
stan
t 200
5 B
illio
ns D
olla
rs
CompensationsOutput
Source: Center for Economic Forecasting and Analysis, Florida State University, and Florida TaxWatch, 2005.
39 Net Present Value (NPV) is a way of comparing the value of money now with the value of money in the future. A dollar today is worth more than a dollar in the future because inflation erodes the buying power of the future money, whereas money available today can be invested and grow. NPV is used to estimate the present value of future revenues by using a discount rate.

16
Impact of Tourism on State Revenue40
Florida’s tax revenues are generated by the purchase of goods by consumers, by corporate profits, and by other economic transactions. Table 12 shows that tourism and travel-related activities are expected to generate between $12.02 billion (IMPLAN) and $13.82 billion (REMI) general state tax revenue through 2010 as a function of direct and indirect earnings.
Table 12. Impact of Tourism on Tax Revenues
Model Taxes Forecasted to be Paid on Tourism-Related Compensations
2005 through 2010 (in 2005 dollars) REMI $13.82 billion
IMPLAN $12.02 billion
Source: Florida TaxWatch REMI and IMPLAN Analysis. Based on a projection of state revenue collections per $1 million of output.
Tourism Costs
Tourism provides Floridians with distinct benefits: enhanced economic output, a substantial portion of state sales tax collections, and high paying jobs. At the same time, tourism comes with “costs.” Notwithstanding previously noted limitations of cost data, the following sections summarize the downside of tourism (see Appendix B for the limitations of cost-benefit analysis).
Seasonality of Employment
Historically, the number of visitors to Florida has remained relatively evenly distributed throughout the year.41 Nonetheless, tourism creates some degree of uncertainty regarding continuous, year-round employment. Cyclical variation, relatively small though it may be, requires some employers to dedicate extra resources to employee recruitment, selection, training, and retention.42 There is also some tourism-based seasonal fluctuation in demand for goods and services such as gasoline and food.
40 Economic projections presented in this section are based on data that do not account for direct effects, if any , of recent gasoline and airline fuel costs increases on travel and tourism. 41 Trends and Conditions Report- 2003, Office of Planning of the Florida Department of Transportation and the Center for Urban Transportation Research, University of South Florida, July 2003. 42 Jolliffe, Lee and R. Farnsworth: Seasonality in Tourism Employment: Human Resource Challenges, International Journal of Contemporary Hospitality Management, 2003.

17
Although certain occupations are more affected by seasonality than others, Florida’s total unemployment rate generally was lower between 1998 and 2004 than the U.S. average (Table 13).
Table 13. Unemployment Rate
Year Florida U.S 1998 4.3 4.5 1999 4.0 4.2 2000 3.6 4.0 2001 4.8 4.7 2002 5.5 5.8 2003 5.2 6.0 2004 4.6 5.5
Source: U.S. Department of Labor, Bureau of Labor Statistics.
Public Safety
There are conflicting views as to whether tourism contributes to crime.43
The tourist population, like society as a whole, includes individuals with criminal intentions. Thus, the more tourists, the more criminals. Though small in number, criminal elements among the tourist population are active.
Tourists carry valuable personal property that provides targets for criminals.
Population density in tourist areas enhances opportunities for criminal
activity.44
43 Pelfrey, W. (1998). Tourism and Crime: Preliminary Assessment of the Relationship of Crime to the Number of Visitors at Selected Sites, International Journal of Comparative and Applied Criminal Justice, Fall 1998, Vol. 22, No.2. 44 Trager, K. (1990). The Impact of Fiscal Year 1998-89 Out-of-State Tourism on the Florida Economy. Tallahassee, FL: The Florida Legislature�s Joint Legislative Management Committee.

18
Figure 6. Crime Rate per 100,000 and Growth of Tourism (1989–2003)
05,000
10,00015,00020,00025,00030,00035,00040,00045,00050,00055,00060,00065,00070,00075,00080,000
1989 1990 1991 1992 1993 1994 1995 1996 1997 1998 1999 2000 2001 2002 2003
Years
Crime rate per 100,000Tourists (in thousands)
Source: Florida Department of Law Enforcement Uniform Crime Report Data and Center for Economic Forecasting and Analysis, Florida State University. The above notwithstanding, 15-year data presented in Figure 6 show a continuing decrease in Florida’s crime rate while tourism increased.
Nonetheless, a University of North Florida study estimated that the cost of tourist-related incarcerations in Florida was nearly $200 million per year.45 Transportation
Approximately half of Florida tourists arrive by air and half by other means of transportation. They are more likely to return if they experience safe, convenient, and efficient travel into and out of our state. As tourism continues to grow, it contributes to the unmet need of Florida’s transportation system. Failure to meet this need could jeopardize tourism-dependent economic momentum and our attractive quality of life.
In terms of annual spending for highways, Florida ranked 5th with $5 billion in 2002, following California, New York, Pennsylvania, and Texas (Figure 7). However, other indicators more validly reflect the pace with which states have kept up with demand, such as the changes in all lane miles and the average daily traffic per lane.
45 Cost/Benefit Analysis of Tourism in Florida, Center for Research and Consulting in Statistics, University of North Florida, June 2001.

19
Figure 7. The Six States with High Disbursements for Highways (in millions of dollars)
$0
$1,000
$2,000
$3,000
$4,000
$5,000
$6,000
$7,000
$8,000
$9,000
1995 1997 1998 1999 2000 2001 2002Years
CaliforniaNew YorkPennsylvaniaTexasFloridaNew Jersey
Source: U.S. Department of Transportation, Federal Highway Administration
According to the transportation statistics recently released by the U.S. Department of Transportation, Florida’s average daily traffic per lane was around 7,000 vehicles per lane on all principal arterials in 2004, which was 37% higher than the national average (Figure 8). This is despite the increase of lane mileage by 6.8% between 1994 and 2004, which is almost three times higher than the national average of 2.3%. As seen in Table 14, Florida ranks 6th in terms of the total lane miles, following Texas, California, Kansas, Minnesota, and Ohio. In short, the available data indicate that Florida has increased lane mileage much more rapidly than the national average and faster than all other large states except Ohio to keep up with steadily increasing daily traffic per lane.

20
Figure 8. The States with Highest Average Daily Traffic per Lane on All Principal Arterials in 2004
8,2638,832
7,843
9,764
6,989
8,4959,345
8,451
9,789
6,8247,975
6,815
5,107
-
2,000
4,000
6,000
8,000
10,000
12,000
Californ
ia
Connectic
ut
Delaware
Dist. o
f Columbia
Florida
Hawaii
Marylan
d
Massa
chuse
tts
New Je
rsey
New York
Rhode Isla
nd
Virginia
U.S. Ave
rage
States
Source: U.S. Department of Transportation.

21
Table 14. Lane Miles Added by States 1994–2004
Total Total % STATE Lane Miles Lane Miles Change
1994 2004 (1994–2004) Ohio 241,609 264,873 8.8 Florida 243,895 261,619 6.8 Georgia 232,831 246,347 5.5 Michigan 247,176 257,244 3.9 Missouri 250,271 259,807 3.7 Texas 623,269 646,247 3.6 Wisconsin 227,791 234,420 2.8 Alabama 192,558 197,892 2.7 U.S. Total 8,143,445 8,338,821 2.3 Pennsylvania 246,918 251,271 1.7 Iowa 230,627 234,256 1.5 Kansas 270,953 275,139 1.5 Minnesota 266,855 270,932 1.5 New York 237,282 240,167 1.2 Oklahoma 231,607 233,300 0.7 California 377,147 378,435 0.3
Source: U.S. Department of Transportation.
Traffic Congestion
As of 1998, tourism accounted for 10.9% of Florida vehicle miles traveled.46 Whether driving their own cars or renting them after arriving by air, tourists contribute minimally to congestion. Table 15 shows 2002 congestion costs (delay and extra fuel) per driver in selected urbanized areas in Florida compared to the 85 largest urbanized areas and a national average.
46 Chu, X and Pulzin, S.: An Application for Measuring Vehicle Travel by Visitors, Journal of Transportation and Statistics, 2002, v.5, n.2/3.

22
Table 15. Traffic Congestion Costs, 2002
Urban Area Annual Congestion Cost per Driver Average of 85 Largest Urban Areas $567 Miami-Hialeah $512 Orlando $486 National Average $435 Tampa-St. Petersburg-Clearwater $399 Jacksonville $296 Sarasota-Bradenton $187 Pensacola $176 Cape Coral $132
Source: Texas Transportation Institute, College Station, Texas; 2004 Urban Mobility Study.
In 2002, congestion costs per driver in Miami and Orlando were higher than the national average but lower than the average of the nation’s 85 largest urban areas. Five other Florida urban areas, including Tampa-St. Petersburg-Clearwater, were below the national average. Moreover, U.S. Census data indicate that in 2000, Floridians’ average round trip to work was 26 minutes, identical to the national average.
A 2001 study at the University of North Florida estimated that the average cost per Florida driver due to congestion-related time delays and fuel consumption was $784 per year.47 However, the same study noted that only a small portion of congestion costs could be attributed to visitors. With people moving to Florida every day, the cost of traffic congestion likely will increase.
The Environment
Though tourism has positive impacts on Florida’s economy, it may negatively impact the environment in terms of air pollution, water quality, etc.48 There is ongoing discussion in the literature regarding “sustainable tourism,” defined as striking an acceptable balance between tourism-related economic activities and environmental protection.49
47 Cost/Benefit Analysis of Tourism in Florida, Center for Research and Consulting in Statistics, University of North Florida, June 2001. 48 Davies, Terry and C. Sarah: Environmental Implications of the Tourism Industry, Discussion Paper 00-14, Resource for Future. The Review of Regional Studies; Vol. 23, No. 2; Fall 1993. 49 Hunter, Colin: Sustainable Tourism and The Touristic Ecological Footprint, Environment, Development and Sustainability, 4, 2002.

23
Tourism’s impacts typically are grouped as economic, socio-cultural, and environmental/ecological.50 Tourism’s impact on the environment, particularly in terms of costs, is difficult to ascertain. The above referenced University of North Florida study, for example, estimated that although the direct net benefit of tourism to our state was nearly $2 billion, it could not measure environmental impacts in monetary value.51
Assessments of economic impacts usually are context-specific. That is, they typically subject data analysis to a variety of ecological, human, and cultural benefits such as improving and maintaining native biodiversity, protecting endangered/threatened species, reducing fragmentation of habitat, maintaining/protecting the hydrologic system, reducing/avoiding air and water pollution, improving physical health and fitness, and opportunities for education and scientific research.
It is common for environmental cost considerations to be taken into account topic and site specifically rather than generally. Examples: the spread of disease/fire, invasion of exotics, increased hybridization, increased predation and soil erosion, barriers to biological movement, increased noise, lessened privacy, increased crime, and increased traffic.
It would be difficult and theoretically questionable to extrapolate site-specific results to the larger, more generalized Florida context. Evaluations of site-specific attributes of costs (or benefits) of open space cannot, without grave difficulty and prohibitive expense, take into account the full range of impacts attributable to open space, and their results consequently would be skewed and misleading. Jered B. Carr, et al. concur in their attempt to understand the benefits and costs of conservation corridors associated with greenways and trails, pointing out that “boiler-plating costs and benefits outlined in other studies is inappropriate and leads to flawed and misleading evaluations.”52
To extrapolate site-specific results to the larger, more generalized Florida context, it would be practically imprecise, theoretically tenuous and methodologically unacceptable.
The EPA Model
The travel and tourism industry is often defined by its share of economic outputs and environmental impacts on transportation, communications, power, wholesale and retail trade, hospitality, manufacturing, and construction.
The U.S. Environmental Protection Agency (EPA) has developed a model for assessing the economic impacts of travel and tourism. Its goal is to identify and assess interrelationships among the environment, recreation and economic health, and to inform industry, government, and recreation officials about these links. 50 Hunter, Colin: Sustainable Tourism and The Touristic Ecological Footprint, Environment, Development and Sustainability, 4, 2002. 51 Cost/Benefit Analysis of Tourism in Florida, Center for Research and Consulting in Statistics, University of North Florida, June 2001. 52 Lindberg, K. & Johnson, R. L. (1997). The Economic Values of Tourism�s Social Impacts. Annals of Tourism Research 24, (1), 90−116.

24
The EPA’s approach accounts for impacts of supply sectors and activities and identifies sub-sectors to provide an understanding of relatively small segments of an industry that may have similar economic and environmental impacts. For each sub-sector, direct impacts are assessed regarding associated travel, lodging, meals, and activities themselves. Considering an industry in this way facilitates examination of drivers and barriers that influence environmental protection decisions within sub-sectors such as boating, urban/cultural attractions, hunting, skiing and snowboarding, golfing amusement/theme parks, casino gambling, conferences and conventions, waterside activities, and fishing. To assess direct impacts of each subsector, the EPA model uses one economic indicatordata on tourism and recreation expendituresand the following environmental indicators: water use, energy use, air emissions, solid waste generation, wastewater generation, greenhouse gas emissions and acres of land use – both alone and in combination with other sub-sector specific data, such as participation rates.
The model examines individual sub-sectors by establishing baselines, emission reduction goals and measures of progress. It also compares across sub-sectors to determine, for example, travel to a site, staying at the site, and the activity itself of a particular recreational activity that has the most and least environmental and economic impact.
The EPA model has several limitations:53 Results are reported at the national, not state, level; the model is based on total rather than net impacts; the time period over which the data was gathered is not clear; and there is no dollar value assigned to negative impacts.
Because it includes a limited set of environmental indicators and only direct impacts, this model has a somewhat restricted view of sustainability issues associated with each sub-sector. Nonetheless, it could become a powerful tool in the EPA’s efforts to examine the travel and the tourism industry, and to identify areas for cooperative programs to improve environmental performance. Eventually, the model may be augmented with indicators of sustainability to enhance its value.
Conclusion
Tourism continues to bring substantial benefits to Floridians despite setbacks from the 2001–02 recession, 9/11, the Afghanistan and Iraq wars and war on terrorism, and the 2004 and 2005 hurricanes.
Assuming continued state support, our study projects continuation of significant state tax revenue collection from tourist expenditures. It projects increasing earnings in tourism and tourism-related jobs through 2010. This report’s finding that Florida’s economy benefits from direct, indirect, and induced impacts of tourism (explained in footnote 28) is further reason for optimism. Currently, 1.3 million Floridians’ jobs (entry through executive level) are
53 Cost/Benefit Analysis of Tourism in Florida, Center for Research and Consulting in Statistics, University of North Florida, June 2001.
25
associated directly and indirectly with tourism. Projections show that by 2010, up to 1.8 million jobs will be associated with tourism. Tourism, therefore, is a major, if not the major employer in Florida.
Recommendation
Tourism Satellite Account (TSA) is a scientifically reliable method for estimating tourism expenditures and the official international standard for estimating tourism expenditures. TSA should be used by the State of Florida to more accurately assess and monitor the tourism sector, and for establishing policies to mitigate problems and seizing opportunities to grow this economic sector. Special acknowledgment to Dr. Stephen Morrell, Professor of Economics and Finance, Andreas School of Business, Barry University and Florida TaxWatch Senior Research Fellow and Dr. Mark Bonn, Dedman Professor of Services and Director of Graduate Studies in Hospitality and Tourism, College of Business, Florida State University. Our thanks also to the VISIT FLORIDA Research Department for the data and reports it provided. This Special Report was written by Necati Aydin, Ph.D. Senior Research Analyst, and Keith G. Baker, Ph.D., with assistance from Dave Davis, Senior Research Analyst, John Turcotte, Research Consultant, and Charles
Ranson, Consultant, under the direction of Mary Lou Rajchel, Senior Vice President for Research and Development, Florida TaxWatch Research Institute, Inc. with
Tim Lynch, Ph.D., Director, Julie Harrington, Ph.D., Deputy Director, Douglas Lee, Ph.D., Florida State University Center for Econometric Forecasting and Analysis.
Michael Jennings, Chairman; Dominic M. Calabro, President and Publisher
March 2006
http://www.floridataxwatch.org

26
Appendix A: Tourists Arriving In Florida by Air and by Other Means of Transportation
Tourism expenditures forecasted by the Regional Economic Models, Inc. (REMI) and IMPLAN are based on two scenarios regarding the ratio of Florida tourists arriving by air and by other means of transportation. This distinction is important because it affects total tourist expenditures.
Scenario A: Continuation of Current Air-to-Non-Air Ratio Current Trend
Until 9/11, air traveling had been dominant for ten years as the preference of 52% of all visitors. 9/11 reversed this trend for two years. Figure 9 shows an econometric projection through 2014 for the number of air and non-air tourists under Scenario A, which posits that the air dominant trend after 2006, similarly to the one before 9/11. The estimate is based on three econometric projections: an optimistic view, a pessimistic view, and a median view. The optimistic view estimates a long-term growth rate of 4.0% annually following 2005; the pessimistic view estimates a 1.0% annual growth rate; and the median view estimates a more modest annual growth rate of 2.5 % after 2005. The median view, graphically portrayed here, is used as the most likely of the three alternatives.

27
Figure 9. Historic and Forecast Number of Florida Air and Non-Air Tourists, 1976–2014 (Scenario A, Median View)
0
10,000,000
20,000,000
30,000,000
40,000,000
50,000,000
60,000,000
1976
1978
1980
1982
1984
1986
1988
1990
1992
1994
1996
1998
2000
2002
2004
2006
2008
2010
2012
2014
Estimates of growth after 2005 are set at a long run annual modest growth rate of 2.5% annually after 2004.In July 1999 Visit Florida adopted a new tourist estimation methodSource: Historic Data, Visit Florida; forecast Data, CEFA, FSU.
Ann
ual N
umbe
r of V
isito
rs
Non-Air TravelersAir Travelers
Tourism expenditures are related to the ratio of air to non-air visitors. Figure 10 shows non-air and air tourists are spending less time during their visits to Florida. The length of stay after year 2004 was estimated based on percentage changes between 2000 and 2003, which suggest that length of stay has become stable in recent years. If the current trend continues, air visitors will stay for even shorter periods while non-air visitors will stay a bit longer than currently. Moreover, as Table 16 shows, domestic air travelers (2004 data) spend significantly more per person while here—$163.10 per day as compared to $107.30 per day, respectively.54
54 VISIT FLORIDA, 2003 Florida Visitor Study.

28
Figure 10. Length of Stay for Domestic Visitors
9.8 9.7
8.5
7.4
5.1 4.8 4.6
15.9 15.5
11.5
9.5
8.1
5.5 5.7 6.0
10.5
0.0
2.0
4.0
6.0
8.0
10.0
12.0
14.0
16.0
18.0
1978 1983 1988 1993 1998 2003 2008 2014
Day
s
Average Days (Air) Average Days (Non-Air)
Source: VISIT FLORIDA, Florida Visitors Studies and Forecast Data, Florida TaxWatch. Note: Estimated length of stay for 2004 to 2014 is based on the average change between 2000 and 2003, assuming that these years’ trend will continue in the future.

29
Table 16. Domestic Tourists’ Average Daily Spending in 2004
Air Travelers Non-Air Travelers Average per person expenditure per day: $163.10
Average per person Expenditure per day: $107.30
Transportation $59.70 Transportation $19.70 Food $30.50 Food $27.40 Room $23.80 Room $18.20 Shopping $21.10 Shopping $17.00 Entertainment $19.80 Entertainment $19.40 Misc. $8.10 Misc. $5.50 Average length of stay: 5.2 nights
Average length of stay: 5.0 nights
Source: VISIT FLORIDA. 2004 Florida Visitors Study.
Scenario A: Median View of Florida Tourist Expenditures
Utilizing data generated based on average per-day expenditures and length of stay by air and non-air tourists55 (generated under Scenario A assumptions regarding the ratio of Florida air to non-air tourists), Table 17 and Figures 11 and 12 show slightly higher tourist expenditures occurred under Scenario A due to tourists who arrived by air continuing to outnumber non-air tourists and spending more per capita during their stay.
55 The estimate is based on data for domestic visitors. International visitors stay longer but spend less money per night. According to the recent data from the U.S. Department of Commerce, average expenditures per visitor per day in the U.S. for international visitors was $93 in 2004. However, since international visitors stay longer, their total expenditures exceed that of domestic visitors. In estimating tourism expenditures in this study, international visitors are considered equivalent to domestic air travelers.

30
Table 17. Tourist Expenditures by Category (in millions)
(Scenario A, Median View)
Year Transportation Food Lodging Shopping Entertainment Misc. Total
1976 $1,677 $1,427 $1,330 $916 $923 $283 $6,556 1980 $3,174 $2,536 $2,391 $1,620 $1,622 $506 $11,848 1990 $8,975 $6,363 $6,139 $4,024 $3,972 $1,284 $30,757 2000 $14,163 $9,966 $9,630 $6,298 $6,210 $2,012 $48,278 2010 $21,602 $15,366 $14,815 $9,720 $9,597 $3,098 $74,198 2014 $26,223 $18,564 $17,916 $11,738 $11,583 $3,745 $89,770
Source: Historic Data, VISIT FLORIDA and Center for Economic Forecasting and Analysis (CEFA), Florida State University (FSU); Forecast Data, CEFA, FSU.
Figure 11. Annual Tourist Expenditures by Category, 1976–2014 (Scenario A, Median View)
0
10,000
20,000
30,000
40,000
50,000
60,000
70,000
80,000
90,000
100,000
1976
1978
1980
1982
1984
1986
1988
1990
1992
1994
1996
1998
2000
2002
2004
2006
2008
2010
2012
2014
Mill
ion
Dol
lars
Transport Food Lodging Shopping Entertainment Miscell.
Source of Historic Data: VISIT FLORIDA. Forecast Data, CEFA, FSU.

31
Figure 12. Florida Tourist Expenditures, Historic and Forecast Trends (Scenario A, Median View)
$19,715
$11,042
$15,950
$26,862
$47,337
$32,531
$6,289 $5,560
$0
$5,000
$10,000
$15,000
$20,000
$25,000
$30,000
$35,000
$40,000
$45,000
$50,000
1980 1990 2000 2010
Nom
inal
Mill
ions
Dol
lars
Air Travelers Non-Air Travelers
Source of Historic Data: VISIT FLORIDA. Forecast Data, CEFA, FSU.
Scenario B: Air-to-Non-Air Ratio Reversal
Historically, the number of air visitors has been higher than non-air visitors. However, the air to non-air ratio reversed for two years after 9/11. In 2002, visitors arriving by air was 5% less than non-air visitors.
Although 9/11 sharply reduced the number of air visitors, it is important to note that the decline in the ratio started several years earlier. Figure 13 projects the total number of each category of visitors if the ratio reversal occurs again, beginning in 2006.
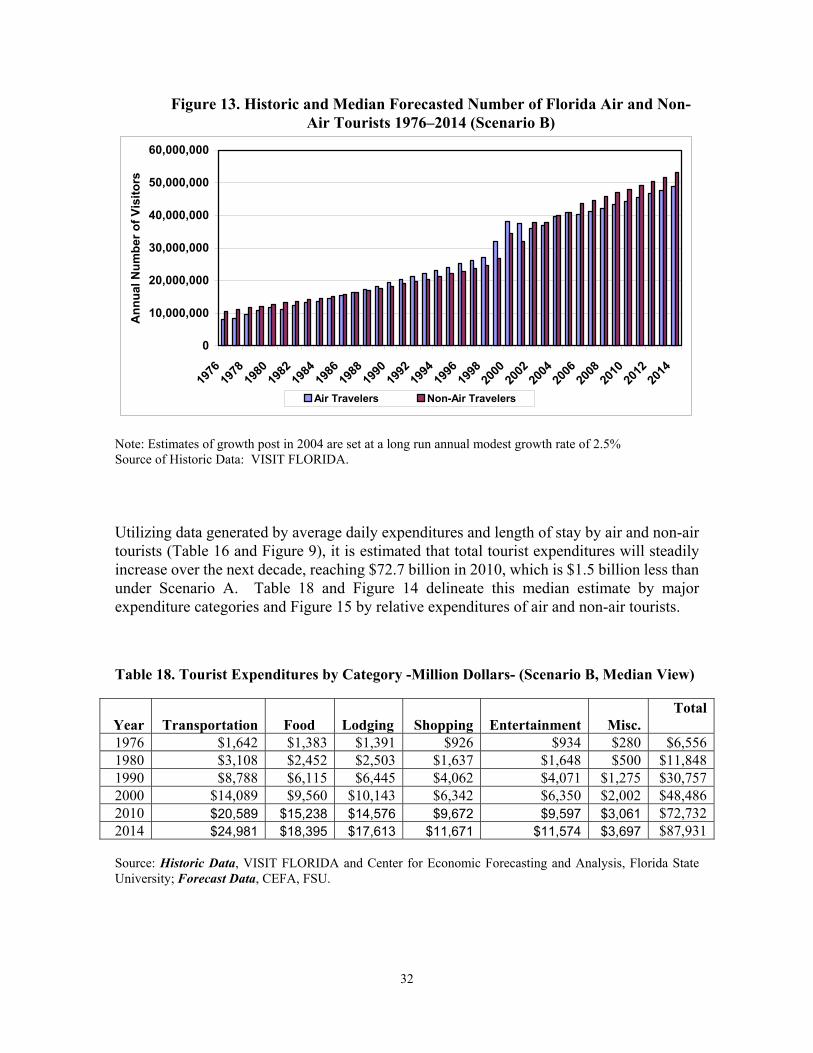
32
Figure 13. Historic and Median Forecasted Number of Florida Air and Non-Air Tourists 1976–2014 (Scenario B)
0
10,000,000
20,000,000
30,000,000
40,000,000
50,000,000
60,000,000
1976
1978
1980
1982
1984
1986
1988
1990
1992
1994
1996
1998
2000
2002
2004
2006
2008
2010
2012
2014
Ann
ual N
umbe
r of V
isito
rs
Air Travelers Non-Air Travelers
Note: Estimates of growth post in 2004 are set at a long run annual modest growth rate of 2.5% Source of Historic Data: VISIT FLORIDA. Utilizing data generated by average daily expenditures and length of stay by air and non-air tourists (Table 16 and Figure 9), it is estimated that total tourist expenditures will steadily increase over the next decade, reaching $72.7 billion in 2010, which is $1.5 billion less than under Scenario A. Table 18 and Figure 14 delineate this median estimate by major expenditure categories and Figure 15 by relative expenditures of air and non-air tourists. Table 18. Tourist Expenditures by Category -Million Dollars- (Scenario B, Median View)
Year Transportation Food Lodging Shopping Entertainment Misc.
Total
1976 $1,642 $1,383 $1,391 $926 $934 $280 $6,556 1980 $3,108 $2,452 $2,503 $1,637 $1,648 $500 $11,848 1990 $8,788 $6,115 $6,445 $4,062 $4,071 $1,275 $30,757 2000 $14,089 $9,560 $10,143 $6,342 $6,350 $2,002 $48,4862010 $20,589 $15,238 $14,576 $9,672 $9,597 $3,061 $72,7322014 $24,981 $18,395 $17,613 $11,671 $11,574 $3,697 $87,931 Source: Historic Data, VISIT FLORIDA and Center for Economic Forecasting and Analysis, Florida State University; Forecast Data, CEFA, FSU.

33
Figure 14. Annual Tourist Expenditures by Category, 1976–2014 (Scenario B, Median View)
0
10,000
20,000
30,000
40,000
50,000
60,000
70,000
80,000
90,000
100,000
1976
1978
1980
1982
1984
1986
1988
1990
1992
1994
1996
1998
2000
2002
2004
2006
2008
2010
2012
2014
Mill
ion
Dol
lars
Transport Food Lodging Shopping Entertainment Miscell.
Source: VISIT FLORIDA and Center for Economic Forecasting and Analysis (CEFA), Florida State University.
Figure 15. Florida Tourist Expenditures, Historic and Forecast Trends
$19,715
$43,696
$11,042
$15,950
$29,036$32,531
$6,289 $5,560
$0
$5,000
$10,000
$15,000
$20,000
$25,000
$30,000
$35,000
$40,000
$45,000
$50,000
1980 1990 2000 2010
Nom
inal
Mill
ions
Dol
lars
Air Travelers Non-Air Travelers
Source: Historic Data, VISIT FLORIDA and Center for Economic Forecasting and Analysis, Florida State University; Forecast Data, CEFA, FSU.

34
Appendix B: Limitations of Cost-Benefit Analysis
Textbooks on cost-benefit analysis typically call for calculation of all costs and all benefits of tourism’s impact. In the real world, however, it is possible to calculate only costs and benefits for which data are available.56 It was anticipated, and acknowledged in the research design of this study, that some costs and benefits of tourism’s impact on the quality of life in Florida may be unaccountable because of inaccurate or incomplete data. In addition to being a data-intensive form of analysis, cost and benefit data can be very context-specific. Thus, conclusions generated by the application of cost-benefit methodology often are only very narrowly applicable to a single case or to time-specific incidences or effects. In the latter case, in order to be useful, cost-benefit data must be current. Florida TaxWatch’s search for timely, Florida-specific cost-benefit tourism data reveals that tourism studies and related data collection efforts by-and-large have been directed more toward the benefit rather than the cost side of the equation for three reasons:57 ►Benefit-related economic impacts are relatively easy to measure, whereas physical and social cost-related impactsparticularly the latterare difficult to subject to numerical measurement because they are difficult to quantify. ►Relatively explicit data are required to measure the economic costs and benefits of tourism. Tourism-based employment and tax-related revenue data, etc. are more easily collected than those related to cost-consequences. ►An historical emphasis on economic and related benefits of tourism may reflect a widely held belief or bias among tourism advocates that tourism, other things being equal, yields a considerable return on investment and is a positive net influence in providing jobs and improving prosperity. Conversely, these purported benefits may not be perceived by Florida residents because of a lack of widely disseminated information in the media. Florida TaxWatch’s search for tourism cost-benefit data also reveals that, although benefits are visible in the form of jobs, earnings, business output, and tax revenues, explicit data with which to measure costs are relatively invisible or indistinguishable from other cost-related impacts. This is because they tend to meld with, and are difficult to separate from, more general social and quality-of-life factors. Traffic congestion, health care needs and costs, public safety, and similar issues are all part of Floridians’ daily lives. To what extent these are increased by tourists to the state is difficult to isolate. Optimally, but subject to availability of data, a cost-benefit analysis of Florida tourism would assign quantitative values (discrete indexes and/or dollar measures) to the benefits/costs of tourism on the quality of life in Florida. Ideally, costs and benefits would also be adjusted to
56 Meier, K. (1984). The Limits of Benefit-Cost Analysis. In Decision-Making in the Public Sector. Lloyd Nigro, Editor. (New York: Marcel Dekker) pp. 43-64. 57 Mathieson, A. & Wall, G. (1996). Tourism: Economic and Social Impacts. Essex, U.K.: Longman, Group Limited.

35
reflect the time-value of money, multiplier effects, and other macroeconomic cost/benefit impacts. A Florida household government benefits and tax burden study conducted for Florida TaxWatch by Drs. Keith G. Baker and Craig E. Reese shows that Florida tourists consume/use far less government services than do Florida residents in a variety of government services arenas. For example, the cost-to-government side of the equation is decidedly weighted against individual Florida resident households and favors Florida tourists when it comes to the consumption/use of prisons, Medicaid, public schools and post-secondary colleges and universities, and Aid to Families with Dependent Children.58
58 Ibid.

36
Appendix C: REMI Estimate of Florida GSP
1. Historic Data
REMI Forecast of Florida Gross State Product
1980–1990 4.6%
1990–2002 3.5%
1980–2002 3.9% Source: REMI.
Annual Increase in Number of Florida Tourists
1980–1990 4.4%
1990–2002 6.0%
1980–2002 5.3% Source: VISIT FLORIDA and Florida Statistical Abstract. 2. Forecast Data
U.S. Gross Domestic Product Forecast
2001–2012 3.0% Source: Florida Legislature, Office of Economic and Demographic Research.
Florida Personal Income Forecast
2001–2012 4.8% Source: Florida Legislature, Office of Economic and Demographic Research.
REMI Forecast of Annual Increase in Florida Gross State Product
2001–2012 2.6%
2001–2015 2.4%
2001–2020 2.2%
2001–2030 2.0%
2001–2035 2.0% Source: REMI.

37
Appendix D: REMI and IMPLAN Models
REMI The REMI model was developed by Regional Economic Models, Inc. of Amherst, Massachusetts. It specifies commodity-trade and personal-income flows between regions in creating long-term portraits of regional economic growth. The model consists of five basic blocks: (1) output, (2) labor and capital demands, (3) population and labor supply, (4) wages, prices, and profits, and (5) market shares. Production is categorized into 49 non-farm private industries (primarily at the two-digit S.I.C. level), three government sectors, and the farm sector. Economic relationships are given by an industry-based input-output component combined with an econometric component. The econometric specifications are derived from economic theories that are-generally neoclassical in nature. The model is dynamic, enabling it to be used both as an impact model and for forecasting. The REMI model, as Bolton (1985) states in a review of econometric models, “is a world apart in complexity, reliance on inter-industry linkages, and modeling philosophy” from other econometric models. It may be seen as an eclectic model that links an input-output model to an econometric model. In this way, if econometric responses are suppressed, the model collapses to an input-output model. REMI uses three sources of employment and wage and salary data: (1) Bureau of Economic Analysis (BEA) employment, wage and personal income series; (2) ES-202 establishment employment and wage and salary data; and (3) County Business Patterns (CBP) data published by the U.S Census Bureau. The BEA data are annual averages reported at the two-digit level for states and one-digit for counties. The ES-202 data, which are the foundation for BEA data, are collected monthly in conjunction with the unemployment insurance program at the two-digit level for counties and states. CBP data are collected in conjunction with Social Security programming in March of each year. Output measures are based on regional employment data, the BEA Gross State Product series, and national output-to-employment ratios. REMI begins by applying the national output-to-employee ratio to employment by industry. This application is adjusted by regional differences in labor intensity and total factor productivity. Regional differences are given by industry production function and unit factor costs. Total factor productivity calculations depend on industry value added in production reported in real U.S. dollars by BEA, and on adjustments by REMI to the BEA numbers. IMPLAN IMPLAN is an input-output model developed by the U.S. Forest Service, Department of Agriculture, in 1989. IMPLAN estimates output at the state level by using value-added data reported by BEA as proxies to allocate U.S. total gross output. IMPLAN also allocates state total gross output to counties based on county employment earnings. The use of the BEA Gross State Product series for states, and implicit assumption of uniform value

38
added-to-earnings ratios across counties within a state, parallels REMI’s procedure. However, because of REMI’s neoclassical production function, differential labor costs cause REMI’s labor intensities to differ across states and counties. In addition, REMI adjusts real value added in U.S. dollars reported by BEA for differences in regional unit factor costs.59 Similar to REMI, IMPLAN builds its data from top to bottom. National data serve as control totals for state data. In turn, state data serve as control totals for county data. Primary sources of employment and earnings data are County Business Patterns data and BEA data. Similar to REMI, IMPLAN assumes a uniform national production technology and uses a regional purchase coefficient approach to regionalize technical coefficients. By contrast to REMI, IMPLAN is exclusively an input-output model. It is non-survey based, and its structure typifies that of input-output models found in the regional science literature. The model generates two types of multipliers: Type I multipliers and what IMPLAN refers to as Type III multipliers. The difference between Type I and Type III multipliers is an induced consumption effect. IMPLAN’s Type III multiplier differs from the standard Type II multiplier because the consumption function is nonlinear. That is, the marginal propensity to consume is not constant, decreasing as income in the region rises. Population completely responds to employment changes and drives consumer spending. Multipliers are generated for employment, output, value added, personal income, and total income. For this study, the 1997 IMPLAN version is used. The greatest level of disaggregation of the model is 528 sectors. However, the industries that do not exist in the region are eliminated during user construction of the model. In addition, industries of the IMPLAN model can be aggregated into desired categories. Therefore, industries in the IMPLAN model are ag-gregated to match the industry classifications of the REMI model. IMPLAN uses an industry-based technology to derive its input-output coefficients. Finally, IMPLAN is a static model and cannot trace the time path of economic impacts or be readily used for forecasting as REMI can.
59 Adapted from Dan S. Rickman and R. Keith Schwer,”REMI AND IMPLAN Models: The Case of Southern Nevada.”

39
Appendix E: SICs and IMPLAN Codes
AE A* FH T C ** N um ber N am e N um ber C om pany N am ev 2833 6 M edic ina ls and Botan ica lsv 2834 26 P harm aceutica l P reparationsv 2835 1 In V itro and in V ivo D iagnostic v 2836 1 B io log ica l P roducts . E xcep t
v v 339 E lectric C om puters 3571 23 E lec tric C om putersv v 340 C om puter S torage D evices 3572 0 C om puter S to rage D evicesv v 341 C om puter T erm ina ls 3575 0 C om puter T erm ina lsv v 342 C om puter Periphera l Equ ipm ent 3577 9 C om puter P eriphera l E qu ipm ent,N ECv v 343 C alcu la ting and A ccounting 3578 0 C a lcu la ting and Accounting M ach inesv v 344 T ype W rite rs and O ffice M ach ines 3579 29 C om puter P eriphera l E qu ipm entv v 372 T elephone and T e legraph 3661 12 T e lephone and T e legraph Appara tusv v 373 R ad io and T V C om m unica tions 3663 23 R adio and T V C om m unications v v 374 C om m unications E qu ipm ent, 3669 12 C om m unica tions Equ ipm entv v 375 E lec tron T ubes 3671 1 E lec tron T ubes v v 376 Prin ted C ircu it B oards 3672 43 P rin ted C ircu it Boardsv v 3674 18 S em iconductors and R ela ted D evicesv v 3675 2 E lec tron ic C apacito rsv v 3676 4 E lec tron ic R es is to rsv v 3677 2 E lec tron ic C o ils and T ransform ersv v 3679 79 E lec tron ic C om ponents
v 396 Stroage B atteries 3761 1 G uided M iss iles and S pace V ehic lesv v 400 Search and N avigation 3812 30 S earch, N aviga tion , G uidance v v 401 Laboratory Apparatus and 3821 4 Laborato ry A ppara tus and Furn itu rev v 402 Autom atic tem pera tu re C ontro ls 3822 16 E nvironm enta l C ontro lsv v 3823 13 P rocess C ontro l ins trum entsv v 3824 5 F lu id M eters and C ounting D evicesv v 3829 22 M easuring and C ontro lling D evices, v v 404 Ins trum ents to M easure 3825 7 Ins trum ents to T est/ M easure v v 405 Analytica l Ins trum ents 3826 4 A na lytica l Ins trum entsv v 406 O ptica l Instrum ents and Lenses 3827 19 O ptica l Ins trum ents and Lenses
v 407 Surg ica l and M edica l 3841 97 S urg ica l and M ed ica l Ins trum entsv 408 Surg ica l App liances and S upplies 3842 85 O rthotic , P rosthe tic , Surg ica l
v v 410 X -R A Y A pparatus 3844 9 X -R AY Appara tus and T ubesv v 411 E lectrom ed ica l Apparatus 3845 18 E lec trom edica l E qu ipm entv v 413 Photograph ic Equ ipm ent and 3861 11 P hotograph ic E qu ipm ent and v v 4812 102 R adio te lephone C om m unicationsv v 4813 141 T e lephone C om m unications or R ad iov v 4822 24 T e legraph and O ther M essage v v 4841 81 C able and O ther Pay T V Servicesv v 4899 3l C om m unica tions Services , N E Cv v 7371 414 C om puter P rogram m ing Servicesv v 7372 14 P repackaged Softw arev v 7373 15 C om puter In tegra ted System s D esignv v 7374 76 C om puter P rocess ing and D ata v v 7375 5 In form ation R etrieva l S ervicesv v 7378 174 C om puter M a in tenance and R epairv v 7379 45 C om puter R e la ted S ervices, N EC
v 493 O ther M edica l and H ealth S ervice 8071 2 M edica l Labora to riesv 506 Engineering , Agricu ltu ra l 8711 4 E ng ineering Servicesv 8731 8 C om m erc ia l P hys ica l and B io log ica l v 8734 4 T esting Labora to ries
v 370 R ad io and T V R ece iv ing Se ts 3651 9 H ousehold A ud io and V ideo E qu ip .v 371 Phonograph ic R ecords and 3652 5 P honograph ic R ecords and v 378 E lectron ic C onnectors N EC 3678 1 E lec tron ic C onnecto rsv 7376 0 C om puter Fac ilities M anagem ent v 7377 0 C om puter R enta l and Leas ing
* S IC is used by Am erican E lec tron ics A ssocia tions 's defin ition o f "H igh T ech" com panies .** S IC w as used to iden tify cand idate com panies for the F lorida .H igh. T ech 2001 corpora te gu ide and the report
IM P LAN SIC
195 D rugs
441
475
509
C om puter and D ata P rocess ing
C om m unications E xcept R ad io an
475 C om puter and D ata P rocess ing Services
R esearch, D eve lopm ent, and T es
403 M echanica l M easuring D evices
377 Sem iconductors and R e la ted D ev

40
Appendix F: IMPLAN and REMI Industry Listings
IMPLAN Industry Sectors REMI Industry Sectors Dairy Farm Products Logging Poultry and Eggs Sawmills and planning mills Ranch Fed Cattle Millwork, plywood, and structural members Range Fed Cattle Wood containers and misc. wood products Cattle Feedlots Wood buildings and mobile homes Sheep- Lambs and Goats Household furniture Hogs- Pigs and Swine Partitions and fixtures Miscellaneous Livestock Office and misc. furniture and fixtures Cotton Glass and glass products Food Grains Hydraulic cement Feed Grains Stone, clay, and misc. mineral products Hay and Pasture Concrete, gypsum, and plaster products Grass Seeds Blast furnaces and basic steel products Tobacco Iron and steel foundries Fruits Primary nonferrous smelting and refining Tree Nuts All other primary metals Vegetables Nonferrous rolling and drawing Sugar Crops Nonferrous foundries Miscellaneous Crops Metal cans and shipping containers Oil Bearing Crops Cutlery, hand tools, and hardware Forest Products Plumbing and electric heating equipment Greenhouse and Nursery Products Fabricated structural metal products Forestry Products Screw machine products, bolts, rivets, etc. Commercial Fishing Metal forgings and stampings Agricultural- Forestry- Fishery Services Metal coating, engraving, and allied services Landscape and Horticultural Services Ordnance and ammunition Metal Mining Services Miscellaneous fabricated metal products Metal Ores- Not Elsewhere Classified Engines and turbines Coal Mining Farm and garden machinery and equipment Natural Gas and Crude Petroleum Construction and related machinery Natural Gas Liquids Metalworking machinery and equipment Dimension Stone Special industry machinery Sand and Gravel General industrial machinery and equipment Clay- Ceramic- Refractory Minerals- N.E.C. Computer and office equipment Potash- Soda- and Borate Minerals Refrigeration and service industry machinery Phosphate Rock Industrial machinery, N.E.C Chemical- Fertilizer Mineral Mining- N.E.C. Electric distribution equipment Nonmetallic Minerals (Except Fuels) Service Electrical industrial apparatus Misc. Nonmetallic Minerals- N.E.C. Household appliances Maintenance and Repair- Residential Electric lighting and wiring equipment Maintenance and Repair Other Facilities Household audio and video equipment Maintenance and Repair Oil and Gas Wells Communications equipment

41
Meat Packing Plants Electronic components and accessories Sausages and Other Prepared Meats Miscellaneous electrical equipment Poultry Processing Motor vehicles and equipment Creamery Butter Aerospace Cheese- Natural and Processed Ship and boat building and repairing Condensed and Evaporated Milk Railroad equipment Ice Cream and Frozen Desserts Miscellaneous transportation equipment Fluid Milk Search and navigation equipment Canned Specialties Measuring and controlling devices Canned Fruits and Vegetables Medical equipment, instruments, and supplies Dehydrated Food Products Ophthalmic goods Pickles- Sauces- and Salad Dressings Photographic equipment and supplies Frozen Fruits- Juices and Vegetables Watches, clocks, and parts Frozen Specialties Jewelry, silverware, and plated ware Flour and Other Grain Mill Products Toys and sporting goods Rice Milling Manufactured products, N.E.C. Blended and Prepared Flour Meat products Dog- Cat- and Other Pet Food Dairy products Prepared Feeds- N.E.C Preserved fruits and vegetables Bread- Cake- and Related Products Grain mill products and fats and oils Cookies and Crackers Bakery products Sugar Sugar and confectionery products Confectionery Products Beverages Chocolate and Cocoa Products Miscellaneous food and kindred products Animal and Marine Fats and Oils Tobacco products Shortening and Cooking Oils Weaving, finishing, yarn, and thread mills Malt Beverages Knitting mills Wines- Brandy- and Brandy Spirits Carpets and rugs Distilled Liquor- Except Brandy Miscellaneous textile goods Bottled and Canned Soft Drinks and Water Apparel Flavoring Extracts and Syrups- N.E.C. Miscellaneous fabricated textile products Canned and Cured Seafoods Pulp, paper, and paperboard mills Prepared Fresh Or Frozen Fish Or Seafood Paperboard containers and boxes Roasted Coffee Converted paper products except containers Potato Chips and Similar Snacks Newspapers Manufactured Ice Periodicals Macaroni and Spaghetti Books Food Preparations- N.E.C Miscellaneous publishing Cigarettes Commercial printing and business forms Cigars Greeting cards Chewing and Smoking Tobacco Blankbooks and bookbinding Broadwoven Fabric Mills and Finishing Service industries for the printing trade Narrow Fabric Mills Industrial chemicals Hosiery- N.E.C Plastics materials and synthetics Knit Outerwear Mills Drugs Knit Underwear Mills Soap, cleaners, and toilet goods Knit Fabric Mills Paints and allied products

42
Yarn Mills and Finishing Of Textiles- N.E.C. Agricultural chemicals Carpets and Rugs Miscellaneous chemical products Thread Mills Petroleum refining Coated Fabrics- Not Rubberized Miscellaneous petroleum and coal products Tire Cord and Fabric Tires and inner tubes Nonwoven Fabrics Rubber products and plastic hose and footwear Cordage and Twine Miscellaneous plastics products, N.E.C Textile Goods- N.E.C Footwear, except rubber and plastic Apparel Made From Purchased Materials Luggage, handbags, and leather products, N.E.C. Curtains and Draperies Metal mining House Furnishings- N.E.C Coal mining Textile Bags Crude petroleum, natural gas and gas liquids Canvas Products Oil and gas field services Pleating and Stitching Nonmetallic minerals, except fuels Automotive and Apparel Trimmings Construction Schiffi Machine Embroideries Railroad Fabricated Textile Products- N.E.C. Trucking Logging Camps and Logging Contractors Local and Interurban Sawmills and Planning Mills- General Air Transportation Hardwood Dimension and Flooring Mills Other Transport Special Product Sawmills- N.E.C Communication Millwork Public Utilities Wood Kitchen Cabinets Banking Veneer and Plywood Insurance Structural Wood Members- N.E.C Credit and Finance Wood Containers Real Estate Wood Pallets and Skids Eating and Drinking Mobile Homes Rest of Retail Prefabricated Wood Buildings Wholesale trade Wood Preserving Hotels Reconstituted Wood Products Pers Serv and Rep Wood Products- N.E.C Private Household Wood Household Furniture Non-Air Rep and Serv Upholstered Household Furniture Misc. Bus Serv Metal Household Furniture Amusem and Recr Mattresses and Bedsprings Motion Pictures Wood TV and Radio Cabinets Medical Household Furniture- N.E.C Misc. Prof Serv Wood Office Furniture Education Metal Office Furniture Non-Profit Org Public Building Furniture Agricultural services Wood Partitions and Fixtures Forestry, fishing, hunting, and trapping Metal Partitions and Fixtures State Gov’t Blinds- Shades- and Drapery Hardware Local Gov’t Furniture and Fixtures- N.E.C Pulp Mills Paper Mills- Except Building Paper

43
Paperboard Mills Paperboard Containers and Boxes Paper Coated and Laminated Packaging Paper Coated and Laminated N.E.C. Bags- Plastic Bags- Paper Die-cut Paper and Board Sanitary Paper Products Envelopes Stationery Products Converted Paper Products- N.E.C Newspapers Periodicals Book Publishing Book Printing Miscellaneous Publishing Commercial Printing Manifold Business Forms Greeting Card Publishing Blankbooks and Looseleaf Binder Bookbinding and Related Typesetting Plate Making Alkalies and Chlorine Industrial Gases Inorganic Pigments Inorganic Chemicals, N.E.C. Cyclic Crudes- Interm. and Indus. Organic Chem. Plastics Materials and Resins Synthetic Rubber Cellulosic Man-made Fibers Organic Fibers- Noncellulosic Drugs Soap and Other Detergents Polishes and Sanitation Goods Surface Active Agents Toilet Preparations Paints and Allied Products Gum and Wood Chemicals Nitrogenous and Phosphatic Fertilizers Fertilizers- Mixing Only Agricultural Chemicals- N.E.C Adhesives and Sealants Explosives Printing Ink Chemical Preparations- N.E.C Petroleum Refining

44
Paving Mixtures and Blocks Asphalt Felts and Coatings Lubricating Oils and Greases Petroleum and Coal Products- N.E.C. Tires and Inner Tubes Rubber and Plastics Footwear Rubber and Plastics Hose and Belting Gaskets- Packing and Sealing Devices Fabricated Rubber Products- N.E.C. Miscellaneous Plastics Products Leather Tanning and Finishing Footwear Cut Stock House Slippers Shoes- Except Rubber Leather Gloves and Mittens Luggage Womens Handbags and Purses Personal Leather Goods Leather Goods- N.E.C Glass and Glass Products- Exc Containers Glass Containers Cement- Hydraulic Brick and Structural Clay Tile Ceramic Wall and Floor Tile Clay Refractories Structural Clay Products- N.E.C Vitreous Plumbing Fixtures Vitreous China Food Utensils Fine Earthenware Food Utensils Porcelain Electrical Supplies Pottery Products- N.E.C Concrete Block and Brick Concrete Products- N.E.C Ready-mixed Concrete Lime Gypsum Products Cut Stone and Stone Products Abrasive Products Asbestos Products Minerals- Ground Or Treated Mineral Wool Nonclay Refractories Nonmetallic Mineral Products- N.E.C. Blast Furnaces and Steel Mills Electrometallurgical Products Steel Wire and Related Products Cold Finishing Of Steel Shapes

45
Steel Pipe and Tubes Iron and Steel Foundries Primary Aluminum Primary Nonferrous Metals- N.E.C. Secondary Nonferrous Metals Copper Rolling and Drawing Aluminum Rolling and Drawing Nonferrous Rolling and Drawing- N.E.C. Nonferrous Wire Drawing and Insulating Aluminum Foundries Brass- Bronze- and Copper Foundries Nonferrous Castings- N.E.C. Metal Heat Treating Primary Metal Products- N.E.C Metal Cans Metal Barrels- Drums and Pails Cutlery Hand and Edge Tools- N.E.C. Hand Saws and Saw Blades Hardware- N.E.C. Metal Sanitary Ware Plumbing Fixture Fittings and Trim Heating Equipment- Except Electric Fabricated Structural Metal Metal Doors- Sash- and Trim Fabricated Plate Work (Boiler Shops) Sheet Metal Work Architectural Metal Work Prefabricated Metal Buildings Miscellaneous Metal Work Screw Machine Products and Bolts- Etc. Iron and Steel Forgings Nonferrous Forgings Automotive Stampings Crowns and Closures Metal Stampings- N.E.C. Plating and Polishing Metal Coating and Allied Services Small Arms Ammunition Ammunition- Except For Small Arms- N.E.C. Small Arms Other Ordnance and Accessories Industrial and Fluid Valves Steel Springs- Except Wire Pipe- Valves- and Pipe Fittings Miscellaneous Fabricated Wire Products Metal Foil and Leaf

46
Fabricated Metal Products- N.E.C. Steam Engines and Turbines Internal Combustion Engines- N.E.C. Farm Machinery and Equipment Lawn and Garden Equipment Construction Machinery and Equipment Mining Machinery- Except Oil Field Oil Field Machinery Elevators and Moving Stairways Conveyors and Conveying Equipment Hoists- Cranes- and Monorails Industrial Trucks and Tractors Machine Tools- Metal Cutting Types Machine Tools- Metal Forming Types Industrial Patterns Special Dies and Tools and Accessories Power Driven Hand Tools Rolling Mill Machinery Welding Apparatus Metalworking Machinery- N.E.C. Textile Machinery Woodworking Machinery Paper Industries Machinery Printing Trades Machinery Food Products Machinery Special Industry Machinery N.E.C. Pumps and Compressors Ball and Roller Bearings Blowers and Fans Packaging Machinery Power Transmission Equipment Industrial Furnaces and Ovens General Industrial Machinery- N.E.C Electronic Computers Computer Storage Devices Computer Terminals Computer Peripheral Equipment- Calculating and Accounting Machines Typewriters and Office Machines N.E.C. Automatic Merchandising Machine Commercial Laundry Equipment Refrigeration and Heating Equipment Measuring and Dispensing Pumps Service Industry Machines- N.E.C. Carburetors- Pistons- Rings- Valves Fluid Power Cylinders and Actuators Fluid Power Pumps and Motors

47
Scales and Balances Industrial Machines N.E.C. Transformers Switchgear and Switchboard Apparatus Motors and Generators Carbon and Graphite Products Relays and Industrial Controls Electrical Industrial Apparatus- N.E.C. Household Cooking Equipment Household Refrigerators and Freezers Household Laundry Equipment Electric Housewares and Fans Household Vacuum Cleaners Household Appliances- N.E.C. Electric Lamps Wiring Devices Lighting Fixtures and Equipment Radio and TV Receiving Sets Phonograph Records and Tape Telephone and Telegraph Apparatus Radio and TV Communication Equipment Communications Equipment N.E.C. Electron Tubes Printed Circuit Boards Semiconductors and Related Devices Electronic Components- N.E.C. Storage Batteries Primary Batteries- Dry and Wet Engine Electrical Equipment Magnetic and Optical Recording Media Electrical Equipment- N.E.C. Motor Vehicles Truck and Bus Bodies Motor Vehicle Parts and Accessories Truck Trailers Motor Homes Aircraft Aircraft and Missile Engines and Parts Aircraft and Missile Equipment Ship Building and Repairing Boat Building and Repairing Railroad Equipment Motorcycles- Bicycles- and Parts Complete Guided Missiles Travel Trailers and Camper Tanks and Tank Components Transportation Equipment- N.E.C

48
Search and Navigation Equipment Laboratory Apparatus and Furniture Automatic Temperature Controls Mechanical Measuring Devices Instruments To Measure Electricity Analytical Instruments Optical Instruments and Lenses Surgical and Medical Instrument Surgical Appliances and Supplies Dental Equipment and Supplies X-Ray Apparatus Electromedical Apparatus Ophthalmic Goods Photographic Equipment and Supplies Watches- Clocks- and Parts Jewelry- Precious Metal Silverware and Plated Ware Jewelers Materials and Lapidary Work Musical Instruments Dolls Games- Toys- and Childrens Vehicles Sporting and Athletic Goods- N.E.C. Pens and Mechanical Pencils Lead Pencils and Art Goods Marking Devices Carbon Paper and Inked Ribbons Costume Jewelery Fasteners- Buttons- Needles- Pins Brooms and Brushes Signs and Advertising Displays Burial Caskets and Vaults Hard Surface Floor Coverings Manufacturing Industries- N.E.C. Railroads and Related Services Local- Interurban Passenger Transit Motor Freight Transport and Warehousing Water Transportation Air Transportation Arrangement Of Passenger Transportation Transportation Services Communications- Except Radio and TV Radio and TV Broadcasting Electric Services Gas Production and Distribution Water Supply and Sewerage Systems Sanitary Services and Steam Supply Wholesale Trade
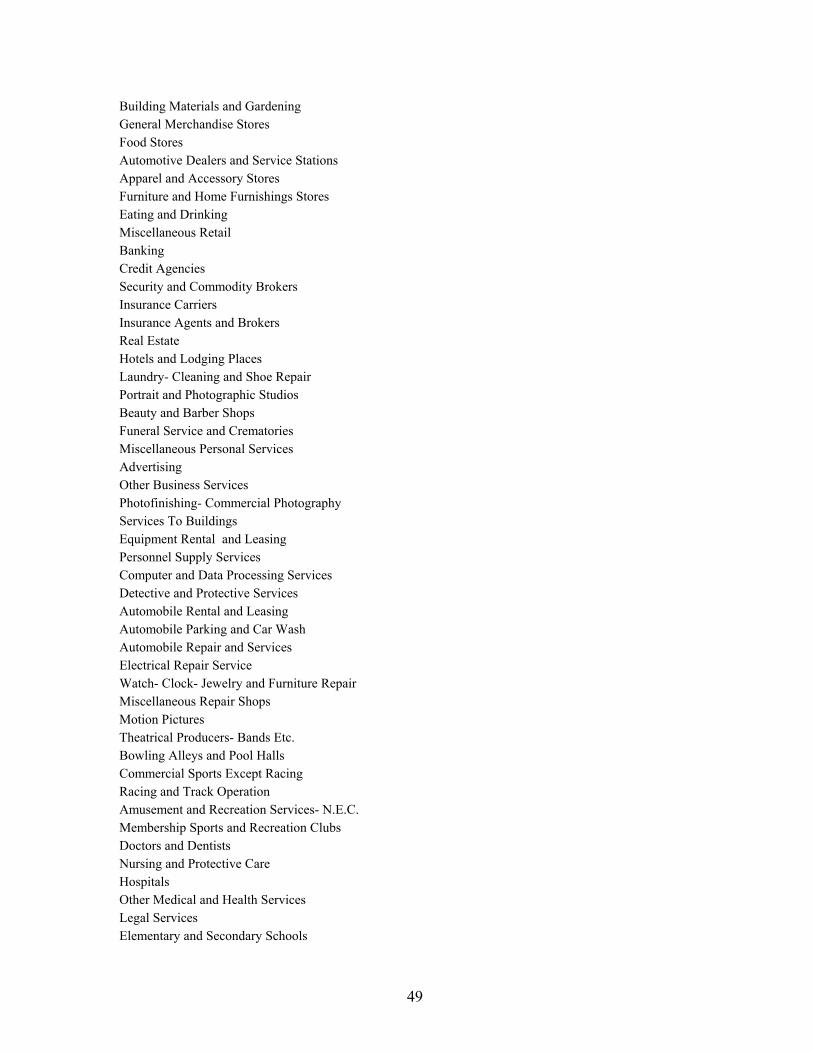
49
Building Materials and Gardening General Merchandise Stores Food Stores Automotive Dealers and Service Stations Apparel and Accessory Stores Furniture and Home Furnishings Stores Eating and Drinking Miscellaneous Retail Banking Credit Agencies Security and Commodity Brokers Insurance Carriers Insurance Agents and Brokers Real Estate Hotels and Lodging Places Laundry- Cleaning and Shoe Repair Portrait and Photographic Studios Beauty and Barber Shops Funeral Service and Crematories Miscellaneous Personal Services Advertising Other Business Services Photofinishing- Commercial Photography Services To Buildings Equipment Rental and Leasing Personnel Supply Services Computer and Data Processing Services Detective and Protective Services Automobile Rental and Leasing Automobile Parking and Car Wash Automobile Repair and Services Electrical Repair Service Watch- Clock- Jewelry and Furniture Repair Miscellaneous Repair Shops Motion Pictures Theatrical Producers- Bands Etc. Bowling Alleys and Pool Halls Commercial Sports Except Racing Racing and Track Operation Amusement and Recreation Services- N.E.C. Membership Sports and Recreation Clubs Doctors and Dentists Nursing and Protective Care Hospitals Other Medical and Health Services Legal Services Elementary and Secondary Schools

50
Colleges- Universities- Schools Other Educational Services Job Trainings and Related Services Child Day Care Services Social Services- N.E.C. Residential Care Other Nonprofit Organizations Business Associations Labor and Civic Organizations Religious Organizations Engineering- Architectural Services Accounting- Auditing and Bookkeeping Management and Consulting Services Research- Development and Testing Services Local Government Passenger Transit State and Local Electric Utilities Other State and Local Govt Enterprises U.S. Postal Service Other Federal Government Enterprises Domestic Services

51
Appendix G: List of Websites Consulted
WEB SITE ADDRESS
ORGANIZATION OR UNIVERSITY
http://www.msu.edu/course/prr/840/econimpact/
Michigan State University Impact Page
http://home.att.net/~bartlnet/tour.html
Top 50 state Tourism sites
http://gocalif.ca.gov/
California Tourism
http://www.dra-research.com/
Dean Runyan Associates
http://www.dot.state.fl.us/moreDOT/phone.htm
FDOT phone book page
http://www.epa.gov/ispd/define.htm
EPA Impacts of Tourism
http://www.forestry.umt.edu/itrr/
University Of Montana
http://www.tourism.umn.edu/
University of Minnesota
http://tourism.ttr.msu.edu/
Michigan State University
http://www.123world.com/
Tourist info site
http://www.panynj.gov/aviation/jfkaboutframe.html
JFK Airport info
http://www.ttra.com/
Travel and Tourism Research Assn.
http://www.world-tourism.org/
World Tourism Organization
http://www.tourismstatistics.com/
Tourism Stats on the Web
http://www.co.broward.fl.us/sunny.htm
Ft. Lauderdale Visitors
http://www.facvb.org/
Florida Association of Convention and Visitors Bureaus
http://www.fishkind.com/
Fishkind and Associates
http://www.miami-airport.com/
Miami International Airport

52
Other Sources Referenced
IMPLAN Professional (Version 1.1) was used for this analysis. IMPLAN (Impact Analysis for Planning) was originally developed by the U.S. Department of Agriculture’s Forest Service in cooperation with the Federal Emergency Management Agency and the U.S. Department of Interior’s Bureau of Land Management to assist the Forest Service in land and resource management planning. The software has been upgraded and is presently sold and maintained by the Minnesota IMPLAN Group, Inc. Minnesota IMPLAN Group, Inc. 1997 (Feb). IMPLAN Professional User’s, Analysis and Data Guide. Stillwater, MN: MIG.
REMI, Regional Economic Models, Inc., Treyz, George, I., President, Amherst, MA.
Applicable assumptions are described in the IMPLAN Users, Analysis and Data Guide, pages 87, 88.
U.S. Department of Commerce, Bureau of Economic Analysis, November 1998.

53
About Florida TaxWatch
Florida TaxWatch is a private, non-profit, non-partisan research institute that over its 25 year history has become widely recognized as the watchdog of citizens’ hard-earned tax dollars. Its mission is to provide the citizens of Florida and public officials with high quality, independent research and education on government revenues, expenditures, taxation, public policies and programs and to increase the productivity and accountability of Florida Government. Florida TaxWatch’s empirically sound research recommends productivity enhancements and explains the statewide impact of economic and tax and spend policies and practices on citizens and businesses. Florida TaxWatch has worked diligently and effectively to help state government shape responsible fiscal and public policy that adds value and benefit taxpayers. This diligence has yielded impressive results: since 1979, policy makers and government employees have implemented three-fourths of Florida TaxWatch’s cost-saving recommendations, saving the taxpayers of Florida more than $6.2 billion--approximately $1,067 in added value for every Florida family. The organization enjoys a credible reputation and statewide exposure with the television, radio and newspaper media, which regularly report on its research and recommendations. Florida TaxWatch has a historical understanding of state government, public policy issues, and the battles fought in the past necessary to structure effective solutions for today and the future. It’s the only statewide organization devoted entirely to Florida taxing and spending issues. Supported by voluntary, tax-deductible memberships and grants, Florida TaxWatch is open to any organization or individual interested in helping to make Florida competitive, healthy and economically prosperous by supporting a credible research effort that promotes constructive taxpayer improvements. Members, through their loyal support, help Florida TaxWatch to bring about a more effective, responsive government that is accountable to the citizens it serves. Florida TaxWatch is supported by all types of taxpayers -- homeowners, small businesses, large corporations, philanthropic foundations, professionals, associations, labor organizations, retirees--simply stated, the taxpayers of Florida. The officers, Board of Trustees and members of Florida TaxWatch are respected leaders and citizens from across Florida, committed to improving the health and prosperity of Florida. With your help, Florida TaxWatch will continue our diligence to make certain your tax investments are fair and beneficial to you, the taxpaying customer who supports Florida’s government. Florida TaxWatch is ever present to ensure that taxes are equitable, not excessive, that their public benefits and costs are weighed, and that government agencies are more responsive and productive in the use of your hard-earned tax dollars. The Florida TaxWatch Board of Trustees is responsible for the general direction and oversight of the research institute and safeguarding the independence of the organization’s work. In his capacity as chief executive officer, the president is responsible for formulating and coordinating policies, projects, publications and selecting the professional staff. As an independent research institute and taxpayer watchdog, the research findings and recommendations of Florida TaxWatch do not necessarily reflect the view of its members, staff or distinguished Board of Trustees, or Executive Committee and are not influenced by the positions of the individuals or organizations who directly or indirectly support the research.
Florida TaxWatch Values: ♦Integrity ♦Productivity ♦Accountability ♦ Independence ♦ Quality Research

54
[This page left blank for formatting purposes.]

55
NON-PROFIT ORG.
U.S. POSTAGE PAID
TALLAHASSEE, FL
Permit No. 409 106 N. Bronough St. Tallahassee, FL 32301