tourism nanaimo - mid-year tourism report
TRANSCRIPT

Mid-Year Tourism Report
Aug. 10, 2015

Board
Tourism Leadership Committee Sasha Angus
CEO
Lesley Anderson
E.D. Destination Management
Kara Walsh
Destination Development Officer
Chelsea Barr
Destination Marketing Officer
Megan Beauregard
Stakeholder & Communications Specialist
Amanda Daly Visitor Services
Specialist
Helga Lange
VIC & Clerk
Part-time staff & volunteers
Visitor Counsellors
Amrit Manhas
Economic Development Officer
Peter McGee
Economic Development Coordinator
Robynn Baijus (temp)
Operations Coordinator
NEDC Organizational Chart Updated Aug 2015

• CHAIR: Sandra Petryk – Nanaimo Airport
• VICE-CHAIR: Margot Holmes – Vancouver Island Symphony
• PREVIOUS CHAIR: Dan Brady – Howard Johnson / NHA
• David Mailloux – Nanaimo Port Authority
• Leif Bogwald – Owner, Vancouver Island Expeditions
• Leo Boon – Independent Contractor
• Jonelle Knowles – Vancouver Island University
• David Twynam – Vancouver Island University
• Douglass Legg – Douglass Legg & Associates
• Denise Tacon – Vancouver Island Conference Centre
• Diana Johnstone
• Geoff Wallace – Best Western Northgate (NHA appointee)
• James Young – Long Lake Inn (NHA appointee)
• Odai Sirri – Grand Hotel & Waterfront Suites (NHA appointee)
Tourism Leadership Committee

Then vs Now
• $924,110 – 2009 total approx. value of City spending on tourism (in 2014 dollars) to support Destination & Tourism Nanaimo
• $734, 139 – 2014 value of NEDC spending on tourism activities – Includes $125,000 earmarked for product development through the TDF
• Tourism Nanaimo undertakes more activities at lower budget. Additional activities since 2012:
– Cruise, product and travel trade development
– Meetings & conventions support
– Grants program administration
– Sport marketing
– 2nd visitor centre & roving visitor servicing
– Stakeholder programs – NBT, CYPT
– Social media, content development and website management
– Formal governance activities

Source: Destination NEXT, sample size 367 DMOs worldwide
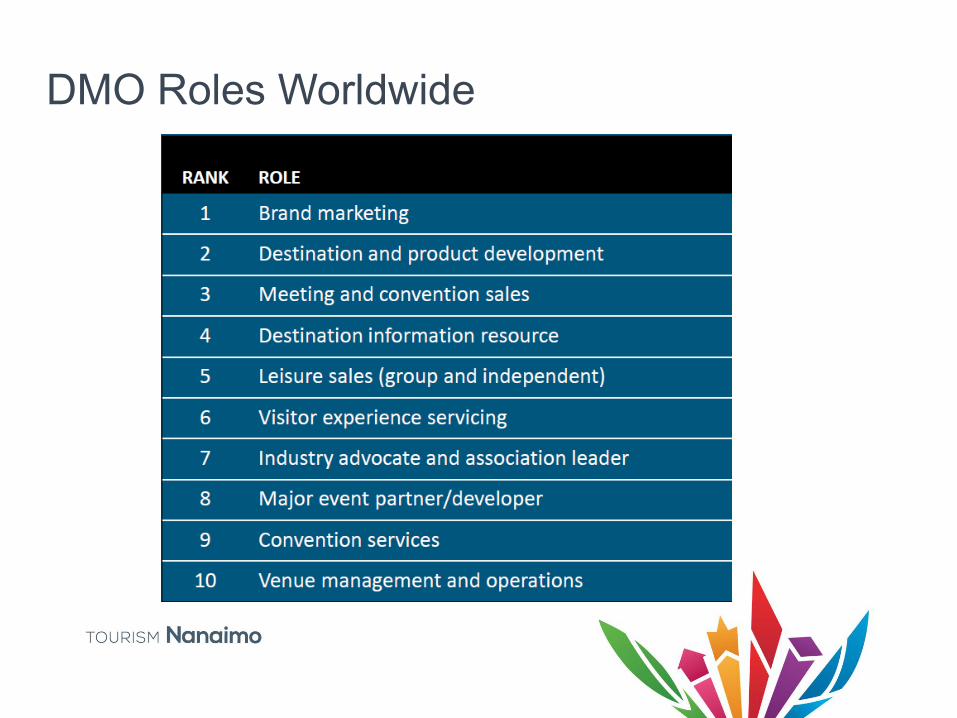
DMO Roles Worldwide

Tourism Strategic Plan Goals
#1: Product Development
#2: Industry Partnerships
#3: Marketing & Public Relations
#4: Community Pride
#5: Accountability

TLC Direction for 2015
• Market what we have more effectively
• Maximize the value of local community
• Capitalize on existing visitors & local markets
• Develop meetings, events & festivals
• Lean on DMO partners to reach beyond local
markets

MARKETING

#ExploreNanaimo Campaign
explorenanaimobc.com
Local market pride of place
campaign running May –
Sept
Objectives:
1) Entice locals & visiting
friends/relatives to
experience things to do
in Nanaimo & Region
2) Grow our social media
audiences
3) Grow use of the
#ExploreNanaimo tag

Mid-campaign results
• 800 tourism passport downloads
• 1000+ passports distributed at VICs
• 6,000 website visits
• Significant growth in social audience:
– Facebook up 9.2% (to 6066)
– Instagram up 34.9% (to 1861)
– Twitter up 5% (to 8384)
• 360% growth in #ExploreNanaimo use
• Delivering qualified traffic to
tourismnanaimo.com – 2.5x more
pageviews & 3x longer stay on site

Share Vancouver Island Campaign
sharevancouverisland.com
The 3rd year of our award-
winning campaign (formerly
You Won’t Be Sorry)
Market: Pacific Northwest
Timing: June - Aug
Objective: Grow awareness &
visitation to VI beyond Victoria
Leveraged: 3:1 ($55,000
campaign for $13,500 from
Tourism Nanaimo)

Go Vancouver Island Campaign
govancouverisland.ca
Markets: Alberta/Seattle
Timing: Apr – June
Objective: Continue growing
awareness & visitation to VI
Leverage: 25:1 ($8,900
contribution for a $217,000
campaign)
Campaign visits up 24% over
previous year
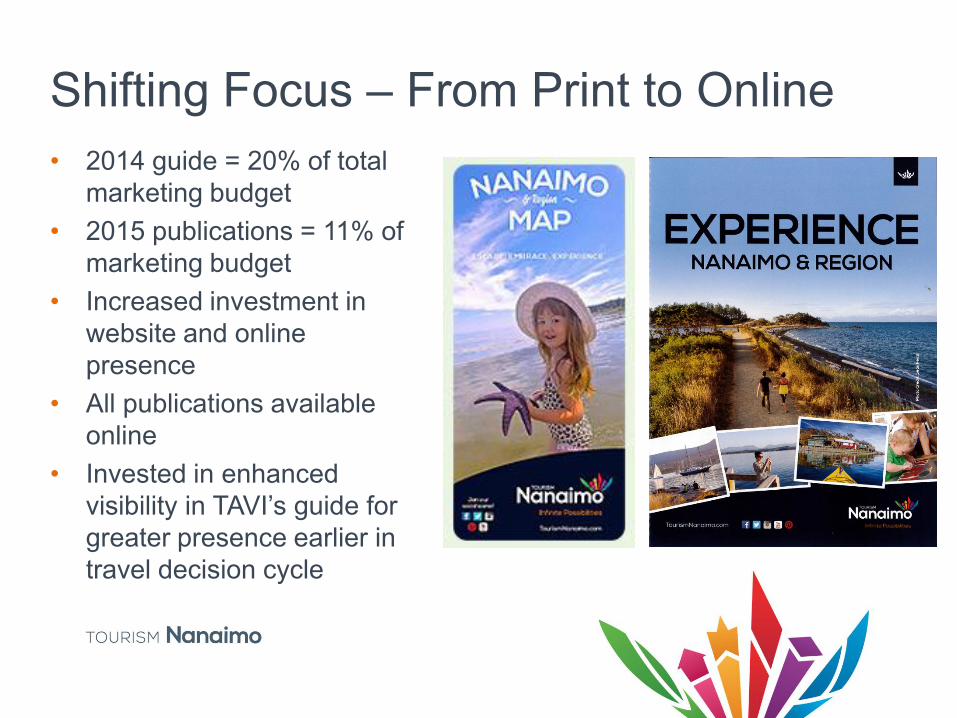
Shifting Focus – From Print to Online
• 2014 guide = 20% of total
marketing budget
• 2015 publications = 11% of
marketing budget
• Increased investment in
website and online
presence
• All publications available
online
• Invested in enhanced
visibility in TAVI’s guide for
greater presence earlier in
travel decision cycle

Website
Year-over-year (Jan 1 – Aug 4)
• 61% increase in visits
• 55% increase in users
• 54% increase in pageviews
• Averaging 14,800 visits/mo

Explore Nanaimo Blog
• Posting 2-3x weekly
• Delivers qualified traffic to
tourismnanaimo.com – 2x more
pageviews and 4x longer site visit
than average
• 9552 views since Jan. 1 – almost
100% growth YOY
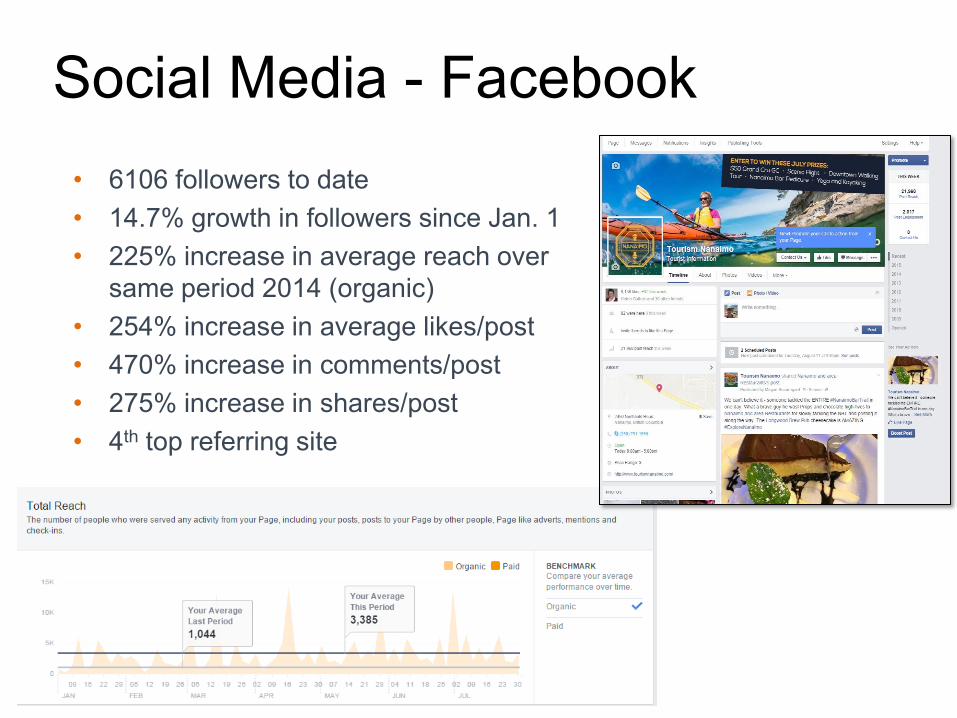
Social Media - Facebook
• 6106 followers to date
• 14.7% growth in followers since Jan. 1
• 225% increase in average reach over
same period 2014 (organic)
• 254% increase in average likes/post
• 470% increase in comments/post
• 275% increase in shares/post
• 4th top referring site

• 8442 followers
• 13.8% growth in followers since Jan. 1

BC Day Instameet – Aug. 3
• Province-wide event in
partnership with
Destination BC
• 19 participants
• 149 uses of
#ExploreNanaimo
hashtag in 1 day
• 475 new Instagram
followers resulting from
this event

Media Relations
• Continuing to proactively grow our presence &
engagement with media
– Attending GoMedia & TMAC media marketplaces
– Regularly hosting writers
• Leveraging partner programs
• Proactive pitching
• Digital Asset Management & Branded Content
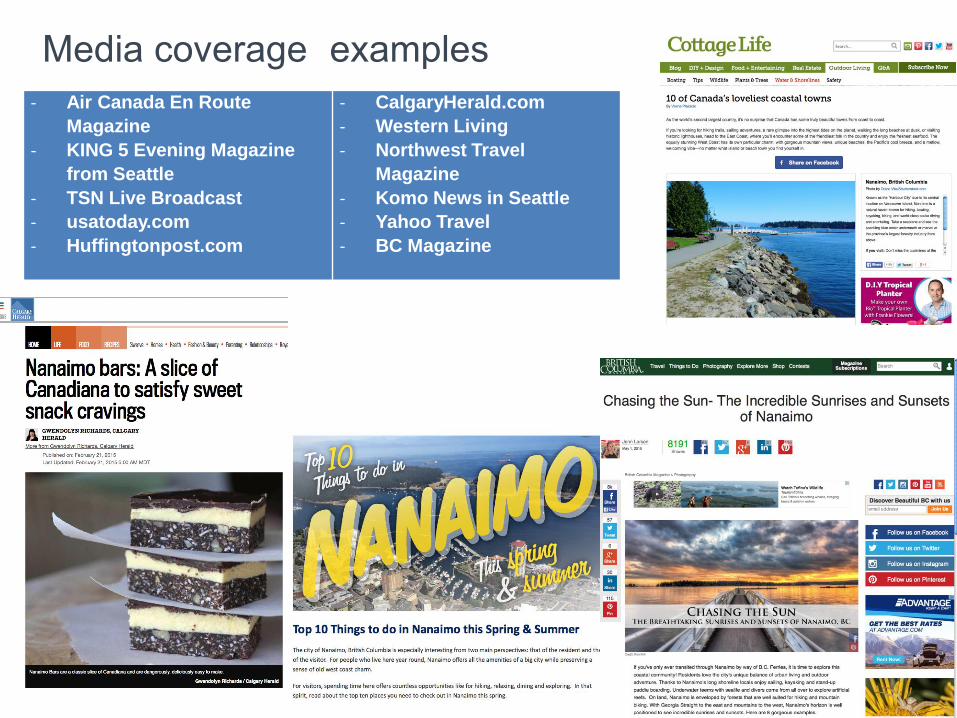
Media coverage examples
- Air Canada En Route
Magazine
- KING 5 Evening Magazine
from Seattle
- TSN Live Broadcast
- usatoday.com
- Huffingtonpost.com
- CalgaryHerald.com
- Western Living
- Northwest Travel
Magazine
- Komo News in Seattle
- Yahoo Travel
- BC Magazine

DESTINATION
DEVELOPMENT

Destination Development - Product
• Mt. Benson gondola – product fam
• Deep Discovery Centre – event Feb. 19
– feasibility study completion
– steering committee
• Supported Newcastle development
– Hosted product development fam trip for SFN to 2 First
Nations cultural centres
– TDF grant to support business plan development
– Participated in consultation process

Destination Development - Grants
• 2 TDF intakes awarding $38,000 to 9 organizations
• TDF Program Review in progress
• MRDT grants program implementation
• Implemented new sport grants program
• 2 sport grant intakes awarding $17,300 to 24 sport
organizations (3rd intake in Oct)
• Estimated economic impact of funded events in 2015
approx. $4.5 million

Destination Development – Sport, Travel
Trade & Cruise
Sport:
• Built new website section with targeted sport content
• Completed sport tourism plan – working with sport steering committee
Travel Trade:
• Seattle travel agent show
• TAVI travel trade showcase
• Asian receptive fam with top buyers from Chinese & Japanese tour
operators
Cruise:
• Supporting 3 cruise visits with on-site visitor services
• Hosted RCL executive on site visit with NPA
• Supporting cruise product development efforts

Stakeholder Programs
• Nanaimo Bar Trail
• NBT 34 listings (at max. capacity)
• Cedar Yellowpoint Trail
– CYPAT 24 listings (up from 23)
• Working to develop digitally
mapped versions of these trails
• Website listings, brochure racking,
educational workshops, Tourism
Matters events

Hotel Tax Grants Program • Live at www.tourismnanaimo.com/grants
• Ongoing application intakes with quarterly application review & evaluation
• Approx. annual grants available $450,000 – 45% for festivals & events (incl. sporting events)
– 35% for sport tourism initiatives (incl. minor capital upgrades for sport infrastructure)
– 20% for marketing associated with the events
• Newcastle Island funding pending business plan completion and MRDT agreement addendum submission to Provincial Gov’t

VISITOR
SERVICING

Visitor Centre Operations
• Northfield, Bastion (May 15 – Sep 8), roving “street team”, events & conferences
– Dragonboat
– Silly Boat
– Marine Festival
– Blues Fest
– VIU student orientation
• Visitor Experience Survey
• Staff fam trips to train other VICs on Nanaimo
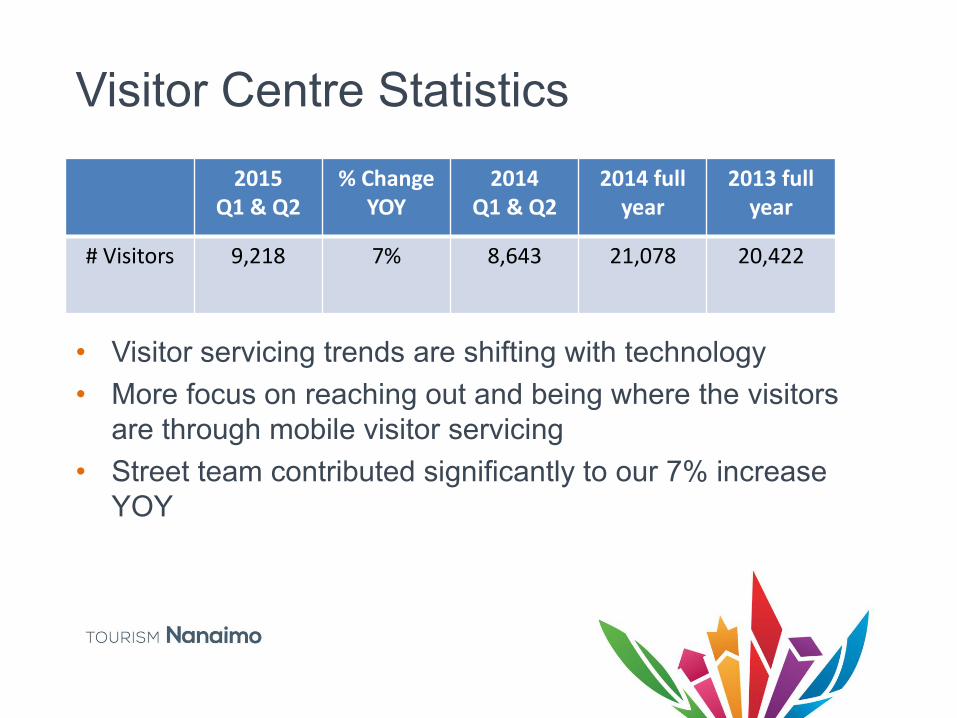
Visitor Centre Statistics
2015 Q1 & Q2
% Change YOY
2014 Q1 & Q2
2014 full year
2013 full year
# Visitors 9,218 7% 8,643 21,078 20,422
• Visitor servicing trends are shifting with technology
• More focus on reaching out and being where the visitors
are through mobile visitor servicing
• Street team contributed significantly to our 7% increase
YOY
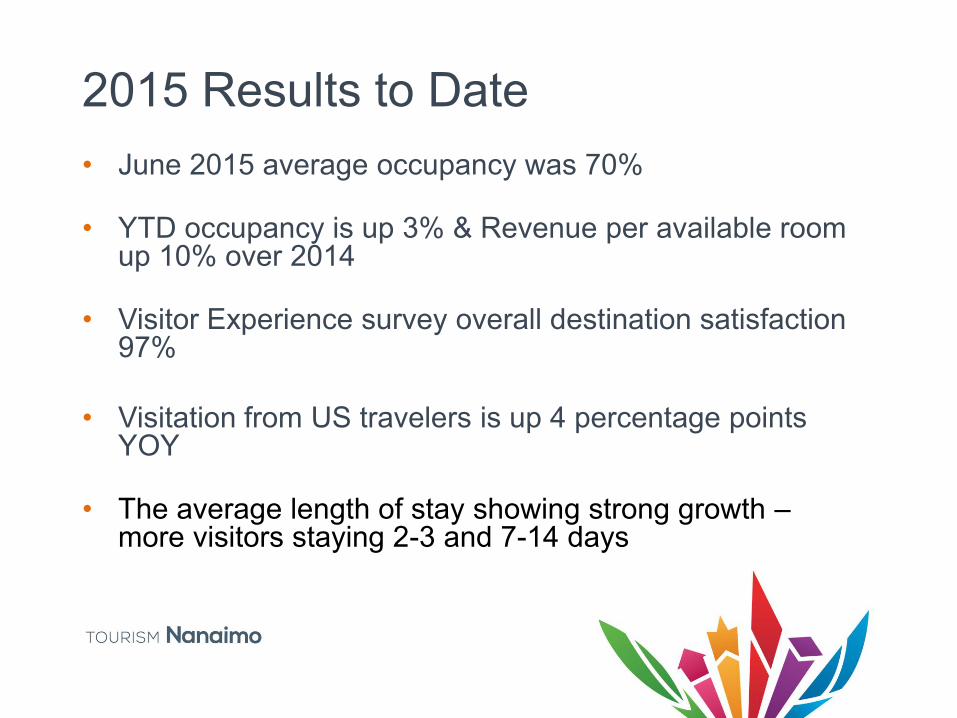
2015 Results to Date
• June 2015 average occupancy was 70%
• YTD occupancy is up 3% & Revenue per available room up 10% over 2014
• Visitor Experience survey overall destination satisfaction 97%
• Visitation from US travelers is up 4 percentage points YOY
• The average length of stay showing strong growth –more visitors staying 2-3 and 7-14 days

Thank you