toughening of thermoset polymers by rigid crystalline - deep blue
TRANSCRIPT

JOURNAL OF MATERIALS SCIENCE 27 (1992) 161-174
Toughening of thermoset polymers by rigid crystalline particles
JUN KYUNG KIM, R. E. ROBERTSON* Macromolecular Science and Engineering Center, and Department of Materials Science and Engineering, The University of Michigan, Ann Arbor, MI 48109, USA
The toughening of an aromatic amine-cured diglycidyl ether of bisphenoI-A epoxy with particles of crystalline polymers was studied. The crystalline polymers were poly(butylene terephthalate), nylon 6, and poly(vinylidene fluoride). Nylon 6 and poly(vinylidene fluoride) were found to toughen the epoxy about as well as did an equivalent amount of CTBN rubber. Poly(butylene terephthalate) was found to toughen the epoxy about twice as well as did the rubber. The toughness of poly(butylene terephthalate)-epoxy blends was independent of par- ticle size for sizes in the range of tens of micrometres, but the toughness of the nylon 6-epoxy blends decreased with increasing particle size for sizes smaller than about 40 #m. There was no loss of either Young's modulus or yield strength of the epoxy with the inclusion of either nylon 6 or poly(butylene terephthalate) and less loss of these with the inclusion of poly(vinylidene fluoride) than with the inclusion of rubber. Toughness seems to have arisen from a combination of mechanisms. The poly(butylene terephthalate)-epoxy blends alone seem to have gained toughness from phase-transformation toughening. Crack path alteration and the formation of steps and welts and secondary crack bridging seem to have accounted for an especially large part of the fracture energy of the poly(vinylidene fluoride)-epoxy blends. Secondary crack nucleation contributed to the toughness of the nylon 6-epoxy blends.
1. Introduct ion Toughness, the resistance of materials to crack propa- gation, is one of the most important properties for materials intended for load-bearing applications. Because of their high stiffness, high strength, chemical resistance, and excellent dimensional stability, brittle network or thermoset polymers are used often as the matrix in structural composites. But their low tough- ness, especially in the presence of sharp notches, de- tracts from this usage, and an improvement in tough- ness is greatly desired.
Until now, toughness has been attained most successfully in polymers by incorporating rubber particles [1, 2]. Well-known examples of this are high-impact polystyrene (HIPS), acrylonitrile-butadiene-styrene copolymer (ABS), and, more recently, rubber-toughened thermoset re- sins [3-9]. The improvement in toughness of rubber- toughened thermosets can be remarkable, but not all thermosets are significantly toughened by rubber. For example, the improved toughness of epoxies re- portedly arises mainly from shear deformation, but the shear deformability of epoxies seems to depend on characteristics like the cross-link density and glass transition temperature [9]. Thus, epoxies with low cross-link densities can be successfully toughened by the inclusion of rubber, but highly cross-linked epoxies often cannot. Moreover, the high stiffness and strength of thermoset resins are inevitably reduced by
*To whom correspondence should be addressed
0022-2461/92 $03.00 + .12 �9 1992 Chapman & Hall
adding the low stiffness and strength elastomer. In addition, the elastomeric phase increases the melt viscosity of the mixture, thus reducing processability. So other toughening methods for brittle polymers must be sought.
To avoid the loss of the inherent stiffness and strength of thermosets, rigid particulate fillers, such as alumina, silica [10-12], and glass spheres [13-15], have been used as the second phase. These fillers can increase considerably the fracture energy of brittle epoxies. But processing can be difficult. Uniform mix- ing and dispersion of these fillers, for example, is rarely obtained because of the higher density of the filler materials than that of the polymer.
Recently, rigid polymers such as polyethersulphone have been used as the second phase [16, 17]. The good intrinsic mechanical properties of the matrix remain undiminished with the rigid polymer phase, but the maximum toughness reported has been only twice that of the unfilled matrix. The enhanced toughness of this system has been suggested to arise from crack pinning and the rupture of the dispersed polymer.
A dramatic toughening of a brittle matrix, though until now not duplicated with polymers, arises from phase-transformation toughening. This mechanism is exhibited by zirconia-containing ceramics [18-23]. The metastable tetragonal phase of zirconia is incor- porated into the ceramic, and under the influence of the stress field ahead of a crack tip, this phase trans- forms to the stable monoclinic phase. Because the
161

monoclinic is less dense than the tetragonal phase, a compressive stress results that superposes on the ten- sile stress field ahead of the crack tip. This slows or stops the growing crack and has the effect of increas- ing the critical fracture energy. Such a toughening mechanism might be applicable to brittle polymers if a stress-transformable crystalline polymer were used as the rigid second phase.
For dispersed crystalline polymers to be effective for toughening by phase transformation, several proper- ties similar to those of the metastable tetragonal phase of zirconia are required. First, the polymers should have a variety of crystalline phases between which transformations can be induced by an applied stress. The desired phase transformation is one in which volume dilatation and distortion both occur in re- sponse to the stress field ahead of a crack tip. Second, the desired zero-stress crystalline phases should be stable or stabilizable in the temperature and pressure ranges under which the brittle matrix resins are pro- cessed. Third, these polymers should form strong interfacial bonds with the matrix.
The three crystalline polymers studied in the pre- sent work were poly(butylene terephthalate) (PBT), nylon 6, and poly(vinylidene fluoride) (PVDF). Each is capable of phase transformation by a stress field, and each can be bonded to epoxies. These were used as particulate inclusions for a highly cross-linked epoxy that cannot be toughened significantly by inclusion of rubber.
2. Experimental procedure 2.1. Materials The epoxy matrix studied was diglycidyl ether of bisphenol A, Epon 828, that was cured with Curing Agent Z, a mixture of aromatic amines with the main component being 4,4'-methylenedianiline. Both resin and curing agent were obtained from Shell Chemical Company. The optimum concentration of Curing Agent Z, 20 p.h.r., was used, and the epoxy- curing agent mixture was cured at 80 ~ for 2 h and postcured at 150~ for another 2 h. The glass trans- ition temperature of the cured epoxy was 155 ~
The poly(butylene terephthalate) (PBT) used in this investigation (Aldrich Chemical Company) had an inherent viscosity in phenol at 40 ~ of 0.71. To facilit- ate incorporation into the epoxy blend, the PBT was made into particulate form by dissolution in phenol and precipitation in methanol. After further washing in methanol and drying, the PBT was milled and sieved to obtain a uniform particle size. The dilute solution viscosity of the powder was the same as that of the original bead, meaning that no molecular weight reduction had occurred in the powder-making process.
The nylon 6 used, Capron 8200, was one of medium viscosity (Allied Chemical Company). The molecular weight measured by solution viscosity was around 42 000. A powder of nylon 6 for dispersal in the epoxy matrix was made also by dissolution in phenol and precipitation in methanol. The precipitate was ground and sieved to various particle sizes. The
162
poly(vinylidene fluoride) (PVDF) used was obtained as a fine powder (Aldrich Chemical Company).
All of the above polymers were dried under vacuum before mixing with epoxy, To make fracture speci- mens, the polymer powders were mixed with the epoxy resin at room temperature. The mixtures were degassed in a vacuum desiccator until most of the trapped gas and air had been removed. Then, Curing Agent Z was added with gentle mixing, and the mix- tures were degassed again, cured, and postcured.
A dispersion of rubber particles in the epoxy was also studied. The rubber, Hycar CTBN 1300 X 13, was a liquid copolymer of butadiene and acrylonitrile with carboxyl end groups (Goodrich Chemical Company). According to the manufacturer's literature, the car- boxyl content is 2.40%, the acrylonitrile content is 27.0%, and the molecular weight is 3500. The rubber was stirred with epoxy for 1 h at 120~ to dissolve it. After dissolution, the mixture was cooled to room temperature, and the curing agent was added. The mixture was cured and post-cured in the usual fashion. Precipitation of the rubber phase occurred during the curing process, and the diameter of the resulting rub- ber particles was approximately 0.7 lam.
2.2. Characterization To measure the molecular weights, dilute solution viscometry was used. The inherent viscosity of the PBT was measured in 0.5 gd1-1 phenol solution at 40 ~ and the intrinsic viscosity, [rl], of the nylon 6 was measured in formic acid solution at 25~ To calculate the molecular weight, the Mark-Houwink-Sakurada equation was used
[TI] = K M a (1)
where M is the viscosity average molecular weight. The values of K and a for nylon 6 are 22 600 ml g- 1 and 0.82, respectively [24]; none have been reported for PBT.
A differential scanning calorimeter (DSC) was used to measure the melting, Tin, and glass transition, Tg, temperatures, A Perkin-Elmer DSC 7 was used with specimens weighing approximately 10 rag, in an inert environment, and at a heating rate of 10 ~ rain-
2.3. Mechanica l tes ts The double torsion test (DT test), which was first described by Kies and Clark [25], was used for measuring toughness. This method was initially de- signed for brittle ceramic materials [26-29], but has since been used widely for brittle polymers such as epoxies [30-35]. The double torsion specimen can be considered to be a pair of elastic torsion bars, each having a rectangular cross-section, that are joined together. A diagram of the DT specimen and loading configuration is shown in Fig. 1. For small deflections, the fracture toughness, K~c, is given by
KIc = Perit W.[3(1 + v ) / W t a t . ] 1/2 (2)
where P e r i t is the load at which crack growth initiation or arrest occurs, IV, is the moment arm of each torsion

Initial crack Crack guide groove
J W
t
0/2
,o/2
Figure 1 Double torsion specimen geometry.
bar, v is Poisson's ratio, W is the specimen width, t is the thickness, and t n is the specimen thickness where fracture is occurring. As can be seen from the equa- tion, the stress intensity factor and fracture toughness are independent of crack length and are functions only of the applied load, the specimen dimensions, and Poisson's ratio. This feature makes the double torsion test extremely useful for sub-critical crack growth studies.
The fracture energy, Glc, is related to the fracture toughness by
K,o = (EGIo) I/2 (3)
where E is Young's modulus. Young and Beaumont [31] have suggested that
Equation 2 should be modified for variation in speci- men geometry to
K,~ = PcritWn[3(1 + v) /Wt3tnk '] 1/2 (4)
where k' is the correction factor. For the specimen geometry used, k' is about 0.75 [31]. When Equation 4 is used instead of Equation 2, K~o becomes about 13% larger. However, all of the fracture energies given below were computed from Equations 2 and 3 rather than Equation 4.
The above analytical models are based on the as- sumption that the specimen can be treated as two independent torsion bars and that all displacements are related to torsional deflections of the two bars. This neglects the possibility of either shear strains in the individual bars or the flexure of the uncracked portion of the specimen. The validity of these assump- tions can be tested experimentally by performing a compliance calibration on the specimen and com- paring these experimental data with that from the analytical expression.
The specimens used had a rectangular shape with the dimensions 100 mm long, 30 mm wide, and 6 mm thick. A sharp crack was inserted at one end, and a shallow centre groove was cut along one face of the specimen. The sharp crack prevents the formation of a plastic zone in the vicinity of the crack tip and was inserted by tapping with a hammer on a razor blade
held against the bottom of a saw cut. The initial crack lengths were made longer than 0.55 times the speci- men width to avoid end effects [27]. The centre groove guides the propagating crack and was made with a table saw. The width of the groove was less than 0.5 mm, and the depth was nearly one-half the speci- men thickness. The load was applied with a screw- driven Instron machine at 0.04rams -1 crosshead speed. The load against time was recorded with a strip chart recorder.
To examine the yielding behaviour of the materials, specimens were deformed in uniaxial compression. The epoxies studied deform plastically in uniaxial compression but not in uniaxial tension. Rectangular rod-shaped specimens were used with a height-to- width ratio of about 2: 1. The specimens were defor- med between polished ceramic plates lubricated with molybdenum disulphide at a constant displacement rate of 0.01 mm s-a. The load was measured from the load~tisplacement curve and converted to stress using the initial specimen's cross-sectional area. The com- pressive modulus, E, and the compressive yield stress, Oy, were also determined.
2.4. Fractography Scanning electron microscopy (SEM) was used to study and record the fractured surfaces of the pure and modified epoxies. The fractured sample surfaces were coated with a thin layer (10-30nm) of gold-palladium. This coating was carried out by plac- ing the specimen in a high vacuum evaporator and vaporizing the metal held in a heated tungsten basket.
Polarized transmission optical microscopy was used to investigate plastic deformation below the frac- ture surface. The specimens used for optical micro- scopy were bars broken by three-point bending. Thin sections perpendicular to the fracture surface, ob- tained by metallographic thinning [36], were taken from the mid-region of the specimen. The section plane was parallel to the crack propagation direction and normal to the fracture surface.
163

P. I
& ~ Tune Tune
(a) (b)
Figure 2 Load-time curves for double torsion test. (a) Unstable crack propagation with different initiation (Pi) and arrest (P.) loads; (b) stable crack propagation.
3. Results Crack propagation in the unfilled epoxy tended to be unstable, behaving in a "stick-slip" manner. The res- ulting load-displacement curve in the double torsion (DT) test had a "sawtooth" appearance, like that in Fig. 2a, rather than like the stable, constant load curve in Fig. 2b. The specimen deforms elastically until the load reaches a critical value, at which point the crack suddenly propagates along the specimen and con- tinues until the strain energy decreases sufficiently to allow crack arrest. As is typical of the DT fracture test, crack initiation, propagation, and arrest were able to be induced a number of times before complete fracture of the test specimen occurred. The average fracture energies for crack initiation and arrest were 190 and 170 J m - 2, respectively.
The "stick-slip" mode of fracture caused several crack arrest/initiation bands to appear on the fracture surfaces. A schematic diagram of the typical fracture surface from a DT test is shown in Fig. 3. The fracture surface between the crack arrest/initiation bands, which corresponds to fast crack propagation, is quite smooth and featureless, except for the basic longitud- inal texture. By contrast, the fracture surfaces in the arrest/initiation bands, which correspond to slow crack propagation, are rough and show a degree of plastic deformation.
3.1. Poly(butylene terephthalate)-epoxy blends
Like the unfilled epoxy, the PBT-epo~y blends exhib- ited relatively unstable crack propagation and yielded
a sawtooth load-deflection curve similar to that in Fig. 2a. Hence, the fracture energies for crack initia- tion and arrest again differ. The effect of composition on the fracture energy is shown in Fig. 4; the fracture toughness and fracture energy values are listed in Table I. The fracture energy is seen to have increased rapidly up to 5 wt % PBT and then increased almost linearly but at a lower rate at higher PBT content. The trend is the same for both crack initiation and arrest, but the difference between the fracture energy for crack initiation and crack arrest increased with PBT content.
The effect of PBT particle size on the fracture energy is shown in Fig. 5; the values are given in Table I. In the range studied, particle size has no significant effect on the fracture energy for either crack initiation or crack arrest.
A typical crack arrest/initiation band occurring in the double torsion test is shown in Fig. 6. The crack growth direction in Fig. 6 is generally from lower left to upper right. The location of the arrest/initiation band is indicated by the three arrows. The region within the band corresponds to slow crack propaga- tion, and the region outside corresponds to fast crack propagation. In both the slow and fast crack growth regions, there occurred behind nearly every PBT par- ticle a "tail" or crack bifurcation line, but like the unfilled epoxy, the region of slow crack propagation is generally the more complex. Also, the size and length of the tails behind the particles were greater generally within the arrest/initiation band than outside.
The effect of PBT particle size on the crack bifurca- tion line can be observed in Fig. 7, a micrograph of a region having a range of particle sizes resulting from the grinding and sieving of the PBT precipitate. The fracture direction is generally vertical, in the direction of the arrow. The size of the welt along the bifurcation line behind the particles is seen to increase with par- ticle size.
The basic longitudinal texture (BLT) on the fracture surfaces of the epoxy, consisting of a linear pattern of low ridges and shallow grooves that are parallel with the direction of crack propagation, can be used to indicate the role of the particle during fracture. In Fig. 8, the BLT above the particle is seen to rotate around the particle, although that below the particle follows a path that seems to take it through the epoxy-PBT interface.
Nominal crack propagation direction
Crack arrest lines or bands Fast crack propagation regions Precrack (rough) (smooth)
Figure 3 Schematic diagram of the fracture surface arising from unstable fracture in double torsion.
164

1.4
~a
eat)
1.2
1.0
0.8
0.6
0.4
0.2
0.0
" t l / ( a )
~ / ( b ) / / R
I ' I ' I ' I ) I
0 5 l0 15 20 25
Composition of PBT (wt%)
Figure 4 Effect of PBT composition on the fracture energy of PBT-epoxy blends (particle size 15 gin): (a) crack initiation, (b) crack arrest.
The fracture surfaces of the PBT phase often exhibit ductile behaviour. This is indicated by the fibrous nature of the PBT fracture surface in Figs 8-10. Also apparent in Fig. 10 is an underlying nodular structure of the PBT particles. The PBT particles appear as agglomerates of smaller diameter particles. This struc- ture can limit the ductility and strength of the PBT particles, and the crack is found to pass between these smaller particles sometimes.
The occurrence of plastic deformation can be re- vealed by the light microscopy of thin sections. Micro- graphs obtained with and without crossed polarizers of a thin section whose plane was perpendicular to the fracture surface and parallel with the direction of crack propagation are shown in Fig. 11. The direction of crack growth, towards the left, is indicated by the larger arrow. The smaller arrow indicates the point where crack growth began at the root of a notch. The profile of the fracture surface in Fig. 1 la is very rough due to the crack bifurcation induced by the PBT particles. Gross plastic deformation of the epoxy matrix by the formation of shear bands, or otherwise, appears to be absent in this section. Local plastic deformation, in the immediate vicinity of the PBT particles, if present, is obscured by the very bright birefringence of the PBT particles.
Many of the properties of the epoxy were essentially unaffected by being blended. As seen from Table I, the Tg of the epoxy has remained at approximately 155 ~ Also, the Young's modulus and yield stress (in com- pression) of the blend have remained around 3.0 and 118 GPa, respectively.
3.2. Nylon 6 - e p o x y blends Like the unfilled epoxy and the PBT-epoxy blends, the nylon 6-epoxy blends exhibited relatively unstable crack propagation. The load-displacement curve in the DT test had a sawtooth appearance, like that in Fig. 2a.
The fracture energy of the epoxy blends was found to increase almost linearly with nylon 6 content, as seen in Fig. 12; the fracture toughness and fracture energy values for crack initiation are listed in Table II. The trend was the same for both crack initiation and crack arrest, although the difference between the frac- ture energy for crack initiation and arrest increased with nylon content. The effect of the crack growth rate is seen also in Fig. 13. The fracture surface of the blend in the fast crack growth rate regions, between the arrest/initiation bands, was nearly smooth for both epoxy and nylon. That in the slow crack growth rate regions, in the vicinity of the arrest/initiation bands, was rough and complex, with several secondary cracks behind each nylon particle. The nylon particles in the slow crack growth region often exhibited ductile beha- viour also, as is indicated by the fibrous nature of the nylon fracture surface seen in Fig. 14.
The effect of particle size on fracture is exhibited in Figs 15 and 16. As seen in Fig. 15, the fracture energy seems to remain essentially constant for particle sizes larger than 40 gm, but increased with decreasing par- ticle size below this size. Behind the small nylon par- ticles seen in Fig. 16, there occurred only tail-like crack bifurcation lines, while behind large nylon par- ticles, there occurred several secondary cracks besides the crack bifurcation lines. The effect of particle size on crack bifurcation can also be seen in the BLT. There is generally greater rotation of the BLT around the nylon phase with the smaller particles. On the other hand, with increasing particle size, the number of secondary cracks increased.
Micrographs obtained with and without crossed polarizers of a thin section whose plane was perpendi- cular to the fracture surface and parallel with the direction of crack propagation are shown in Fig. 17. The direction of crack growth, toward the left, is indicated again by the larger arrow; the smaller arrow indicates the point where crack growth began at the root of a notch. By comparison with the profile of the fracture surface of the PBT-epoxy blends in Fig. 1 la, the profile of the fracture surface of the nylon 6-epoxy blend in Fig. 17 is smooth. Gross plastic deformation of the epoxy matrix by the formation of shear bands, or otherwise, appears to be absent in this section also. The birefringence that is visible in Fig. 17b around the
TABLE I Properties of PBT-epoxy blends
PBT (wt %) Size (~tm) Epoxy Tg (~ E (GPa) cry (MPa) Kle (MPa m ~/2) GI~ (kJ m- 2)
Unfilled - 155 3.06 118 0.75 0.19 5 15 156 2.99 115 1.34 0.60
10 15 155 3.04 117 1.48 0.73 10 40 156 2.90 117 1.43 0.68 10 75 155 2.84 119 1.50 0.75 20 15 155 2.96 115 1.82 1.10
165

1.2
1.0
0.8
~3
0.6
0.4
0.2
0.0
[]
(a) - - n []
(b) --n "
I I I I
20 40 60 ~8 0
PBT particle size (]am)
Figure 5 Effect of PBT particle size on the fracture energy of PBT-epoxy blends (10 wt % PBT): (a) crack initiation; (b) crack arrest.
Figure 7 Scanning electron micrograph of the fracture surface of the fast crack growth region of a PBT-epoxy blend (10 wt % PBT, 15 gm particle size). (Arrow indicates the direction of crack propa- gation.)
Figure 6 Scanning electron micrograph of the fracture surface of a PBT-epoxy blend (10wt% PBT, 15 gm particle size). (Three arrows indicate the crack arrest band.)
nylon particles may have arisen from residual stresses developed during cooling from the postcure temper- ature, owing to the thermal mismatch between the epoxy resin and nylon particles.
As may be noted from Table II, the Young's modu- lus, yield stress, and glass transition temperature of the epoxy were unchanged by inclusion of nylon 6 particles.
3.3. Poly(vinylidene fluoride)-epoxy blends Like the unfilled epoxy and blends with PBT and nylon 6, PVDF-epoxy blends were found to exhibit
166
Figure 8 Scanning electron micrograph of the fracture surface of a PBT-epoxy blend. BLT above PBT particle rotates around the particle. (Arrow indicates the direction of crack propagation.)
relatively unstable crack propagation. The load- displacement curve in the DT test was similar to the sawtooth curve in Fig. 2a.
The fracture energy of the blends increased linearly with PVDF composition, as seen in Fig. 18; the frac- ture toughness and fracture energy values for crack
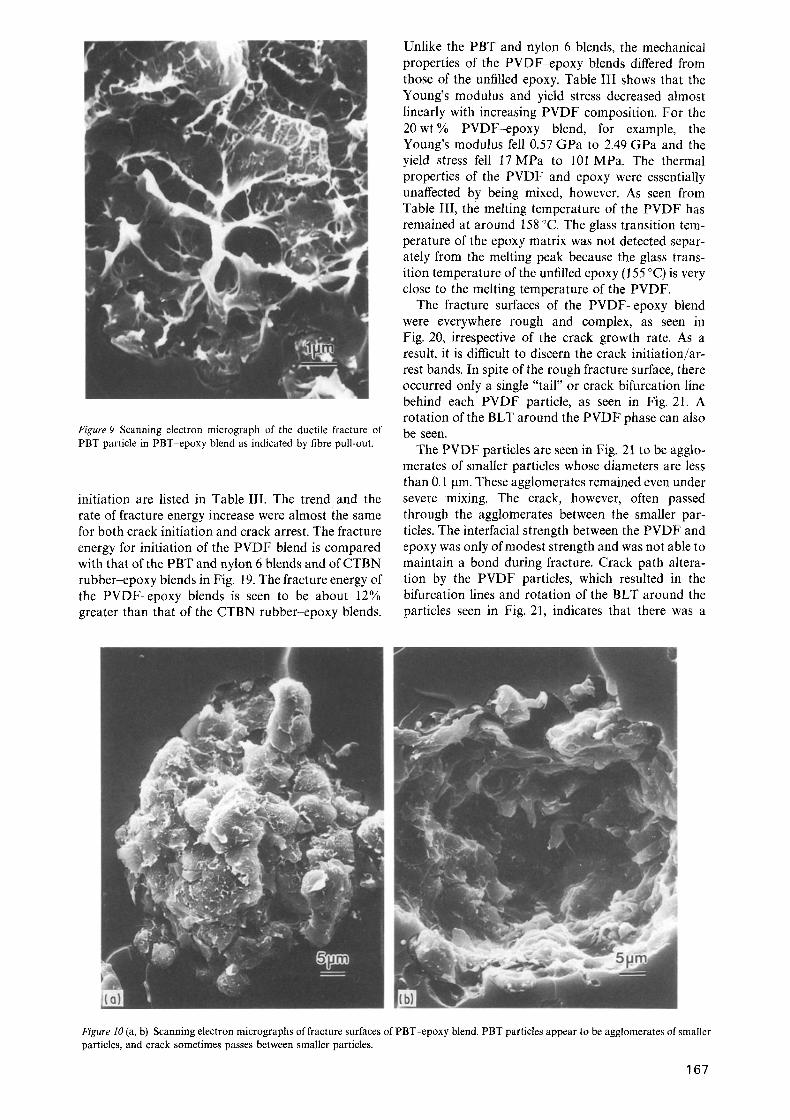
Figure 9 Scanning electron micrograph of the ductile fracture of PBT particle in PBT-epoxy blend as indicated by fibre pull-out.
initiation are listed in Table III. The trend and the rate of fracture energy increase were almost the same for both crack initiation and crack arrest. The fracture energy for initiation of the PVDF blend is compared with that of the PBT and nylon 6 blends and of CTBN rubber-epoxy blends in Fig. 19. The fracture energy of the PVDF-epoxy blends is seen to be about 12% greater than that of the CTBN rubber-epoxy blends.
Unlike the PBT and nylon 6 blends, the mechanical properties of the PVDF-epoxy blends differed from those of the unfilled epoxy. Table III shows that the Young's modulus and yield stress decreased almost linearly with increasing PVDF composition. For the 2 0 w t % PVDF-epoxy blend, for example, the Young's modulus fell 0.57 GPa to 2.49 GPa and the yield stress fell 17 MPa to 101 MPa. The thermal properties of the PVDF and epoxy were essentially unaffected by being mixed, however. As seen from Table III, the melting temperature of the PVDF has remained at around 158 ~ The glass transition tem- perature of the epoxy matrix was not detected separ- ately from the melting peak because the glass trans- ition temperature of the unfilled epoxy (155 ~ is very close to the melting temperature of the PVDF.
The fracture surfaces of the PVDF-epoxy blend were everywhere rough and complex, as seen in Fig. 20, irrespective of the crack growth rate. As a result, it is difficult to discern the crack initiation/ar- rest bands. In spite of the rough fracture surface, there occurred only a single "tail" or crack bifurcation line behind each PVDF particle, as seen in Fig. 21. A rotation of the BLT around the PVDF phase can also be seen.
The PVDF particles are seen in Fig. 21 to be agglo- merates of smaller particles whose diameters are less than 0.1 ~tm. These agglomerates remained even under severe mixing. The crack, however, often passed through the agglomerates between the smaller par- ticles. The interfacial strength between the PVDF and epoxy was only of modest strength and was not able to maintain a bond during fracture. Crack path altera- tion by the PVDF particles, which resulted in the bifurcation lines and rotation of the BLT around the particles seen in Fig. 21, indicates that there was a
Figure 10 (a, b) Scanning electron micrographs of fracture surfaces of PBT-epoxy blend. PBT particles appear to be agglomerates of smaller particles, and crack sometimes passes between smaller particles.
167

PVDF-epoxy bond before fracture, but complete debonding occurred after the crack passed around the PVDF phase.
Micrographs obtained with and without crossed polarizers of a thin section whose plane was perpendi- cular to the fracture surface and parallel with the direction of crack propagation are shown in Fig. 22. The direction of crack growth, towards the left, is indicated again by the larger arrow; the smaller arrow indicates the point where crack growth began at the root of a notch. The profile of the fracture surface of the PVDF-epoxy blend is seen to be fairly rough. Gross plastic deformation of the epoxy matrix by the formation of shear bands, or otherwise, appears to be absent in this section also. A very slight birefringence around the PVDF particles seen in Fig. 22b is not due to plastic deformation developed during fracture be- cause the particles far from the fracture surface also exhibited the same birefringence. This birefringence may be caused by residual stresses developed during cooling from the postcure temperature.
Figure 11 Optical micrographs of a thin section perpendicular to the fracture surface of a PBT-epoxy blend: (a) analyser 45 ~ from polar axis; (b) analyser 90 ~ from polar axis. (Large and small arrows indicate the crack propagation direction and root of notch from which crack growth initiated, respectively.)
0.7-
0.6. ~E
-~0.5.
~0.4.
~0.3.
0.2 ,,'r
0.1
J
oJi I
0 0 5 I'0 1'5 2'0
Composition of nylon lwt %)
{0)
(bl
Figure 12 Effect of nylon content on the fracture energy of nylon 6-epoxy blends (particle size 15 ~tm): (a) crack initiation; (b) crack arrest.
4. D i s c u s s i o n The inclusion of particles of poly(butylene tereph- thalate) (PBT), nylon 6, or poly(vinylidene fluoride) (PVDF) can considerably enhance the toughness of brittle epoxies. For PBT and nylon 6, this occurs without loss of Young's modulus, yield stress, or glass transition temperature. For PVDF, there is a slight lowering of Young's modulus and yield stress (in com- pression), although the glass transition temperature has remained unaffected. A comparison of the several blends, including that with CTBN rubber, is given in Fig. 19.
4.1. Poly(buty lene terephthalate) -epoxy blends
As seen in Fig. 4, the fracture energy increases rapidly up to 5 wt % PBT and then less rapidly at higher PBT content. The cause for the rapid increase of the frac- ture energy at low PBT content is still uncertain, but the non-linear increase of the fracture energy suggests that the toughness enhancement is not due to one dominating mechanism but to a combination of several. The rate of increase of the fracture energy also depends on the crack growth rate. As seen in Fig. 4, the toughness increase with increasing PBT is similar for both crack initiation and crack arrest, but the difference between the two increases with PBT con- tent. Because crack initiation represents slow crack
T A B L E II Properties of nylon 6-epoxy blends
Nylon (wt %) Size (~tm) Epoxy Tg (~ E (GPa) cry (MPa) Kic (MPa m 1/2 ) Glc (kJ m-2)
Unfilled - 155 3.06 118 0.75 0.19 5 15 155 3.03 117 1.09 0.40 5 45 156 3,01 118 0.98 0.32 5 75 154 3.08 116 0.96 0.31
10 75 155 3.00 120 1.05 0.37 20 75 156 3.03 117 1.30 0.56
168

Figure 13 Scanning electron micrographs of fracture surface of nylon 6-epoxy blend. (a) Fast crack growth region; (b) slow crack growth region. (Arrows indicate crack growth direction.)
0.6
~E _~ 0.5
~-0.4
03 co
Co
~ 0 . 2 .
2 -- 0,1.
o 2'0 4 do io Average particle size (lain)
Figure 15 Effect of nylon particle size on the fracture energy of nylon 6-epoxy blends (5 wt % nylon 6).
Figure 14 Scanning electron micrograph of the fracture surface of nylon particles in the slow crack propagation region. (Arrow indic- ates the crack propagation direction.)
growth and crack arrest represents fast crack growth, the lower rate of fracture energy increase with PBT content is associated with higher crack growth rate. In true brittle fracture, the fracture energy is independent of crack growth rate, but the viscoelastic nature of polymers usually causes the fracture energy to in- crease with rate [37]. The contrary results with
PBT-epoxy blends suggests an additional rate-sensi- tive process during fracture.
The fracture surfaces of the PBT-toughened epoxy shown in Figs 6-10 reveal many of the causes for the toughness of these materials. These include: (1) pri- mary crack bridging, (2) crack bifurcation, (3) second- ary crack bridging, and (4) ductile fracture of the particles. Crack bridging is discernable from the BLT. The rotation of the BLT around the PBT particles indicates that the particles are not fractured as the crack is passing by and, perhaps, after the crack has passed by. In holding the crack together, the un- fractured particles limit crack opening and reduce the stress at the crack front. Primary crack bridging de- pends on the strength of the particles and the adhesion of the particles to the matrix.
1 6 9

Figure 16 Scanning electron micrographs of fracture surface of nylon 6-epoxy blend. (a) Average particle size ~ 30 pm; (b) average particle size ~ 5 pro. (Arrow indicates crack propagation direction.)
0.B-
0.7 %
o.6
~ 0 . s
,7 0.4
0.3
O.2 &
0.1
to) o /
0 I i l i
0 5 10 15 20 Composition of PVDF {wt Olo}
Figure 18 Effect of .PVDF content on the fracture energy of PVDF-epoxy blends: (a) crack initiation; (b) crack arrest.
Figure 17 Optical micrographs of a thin section perpendicular to the fracture surface of a nylon 6-epoxy blend: (a) without polariza- tion; (b) with crossed-polarizers. (Large and small arrows indicate the crack propagation direction and blunt notch tip, respectively.)
170
Crack bifurcation has been induced at nearly every PBT particle. The bifurcation is indicated by the "tail" or bifurcation line behind each particle. The exten- siveness of this behaviour is seen in Fig. 6, and its nature is seen in Figs 7 and 8. Each "tail" is actually a step and, for about one-half the step-length, an associ- ated welt 1-38]. (For the other half of the step-length, the welt remains with the opposite step on the oppo- sing fracture surface. Only one welt is formed per two steps and the welt is distributed between them.) Steps and welts form when pairs of cracks moving on differ- ent planes interact with each other and combine or recombine. Hence, steps and welts can be a good indicator that the crack had previously bifurcated.

TABLE II I Properties of PVDF-epoxy blends
PVDF (wt %) PVDF T., (~ E (GPa) dry (MPa) Kic (MPa m uz) G~c (kJ m-2)
Unfilled (158) 3.06 118 0.75 0.19 5 159 3.03 117 0.93 0.29
10 159 2.73 111 1.10 0.44 20 158 2,49 I01 1.33 0.71
'E 1.0. .-.)
~0.8. c,3
>,0.6- E"
=o~, 0.4-
'~ 0.2~
101 o J
o / ( b ~ J / a (c)
i i I i i
0 5 10 15 20 25 Composition of second phose Iwt %)
Figure 19 Fracture energy for initiation for (a) PBT, (b) PVDF, (c) CTBN, and (d) nylon 6.
Figure 21 Scanning electron micrograph of the fracture surface of a PVDF-epoxy blend. (Arrow indicates crack propagation direction.)
Figure20 Scanning electron micrographs of fracture surfaces of PVDF-epoxy blend. (Arrow indicates crack propagation direction.)
The steps and welts that form the bifurcation lines in Figs 6-8 resulted from the cracks being on different elevations after having separated and passed around the two sides of each particle. For the rejoining cracks to be at different elevations, the path of each must be locally and asymmetrically altered by the PBT par- ticles. Thus, the crack-path alteration potential can be a significant characteristic of the particles.
Secondary crack bridging is also associated with the bifurcation lines or tails behind the particle. It is a considerably more important source of energy dissipa- tion than is the creation of crack area. Secondary crack bridging occurs by means of the welt. The welt, being attached to both fracture surfaces, tends to hold the surfaces together. It is stretched and fractured as the two separate. The greater the size of the welt, the greater is the bridging effect. Thus, the greater the crack-path alteration by the particles, the greater is the difference in elevation of the crack when they rejoin, and the greater are the size of the welt and its effect on toughening. Crack-path alteration depends on the volume fraction, size, and spacing of the par- ticles, the particle-matrix interfacial strength, and the asymmetry of particle deformation.
Crack bifurcation is also seen in the fracture of epoxies toughened with rigid inorganic particles. This behaviour is usually suggested to arise from "crack pinning" [10, 39, 40], a mechanism first suggested by Lange [10]. The energy dissipation of the crack pin- ning mechanism is suggested to arise from the creation of new fracture surface and from the line energy of the enlarged crack front. As the crack propagates, the crack front bows out between the reinforcing particles
171

larger amounts of fracture energy if the deformation behaviour of these small particles is similar to that of bulk PBT.
The considerable increase in toughness of the PBT-epoxy blend over that of the other epoxy blends reveals the possibility of a new toughening mech- anism, namely a phase transformation of the PBT in front of the crack tip. As with zirconia, used to toughen ceramics, PBT exhibits a stress-induced phase transformation with volume expansion. The normal m-crystal of PBT can transform to a more extended [3-crystal under small strain along the chain axis. The transformation is thought to arise from a change in the butylene chain conformation from TGTG to TTTT [41-48]. The densities of the ~- and [3-structures are reported to be 1.40 and 1.28 Mg m-3, respectively, so that a deformation-induced volume increase of about 9% is possible. Even under strains of less than 2%, the transformation from the ~- to [3-structures occurs with volume expansion. There oc- curs a reverse transformation from the [3- to a-crystal when the applied stress is released, however, so that direct proof for a phase transformation of PBT during fracture has not been possible.
Figure 22 Optical micrographs of a thin section perpendicular to the fracture surface of a PVDF-epoxy blend: (a) without polariza- tion; (b) with crossed-polarizers. (Large and small arrows indicate the crack propagation direction and blunt notch tip, respectively.)
while still remaining pinned at the particles. The degree of toughness enhancement depends on the volume fraction, size, and spacing of the filler particles and the filler-matrix interfacial strength. The required properties for the second dispersed phase are fracture resistance, small thermal and elastic mismatch, high interfacial strength, and high modulus.
Ductile fracture of the PBT particles, such as by fibre pull-out, can also contribute to the toughness of the PBT-epoxy blends. Even in rubber-epoxy blends, the deformation and rupture of the rubber particles are considered to be energy absorbing. The rubber particles are believed to bridge the cracks as the cracks propagate through the material, and the toughness of rubber-epoxy blends may be identified in part with the amount of elastic energy stored in the rubber particles while stretched, which is dissipated irrever- sibly when the particles rupture. The principal toughen- ing mechanism of rubber-epoxy blends, however, has been found to be plastic deformation of the epoxy matrix induced by cavitation of the rubber phase [6, 7]. Thus, the deformation of the rubber particles is usu- ally only of secondary importance in rubber-epoxy blends. For the PBT-epoxy blend, however, the ductile deformation of the PBT particles may absorb
172
4.2. Nylon 6 -epoxy blends The fracture surfaces of the nylon 6-epoxy blend shown in Figs 13-16 reveal most of the causes of toughness, including (1) primary crack bridging, (2) crack bifurcation and crack path alteration, (3) forma- tion of steps and welts and secondary crack bridging, (4) ductile fracture of the particles, and (5) initiation of secondary cracks. Most are also seen with PBT-epoxy blends. Primary crack bridging is indicated by the rotation of the BLT lines around the particles. Crack bifurcation and secondary crack bridging are indi- cated by the "tail" behind each particle resulting from crack path alteration and the formation of steps and welts. Crack bridging and crack bifurcation both are seen in Fig. 16b. Ductile fracture of the nylon par- ticles, indicated by the formation of a fibrous texture, is seen in Fig. 14.
The nylon particles also have induced secondary cracks, as seen in Fig. 16a. Secondary cracks enhance the fracture energy by creating fracture area and steps and welts where they overlap the primary crack.
As with the PBT-epoxy blends, the toughening of the nylon 6-epoxy blends is affected by the crack growth rate. As seen in Fig. 12, the fracture energy of the blends increased almost linearly with nylon 6 composition for both crack initiation and arrest, but the fracture energy for crack arrest increased less rapidly so that the difference between initiation and arrest increased with nylon content. The fracture sur- face in the fast crack growth regions was nearly smooth for both phases, epoxy and nylon, as seen in Fig. 13, while that in the slow crack growth rate regions was rough and complex with several second- ary cracks behind the nylon particles. Also, the frac- ture surfaces of the nylon phase in the slow crack growth region often exhibited a ductile behaviour. Thus, as the crack growth rate increases, the fracture

surfaces seems to become smoother with less crack path alteration and fewer secondary cracks.
Although the fracture energy seems to remain essen- tially constant for particle sizes larger than 40 ~tm, it increases with decreasing particle size below this size. Behind small nylon particles, there occurred only tail- like crack bifurcation lines as seen in Fig. 16b. Behind large nylon particles, there occurred several secondary cracks besides the crack bifurcation, as seen in Fig. 16a; i.e. crack path alteration became weaker while the formation of secondary cracks became stronger with increasing particle size. Thus, crack path alteration seems more effective for increasing tough- ness than does the formation of secondary cracks.
Nylon 6 has several crystalline structures between which the material can be transformed by deforma- tion. Both deviatoric and dilatational transformations can occur. The deviatoric transformation involves the change from the less stable pleated (z-structure to the more stable planar zig-zag (z-structure [49-53]. Because the densities of the pleated (z- and the planar zig-zag (z-structures are reported to be 1.16 and 1.23 Mg m-3, respectively, this transformation is ex- pected to be accompanied by a volume reduction. The dilatational transformation involves the change from the planar zig-zag (z-structure to the amorphous phase (density ~ 1.10 Mgm -3) and could result in about a 12% increase in volume. The dilatational trans- formation seems not to have occurred during fracture, however [54].
4.3. Poly(vinylidene fiuoride)-epoxy blends The fracture surfaces of the poly(vinylidene fluoride)-epoxy blends shown in Figs 20 and 21 reveal some of the causes of toughness seen also with the PBT-epoxy and nylon 6-epoxy blends, including (1) primary crack bridging, (2) crack bifurcation and path alteration, and (3) formation of steps and welts and secondary crack bridging. Primary crack bridging is indicated by the rotation of the BLT lines around the particles. Crack path alteration and the formation of steps and welts is indicated by the presence of a "tail" behind each particle. These can be seen in Figs 20 and 21. Although primary crack bridging by unfractured PVDF particles seems to occur while the crack is passing by each particle, the particles probably do not continue to bridge the crack after the crack has passed beyond it, because of the low interfacial strength with the matrix. But secondary crack bridging seems to continue to be effective, occurring by means of the welt attached to both fracture surfaces: the greater the size of the welt, the greater its bridging effect. For the PVDF-epoxy system, the rough fracture surface res- ults from large steps and welts. The steps and welts in PVDF-epoxy system seem to be much larger than those in either the PBT-epoxy or the nylon 6-epoxy systems. The cause of the large loss of coherence by the separated cracks in passing around the PVDF par- ticles, which leads to the large steps and welts, is unknown, but must be related to the process by which the PVDF particles fracture. Further changes in the stress field occurring during fracture are indicated by
the crack bifurcation lines not being straight nor parallel to the nominal crack propagation direction, as can be seen in Fig. 20.
Because the fracture surface of the PVDF-epoxy blend is very rough and complex, irrespective of the crack growth rate, it is difficult to discern the crack initiation/arrest bands. The increase in fracture energy with PVDF content was almost the same for crack initiation and crack arrest, which suggests few or no rate-sensitive processes occurring during fracture.
Poly(vinylidene fluoride) can be induced by defor- mation to transform from the (z- (nonpolar) to the [3-phase (polar) with the change in chain conformation from TGTG to a planar zigzag TTTT [55-61]. The volume is decreased by the transformation ((z-density ~ 1.9 Mgm-3; j3-density ~ 2.0 Mgm-3), however. But this phase transformation seems not to have occurred during fracture [54].
5. Conclusions The fracture toughness of "non-toughenable" epoxies can be increased as much by the inclusion of nylon 6 or poly(vinylidene fluoride) particles as by the inclu- sion of CTBN rubber particles. And the fracture toughness can be increased about twice as much by the inclusion of poly(butylene terephthalate) particles. Moreover, there is no loss of either Young's modulus or yield strength with the inclusion of either nylon 6 or PBT particles and less loss of these properties with the inclusion of PVDF particles than with the inclusion of CTBN particles.
The increase in toughness in each of these systems seems to arise from a combination of processes that include (1) primary crack bridging, (2) crack bifurca- tion and crack path alteration, (3) formation of steps and welts and secondary crack bridging, (4) ductile fracture of the particles, (5) initiation of secondary cracks, and (6) phase-transformation toughening. The first four are confirmed for PBT-epoxy blends, and the sixth, phase-transformation toughening, is sug- gested to account for the especially large increase in fracture energy with PBT inclusions. The first five, including the initiation of secondary fracture, are con- firmed for nylon 6-epoxy blends, but phase-trans- formation toughening seems not to occur. The first three are confirmed for PVDF-epoxy blends, with the crack path alteration and formation of steps and welts and secondary crack bridging accounting for an especially large part of the fracture energy.
The toughness of PBT-epoxy and nylon 6-epoxy blends seem to depend on the crack growth rate. As the crack growth rate increases, the fracture surfaces become smoother and the crack path alteration and initiation of secondary cracks become weaker.
The toughness of the PBT-epoxy blends seem to be independent of particle size for sizes in the range of tens of micrometres, but the nylon 6-epoxy blends seem to depend on particle size when smaller than about 40 gin. As the particle size of nylon increases, crack path alteration becomes weaker while the formation of secondary cracks becomes stronger.
173

Crack path alteration seems more effective for toughen- ing, therefore, than does the formation of secondary cracks. At least for PBT and PVDF, the dispersed particles appeared to consist of agglomerates of smal- ler particles, and this probably has reduced the effect- iveness from what it could be for these inclusions.
The interfacial strength between PVDF and epoxy was not strong enough to maintain bonding during fracture. Thus, complete debonding occurred on frac- ture. However, crack path alteration and the forma- tion of steps and welts are unusually strong. Because of them, the fracture surface of the blend is very rough and complex, irrespective of the crack growth rate.
Acknowledgements We acknowledge the useful discussions with our col- leagues, Professors I-Wei Chen and Albert Yee, and Dr Ray Pearson. This work was supported by the National Science Foundation through a Materials Research Group grant, DMR-8708405.
References 1. R . P . K A M B O U R , Macromol. Rev. 7 (1973) 1. 2. C .B. B U C K N A L L , Adv. Polym. Sci. 27 (1978) 121. 3. J .N. SULTAN, R.C. L A I B L E a n d F . J. M c G A R R Y , J. Appl.
Polym. Sci. 6 (1971) 127. 4. A. J. K I N L O C H , S. J. SHAW, D. A. TOD and D. L.
H U N S T O N , Polymer 24 (1983) 1341. 5. A.J . K I N L O C H , S. J. SHAW and D. L. H U N S T O N , ibid, 24
(1983) 1355. 6. R.A. PEARSON and A. F. YEE, J. Mater. Sci. 21 (1986) 2475. 7. A . F . YEE and R. A, PEARSON, ibid. 21 (1986) 2462, 8. A . J . K I N L O C H and D. L. H U N S T O N , J. Mater. Sci. Lett.
6 (1987) 137. 9. A.F . YEE and R. A. PEARSON, J. Mater. Sci. 24 (1989) 2571.
10, F . F . LANGE, Phil. Ma 9. 22 (1970) 839. 11. L .J . B R O U T M A N and S. SAHU, Mater. Sei. Engng 8 (1971)
98. 12. R.J . Y O U N G and P. W. R. B E A U M O N T , J. Mater. Sci. 12
(1977) 684. 13. J. S P A N O U D A K I S and R. J. YOUNG, ibid. 19 (1984) 473,
487, 14. A.J . K I N L O C H , D. L. MAXWELL and R. J. YOUNG, ibid.
20 (1985) 3797. 15. R.J . YOUNG, D. L. MAXWELL and A. J. K I N L O C H , ibid.
21 (1986) 380. 16. C . B . B U C K N A L L and L. K. PARTRIDGE, Polymer 24
(1983) 639. Idem, Polym. Engng Sci. 26 (1986) 54. N. CLAUSSEN, J. Amer. Ceram. Soc. 59 (1976) 49. D . L . PORTER and A. H. HEUER, ibid. 60 (1977) 183. A. G. EVANS and A. H. HEUER, ibid. 63 (1980) 241. R. M. M c M E E K I N G and A. G. EVANS, ibid. 65 (1982) 242. I-W. CHEN and P. E. REYES-MOREL, ibid. 69 (1986) 181. L. R. F. ROSS and M. V. SWAIN, ibid. 69 (1986) 203. A. MATTIUSSI , G. B. GE C HE L E and R. FRACNSCONI , J. Polym. Sci. A-2 7 (1969) 411. J. A. KIES and B. J. CLARK, in "Proceedings of the Second International Conference on Fracture", Brighton 1969, edited by P. L. Prat t (Chapman and Hall, London, 1969) p. 83.
17. 18. 19. 20. 21. 22. 23. 24.
25.
26. A . G . EVANS and S. M. W I E D E R H O R N , J. Mater. Sci, 9 (1974) 270.
27. G . G . TRANTINA, J. Amer. Ceram. Soc. 60 (1977) 7. 28. A .G. EVANS, L. R. RUSSELL and D. W. RICHARDSON,
Metall. Trans. A. 6A (1975) 707. 29. R . K . GOVILA, d. Amer. Ceram. Soc. 63 (1980) 319. 30. P . W . R . B E A U M O N T and R. J. YOUNG, J. Mater. Sci. 10
(1973) 1334. 31. R.J. Y O U N G and P. W. R. BEAUMONT, ibid. 12 (1977) 684. 32. S. YAMINI and R. J. YOUNG, ibid. 14 (1979) 1609. 33. J . M . SCOTT, G. M. WELLS and D. C. PHILLIPS, ibid. 15
(1980) 1436. 34. P .S . LEEVERS and J. G. WILLIAMS, ibid. 22 (1987) 1097. 35. W.J . CANTWELL, A. C. R O U L I N - M O L O N E Y and K. H.
KAUSCH, J. Mater. Sci. Lett. 7 (1988) 976. 36. A.S . HOLIK, R. P. K A M B O U R , S. Y. HOBBS and D. G.
FINK, Microstruct. Sci. 7 (1979) 357. 37. K . P . H E R R M A N N and L. H. LARSSON,"Frac ture o fnon-
metalic materials" (Reidel, Norwell, 1987). 38. R .E . ROBERTSON and V. E. M I N D R O I U , Polym. Engng
Sci. 27 (1987) 55. 39. A .G . EVANS, J. Mater. Sei. 9 (1974) 1145. 40. D.J . GREEN, P. S. N I C H O L S O N and J. D. EMBURY, ibid,
14 (1979) 1413. 41. I. M. WARD, M. A. W I L D I N G and H. J. BRODY,
J. Polym. Sci. Polym. Phys. Ed. 14 (1976) 41. 42. I . M . HALL and M. G. PASS, Polymer 17 (1976) 807. 43. M. Y O K O U C H I , Y. SAKAKIBARA, Y. CHATANI,
H. T A D O K O R O , T. TANAKA and K. YODA, Macromol. 9 (1976) 266.
44. B. STAMBAUGH, J. L. K O E N I G and J. B. LANDO, J. Polym. Sci. Polym. Phys, Ed. 17 (1979) 1063.
45. K. TASHIRO, Y. NAKAI, M. KOBAYASHI and H. T A D O K O R O , Macromol. 13 (1980) 137.
46. I. S. DAVIDSON, A. J. M A N U E L and I. M. WARD, Polymer 24 (1983) 30.
47. B.C. PERRY, J. L. K O E N I G and J. B. LANDO, Macromol. 20 (1987) 422.
48. B . C . PERRY, R. B. GRASSO, J. L. K O E N I G and J. B. LANDO, ibid. 22 (1989) 2014.
49. G. ROLDAN and H. S. K A U F M A N , J. Polym. Sei. B 1 (1963) 603.
50. J .P . PARKER and P. H. L INDENMEYER, J. AppL Polym. Sci. 21 (1977) 821.
51. V.G. BANKER, J. E. SPRUIELL and J. L. WHITE, ibid. 21 (1977) 2341.
52. R . F . STEPANIAK, A. GARTON, D. J. CARLSSON and D. M. WILES, J. Polym. Sci. Polym. Phys. Ed. 17 (1979) 987.
53. R . F . STEPANIAK, A. GARTON, D. J. CARLSSON and D. M. WILES, J. Appl. Polym. Sci. 23 (1979) 1747.
54. J . K . KIM and R. E. ROBERTSON, submitted to J. Mater. Sei.
55. W.W. DOLL and J. B. LANDO, J, Macromol. Sci. B2 (1968) 219.
56. R. HASEGAWA, M. KOBAYASHI and H. T A D O K O R O , Polym. J. 3 (1972) 591.
57. R. HASEGAWA, Y. TAKAHASHI , Y. CHATANI and H. T A D O K O R O , ibid. 3 (1972) 600.
58. K. MATSUSHIGE, K. NAGATA, S. IMADA and T, TAKEMURA, Polymer 21 (1980) 1391.
59. A. RICHARDSON, P. S. HOPE and I. M. WARD, J. Polym. Sci. Polym. Phys. Ed. 21 (1983) 2525.
60. H . W . SIESLER, ibid. 23 (1985) 2413. 61. T . C . HSU and P. H. GEIL, J. Mater. Sci. 24 (1989) 1219.
Received 13 August 1990 and accepted 25 February1991
174