total variable costs 40,000 marketing costs 5,000 special
TRANSCRIPT

© The McGraw-Hill Companies, Inc., 2003 McGraw-Hill/Irwin
Special Orders
Jet, Inc.
Contribution Income Statement
Revenue (5,000 × $20) 100,000$
Variable costs:
Direct materials 20,000$
Direct labor 5,000
Manufacturing overhead 10,000
Marketing costs 5,000
Total variable costs 40,000
Contribution margin 60,000
Fixed costs:
Manufacturing overhead 28,000$
Marketing costs 20,000
Total fixed costs 48,000 Net operating income 12,000$
$8 variable cost

© The McGraw-Hill Companies, Inc., 2003 McGraw-Hill/Irwin
Special Orders
If Jet accepts the offer, net operating income
will increase by $6,000.
Increase in revenue (3,000 × $10) 30,000$
Increase in costs (3,000 × $8 variable cost) 24,000
Increase in net income 6,000$
Note: This answer assumes that fixed costs are
unaffected by the order and that variable marketing
costs must be incurred on the special order.

© The McGraw-Hill Companies, Inc., 2003 McGraw-Hill/Irwin
Quick Check
Northern Optical ordinarily sells the X-lens for
$50. The variable production cost is $10, the
fixed production cost is $18 per unit, and the
variable selling cost is $1. A customer has
requested a special order for 10,000 units of the
X-lens to be imprinted with the customer’s logo.
This special order would not involve any selling
costs, but Northern Optical would have to
purchase an imprinting machine for $50,000.
(see the next page)

© The McGraw-Hill Companies, Inc., 2003 McGraw-Hill/Irwin
Quick Check
What is the rock bottom minimum price below
which Northern Optical should not go in its
negotiations with the customer? In other words,
below what price would Northern Optical
actually be losing money on the sale? There is
ample idle capacity to fulfill the order.
a. $50
b. $10
c. $15
d. $29

© The McGraw-Hill Companies, Inc., 2003 McGraw-Hill/Irwin
What is the rock bottom minimum price below
which Northern Optical should not go in its
negotiations with the customer? In other words,
below what price would Northern Optical
actually be losing money on the sale? There is
ample idle capacity to fulfill the order.
a. $50
b. $10
c. $15
d. $29
Quick Check
Variable production cost $100,000
Additional fixed cost 50,000
Total relevant cost $150,000
Number of units 10,000
Average cost per unit $15
© The McGraw-Hill Companies, Inc., 2003 McGraw-Hill/Irwin
Utilization of a Constrained
Resource
Firms often face the problem of deciding how
to best utilize a constrained resource.
Usually fixed costs are not affected by this
particular decision, so management can focus
on maximizing total contribution margin.
Let’s look at the Ensign Company example.
© The McGraw-Hill Companies, Inc., 2003 McGraw-Hill/Irwin
Source: Norfolk Southern

© The McGraw-Hill Companies, Inc., 2003 McGraw-Hill/Irwin Source: Norfolk Southern
© The McGraw-Hill Companies, Inc., 2003 McGraw-Hill/Irwin Source: Norfolk Southern
© The McGraw-Hill Companies, Inc., 2003 McGraw-Hill/Irwin
Utilization of a Constrained
Resource
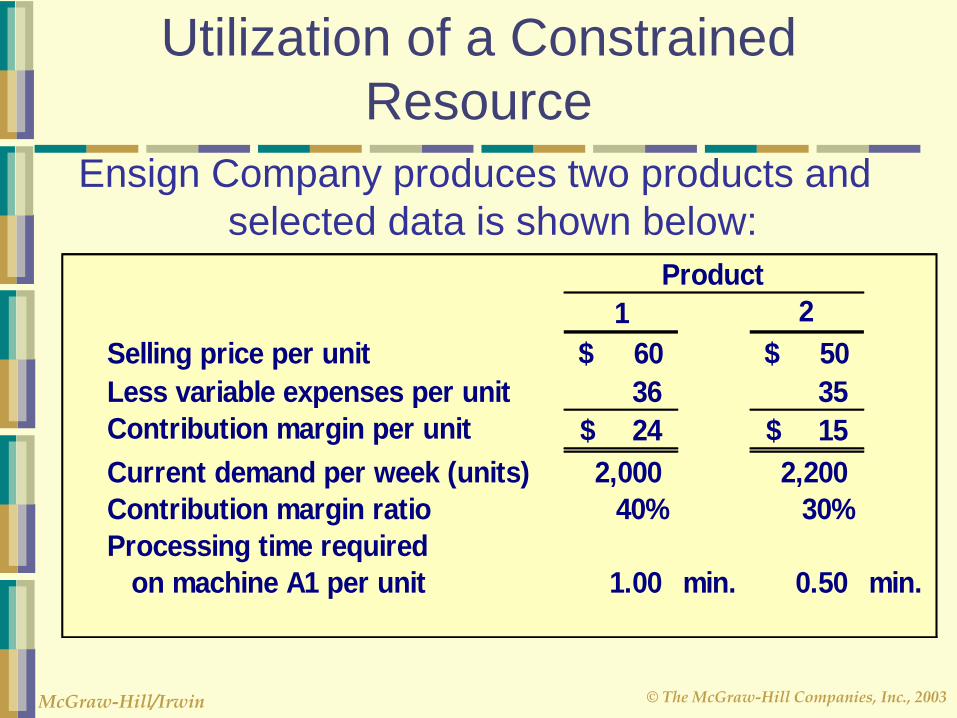
Ensign Company produces two products and
selected data is shown below:
Product
1 2
Selling price per unit $ 60 $ 50
Less variable expenses per unit 36 35
Contribution margin per unit 24$ 15$
Current demand per week (units) 2,000 2,200
Contribution margin ratio 40% 30%
Processing time required
on machine A1 per unit 1.00 min. 0.50 min.

© The McGraw-Hill Companies, Inc., 2003 McGraw-Hill/Irwin
Utilization of a Constrained
Resource
Machine A1 is the constrained resource and is being used at 100% of its capacity.
There is excess capacity on all other machines.
Machine A1 has a capacity of 2,400 minutes per week.
Should Ensign focus its efforts on Product 1 or 2?
© The McGraw-Hill Companies, Inc., 2003 McGraw-Hill/Irwin
Quick Check
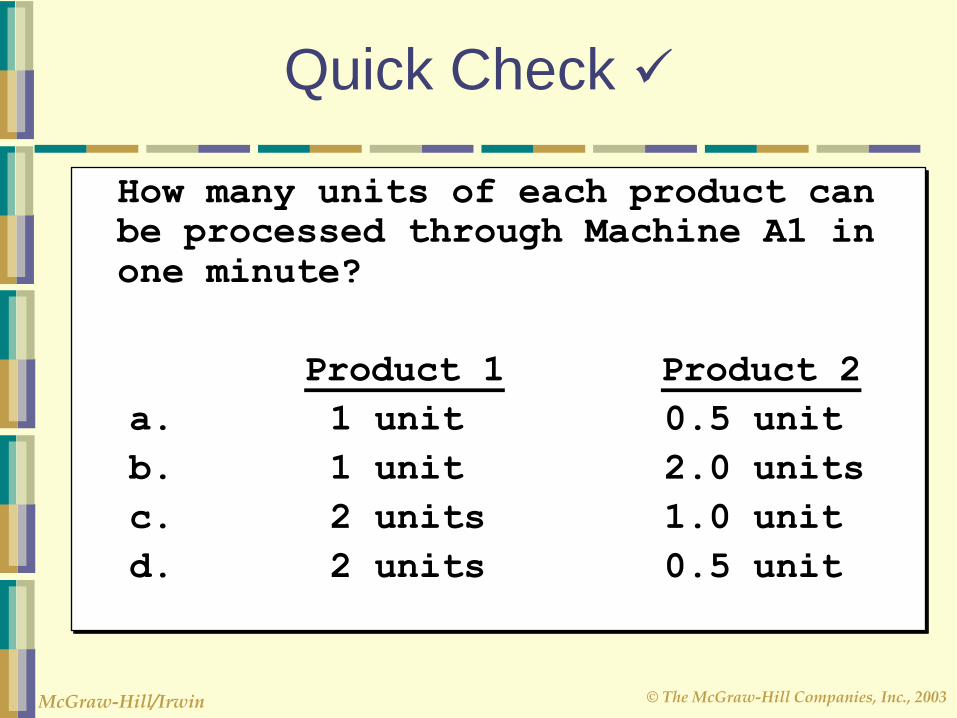
How many units of each product can be processed through Machine A1 in
one minute?
Product 1 Product 2
a. 1 unit 0.5 unit
b. 1 unit 2.0 units
c. 2 units 1.0 unit
d. 2 units 0.5 unit
© The McGraw-Hill Companies, Inc., 2003 McGraw-Hill/Irwin
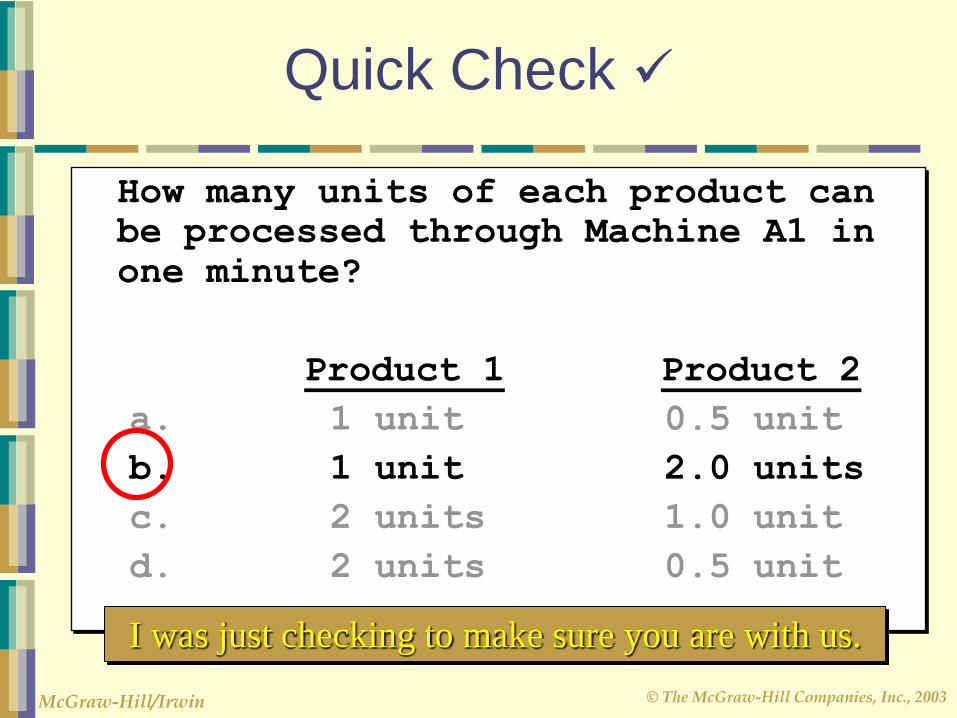
How many units of each product can be processed through Machine A1 in
one minute?
Product 1 Product 2
a. 1 unit 0.5 unit
b. 1 unit 2.0 units
c. 2 units 1.0 unit
d. 2 units 0.5 unit
Quick Check
I was just checking to make sure you are with us.

© The McGraw-Hill Companies, Inc., 2003 McGraw-Hill/Irwin
Quick Check
What generates more profit for the company,
using one minute of machine A1 to process
Product 1 or using one minute of machine A1 to
process Product 2?
a. Product 1
b. Product 2
c. They both would generate the same profit
d. Cannot be determined

© The McGraw-Hill Companies, Inc., 2003 McGraw-Hill/Irwin
What generates more profit for the company,
using one minute of machine A1 to process
Product 1 or using one minute of machine A1 to
process Product 2?
a. Product 1
b. Product 2
c. They both would generate the same profit
d. Cannot be determined
Quick Check
With one minute of machine A1, we could make 1 unit
of Product 1, with a contribution margin of $24, or 2
units of Product 2, each with a contribution margin of
$15. 2 × $15 > $24

© The McGraw-Hill Companies, Inc., 2003 McGraw-Hill/Irwin
Utilization of a Constrained
Resource
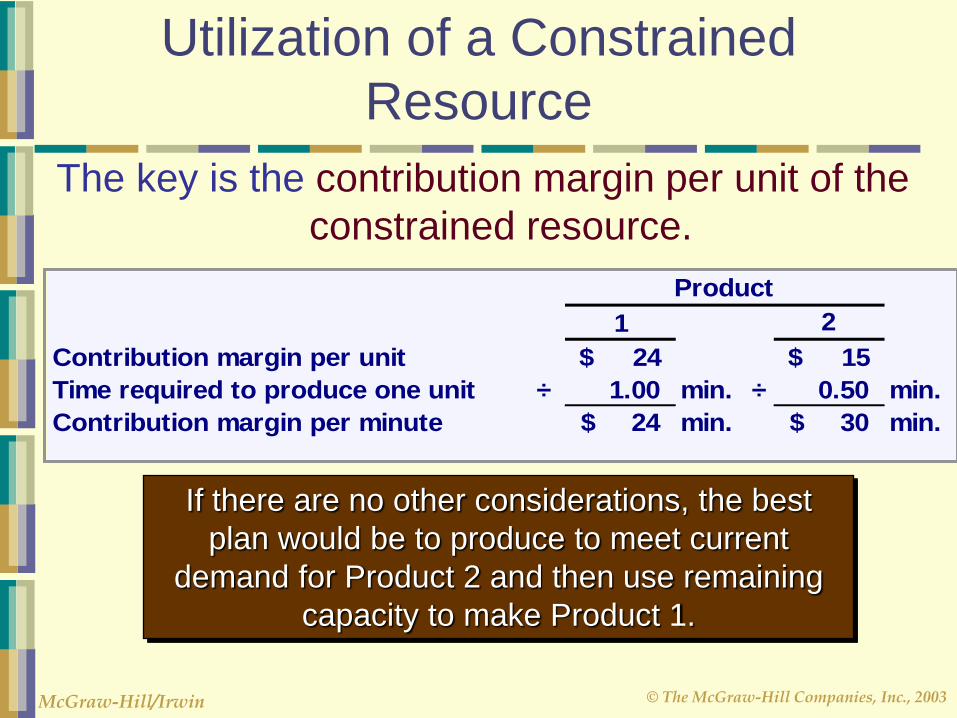
The key is the contribution margin per unit of the
constrained resource.
Product 2 should be emphasized. Provides more
valuable use of the constrained resource machine A1,
yielding a contribution margin of $30 per minute as
opposed to $24 for Product 1.
Product
1 2
Contribution margin per unit $ 24 $ 15
Time required to produce one unit ÷ 1.00 min. ÷ 0.50 min.
Contribution margin per minute 24$ min. 30$ min.
© The McGraw-Hill Companies, Inc., 2003 McGraw-Hill/Irwin
Utilization of a Constrained
Resource
If there are no other considerations, the best
plan would be to produce to meet current
demand for Product 2 and then use remaining
capacity to make Product 1.
Product
1 2
Contribution margin per unit $ 24 $ 15
Time required to produce one unit ÷ 1.00 min. ÷ 0.50 min.
Contribution margin per minute 24$ min. 30$ min.
The key is the contribution margin per unit of the
constrained resource.

© The McGraw-Hill Companies, Inc., 2003 McGraw-Hill/Irwin
Utilization of a Constrained
Resource
Let’s see how this plan would work. Alloting Our Constrained Recource (Machine A1)
Weekly demand for Product 2 2,200 units
Time required per unit × 0.50 min.
Total time required to make
Product 2 1,100 min.
© The McGraw-Hill Companies, Inc., 2003 McGraw-Hill/Irwin
Alloting Our Constrained Recource (Machine A1)
Weekly demand for Product 2 2,200 units
Time required per unit × 0.50 min.
Total time required to make
Product 2 1,100 min.
Total time available 2,400 min.
Time used to make Product 2 1,100 min.
Time available for Product 1 1,300 min.
Utilization of a Constrained
Resource
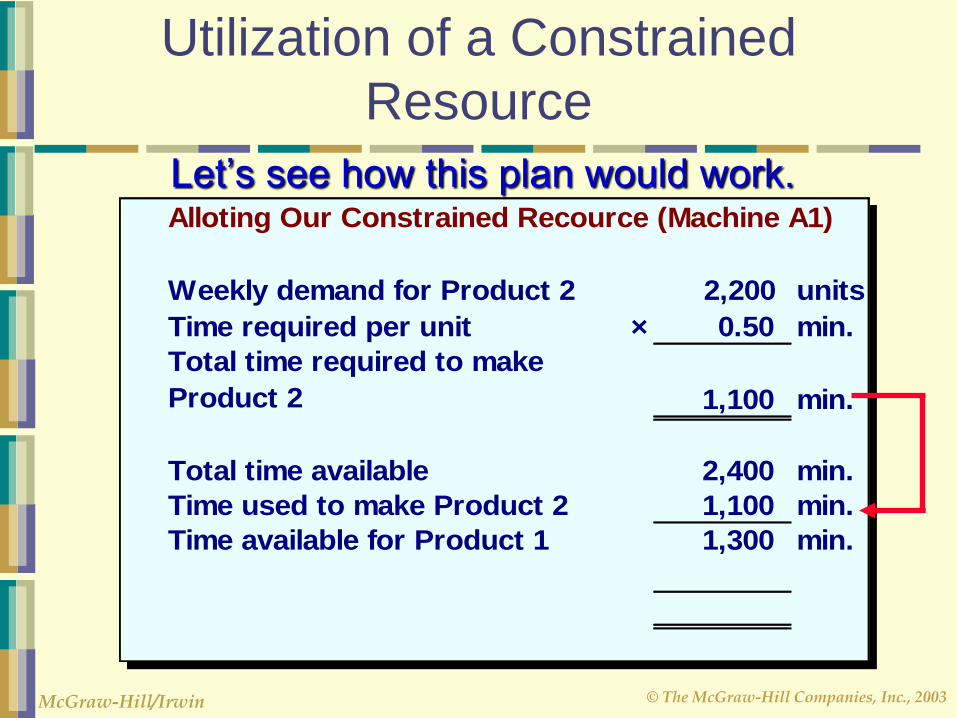
Let’s see how this plan would work.

© The McGraw-Hill Companies, Inc., 2003 McGraw-Hill/Irwin
Utilization of a Constrained
Resource
Let’s see how this plan would work. Alloting Our Constrained Recource (Machine A1)
Weekly demand for Product 2 2,200 units
Time required per unit × 0.50 min.
Total time required to make
Product 2 1,100 min.
Total time available 2,400 min.
Time used to make Product 2 1,100 min.
Time available for Product 1 1,300 min.
Time required per unit ÷ 1.00 min.Production of Product 1 1,300 units

© The McGraw-Hill Companies, Inc., 2003 McGraw-Hill/Irwin
Utilization of a Constrained
Resource
According to the plan, we will produce 2,200
units of Product 2 and 1,300 of Product 1.
Our contribution margin looks like this.
Product 1 Product 2
Production and sales (units) 1,300 2,200
Contribution margin per unit 24$ 15$
Total contribution margin 31,200$ 33,000$
The total contribution margin for Ensign is $64,200.

© The McGraw-Hill Companies, Inc., 2003 McGraw-Hill/Irwin
Quick Check
Colonial Heritage makes reproduction colonial
furniture from select hardwoods.
The company’s supplier of hardwood will only
be able to supply 2,000 board feet this month. Is
this enough hardwood to satisfy demand?
a. Yes
b. No
Chairs Tables Selling price per unit $80 $400 Variable cost per unit $30 $200 Board feet per unit 2 10 Monthly demand 600 100

© The McGraw-Hill Companies, Inc., 2003 McGraw-Hill/Irwin
Colonial Heritage makes reproduction colonial
furniture from select hardwoods.
The company’s supplier of hardwood will only
be able to supply 2,000 board feet this month. Is
this enough hardwood to satisfy demand?
a. Yes
b. No
Chairs Tables Selling price per unit $80 $400 Variable cost per unit $30 $200 Board feet per unit 2 10 Monthly demand 600 100
Quick Check
2 600 + 10 100 = 2,200 > 2,000

© The McGraw-Hill Companies, Inc., 2003 McGraw-Hill/Irwin
Quick Check
The company’s supplier of hardwood will only be
able to supply 2,000 board feet this month. What
plan would maximize profits?
a. 500 chairs and 100 tables
b. 600 chairs and 80 tables
c. 500 chairs and 80 tables
d. 600 chairs and 100 tables
Chairs Tables Selling price per unit $80 $400 Variable cost per unit $30 $200 Board feet per unit 2 10 Monthly demand 600 100

© The McGraw-Hill Companies, Inc., 2003 McGraw-Hill/Irwin
The company’s supplier of hardwood will only be
able to supply 2,000 board feet this month. What
plan would maximize profits?
a. 500 chairs and 100 tables
b. 600 chairs and 80 tables
c. 500 chairs and 80 tables
d. 600 chairs and 100 tables
Quick Check
Chairs Tables Selling price per unit $80 $400 Variable cost per unit $30 $200 Board feet per unit 2 10 Monthly demand 600 100
Chairs Tables
Selling price 80$ 400$
Variable cost 30 200
Contribution margin 50$ 200$
Board feet 2 10
CM per board foot 25$ 20$
Production of chairs 600
Board feet required 1,200
Board feet remaining 800
Board feet per table 10
Production of tables 80
© The McGraw-Hill Companies, Inc., 2003 McGraw-Hill/Irwin
Quick Check
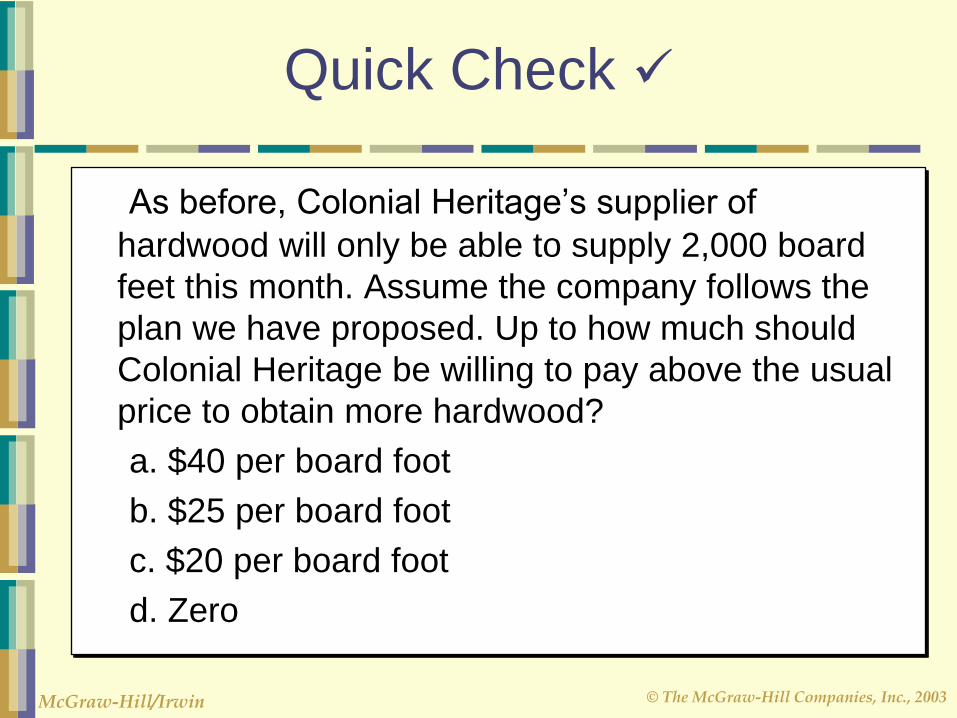
As before, Colonial Heritage’s supplier of
hardwood will only be able to supply 2,000 board
feet this month. Assume the company follows the
plan we have proposed. Up to how much should
Colonial Heritage be willing to pay above the usual
price to obtain more hardwood?
a. $40 per board foot
b. $25 per board foot
c. $20 per board foot
d. Zero
© The McGraw-Hill Companies, Inc., 2003 McGraw-Hill/Irwin
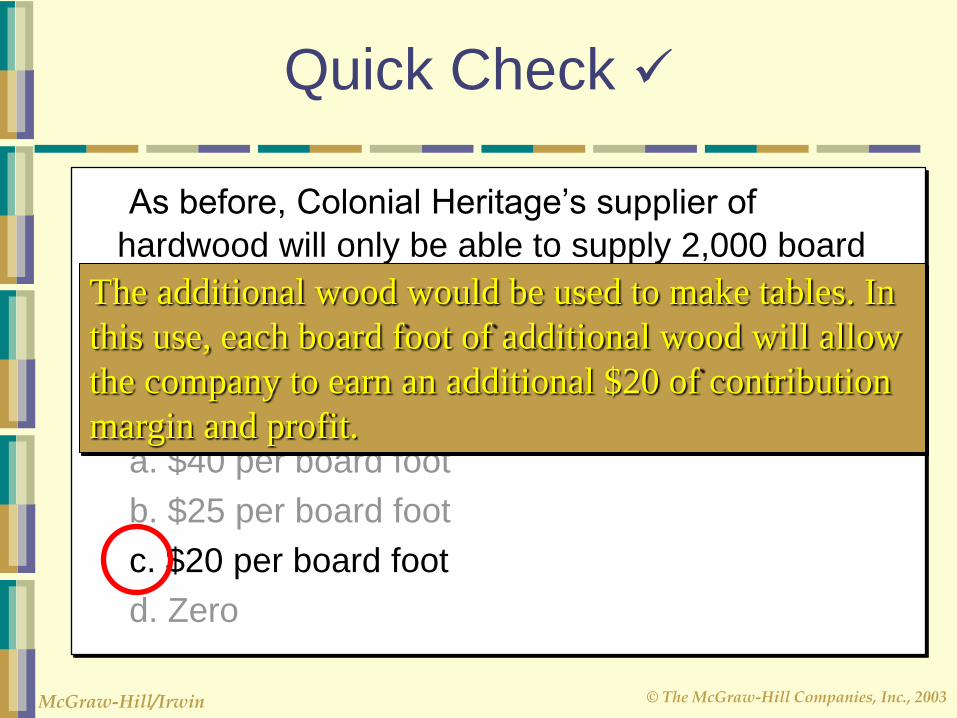
As before, Colonial Heritage’s supplier of
hardwood will only be able to supply 2,000 board
feet this month. Assume the company follows the
plan we have proposed. Up to how much should
Colonial Heritage be willing to pay above the usual
price to obtain more hardwood?
a. $40 per board foot
b. $25 per board foot
c. $20 per board foot
d. Zero
Quick Check
The additional wood would be used to make tables. In
this use, each board foot of additional wood will allow
the company to earn an additional $20 of contribution
margin and profit.
© The McGraw-Hill Companies, Inc., 2003 McGraw-Hill/Irwin
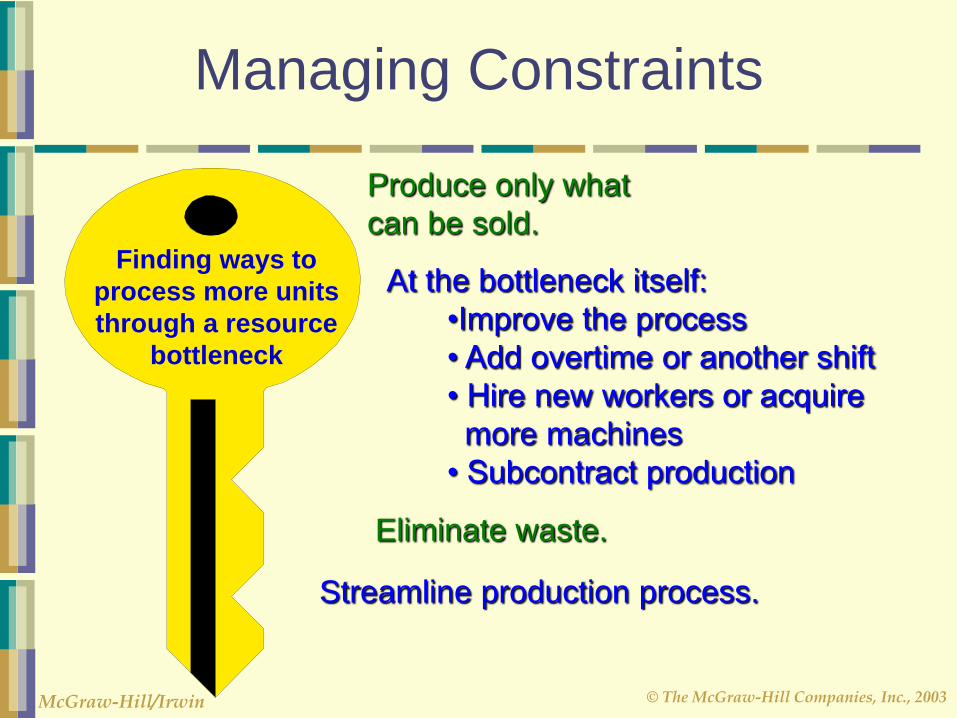
Managing Constraints
Finding ways to
process more units
through a resource
bottleneck
Produce only what
can be sold.
Streamline production process.
Eliminate waste.
At the bottleneck itself:
•Improve the process
• Add overtime or another shift
• Hire new workers or acquire
more machines
• Subcontract production

© The McGraw-Hill Companies, Inc., 2003 McGraw-Hill/Irwin
Joint Costs
In some industries, a number of end
products are produced from a single raw
material input.
Two or more products produced from a
common input are called joint products.
The point in the manufacturing process
where each joint product can be recognized
as a separate product is called the split-off
point.

© The McGraw-Hill Companies, Inc., 2003 McGraw-Hill/Irwin
Joint Products
Joint
Input
Common
Production
Process
Split-Off
Point
Joint
Costs Oil
Gasoline
Chemicals

© The McGraw-Hill Companies, Inc., 2003 McGraw-Hill/Irwin
Joint Products
Separate
Processing
Separate
Processing
Final
Sale
Final
Sale
Final
Sale
Separate
Product
Costs
Joint
Input
Common
Production
Process
Split-Off
Point
Joint
Costs Oil
Gasoline
Chemicals

© The McGraw-Hill Companies, Inc., 2003 McGraw-Hill/Irwin
Which one sells for $82.00 ?

© The McGraw-Hill Companies, Inc., 2003 McGraw-Hill/Irwin
The Pitfalls of Allocation
Joint costs are really
common costs incurred to
simultaneously produce a
variety of end products.
Joint costs are often
allocated to end products on
the basis of the relative
sales value of each product
or on some other basis.
© The McGraw-Hill Companies, Inc., 2003 McGraw-Hill/Irwin
It will always profitable to continue
processing a joint product after the split-
off point so long as the incremental
revenue exceeds the incremental
processing costs incurred after the split-
off point.
Let’s look at the Sawmill, Inc. example.
Sell or Process Further

© The McGraw-Hill Companies, Inc., 2003 McGraw-Hill/Irwin
Sell or Process Further
Sawmill, Inc. cuts logs from which
unfinished lumber and sawdust are the
immediate joint products.
Unfinished lumber is sold “as is” or
processed further into finished lumber.
Sawdust can also be sold “as is” to
gardening wholesalers or processed further
into “presto-logs.”

© The McGraw-Hill Companies, Inc., 2003 McGraw-Hill/Irwin
Sell or Process Further
Data about Sawmill’s joint products includes:
Per Log
Lumber Sawdust
Sales value at the split-off point 140$ 40$
Sales value after further processing 270 50
Allocated joint product costs 176 24
Cost of further processing 50 20

© The McGraw-Hill Companies, Inc., 2003 McGraw-Hill/Irwin
Sell or Process Further
Analysis of Sell or Process Further
Per Log
Lumber Sawdust
Sales value after further processing 270$ 50$
Sales value at the split-off point 140 40
Incremental revenue 130 10

© The McGraw-Hill Companies, Inc., 2003 McGraw-Hill/Irwin
Sell or Process Further
Analysis of Sell or Process Further
Per Log
Lumber Sawdust
Sales value after further processing 270$ 50$
Sales value at the split-off point 140 40
Incremental revenue 130 10
Cost of further processing 50 20 Profit (loss) from further processing 80$ (10)$
Should we process the lumber further
and sell the sawdust “as is?”
© The McGraw-Hill Companies, Inc., 2003 McGraw-Hill/Irwin
End of Chapter 13

© The McGraw-Hill Companies, Inc., 2003 McGraw-Hill/Irwin

© The McGraw-Hill Companies, Inc., 2003 McGraw-Hill/Irwin

© The McGraw-Hill Companies, Inc., 2003 McGraw-Hill/Irwin
Everything in moderation ….