total ionizing dose testing of the orion and phoenix …€¦ · total ionizing dose testing of the...
TRANSCRIPT
Space Flight Technology, German Space Operations Center (GSOC)
Deutsches Zentrum für Luft- und Raumfahrt (DLR) e.V.
Total Ionizing Dose Testing of the Orion and Phoenix GPS Receivers
M. Markgraf, O. Montenbruck
Doc. No. : TN 04-01
Version : 1.0
Date : Feb. 18, 2004

Document Title: ii Total Ionizing Dose Testing of the Orion and Phoenix GPS Receivers
Document Change Record
Issue Date Pages Description of Change 0.9 Jan. 10, 2004 All Draft issue 1.0 Feb. 18, 2004 All Editorial corrections and 1st official release
Document No. Issue 1.0 TN 04-01
DLR/GSOC No part of this document shall be reproduced in any form or disclosed to third parties without prior authorization.
Feb. 18, 2004

Document Title: iii Total Ionizing Dose Testing of the Orion and Phoenix GPS Receivers
Table of Contents
Document Change Record ....................................................................................................ii Table of Contents ..................................................................................................................iii Scope.......................................................................................................................................1 1. Introduction.......................................................................................................................3 2. Space Radiation and Its Effects on Electronic Systems...............................................4
2.1 Space Radiation Environment....................................................................................4 2.2 Radiation Effects on Electronic Systems....................................................................7
3. GPS Receiver Description ...............................................................................................9 3.1 Orion GPS Receiver...................................................................................................9 3.2 Phoenix GPS Receiver.............................................................................................10
4. Test Setup and Operations ............................................................................................12 5. Results and Analysis......................................................................................................17
5.1 Current Drain and Total Dose Tolerance .................................................................17 5.2 Oscillator Drift ...........................................................................................................19
6. Signal Tracking and Navigation Accuracy ...................................................................22 6.1 Carrier-to-Noise Ration ............................................................................................22 6.2 Signal Tracking and Navigation Accuracy................................................................23 6.3 Raw Data Evaluation................................................................................................26
7. Post-Radiation Receiver Evaluation .............................................................................31 Summary and Conclusions .................................................................................................33 Acknowledgement................................................................................................................34 Notation and Symbols .........................................................................................................35 References ............................................................................................................................36
Document No. Issue 1.0 TN 04-01
DLR/GSOC No part of this document shall be reproduced in any form or disclosed to third parties without prior authorization.
Feb. 18, 2004

Document Title: iv Total Ionizing Dose Testing of the Orion and Phoenix GPS Receivers
Document No. Issue 1.0 TN 04-01
DLR/GSOC No part of this document shall be reproduced in any form or disclosed to third parties without prior authorization.
Feb. 18, 2004

Document Title: 1 Total Ionizing Dose Testing of the Orion and Phoenix GPS Receivers
Scope
This note addresses a series of GPS hardware total dose radiation tests conducted at the Fraunhofer Institute for Technological Trend Analysis (FhG/INT) in Euskirchen. In the frame-work of these tests several Orion and Phoenix GPS receivers developed by DLR/GSOC for high dynamics and space applications have been evaluated. Following a brief introduction to the space radiation environment, a detailed description of the simulation setup and operation is provided. Furthermore, the obtained test results and performed analyses are presented within this note.
Document No. Issue 1.0 TN 04-01
DLR/GSOC No part of this document shall be reproduced in any form or disclosed to third parties without prior authorization.
Feb. 18, 2004

Document Title: 2 Total Ionizing Dose Testing of the Orion and Phoenix GPS Receivers
Document No. Issue 1.0 TN 04-01
DLR/GSOC No part of this document shall be reproduced in any form or disclosed to third parties without prior authorization.
Feb. 18, 2004

Document Title: 3 Total Ionizing Dose Testing of the Orion and Phoenix GPS Receivers
1. Introduction Leaving the Earth’s protective shield, the atmosphere, every object is inevitably exposed to an extremely high level of natural radiation, considerably above the radiation dose encoun-tered in terrestrial applications. This space radiation interacts with electronic systems used onboard satellites in various, mostly unfavorable and often destructive ways and is thus a major concern for any space mission.
While industry has developed various technologies to harden or even immunize semiconduc-tors against radiation effects, appropriate components are often unavailable or non-suitable for specific applications. Aside from their prohibitive cost, space-qualified versions of indus-trial components rarely represent state of the art microelectronics. Hence, commercial-off-the-shelf (COTS) parts are of growing interest and widely used for the design of electronic systems in low cost satellite projects. The utilization and application of COTS components, however, requires a thorough testing and understanding of the reliability and failure mecha-nisms associated with the selected devices [1].
Motivated by the above considerations, a series of total ionizing dose (TID) radiation test has been carried out for two types of spaceborne GPS receivers. The Orion and Phoenix receiver are based on a terrestrial receiver design that has been modified for space applications by DLR/GSOC. While the receiver software has been suitably adapted for the high signal dy-namics encountered in low Earth satellite orbits or sounding rockets, the receiver hardware is entirely base on COTS technology and therefore susceptible to radiation damage.
Other than previous GPS receiver tests that have been confined to the study of key electrical parameters, the present radiation tests have been performed under realistic signal condi-tions. Throughout each test the receiver was connected to an outside antenna and a refer-ence receiver was furthermore operated in a zero-baseline configuration. This approach for the first time allowed a qualitative and quantitative assessment of the impact of space radia-tion onto the tracking performance and the navigation accuracy of a GPS sensor and a study of radiation induced oscillator variations.
In the subsequent chapter a brief introduction to the nature of the near-Earth space environ-ment is given with regard to space radiation and its impact on electronic system. The investi-gated GPS receivers and their architecture as well as the key electronic components are addressed in Chap. 3. Chap. 4 to 6, describe the test setup and operation and present the obtained results and their analysis. Chap. 7, finally, summarizes the post-radiation receiver tests carried out to assess annihilation effects in the weeks after the test.
Document No. Issue 1.0 TN 04-01
DLR/GSOC No part of this document shall be reproduced in any form or disclosed to third parties without prior authorization.
Feb. 18, 2004

Document Title: 4 Total Ionizing Dose Testing of the Orion and Phoenix GPS Receivers
2. Space Radiation and Its Effects on Electronic Systems
2.1 Space Radiation Environment
The near-earth space radiation environment, and only this is addressed in this note, can principally be divided into two categories: the trapped particle environment and the transient radiation environment.
Trapped Environment
As a result of the interaction between Earth’s magnetosphere and radiation in space, charged particles are trapped in the Earth’s dipole field and their motion is subsequently con-fined to certain doughnut shaped regions above the equator. The trapped particles gyrate around the magnetic field lines and bounce along them, reflected back and forth between pairs of conjugate mirror points in opposite hemisphere. Due to their charge and the radial gradient in the magnetic field they are subject to a drift around the Earth, in eastward direc-tion for electrons and in opposite direction for protons [2] (Fig. 2.1).
Fig 2.1 The basic motions of trapped particles in the Earth's magnetic field [3]
The existence of different radiation belts has been discovered by J.A. Van Allen in 1958 [2] Accordingly these particle rings became known as the “Van Allen Belts”. The belts mainly consist of ionized gas (or plasma). Nominally the Earth is surrounded by three toroidal parti-cle regions, two electron belts (inner and outer zone) and one proton belt. The inner electron belt ranges from approximately 500 km to 11.000 km in altitude whereas the outer electron belt stretches from roughly 13.000 km in altitude to 70,000 km. These zones are populated with electrons that have a typical energy of up to 5 MeV for the inner belt and up to 7 MeV for the outer ring. The proton belt extends from approximately 500 km altitude to about 18 000 km. The energy of the trapped protons can ranges from a few MeV to several hundred MeV. Other than for the electron rings, higher particle energies are more often encountered in the inner regions of the proton belt [4]. Figure 2.2 gives an artist’s impression of the regions in space occupied by the two electron belts. For completeness, however, it has to be men-tioned that large solar events can temporarily change this configuring in a dramatic way. In the past, deformations up to the emergence of new electron and proton rings were observed during sever solar storms.
Document No. Issue 1.0 TN 04-01
DLR/GSOC No part of this document shall be reproduced in any form or disclosed to third parties without prior authorization.
Feb. 18, 2004

Document Title: 5 Total Ionizing Dose Testing of the Orion and Phoenix GPS Receivers
Fig 2.2 Schematic view of the Earth and its magnetic field lines (dotted) with the two electron belts discovered by Van Allen (not to scale) [5]
Transient Environment
The transient radiation environment consists of three basic radiation components: solar wind, solar flares and galactic cosmic rays (GCR),
which do not only exist in the near-Earth environment but also fill the entire solar system. The solar wind is an ionized gas primarily composed of low energetic electrons, protons and to a minor extend alpha particles. Due to the insignificant energy level of electrons (1 KeV) and protons (30 eV) compared to other radiation sources, solar wind generally has a negligi-ble impact on electronic systems operated in space.
In the following context the term solar flare is used representatively for all types of solar events. In most flares the majority of the radiated particles are protons (90-95%) and alpha particles while the number of emitted heavy ion particles is considerably smaller. During se-vere solar events the number of emitted protons and alpha particles can reach values of up to 104 times higher than observed in phases of moderate Sun activity. Furthermore, a notable rise in the magnitude of emitted heavy ion particles is normally encountered and hence also a significant increase of heavy ions in the near-Earth environment. This temporary abun-dance of heavy ion particles subsequent to solar eruptions can seriously affect electronic systems operated onboard satellites. Whenever an increased number of satellite anomalies or failure has been reported in the past, this phenomenon could mostly be attributed to a solar event that occurred briefly before. To a very large extent, the encountered problems in the electronic systems are due to single event effects (SEE) caused by the impact of single heavy ion particles. LEO satellites, however, receive a significant screening against charge particles by the magnetic field of Earth. Charged particles impacting into and travelling through the magnetosphere are absorbed or experience a change in their trajectory. The penetration depth of a particle strongly depends on its energy level. For completeness it needs to be mentioned that satellites in equatorial orbits or orbits with low inclination are
Document No. Issue 1.0 TN 04-01
DLR/GSOC No part of this document shall be reproduced in any form or disclosed to third parties without prior authorization.
Feb. 18, 2004

Document Title: 6 Total Ionizing Dose Testing of the Orion and Phoenix GPS Receivers
shielded much more effectively than space vehicles in near polar orbits because of the spe-cific shape of the magnetic field. While the first two radiation types are solar-induced, the galactic cosmic radiation appears to exist uniformly and omni-directionally in the entire galaxy. The origin of this radiation is a yet unresolved question, but it is well-know that GCR mainly consist of electrons, protons and heavy ions in extreme cases with energies of up to several GeV. The incident particle flux, however, decreases rapidly with increased particle energy. Thus particles with an extremely high energy are extremely rare and their contribution to anomalies in electrical systems can be considered minor. As with solar flare particles, the entire GCR (high and low energy parti-cles) is affected by the Earth’s magnetic field. Again, satellites in low orbits receive a signifi-cant shielding compared to space vehicles in high altitude orbits.
It has once again to be stressed that the near-Earth radiation environment must be consid-ered to be extremely inhomogeneous. The radiation intensity as well as the particle distribu-tion are highly variable in time and location. On the one hand, the Sun’s activity has an im-portant impact onto the “space weather” around Earth. Although anomalies due to solar events are only of temporary nature they pose a major threat to electronic systems because of their unpredictability and the short time required to reach Earth.
On the other hand, the Van Allen Belts are subject to a permanent deformation, caused by the offset and tilt of the geomagnetic axis with respect to the Earth's rotation axis and the resulting anomalies in the Earth’s magnetic field. These anomalies are confined to certain regions on the globe and known as “South Atlantic” anomaly and “Southeast Asia” anomaly. While the field lines are higher in altitude over southeast Asia, thus shifting the Van Allen belts to higher regions, the reverse is true above the Brazilian coast. The magnetic field is apparently depressed towards the earth’s surface. There, the Van Ellen Belts reach lower altitudes and can even extend down into the atmosphere. This anomaly is considered to be the dominating source for the accumulated radiation dose observed by LEO satellites. For satellites flying in higher orbits, however, this effect fades in importance.
A further anomaly grows increasingly dominant in orbits above an approximate height of 1000 km. In higher altitudes the dipole like magnetic field is deformed considerably by inter-action with the solar particle flux. It is compressed at the day side by the pressure of the solar wind and elongated at the night side. This deformation, however, affects only satellites in very high altitudes or vehicles following an highly elliptical trajectory.
To arrive at a reliable prediction for the amount and type of natural radiation that a satellite will be exposed to during his life-time in space, detailed model-based computer simulations have to be carried out as part of the satellite’s design phase. To this end, ESA, NASA and other research institutions have developed and made available a great variety of computer models [6,7] for space radiation covering both, best and worst case scenarios (cf. Fig. 2.3). Due to their highly unpredictable nature, however, the occurrence of certain events (e.g. the impact of a high energetic practical) can only be evaluated in a statistical manner. Thus, adequate precautions against this kind of radiation effects need to be taken from the very beginning of operation in space, even if the simulation reveals only a small probability of such events.
Document No. Issue 1.0 TN 04-01
DLR/GSOC No part of this document shall be reproduced in any form or disclosed to third parties without prior authorization.
Feb. 18, 2004
Document Title: 7 Total Ionizing Dose Testing of the Orion and Phoenix GPS Receivers
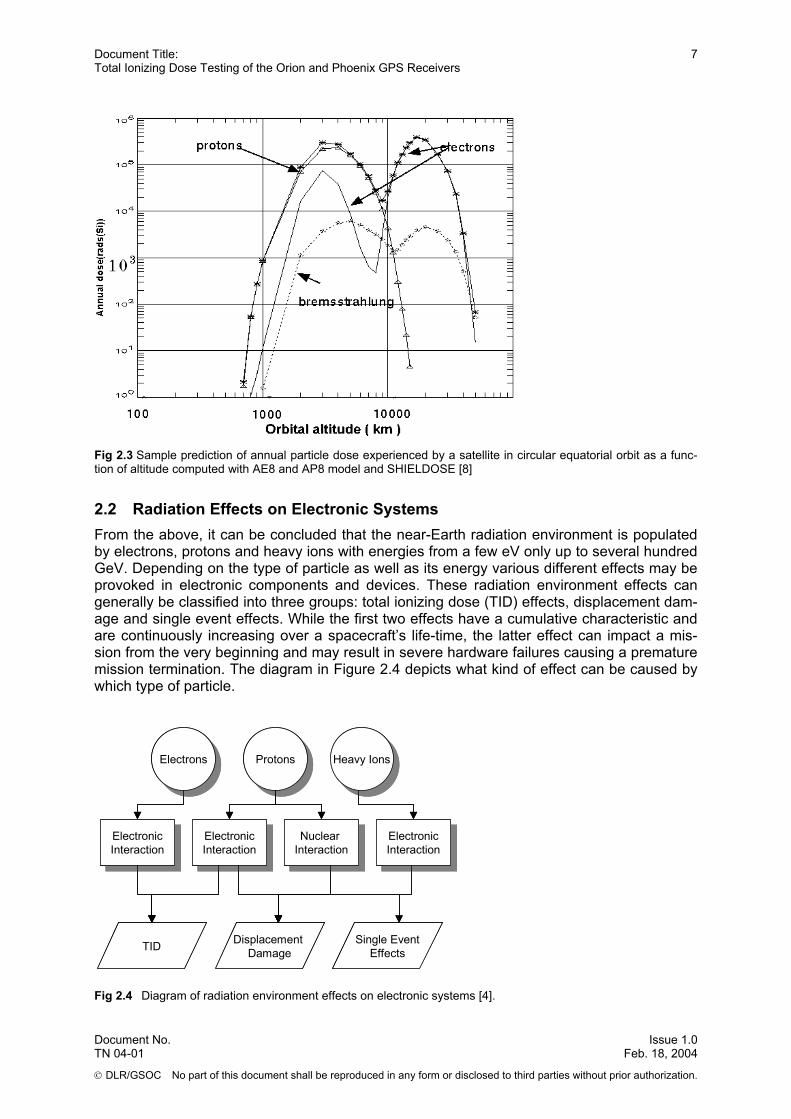
Fig 2.3 Sample prediction of annual particle dose experienced by a satellite in circular equatorial orbit as a func-tion of altitude computed with AE8 and AP8 model and SHIELDOSE [8]
2.2 Radiation Effects on Electronic Systems From the above, it can be concluded that the near-Earth radiation environment is populated by electrons, protons and heavy ions with energies from a few eV only up to several hundred GeV. Depending on the type of particle as well as its energy various different effects may be provoked in electronic components and devices. These radiation environment effects can generally be classified into three groups: total ionizing dose (TID) effects, displacement dam-age and single event effects. While the first two effects have a cumulative characteristic and are continuously increasing over a spacecraft’s life-time, the latter effect can impact a mis-sion from the very beginning and may result in severe hardware failures causing a premature mission termination. The diagram in Figure 2.4 depicts what kind of effect can be caused by which type of particle.
ElectronsElectrons ProtonsProtons Heavy IonsHeavy Ions
ElectronicInteraction
ElectronicInteraction
ElectronicInteraction
ElectronicInteraction
Nuclear Interaction
Nuclear Interaction
ElectronicInteraction
ElectronicInteraction
TID Displacement Damage
Single EventEffects
ElectronsElectrons ProtonsProtons Heavy IonsHeavy Ions
ElectronicInteraction
ElectronicInteraction
ElectronicInteraction
ElectronicInteraction
Nuclear Interaction
Nuclear Interaction
ElectronicInteraction
ElectronicInteraction
TID Displacement Damage
Single EventEffects
Fig 2.4 Diagram of radiation environment effects on electronic systems [4].
Document No. Issue 1.0 TN 04-01
DLR/GSOC No part of this document shall be reproduced in any form or disclosed to third parties without prior authorization.
Feb. 18, 2004

Document Title: 8 Total Ionizing Dose Testing of the Orion and Phoenix GPS Receivers
Supplementary to the above, it has to be noted that even if not directly involved in an in-crease of the TID, highly energetic proton and heavy ions do still indirectly contribute to the accumulated radiation dose. This is a result of the so-called secondary radiation which is induced by an interaction of high energy particles with matter surrounding the electronic cir-cuits. Secondary radiation, in turn, contributes to an increase of the absorbed TID. One of the most significant type of secondary radiation is the bremsstrahlung which is generated by the deceleration of high energetic electrons hitting e.g. the shielding.
In this section, merely the total ionizing dose effects are discussed since only these effects have been assessed within the conducted hardware tests. The total ionizing dose is a meas-ure of the accumulated amount of ionizing radiation to which a satellite or a specific elec-tronic component was exposed during its life-time. The absorbed dose is normally expressed in the unit of rad1. TID is known to cause cumulative damage in electronic components, usu-ally resulting in a deviation of the component parameters from their specified values. While passive components, such as resistors, capacitors, inductors and transformers are almost immune against space radiation, active components such as integrated circuits, oscillators, diodes and bipolar transistors are generally affected by the natural space radiation. Encoun-tered effects can range from threshold shift, device leakage, increased power consumption and timing changes up to a complete loss of functionality [9]. The susceptibility of active and particularly semi-conductor components to such parameter changes depends predominately on their design, the used materials and the technology employed for the manufacturing proc-ess. A general statement regarding the expected lifetime of a specific component in space, however, is not feasible unless comprehensive radiation tests have been carried out.
Total ionizing dose may be effectively reduced by applying shielding, whereby the skin of the satellite and the solar cells already provide a minimum protection. While shielding is consid-ered as an adequate measure against electrons and low energy particles, it is almost ineffec-tive for radiation consisting of high energy protons or heavy ions. Moreover, shielding be-comes even counterproductive beyond a certain point because of the secondary radiation induced by high energy charged particles penetrating the spacecraft (see above).
Last but not least, a fundamental difficulty of TID testing needs to be emphasized. Within a TID test the applied dose rate is generally far higher than in real life in order to achieve a specified total dose within the limited time frame of a few hours or days. This considerably increased dose rate can affect the test electronic in a more harmful way than during normal operation in space. Therefore, degradation effects on a component level or system malfunc-tions can occur at a much earlier stage than in a true space environment and the accelerated TID test can thus be considered as a worst case situation. In some cases, however, the in-verse becomes true. Occasionally, it has been demonstrated that less intensive radiation doses can induce an even stronger degradation for certain components than higher dose rates. For some poorly understood reason, the damage actually appears to be more cumula-tive in this case and obviously results in earlier component failure. It’s highly recommended to accurately account for the above differences between reality and simulation in the selec-tion of electronic components. This can be done e.g. by simply increasing the applied safety margins for all COTS components.
TN 04-01
DLR/GSOC No part of this document shall be reproduced in any form or disclosed to third parties without prior authorization.
1 radiation absorbed dose: Amount of radiation required to deposit a certain amount of energy in a specific sub-stance (e.g. silicon). In SI units, the absorbed dose is the gray which is 1 J/kg. (100 rad = 1 gray [Gy])
Document No. Issue 1.0 Feb. 18, 2004

Document Title: 9 Total Ionizing Dose Testing of the Orion and Phoenix GPS Receivers
3. GPS Receiver Description
As stated above, two slightly different types of GPS receivers have been examined during the test campaign, the GPS Orion receiver and the Phoenix receiver. Both receivers operate a tracking and navigation software specifically designed for high-dynamics and space appli-cations but are exclusively based on COTS components. In the sequel, a brief description of both systems is provided, addressing the key characteristics of each receiver. Moreover a summary of all utilized semi-conductor components is given which are potentially affected by total dose radiation effects.
3.1 Orion GPS Receiver The Orion receiver hardware (Fig. 3.1) has been built by DLR/GSOC following the prototype design of a terrestrial 12 channel L1 C/A-code GPS receiver made available by Mitel Semi-conductor.
Fig. 3.1 The Orion receiver main board (top) and interface unit (bottom) with a total dimension of 95 mm x 50 mm x 30 mm.
The receiver employs the GP2000 chip set of Mitel (now Zarlink), which comprises the GP2015 R/F down converter and the DW9255 SAW filter, the GP2021 correlator IC and a 32-bit ARM60 RISC micro-processor [10,11]. In addition to the above components the re-ceiver main board holds a temperature compensated crystal oscillator (TCXO) providing the 10 MHz reference frequency as well as SRAM and EPROM memory devices for storage of the receiver application code and run-time data. Optionally, the main board can be supple-mented by an equally-sized interface board providing voltage regulation, two bi-directional RS232 serial line driver and a backup battery for non-volatile memory retention and contin-ued real-time clock operation during receiver off-times. While the hardware itself has re-ceived only minor modifications, numerous enhancements and improvements were applied to the original software to enable a continuous and reliable operation of the system under the extreme signal conditions typically encountered in space missions as well as sounding rocket flights.
The Orion main receiver board requires a regulated +5V DC power supply which is the nomi-nal voltage required by all semi-conductor components. Under nominal conditions the re-
Document No. Issue 1.0 TN 04-01
DLR/GSOC No part of this document shall be reproduced in any form or disclosed to third parties without prior authorization.
Feb. 18, 2004
Document Title: 10 Total Ionizing Dose Testing of the Orion and Phoenix GPS Receivers
ceiver exhibits an average power consumption of 2.0 W. In combination with the standard I/F board the overall power consumption amounts to roughly 2.4 W due to DC/DC switching regulator losses.
Table 3.1 Semiconductor and crystal components employed in the Orion GPS receiver (main board only).
# Part Type Part No Manufacturer Size 1 RF Front end GP2015 Zarlink (Mitel) TQFP48 2 Correlator GP2021 Zarlink (Mitel) QFP80 3 NAND gate 74S00 (by TI) Texas Instruments SO14 4 Processor ARM60-B IG ARM QFP100 5 RAM 128K x 8 HM628127 HJP-20 Hitachi SOJ32 6 EPROM 64K x 16 AM29C-1024-70JI Atmel PLCC44 7 Schottky Diode SS12 General Instruments 8 TCXO 10MHz IT 225 BE Rakon 9 Watch Crystal 32.768 kHz n/a n/a n/a
Table 3.1 summarizes all semiconductor and crystal components utilized on the receiver main board. These components are considered to be most susceptible to the applied radia-tion and may thus be potential sources of receiver failures and malfunctions in the TID tests.
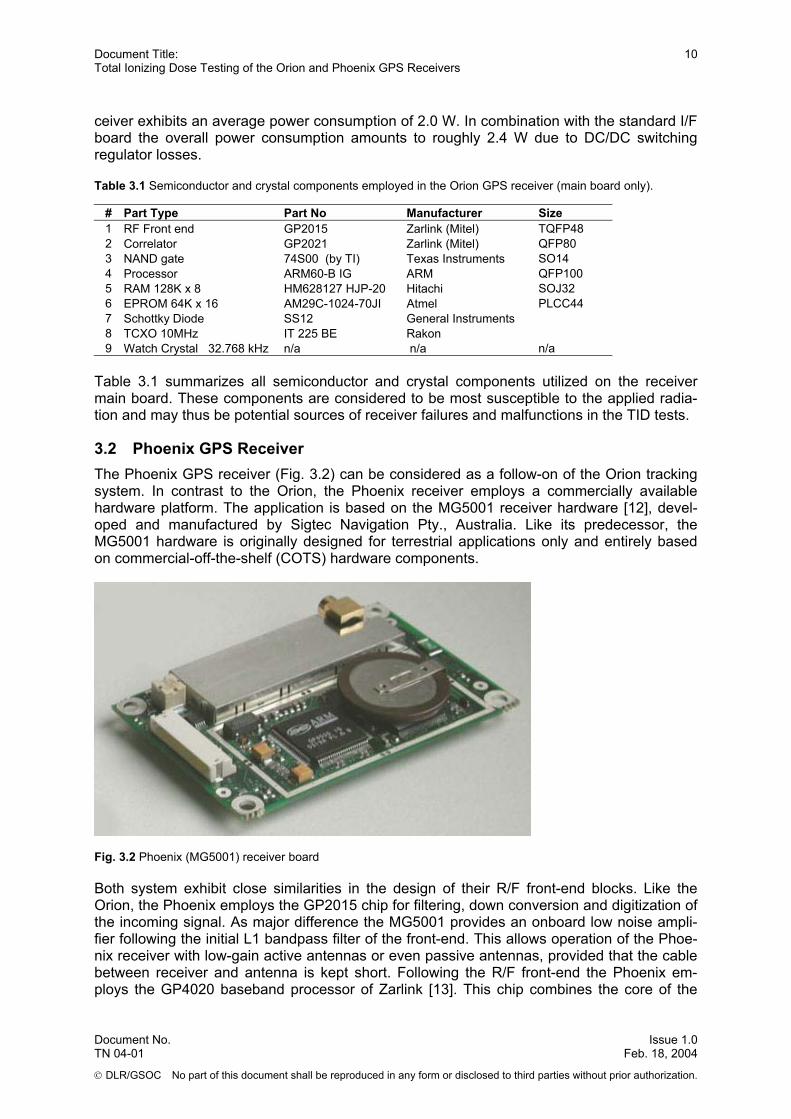
3.2 Phoenix GPS Receiver The Phoenix GPS receiver (Fig. 3.2) can be considered as a follow-on of the Orion tracking system. In contrast to the Orion, the Phoenix receiver employs a commercially available hardware platform. The application is based on the MG5001 receiver hardware [12], devel-oped and manufactured by Sigtec Navigation Pty., Australia. Like its predecessor, the MG5001 hardware is originally designed for terrestrial applications only and entirely based on commercial-off-the-shelf (COTS) hardware components.
Fig. 3.2 Phoenix (MG5001) receiver board
Both system exhibit close similarities in the design of their R/F front-end blocks. Like the Orion, the Phoenix employs the GP2015 chip for filtering, down conversion and digitization of the incoming signal. As major difference the MG5001 provides an onboard low noise ampli-fier following the initial L1 bandpass filter of the front-end. This allows operation of the Phoe-nix receiver with low-gain active antennas or even passive antennas, provided that the cable between receiver and antenna is kept short. Following the R/F front-end the Phoenix em-ploys the GP4020 baseband processor of Zarlink [13]. This chip combines the core of the
Document No. Issue 1.0 TN 04-01
DLR/GSOC No part of this document shall be reproduced in any form or disclosed to third parties without prior authorization.
Feb. 18, 2004

Document Title: 11 Total Ionizing Dose Testing of the Orion and Phoenix GPS Receivers
GP2021 12 channel correlator and a 32 bit ARM7 TDMI micro-processor kernel in a single package. In addition to the above key components, the receiver board provides a 512 kByte flash EPROM for storing the receiver software and a 256 kByte RAM memory for run-time code and data.
Supplementary to the external memory modules, the GP4020 chip itself hosts a fast internal RAM of 32 kByte size. It is battery buffered and serves as non-volatile memory for critical receiver parameters and data required for a warm-start. Again, a 10.0 MHz TCXO is used to generate the required reference frequency.
Compared to its predecessor, the Phoenix receiver features a notably lower power consump-tion (ca. 0.8 W) as well as a smaller form factor (70 x 47 x 11 mm). By default, the MG5001 receiver is operated at a +5V supply voltage, which is internally converted to the 3.3V re-quired by the receivers semi-conductor components. Further benefits of the Phoenix are the increased computing power of its micro-processor and the in circuit programmability, which allows updates of the receiver firmware through its serial standard interface.
Table 3.2 Semiconductor and crystal components employed in the Phoenix (MG5001) GPS receiver board
Part Type Part No Manufacturer Size Schottky diode BAT54J ST Microelectronics SOD-323 Transistor FMMT591A Zetex SOT-23 Digital FET FDV301N Fairchild SOT-23 EXCLUSIVE-OR gate 74HC86D Philips SO14 Flash Micro ATtiny12L-4SC Atmel 8Pin SMD Quad D-Type Flip-Flop MM74HC175 Industry Standard SO16 Step-Down Regulator MAX1692 Maxim SRAM IS61LV12816 ISSI 44Pin TSSOP Baseband Processor GP4020 Mitel 100 Pin TQFP CA Code Down-Converter GP2015 Mitel 48Pin TQFP LNA BGA427 Infineon SOT343 Flash Memory AM29LV200B AMD 48 Pin TSSOP TCXO 10.0MHZ IT7525 Rakon SMD TCXO HS Inverter NC7S04M5 Fairchild SOT23-5 Watch Crystal 32.768KHZ Crystec 8.7X 3.7mm Table 3.2 summarizes the semiconductor and crystal devices employed in the Phoenix re-ceiver that are considered of prime relevance for the TID tests. The board, furthermore, comprises a 3.0V Lithium battery mounted on top of the flash EPROM. In view of its moder-ate thickness (ca. 3 mm) the resulting shielding of the memory chip was considered to be negligible and the battery was therefore retained during al tests.
Document No. Issue 1.0 TN 04-01
DLR/GSOC No part of this document shall be reproduced in any form or disclosed to third parties without prior authorization.
Feb. 18, 2004

Document Title: 12 Total Ionizing Dose Testing of the Orion and Phoenix GPS Receivers
4. Test Setup and Operations
The total ionizing dose radiation tests described below were conducted on Nov. 25-26, 2004, at the Fraunhofer Institute for Technological Trend Analysis (FhG/INT) at Euskirchen, Ger-many. The institute has a long-term experience in the performance of interference and radia-tion tests and has recently specialized in component tests for aerospace applications. All tests were conducted using a Gammamat TK1000 Cobalt-60 radiation source with represen-tative dose rates of 0.25-5 rad/s.
In order to allow a comprehensive monitoring of the GPS receiver performance during the test, a zero-baseline configuration was selected, in which the DUT and a reference receiver were jointly supplied with life GPS signals from a common external antenna For simplifica-tion, the test setup may be divided into three fundamental blocks, namely the GPS antenna system, the radiation chamber and the monitoring and recording equipment outside the test chamber (Fig. 4.1). Key components are summarized in Table 4.1.
Helix antenna
ca. 15m R/FTest receiver
60Co sourceGammamat TK1000
20m (R/F, DC)
20m (R/F+DC)
28.5 cm1 rad/s
Reference receiver
Interface board
RS232 (Rx, Tx, Gnd)ca. 20m
Reg. power supply 12V
ca. 2.3m
Power Divider(-3dB)
Multimeter
Laptop Laptop
RS232
5V,~175 mA
RS232 ca. 15m
DC block
DC block
2x LNA à 24dB
DC/DC
ca. 15m24V DC
LNA 40 dB
15V DC
28.7m R/F cable
Attenuator-3 dB
HP Computer(Current/time)
IE3C bus, 20m
5.02V
4.92V
Fig. 4.1 Structural diagram of the standard setup as applied for the Total Ionizing Dose GPS receiver tests
Document No. Issue 1.0 TN 04-01
DLR/GSOC No part of this document shall be reproduced in any form or disclosed to third parties without prior authorization.
Feb. 18, 2004

Document Title: 13 Total Ionizing Dose Testing of the Orion and Phoenix GPS Receivers
Table 4.1 Summary of active and passive devices employed in the radiation test setup . Table 4.1 Summary of active and passive devices employed in the radiation test setup .
# # Device Type Device Type Quant. Quant. Device Name Device Name Manufacturer Manufacturer Notes Notes 1 GPS Antenna 1 Quadrifilar Helix Antenna Fraunhofer INT Customized antenna 2 LNA (24dB) 2 ZEL-1217LN Mini 24dB @ 15 V DC 3 LNE (40dB) 1 ZHL 1217HLN MiniCircuits 40dB @ 15 V DC 4 R/F Cables - EcoFlex 12.5dB/100m MiniCircuits ca. 50 m Ant.<-> Rec. 5 Attenuator 1 -3 dB Fixed Coaxial Attenuators Weinschel 6 Power divider 1 MiniCircuits 7 DC block 2 Weinschel 7006 Weinschel 8 Co-60 Source 1 Gammamat TK 1000 MDS Nordion 9 Reg. Power Supply 4 10 Multimeter 1 HP 34401A Hewlett-Packard
The antenna system comprised the following components:
a dual-helix antenna for the reception of L1 GPS signals, mounted on the roof of the test building, three low-noise amplifiers (LNAs)2, a power-splitter with subsequent DC-blockers allowing the simultaneous connection of
two GPS receivers to the roof top antenna, low attenuation (12 dB/100 m) R/F cables.
The system has been installed by R/F specialists of INT prior to the test campaign and its proper functioning was verified during a short test with a reference receiver prior to the start of the first simulation.
Fig. 4.2 Gammamat TK1000 Cobalt-60 radiation source and GPS test receiver on the table below.
Fig. 4.3 The minimum distance between radiation source and test object is determined by the diagonal size of the test object and the desired beam homo-geneity (better than 10%).
Co-60 Source
Test Receiver Board
αMAX = 18.4°
d
Φ(h)
h
Φ(r)
Φ(h) > 0.9 Φ(r)
Co-60 Source
Test Receiver Board
αMAX = 18.4°
d
Φ(h)
h
Φ(r)
Φ(h) > 0.9 Φ(r)
2 The pre-installed amplifier chain provides a formal gain of 88 dB, which is much higher than required by the GPS receivers (12 dB to 28 dB), even after accounting for cable losses (12 dB / 100 m) as well as the attenuator und power divider (6 dB loss). Due to time limitations and an adequate tracking performance of all GPS receivers, no effort has been made to assess the actual gain and the feasibility of working with a reduced set of amplifiers.
Document No. Issue 1.0 TN 04-01
DLR/GSOC No part of this document shall be reproduced in any form or disclosed to third parties without prior authorization. rties without prior authorization.
Feb. 18, 2004

Document Title: 14 Total Ionizing Dose Testing of the Orion and Phoenix GPS Receivers
Inside the radiation chamber, the device under test (DUT) was placed on top of a small table below the Cobalt-60 gamma ray projector (Fig. 2.2). The desired radiation does rate was achieved by adjusting the vertical position of the table to a pre-determined value. Due to the omnidirectional radiation characteristic of the gamma ray source, the dose rate
2/1 r∝φ (1) experienced by a test device decreases proportional to the square of the distance r between the Co-60 source and the DUT.
As an example, a vertical separation of 28.5 cm between the receiver board (located on top of the table) and the Cobalt source resulted in a dose rate of about 1 rad/s. This relation ap-plied for the particular test date only and is subject to changes due to the natural decay (half-life-time 5.3 years) or in case of reloads of the source. To ensure a homogeneity of better than 10% that is recommended by common standards (e.g. [14]) the illuminating beam must not exceed a half-cone angle of 18.4°. This limits the distance to a minimum of 10.5 cm (dose rate 7.5 rad/s) for the Phoenix receiver or 12.8 cm (dose rate 5 rad/s) for a single Orion board under test.
The illumination was started by pushing the Co-60 pill from inside the Gammamat into a tube just above the target. This process can be remotely controlled from outside the test chamber. At the end of each test (or for a temporary interruption) the source has been again moved back into the housing under remote control. Humans were only allowed to handle equipment near the Gammamat, if the Co source was safely stored inside, but could enter the test chamber almost immediately after closing the source.
The electrical interface (I/F) unit, providing the power supply and the line driver for the re-ceiver board, was placed a few meters away from the radiation source and shielded against stray radiation behind thick blocks of lead. This precaution was taken to prevent the interface electronic being exposed to the full radiation dose and to prevent a potential falsification of the test results by TID effects in the I/F electronic. The I/F unit used during these test is usu-ally required only for stand alone operations of the receiver on ground. During a real space mission the I/F functionalities are commonly provided by the onboard service systems of the satellite. Therefore, test objective was primarily to examine the receiver unit, rather than to evaluate the combination of receiver board and interface electronic.
The receiver board was connected to the I/F unit through a specifically customized two meter long adapter cable. Moreover, an ampere-meter was incorporated into the power supply line, to measure the current consumption of the receiver before and during the tests. A set of se-rial data cables going from inside the test chamber to the outside enabled a remote monitor-ing as well as remote commanding of the test device during the simulations. Furthermore, a data cable for the transmission of the current meter readings was available.
Outside the radiation chamber a total of three PCs were employed to gather and store all relevant information during the tests. While one PC was utilized to collect and display naviga-tion solutions, raw measurements and tracking status information provided by the test re-ceiver, a second computer recorded the corresponding data from a reference GPS sensor operated outside the radiation chamber. A third PC was finally used to monitor the current consumption of the test receiver as measured by the ampere meter inside the test chamber. The reference GPS receiver (Orion unit #7) was connected to the same roof antenna as the test receiver and provided measurements for the zero-baseline analysis of the tracking per-formance and navigation accuracy.
Document No. Issue 1.0 TN 04-01
DLR/GSOC No part of this document shall be reproduced in any form or disclosed to third parties without prior authorization.
Feb. 18, 2004

Document Title: 15 Total Ionizing Dose Testing of the Orion and Phoenix GPS Receivers
In one case (test 3b, cf. Table 4.2) a slightly different test setup was used than described above. Main objective of this test was to examine the effect of low radiation dose rates, ap-plied to the receivers over an extended period of time (approx. 16-18 hours). In order to limit the overall test time it was decided to simultaneously examine two receivers (a Phoenix and an Orion unit) within a single test run. Due to the fairly large distance between source and targets, the homogeneity of the illumination beam could be fully ensured for both receivers. While the Phoenix unit was connected to the I/F unit via the customized adapter cable in the above described way, the Orion receiver was tested directly stacked onto the laboratory I/F board. This configuration had to be chosen because of the lack of a second adapter cable. Due to slightly different heights of both hardware devices placed on top of the test table, the Orion main board was exposed to a marginally higher dose rate (0.27 rad/s) than the Phoe-nix board (0.25 rad/s). The supply of both receiver with GPS signal from a common antenna was achieved by incorporating an additional signal splitter into the antenna line, close to the test units.
Following the breakdown of the Phoenix receiver during this simulation, the test configuration was again slightly modified. During a short interruption, the Phoenix unit was removed from the test bed to prevent further damage. Subsequently, the radiation dose was increased to 1 rad/s (by reducing the distance between the DUT and the Co-60 source) in order to further accelerate the test process.
In all tests, the GPS test receivers have been activated a few minutes prior to starting the illumination. Within the first minutes after power-on a slight increase of the receiver’s tem-perature can usually be observed due to the natural warming-up of the electronic compo-nents. This raise in temperate can cause a shift in the output frequency of the reference os-cillator of up to several hundred Hz (with respect to L1). When the nominal working tempera-ture has been reached about five to ten minutes after power-on, the system enters a stable state. This pre-test phase furthermore allowed the receiver to acquire a sufficient number of GPS satellites and to achieve a stable and reliable 3D navigation solution.
All test devices have been exposed to the radiation source at least up to the moment where the message output stopped and a significant drop in the power consumption indicated the ultimate receiver break-down.
Table 4.2 Key parameters of total dose radiation tests.
# DUT Distance to Source
Dose Rate [rad/sec]
Source opened (UTC)
Source closed (UTC)
Total exposure
1 Phoenix #03 28.7 cm 1.0 03/11/25 07:32 03/11/25 11:50 15.5 krad 2 Phoenix #02 12.8 cm 5.0 03/11/25 13:06 03/11/25 14:03 17.1 krad 3a Phoenix #01 57.4 cm 0.25 03/11/25 15:30 03/11/26 07:43 14.6 krad
3b Orion #19 & I/F #6 55.4 cm 28.7 cm
0.27 1.0
03/11/25 15:3003/11/25 08:15
03/11/26..07:43 03/11/26 08:56 17.4 krad
4 Orion #20 12.8 cm 5.0 03/11/26 09:29 03/11/26 10:27 17.4 krad Table 4.2 summarizes the key information for the conducted tests. It provides a list of the employed receiver hardware, the configured dose rates as well as the start and end time of each test. The total exposure given in the final column indicates the overall dose experienced by the respective devices. Since the exposure was continued beyond a receiver failure in some of the tests, the specified dose may be higher than the total dose at breakdown, which is provided in Table 5.1. In total, four independent test runs have been performed involving two Orion and three Phoenix GPS receivers. All receivers were running an identical firmware version (D07Ns) configured for terrestrial operation.
Document No. Issue 1.0 TN 04-01
DLR/GSOC No part of this document shall be reproduced in any form or disclosed to third parties without prior authorization.
Feb. 18, 2004

Document Title: 16 Total Ionizing Dose Testing of the Orion and Phoenix GPS Receivers
While common standards for radiation testing of electronic devices [14,15] require the simul-taneous evaluation of multiple devices (11 samples from a common manufacturing lot or 22 samples from mixed lots), only a limited number of GPS receiver units could be made avail-able for the present tests. Preference was therefore given to tests of individual units at differ-ent dose rates, in order to identify a possible dependence of radiation induced damages on the applied beam intensity (see also Sect. 2.2).
For completeness, it is mentioned that the temperature inside the radiation chamber has been measured prior to and after each test. During all tests a constant temperature between 24°C and 25°C was observed.
Document No. Issue 1.0 TN 04-01
DLR/GSOC No part of this document shall be reproduced in any form or disclosed to third parties without prior authorization.
Feb. 18, 2004

Document Title: 17 Total Ionizing Dose Testing of the Orion and Phoenix GPS Receivers
5. Results and Analysis
5.1 Current Drain and Total Dose Tolerance The overall current drain and its variation throughout a TID test provide a direct measure of radiation induced component aging in electronic system. It reflects the occurrence of leak currents that ultimately result in a destruction of the irradiated device. Fig. 5.1 illustrates the increase of the current consumption encountered during the conducted GPS receiver tests. To facilitate a comparison between both receiver types the current drain is given relative to the value determined prior to the start of the exposure.
-50%
-40%
-30%
-20%
-10%
0%
10%
20%
30%
40%
50%
0 1 2 3 4 5 6 7 8 9 10 11 12 13 14 15 16 17 18 19 20
Total Dose [krad]
Cur
rent
Incr
ease
Phoenix #3 (1 rad/s)Phoenix #2 (5 rad/s)Phoenix #1 (0.25 rad/s)Orion #19 + I/F #6 (0.27/1.0 rad/s)Orion #20 (5 rad/s)
Fig. 5.1 Relative increase of the current drain of the tested GPS receivers as a function of the accumulated total dose Although the current increase differed notably between the tested receivers, a more detailed inspection has revealed a potential communality in the current pattern of each device. Essen-tially, all simulations can be divided into three “phases” (Fig 5.2). Up to a receiver specific threshold, the absorbed dose rate doesn’t obviously cause measurable harm to the system, as no increase in the power consumption is observed. Thereafter, in a second phase, the beginning of a apparent degradation of components is indicated by a gradual rise in the cur-rent drain. Prior to the hardware failure a third phase with almost linearly increasing current consumption may be recognized.
The receiver hardware break-down is finally marked by a sudden drop in the power con-sumption. It closely coincided with a loss of data transmission and communication. Sporadic peaks in the current consumption observed thereafter can most likely be attributed to autonomous reboots initiated by the receiver hard- and software.
Document No. Issue 1.0 TN 04-01
DLR/GSOC No part of this document shall be reproduced in any form or disclosed to third parties without prior authorization.
Feb. 18, 2004

Document Title: 18 Total Ionizing Dose Testing of the Orion and Phoenix GPS Receivers
-20%
-10%
0%
10%
20%
30%
40%
0 1 2 3 4 5 6 7 8 9 10 11 12 13 14 15 16Total Dose [krad]
Cur
rent
Incr
ease
1st Phase(no increase)
2nd Phase(non-linear increase)
3rd Phase(linear increase)
Receiver collapse
Fig. 5.2 Current increase as measured for the Phoenix receiver #1 during the test #3 (0.25 rad/s). No conclusive explanation could yet be found for the discontinuity in the current consumption of both Orion receivers observed prior to the overall device failure. While the sudden current increase may suggest the destruction of single semi-conductor component, the receiver con-tinued to operate and provide valid navigation solutions over and additional dose of 1-2 krad. Another unresolved phenomenon concerns the slightly different behavior of both receiver types at break-down. For the Phoenix units, the end of data transmission and the sudden drop in the current drain occurred simultaneously. The Orion test receivers, on the other hand, stopped sending messages a few minutes prior to the final power drop. This is possibly a result of a failure in the UART block at a time where the remaining system was still work-ing.
Table 5.1 summarizes the TID values up to which the test receivers transmitted data and were thus considered as “functioning”.
Table 5.1 Summary of absorbed TID radiation at the time of receiver break-down
GPS receiver Test Receiver break-down (UTC)
TID
Phoenix #03 1 2003/11/25 11:47 15.3 krad Phoenix #02 2 2003/11/25 14:03 16.5 krad Phoenix #01 3a 2003/11/26 07:43 14.3 krad Orion #19 & I/F-Board #6 3b 2003/11/26 08:56 17.0 krad (I/F: 15.8 krad) Orion #20 4 2003/11/26 10:27 17.4 krad
Document No. Issue 1.0 TN 04-01
DLR/GSOC No part of this document shall be reproduced in any form or disclosed to third parties without prior authorization.
Feb. 18, 2004

Document Title: 19 Total Ionizing Dose Testing of the Orion and Phoenix GPS Receivers
5.2 Oscillator Drift 5.2 Oscillator Drift Another significant receiver parameter, which has been carefully observed through all tests, was the initial offset and the drift rates of the 10MHz reference oscillators employed in the receivers. While having a valid navigation solution, both receiver can determine precisely the actual frequency shift. Fig. 5.3 depicts the measured frequency offsets (referred to L1) ver-sus accumulated radiation dose for all tested receivers.
Another significant receiver parameter, which has been carefully observed through all tests, was the initial offset and the drift rates of the 10MHz reference oscillators employed in the receivers. While having a valid navigation solution, both receiver can determine precisely the actual frequency shift. Fig. 5.3 depicts the measured frequency offsets (referred to L1) ver-sus accumulated radiation dose for all tested receivers.
Evidently, the oscillators were affected by the radiation from the very beginning of the illumi-nation. During all tests surprisingly high but almost constant frequency drift rates were en-countered. For all tests, the drifting started immediately after opening the radiation source and was recognized continuously up to the hardware break-down. This observation applied equally for both receiver types, although Orion and Phoenix employ a slightly different oscil-lator hardware for the generation of a reference frequency. The drift rates determined for the three Phoenix units closely match each other and amount to approximately -1.2 ppm/krad. For the Orion receivers, however, it was noted that unit #20 exhibited a notably higher drift rate (approx. -1.7 ppm/krad) then unit #19 (approx. -1.2 ppm/krad). This deviation in the os-cillator behavior may be attributed to the varying dose rates applied in both tests. This as-sumption is furthermore supported by an approximately -0.6 ppm/krad increased drift rate observed after modifying the dose rate from 0.25 rad/s to 1.0 rad/s during test #3. With re-gard to the Phoenix receiver and its oscillator device, however, the applied dose rate is ap-parently of minor importance.
Evidently, the oscillators were affected by the radiation from the very beginning of the illumi-nation. During all tests surprisingly high but almost constant frequency drift rates were en-countered. For all tests, the drifting started immediately after opening the radiation source and was recognized continuously up to the hardware break-down. This observation applied equally for both receiver types, although Orion and Phoenix employ a slightly different oscil-lator hardware for the generation of a reference frequency. The drift rates determined for the three Phoenix units closely match each other and amount to approximately -1.2 ppm/krad. For the Orion receivers, however, it was noted that unit #20 exhibited a notably higher drift rate (approx. -1.7 ppm/krad) then unit #19 (approx. -1.2 ppm/krad). This deviation in the os-cillator behavior may be attributed to the varying dose rates applied in both tests. This as-sumption is furthermore supported by an approximately -0.6 ppm/krad increased drift rate observed after modifying the dose rate from 0.25 rad/s to 1.0 rad/s during test #3. With re-gard to the Phoenix receiver and its oscillator device, however, the applied dose rate is ap-parently of minor importance.
-45.0
-40.0
-35.0
-30.0
-25.0
-20.0
-15.0
-10.0
-5.0
0.0
5.0
0 2 4 6 8 10 12 14 16 18 20
Total Dose [krad]
Osc
illat
or O
ffset
[kH
z]
-28.6
-25.4
-22.2
-19.0
-15.9
-12.7
-9.5
-6.3
-3.2
0.0
3.2
Osc
illat
or O
ffset
[ppm
]
Test#2 (Phoenix#2)Test#1(Phoenix#3)Test#3(Phoenix#1)Test#3(Orion#19)Test#4(Orion#20)
Fig. 5.3 Measured oscillator offset (w.r.t. the GPS L1 frequency) as a function of absorbed total radiation dose.
According to the information given in [16], increased frequency drifts are a normal phenome-non observed for oscillators exposed to radiation and can be primarily attributed to changes in the crystal unit caused by the absorbed radiation dose. Due to their firmware design both,
According to the information given in [16], increased frequency drifts are a normal phenome-non observed for oscillators exposed to radiation and can be primarily attributed to changes in the crystal unit caused by the absorbed radiation dose. Due to their firmware design both,
Document No. Issue 1.0 TN 04-01
DLR/GSOC No part of this document shall be reproduced in any form or disclosed to third parties without prior authorization. DLR/GSOC No part of this document shall be reproduced in any form or disclosed to third parties without prior authorization.
Feb. 18, 2004
Document Title: 20 Total Ionizing Dose Testing of the Orion and Phoenix GPS Receivers
the Orion and Phoenix receivers are generally able to cope with reference frequency shifts in the order of magnitude encountered in the tests. For the sake of completeness, however, it should be noted that extremely large oscillator offsets (>50 ppm) will cause the front-end chip to impose a considerable frequency offset in the down-converted signal. This can result in a significant part of the GPS signal being removed by the employed SAW filter. In this case, one would expect to encounter a notable degradation in the carrier-to-noise measurements reaching up to a complete loss of lock on all channels. The offsets measured during the pre-sent radiation tests, however, remained well within tolerable limits.
Furthermore, severe signal acquisition problems due to a oscillator drift may be encountered during a receiver (re-)start after an extended period of system inactivity. Usually GPS re-ceiver store the currently valid frequency offset in the non-volatile memory at power-down. At a receiver restart this value is then used for signal acquisition aiding in order to reduce the time-to-first-fix. A shift in the frequency offset during a receiver off-time can therefore result in a significantly increased signal acquisition time since GPS signals are searched at incorrect Doppler-offset frequencies. In the worst case, this can even lead to a total failure of acquisi-tion during an operation in space.
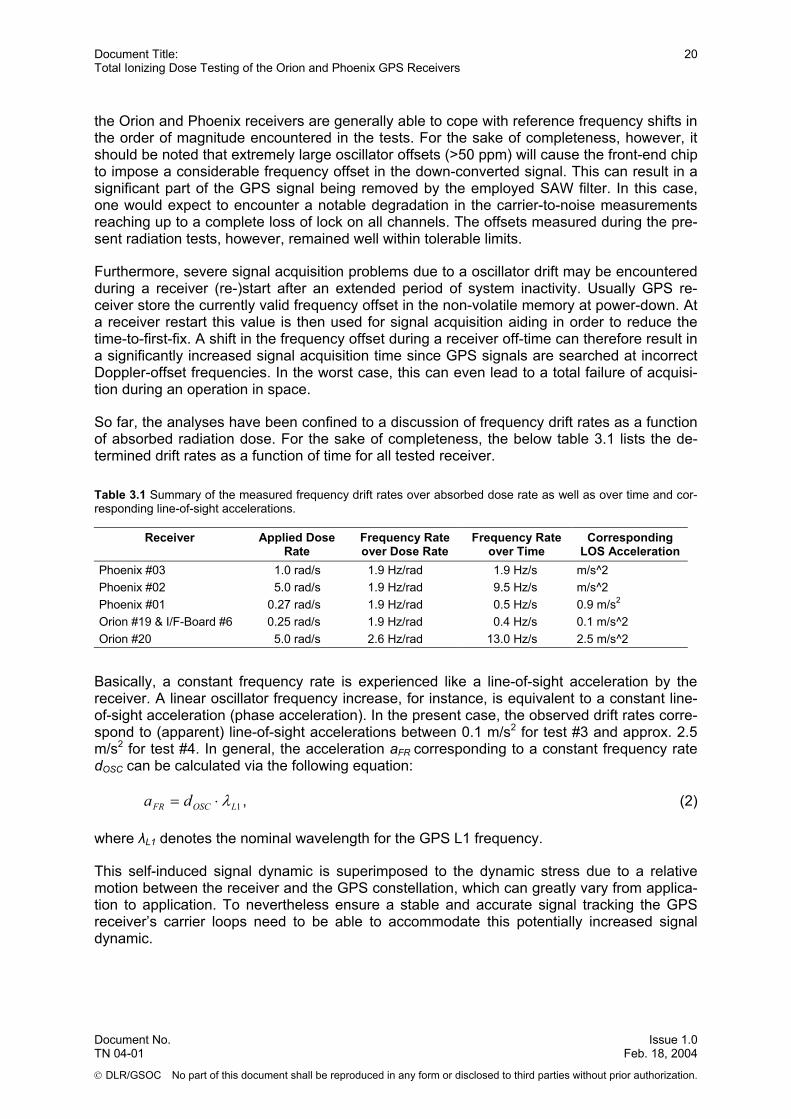
So far, the analyses have been confined to a discussion of frequency drift rates as a function of absorbed radiation dose. For the sake of completeness, the below table 3.1 lists the de-termined drift rates as a function of time for all tested receiver.
Table 3.1 Summary of the measured frequency drift rates over absorbed dose rate as well as over time and cor-responding line-of-sight accelerations.
Receiver Applied Dose Rate
Frequency Rate over Dose Rate
Frequency Rate over Time
Corresponding LOS Acceleration
Phoenix #03 1.0 rad/s 1.9 Hz/rad 1.9 Hz/s m/s^2 Phoenix #02 5.0 rad/s 1.9 Hz/rad 9.5 Hz/s m/s^2 Phoenix #01 0.27 rad/s 1.9 Hz/rad 0.5 Hz/s 0.9 m/s2 Orion #19 & I/F-Board #6 0.25 rad/s 1.9 Hz/rad 0.4 Hz/s 0.1 m/s^2 Orion #20 5.0 rad/s 2.6 Hz/rad 13.0 Hz/s 2.5 m/s^2
Basically, a constant frequency rate is experienced like a line-of-sight acceleration by the receiver. A linear oscillator frequency increase, for instance, is equivalent to a constant line-of-sight acceleration (phase acceleration). In the present case, the observed drift rates corre-spond to (apparent) line-of-sight accelerations between 0.1 m/s2 for test #3 and approx. 2.5 m/s2 for test #4. In general, the acceleration aFR corresponding to a constant frequency rate dOSC can be calculated via the following equation:
1LOSCFR da λ⋅= , (2)
where λL1 denotes the nominal wavelength for the GPS L1 frequency.
This self-induced signal dynamic is superimposed to the dynamic stress due to a relative motion between the receiver and the GPS constellation, which can greatly vary from applica-tion to application. To nevertheless ensure a stable and accurate signal tracking the GPS receiver’s carrier loops need to be able to accommodate this potentially increased signal dynamic.
Document No. Issue 1.0 TN 04-01
DLR/GSOC No part of this document shall be reproduced in any form or disclosed to third parties without prior authorization.
Feb. 18, 2004

Document Title: 21 Total Ionizing Dose Testing of the Orion and Phoenix GPS Receivers
In principle, the tested DLR GPS receivers are designed to fully tolerate constant frequency drift rates. Both systems employ a third order phase locked loop (PLL) for carrier tracking in their software. This implies that the loops are generally able to cope with constant frequency rates (phase acceleration) without steady state tracking errors. Only higher order frequency changes may cause tracking problems in the receiver, but haven’t been encountered in the analysis of the oscillator behavior.
However, it must be noted that a GPS tracking system employing a second-order PLL can be seriously affected by a constant oscillator drift superimposed to the dynamic caused by the vehicle’s motion. A second-order loop by nature exhibits an acceleration dependent phase tracking error, resulting in a corresponding degradation of the kinematic navigation solution under dynamic motion. In worst case such a phase error can result in a highly instable signal tracking and even lead to a loss of lock on individual channels. Therefore, it is of great impor-tance to properly accounted for a potentially drifting reference oscillator during the receiver design phase.
Document No. Issue 1.0 TN 04-01
DLR/GSOC No part of this document shall be reproduced in any form or disclosed to third parties without prior authorization.
Feb. 18, 2004

Document Title: 22 Total Ionizing Dose Testing of the Orion and Phoenix GPS Receivers
6. Signal Tracking and Navigation Accuracy
6.1 Carrier-to-Noise Ration The carrier-to-noise (C/N0) measurements obtained during the tests have been evaluated by comparing them against values obtained by the reference sensor operated outside the radia-tion chamber. A sample plot of carrier-to-noise readings from both receivers for test #1 and GPS satellite PRN #5 is shown in Fig. 6.1.
Fig. 6.1 Sample C/N0 readings of PRN #5 for the test and the reference receiver recorded during test #1.
The almost periodical C/N0 variations encountered in the period from 9:00 to 10:00 UTC are characteristic for multipath effects, caused by the interference of directly received GPS sig-nals with signals reflected in the vicinity of the antenna. Since both receiver shared a com-mon antenna and employ a nearly identical hardware and software, the C/N0 graphs are barely distinguishable form each other. As expected, both receiver handle multipath interfer-ences in an almost identical manner. The increased noise level which may be recognized from approximately 10:00 to roughly 10:20 UTC, could be traced back to interferences caused by a cellular phone operated close to one of the antenna amplifiers. Apart form the above phenomena, no indication was found for a significant degradation of the average C/N0 values due to the absorbed radiation dose. During several simulations, however, fairly fre-quent short-term drops in the determined signal-strength have been recognized, with C/N0 values going down to 30 to 35 dB-Hz or sporadically even below. In extreme cases such drops resulted even in a loss of lock on the associated tracking channel. Especially during test #4 a large number of pronounced drops has been recorded (Fig. 6.2). Further analysis revealed that these drops are well correlated with anomalies detected in the navigation fixes and the raw data, which will be addressed in more detail in the subsequent sections.
Document No. Issue 1.0 TN 04-01
DLR/GSOC No part of this document shall be reproduced in any form or disclosed to third parties without prior authorization.
Feb. 18, 2004

Document Title: 23 Total Ionizing Dose Testing of the Orion and Phoenix GPS Receivers
0
10
20
30
40
50
60
9:20 9:30 9:40 9:50 10:00 10:10 10:20Time (UTC)
C/N
0 [d
B-H
z]
Orion#20
Ref. Receiver
Fig. 6.2 Sample C/N0 readings of PRN #5 for Orion receiver #20 and reference receiver recorded during test #4.
6.2 Signal Tracking and Navigation Accuracy In a further step the navigation solution accuracy and overall tracking performance was evaluated for all five test receivers. To this end, the position and velocity residuals between the navigation fixes from the test receivers and a static reference position were computed. As an example Fig. 4.3 illustrates the position and velocity errors found during test #4 conducted with the Orion unit #20 and an applied dose rate of 5 rad/s.
-100
-50
0
50
100
150
200
250
300
350
9:25 9:35 9:45 9:55 10:05 10:15
Pos
ition
[m] /
Vel
ocity
[m/s
] .
-1 0 1 2 3 4 5 6 7 8 9 10 11 12 13 14 15Radiation Dose [krad]
Delta PosDelta Vel
Time (UTC)
Fig. 6.3 Position and velocity residuals of the Orion #20 with respect to a static reference position (test #4).
Document No. Issue 1.0 TN 04-01
DLR/GSOC No part of this document shall be reproduced in any form or disclosed to third parties without prior authorization.
Feb. 18, 2004

Document Title: 24 Total Ionizing Dose Testing of the Orion and Phoenix GPS Receivers
Both, position and velocity readings, exhibit a large number of obviously corrupted fixes, with peak errors of up to 340 m and 135 m/s, respectively. Furthermore several navigation out-ages have been encountered ranging from a few seconds up to several minutes during this test. A closer investigation has revealed that basically two different categories of navigation anomalies have to be distinguished: On the one hand, fairly frequent ramps in the velocity and position solutions were immediately identified, with faulty navigation data over a time interval of typically several seconds (Fig. 6.3). The first occurrence of such an anomaly was detected about 15 minutes after opening the radiation source. Thereafter such ramps could be observed at an ever increasing rate up to the end of the test.
In addition to these ramps, a considerably increased number of outliers in the velocity solu-tions has been found compared to the reference receiver. In this context the term outliers is used exclusively for single erroneous navigation solutions at a particular epochs. The fixes collected before and after this one corrupted solution should be well within nominal limits. Due to the significantly smaller magnitudes of these outliers compared to the values ob-served during the aforementioned position and velocity ramps the effect became evident only after masking out the ramps. Fig. 6.4 depicts the velocity errors identified during the first 10 minutes of simulation #4 for the test device as well as the reference receiver. Other than for the observed error ramps in the navigation fixes, the outliers in the velocity solutions are pre-sent form the very beginning of illumination and throughout the entire test.
0.0
0.5
1.0
1.5
2.0
2.5
3.0
3.5
4.0
9:25 9:26 9:27 9:28 9:29 9:30 9:31 9:32 9:33 9:34 9:35
Vel
ocity
Err
or [m
/s]
Orion#20Ref. Receiver
Time (UTC)
Start of Illumination
Fig. 6.4 Comparison of velocity solution accuracy between test and reference GPS receiver for the first 10 min-utes within test #4.
Such pronounced and frequent navigation errors and in particular the distinctive ramps in the position and velocity solutions were only encountered during test #4 with the Orion re-ceiver #20. However, outliers in the velocity records were likewise observed in other simula-tions, but considerably less frequent. In general, the Orion receivers turned out to be more sensitive to radiation exposure than the Phoenix hardware, at least with regard to the ob-served navigation and tracking performance.
For further reference, the following plot (Fig 6.5) shows the velocity errors identified during test #2 conducted with the Phoenix unit #2. As for test #4 with the Orion receiver this simula-tion has been carried out applying a radiation dose rate of 5 rad/s.
Document No. Issue 1.0 TN 04-01
DLR/GSOC No part of this document shall be reproduced in any form or disclosed to third parties without prior authorization.
Feb. 18, 2004
Document Title: 25 Total Ionizing Dose Testing of the Orion and Phoenix GPS Receivers
0.0
1.0
2.0
3.0
4.0
5.0
6.0
7.0
8.0
9.0
10.0
13:00 13:10 13:20 13:30 13:40 13:50 14:00
Time (UTC)
Vel
ocity
[m/s
]
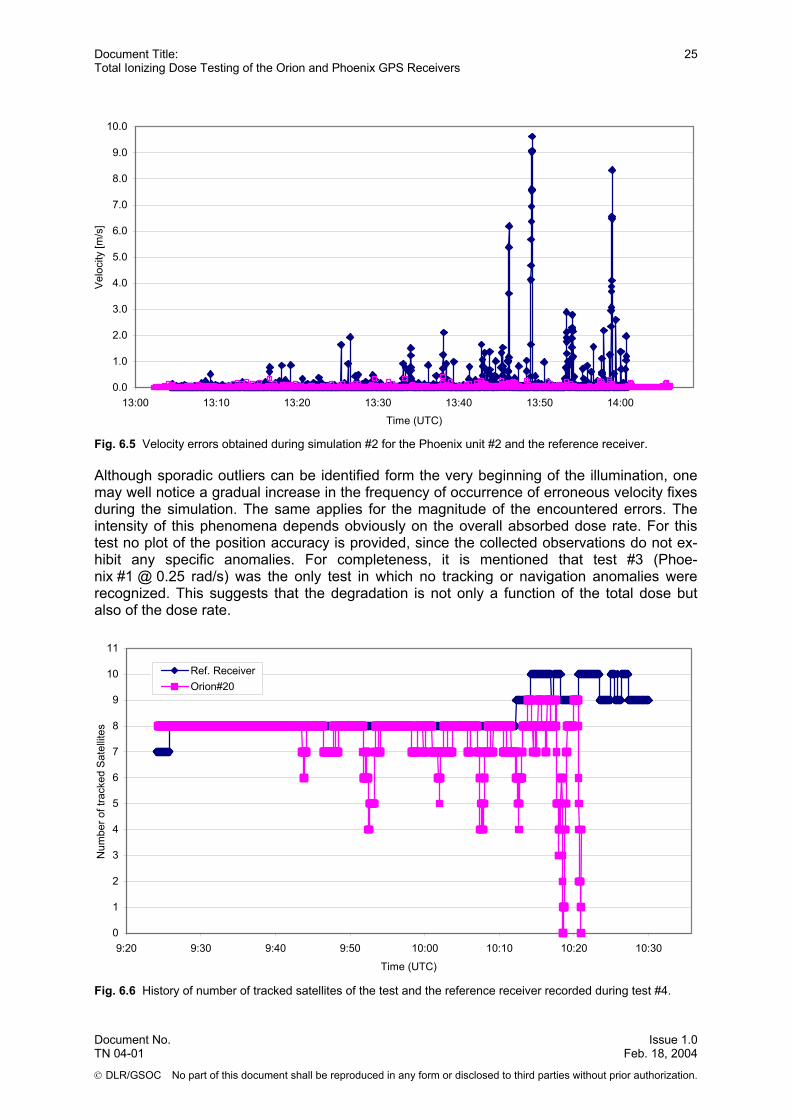
Fig. 6.5 Velocity errors obtained during simulation #2 for the Phoenix unit #2 and the reference receiver.
Although sporadic outliers can be identified form the very beginning of the illumination, one may well notice a gradual increase in the frequency of occurrence of erroneous velocity fixes during the simulation. The same applies for the magnitude of the encountered errors. The intensity of this phenomena depends obviously on the overall absorbed dose rate. For this test no plot of the position accuracy is provided, since the collected observations do not ex-hibit any specific anomalies. For completeness, it is mentioned that test #3 (Phoe-nix #1 @ 0.25 rad/s) was the only test in which no tracking or navigation anomalies were recognized. This suggests that the degradation is not only a function of the total dose but also of the dose rate.
0
1
2
3
4
5
6
7
8
9
10
11
9:20 9:30 9:40 9:50 10:00 10:10 10:20 10:30
Time (UTC)
Num
ber o
f tra
cked
Sat
ellit
es
Ref. ReceiverOrion#20
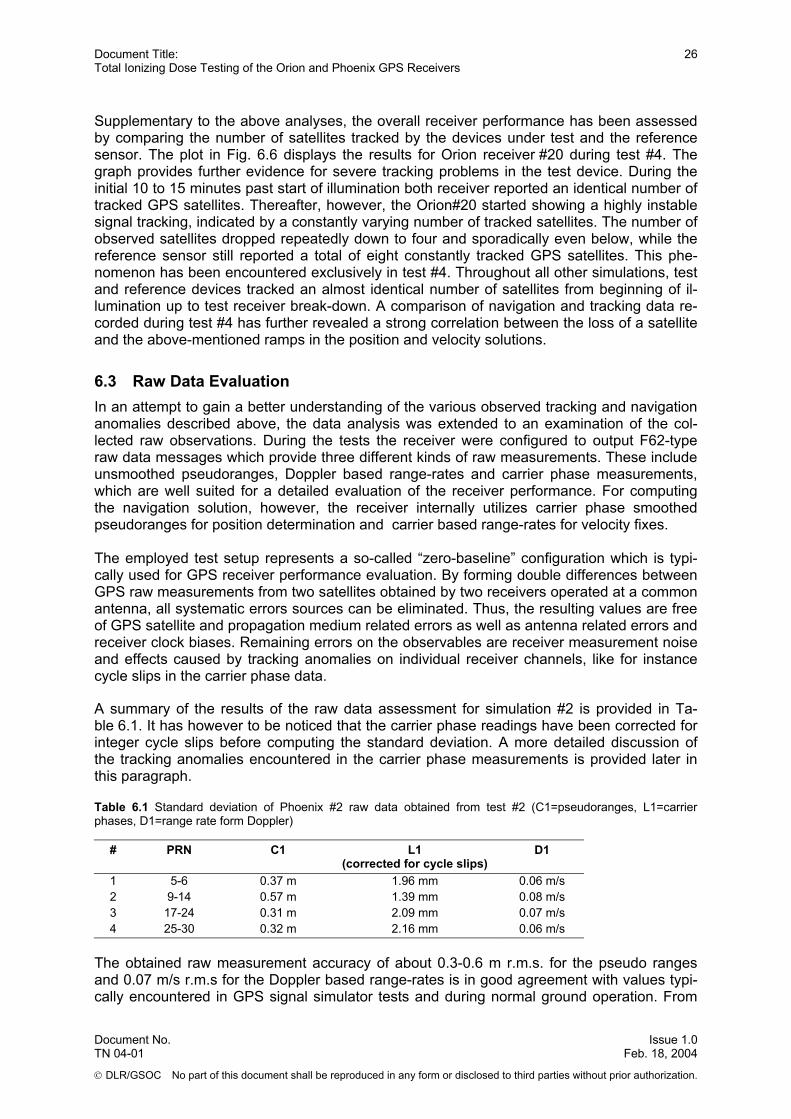
Fig. 6.6 History of number of tracked satellites of the test and the reference receiver recorded during test #4.
Document No. Issue 1.0 TN 04-01
DLR/GSOC No part of this document shall be reproduced in any form or disclosed to third parties without prior authorization.
Feb. 18, 2004
Document Title: 26 Total Ionizing Dose Testing of the Orion and Phoenix GPS Receivers
Supplementary to the above analyses, the overall receiver performance has been assessed by comparing the number of satellites tracked by the devices under test and the reference sensor. The plot in Fig. 6.6 displays the results for Orion receiver #20 during test #4. The graph provides further evidence for severe tracking problems in the test device. During the initial 10 to 15 minutes past start of illumination both receiver reported an identical number of tracked GPS satellites. Thereafter, however, the Orion#20 started showing a highly instable signal tracking, indicated by a constantly varying number of tracked satellites. The number of observed satellites dropped repeatedly down to four and sporadically even below, while the reference sensor still reported a total of eight constantly tracked GPS satellites. This phe-nomenon has been encountered exclusively in test #4. Throughout all other simulations, test and reference devices tracked an almost identical number of satellites from beginning of il-lumination up to test receiver break-down. A comparison of navigation and tracking data re-corded during test #4 has further revealed a strong correlation between the loss of a satellite and the above-mentioned ramps in the position and velocity solutions.
6.3 Raw Data Evaluation In an attempt to gain a better understanding of the various observed tracking and navigation anomalies described above, the data analysis was extended to an examination of the col-lected raw observations. During the tests the receiver were configured to output F62-type raw data messages which provide three different kinds of raw measurements. These include unsmoothed pseudoranges, Doppler based range-rates and carrier phase measurements, which are well suited for a detailed evaluation of the receiver performance. For computing the navigation solution, however, the receiver internally utilizes carrier phase smoothed pseudoranges for position determination and carrier based range-rates for velocity fixes. The employed test setup represents a so-called “zero-baseline” configuration which is typi-cally used for GPS receiver performance evaluation. By forming double differences between GPS raw measurements from two satellites obtained by two receivers operated at a common antenna, all systematic errors sources can be eliminated. Thus, the resulting values are free of GPS satellite and propagation medium related errors as well as antenna related errors and receiver clock biases. Remaining errors on the observables are receiver measurement noise and effects caused by tracking anomalies on individual receiver channels, like for instance cycle slips in the carrier phase data.
A summary of the results of the raw data assessment for simulation #2 is provided in Ta-ble 6.1. It has however to be noticed that the carrier phase readings have been corrected for integer cycle slips before computing the standard deviation. A more detailed discussion of the tracking anomalies encountered in the carrier phase measurements is provided later in this paragraph.
Table 6.1 Standard deviation of Phoenix #2 raw data obtained from test #2 (C1=pseudoranges, L1=carrier phases, D1=range rate form Doppler)
# PRN C1 L1 (corrected for cycle slips)
D1
1 5-6 0.37 m 1.96 mm 0.06 m/s 2 9-14 0.57 m 1.39 mm 0.08 m/s 3 17-24 0.31 m 2.09 mm 0.07 m/s 4 25-30 0.32 m 2.16 mm 0.06 m/s
The obtained raw measurement accuracy of about 0.3-0.6 m r.m.s. for the pseudo ranges and 0.07 m/s r.m.s for the Doppler based range-rates is in good agreement with values typi-cally encountered in GPS signal simulator tests and during normal ground operation. From
Document No. Issue 1.0 TN 04-01
DLR/GSOC No part of this document shall be reproduced in any form or disclosed to third parties without prior authorization.
Feb. 18, 2004

Document Title: 27 Total Ionizing Dose Testing of the Orion and Phoenix GPS Receivers
the recorded data no evidence was found for a potential impact of the total absorbed radia-tion dose onto the pseudorange and Doppler frequency tracking in the receiver. A sample plot of double differenced raw observations for the satellite pair PRN 5-6 obtained during test #2 is shown in Fig. 6.7. Again all cycle slips have been removed from the carrier phase measurements before being plotted.
sig(C1)=0.37m
2003/11/25
13h 10m 20m 30m 40m 50m 14h
-4
-2
0
2
4
DD
C1
Pse
udor
ange
[m]
sig(L1)=1.96mm
2003/11/25
13h 10m 20m 30m 40m 50m 14h
-80-60-40-20
020406080
DD
L1
Car
rier
Pha
se [m
m]
sig(D1)=0.06m/s
2003/11/25
13h 10m 20m 30m 40m 50m 14h
-2.0-1.5-1.0-0.50.00.51.01.52.0
DD
D1
Dop
pler
[m/s
]
Fig. 6.7 Double differences (PRN 5-6, Phoenix#2-Ref. Receiver) obtained in simulation #2 for a radiation dose rate of 5 rad/s. Cycle Slips in the carrier phase observation have been eliminated for this plot. (C1=pseudoranges, L1=carrier phases, D1=range rate form Doppler)
For the carrier phase measurements obtained from the test receivers, however, an excep-tional number of discontinuities was noticed, which could be attributed to slips by one or a few integer cycles of the L1 carrier frequency. While in previously performed terrestrial re-ceiver tests cycle slips have been encountered only very sporadically, an uncommon fre-quent occurrence was observed across all tracking channels and during almost all tests. Only for Phoenix unit #1 investigated during test #3a no such anomalies could be identified. Aside from this large number of encountered carrier cycle slips, the analysis gave no further indication of severe tracking problems.
For the observed carrier phase tracking problems, no conclusive explanation could yet be found. It is however speculated, that short-term frequency instabilities in the reference oscil-lator or similar effects induced by the radiation are the most likely cause for the encountered tracking instability. This assumption is further supported by a surprisingly large number of cycle slips, which occurred simultaneously on more then one (but not al) tracking channels.
Document No. Issue 1.0 TN 04-01
DLR/GSOC No part of this document shall be reproduced in any form or disclosed to third parties without prior authorization.
Feb. 18, 2004

Document Title: 28 Total Ionizing Dose Testing of the Orion and Phoenix GPS Receivers
This observation suggests that the encountered tracking instability has its origin outside the correlator device, for instance in the receiver’s front-end part or even more likely in the refer-ence oscillator.
Following the elimination of the integer cycle slips in the phase measurements a still slightly increased noise level of about 2.0 mm r.m.s. was determined (Tab. 6.1) compared to values of 0.5-0.7 mm typically found in previously performed receiver tests. This increase could be mainly attributed to numerous outliers recognized in the direct vicinity of the cycle slips and obviously associated with the tracking loop relaxation after a sudden jump in the observa-tions.
A closer examination of the carrier phase readings furthermore revealed an uneven statistical distribution of the cycle slips throughout the simulation intervals. Similar to the outliers dis-cerned in the velocity fixes, a clear dependence of the frequency of integer cycle slips and the accumulated radiation dose could be ascertained. The histogram in Fig 6.8 illustrates the number of detected cycle slips as a function of the absorbed radiation dose for test #2.
0
5
10
15
20
25
30
35
Num
ber o
f Cyc
le S
lips
< 2.5
krad
< 5.0
krad
< 7.5
krad
< 10.0
krad
< 12.5
krad
< 15.0
krad
< 17.5
krad
Absorbed Dose Rate [krad]
Fig. 6.8 Statistical distribution of cycle slips detected during test #2 (Phoenix #2, 5rad/s) versus absorbed dose rate.
In addition to the above analysis, a comparison of the carrier phase observations with the recorded navigation solutions has confirmed a direct relation between the occurrence of cy-cle slips and the outliers in the velocity fixes. For each recognized cycle slip a corresponding outlier in the velocity solution at the same epoch could be identified. This was however not surprising, as the receiver computes velocity fixes internally form range-rates which are de-rived form consecutive carrier phase samples. Therefore, a jump in the carrier phase obser-vations translates directly into a erroneous velocity solution. With regard to the position de-termination, on the other hand, a step in the carrier phase measurements of the observed
Document No. Issue 1.0 TN 04-01
DLR/GSOC No part of this document shall be reproduced in any form or disclosed to third parties without prior authorization.
Feb. 18, 2004

Document Title: 29 Total Ionizing Dose Testing of the Orion and Phoenix GPS Receivers
magnitude is only of marginal relevance. This may explain why no degradation of the position accuracy was found during the analyses, while the velocity fixes exhibited fairly frequent out-liers.
In a final evaluation step, the raw data collected during test #4 have been analyzed in more detail in an effort to identify the origin for the observed ramps in the position and velocity plots. Similar navigation errors have been occasionally observed previously and more fre-quently in a hardware-in-the-loop GPS signal simulator test conducted recently with an Orion receiver. However, no satisfactory explanation for this phenomena could be found so far. An inspection of a raw data arc recorded during a time interval where such navigation errors occurred gave evidence for severe tracking problems on individual channels. A sample plot for the obtained results is shown in Fig. 6.9.
2003/11/26-10:088m 9m 10m
-100-80-60-40-20
020406080
100
DD
C1
Pse
udor
ange
[m]
2003/11/26-10:088m 9m 10m
-400000-300000-200000-100000
0100000200000300000400000
DD
L1
Car
rier
Pha
se [m
m]
2003/11/26-10:088m 9m 10m
-40-30-20-10
010203040
DD
D1
Dop
pler
[m/s
]
Fig. 6.9 Ramps in code, carrier and Doppler measurements recorded at an time interval corresponding to the occurrence of large ramps in position and velocity solutions observed during test #4 with the Orion receiver #20. It is speculated that, a sudden loss-of-lock in the carrier loop caused the ramps in the Dop-pler and carrier-phase measurements which are discernable in the above graphs. Due to the tight coupling of code and carrier tracking loops, the code phase measurements were like-wise affected by this loss-of-lock. For some not understood reason, the corresponding code and carrier lock detectors did not immediately recognize the loss of signal tracking, but needed a couple of seconds to flag the measurements as invalid and restart signal search on
Document No. Issue 1.0 TN 04-01
DLR/GSOC No part of this document shall be reproduced in any form or disclosed to third parties without prior authorization.
Feb. 18, 2004

Document Title: 30 Total Ionizing Dose Testing of the Orion and Phoenix GPS Receivers
the relevant channel. Within a few seconds thereafter, signal re-acquisition was achieved and valid raw date were again available for the computation of the navigation solution.
Due to the fact that these tracking and navigation errors occurred only in the Orion receiver and furthermore since both receiver types are running an essentially identical firmware, the problem is unlikely to represent a principal flaw of the tracking software.
Document No. Issue 1.0 TN 04-01
DLR/GSOC No part of this document shall be reproduced in any form or disclosed to third parties without prior authorization.
Feb. 18, 2004
Document Title: 31 Total Ionizing Dose Testing of the Orion and Phoenix GPS Receivers
7. Post-Radiation Receiver Evaluation
In according with ESA and NASA specifications for total ionizing dose testing, the employed receiver boards have further been inspected in regular intervals after the termination of ex-posure. These tests essentially allowed an assessment of post-irradiation annealing proc-esses taking place inside the radiation affected electronic components.
Already a few minutes after end of radiation exposure most test receivers resumed data transmission. However, the transmitted messages were heavily corrupted and frequent re-ceiver reboots in intervals of a few seconds were encountered. Consequently, the receivers were unable to acquire satellite signals or to achieve 3D navigation and thus no further re-ceiver evaluation could be carried through at that stage.
Approximately three hours following the end of the radiation test Phoenix unit #3 stated again to provide continuous and valid data sentences. Due to evidently available initialization data stored in the receivers NVM, a sufficient number of GPS satellites for computing a navigation solution could be acquired within a few minutes after activation. However, the receiver con-tinued to exhibit an significantly unstable operating behavior, indicated by still frequent re-boots in irregular intervals of a few seconds up to several minutes. A comparable behavior could be observed for all other tested devices except for Phoenix receiver #1, which couldn’t be reactivated at all. For Orion unit #19, a closer hardware inspection revealed that appar-ently the I/F board caused the hardware-breakdown. Connected to a non-irradiated I/F-board the receiver was functioning almost nominal while the irradiated I/F-unit delivered a supply voltage of only 2.5 V to the interface connector’s power-out pin.
As key electrical parameter the receiver’s current consumption has been measured and re-corded during the post-radiation tests. Table 7.1 provides a comparison of values measured close to the receiver break-down and readings obtained approximately 4 weeks after end of tests. Throughout the post-irradiation tests only marginal variations in the power consumption were observed and no indication was given for a further degradation of the electronic devices subsequent to the end of exposure, nor for any kind of recovery or self-healing effect. This suggests that the recognized increase in the power drain results essentially from a perma-nent degradation of the electronic components due to the absorbed TID, rather than a tem-porary effect.
Table 7.1 Test receiver current consumption measured briefly before the hardware break-down and about four week (03/12/19) thereafter in the laboratory.
# Receiver Current drain
Receiver break-down After annealing (four weeks)
1 Phoenix #03 199 mA @ 5 V 195 mA @ 5 V 2 Phœnix #02 232 mA @ 5 V 219 mA @ 5 V 3 Phoenix #01 200 mA @ 5 V 110 mA @ 5 V (non-functioning) 4 Orion #19 234 mA @ 12 V 210 mA @ 12 V 5 Orion #20 363 mA @ 5 V 375 mA @ 5 V
In addition to evaluating the post-radiation electrical parameter the basic tracking and naviga-tion performance has been assessed during the post-irradiation receiver tests. In particular, the offset of the reference oscillators and the frequency rates have been continuously meas-ured over a period of more than one week after the end of the tests. Fig. 7.1 illustrates the apparent “recovery” of the reference oscillator of Phoenix unit #3. The other irradiated GPS receivers exhibited a rather similar oscillator behavior during the performed investigations.
Document No. Issue 1.0 TN 04-01
DLR/GSOC No part of this document shall be reproduced in any form or disclosed to third parties without prior authorization.
Feb. 18, 2004

Document Title: 32 Total Ionizing Dose Testing of the Orion and Phoenix GPS Receivers
Other the for the increase in the current consumption, the radiation induced changes in the oscillator can (at least in part) be considered as a temporary effects and the device obviously features a certain self-heal capability.
0
5000
10000
15000
20000
25000
30000
26.11
.03 0:
00
27.11
.03 0:
00
28.11
.03 0:
00
29.11
.03 0:
00
30.11
.03 0:
00
1.12.0
3 0:00
2.12.0
3 0:00
3.12.0
3 0:00
4.12.0
3 0:00
5.12.0
3 0:00
Date and Time (UTC)
Osc
illato
r Offs
et [H
z]
Fig. 7.1 Oscillator relaxation observed in the post-irradiation tests for Phoenix receiver #3
Furthermore, a still notably increased number of cycle slips could be recognized throughout the post-radiation inspections for all functioning receivers. This indicates an obviously still severely degraded carrier phase tracking performance resulting in frequent velocity outliers as observed during the radiation exposure.
Document No. Issue 1.0 TN 04-01
DLR/GSOC No part of this document shall be reproduced in any form or disclosed to third parties without prior authorization.
Feb. 18, 2004

Document Title: 33 Total Ionizing Dose Testing of the Orion and Phoenix GPS Receivers
Summary and Conclusions
Within a series of total ionizing dose radiation tests, several DLR Orion and Phoenix GPS receiver have been evaluated with regard to their tolerance against radiation typically en-countered in space applications. The tests have been carried out at the Fraunhofer Institute for Technological Trend Analysis (FhG/INT) using a Cobalt-60 gamma radiation source. In contrast to previously performed radiation tests, the analysis was not confined to electrical parameters only, but also included an investigation of the tracking and navigation perform-ance during and after the illumination. This was achieved by providing the receiver inside the radiation chamber with real GPS received by a roof antenna and operating a reference re-ceiver outside the test chamber in a zero-baseline configuration. All tested devices provided continuous and reliable navigation information up to an absorbed dose of approximately 14 to 17 krad. As expected, an continuous increase of the current con-sumption was observed during the test. It reached a maximum of roughly 10-20% of the pre-radiation value for the Orion and 25-45% for the Phoenix receivers. Receiver break-down was finally marked by the termination of data transmission accompanied by a sudden drop in the current drain. A constant frequency drift of the reference oscillator at a rate of about –2 ppm/krad was, fur-thermore, recognized during all tests from the very beginning of the illumination. It is unclear at present, whether this large drift can be attributed to the oscillator crystal itself or is caused by the temperature compensation electronics within the TCXO. On the other hand, a gradual relaxation of the frequency offset was observed in post radiation test. Therefore, the self-healing might just compensate the degradation caused by the incident ionizing radiation at low radiation doses and oscillator offsets might not be a concern for real space applications. The analysis of the tracking and navigation data has revealed no anomalies for the code and Doppler tracking data. The carrier phase readings on the other hand exhibited an unusual large number of integer cycle slips, resulting in erroneous carrier-phase-derived range-rate values and thus frequent outliers in the velocity fixes. A notably degraded position accuracy was only observed during a test with an Orion receiver and an applied dose rate of 5 rad/s,. It can most likely be attributed to effects caused by the high radiation beam intensity rather than to the absorbed total dose. The identified navigation errors can to a large extent be handled by a data post-processing performed on ground or even in near real-time by applying suitable filter algorithms inside the receiver. Moreover, the observed effects are obviously depending on the dose rate which was much higher in all tests than typically encountered onboard a spacecraft during a real LEO mission. Although the test haven’t been carried out in full compliance with current ESA or NASA specifications for radiation testing of electronic components, they yet contribute to a better understanding of how the receiver will behave in a space radiation environment. Moreover, the tests provide valuable information on the survivability of COTS GPS receivers in a space environment.
Document No. Issue 1.0 TN 04-01
DLR/GSOC No part of this document shall be reproduced in any form or disclosed to third parties without prior authorization.
Feb. 18, 2004

Document Title: 34 Total Ionizing Dose Testing of the Orion and Phoenix GPS Receivers
Acknowledgement
The radiation tests presented in this paper have been carried through at the Fraunhofer Insti-tute for Technological Trend Analysis INT in Euskirchen, Germany. The authors would like to gratefully thank Dr. Metzger and all colleagues involved in this test campaign for their kind support and many interesting discussions.
Document No. Issue 1.0 TN 04-01
DLR/GSOC No part of this document shall be reproduced in any form or disclosed to third parties without prior authorization.
Feb. 18, 2004

Document Title: 35 Total Ionizing Dose Testing of the Orion and Phoenix GPS Receivers
Notation and Symbols
AE8 Trapped Electron Model AP8 Trapped Proton Model ARM Advanced Risc Machines C/A Coarse Acquisition C/N0 Carrier-to-Noise COTS Commercial Off-The-Shelf DC Direct Current DLR German Aerospace Center DUT Device Under Test EPROM Erasable Programmable Read Only Memory ESA European Space Agency EV Electron Volt FhG Fraunhofer Gesellschaft GCR Galactic Cosmic Ray GPS Global Positioning System GSOC German Space Operations Center I/F Interface INT Institute for Technological Trend Analysis LEO Low Earth Orbit LNA Low Noise Amplifier N/A Not Available, Not Applicable NASA National Aeronautic and Space Administration PLL Phase-Locked Loop PPM Parts per Million PRN Pseudorandom Noise RAD Radiation Absorbed Dose RAM Random Access Memory R/F Radio Frequency SEE Single Event Effects SRAM Synchronous Random Access Memory TCXO Temperature Compensated Quartz Oscillator TID Total Ionizing Dose UART Universal Asynchronous Receiver/Transmitter aFR Acceleration dOSC Constant frequency drift rate r Distance between radiation source and target λL1 Wavelength for the GPS L1 frequency φ Radiation dose rate
Document No. Issue 1.0 TN 04-01
DLR/GSOC No part of this document shall be reproduced in any form or disclosed to third parties without prior authorization.
Feb. 18, 2004

Document Title: 36 Total Ionizing Dose Testing of the Orion and Phoenix GPS Receivers
Document No. Issue
DLR/GSOC No part of this document shall be reproduced in any form or disclosed to third parties without prior authorization.
1.0 TN 04-01 Feb. 18, 2004
References [1] Kayali S.; Utilization of COTS Electronics in Space Application, Reliability Challenges and Reality; Commer-
cialization of Military and Space Electronics Conference & Exhibition, Los Angeles, CA , 12-13 Feb. 2002.
[2] Häusler B.; Space Radiation Environmentally Induced Spacecraft Anomalies And Associated Effects; Univer-sity of Armed Forces Munich (UniBwM), September 1995.
[3] ESA/ESTEC; ESA Space Environments and Effects Home Page - The Radiation Environment; http://www.estec.esa.nl/wmwww/wma/Background/rad_env.html#Hess, 2003.
[4] Howard J.W., Hardage D.M.; Space Environments Interactions: Space Radiation and Its Effects on Elec-tronic Systems; NASA/TP-1999-209373, Systems Analysis and Integration Laboratory, Science and Engi-neering Directorate, NASA Marshall Space Flight Center, July 1999.
[5] Schombert J.; History of Space Flight – Lecture 9; University of Oregon, Department of Physics http://zebu.uoregon.edu/~js/space/lectures/lec09.html, 2004.
[6] NSSDC (National Space Science Data Center); Space Environments and Effects (SEE) Program; NASA, http://see.msfc.nasa.gov/ire/models.html, 2003.
[7] BIRA (Belgian Institute for Space Aeronomy); SPENVIS – Space Environment Information System ; http://www.spenvis.oma.be/spenvis/, 2004.
[8] Fortescue P., Stark J.; Spacecraft System Engineering (2nd Edition); John Wiley & Sons Ltd., New York, 1995.
[9] Holbert K.E.; Total Ionizing Dose; Arizona State University Main, Department of Electrical Engineering, http://www.eas.asu.edu/~holbert/eee460/tiondose.html, 2004.
[10] GPS Orion 12 Channel GPS Receiver Design; DS4808; Mitel Semiconductor; Issue 1.3, August 1997.
[11] GP2021 GPS 12 Channel Correlator; DS4077; Mitel Semiconductor; Issue 2.6, July 1996.
[12] MG5000 Series GPS Receiver User’s Guide; MG5-200-GUIDS-User Guide, Sigtec Navigation Pty Ltd, Is-sue B.T08, August 2003.
[13] GP4020 GPS Receiver Baseband Processor; DS5134, Zarlink Semiconductor, Issue 4.4, May 2002.
[14] ESA/SSC; Total Dose Steady-State Irradiation Test Method; ESA/SCC BASIC Specification No. 22900 Iusse/Rev. 4, April 1995.
[15] Dentan M.; Overview of the ATLAS Policy on Radiation Tolerant Electronics; Proceedings of the 6thWorkshop on Electronics for LHC Experiments, CERN-2001-005/CERN-LHCC-2001-034, Oct.2001.
[16] Vig J. R.; Introduction to Quartz Frequency Standards; Research and Development Technical Report, CE-COM-TR-97-3. U.S. Army Communications-Electronics Command Research, Development and Engineering Center. Fort Monmouth, NJ, 1997.