total cost of ownership (tco): comparing system z and ... · ibm systems and technology group 2007...
TRANSCRIPT

IBM Systems and Technology Group 2007
© 2007 IBM Corporation
Total Cost of Ownership (TCO): Comparing System z and Distributed Platforms
Chris RohrbachSenior IT Consultant
Marlin MaddyExecutive IT [email protected]
February 15, 2007Session 9265

IBM Systems and Technology Group 2007
2 © 2007 IBM Corporation
TrademarksThe following are trademarks of the International Business Machines Corporation in the United States and/or other countries.
The following are trademarks or registered trademarks of other companies.
Intel is a trademark of the Intel Corporation in the United States and other countries.Linux is a registered trademark of Linus Torvalds in the United States, other countries, or both.Java and all Java-related trademarks and logos are trademarks or registered trademarks of Sun Microsystems, Inc., in the United States and other countries.Microsoft, Windows and Windows NT are registered trademarks of Microsoft Corporation.UNIX is a registered trademark of The Open Group in the United States and other countries.
* All other products may be trademarks or registered trademarks of their respective companies.
Notes: Performance is in Internal Throughput Rate (ITR) ratio based on measurements and projections using standard IBM benchmarks in a controlled environment. The actual throughput that any user will experience will vary depending upon considerations such as the amount of multiprogramming in the user's job stream, the I/O configuration, the storage configuration, and the workload processed. Therefore, no assurance can be given that an individual user will achieve throughput improvements equivalent to the performance ratios stated here.
IBM hardware products are manufactured from new parts, or new and serviceable used parts. Regardless, our warranty terms apply.
All customer examples cited or described in this presentation are presented as illustrations of the manner in which some customers have used IBM products and the results they may have achieved. Actual environmental costs and performance characteristics will vary depending on individual customer configurations and conditions.
This publication was produced in the United States. IBM may not offer the products, services or features discussed in this document in other countries, and the information may be subject to change without notice. Consult your local IBM business contact for information on the product or services available in your area.
All statements regarding IBM's future direction and intent are subject to change or withdrawal without notice, and represent goals and objectives only.
Information about non-IBM products is obtained from the manufacturers of those products or their published announcements. IBM has not tested those products and cannot confirm the performance, compatibility, or any other claims related to non-IBM products. Questions on the capabilities of non-IBM products should be addressed to the suppliers of those products.
Prices subject to change without notice. Contact your IBM representative or Business Partner for the most current pricing in your geography.
This presentation and the claims outlined in it were reviewed for compliance with US law. Adaptations of these claims for use in other geographies must be reviewed by the local country counsel for compliance with local laws.
* Registered trademarks of IBM Corporation
AIX*AS/400*DB2*DB2 Universal DatabaseIBM*IBM eServerIBM logo*On Demand Business logopSeries*S/390*
System z9Tivoli*WebSphere*z/OS*z/VM*zSeries*

IBM Systems and Technology Group 2007
3 © 2007 IBM Corporation
A recent article
http://www-306.ibm.com/software/swnews/swnews.nsf/n/cres6x3lc8

IBM Systems and Technology Group 2007
4 © 2007 IBM Corporation
Have you heard/made these statements?
" My mainframe cost 2x, 5x, 10x compared to
my distributed environment“ Mainframe
“Mainframe software costs are expensive and are driving me off the platform” Mainframe
"We are on a get off the mainframe strategy“Mainframe
"We keep adding servers and people“Distributed
“Our infrastructure can not support our servers”Distributed
IBM Systems and Technology Group 2007
5 © 2007 IBM Corporation
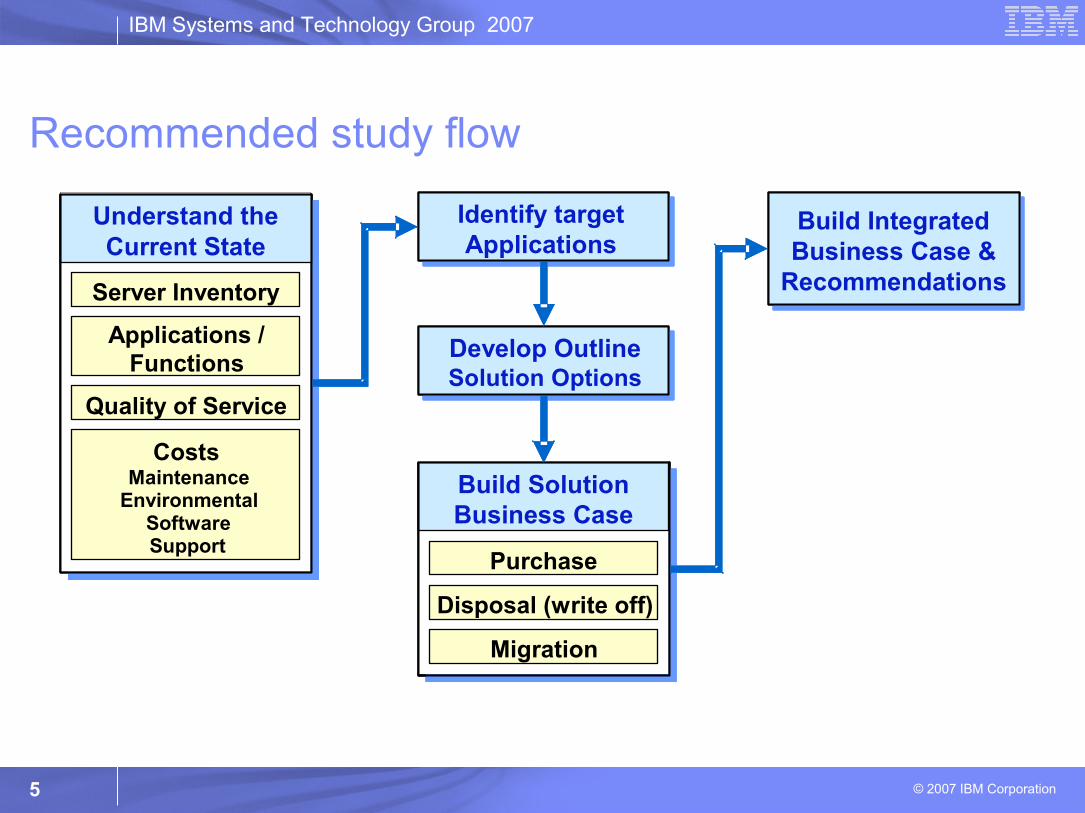
Build SolutionBusiness Case
Purchase
Disposal (write off)
Migration
Develop OutlineSolution Options
Develop OutlineSolution Options
Select OpportunityAreas
Select OpportunityAreas
Build IntegratedBusiness Case &
Recommendations
Build IntegratedBusiness Case &
Recommendations
Understand theCurrent State
Server Inventory
Applications /Functions
Boundaries
CostsMaintenance
EnvironmentalSoftwareSupport
Build SolutionBusiness Case
Purchase
Disposal (write off)
Migration
Build SolutionBusiness Case
Purchase
Disposal (write off)
Migration
Develop OutlineSolution Options
Develop OutlineSolution Options
Select OpportunityAreas
Identify target Applications
Build IntegratedBusiness Case &
Recommendations
Build IntegratedBusiness Case &
Recommendations
Understand theCurrent State
Server Inventory
Applications /Functions
Boundaries
CostsMaintenance
EnvironmentalSoftwareSupport
Understand theCurrent State
Server Inventory
Applications /Functions
Quality of Service
CostsMaintenance
EnvironmentalSoftwareSupport
Recommended study flow
IBM Systems and Technology Group 2007
© 2007 IBM Corporation
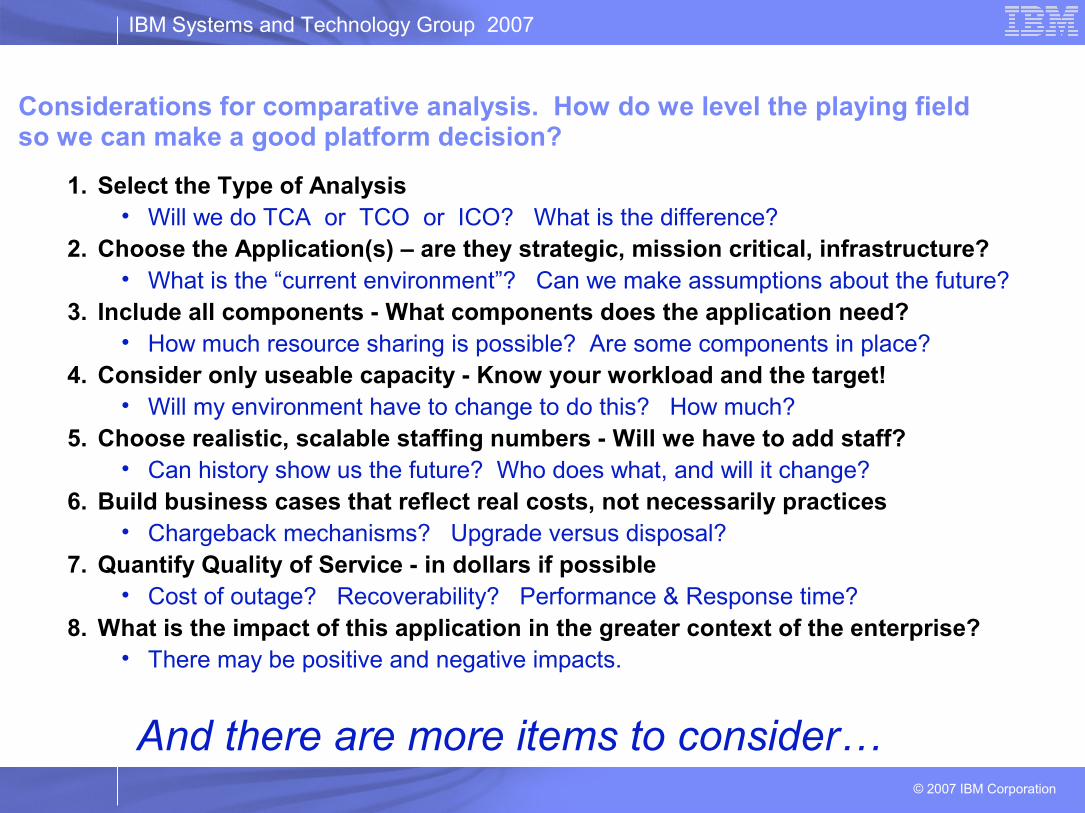
Considerations for comparative analysis. How do we level the playing field so we can make a good platform decision?
1. Select the Type of Analysis • Will we do TCA or TCO or ICO? What is the difference?
2. Choose the Application(s) – are they strategic, mission critical, infrastructure?• What is the “current environment”? Can we make assumptions about the future?
3. Include all components - What components does the application need? • How much resource sharing is possible? Are some components in place?
4. Consider only useable capacity - Know your workload and the target!• Will my environment have to change to do this? How much?
5. Choose realistic, scalable staffing numbers - Will we have to add staff?• Can history show us the future? Who does what, and will it change?
6. Build business cases that reflect real costs, not necessarily practices • Chargeback mechanisms? Upgrade versus disposal?
7. Quantify Quality of Service - in dollars if possible • Cost of outage? Recoverability? Performance & Response time?
8. What is the impact of this application in the greater context of the enterprise? • There may be positive and negative impacts.
And there are more items to consider…

IBM Systems and Technology Group 2007
© 2007 IBM Corporation
1.Select the type of analysis 1. Total Cost of Acquisition (TCA)
The easiest and fastest to do Typically considers new hardware and software Well oriented to computer professionals - forward looking, technology based, no financials Vendors love it - oriented to glossy brochures, a functional matrix/cost comparison The least useful to IT department - leads to complexity and duplication
2. Total Cost of Ownership (TCO)• Not as easy to do, but still project oriented• Typically considers new hardware, software, environmentals, staff, and other • Many Rules of Thumb in the press - sense of security • Consultants love it - easy to add value, difficult to confirm - fishing expeditions• Useful to gain understanding of cost growth areas
3. Incremental Cost of Ownership (ICO)• Most accurate • Most difficult and thus most infrequently used - usually one-of-a-kind• Depends on understanding the current environment - implementation context• Typically considers current and new hardware, software, environmentals, staff, and other • Can include or exclude the cost of strategic change - one project can fund another• Is NOT the budget $$ divided by MIPS or machines, times the new stuff!
IBM Systems and Technology Group 2007
© 2007 IBM Corporation
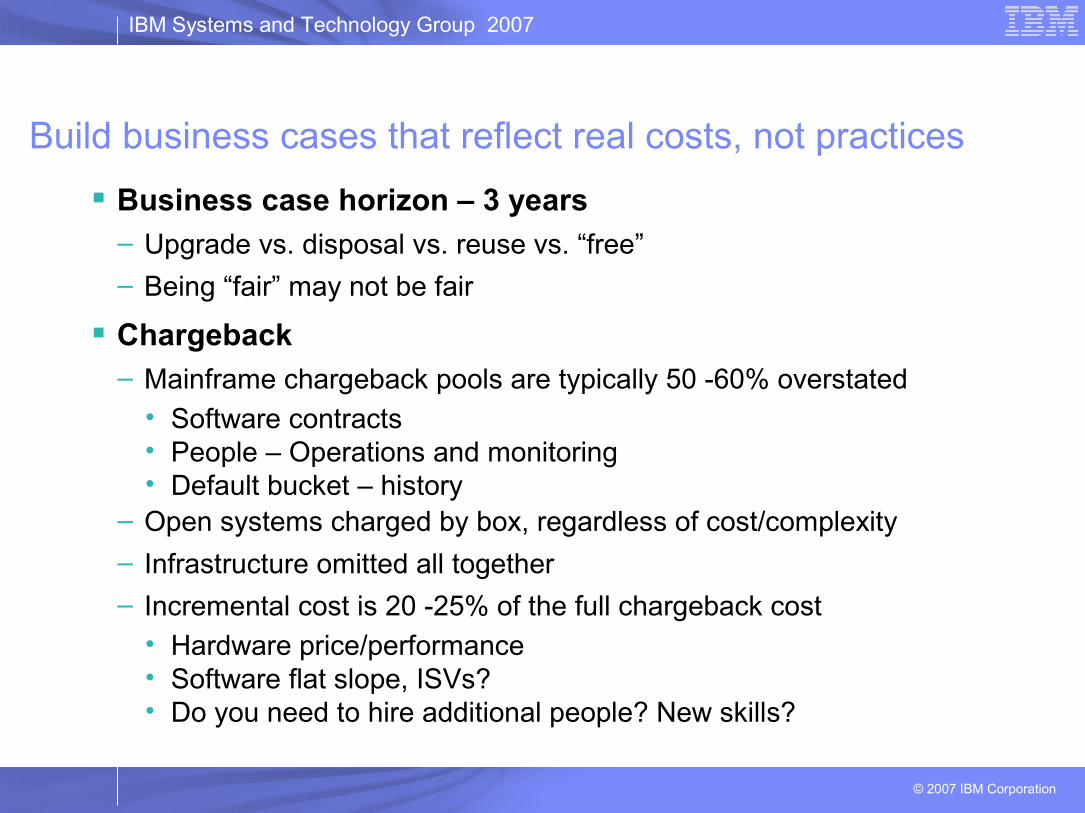
Build business cases that reflect real costs, not practices
Business case horizon – 3 years– Upgrade vs. disposal vs. reuse vs. “free”
– Being “fair” may not be fair
Chargeback– Mainframe chargeback pools are typically 50 -60% overstated
• Software contracts• People – Operations and monitoring• Default bucket – history
– Open systems charged by box, regardless of cost/complexity
– Infrastructure omitted all together
– Incremental cost is 20 -25% of the full chargeback cost• Hardware price/performance• Software flat slope, ISVs?• Do you need to hire additional people? New skills?

IBM Systems and Technology Group 2007
9 © 2007 IBM Corporation
People expense has tripled as a % Software expense has doubled as a %
Hardware is less than 1/3 of its original %
1995
People14%
Other7%
Hardware65%
Software14%
2004
Other9%
Hardware18%
People45%
Software28%
Throughout the past 10 years the cost dynamics of supporting corporate IT infrastructures has changed significantly as has the landscape.
We typically see…
IBM Systems and Technology Group 2007
10 © 2007 IBM Corporation
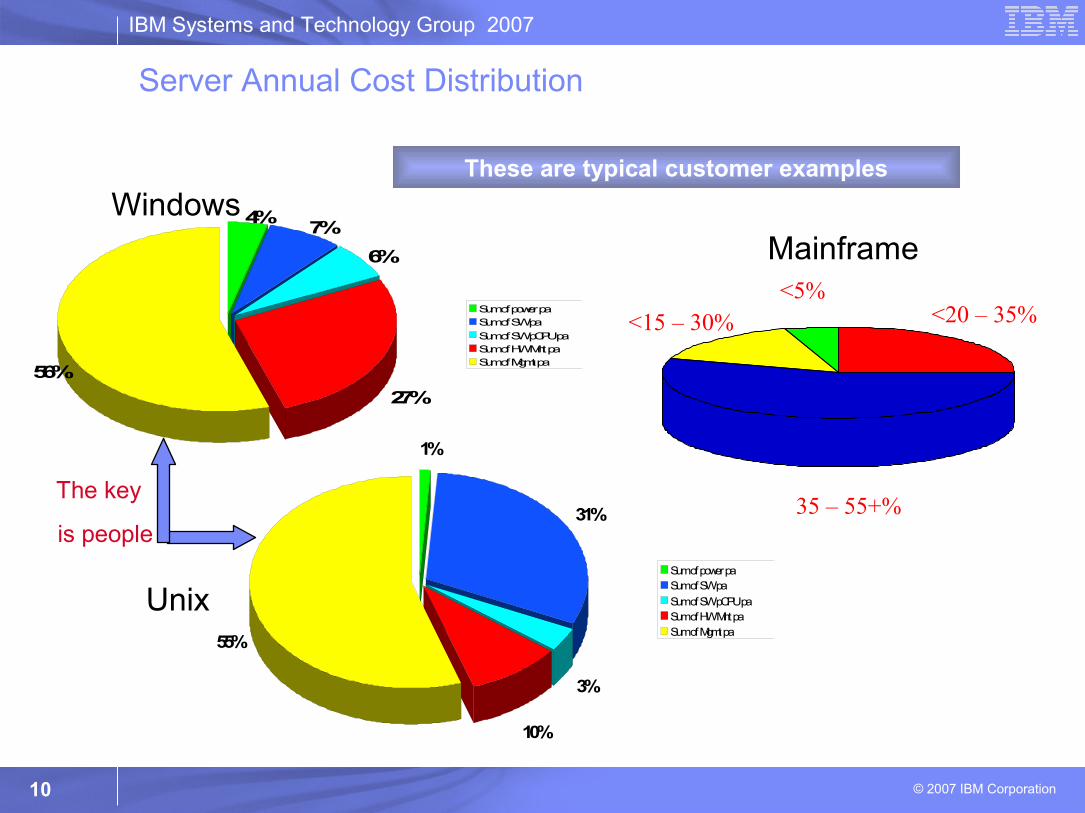
Server Annual Cost Distribution
4%7%
6%
27%
56%
Sum of power paSum of SW pa
Sum of SW pCPU paSum of HW Mnt paSum of Mgmt pa
These are typical customer examples
1%
31%
3%
10%
55%
Sum of power paSum of SW pa
Sum of SW pCPU paSum of HW Mnt paSum of Mgmt pa
<20 – 35%<5%
<15 – 30%
35 – 55+%
Windows
Unix
Mainframe
The key
is people

IBM Systems and Technology Group 2007
11 © 2007 IBM Corporation
Cost of mgmt. & admin. 10% CAGRNew server spending (USM$) 3% CAGR
Spending (USB$) Installed Base (M Units)
$0
$20
$40
$60
$80
$100
$120
$140
$160
$180
$200
1996 ’97 ’98 ’99 2000 ’01 ’02 ’03 ’04 ’05 ’06 ’07 ’08
5
10
15
20
25
30
35
Source: IDC
IDC Finds that Since 2000, Labor Costs Have Exceeded the Cost of All Servers … and are Still Growing
Distributed scale-out is costly!

IBM Systems and Technology Group 2007
12 © 2007 IBM Corporation
Server utilization varies significantly by platform and that needs to be accounted for in the business case. The mainframe environment is used most
efficiently, but is it the most or least expensive .
* system capacity (tpms) is an approximation of the transaction processing capability of each system. It cannot be compared to other commercial ratings or benchmarks and is invalid outside of the context of this IBM study.
Installed Capacity: 33M tpms*
Used Capacity: 4M tpms*
Installed vs. Used capacity
Typical Utilization Mainframe 80 – 90%Unix 10 – 20% Wintel 5 – 12%
IBM Systems and Technology Group 2007
13 © 2007 IBM Corporation
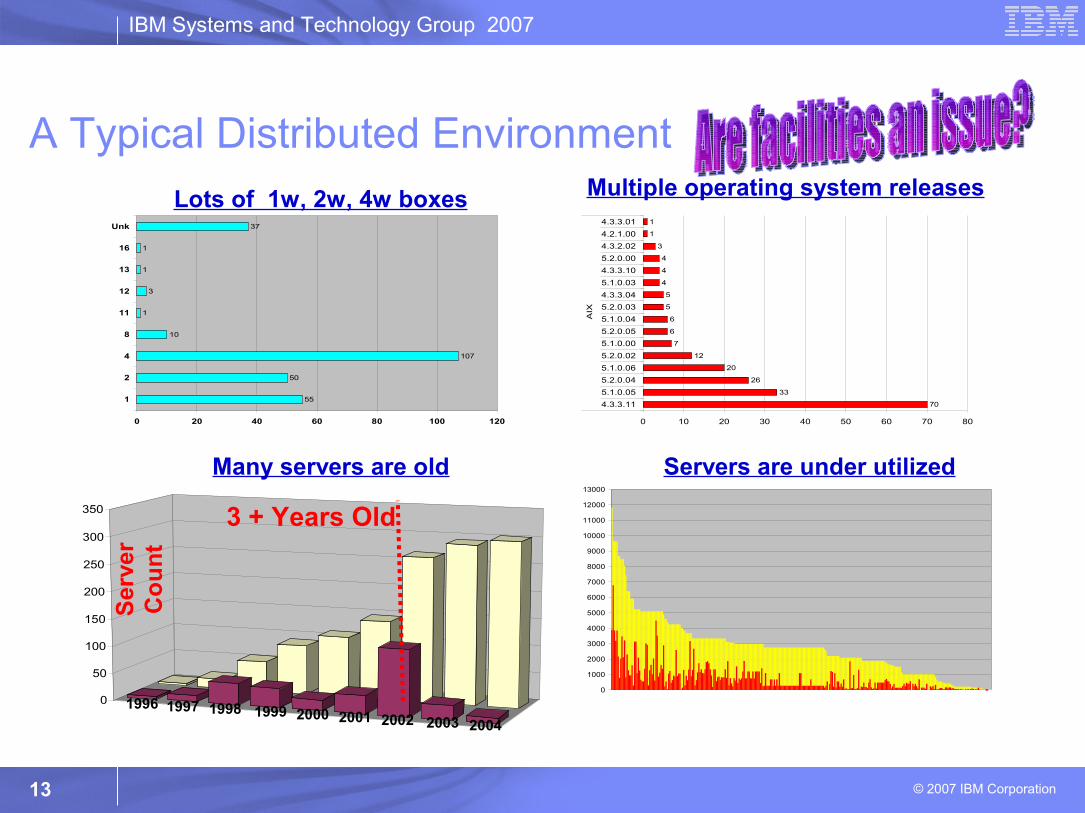
A Typical Distributed Environment
55
50
107
10
1
3
1
1
37
0 20 40 60 80 100 120
1
2
4
8
11
12
13
16
Unk
70
33
26
20
12
7
6
6
5
5
4
4
4
3
1
1
0 10 20 30 40 50 60 70 80
4.3.3.11
5.1.0.05
5.2.0.04
5.1.0.06
5.2.0.02
5.1.0.00
5.2.0.05
5.1.0.04
5.2.0.03
4.3.3.04
5.1.0.03
4.3.3.10
5.2.0.00
4.3.2.02
4.2.1.00
4.3.3.01
AIX
0
1000
2000
3000
4000
5000
6000
7000
8000
9000
10000
11000
12000
13000
Servers are under utilized
Multiple operating system releasesLots of 1w, 2w, 4w boxes
Many servers are old
0
50
100
150
200
250
300
350 3 + Years Old
Ser
ver
Co
un
t
1996 1997 1998 1999 2000 2001 2002 2003 2004

IBM Systems and Technology Group 2007
14 © 2007 IBM Corporation
“Power and cooling will be a top 3 issue with all CIO’s in the next
6-12 months”Michael Bell – Gartner Group
“Power and cooling costs will increase to more than one-third of the total
IT budget”Robert Frances Group, January 2006
“The cost of datacenter floor space is inconsequential compared with the
cost of operating and cooling a datacenter”
“You pay once to power the systems and again to cool them”
Information Week, February 2006
“And again and again for” redundancy
Marlin Maddy, February 2006
0% 5% 10% 15% 20% 25% 30% 35%
None of the above
Poor location
Excessive facility cost
Insufficient raised floor
Insufficient power
Excessive heat
What is the greatest facility problem with your primary data center?
Gartner 2006
Power and cooling exceeds server spending
$0
$10
$20
$30
$40
$50
$60
$70
$80
1996 1997 1998 1999 2000 2001 2002 2003 2004 2005 2006 2007 2008 2009
Installed base(M units)
2
4
6
8
10
12
14
16
18
Spending
(US$B)
New server spending
Power and cooling
IDC 2006
IBM Systems and Technology Group 2007
15 © 2007 IBM Corporation
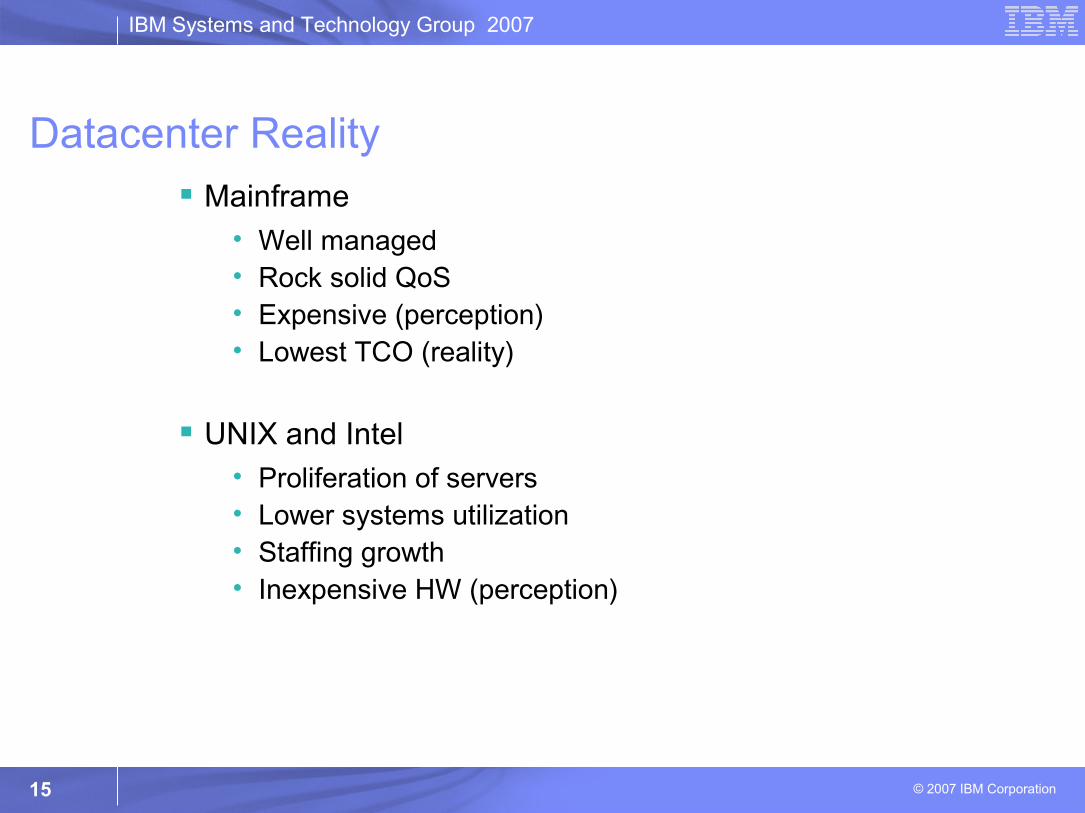
Datacenter Reality Mainframe
• Well managed• Rock solid QoS• Expensive (perception) • Lowest TCO (reality)
UNIX and Intel• Proliferation of servers• Lower systems utilization• Staffing growth• Inexpensive HW (perception)

IBM Systems and Technology Group 2007
16 © 2007 IBM Corporation
Server ProliferationDescribe a current application environment
–Production•Database server? How many?•Application server? How many?•Messaging server? How many? •Failover servers? For each?
–Additional Servers•Development servers? Multiple levels?•Test servers? Multiple levels?•Systems test? Multiple levels?•Quality Assurance servers?•Education servers?
–Disaster Recovery•Do you have a DR site?
How many applications/types of workload do you have?

IBM Systems and Technology Group 2007
17 © 2007 IBM Corporation
Web/App
Database
Messaging MessagingF/O
Web/AppD/R& QA
8wHardware - 3 primary production servers
- 16 total servers 5:1 ratio
???
Software
- 32+ processors for database software~ $1.8M for 3yrs
- 15+ processors for application software
2-4w
Development Test
Test/Education Integration
2-4w 2-4w
2-4w2-4w
D/R F/O
Messaging D/R & QA
D/R F/O
D/R F/ODatabase D/R & QA
8w 8w
2-4w2-4w
2-4w2-4w
2-4w
App F/O
DatabaseF/O
8w
2-4w
2-4w
e-business Servers - Complexity and Cost

IBM Systems and Technology Group 2007
18 © 2007 IBM Corporation
Why is utilization low?Use of response time as a measure of capacity
–Buy rather than tune
Backup, development, test, training and integration servers
Peaked, spiky workloads on dedicated rather than shared hardware
I/O Bound workloads, contention
Utilization controlled to avoid system stress and outages
Incompatible release levels
Incompatible maintenance windows

IBM Systems and Technology Group 2007
19 © 2007 IBM Corporation
Mainframe UNIX Intel
People Efficiency Very Good Average to Low Very Goodtend to be cloned
infrastructure applications
Prime Shift UtilizationVery high (65-85%) Fair/Good (10-20%) Very low (1- 8%)
Online Availability Excellent (99.9-99.95%)
* DB2® avail. = 99.98%
Fair/Good (98.5-99.7%)
* Oracle avail. = 99.35
Not known(97.0-99.0%)
Total Spend / Year .. M$ / year .. M$ / year .. M$ / year
Usual Incremental Cost Ratio to Mainframe
1.0 0.9 – 1.5 x** IBM System p® 0.7 - 1.2x
<1.0 - 4.0 x
Typical Incremental to Current Cost Ratio
20 - 25 % 50 - 60% 50 - 60%
Example
* actual customer measurement
** based on multiple studies
Summary of Server Scorecard Metrics

IBM Systems and Technology Group 2007
20 © 2007 IBM Corporation
Customer perception: Solaris environment is 1/5 the cost of the mainframe
Customer Studies WebSphere® customer
Hardware
– 5000+ MIPS
– 1000+ servers (25% UNIX)
Software
– WebSphere currently on Solaris
– Oracle and DB2®

IBM Systems and Technology Group 2007
21 © 2007 IBM Corporation
HTTP Server Layer
Firewall(s)
Firewall(s)
Web App Server Layer
DB2 Universal Database™ Session DB
PROD3Oracle Data Mart
PROD2Oracle
PROD1
Oracle
S/390® production databases and transactions
Internal HTTP servers -- prod1 - 4
LOB production systems and
transaction
WAS WAS WAS WAS WAS WAS
External HTTP serversv-- prod1-6
PROD1 - 6
Source: Scorpion Study 1999 - 2004
Current Production WebSphere Environment
IBM Systems and Technology Group 2007
22 © 2007 IBM Corporation
UDBwudbprod2
UDBwudbprod1 Oracle Prod
prod1
Oracle Prodprod2
WebSphereprod 1
WebSphere
prod 2
WebSphereprod 3
WebSphereprod 4
Databaseprod 1
External HTTPprod1
External HTTProd2
External HTTPprod3
External HTTPprod4
??webev1
E3500 V880 280R 4800 U2Internal HTTP
prod1
Internal HTTPprod2
280R
Internal HTTPprod3
Internal HTTPprod4
External HTTPprod5
External HTTPprod6
WebSphereprod 5
WebSphereprod 6
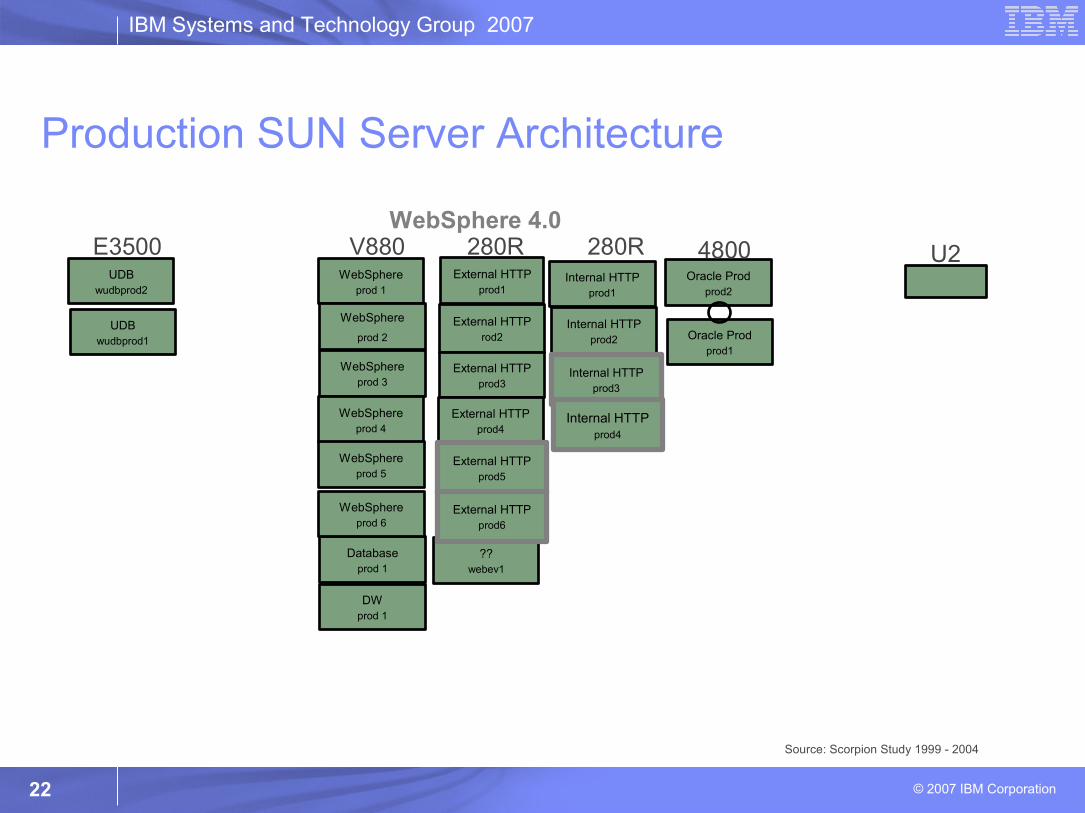
WebSphere 4.0
DWprod 1
Source: Scorpion Study 1999 - 2004
Production SUN Server Architecture

IBM Systems and Technology Group 2007
23 © 2007 IBM Corporation
U2WebSphere
UDBwudbprod2
UDBwudbprod1
Oracle Prodprod1
Oracle Prodprod2
Websphereprod 1
Websphereprod 2
Websphereprod 3
Websphereprod 4
Databaseprod 1
External HTTPprod1
External HTTProd2
External HTTPprod3
External HTTPprod4
??webev1
E3500 V880 280R 4800Internal HTTP
prod1
Internal HTTPprod2
280R
Internal HTTPprod3
Internal HTTPprod4
External HTTPprod5
External HTTPprod6
Websphereprod 5
Websphereprod 6
DWprod 1
V880
Test
D/R
Test
Test
Test
Test
Test
Test
Test
Test
Test
Test
Test
Test
Test
Development
Development
Development
Development
Development
Development
Development
Development
Development
Development
E10000 DomainsDevelopment
Development
DevelopmentDevelopmentDevelopment
Development Development Development
DevelopmentDevelopment
D/R
D/R
D/R
D/R
D/R
D/R
D/R
D/R
D/R
D/R
D/R
D/R D/RDevelopment
E250
isn’t always reality!
Customer perception was that the mainframe was 5x the cost of the existing Sun implementation
Customer Example:Distributed SUN Server Solution – perception…
Source: Scorpion Study 1999 - 2005
IBM Systems and Technology Group 2007
24 © 2007 IBM Corporation
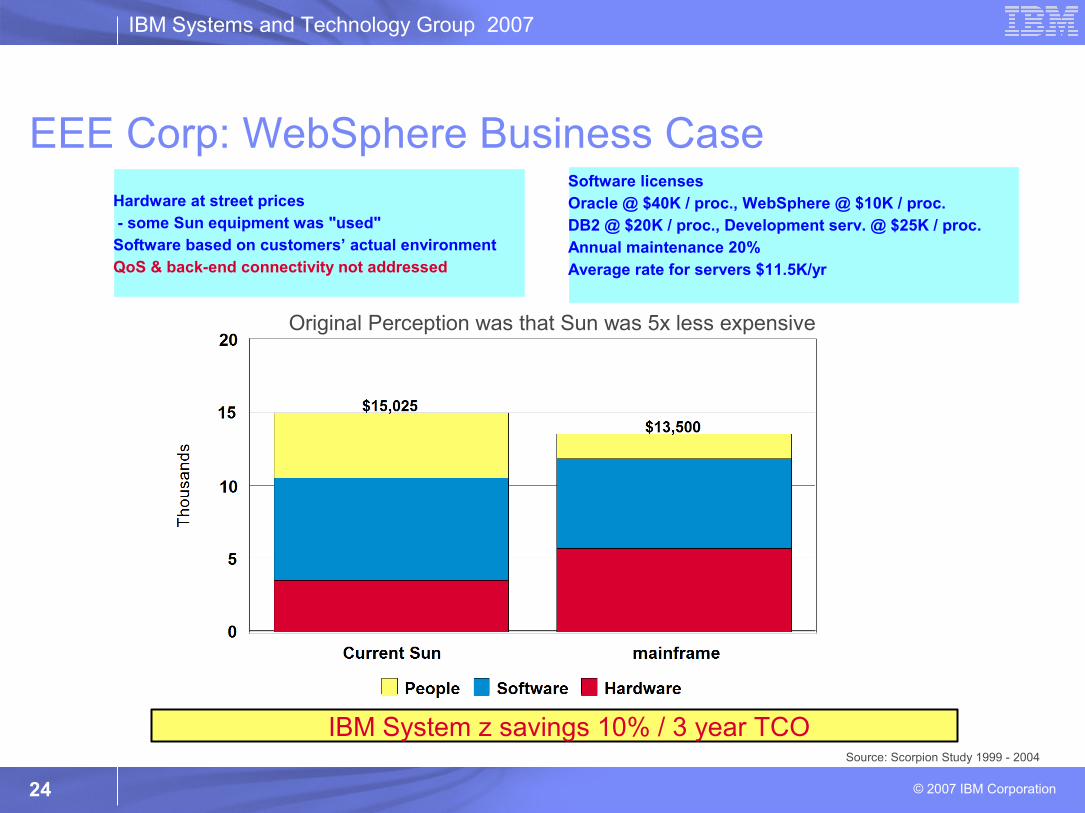
IBM System z savings 10% / 3 year TCO
Hardware at street prices - some Sun equipment was "used"Software based on customers’ actual environmentQoS & back-end connectivity not addressed
Software licensesOracle @ $40K / proc., WebSphere @ $10K / proc.DB2 @ $20K / proc., Development serv. @ $25K / proc.Annual maintenance 20%
Average rate for servers $11.5K/yr
Source: Scorpion Study 1999 - 2004
Original Perception was that Sun was 5x less expensive
EEE Corp: WebSphere Business Case

IBM Systems and Technology Group 2007
25 © 2007 IBM Corporation
G5 G6 z800 z890z900
z990z9
0.30
0.79
1.32
1.64
2.44
3.00
IFL Value Increase
IFL Capacity
% Increased Value
Machine Type
Unique Value of Integrated Facility for Linux® (IFL)
IFL Price has remained constant
IFLs move with upgrades
30% more capacity!!!
zAAP follows same model
Distributed model over same time:
– 2 Technology Refreshes (New Hardware)
– 2 System migrations

IBM Systems and Technology Group 2007
26 © 2007 IBM Corporation
3-Y
ea
r IT
Ex
pe
ns
e (
M$
)
Competitive UNIX Linux on Intel Linux on System z9 and
zSeries
Hardware
Hardware Maintenance
Software
Software Maintenance
People
Other
Source: Capricorn whitepaper
Web Trading Application CostsWebLogic/Oracle
3Year TCOYour TCO may vary:
Workload consolidation using
Linux on a mainframe can result
in significant TCO savings
4.9x4.9x
2.3x2.3x
Source: Scorpion Study 1999 - 2005
Potential for dramatic reductions in software expense for processor based licenses
Significant reductions in power and cooling costs are typical
–Cost curve is not linear: when will infrastructure break?
–
People savings from virtualization
Increased processor utilization
TCO Impact of Mainframe Consolidations

IBM Systems and Technology Group 2007
27 © 2007 IBM Corporation
-14%
-49%
-37%
-10%
With zAAP processors, zSeries savings would have been 37%
Source: Scorpion Study 1999 - 2004
What about zSeries Application Assist Processors (zAAPs)?
IBM Systems and Technology Group 2007
28 © 2007 IBM Corporation
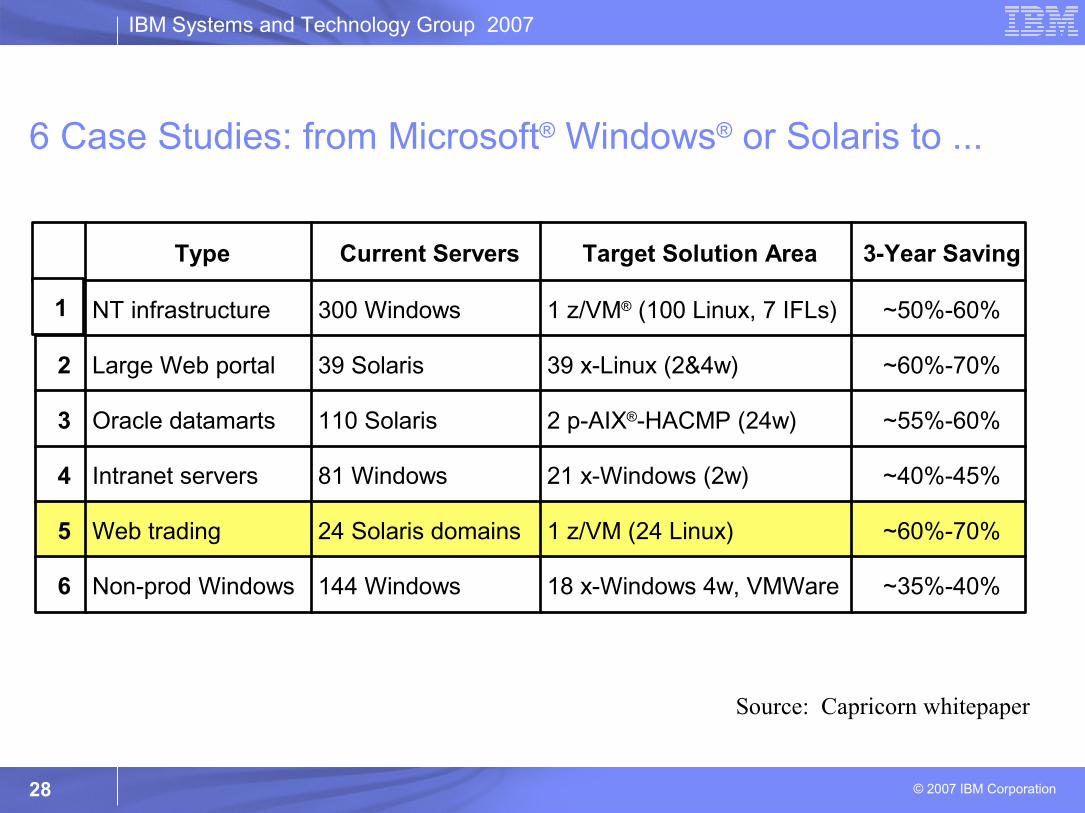
Type Current Servers Target Solution Area 3-Year Saving
NT infrastructure 300 Windows 1 z/VM® (100 Linux, 7 IFLs) ~50%-60%
2 Large Web portal 39 Solaris 39 x-Linux (2&4w) ~60%-70%
3 Oracle datamarts 110 Solaris 2 p-AIX®-HACMP (24w) ~55%-60%
4 Intranet servers 81 Windows 21 x-Windows (2w) ~40%-45%
5 Web trading 24 Solaris domains 1 z/VM (24 Linux) ~60%-70%
6 Non-prod Windows 144 Windows 18 x-Windows 4w, VMWare ~35%-40%
Source: Capricorn whitepaper
6 Case Studies: from Microsoft® Windows® or Solaris to ...
1

IBM Systems and Technology Group 2007
29 © 2007 IBM Corporation
What Makes the Best Fit for z
Leverage classic strengths of the zSeries – High availability
– High i/o bandwidth capabilities
– Flexibility to run disparate workloads concurrently
– Requirement for excellent disaster recovery capabilities
– Security– Facilities - 15 yrs ago did you think facilities would be a mainframe strength
Shortening end to end path length for applications– Collocation of applications
– Consolidation of applications from distributed servers
– Reduction in network traffic
– Simplification of support model
WebSphere MQ Series DB2 Connect CICS Transaction Gateway IMS Connect for Java Web Logic/WebSphere and JAVA applications development Applications requiring top end disaster recovery modelLDAP security services IBI Web Focus

IBM Systems and Technology Group 2007
30 © 2007 IBM Corporation
Summary – Reducing TCO with System zChargeback methodology works against the mainframe
It feeds the “expensive” perception
Specialty engines can significantly lower the total cost of the mainframe
The typical total server to production server ratio is between 3:1 or 5:1 for a distributed app.
The incremental cost of capacity on a zSeries is less expensive than distributed serversUNIX - 0.9 – 1.5 x compared to mainframes Windows - <1.0 - 4.0 x compared to mainframes
System z (z/OS) has a significant business case advantage in people, availability, and utilization
System z (Linux/VM) has a significant business case advantage in people, software, utilization, and failover

IBM Systems and Technology Group 2007
© 2007 IBM Corporation
Have a Great Day!

IBM Systems and Technology Group 2007
32 © 2007 IBM Corporation
Integration
– Integrated Functionality vs. Functionality to be implemented (possibly with 3rd party tools)
– Balanced System
– Integration of / into Standards
Further Availability Aspects
– Planned outages
– Unplanned outages
– Automated Take Over
– Uninterrupted Take Over (especially for DB)
– Workload Management across physical borders
– Business continuity
– Availability effects for other applications / projects
– End User Service
– End User Productivity
– Virtualization
Skills and Resources
– Personnel Education
– Availability of Resources
Full range of TCO factors considerations – often ignored
Availability– High availability– Hours of operation
Backup / Restore / Site Recovery– Backup– Disaster Scenario
– Restore
– Effort for Complete Site Recovery
– SAN effort
Infrastructure Cost– Space
– Power– Network Infrastructure– Storage Infrastructure
Additional development and implementation– Investment for one platform – reproduction for
others
Controlling and Accounting– Analyzing the systems– Cost
Operations Effort– Monitoring, Operating
– Problem Determination
– Server Management Tools
– Integrated Server Management – Enterprise Wide
Security– Authentication / Authorization
– User Administration
– Data Security
– Server and OS Security
– RACF vs. other solutions
Deployment and Support
– System Programming
• Keeping consistent OS and SW Level
• Database Effort
– Middleware
• SW Maintenance
• SW Distribution (across firewall)
– Application
• Technology Upgrade
• System Release change without interrupts
Operating Concept
– Development of an operating procedure
– Feasibility of the developed procedure
– Automation
Resource Utilization and Performance
– Mixed Workload / Batch
– Resource Sharing• shared nothing vs. shared everything
– Parallel Sysplex vs. Other Concepts
– Response Time
– Performance Management
– Peak handling / scalability