topquants newsletter · look forward to seeing you at ... construction. as expected, the talk ......
TRANSCRIPT

Constant Maturity Swaps
(CMS) and CMS Spread De-
rivatives. The second runner
up in the competition was Lin
Zhao who is currently pursu-
ing her PhD in the University
of Amsterdam. Her thesis
focussed on Real Options
perspective on valuing Gas
Fields.
The upcoming TopQuants
spring workshop will be held
in May 2015 and is hosted by
Ernst & Young. The main
speakers would be Svetlana
Borokova (Associate Profes-
sor at Vrije Universiteit, Am-
sterdam), Philip Whitehurst
(LCH Clearnet) and Raoul
Pietersz (Head of Quantitative
Analysis, ABN AMRO).
K ind l y re f er to the
TopQuants webpage for all
further information on the
event.
We hope you will enjoy read-
ing this newsletter and we
look forward to seeing you at
the upcoming TopQuants
event(s).
Aneesh Venkatraman
(on behalf of TopQuants)
Dear Reader,
The TopQuants team presents
the first issue of our 2015
newsletter series. We con-
tinue to hear positive opinions
from the Quant community on
the newsletter articles and also
see the increased readership
which is quite encouraging. We
cordially invite you all to con-
tact us with your ideas and
submissions which can include
technical articles, blogs, sur-
veys, book/article reviews,
opinions (e.g. on newly pro-
posed regulations), coverage
of interesting events, research
results from Masters/PhD
work, job internships etc. The
newsletter will continue to
cover a l l t he regu l ar
TopQuants events (autumn/
spring workshops) and the new
initiatives taken. Particularly
worth highlighting are two
events that were supported by
TopQuants: "Best Quant Fi-
nance Thesis Award" competi-
tion for masters students in
The Netherlands that was con-
cluded in October 14, 2014
and the "Math Olympiad for
Corporates" that was con-ducted on January 2, 2015.
This issue starts with a cover-
age of the TopQuants autumn
event conducted in November
2014 and hosted by KPMG at
their global headquarters in
Amstelveen. There was a warm
welcome speech by Jan Hom-
men, the CEO of KPMG, who
expressed his happiness to see
such a large Quant audience.
He indicated the potential op-
portunities that KPMG offers
for quants.
TopQuants will assume the
status of a formal association
in 2015 and has also under-
gone a major rebranding of
its webpage. A short update
on the new status of
TopQuants is included in the
newsletter.
This issue includes the ex-
tended summaries by several
of the speakers in the autumn
event. They are in the follow-
ing order: Philippos Papado-
poulos (founder of Open
Risk), Robert van Gulick (risk
manager at Optiver), Pim
Stohr (Zanders), Giampietro
Carpent ier i (Cardano) ,
Baauke Maarse (Senior Con-
sultant, Deloitte) and Jok
Tang (Senior Mathematical
Consultant, VORtech).
The next three articles pre-
sent the case studies of the
final three contestants in the
"Best Quant Finance Thesis
Award" competition held in
2014. The winner of the
competition was Rob Sperna
Weiland, a graduate from the
University of Amsterdam and
who is currently pursuing his
PhD in the same University.
His thesis had focused on the
Liquiduty Risk in the Sover-
eign Credit Default Swap
Market and was highly
praised by the jury for its
relevance and potential im-
pact on the Quantitative Fi-
nance industry. Sebastiaan
Borst was the first runner up
in the competition and he
currently works for the pric-
ing model validation team of
Rabobank. His thesis was in
the area of Efficient Pricing of
Editorial
March 2015 Volume 3, Issue 1
TopQuants Newsletter
Inside this issue:
Editorial 1
TopQuants Autumn
Event—2014
2
TopQuants - Forma-
tion Association in
2015, Rebranding
3
Open Source Risk
Modeling
4
Risk Management at
Optiver
6
Integration of Credit
and Interest Rate Risk
in the Banking Book
7
The impact of OIS dis-
counting on Libor-
benchmarked liabilities
8
Modelling behavioural
liquidity risk
10
High-performance com-
puting for valuation of
complex insurance
guarantees
11
The Efficient Pricing of
CMS and CMS Spread
Derivatives
13
Liquidity Risk in the
Sovereign Credit De-
fault Swap Market
16
A Real Option Perspec-
tive on Valuing Gas
Fields
20
Upcoming TopQuants
Events
26

AQR stress test compared to other EU
banks. The challenger model is the
same for all banks, although the model
will be parameterized based on ob-
served data. The presentation was in-
teresting and was followed by several
questions from the audience.
Among the talks on risk modeling, par-
ticularly interesting was the presenta-
tion by Philippos Papadopoulos
(OpenRisk) who emphasized the need
for open source risk modeling within
the financial community and discussed
the implementation challenges
(licensing of open source software, protection of client data etc) associ-
ated with it. He highlighted the impor-
tance of peer review and collaborative
work when it comes to Risk Manage-
ment and cited several illustrative ex-
amples of open source software for
finance.
The presentation from Deloitte by
Eelco Rietsema, Maurits Malkus, Bauke
Maarse on Behavioral Liquidity Risk Mod-
eling mainly focused on the need and
approach to develop behavioral models
for liquidity risk and the challenges
involved in liquidity stress testing (e.g.
account for interactions between bal-
ance sheet items). As an illustrative
case study, the speakers discussed in
detail the liquidity risk involved in
mortgage loans and touched upon the
well known Northern Rock bank run
example. The talk by Erik Vijlbrief and
Pim Stohr from Zanders, compared
two approaches for correlating the
credit risk and interest rate risk in the
banking book i.e. integrated vs. aggre-
gated, with end use being mainly for
regulatory capital calculation purposes.
The speakers favored the integrated
approach but indicated that the meth-
odology is vulnerable to the parameter
calibration accuracy.
Robert van Gulik (Optiver), provided
highlights on the risk management
The 2014 TopQuants Autumn Event
was hosted by KPMG at their global
headquarters in Amstelveen. For the
first time since 2011, we witnessed a
complete ticket sellout within 24
hours following the event announce-
ment which marks another success
story for us!!
The format was similar to previous
TopQuants Autumn events: two
rounds with five parallel sessions each
and a sitting capacity of approx 30 per
session. The presentations covered
many topics: risk modeling and imple-
mentation, big data analysis, valuation
of complex financial products and
execution of the banking supervisory
mechanism in The Netherlands. The
speakers were from banks, audit, in-
surance and proprietary trading firms.
An introductory speech was given by
TopQuants committee member,
Caroline Tan, in which she briefly
outlined the history of the organiza-
tion from 2011 until now. She men-
tioned that as always, TopQuants is
keen meet quants who want to be-
come active within the organization.
This was followed by a warm wel-
come speech by Jan Hommen, the
CEO of KPMG, who expressed his
happiness to see such a large Quant
audience and he later on indicated
the potential opportunities for quants
in KPMG.
The presentation from DNB by Fran-
cesca Armandillo and Martijn Schri-
jvers titled Single Supervisory Mecha-
nism Asset Quality Review (AQR) con-
tained highlights of the execution
phase of the AQR and particularly
focused on the Collective Provision
Analysis Challenger model that was
developed by the ECB to validate the
banks' internal credit models used for
loan loss provisioning. The Dutch
banks performed relatively well in the
framework within his firm and em-
phasized that Automated Trading
Risk (ATR) will be an important
source of risk for trading activities
in the future. He cited many histori-
cal examples of trading losses that
could be attributed to ATR inci-
dents and also discussed some in-
teresting ATR scenarios.
There were two presentations from
KPMG, both of very different fla-
vors. Jan Amoraal addressed a rela-
tively offbeat topic, tracking cus-
tomer behavior based on Wi-Fi
signals. He presented highlights of the in-house Wi-Fi tracker em-
ployed in KPMG and also explained
the theoretical underpinnings be-
hind the software modeling/
construction. As expected, the talk
was followed by a round of inter-
esting questions from the audience
related to technical complications,
legal issues, privacy of customers
etc. The talk by Paul Wessels and
Erik Rood focused on the factual
details of the European Banking
Authority (EBA) stress test con-
ducted in 2014. The speakers made
interesting remarks on the effec-
tiveness of the stress test and chal-
lenged some of the key assumptions
of AQR (Asset Quality Review) like
maintaining the stability of bank's
balance sheets, keeping the same
business mix etc.
There were two talks on the valua-
tion aspects of complex financial
products. Jok Tang (VORtech) and
Denys Semagin (NN Re) spoke on
the modeling and computational
challenges involved in pricing of
variable annuities and highlighted
the potential use of High Perform-
ance Computing (HPC) in tackling them. Dirk Scevenels (ING) high-
lighted the CRD IV requirement of
applying Prudent Valuation stan-
dards to all positions measured at
Page 2 TopQuants Newsletter
TopQuants Autumn Event—2014

are not entirely coherent or rather
sometimes contradictory on the ways
to handle liability discounting which
thereby makes it an open subject. His
talk detailed on how liability discount-
ing should be done and the Asset-
Liability Management that results from
it with Special Purpose Vehicles (SPVs)
considered as a case study. Giampietro
Carpentieri focused his talk on the
hedging framework used for Libor
benchmarked liabilities in the pre-OIS
times and the changes required in the
framework to account for the basis
risk introduced due to OIS discounting.
His conclusion was that, compared
to other hedging assumptions, the
basis risk due to OIS-LIBOR spread
is relatively small.
The lively event was concluded by
drinks and snacks sponsored by the
event host. TopQuants are thankful
to KPMG for sponsoring and host-
ing the event. We appreciate all the
efforts by the speakers and the
quant audience for making this an-
other successful TopQuants event.
Fair Value and the absence of well
defined technical standards from EBA
for implementation of the same. Con-
tinuing further, he explained in detail,
the concept of 'Additional Value Ad-
justment' which essentially accounts
for the difference between Prudent
and fair valuations.
The talks by Jan Rosenzweig (FinCad)
and Giampietro Carpentieri (Cardano)
focused on the discounting of liabili-
ties. Jan Rosenzweig, by the way our
first overseas speaker, opinioned that
the regulations (IFRS B, Solvency II)
Page 3 Volume 3, Issue 1
Disclaimer
Any articles contained in this newsletter express the views and opinions of their authors as indicated, and not
necessarily that of TopQuants. Likewise, in the summary of talks presented at TopQuants workshop, we strive to
provide a faithful reflection of the speaker's opinion, but again the views expressed are those of the author of the
particular article but not necessarily that of TopQuants. While every effort has been made to ensure correctness of
the information provided within the newsletter, errors may occur in which case, it is purely unintentional and we
apologize in advance. The newsletter is solely intended towards sharing of knowledge with the quantitative
community in the Netherlands and TopQuants excludes all liability which relates to direct or indirect usage of the
contents in this newsletter.
TopQuants - Formal Association in 2015 and Rebranding
Formal Association: TopQuants
has registered itself as a formal asso-
ciation in 2015. The main motivation
behind the update of its status is due
to the large growing interest in
TopQuants among the Quantitative
community since its initiation in 2011,
thereby encouraging us to improve
ourselves and serve Quants in a better
way.
In view of the financial costs that are
attached to the association formation
and its continued maintenance, it is
possible that TopQuants will charge a
membership fee in the future. More
details of the membership will follow
in due course on our webpage and
our mailings.
The TopQuants semi-annual work-
shops will have an entry fee from now
onwards due to a couple of reasons:
1. The 2014 TopQuants autumn work-
shop tickets were sold out completely
within the course of one day, which
caused lot of people to miss out on the
event. Further, we had noticed that
many people had cancelled their ticket
on the day of the event and some peo-
ple did not turn up after having regis-
tered. Imposing a ticket charge will
hopefully ensure that the threshold to
register will be slightly higher than be-
fore. 2. Collected fees will be used
towards arranging international speak-
ers in the future. 3. The costs attached
to the association formation can partly
be recovered from these events.
Rebranding: The Dutch company VI/
Company, that creates online applica-
tions for financial markets, has been
very kind to rebrand "TopQuants" as
can be seen on our website
(topquants.nl) and our Twitter page
(@topquants). The new logo has
also made it to this newsletter issue
and we hope to complete the re-
branding of the newsletter before
the end of this year.
VI/Company is known for many
other prominent works: ING web-
platform, CARDANO PensionSim,
online educational platform for in-
vestors - RTL Z Beursspel, websites
of BX Swiss and Think ETF's.
TopQuants is very pleased with the
new webpage, which looks at its
best in the most modern browsers
and is also fully responsive. Hence,
do surely try to access the webpage
on your tablet or mobile devices.
We wholeheartedly thank Olaf Mul-
ler, Sven Sigmond and the rest of
the VI/Company team!

Page 4 TopQuants Newsletter
Open Source Risk Modeling — by Philippos Papadopoulos (Open Risk)
The dismal state of quantitative risk modeling
The current framework of internal risk modeling at fi-
nancial institutions has had a fatal triple stroke. We saw
in quick sequence, market, operational, and credit risk
measurement failures. This left the science and art of
quantitative risk modeling reeling under the crushing
weight of empirical evidence. The aspect of failure we
are interested here is the technical failure, that is, the
engineering side, thus distinct from the risk management
failure (After all, good risk managers can use even primi-
tive or poor risk models to good effect and poor risk
managers will ignore or subvert the outcomes of even
perfect risk models) which is more of a business self-
destruction phenomenon. It would take volumes to
document all the specific weaknesses and faults of risk
modeling revealed by the successive crises since 2008.
For our purposes some cursory glances will suffice to set
the tone. In the market risk space, the mantra of “credit
risk is just another form of market risk” has proven dis-
astrously wrong. This exposed deep methodological diffi-
culties await the market risk treatment of illiquid traded
products. In operational risk, epoch defining fines re-
vealed that the best practice “reduced form” AMA ap-
proaches are essentially blind to both the buildup of in-
ternal risk factors and unable to offer a reasonable up-
date of views after the event realization. Finally, and most
unfortunately, the - vital for the real economy - credit
risk models managed to get wrong every moment of the
distribution: First order (PD / expected loss) aspects
have proven unable to capture deterioration of under-
writing standards (essentially because key product / cli-
ent risk factors were ignored), second order
(correlation) aspects have not captured dependency be-tween markets because of obsolete approaches to esti-
mating sector correlations and the tail side of the models
has not included rare but disastrous events such as sov-
ereign default because contagion modeling was still in its
infancy.
The problem with risk models is already reflecting in
various new regulatory policies since the crisis (non risk
based metrics, standardization etc.) that reverse techni-
cal achievements spanning decades of effort. But what is
there to be done? The risk modeling community is cer-
tainly not missing intellectual firepower. It can revisit and
fix what is fixable and jettison what was unworkable. The
real challenge is to constructively channel this firepower
towards a more robust and professional landscape that
will serve the industry and will also be recognized by other
stakeholders. Alas, this is not an easy task. Very deservedly,
there is little outside appetite for one more round of self-
declared “excellence”.
What the success of open source teaches us
The current setup around risk models has failed. Our view
is that a viable future can instead adapt and emulate the
behaviors, organizational patterns and toolkits of technical
areas that have succeeded rather than failed in tasks of simi-
lar complexity. While inspiration can be drawn from many
other areas of human endeavor (most areas of engineer-
ing actually qualify – what is the last time your car ex-
ploded on an uphill?), our focus here is on a paradigm we
denote as Open Source Risk Modeling. Risk models are
essentially just software, and developing risk modeling so-
lutions has many affinities with developing open source
software. We believe re-engineering some key parts of the
risk modeling work-flow along the lines followed by open
source communities offers a viable technical "change pro-
gram" that can re-establish in due course confidence in the
risk quantification tools developed by the financial industry
(Of course in areas where increased and broad based con-fidence is not relevant one can continue with present or-
ganizational models and paradigms)
Open Source has ushered new working paradigms that are
extremely effective at solving tough problems. Wikipedia,
a community driven encyclopedia is the 6th top website glob-
ally and has eclipsed any other effort to compile general
purpose encyclopedias. Linux, the stable and high per-
formance open source operating system is dominating both
internet servers and mobile. MySQL, an open source pro-
duction ready database is the second most important data-
base technology worldwide. Stackoverflow, a website
supporting collaborative programming receives 4M hits per
day. The software world was indeed changed by open
source!
The above examples (just a small sample of a vast and
growing universe!) utilize to varying degrees the following
three key concepts: I) Open source licensing that al-
lows accessibility to and propagation of intellectual prop-
erty ii) Promotion of standards that enables interop-
erability and quality control and iii) Collaborative work
that pools efforts of independent agents.
The concept of open source licensing is fundamental for
Page 5 Volume 3, Issue 1
the current boom in software. Under the open source
paradigm, while developers retain copyrights to their
creation, the software (or other IP) is released under a
license that permits (for example) inspection of the
source code and - depending on the type of license -
modification of the code and even further packaging of
the code into new products, possibly even commercial
resale. This setup acts multiplicatively, enabling the build-
ing of complex software frameworks with multiple con-
tributors.
While the licensing and contributor agreements take care
of the legal framework for collaboration, it is the collabo-
rative tools and standards that make open source commu-
nities true productivity beehives. There is by now a huge
range of tools, online websites, techniques and how-to's.
Just a sample: developer education tools (stackoverflow,
public wiki's), collaboration tools (github), project man-
agement styles (agile and scrum), documentation tools
(new markup schemes), package management tools, open
standards (W3C) and application programming interfaces
(API's).
Besides the legal framework and the enabling technical toolkit, there are a number of behaviors that are prevalent
in open source and which are very conducive to produc-
tive and high quality development: Attribution becomes
the means to build reputation, peer review is used in ac-
cepting contributions of code, selection of ideas is per-
formed in online forums discussing project directions.
Some of these behaviors are actually reminiscing of aca-
demic environments but are generally occurring rather
naturally and without much formal governance.
Open Source Financial Risk Modeling
In-house use of open source software to support various
operations (e.g., linux servers) is by now a reality in the
financial sector. But in what concerns the broader risk
analysis stack, open source is only marginally present al-
though not completely new: There are certain microfi-
nance initiatives that developed field oriented frontend
systems (MIFOS, Cyclos), there are trading oriented
pricing and risk libraries (quantlib, opengamma), there
are insurance (actuarial) risk models (pillarone, ope-
nunderwiter) and finally numerous contributions to
open source systems such as R and Python.
Conspicuously missing from the above list is a broad
based effort targeting the risk modeling of “core” banking
operations, including standard credit, operational and
business risk analysis. This is where OpenRisk hopes to
make a difference by supporting the formation of an open
source community focusing on this area. The architecture
of this open source risk modeling framework would con-
sist of an broad contribution community, comprising of
individuals in academia, financial firms and/or regulatory
bodies. Anybody from within (or without) the community
can check-out, comment, test, validate, opine the risk li-
brary. Checking-in is subject to open standards that are en-
forced by peer review within the community. Users can
either use standardized versions (use verbatim the code)
or use customized versions (fork the code).
OpenRisk is currently envisaging the development an open
source risk library. While in principle contributions are wel-
come in any language / platform, there are benefits of stan-
dardizing around a few key promising technologies. For this
reason we suggest Python, R and C++. While the work
program is huge, we are aiming first for a proof-of-principle
around credit portfolio management (OpenCPM). The fol-
lowing organizational tools are already available for any
interested developer:
Risk Forum: An online bulletin board to capture discus-
sions and support the coordination of model development.
To use, simply follow the link and open an account
Github: Public repository storing the library. To use, cre-
ate a github account, sign the collaborator agreement and
your are ready to commit code!
Risk Manual: Public wiki holding the documentation of
the principles and methodologies behind the risk library
Questions & Answers
A question that arises most frequently from finance indi-
viduals that have not been involved in open source is the
economic perspective. Details aside, it suffices to say that
there are multiple channels that can support the different
modalities of an open community: from corporate spon-
sorships, to crowd-funding, to ad-driven business models,
to added services (such as training and support) to “pro”
versions of software that offer additional / full functionality.
Another frequent question from finance professionals are
the issues around data privacy. The answer is simply that a
good majority of risk model development does not require
sensitive client data, surely not before the final stages.
Open source risk modeling will need to adapt to some of
the significant constraints of this particular industry.
Do you have suggestions/ideas/observations around open
source in general or OpenRisk in particular? Come join the
forums or contact us at [email protected]
Page 6 TopQuants Newsletter
Risk Management at Optiver
— by Robert van Gulik (Group Risk Head, Optiver)
Introduction
Optiver is an electronic trading firm that improves the
markets by providing liquidity to the financial markets using
low-latency techniques. The group has around 800 employ-
ees working in the three principal offices (Amsterdam,
Chicago and Sydney). The group is active on all major
global exchanges and covers all major asset classes
(Equities, Volatility Indices, Fixed Income, Currencies, and
Commodities). The vast majority of the trades is in ex-
change listed instruments (stocks, futures, plain vanilla op-
tions, warrants, …).
Risk Management
By continuously providing liquidity Optiver executes hun-
dreds of thousands of trades on a daily basis. The number
of quote updates and orders are a multiple of this amount.
Consequently, positions and risk exposures can change
rapidly. Optiver has introduced a portfolio management
system that can on a real-time basis keep track on all posi-
tions in the trading books. In addition, it provides real-time
updates of the trading results and all the market-risk expo-
sures. This allows for near real-time monitoring of all the
market risk exposures. The market risk limit framework is
based on scenario exposures (full revaluation) and adjusted
ATM Greeks (see footnote 1). Credit Risk is a more static,
residual risk and is monitored at a lower frequency. Op-
tiver also runs operational risk. One of the most important
operational risks is Automated Trading Risk.
Automated Trading Risk (ATR)
The vast majority of the orders and quotes are generated
automatically by trading algorithms which are controlled by
traders. This automated trading set-up allows Optiver to
quickly update the prices. It also introduces operational
risks. Due to human errors, programming bugs, incorrect
input information, incorrect instrument definitions (strike,
maturity, multiplier, underlying), hard-ware/soft-ware mis-
configurations, the automated trading systems can generate
in a very short period a large amount of incorrect trading
instructions, resulting in large risk exposures and, poten-
tially, large financial losses. The USD 460Mln loss of Knight
Capital in a 45min time window illustrates that this is not
just a theoretical risk. Footnote 2 illustrates how a minor
programming issue can result in large risk exposures. In
order to protect Optiver against these large losses, a num-
ber of protection mechanisms are in place: pre-trade limits
at the periphery (order/quote volume & value limits, out-
standing volume limits, frequency limits), instrument defini-
tion checks with external parties, intraday position recon-
ciliation with external parties and mechanisms to trigger
trading-system shut downs (kill switch/panic button). In
addition, there are monitoring processes in place that all
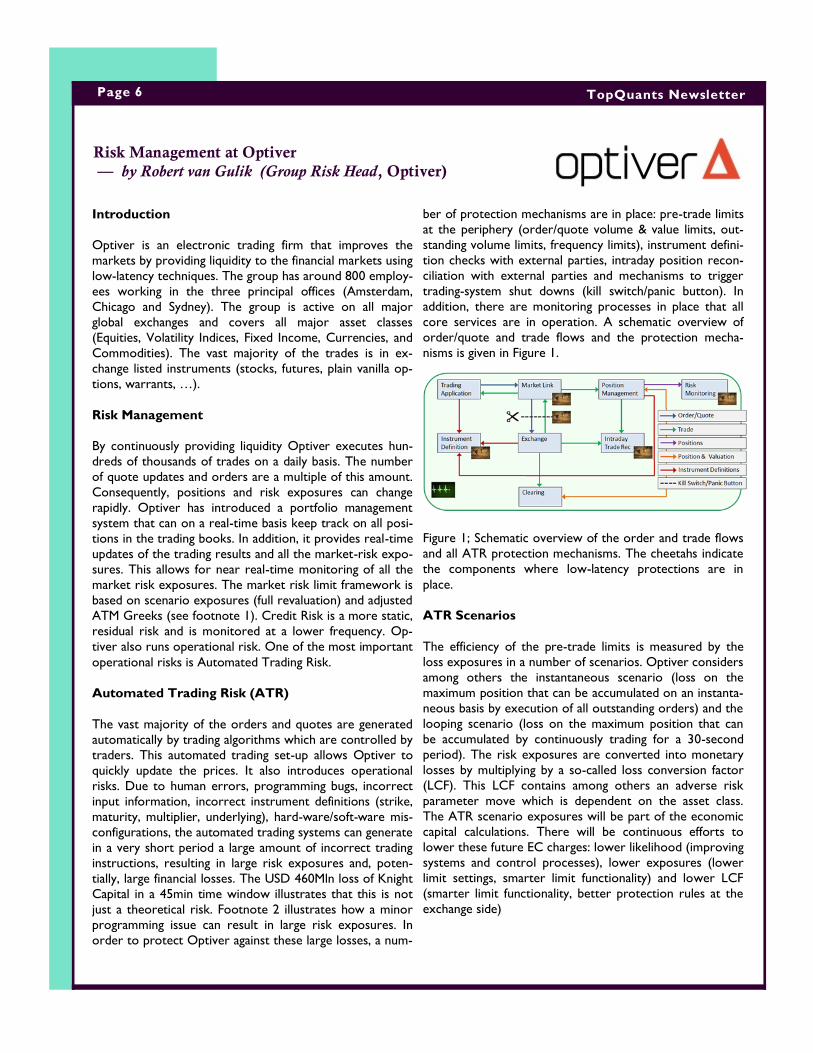
core services are in operation. A schematic overview of
order/quote and trade flows and the protection mecha-
nisms is given in Figure 1.
Figure 1; Schematic overview of the order and trade flows
and all ATR protection mechanisms. The cheetahs indicate
the components where low-latency protections are in
place.
ATR Scenarios
The efficiency of the pre-trade limits is measured by the
loss exposures in a number of scenarios. Optiver considers
among others the instantaneous scenario (loss on the
maximum position that can be accumulated on an instanta-
neous basis by execution of all outstanding orders) and the
looping scenario (loss on the maximum position that can
be accumulated by continuously trading for a 30-second
period). The risk exposures are converted into monetary
losses by multiplying by a so-called loss conversion factor
(LCF). This LCF contains among others an adverse risk
parameter move which is dependent on the asset class.
The ATR scenario exposures will be part of the economic
capital calculations. There will be continuous efforts to
lower these future EC charges: lower likelihood (improving
systems and control processes), lower exposures (lower
limit settings, smarter limit functionality) and lower LCF
(smarter limit functionality, better protection rules at the
exchange side)

Page 7 Volume 3, Issue 1
Footnote 1:
Optiver uses adjusted Greeks in the reporting of risk ex-
posures. An illustration of an adjusted Greek is the
Weighted Vega. For an equity option with a maturity of T
days from now and a Vega exposure of V, the Weighted
Vega W is defined by
This weight factor puts more emphasis on the Vega expo-
sures driven by position close to expiry. This is in line with
the general observation that points on the volatility term
structure close to expiry tend to change more from day to
day than points on the back end of the volatility term
structure. Regular back-testing analysis shows that this is
an effective scaling factor. For other asset classes similar
adjustments are in use.
Footnote 2:
As an illustration that relatively benign issues can result in
potentially large exposures, consider the following exam-
ple. Assume an algorithm trading one single future that on
each evaluation moment attempts to send hedge instruc-
tions that would result in a delta neutral position. Assume
that due to a configuration error the confirmation of the
hedge transaction and the update of the delta position does
not reach the algorithm on the next evaluation moment,
but two of those time ticks later. The below table and
figure illustrate that this algorithm will oscillate into lar-
ger and larger delta positions (exponential growth as-
suming unlimited liquidity).
Integration of Credit and Interest Rate Risk in the Banking Book
— by Pim Stohr (Zanders)
With the establishment of Task Force on Interest Rate
Risk (TFIR) at the end of 2013, the Basel committee has
reopened the discussion on Interest Rate Risk in the Bank-
ing Book (IRRBB). The Task Force aims to elaborate on
the appropriate positioning of IRRBB in the Basel accord. In
the current framework, IRRBB is addressed under Pillar 2
and the capital held for IRRBB is part of the Economic
Capital. This capital calculation is usually performed with a
diversification factor between credit and interest rate risk
that is based on expert judgments, but lacks a robust esti-
mation technique. Moreover, the resulting capital has been
observed to be quite sensitive to errors in this diversifica-
tion factor. Zanders has recently developed an approach to
achieve more insight in the correlation between credit and
interest rate risk. The speakers, Erik Vijlbrief and Pim Stohr
presented the results of their study in this talk.
In order to measure the conjoint impact of credit and
interest rate risk, two approaches have been studied and
compared. The first is an aggregated model which com-
putes the credit and interest rate risk of a banking book
portfolio separately. This is the standard method em-
ployed by many banks and results in relatively uncorre-
lated risk factors (i.e. large diversification). The second
model adopts an integrated approach and was presented
by the speakers. Here, the credibility of counterparties is
calibrated on the interest rate curve by using a Collin-
Dufresne Goldstein representation. This method enables
the modeling of default probabilities under any interest
rate scenario. Using the integrated model, the correla-
tion between credit and interest rate risk can be esti-
mated.

Page 8 TopQuants Newsletter
The integrated model was evaluated on a range of banking
book portfolios and it was observed that the model tends
to result in higher risk figures. A large contribution to the
increased risk is caused by the migration of assets in the
portfolio, which is not included in the aggregated ap-
proach. On the contrary, the interaction between credit
and interest rate risk decreases the overall risk estima-
tion, by incorporating a hedging behavior between the
two risk types. An important observation in this analysis is
the variability of the correlation parameter that depends
on the portfolio composition. Among other factors, it is
dependent on the risk profile, product composition and
management strategy of the portfolio. In a typical eco-
nomic capital implementation based on an aggregated
model, a constant correlation between the two risk types
is assumed which is not dependent on these risk factors.
The talk was concluded by presenting recommendations
on integrated modeling to the audience. The speakers
mentioned that neither of the two approaches can be
claimed to be better in an absolute sense. An integrated
model can be used for robustly estimating a correlation
factor and answering complex management questions, but
is also dependent on the calibration procedure or the avail-
ability of good quality data. The aggregated model, on the
other hand, is very limited in modeling the (joint) contribu-
tion of the two risk factors. This becomes apparent when
considering the fact that the correlation factor varies over
portfolios. However, the aggregated model approach, due
to its relatively simplistic approach, does allow for better
control and understanding of the individual risk factors.
The relatively complex integrated model can therefore
best be used in addition to an aggregated approach, in
order to study adjustments of credit spreads, determine a
correlation factor or to challenge expert judgment.
The impact of OIS discounting on Libor-benchmarked liabilities
—- Giampietro Carpentieri (Quantitative Analytics, Cardano)
Introduction: Hedging liabilities that are benchmarked
to the Libor curve, using Libor-discounted Libor swaps,
used to be straightforward and well understood. In the
simplest case of fixed liability cash flows, a replicating
portfolio of swaps could be set up at inception and left
unaltered. This changed with OIS discounting, which sud-
denly introduced a new challenge: hedging the same liabili-
ties required dealing with the Libor-OIS basis exposure,
either actively or passively. Possible sudden increases of
the Libor-OIS basis during periods of market stress and
the lack of a very liquid OIS market became cause of con-
cerns for LDI managers. Not to mention all the difficulties
associated with updating systems and operational proc-
esses.
Numerical data. The results of the analysis have been
produced using two one-year long scenarios (250 busi-
ness days). The first one sees rates falling as much as 100
basis points (at the 30 year point), and the basis widening
up to 9.3 basis points. Rates in the second scenario oscil-
late around their initial level, and the basis widens appre-
ciably, up to 16.5 basis points.
Hedging framework prior to OIS discounting. Li-abilities are hedged exactly when the present value of
their cash flows, plus the value of the hedging portfolio,
grows according to the rate of return implied from the
benchmark curve. With the latter statement in mind, a
ratio can be conveniently formed such that it is 1 for liabili-
ties that are hedged exactly (when the hedging portfolio is
the replicating portfolio) and deviates from one in any
other case. The deviation is a measure of the hedging er-
ror.
Hedging after OIS discounting. The fact that the cash
flows of a Libor swap are discounted by the OIS curve has
important implications for sizing the hedges, mainly be-
cause the benchmark curve used for discounting liabilities
tends to remain the pre-OIS Libor curve, that is the curve
bootstrapped in the old way. Of course local regulations
largely determined what constitutes a valid discount curve,
but certainly in the Netherlands this is the case. In the
United Kingdom there is no prescribed discount curve, but
to our extent a lot of defined benefit funds have stuck to
using the pre-OIS curve. The sensitivity of the swap to the
par rate is the PV01 (i.e., the present value of a 1 basis
point parallel move of the curve), which is now an OIS
annuity, rather than a Libor annuity as before. Ignoring this
and sizing the hedges using the old method produces er-
rors. A possible method of sizing the hedges is to first
compute the notionals using the old method, and then to
scale them by the ratio of the Libor and OIS annuities.

Page 9 Volume 3, Issue 1
Figure 1a and b show the hedging error for the two sce-
narios with and without notional scaling. Especially in sce-
nario 1, the scaling seems to be very effective, with the
maximum error reduced from 1.34% to 0.44%. Please
note that this is an intuitive approximation, which is ex-
tremely simple to implement. Exact sizing would involve
the computation of the exact sensitivities, which due to
the Libor-Ois cross dependency is definitely more com-
plex than performing the scaling.
Effectiveness of scaling the notionals. The effective-
ness of the scaling is due to the fact that an OIS dis-
counted Libor swap can be written as an equivalent OIS
swap when the spread/basis between the two curves re-
mains constant. As long as the basis does not change, such
swap can be used to hedge the liabilities exactly. When
the basis changes, then an error will appear. The error will
disappear if the basis vanishes, or will be lasting otherwise.
In the latter case, the magnitude of the error depends on
the amount of OIS exposure.
Figure 1 – Hedging error of Libor-benchmarked liabilities
using OIS discounted Libor swaps, with notional scaling
(Libor-OIS sizing) and without (Libor sizing).
Swap moneyness as a driver of the hedging error.
The present value of the swap can be conveniently written
as the product of its moneyness and the PV01 (OIS annu-
ity). This way of writing the present value emphasises how
the moneyness drives the OIS exposure. Obviously the
more a swap portfolio is far from the money, the more it
is affected by the basis. Results have been produced for
ITM and OTM portfolios, with as much as 25% of the total
exposure being OIS. The impact was more evident, but still
comparable to the at-the-money case in terms of magni-
tude. Moreover, the results show clearly that the impact of
the moneyness on the error is far more important than
the impact of the basis itself.
Managing the basis via recouponing. The rate of a
running swap can be reset to par, and its notional altered
such that the PV01 of the modified swap matches that of
the original swap. This is in essence recouponing. Since the
OIS exposure is driven by the moneyness of the swap,
recouponing is an effective tool for limiting the influence of
the basis. Moreover, it is already available in the toolbox of
every LDI manager. Recouponing was and is routinely used
to monetise swap positions.
Hedging assumptions: bucketing. There are a number
of other hedging assumptions that are routinely used while
hedging liabilities. Bucketing is one of them. It can be done
uniformly, using instruments with maturities uniformly dis-
tributed over the term structure, or in a non-uniform way.
Uniform bucketing is performed when buying the whole
replicating portfolio might be impractical, though the hedg-
ing portfolio must be as close as possible to it. Non-
uniform bucketing is usually performed in order to express
curve views. For instance, while fully hedging for parallel
shifts of the curve, the managers might try to gain expo-
sure to slope movements.
Impact of the basis vs different bucketing configura-
tions. Four types of bucketing have been analysed, with
hedging instruments located: uniformly; in the middle part
of the term structure; at the short end; and at the long
end. The liabilities, which are nominal or indexed, have
been tested on the two scenarios mentioned in the nu-
merical data section. As shown by the results in Table 1,
the error introduced by OIS-discounting is relatively small
in comparison to the error introduced by the bucketing.
This is especially true when the bucketing is not uniform.

Page 10 TopQuants Newsletter
Summary. The outcome of the analysis can be summa-
rised in three main points:
1. Properly sizing the swap notionals to reflect OIS dis-
counting is very effective at neutralising/reducing the
impact of the basis. Such impact becomes minimal
(only volatility) if the basis vanishes after widening;
2. The moneyness of the swaps is the driving/amplifying
factor for the hedging error caused by the basis. Re-
setting the portfolio is in this sense the best way to
protect the portfolio and for this end tools such as
recouponing are readily available;
3. With properly sized hedging portfolios that are not
too far from the money, the error generated by the
basis can become relatively small when compared to
other common hedging assumptions such as bucket-
ing.
Table 2 – Hedging error of nominal (N) and inflation linked (I) liabilities for two rates scenarios and for four bucketing
configurations: hedging instruments uniformly distributed (U), around the middle of the term structure (M, maturities
between the 10 and 30 year points), at the short-end (L, maturities shorter than 20 year) and at the long end (R, ma-
turity longer than 30 years). The error is computed for Libor and OIS discounting of the hedging swaps.
Modelling behavioural liquidity risk
—- Bauke Maarse (Deloitte)
In recent years liquidity risk has become more important
as regulatory requirements relating to liquidity risk have
become more stringent. In addition, banks are forced by
rising funding costs to reassess their transfer pricing poli-
cies and to focus on the allocation of funding costs to im-
prove profitability. These trends increased the importance
of liquidity risk.
Liquidity risk can be defined as the risk that an organization
is not able to meet its cumulative net cash outflow over a
specific period of time. To quantify liquidity risk the ex-
pected cash outflows can be modelled by a behavioural
liquidity risk model. Until recently the focus within liquidity
modelling was mainly on contractual cash flows. Due to
more stringent regulation and increased funding costs cli-
ent behaviour becomes more and more important. To take
client behaviour into account, the contractual cash flows
have to be adjusted for behavioural aspects. For example,
expected cash inflows are adjusted for prepayments risk
and cash outflows are adjusted for early withdrawal risk.
For each balance sheet item one or more behavioural as-
pects are taken into account. For liabilities the main risk
is early withdrawal, for assets it is either an extension
after the maturity or a repayment before maturity.
The output of a behavioural liquidity risk model is a be-
havioural cash flow calendar. The behavioural cash flow
calendar specifies for each balance sheet item the ex-
pected cash in- or outflows over a specific period of time
based on the contractual cash flows adjusted for behav-
ioural risks. The behavioural cash flow calendar can be
applied for different purposes: (i) input for funding plan,
(ii) liquidity stress testing and (iii) pricing of direct and/or
indirect liquidity costs.
To illustrate behavioural modelling a case study for resi-
dential mortgages was presented. In this case study the
liquidity risk for mortgages is defined as: “The risk that
cash flows deviate from contractual cash flows”. To esti-
mate the behavioural cash flows, three events leading to
deviations in contractual cash flow are modelled: (i) par-
tial prepayment, (ii) full prepayment and (iii) conversion

Page 11 Volume 3, Issue 1
of the mortgage type (for example, from a bullet type to an
amortizing mortgage). Each of these events can occur
every month for each mortgage contract. When the
monthly probabilities on each event have been estimated
one can perform a cash flow projection using a Single
Monthly Mortality rate or a Monte Carlo simulation and
derive the behavioural cash flow calendar. Since three
different events are modelled a multinomial logit model is
used to estimate for each future month the probability
on the occurrence of one of the three events.
High-performance computing for valuation of
complex insurance guarantees
- Jok Tang (VORtech), Denys Semagin (NN Group, NN Re)
Abstract: We consider the high-performance computing
(HPC) aspects of a typical Monte-Carlo (MC) simulation
for the valuation of unit-linked insurance gufarantees such
as variable annuities (VA). Different solutions are discussed
to reduce the computational time for the valuation of the
embedded options and their sensitivities to market risk
factors. We compare Windows HPC Server and GPUs in
more detail and provide suggestions for further improve-
ments.
Introduction: Managing a portfolio of life-insurance guar-
antees with a mixture of market and non-market risks (e.g.,
EQ/IR and longevity/surrender, respectively) represents all
challenges coming from volume, sensitivity, and complexity
of the products. Each of these criteria often entails a prac-
tical need of high-performance valuation platform even for
conventional banking and investment products. A book of
typical Variable Annuities (VA) would combine all and
hence need an HPC framework very naturally.
NN Re, the NN Group's internal reinsurance and hedging
company, owns the hedging program for VA books in Japan
and Europe.
VA business globally has gone through several developing
phases, and various challenging business aspects of pricing,
risk management, and general modelling have been dis-
cussed extensively by industry practitioners and academics.
We discuss the major modelling and computational com-
plexities, and explain the growing practical needs for HPC.
Variable annuities (VA): It is a type of unit-linked prod-
uct with embedded options (insurance guarantees). Cus-
tomer chooses the amount to invest (e.g. buy units of mu-
tual funds), type of premium (e.g., single or regular), and
holding period. In the end, customer receives an annuity
based on the variable value of investments.
Insurer invests the assets on behalf of the customer: pre-
mium à funds à account value (AV). Insurer offers death
benefit (at any point) and survival benefit (at the end),
and other benefits (riders), composition of which defines
Insurer’s risks (a portfolio of basket put options). Cus-
tomer bears running cost/fees, and can lapse the contract
at any time and withdraw the available account value
(American option).
Benefit pay-out is the AV if it is greater than the guaran-
tee G, or the guaranteed amount if G > AV. The expecta-
tion of the AV shortfall in the latter case is the measure
of Insurer's risk.
Numerical complexity: The common approach to
Monte-Carlo (MC) simulations of such exotic products is
to have a calculation flow that (i) generate of correlated
random numbers, (ii) project economic scenarios for
market risk factors, (iii) convert them into fund projec-
tions, (iv) project contract investment accounts, and (v)
calculate the cash flows and present value of embedded
options.
The steps (i)-(v) are sequential, and each of them oper-
ates with large arrays of data. The numbers of MC sce-
narios and time steps are consistent for all steps, but for
each of scenarios and time points we have unequal num-
ber of risk factors, funds, accounts and cash flows to pro-
ject for each policy. VA features are path-dependent, and
very entangled within each path. One needs to optimize
the whole projection flow, each step there and data
transfer / reusability / synchronizing among the steps to
introduce efficient parallelization.
Another major challenge is coming from the portfolio
profile: different products have different features (specific
configuration of the objects in the flow), and within each

Page 12 TopQuants Newsletter
product group all policies have different life-time (number
of time steps) and investment profile (number of fund
projections required to project AV).
It is essential to pre-process contract information to opti-
mize the flow, and also carefully choose mathematical
methods to improve overall convergence based on that
diversity and pre-processing.
Practically, it is about identifying the functional blocks un-
derlying specific product features and introduce scalable
parallelization capable to speed up these blocks with typi-
cal workload for a given portfolio. A model scan was per-
formed to investigate the potential of parallelization op-
tions for the whole flow and such functional blocks.
Model scan: As an HPC specialist, VORtech was in-
volved to carry out the model scan of a production proto-
type code and advise on a suitable parallel design. The
HPC solution must accelerate the code significantly, while
the flexibility and transparency of the code should be
maintained as much as possible. In the model scan, the
code was examined in more detail and profiling tests were
done to identify time- and resource- consuming compo-
nents of the prototype code. Based on the model scan
findings and recommendations, a more adequate strategy
can be worked out for the HPC framework.
The model scan revealed the functional blocks that are the
bottlenecks (computing time and complexity). One of
them is the cash-flow computations block (steps (iv)-(v)
above), which consists of the nested loops over contracts,
scenarios, time steps, and funds, respectively. Parallelizing
those loops (holistically or per model / function) would
accelerate the overall code substantial ly .
HPC solutions: Several HPC solutions could be adopted
that can do the parallelization. For the specific code and
application, and based on the specific wishes regarding
flexibility and transparency, the two most promising solu-
tions are the GPU solution and Windows HPC Server
solution.
On the one hand, Windows HPC Server solution is
straightforward in terms of software development. By
adding some calls to HPC macros in the prototype code.
Therefore, the flexibility and transparency will be main-
tained easily. It however requires a significant investment
in a cluster and its maintenance, especially when a cluster
with many machines is desired. The acceleration of the
code depends on e.g. the number of machines of the clus-
ter.
On the other hand, the GPU solution is attractive, since
the investment in hardware is low, while a substantial ac-
celeration can be achieved due to the many GPU cores.
However, it will require a significant development effort,
since dedicated OpenCL or CUDA code must be written
that should be carried out on the GPU. The routines can
be put in a DLL, so that in the prototype code function
calls can be made to those. In this case, it is obvious that
both the flexibility and transparency will suffer.
The potential of the GPU solution was shown by isolating
the prototype code of the time-consuming cash flow loops
and port this to first C and then OpenCL. The C code is
performed on an i7-2640 machine and the OpenCL code
on an AMD Radeon HD 9870M GPU. For a representative
problem with 1000 policies and 1000 scenarios, a speedup
factor range of 30x to 100x is achieved for various product
features, by comparing the C and OpenCL code, on top of
a speedup factor range of 30x to 40x by porting the proto-
type to a standard C code. This is an impressive result as a
test compared to the performance of the advanced pro-
duction code per grid core.
Conclusions and future work: The code for the valua-
tion of variable annuities can be accelerated by paralleliza-tion. For the specific code that is used by NN Re, the two
best HPC solutions are using Windows HPC Server and
GPU, each having their advantages and drawbacks in terms
of flexibility, transparency and costs.
The proposed variety of the solutions will be considered
by NN Re. Upon the final decision, more implementation
and tests can be done to further explore the acceleration
potential of the model code for such exotic insurance
products as variable annuities.

Page 13 Volume 3, Issue 1
Abstract: Two popular products on the interest rate
market are CMS derivatives and CMS spread derivatives.
CMS-based products are widely used by insurance compa-
nies, pension funds and banks, because these institutions
are very vulnerable to movements in the interest rates.
Our main focus is on the efficient pricing of CMS options
and CMS spread options. The notional values for these
products are usually quite large, so accurate pricing is of
vital importance. It is possible to use sophisticated models
(e.g. Libor Market Model) to price these products accu-
rately, however the downside is that these models have
high computational costs. We will propose models that
can accurately and efficiently price CMS options and CMS
spread options.
Keywords: CMS option, CMS spread option, TSR model,
2D SABR model, DD SABR model.
Introduction
Constant Maturity Swap (CMS) derivatives and CMS
spread derivatives are very popular products nowadays
because they enable investors to take a view on the level
or the change in the level of the yield curve. It is very im-
portant that the pricing of both CMS and CMS spread
derivatives is efficient and accurate, since a small pricing
error can lead to substantial losses due to the large no-
tional values associated with these kind of products. Some
types of CMS derivatives are CMS swaps, CMS caps and
CMS floors. The underlying is a swap rate, also called a
CMS rate, which is a long-term interest rate. The defini-
tion of the swap rate and its associated annuity is given by:
where
is a tenor structure of dates. For the pricing of CMS de-
rivatives, it is necessary to compute the expectation of the
future CMS rates under the forward measure that is asso-
ciated with the payment date. However, the natural mar-
tingale measure of the CMS rate is the annuity measure.
A so-called convexity adjustment arises because the ex-
pected value of the CMS rate under the forward measure
differs from the expected value of the CMS rate under its
natural swap measure with annuity as the numéraire.
Some of the most common CMS spread derivatives are
CMS spread options. A CMS spread option is similar to a
regular cap/floor option. The difference is that whereas in
a regular cap/floor the underlying is usually a reference
rate, in a CMS spread cap/floor the underlying is the
spread between two swap rates (CMS rates) of different
maturity. The main difficulty in pricing CMS spread deriva-
tives is that the joint distribution function of the two swap
rates of different maturity is not known.
Pricing CMS Options with TSR Models
We will first focus our attention on the pricing of CMS
options. The value of so-called CMS-linked cash flow is
defined by:
where t = 0 denotes the present date, T0 denotes the
start date in the future and Tp is the payment date in the
future. The function g denotes the payoff of either a
swaplet, caplet or floorlet. Hence, CMS swaps, caps and
floors are simply a collection of CMS-linked cash flows
where g is their respective payoff function. However, the
probability density function (PDF) in the forward measure
is not available, the PDF in the annuity measure on the
other hand is available. We can obtain the PDF of a CMS
rate in the annuity measure from the market prices of
swaptions. So we will change measure and obtain:
The difficulty in calculating the expectation stems from
the term P(T0,Tp)/A(T0). However, we can approximate this
term by making use of a Terminal Swap Rate (TSR) model.
From a terminal swap rate model we obtain a so-called
annuity mapping function. The annuity mapping function is
The Efficient Pricing of CMS and CMS Spread Derivatives
- by Sebastiaan Borst (PMV - Pricing Model Validation, Rabobank)

Page 14 TopQuants Newsletter
We obtain the following valuation formula for the
CMSSO:
We can now define a two-dimensional SABR (2D SABR)
model that can be used for the pricing of CMSSOs. The
stochastic dynamics for CMS-adjusted forward rate and
associated stochastic volatility are given by:
One of the main advantages of this model is that it can be
easily calibrated using Hagan’s formula, [3]. This is based
on the fact that CMS caplets are simply European call op-
tions on CMS-adjusted forward rates and the CMS-
adjusted forward rates are defined such that each CMS-
adjusted rate follows SABR dynamics. The CMS-adjusted
forward rates can be calculated by making use of a TSR
model. Note that unlike in the copula approach now the
full correlation structure is taken into account. However,
still a Monte Carlo simulation has to be applied. Our aim
is to obtain a model, which can be used to calculate
CMSSOs efficiently. With the Markovian projection
method we can project the 2D SABR model onto a so-
called displaced diffusion SABR model. The spread be-
tween the CMS-adjusted rates is defined by:
A displaced diffusion SABR (DD SABR) model is given by
the following set of SDEs:
the function that maps the term P(T0,Tp)/A(T0) to a func-
tion of the swap rate, [1, pp. 726-727]. The market stan-
dard TSR model is the swap-yield TSR model. We devel-
oped two new TSR models both based on interpolation,
the linear interpolation TSR model and the log-linear interpola-
tion TSR model. The log-linear interpolation TSR model can
be a better way to describe the future yield curve mo-
ment, compared to the swap-yield TSR model. When it is
important to reduce the calculation time the linear inter-
polation TSR model is recommended, as it is the model
with the lowest computational costs. The exact details can
be found in [2, pp. 17-41].
Pricing CMS Spread Options with DD SABR Model
The undiscounted value of a CMS spread option (CMSSO) is
given by
We saw that for the pricing of a CMS options it is neces-
sary to compute the expectation of the future CMS rates
under the forward measure that is associated with the
payment date. However, the natural martingale measure
of the CMS rate is the annuity measure. Therefore, we
cannot model both of them as driftless processes under
the same measure. The market standard approach to cal-
culate CMS spread options is to make use of the copula approach. First the marginal distribution for each swap
rate is determined under their associated payment for-
ward measure (making use of a TSR model), the joint dis-
tribution can then be obtained by linking the marginal dis-
tributions with a copula function.
We will follow an approach that can be seen as a combi-
nation of the approaches described in [3, pp. 159-171] and
[1, pp. 804-805] to obtain a stochastic volatility model that
can efficiently and accurately price CMS spread options,
the displaced diffusion SABR model. With this model the
prices can in fact be calculated analytically. In order to
avoid dealing with drift terms we will define CMS-adjusted
forward rates instead of the actual CMS rates. The CMS
forward rate is formally defined as follows:
It follows that at expiry T0 we have:

Page 15 Volume 3, Issue 1
So in this example the DD SABR model outperforms the
copula approach.
To better evaluate the performance of the DD SABR
model we will look at market prices, for the year 2013 we
have market prices available for a 10Y-2Y CMSSO with
start 5 years from today. In the second numerical experi-
ment we will compare CMSSO prices calculated with both
the DD SABR model and the copula approach to market
prices. The CMSSO prices, market prices and price differ-
ences are given by Table 1. In order to compare the re-
sults of the DD SABR model with the copula approach the
sum of squared errors (SSE) is computed for the price
differences obtained with both the DD SABR model and
the copula approach.
Table 1: CMSSO prices - DD SABR model and copula
approach vs market for start date 5 years from today for
2013.
From Table 1 we see that CMSSO prices calculated with
the DD SABR model are closer to the market prices, than
the CMSSO prices calculated with the copula approach.
Once again the DD SABR model outperforms the copula
approach.
where γ denotes the correlation between the forward
price and the volatility process. Note that we now can
calculate the CMSSO prices analytically using Hagan’s for-
mula. The main difficulty when applying Markovian projec-
tion is calculating conditional expectations. Generally,
Gaussian approximation is used to obtain these condi-
tional expected values . The details regarding both the 2D
and DD SABR model can be found in [2, pp. 62-79].
Numerical Experiments
In the first numerical experiment we consider a CMSSO
on a 10Y-2Y spread with 12M frequency, with a start date
5 years from today. We calculated the CMSSO prices with
both the DD SABR model and the copula approach for
the years 2007 and 2013. The 2D SABR model is chosen
as the reference model. To calculate the CMSSO prices by
the 2D and DD SABR model we need to make use of
CMS adjusted forward rates and the associated adjusted
SABR parameters. The computed CMSSO prices in basis
points (bps) for 2007 and 2013 are given in Figure 1.
Figure 1 shows that the prices calculated with both the
DD SABR model and the copula approach only differ
slightly compared to the prices calculated with the refer-
ence model. Although it is clear that the prices calculated
with the DD SABR model are closest to the prices calcu-lated with the reference model. It is also noticeable that
the price differences post-crisis (2013) are larger than pre
-crisis (2007), we attribute this to the fact that
the implied volatilities for the year 2013 are more ex-
treme. This is an indication that accurate pricing of CMS
spread options is of even greater importance nowadays.
Figure 1: CMSSO prices - DD SABR model vs copula approach 2007 and 2013. The start date is 5 years from today.
The swap-yield TSR model was used in the copula approach. The reference model is the 2D SABR model, number of
MC paths is 100000.
Page 16 TopQuants Newsletter
Finally, we would like to mention that the multi-
dimensional SABR model and the DD SABR
model are not only useful for the pricing of CMS spread
options. Further research could be done
in order to apply these models to the pricing of e.g. FX
Asian options or equity basket options.
References
1. V. Piterbarg and B. Anderson, Interest Rate Modelling
Volume I-III, Atlantic Financial Press, 2010.
2. S. L. C. Borst, “The efficient pricing of CMS and CMS
spread derivatives,” TU Delft, 2014
3. P. Hagan, D. Kumar, A. Lesniewski and D. Woodward,
“Managing Smile Risk,” Willmott Magazine, vol. 3, pp. 84-
108, 2002.
4. J. Kienitz and D. Wetterau, Financial Modelling Theory,
Implementation and Practice with MATLAB Source, John
Wiley & Sons Ltd, 2012
Conclusions
CMS-based products are widely used by insurance compa-
nies, pension funds and banks, because these institutions
are very vulnerable to movements in the interest rates.
The notional values for these products are usually quite
large, so accurate pricing is of vital importance. CMS de-
rivatives can be priced accurately and efficiently with TSR
models. Two new TSR models were developed both
based on interpolation, the linear interpolation TSR model
and the log-linear interpolation TSR model.
For the efficient pricing of CMS spread derivatives the
market standard approach is to use the copula approach.
We presented a stochastic volatility model, 2D SABR
model, which can be used for the pricing of CMS spread
derivatives. However, the prices can only be calculated
using a MC simulation. Using the Markovian projection
method the DD SABR model was derived from the 2D
SABR model, which can price CMS spread derivatives ana-
lytically. The main advantage of the DD SABR model com-
pared to the copula approach is that, unlike in the copula
approach, now the full correlation structure is incorpo-
rated into the pricing. From the numerical experiments we have seen that the DD SABR model outperforms the
copula approach..
Liquidity Risk in the Sovereign Credit Default Swap Market
— Rob Sperna Weiland (University of Amsterdam)
Introduction
In this report, which is an adaptation of a study conducted
at Rabobank, we investigate the use of sovereign credit
default swap (CDS) premia in order to estimate sovereign
default probabilities. We conjecture that liquidity risk is
highly priced into these premia and that we therefore
need to quantify, and account for, this distorting effect in
order to get uncontaminated estimates of the default
probabilities. We introduce an intensity-based model that
allows for a country-specific analysis and induces a natural
decomposition of the CDS premia into a credit part and a
liquidity part. We test our model on Brazilian and Turkish
CDS data and we show that liquidity risk is indeed highly
priced into the credit default swap premia. Our default
probability estimates are close to Rabobank's internal esti-
mates, which boosts the confidence we have in our pro-
posed methodology.
The Liquidity-Credit Model
We will use an intensity-based model, since in this class of
models we can construct pricing formulas incorporating
default risk by means of a so-called default intensity proc-
ess. In intensity-based models, a default event is modelled
as the first jump of a jump process which has a jump (or
default) intensity λ( ) that drives the probability of jump-
ing. The process λ( ) is a stochastic process and higher
default intensities imply higher underlying default prob-
abilities. The risk-neutral survival probability until time
> , conditional on the information available at time , is given by
. .
In our pricing model, we will encounter three different
discount factors:

Page 17 Volume 3, Issue 1
they are quoted in basis points) is denoted as:
The maturity of the contract denoted as
and the year fraction between times denoted as:
We will assume a fixed recovery of par rate in case of
default, which is the industry-wide standard (Markit, 2009).
Since the CDS premium is agreed upon by both the pro-tection buyer and seller, we will assume that all liquidity
effects can be incorporated into the fixed leg and, there-
fore, we will model the fixed leg of the CDS separately for the bid and the ask side of the market. We get the
following pricing formulas for the bid and ask premia:
We note that the bid and ask premia only differ by their
respective liquidity discount factors in the denominator and
that in a perfectly liquid market, i.e.
the formulas are identical and there is no bid-ask spread.
For a more detailed construction of the derivation of the
pricing formulas, we refer to the original report.
Set-up of the Stochastic Components
The pricing formulas still contain expressions with ex-
pected values and therefore we still need to specify the
stochastic components of our model in order to obtain
closed-form pricing formulas. A first assumption that we
make, is that the risk-free interest rate is independent of
the default and liquidity intensities and that we can com-
pute the risk-free discount factors from discount curves
Here ( ) is the risk-free interest rate and the (stochastic)
bid/ask liquidity intensities are:
A higher bid/ask implies more illiquidity in the buy/sell-side
of the market, respectively. We will refer the bid and ask
liquidity discount factors respectively as:
and they can be interpreted as the fractional carrying
costs of holding the illiquid CDS (Duffie & Singleton,
1999).
We denote the set of times
as the dates on which the protection buyer pays the CDS
premium to the protection seller. We will make a simpli-
fying assumption that if a default occurs on a non-
reference date, the protection payment is paid at the first
time
following the default (In practice, the default payment is
also not made immediately after the default event, since
the level of the default payment has to be specified by
legal procedures.) This assumption allows us to ignore
accrual interest payments of the protection buyer to the
protection seller and, furthermore, it allows us to focus
only on the reference dates, which makes the calibration
of the pricing formulas computationally less expensive (In
a continuous-time framework, one has to integrate over all possible default times and, in general, this integral
has to be solved numerically. In a discrete-time frame-
work, however, we can just sum over the reference dates
(Duffie, 1998)).
Let denote the notional value of the CDS contract. The
annualized bid and ask premia in percentages (normally
nTTT ,.....,, 21
iT

Page 18 TopQuants Newsletter
that are constructed by bootstrapping USD swap rate
curves. This allows us to consider the interest rate part of
the model separately from the credit and liquidity parts
and this eases the calibration enormously. Furthermore,
this assumption is standard in both academic literature
and practice.
Our model does, however, take into account a depend-
ence structure between the default and liquidity intensi-
ties. We suggest to model this as follows:
The factors
are assumed to be independent and we can think of these
factors as the pure default and liquidity intensities. The
intensities on the left hand side of the above equation
then represent the (full) correlated intensities. We will
denote the components of the factor matrix as the corre-
lation factor matrix since they induce a correlation struc-
ture in the model.
Instead of modelling and we will model the
pure intensities and We will assume that the
pure default intensity follows a CIR process under .
Together with the anticipated low values of
this is enough to guarantee that λ( )≥0, which is a re-
quirement for intensity-based models to work well. We
thus have
We will model the pure liquidity intensities:
as Arithmetic Brownian motion without drifts, which is in line with Longstaff, Mithal and Neis (2005) and
Badaoui, Cathcart and El-Jahel (2013).
We get for ∈ { , }
Lastly, all the processes described above fall into the class
of affine processes. In combination with the above defined
dependence structure, this allows us to derive completely
analytical expressions for our pricing formulas. The ex-
plicit computations can be found in the original report.
Data and Calibration
An attractive feature of our model is that it allows for a
country-specific analysis and has no complicated data re-
quirements. Apart from the USD swap rate curves, which
we need to construct the risk-free interest rate discount
curves, we only use the bid and ask premia of the 2, 3, 5
and 10 year CDSs of the country we want to investigate.
We can use CDSs of different maturities, since in the sov-
ereign CDS market a relatively wide range of maturities is
actively traded (Pan & Singleton, 2008). We will test our
model on Brazilian and Turkish CDSs and we obtain CDS
bid/ask premia of all the maturities mentioned above for
both countries on a daily basis in the period 01-06-2009
until 28-02-2014.
In order to calibrate all the parameters and the daily val-
ues of the intensities, we propose a grid search proce-
dure. In each grid point, we will fix the values of the proc-
ess parameters:
and, given these values, we will find the correlation fac-
tors and the daily values of the pure intensities by least
squares methods such that the model-implied bid/ask pre-
mia fit the observed bid/ask premia best. We will take the
grid point with the best model fit and create a finer grid
around this point and repeat the whole procedure. Our
calibration performs well and we obtain an average rela-
tive pricing error of around 2.2% for both Turkey and
Brazil.
Results
Our model allows for a natural decomposition of the CDS
premium into a credit part and a liquidity part. The credit
part of the CDS premium will be given by considering a
perfectly liquid market. In a perfectly liquid CDS market,
we do not need liquidity discount factors and, therefore,
the CDS premium is given by taking the calibrated default
intensity parameters and default intensity values and by
setting the liquidity intensities to zero in our pricing for-

Page 19 Volume 3, Issue 1
tain these estimates, however, we have to deal with issues
related to the change of probability measure. Until now,
we described our model completely in terms of the risk-
neutral measure, , but for risk management purposes,
however, we want to estimate the real-world default prob-
abilities and therefore we need the values of the model
parameters under the real-world probability measure, .
In the original report, we extensively describe, both from a
mathematical and an economic perspective, how to ad-
dress this topic. Furthermore, we explain how we can use
maximum likelihood estimation in order to obtain esti-
mates for the model parameters under the real-world
probability measure and how we can use them to con-
struct country-specific estimates of the default probabili-
ties.
We find (sample) average one-year default probabilities of
0.28% for Brazil and of 0.57% for Turkey. Unfortunately,
due to their confidential nature, we cannot state Rabo-
bank's internal estimates, but we can, however, state that
these results are very close to Rabobank's internal model.
Summary and Conclusion
In this study, we investigated the use of sovereign credit
default swap data in order to extract market-implied sov-
ereign default probabilities. By introducing an intensity-
based model, we were able to derive closed-form pricing
formulas for bid and ask prices separately, and by calibrat-
ing these formulas to observed bid and ask premia, we
were able to decompose the CDS premia into liquidity and
credit risk related parts. Our decomposition confirms our
conjecture that liquidity risk is heavily priced into sover-
eign CDS premia and, therefore, this distorting component
mulas. Setting the liquidity intensities to zero implies that
and that the correlation factors in our pricing formulas are
irrelevant. In this case, we thus have no bid-ask spread and
we will refer to this premium as the pure credit risk pre-
mium, .
If we now also use the calibrated liquidity parameters and
intensities in the pricing formulas, we have a natural meas-
ure of the liquidity premium, which is given by subtracting
the pure CDS credit premium from the full mid premium.
We thus get
Note that by decomposing the mid premium, we implicitly
assume that the actual agreed upon CDS premium is the
mid premium. This assumption is standard in the academic
literature.
Extracting the Default Probabilities
We can also use our model to extract the market-implied
default probabilities from the CDS premia. By using our
model for this purpose, we immediately account for the
price-distorting liquidity components and obtain uncon-
taminated estimates for the default probabilities. To ob-
Table 1: Decomposition of 2 year CDS premia. Entries are denoted as a fraction of the mid premium.
Decomposition 2 Year CDS Mid Premium
Brazil Turkey
Credit Part
Mean 0.6175
Credit Part
Mean 0.5783
Std. Dev. 0.0249 Std. Dev. 0.0277
Max 0.6677 Max 0.6398
Min 0.5494 Min 0.5181
Liquidity Part
Mean 0.3825
Liquidity Part
Mean 0.4217
Std. Dev. 0.0227 Std. Dev. 0.0272
Max 0.4417 Max 0.4802
Min 0.3379 Min 0.3602

Page 20 TopQuants Newsletter
should be accounted for if one wants to use CDS premia
to extract default probabilities from. Although not fully
described in this article, our model can be used to esti-
mate the real-world implied default probabilities. Our
estimates are in line with Rabobank's internal estimates,
which boosts the confidence we have in our methodology.
References
1. Badaoui, S., Cathcart, L., El-Jahel, L. (2013). Do
sovereign credit default swaps represent a clean measure
of sovereign default risk? A factor model approach. Journal
of Banking and Finance, 37, 2392 –2407.
2. Bühler, W.H.C., Trapp, M. (2008). Credit and liquidity
risk in bond and CDS markets,. Working paper.
3. Duffie, D. (1998). Defaultable term structure model
with fractional recovery of par. Working paper.
4. Duffie, D., Singleton, K.J. (1999). Modeling term
structures of defaultable bonds. Review of Financial Studies,
12, 687 – 720.
5. Longstaff, F.A., Mithal, S., Neis, E. (2005). Corporate
yield spreads: Default risk or liquidity? New evidence
from the credit default swap market. Journal of Finance,
60, 2213 – 2253.
6. Markit (2009). Forthcomming CDS convention changes
for Japan and Asia.
7. Pan, J., Singleton, K.J. (2008). Default and recovery im-
plicit in the term structure of sovereign CDS spreads.
Journal of Finance, 63, 2345 – 2384.
A Real Option Perspective on Valuing Gas Fields
— Lin Zhao, Sweder van Wijnbergen (University of Amsterdam)
1. Introduction
Investment decisions in the energy industry are often un-
dertaken sequentially and are sensitive to market informa-
tion and geographic conditions. The widely used NPV-
based frameworks are unsuitable for evaluating such in-
vestment projects because they ignore the path-
dependency embedded in projects and fail to incorporate
the value of managerial flexibility to change or to revise as
new information becomes available. Real option analysis
(ROA) is a more appropriate approach in the capital budg-
eting process under such circumstances because of its
ability to incorporate managerial flexibility and future in-
formation as it becomes available.
However, even moderately complex problems are widely
considered too difficult to solve using ROA. As a result, it
has remained something of a niche product, nice in theory
but not useful for real world problems. In this article, we
show that such a view is mistaken: we provide a complex
but manageable solution to strategic investment problems
in the form of complex option styles, with unhedgeable
risk, time varying volatilities and endogenous exercise
dates (non-European options).
In the case of gas fields, there are two sources of risk as-
sociated with the value of underlying assets, market gas
prices and reservoir volume. First, gas contracts are
traded publicly, and we observe clustering volatility in the
historical gas spot prices. Thus a GARCH model is em-
ployed and risk-neutral pricing is approximately obtained
as in Duan[1995] to deal with the additional risk source
brought by stochastic volatility. Note that Black-Scholes
formula cannot be applied because it requires the strong
assumption of constant variance. Second, reservoir size
brings in idiosyncratic risks which cannot be hedged by
appropriately structured replicating portfolios for lack of
correlated traded instruments. We demonstrate two al-
ternative approaches to solving contingent claim prob-
lems, namely cost-of-capital method and integrated valua-
tion method.
Moreover the complicated structure of the real-life prob-
lem results in a non-European option setting for which no
closed form solutions exist. We use Stochastic Dynamic
Programming techniques, using the Least Square Monte
Carlo method (Longstaff and Schwartz [2001]) to reduce
the curse of dimensionality problem to manageable pro-
portions and improve computational efficiency. This
method is able to value various styles of options including
American options or other exotic options and to manage
multiple uncertainties described by complex stochastic
processes without sacrificing option pricing tractability. It
approximates conditional continuation values with linear
regression results derived from backward simulation re-
sults. The backward simulations form the basis of the re-
gressions linking continuation values to state variables;

Page 21 Volume 3, Issue 1
2.2 Reservoir Distribution In conformity with industrial
standard terminologies, the reservoir distribution of a gas
field is decomposed into probability of success (POS) and
reservoir size R. As is shown in Figure 2, reservoir amount
R>0 is found with a probability equal to POS; so the prob-
ability of zero recoverable amount is 1-POS. Subsequently,
conditional on a positive finding, the reservoir size R is a
random variable with a truncated lognormal distribution (at
99%) as illustrated in Figure 3.
In practical project evaluation processes, companies typi-
cally use three representative cases, often labeled case P10,
P50, and P90. Here P90 stands for the most pessimistic
reservoir estimate. We incorporate this practice by scaling
the truncated lognormal such that the probability that re-
coverable reserves exceed the P90 case is 90%. Analo-
gously, the P10 case is the most optimistic reservoir esti-
mate that is likely to be met or exceeded with a probability
of only 10%. We estimate the parameters of the truncated
lognormal by loglikelihood maximization. Particularly, each
reservoir size corresponds to its production profiles, in-
cluding output levels and production lifetime.
2.3 Timeline of Options Figure 4 shows the timeline of
the investment problem. T is the minimum license duration
of Prospect A, B, and their facilities; TA,TB are production
periods of Prospect A and B respectively; tA and tB are
the production starting dates of A and B. Interval I contains
all possible starting points of Project B; and Interval II con-
tains all possible starting points of Project A, whose lower
boundary is subject to the starting date of project B, i.e. tB.
although the backward simulations cannot be used in the
valuation exercise, the regression functions can be used in
a subsequent forward simulation study to approximate
continuation values. The methodology solves the dimen-
sionality problem, complexity now increases linearly in
dimension size instead of exponentially.
Furthermore we find that correctly modeling the struc-
ture of volatility is crucial: failure to capture the stochastic
nature of of volatility leads to severely biased results. We
also show that a high correlation between reservoir sizes
at different locations creates extra option values. Option
values are shown to decrease with cost-of-capital rates
while they increase with the investor's risk tolerance. The
non-standard features of our approaches combined are
shown to have a significant impact on project decisions:
options augmented valuations substantially exceed corre-
sponding NPV calculations ignoring option values.
2. Methodology
2.1 Problem Description We consider an investment
problem concerning two prospective gas fields Prospect A
and Prospect B, which share similar geographic and geo-
logic properties. The decision tree of this investment is
displayed in Figure 1. The reservoir uncertainty of Pros-
pect B can be resolved after one-year production, which,
due to similar geological structure, will provide informa-
tion on the reservoir distribution of Prospect A. Based on
new information, the firm continues to decide whether
and when to explore Prospect A. Moreover, higher gas
prices also make new investment projects more attractive.
Figure 1: Decision Tree
The investor's problem can be written as a combination of
two options: the first one is whether to exercise the wait-
ing option on B and the second one is subject to the exer-
cise of the first one that the firm then holds the right to
decide whether and when to exercise the option to un-
dertake project A. Our aim is to evaluate Prospect B by
taking both fixed cash flows and flexible future opportuni-
ties into consideration.
Figure 2 Distribution of Reservoir Size
Figure 3 Truncated Lognormal Distribution for Reservoir Size in Case of Success

Page 22 TopQuants Newsletter
Figure 4: Timeline of Investment
We construct two sequential Bermuda-style options,
which can be exercised at a set of predetermined dates
before maturity. The first option is a waiting option on
Prospect B starting from time 0 with a maturity of T-1-max{TA,TB}. Investor has the option to wait until the
market gas price increases so that higher profits are real-
ized. Once the waiting option is exercised at time tB and
further information on POS (or R, or both) of A is gained
at time tB+1, the firm decides whether and when to ex-
plore Prospect A by taking both reservoir size and future gas prices into consideration. The project A option arises
after one-year production of B (i.e. tB+1), when the
reservoir quantity of B is revealed. It has a maturity of TB-1 with the assumption that the second option disappears
once the development of Prospect B is finished, hence tA
is located in Interval II. Since B unlocks option A, the pro-
ject value of B should include the value of managerial flexi-
bility embedded in project A.
2.4 Gas Prices Title Transfer Facility (TTF) weekly data
for Dutch gas market are obtained through Datastream,
covering the period of Mar 7, 2005 through May 18, 2012.
Let Pt be the spot gas price at time t. The logarithm price
returns are stationary according to both Phillips-Perron
unit root test and Dickey-Fuller unit root test, which im-
plies that only stochastic trend exists in the time series.
Moreover, volatility clustering can be observed from Fig-
ure 5.
For instance, larger fluctuations during the periods 2005-
2006 and 2009-2010 are followed by less volatile periods.
The data clearly argue against a constant volatility assump-
tion, so we use a GARCH frameworks are considered.
Suppose under probability measure P, its one-period rate
of return has a conditional lognormal distribution. Follow-
ing Duan [1995], we have
mu is constant one-period risk-free rate of return and
lambda is the constant unit risk premium. Ft-1 is the infor-
mation set, up to and including time t-1.
2.5. GARCH Option Pricing Model Duan [1995]
shows that under risk-neutral pricing measure Q, the log
return of prices follows a normal distribution conditional
on Ft-1 under certain assumptions and that
Hence under the risk-neutral measure Q, the logarithm
return follows a stochastic process as
An MA(2)-GARCH(1,1) model, which yields the highest
loglikelihood, is eventually selected for predicting returns
and volatilities of future gas prices with standard errors in
the parenthesis.
Figure 5 TTF Weekly Logarithm Returns

Page 23 Volume 3, Issue 1
ditional on the outcome of period-t's market uncertainties
(gas market):
Here vt denotes the project value at time t and gammat is
the NPV of the future period risk tolerances. Therefore
the integrated valuation approach uses effective certainty
equivalent values instead of NPV as a proxy of project
value. Note that as gamma approaches positive infinity, this
decision maker becomes risk neutral and the option pricing
problem becomes identical to a complete market risk neu-
tral pricing solution.
3. Results
In this case study, POS of B equals 80%, while Prospect A
has a much smaller POS of 30%.
3.1 Cost-of-Capital Method We choose a reasonable
range for cost of capital that reveals the underlying risk of a
project.
Results without reservoir information update: The
dotted line in Figure 6 exhibits the simulated NPVs of Pros-
pect B with respect to a range of cost of capital (from 3% to 15% ), where the red horizontal line separates projects
with positive and negative NPVs. It is clear that due to its
low NPV, Prospect B is not economically attractive enough
to be developed in itself: Prospect B is still rejected if the
cost of capital is higher than 9%. Figure 6 shows that the
integrated value of Prospect B is greatly increased when
option values are considered. For instance, with a cost of
capital equal to the risk free rate 15%, the negative NPV of
Prospect B (-1.82mln) would lead to rejection of this pro-
ject using traditional selection criteria. But using real op-
tion analysis gives us a positive integrated project value of
B (10.36mln), implying its commercial profitability; as a
result using ROA leads to very different investment deci-
sions than the decisions one would make based on tradi-
tional NPV criteria.
2.6 Integrated Valuation Method Given a complete
market, we value a claim OP by replicating it with a unique
self-financing portfolio, which yields a price XT at the final
date T. Therefore X0 gives the price of OP at time 0.
However, a claim in an incomplete market cannot be
perfectly replicated and we run into a problem of finding a
unique price for this claim. More specifically, selling such a
claim entails exposing oneself to an idiosyncratic/ un-
hedgeable risk, which can be represented by XT-OP (or OP-XT) at time T. This difference can be solved by speci-
fying the investor's preference towards the risk. Therefore
the price of the claim should be
which results in the failure of preference free pricing. This
leads to the necessity to parametrize the investor’s pref-
erence.
We assume the investor's preferences exhibit constant
absolute risk aversion (CARA):
where rho represents the decision maker's period-t risk
tolerance. Under certain assumptions, the certainty
equivalence can be expressed as
with xt as an uncertain cash flow at period-t.
Now switch to our specific problem. Suppose a project
has a series of future cash flows {CF0, CF1, …, CFT},
where CFt=Pt*Gt-Ct, with gas price Pt, production Gt,
and cost Ct at time t. More generally, we have
where Rt is the realized reservoir volume; and ut is a
dummy variable, representing the strategy, i.e. decisions to
exercise.
Effective certainty equivalent is defined by taking expecta-
tions over period-t's private uncertainties (reservoir) con-Figure 6 Option Values vs NPV

Page 24 TopQuants Newsletter
So real option valuation plays a crucial role in investment
decisions by accepting projects that could have been re-
jected under traditional evaluation rules. Under real op-
tion valuation, the prospect B is valuable for development
under all cost of capital considered. As a result, the firm
should not simply abandon Prospect B; in fact, with the
further exploration opportunity on A, the project yields a
positive expected value and is worth investing. Further-
more, given the precise evaluation of the projects through
ROA, the firm can quantitatively compare the investments
and choose (one of) those with highest values.
Two observations from Figure 6 are also worth comment-
ing on. First, as a natural result, A is less valuable with a
higher cost of capital. Thus as expected, the option value
decreases in discount rates as well due to the shrinking
value of A. But the declining option value does not imply a
negative Greek rho, since the risk-free rate remains un-
changed. Instead Figure 6 shows the interaction between
option value and cost-of-capital, where cost-of-capital is
used to adjust payoffs.
Stochastic Volatility v.s. Constant Volatility: Due to the
limited downside of options, an option becomes more valuable as the volatility of underlying assets increases.
Thus the precise structure of volatility process is impor-
tant in valuing options. Figure 7 presents the results when
assuming the logarithm return time series follows a log-
normal distribution with mean and constant variance cal-
culated from the same TTF data set as used for the above
GARCH model.
It is evident that the option value is still positive but only
half the size one obtains using the GARCH model (Figure
6). The simulated NPV of B is negative under all cost of
capital rates considered. Thus, neglecting clustered volatil-
ity dramatically undervalues both options and NPVs and
the project is more likely to be rejected under constant
volatility assumption.
Results with reservoir information update: The following
part adds one extra dimension to our model by taking
reservoir correlation into consideration. For practical
reasons, three cases of correlation are discussed. The first
one considers that only POS of A and B are correlated.
Assume that POS of A rises to 50% given a success drilling
of B. The second case considers when POS remains un-
changed but focuses on correlation between the PDFs of
reservoir (i.e. R) in particular. We assume that if the res-
ervoir size of B turns out to equal that of P10 case, then
the reservoir size of A equals the outcome of its P10 case
as well. Similarly, a P50 (P90) outcome of B also implies a
P50 (P90) outcome of A. Lastly, Case III combines the first
two cases, where both information updates in POS and R
are considered.
Figure 8 presents all the results from the three cases as
well as the one with no correlation. For all three cases
with correlation, option values are much larger than what
is obtained without reservoir correlation. This is an obvi-
ous result because the more information can be gained in
the future, the more valuable the option to do that is. In
addition, the option value of Case III is larger than either
option value in Case I or in Case II. This is to be expected
since information has been updated to the largest extent
in Case III.
3.2 Integrated Valuation Method
Results with and without reservoir information updates:
Next we explore the preference-dependent valuation
given a particular utility structure of investors. Investors
maximizes their utility with idiosyncratic risk aversion (or
risk tolerance) . Instead of exploring a reasonable set of
cost of capital, we use effective certainty equivalent to
calculate option values based on different risk tolerance
within the context of incomplete markets. Figure 7 Option Values vs NPV with constant variance
Figure 8 Cost-of-capital method with Reservoir Correlation

Page 25 Volume 3, Issue 1
However, both approaches have their own pros and cons,
which is why we present both. The cost-of-capital method
is straightforward and closest to the traditional capital
budgeting processes in practice. The integrated valuation
approach provides the best results if one knows the inves-
tor's risk preference, for which a survey method could be
used to pin down the investor's risk tolerance .
4. Conclusion
I show that ignoring the option values embedded in pro-
jects can lead to seriously wrong investment decisions. In
the presence of clustered volatility, incorrectly assuming
constant variance leads to a significant underestimation of
project values. Note that the algorithm and valuation ap-
proach in this paper can be easily generalized and applied
to general option pricing problems other than real options.
Acknowledgement: The first author likes to thank Prof. Ton
Vorst and Prof. Sweder van Wijnbergen for helpful discussions
and comments. I gratefully acknowledge the financial support of
EBN B.V., The Netherlands.
5. References
1. Duan, J.C., The GARCH option pricing model. Mathe-
matical Finance. 5(1) (1995), 13-32.
2. F.A. Longstaff, E.S. Schwartz, Valuing American options
by simulation: A simple least-squares approach. The Re-
view of Financial Studies. Vol.14, No.1 (2001).
In Figure 9, from left to right, when the risk tolerance
becomes larger, the investor becomes more risk tolerant
(i.e. less risk averse). It is clear from the figure that more
risk averse investors value options less than investors with
higher risk tolerance. Moreover, the option value is a con-
cave function of risk tolerance, meaning that the instanta-
neous acceleration of the option value is decreasing along
with the risk tolerance. Figure 9 also shows that while
option values increase as the investor becomes more risk
seeking (while still risk averse), preference dependence is
moderate.
Stochastic Volatility v.s. Constant Volatility: Again we
compare the results with gas prices specified under a
GARCH process and under a constant volatility assump-
tion. Figure 10 shows that with a constant volatility set-
ting, not only the option values largely shrink, but also the
effect of future information update becomes smaller. This
again confirms the similar conclusions obtained above
through cost-of-capital method.
3.3 Cost-of-Capital v.s. Integrated Valuation Ap-
proach
Despite their different theoretical backgrounds, these two
approaches to a large extent yield similar results. First,
project value increases substantially compared to results
obtained by traditional NPV methods, with potentially
very different investment decisions as a consequence. Sec-
ond, the real option approach allows incorporation of
future information as it becomes available, which again
raises project values when reservoir distributions are cor-
related. Third, the GARCH specification is preferred over
a model with constant volatility, since the latter underval-
ues the investment opportunity due to its oversimplifica-
tion. In short, the value of embedded options is strongly
influenced by the correlation among reservoirs and the
stochastic process of gas prices.
Figure 9 Results of Integrated Valuation Approach
Figure 10 Results of Integrated Valuation Approach with Constant Volatility

Page 26 TopQuants Newsletter
Upcoming TopQuants Events
1. The next event is the 2015 TopQuants Spring workshop on May 26th. The event will be hosted by Ernst & Young
and will feature three main speakers: Svetlana Borokova (VU/DNB), Philip Whitehurst (LCH Clearnet), Raoul Pietersz
(ABN AMRO). All further details of the event will be posted in due course on the TopQuants homepage.
2. The next issue of the TopQuants newsletter will follow in September 2015. Contributions for it are already
welcome. Kindly contact Aneesh Venkatraman and Gilles Verbockhaven ([email protected]).