topology of the correlation networks among major currencies using hierarchical structure methods
TRANSCRIPT

Physica A 390 (2011) 719–730
Contents lists available at ScienceDirect
Physica A
journal homepage: www.elsevier.com/locate/physa
Topology of the correlation networks among major currencies usinghierarchical structure methodsMustafa Keskin a,∗, Bayram Deviren b, Yusuf Kocakaplan c
a Department of Physics, Erciyes University, 38039 Kayseri, Turkeyb Department of Physics, Nevsehir University, 50300 Nevsehir, Turkeyc Institute of Science, Erciyes University, 38039 Kayseri, Turkey
a r t i c l e i n f o
Article history:Received 26 April 2010Received in revised form 7 October 2010Available online 29 October 2010
Keywords:EconophysicsMinimal spanning treeUltrametric hierarchical treeBootstrapTaxonomyForeign exchange market
a b s t r a c t
We studied the topology of correlation networks among 34 major currencies using theconcept of a minimal spanning tree and hierarchical tree for the full years of 2007–2008when major economic turbulence occurred. We used the USD (US Dollar) and the TL(Turkish Lira) as numeraires in which the USD was the major currency and the TL wasthe minor currency. We derived a hierarchical organization and constructed minimalspanning trees (MSTs) and hierarchical trees (HTs) for the full years of 2007, 2008 andfor the 2007–2008 period. We performed a technique to associate a value of reliabilityto the links of MSTs and HTs by using bootstrap replicas of data. We also used theaverage linkage cluster analysis for obtaining the hierarchical trees in the case of theTL as the numeraire. These trees are useful tools for understanding and detecting theglobal structure, taxonomy and hierarchy in financial data.We illustrated how theminimalspanning trees and their related hierarchical trees developed over a period of time. Fromthese trees we identified different clusters of currencies according to their proximity andeconomic ties. The clustered structure of the currencies and the key currency in eachcluster were obtained andwe found that the clustersmatched nicely with the geographicalregions of corresponding countries in theworld such as Asia or Europe. As expected the keycurrencies were generally those showing major economic activity.
© 2010 Elsevier B.V. All rights reserved.
1. Introduction
Currency markets which represent the most liquid and largest financial market are extremely important because theyperform daily transactions totaling trillions of US dollars, exceeding the yearly gross domestic product (GDP) of mostcountries [1]. There is no doubt that the value of a currency is extremely important because it is expected to reflect the entireeconomic status of the country, and the foreign exchange rate is considered to be ameasure of economic balance between thetwo countries. From the physics perspective, foreign exchangemarkets are typical open systems having interactionswith allkinds of financial information around the world including price changes in other markets. The average transaction intervalsof foreign exchange markets are typically about 10 s, and it is not clear how the market correlates with the huge scale ofinformation of a whole country or from economic blocks [2]. It is important to investigate the interaction of currencies usingthe high precision data of foreign exchange markets in order to empirically establish the relations between microscopicmarket fluctuations and macroscopic economic states.
∗ Corresponding author. Tel.: +90 352 4374938x33105; fax: +90 352 4374931.E-mail address: [email protected] (M. Keskin).
0378-4371/$ – see front matter© 2010 Elsevier B.V. All rights reserved.doi:10.1016/j.physa.2010.10.041

720 M. Keskin et al. / Physica A 390 (2011) 719–730
One of the problems in foreign exchange research is that currencies are priced against each other so no independentnumeraire exists. Any currency chosen as a numeraire will be excluded from the results, yet its intrinsic patterns canindirectly affect overall patterns. There is no standard solution to this issue or a standard numeraire candidate. Gold wasconsidered, but rejected due to its high volatility. This is an important problem as different numeraires will give differentresults if strong multidimensional cross-correlations are present. Different bases can also generate different tree structures.The inclusion or exclusion of currencies from the sample can also give different results. This implies that we should take allmajor currencies and improper emphasis should not be placed on any particular MST result. Resulting robustness shouldalso be checked by comparison with other methods or samples [3].
In the present paper, using the concepts of minimal spanning tree (MST) and hierarchical tree (HT), we analyzed thetopology of thirty-fourmajor currencies,whichwere generally free floating andhad eithermarket dominance or representeda region covering the data period from January 4, 2007 toDecember 31, 2008.We choose this period becausemajor economicturbulence occurred during this period. For example, at the beginning of 2007 (02.01.2007), the parity of the USD–TL wasabout 1.406, falling to 1.215 on 15.10.2007, and reaching its lowest value at the end of the year (31.12.2007) at 1.1703. Atthe beginning of 2008 (02.01.2008), the parity was about 1.1708, but it increased to 1.5394 due to economic turbulenceson 31.12.2008. Data were provided from the Pacific Exchange Rate Service [4]. We use the USD and TL as numeraires. TheUSD was a major currency, and the TL was a minor currency. We also performed the bootstrap technique [5] to associate avalue of reliability to the links of MSTs and HTs. Finally, we used the average linkage cluster analysis [5,6] for obtaining thehierarchical trees in the case of the TL as the numeraire.
The MST and HT provided a useful guide for determining underlying economic or regional causal connections inindividual currencies. They also show the interconnection among currencies, detecting clusters and taxonomic relationsin foreign exchange markets. These trees, introduced by Mantegna [7], and Mantegna and Stanley [8], have been appliedto analyze currency markets [2,9,10], especially to find clustered structure of currencies and the key currency in eachcluster [2,3] and to resolve contagion in a currency crisis [9,10]. These trees are also used to study the clustering behaviorof individual stocks within a single country, for example, usually the USA [11–15], Korea and the USA [16], Italy [17,18],Greece [19], and also in Turkey [20]. The concept of the MST and the HT is also used to examine the extent and evolution ofinterdependence betweenworld equitymarkets [21,22], European equitymarkets [23] and commoditymarkets [24]. Finally,we should also mention that a variety of dynamic MST analysis has also been developed and applied to the time-varyingbehavior of stocks in Refs. [25–30].
The outline of the remaining part of this paper is organized as follows. In Section 2, we briefly introduce the MST,ultrametric distance and the HT constructed from the Pearson correlation coefficient. In Section 3 the data are described.Numerical results and discussion are presented in Section 4, followed by a brief conclusion.
2. Minimal spanning tree and hierarchical tree construction
Since the construction of the minimal spanning tree (MST) and hierarchical tree (HT) has been well explained inMantegna [7], and Mantegna and Stanley [8], we will briefly present the methodology here. First, we define a correlationfunction between a pair of currencies based on the Exchange Rate Service [4] in order to quantify synchronization betweenthe currencies. Let Pi(t) be the rate i at time t . Then, a rate change at a time interval τ , Ri(t), is defined as
Ri(t) = ln Pi(t + τ) − ln Pi(t), (1)
meaning the geometrical change of Pi(t) during the interval τ . We take τ as one day in the following analysis throughout thispaper. Ri(t) is also called the vector of the time series of log-returns [22,30]. Using the rate of change, the Pearson correlationcoefficient between a pair of rates or individual currencies can be calculated by the cross-correlation function as
Cij =⟨RiRj⟩ − ⟨Ri⟩⟨Rj⟩
(⟨R2i ⟩ − ⟨Ri⟩
2)(⟨R2j ⟩ − ⟨Rj⟩
2), (2)
where ⟨. . .⟩ represents the statistical average over the period studied. The correlation coefficients Cij have values rangingfrom −1 to +1, where −1 and +1 mean that two currencies, i and j, are completely anti-correlated and correlated,respectively. If Cij = 0 the currencies i and j are uncorrelated. The coefficients Cij form a symmetric N × N matrix withdiagonal elements equal to unity. We apply the correlation matrix to construct a currency minimal spanning tree, and byusing it we can intuitively understand the network among foreign exchange rates. The MST, a theoretical concept of graphtheory [31], forms taxonomy for a topological space of the N rates. The MST is generated from a graph by selecting themost important correlations between currency indices. The MST reduces the information space from N(N − 1)/2 separatecorrelation coefficients to (N − 1) linkages, known as tree ‘‘edges’’, while retaining the salient features of the system [23].Therefore, the MST is a tree having N − 1 edges that minimize the sum of the edge distances in a connected weighted graphof the N rates. The edge distances satisfy the following three axioms of Euclidean distance:
(i) dij = 0 if and only if i = j,(ii) dij = dji,(iii) dij ≤ dik + dkj.

M. Keskin et al. / Physica A 390 (2011) 719–730 721
Table 1Set of daily data for 34 currencies.
Currency Code Currency Code
Argentinian Peso ARS New Zealand Dollar NZDAustralian Dollar AUD Norwegian Krone NOKBrazilian Real BRL Peruvian New Sole PENBritish Pound GBP Philippines Peso PHPCanadian Dollar CAD Polish Zloty PLNChilean Peso CLP Russian Ruble RUBChinese Renminbi CNY Saudi Arabian Riyal SARColombian Peso COP Singapore Dollar SGDCzech Koruna CZK Slovakian Koruna SKKEgyptian Pound EGP South African Rand ZAREuro EUR South Korean Won KRWHungarian Forint HUF Swedish Krona SEKIndian Rupee INR Swiss Franc CHFIndonesian Rupiah IDR Taiwan Dollar TWDJapanese Yen JPY Thai Baht THBKuwaiti Dinar KWD Turkish Lira TLMexican Peso MXN US Dollar USD
Here, dij expresses the distance between each pair of currencies i and j. We need the Euclidean distance between thecurrencies in order to construct the MST. However, it is well known that the correlation coefficient Cij does not satisfy allthese axioms. One can convert the correlation coefficient by appropriate functions so that the axioms can be applied. Oneof the appropriate functions that fulfills the three axioms was found by Mantegna [7], and Mantegna and Stanley [8] and isdefined as
dij =2(1 − Cij), (3)
where the distance dij can lie in 0 ≤ dij ≤ 2, while correlations run from −1 to +1. High correlations correspond to smallvalues of dij.
Now, one can construct aMST for a pair of currencies using theN×N matrix of dij. Twomethods for constructing theMSTare Kruskal’s algorithm [31–33] and Prim’s algorithm [34]. We used Kruskal’s algorithm [31–33] to construct our MST. Thealgorithm consists of the following steps: (i) we choose a pair of currencies with nearest distance and connect them with aline proportional to the distance; (ii) we also connect a pair of currencies with the 2nd nearest distance; (iii) we also connectthe nearest pair that is not connected by the same tree. We repeat the third step until all the given rates are connected inone unique tree. Then, we achieve a connected graph without cycles.
Finally, in order to construct the HT, we introduce the ultrametric distance or the maximal d∧
ij between two successivecurrencies encountered whenmoving from the starting currency i to the ending currency j over the shortest part of theMSTconnecting the two currencies. For example, the distance d∧
ad is dbc when the MST is given as
a − b − c − d
where d∧
bc ≥ max{dab, dcd}. The distance d∧
ij satisfies the axioms of Euclidean distance and the following ultrametricinequality with a condition stronger than axiom (iv) d∧
ij ≤ d∧
ik + d∧
kj [35], which can be written as
d∧
ij ≥ max{dik, dkj}. (4)
The distance d∧
ij is called the subdominant ultrametric distance [36,37]. One can construct an HT by using Eq. (4).We performed a technique to associate a value of reliability to the links of correlation-based graphs, namely the minimal
spanning trees (MSTs) and hierarchical trees (HTs), by using bootstrap replicas of data. We also used the average linkagecluster analysis for obtaining the hierarchical trees in the case of the TL as the numeraire. This analysis gives the clusterstructuremuchbetter. The bootstrap technique and average linkage cluster analysiswere explained extensively in Refs. [5,6].
The constructions of the MST and HT will be elaborated in Section 4.
3. Data
We chose thirty-four major currencies because they were generally free floating and had either market dominance orrepresented a region covering the data period from January 2, 2007 to December 31, 2008, as shown in Table 1. Data wereprovided from the Pacific Exchange Rate Service available online (http://fx.sauder.ubc.ca/data.html) which coincides withdaily data. These data give some idea of how international currencies interact, how currency nodes are clustered, and thepattern behind price influences. We should also mention that these data represent a small sample compared to those offinancial market studies; hence they will restrict possible topologies. We will construct the MSTs and the HTs from thesedata in the next section.

722 M. Keskin et al. / Physica A 390 (2011) 719–730
Fig. 1. (a) USD-based minimal spanning tree for the year 2007. Graphical representation of minimal distance metrics for currencies quoted against theUSD. (b) USD-based hierarchical tree of subdominant ultrametric space for the year 2007. Hierarchical grouping of distance metrics for currencies quotedagainst the USD.
4. Numerical results and discussion
In this section, we present the MSTs and the HTs using the 34 major currencies which were studied to investigate thetopology of the correlation networks among these currencies. TheMSTswere constructed using Kruskal’s algorithm [31–33]for the USD and the TL based on a distance-metric matrix. The reason of choosing the USD and the TL as numeraires is thatthe USD is the major currency and the TL is the minor currency. The numbers on the links of the MSTs and HTs are obtainedfrom the bootstrap technique and the number gives information about statistical reliability of each link of graphs. If thevalues are close to one, the statistical reliability or the strength of the link is very high. Otherwise, the statistical reliabilityor the strength of the link is lower.
Figs. 1(a), 2(a) and 3(a) show the MSTs applying the method of Mantegna and Stanley [7,8] for the USD based on adistance-metric matrix for the full years 2007, 2008 and for the 2007–2008 period, respectively. The number of links in theMSTs is 32; hence the number of links should be (N−1); in our data,N = 33, because we used 34 currencies in which one ofthem is a numeraire. From these trees, we detected different clusters of countries according to their geographical proximityand economic ties. In Fig. 1(a), the first cluster is the Europe cluster where we focused on the EUR (Euro). All neighbors of

M. Keskin et al. / Physica A 390 (2011) 719–730 723
Fig. 2. (a) Same as Fig. 1(a), but for the year 2008. (b) Same as Fig. 1(b), but for the year 2008.
the EUR are almost all European currencies, such as the CHF (Swiss Franc), CZK (Czech Koruna), GBP (British Pound), SEK(Swedish Krona), RUB (Russian Ruble) and NOK (Norwegian Kroner) along with the JPY (Japanese Yen). This group formsa set of currencies that are highly correlated with each other with the EUR at their center, so that the bootstrap values ofthe links between these currencies are changed from 0.82 to 1.0 (in a scale from 0 to 1).The exception in this group is theJPY, which does not fit into the Asia–Pacific cluster but is generally linked to Western markets. A similar behavior withthe EUR at the center was also reported in Refs. [1,2,38]. Although the CNY (Chinese Renminbi) is linked to the EUR, thebootstrap value of the link between EUR and CNY is 0.04. This means that this link is only a statistical fluctuation; hence theCNY does not belong to the Europe cluster. Similarly, from Fig. 1(a) the SAR (Saudi Arabian Riyal) and KWD (Kuwaiti Dinar)pair is observed as a subgroup of the Europe cluster, but has no statistical justification according to the bootstrap analysis.Therefore, the KWD and SAR also do not belong to the Europe cluster. The second cluster seems to the Asia–Pacific clusterwhich is composed of the Asian and Pacific countries, but the bootstrap analysis does not support this result, therefore onecannot consider it as a cluster. We should also mention that the AUD (Australian Dollar) and NZD (New Zealand Dollar) arestrongly connected with each other and similar results have been reported in Refs. [3,22]. Moreover, the IDR (IndonesianRupiah) and PHP (Philippines Peso) are also closely connectedwith each other in this group. It is expected that the THB (ThaiBaht) and INR (Indian Rupee) should be in the Asia–Pacific group because these are Asian countries, but the THB and INRare not in this group. In this case, trade relationships and economic ties appear to dominate geographic effects. The SouthAmerican cluster is a third clusterwhich is composed of the BRL (Brazilian Real), COP (Colombian Peso) andARS (ArgentineanPeso). Although the EGP (Egyptian Pound) is linked to the ARS, the bootstrap value of the link between the EGP and ARS is

724 M. Keskin et al. / Physica A 390 (2011) 719–730
Fig. 3. (a) Same as Fig. 1(a), but for the years 2007–2008. (b) Same as Fig. 1(b), but for the years 2007–2008.
0.02 and this means that this link is only a statistical fluctuation; hence the EGP does not belong to the South Americancluster. This cluster linked to the Asia–Pacific cluster via the NZD and is also linked to the Europe cluster via the TL. Here,we can see that the TL plays a bridging role between the European and South American groups which the BRL heads. Theconnection between the BRL and TL was also reported by Brida et al. [11]. From Fig. 2(a), we can observe a cluster similarto that seen in Fig. 1(a), but the following differences have been found. (i) The Asian and the Pacific clusters are separatedfrom each other. (ii) The Asian grouping with the SGD (Singapore Dollar) at its head which is directly linked to the Europegrouping. The MST in Fig. 3(a) is very similar to Fig. 2(a) in terms of overall structure but the INR, PHP, IDR and EGP aresplit out from the Asian group and the INR and TL are strongly correlated with each other. Moreover, we also obtained theaverage bootstrap values of the links between the currencies and found 0.6225, 0.5925 and 0.6012 for the 2007, 2008 and2007–2008 periods, respectively. It is also worthwhile mentioning that the average bootstrap value for 2007 is larger thanfor 2008 and for the 2007–2008 period. This fact showed that when we used the USD as numeraire, the most stable tree isobtained for the full year of 2007. This is not surprising because the foreign exchange markets had more stable structuresbefore the global financial crisis. Finally, from these results, one can conclude that the global financial crisis had a seriouseffect on markets.
The HTs of the subdominant ultrametric space associated with the MST are shown in Figs. 1(b), 2(b) and 3(b). Twocurrencies (lines) link when a horizontal line is drawn between two vertical lines. The height of the horizontal line indicatesthe ultrametric distance at which the two currencies are joined. To begin with, in Fig. 1(b), one can see that the distancebetween the SAR and KWD is the smallest of the sample, indicating a strong relationship between these two currencies

M. Keskin et al. / Physica A 390 (2011) 719–730 725
Fig. 4. (a) TL-based minimal spanning tree for the year 2007. Graphical representation of minimal distance metrics for currencies quoted against the TL.(b) TL-based hierarchical tree of subdominant ultrametric space for the year 2007. Hierarchical grouping of distance metrics for currencies quoted againstthe TL.
which are from the first cluster. The second cluster is Europewhich consists of two sub-groups, onewith theHUF (HungarianForint) and PLN (Polish Zloty) and the other with the EUR and RUB. The third cluster is composed of the BRL, ZAR (SouthAfrican Rand) and TL, which are related with each other when we choose the USD as the numeraire. One explanation isthat these are currencies belonging to developing countries. In Fig. 2(b), one can see that the overall structure observed inthis figure is consistent with Fig. 1(b), but the following relevant changes are detected: (i) there are three sub-groups inthe Europe cluster in Fig. 2(b), in contrast to Fig. 1(b). These sub-groups are the CZK and PLN, the EUR and SKK (SlovakianKoruna), and the NOK and SEK (Swedish Krona). (ii) The Asia cluster is made up of the PHP and INR. (iii) South America isan inhomogeneous cluster which consists of the BRL, MXN (Mexican Peso), ZAR and TL. Also in this cluster we can see twosub-groups which are the BRL and MXN, and the ZAR and TL. Similarly, from Fig. 3(b), we can see that the overall structureobserved in this figure is consistent with Fig. 2(b), but the following relevant changes are detected. (i) The ZAR and TL leavethe South American cluster and form anew independent cluster. (ii) The BRL andMXN staywith each other and form anotherindependent cluster. (iii) The KRW (South Korean Won) and TWD (Taiwan Dollar) form a new cluster. Finally, the obtainedbootstrap values of the links between the currencies consistent with these clusters are seen in Figs. 1(b), 2(b) and 3(b).
TheMSTs shown in Figs. 4(a), 5(a) and 6(a) were obtained for the TL based on the distance-metricmatrix for the full yearsof 2007, 2008 and for the 2007–2008period, respectively. The TL basedMSTs, Figs. 4(a), 5(a) and6(a), illustrate less clusteringthan when using the USD as numeraire, when comparing these figures with Figs. 1(a), 2(a) and 3(a). In analyzing Fig. 4(a),

726 M. Keskin et al. / Physica A 390 (2011) 719–730
Fig. 5. (a) Same as Fig. 4(a), but for the year 2008. (b) Same as Fig. 4(b), but for the year 2008.
we can see that the USD and EUR are the predominantworld currencies andwe can see also that the two strongest economicclusters are the international cluster with the USD at its center and the Europe cluster with the EUR at its center. A similarfinding was also obtained in Refs. [1,2,38]. These clusters which we studied appear to be organized principally according toa geographical criterion and economic relations. International grouping forms a set of currencies that are highly correlatedwith each other. There are also four pairs of currencies, namely the SAR and KWD, the USD and CNY, the AUD and NZD, andthe EUR and CHF, in which the bootstrap values of the links between these currencies are very high, as seen in Fig. 4(a), 6(a);hence these currencies are very close to each other. Moreover, the bootstrap values of the links between the pairs of the SARand KWD, the USD and CNY, the AUD and NZD and the EUR and SKK are also high, as seen in Fig. 5(a). The Europe clusterconsists of European countries along with the BRL, ZAR, AUD and NZD. Within this cluster the bootstrap values of the linksbetween some currencies are very high. For instance, the bootstrap values of the links between the EUR and CHF, and EURand CZK are equal to 1.00 or the bootstrap values of the links between the EUR and SEK, and the EUR and NOK are equal to0.96 and 0.98, respectively. These high bootstrap values of the links show that there are strong correlations between thesecurrencies. In addition, the Europe cluster is linked to the international cluster via the RUB as seen in Fig. 4(a). In Fig. 5(a),we observed similar clusters to those seen in Fig. 4(a), except that Asian currencies are not in the international cluster andthese currencies do not form a cluster due to the bootstrap analysis. While Fig. 6(a) has the same characteristics as Fig. 5(a),it has the following differences. (i) The INR, KRW, PHP and TWD are not inside the Asian countries and they are connectedto the international cluster with the USD at its center. (ii) The bootstrap values of the links between JPY and USD, PHP andTWD, and MXN and ARS are 0.18, 0.12 and 0.12 respectively; hence these links are a statistical fluctuation. Therefore, the

M. Keskin et al. / Physica A 390 (2011) 719–730 727
Fig. 6. (a) Same as Fig. 4(a), but for the years 2007–2008. (b) Same as Fig. 4(b), but for the years 2007–2008.
JPY, PHP, MXN and BRL do not belong to the international cluster. A similar situation is also seen in the Europe cluster forthe CAD (Canadian Dollar), NZD and AUD. Moreover, we also obtained the average bootstrap value of the links between thecurrencies and found 0.6678, 0.5503 and 0.5815 for the 2007, 2008 and 2007–2008 periods, respectively. We should alsomention that the average bootstrap value for 2007 is larger than for 2008 and for the 2007–2008 period. This fact showedthat when we used the TL as numeraire, the most stable tree is obtained for the full year of 2007. From the results of theTL as numeraire, we can conclude that either currencies are all linked by common economic factors or currency traders paymore attention to the USD and EUR movements than to local factors. Similar results were also found in Ref. [3].
TheHTs of the subdominant ultrametric space associatedwith theMSTs are shown in figs. 4(b), 5(b) and 6(b). In Figs. 4(b),5(b) and 6(b), one can see that the distance between the USD and CNY is the smallest of the sample, indicating a strongrelationship between these two currencies which form the first cluster. This fact is also seen in Figs. 4(a), 5(a) and 6(a),namely the bootstrap values are equal to 1.00 in Fig. 4(a), 6(a) and 0.98 in Fig. 5(a). We also see two other clusters, namelythe clusters between the SAR and KWD, and the AUD and NZD, in Figs. 4(b), 5(b) and 6(b). On the other hand, the EUR andCHF form a cluster with each other in Figs. 4(b) and 6(b), but in Fig. 5(b), the EUR forms a cluster with SKK. These clustersseen in Figs. 4(b), 5(b) and 6(b) are consistent with similar clusters seen in Figs. 4(a), 5(a) and 6(a). This fact is also observedfrom bootstrap values of the links between these currency pairs.
728 M. Keskin et al. / Physica A 390 (2011) 719–730
a
b
c
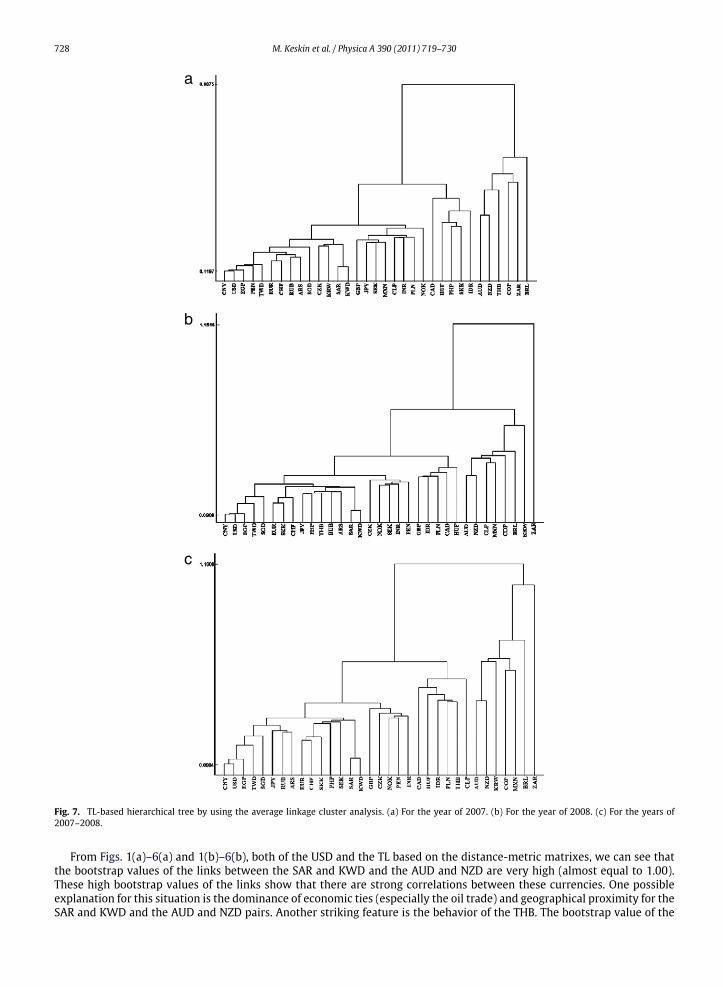
Fig. 7. TL-based hierarchical tree by using the average linkage cluster analysis. (a) For the year of 2007. (b) For the year of 2008. (c) For the years of2007–2008.
From Figs. 1(a)–6(a) and 1(b)–6(b), both of the USD and the TL based on the distance-metric matrixes, we can see thatthe bootstrap values of the links between the SAR and KWD and the AUD and NZD are very high (almost equal to 1.00).These high bootstrap values of the links show that there are strong correlations between these currencies. One possibleexplanation for this situation is the dominance of economic ties (especially the oil trade) and geographical proximity for theSAR and KWD and the AUD and NZD pairs. Another striking feature is the behavior of the THB. The bootstrap value of the

M. Keskin et al. / Physica A 390 (2011) 719–730 729
link between the THB and other currencies is small in all MSTs. This fact shows that the THB does not belong to any clusterin the MSTs. Unfortunately the cluster structure is not observed clearly in these figures.
In order to observe the cluster structure much better we used the average linkage cluster analysis in the HTs for the caseof the TL as the numeraire, seen in Fig. 7. Fig. 7(a)–(c) are obtained for the full years of 2007, 2008 and for the 2007–2008period, respectively. From these figures, we observe four clusters. The first strong cluster is the cluster where the USD andEUR are at its center. The JPY heads the second cluster that consists of the SEK, MXN, GBP, CLP (Chilean Peso), INR, PLN andNOK. The third cluster consists of the PHP, SKK, HUF, IDR and CAD with the SKK at its center. Finally, the AUD heads thefourth cluster that includes the NZD, THB, COP, ZAR and BRL. Moreover, the correlation between the USD and CNY is thestrongest and the second strong relationship is between the SAR and KWD. From these results and as well as Figs. 4(b), 5(b)and 6(b), we can conclude that if the minor currency (TL) is used as the numeraire, the effect of the global financial crisisis not as obvious. Therefore, in order to see the effect of the global financial crisis one should take the major currency aschoosing the ‘‘right’’ numeraire.
In conclusion, in this study, we presented the topology of correlation networks among 34 major currencies using theconcept of the MST and the HT for the full years of 2007, 2008 and for the 2007–2008 period when major economicturbulence occurred. The clustered structure of the currencies and the key currency in each cluster were obtained, andwe found that the clusters matched nicely with geographical regions of corresponding countries in the world such as Asiaor Europe. We performed a technique to associate a value of reliability to the links of MSTs and HTs by using bootstrapreplicas of data to obtain information about the reliability of each link of graphs. From the results of the bootstrap analysis,we can see that, in general, the bootstrap values in MSTs and HTs are highly consistent with each other. We also obtainedthe average bootstrap values of the links between the currencies and found 0.6225, 0.5925 and 0.6012 for the USD as thenumeraire, and 0.6678, 0.5503 and 0.5815 for the TL as the numeraire for the full years of 2007, 2008 and for the 2007–2008period, respectively. In both cases, we can see that the average bootstrap value for 2007 is larger than for 2008 and for the2007–2008 period; hence themost stable tree is obtained for the full year of 2007, that is the year before the global financialcrisis. Moreover, one can conclude from these facts that the TL based trees were more affected than the USD based treesby the global financial crisis. As expected, our results confirm that the USD and EUR are the predominant world currenciesand that they are also both linked to other currencies according to their geographic location and related factors such aseconomic ties. Our results also show that the global financial crisis had an overwhelming effect on exchange rate liaisonsand commercial relations. These results imply that currencies are either all linked by common economic factors or currencytraders pay more attention to the USD and EUR movements than to local factors. Moreover, the results of our analysisdemonstrate that economic dependency can be clarified using the theory of correlation networks; hence, we expect thatcorrelation networks will be helpful in future monetary system studies. We also used the average linkage cluster analysisfor obtaining the hierarchical trees in the case of the TL as the numeraire to observe the cluster structuremuch better. Finally,we should also mention that the detected hierarchical structures might be useful in theoretical descriptions of currenciesand in the search for economic factors affecting specific groups of countries.
Acknowledgements
One of us (MK) would like to thank M. Takayasu and H. Takayasu for many useful discussions and critical readingsof the manuscript as well as for their hospitality in the Department of Computational Intelligence and Systems Science,Tokyo Institute of Technology during his short visit. This work was supported by the Scientific and Technological ResearchCouncil of Turkey (TÜBİTAK) Grant No: 109T133. One of us (BD) would like to express his gratitude to TÜBİTAK for his Ph.D.scholarship. BD is also grateful to R.N. Mantegna and F. Lillo for very helpful discussions about the bootstrap technique andthe average linkage cluster analysis.
References
[1] M. McDonald, O. Suleman, S. Williams, S. Howison, N. Johnson, Phys. Rev. E 72 (2005) 046106.[2] T. Mizuno, H. Takayasu, M. Takayasu, Physica A 364 (2006) 336.[3] M.J. Naylor, L.C. Rose, B.J. Moyle, Physica A 382 (2007).[4] Exchange Rate Service. http://pacific.commerce.ubc.ca/xr/.[5] M. Tumminello, F. Lillo, R.N. Mantegna, J. Econ. Behav. Organ. 75 (2010) 40–58.[6] M. Tumminello, C. Coronnello, F. Lillo, S. Micciche, R.N. Mantegna, Int. J. Bifur. Chaos 17 (7) (2007) 2319–2329.[7] R.N. Mantegna, Eur. Phys. J. B 11 (1999) 193–197.[8] R.N. Mantegna, H.E. Stanley, An Introduction to Econophysics-Correlation and Complexity in Finance, Cambridge University Press, Cambridge, 2000.[9] G.J. Ortega, D. Matesanz, Internat. J. Modern Phys. 17 (2006) 333.
[10] J.G. Brida, D.M. Gómez, W.A. Risso, Expert Syst. Appl. 36 (2009) 7721.[11] G. Bonanno, G. Caldarelli, F. Lillo, S. Micciche, N. Vandewalle, R.N. Mantegna, Eur. Phys. J. B 38 (2004) 363.[12] G. Bonanno, F. Lillo, R.N. Mantegna, Quant. Finance 1 (2001) 96.[13] N. Vandewalle, F. Brisbois, X. Tordoir, Quant. Finance 1 (2001) 372.[14] G. Bonanno, G. Caldarelli, F. Lillo, R.N. Mantegna, Phys. Rev. E 68 (2003) 46130.[15] J.G. Brida, W.A. Risso, Comput. Econ. 35 (2010) 85.[16] C. Eom, G. Oh, S. Kim, J. Korean Phys. Soc. 51 (2007) 1432.[17] J.G. Brida, W.A. Risso, Internat. J. Modern Phys. 18 (2007) 1783.[18] J.G. Brida, W.A. Risso, Econom. Bull. 29 (2009) 2420.[19] A. Garas, P. Argyrakis, Physica A 380 399 (2007).
730 M. Keskin et al. / Physica A 390 (2011) 719–730
[20] M. Keskin, B. Deviren, E. Kantar, Quant. Finance (submitted for publication).[21] G. Bonanno, N. Vandewalle, R.N. Mantegna, Phys. Rev. E 62 (2000) R7615.[22] R. Coelho, C.G. Gilmore, B.M. Lucey, P. Richmond, S. Hutzler, Physica A 376 (2007) 455.[23] C.G. Gilmore, B.M. Lucey, M. Boscia, Physica A 387 (2008) 6319.[24] P. Sieczka, J.A. Hołyst, Physica A 388 (2009) 1621.[25] J.-P. Onnela, A. Chakraborti, K. Kaski, J. Kertesz, Eur. Phys. J. B 30 (2002) 285.[26] J.-P. Onnela, A. Chakraborti, K. Kaski, J. Kertesz, Physica A 324 (2003) 247.[27] J.-P. Onnela, A. Chakraborti, K. Kaski, J. Kertesz, A. Kanto, Phys. Scripta T 106 (2003) 48.[28] J.P. Onnela, A. Chakraborti, K. Kaski, J. Kertesz, A. Kanto, Phys. Rev. E 68 (2003) 056110.[29] S. Micciche, G. Bonanno, F. Lillo, R.N. Mantegna, Physica A 324 (2003) 66.[30] R. Coelho, S. Hutzler, P. Repetowicz, P. Richmond, Physica A 373 (2007) 615.[31] D.D. West, Introduction to Graph Theory, Prentice-Hall, Englewood Cliffs, NJ, 1996.[32] J.B. Kruskal Jr, Proc. Amer. Math. Soc. 7 (1956) 48.[33] T.H. Cormen, C.E. Leiserson, R.L. Rivest, Introduction to Algorithms, MIT Press, Cambiridge, MA, 1990.[34] J.P. Onnela, M. Sc, Thesis, Department of Electrical and Communications Engineering, Helsinki University of Technology, 2002.[35] R. Rammal, G. Toulouse, M.A. Virasoro, Rev. Modern Phys. 58 (1986) 765–788.[36] J.P. Benzecri, L’analyse Des Donnees 1, La Taxinomie, Dunod, Paris, 1984.[37] H. Situngkir, nlin.PS/0405005.[38] A.Z. Górski, S. Drożdż, J. Kwapień, P. Oświęcimka, Acta Phys. Pol. B 40 (2009) 175.