topic: number lo: revision - histograms. prepare for learning agree learning objectives starter...
TRANSCRIPT

Topic: Number
LO: Revision - Histograms.
PREPARE FOR LEARNING
AGREE LEARNING OBJECTIVES
Starter
Imagine you wanted to draw aBar Chart to show the followinginformation;
Height (cm) Frequency
100 < x ≤ 120 20
120 < x ≤ 140 25
140 < x ≤ 150 30
150 < x ≤ 160 25
160 < x ≤ 200 20

HISTOGRAMS

Starter
Height (cm) Frequency
100 < x ≤ 120
20
120 < x ≤ 140
25
140 < x ≤ 150
30
150 < x ≤ 160
25
160 < x ≤ 200
20
Height (cm)
Fre
quen
cy
0
5
20
15
10
100
25
120 180160140 200
REVIEW

Starter• Problems
1) The data is continuous so there should be no gaps
2) 150 – 160 has the same height as 120 – 140, even though it represents a smaller range
A Histogram will correct both of these problems!
Height (cm)
Fre
quen
cy
0
5
20
15
10
100
25
120 180160140 200
PRESENT NEW INFO

Histograms
20
25
30
25
20
Frequency
0.5160 < x ≤
200
2.5150 < x ≤
160
3140 < x ≤
150
1.25120 < x ≤
140
1100 < x ≤
120
Frequency Density
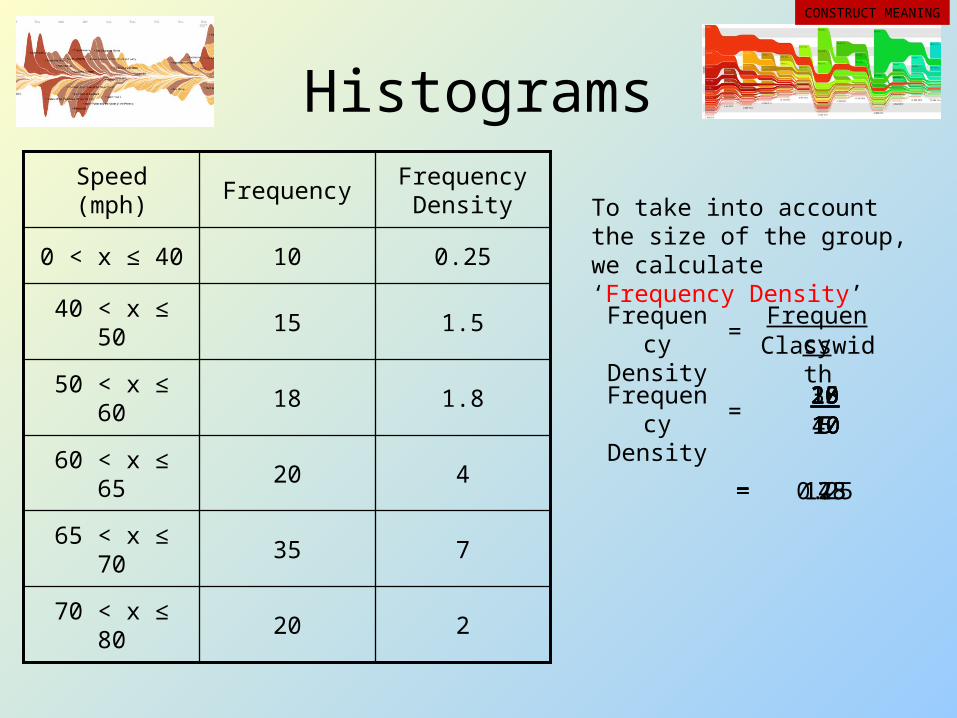
Height (cm) To take into account the size of the group, we calculate ‘Frequency Density’Frequency Density
FrequencyClasswidth
=
Frequency Density
2020
=
1=
3010
3=
2520
1.25=
2040
0.5=
2510
2.5=
CONSTRUCT MEANING

HistogramsHeight (cm) Frequency Frequency
Density
100 < x ≤ 120 20 1
120 < x ≤ 140 25 1.25
140 < x ≤ 150 30 3
150 < x ≤ 160 25 2.5
160 < x ≤ 200 20 0.5
100 140130120 150 160 180170110 200190
1
2
3
0
Fre
quen
cy D
ensi
ty
Height (cm)
CONSTRUCT MEANING

Histograms
With a Histogram, area represents Frequency, not the height
100 140130120 150 160 180170110 200190
1
2
3
0
Frequency
D
ensi
ty
Height (cm)
eg) The first group is a rectangle measuring 20 by 120 x 1 = 20 so there were 20 people in the group
eg) The fifth group is a rectangle measuring 40 by 0.540 x 0.5 = 20 so there were 20 people in the group
CONSTRUCT MEANING
Histograms
To take into account the size of the group, we calculate ‘Frequency Density’Frequency Density
FrequencyClasswidth
=
Frequency Density =
1040
0.25=
22070 < x ≤ 80
73565 < x ≤ 70
42060 < x ≤ 65
1.81850 < x ≤ 60
1.51540 < x ≤ 50
0.25100 < x ≤ 40
Frequency Density
FrequencySpeed (mph)
1810
1.8=
355
7=
205
4=
1510
1.5=
2010
2=
CONSTRUCT MEANING

HistogramsSpeed (mph) Frequency Frequency
Density
0 < x ≤ 40 10 0.25
40 < x ≤ 50 15 1.5
50 < x ≤ 60 18 1.8
60 < x ≤ 65 20 4
65 < x ≤ 70 35 7
70 < x ≤ 80 20 2
0 8040302010 6050 70
10
2
8
6
4
0
Fre
quen
cy D
ensi
ty
Speed (mph)
CONSTRUCT MEANING

Histograms
0 8040302010 6050 70
10
2
8
6
4
0
Frequency
Densi
ty
Speed (mph)
Group 1 is a 40 by 0.25 rectangle
40 x 0.25 = 10
So 10 people in the group
Remember that Area represents Frequency!Group 5 is a 5 by 7 rectangle
5 x 7 = 35
So 35 people in the group
CONSTRUCT MEANING
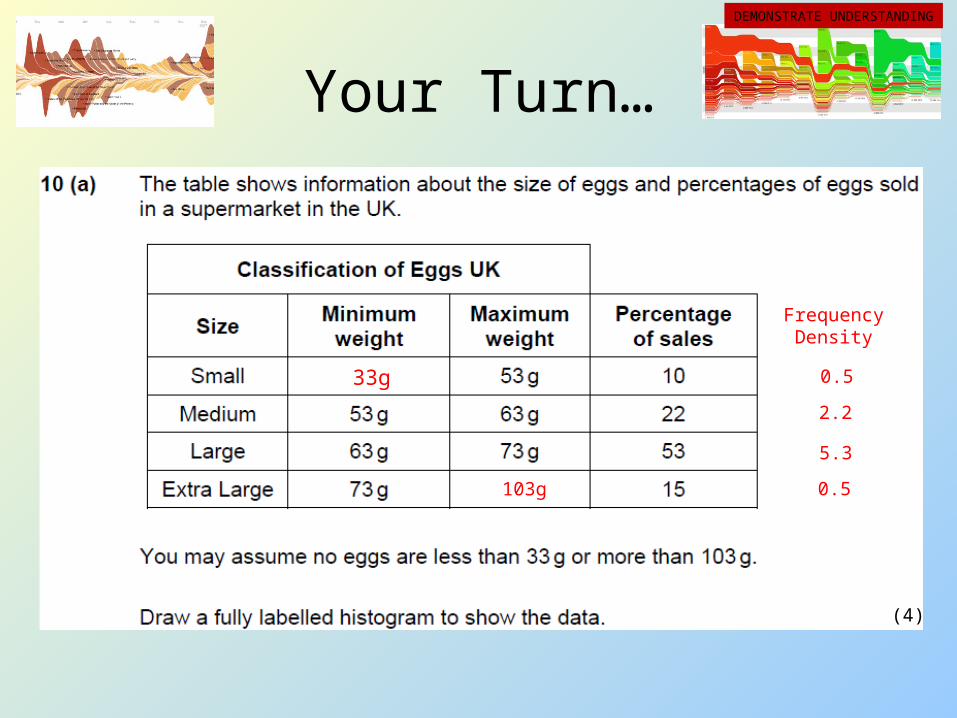
Your Turn…
(4)
33g
103g
Frequency Density
0.5
2.2
5.3
0.5
DEMONSTRATE UNDERSTANDING

Your Turn…
DEMONSTRATE UNDERSTANDING
EXTENSION: MORE HISTOGRAM QUESTIONS

Plenary
1
Frequency
Densi
ty
6
5
4
3
2
Egg Weight (g)
REVIEW
Summary• We have learnt how to plot Histograms of
sets of data
• We have seen how they are different to Bar Charts
• We have learnt what is meant by ‘Frequency Density’
• We have shown that on a Histogram, area represents Frequency, not height!
REVIEW