topic #8 - employment/career focus key evidence: provided by offices of institutional research and...
TRANSCRIPT

Topic #8 - EMPLOYMENT/CAREER
FOCUSKey Evidence:
Provided by
Offices of Institutional Research and
Outcomes AssessmentFriday, April 16, 2010

Student Engagement DataCommunity College Survey of Student
Engagement (CCSSE)relevant to Careers/Employment

In your experiences at this college during the current school year, about how often have you done each of the following? (1=Never, 2=Sometimes, 3=Often, 4=Very often)
Statement AC Mean Large Colleges
Mean
Talked about career plans with an instructor or advisor 2.11[N=752]
1.99[N=90,494]
3
How much has your experience at this college contributed to your knowledge, skills, and personal development in the following areas? (1=Very little, 2=Some, 3=Quite a bit, 4=Very much )
Statement AC Mean Large Colleges
Mean
Acquiring job or work-related knowledge and skills
*Indicates statistical significance
2.79[N=753]
2.49*[N=89,471]

Indicate HOW OFTEN you use the following services? (Responses 0-N/A, 1-Not at all, 2-Somewhat, 3-Very)
Statement Amarillo College Mean Large Colleges Mean
Career Counseling 1.53 (N=666) 1.43 (N=71,253)
Job Placement Assistance 1.19 (N=475) 1.23 (N=52,467)
Indicate HOW SATISFIED you are with the following services? (Responses 0-N/A, 1-Not at all, 2-Somewhat, 3-Very)Career Counseling 2.26 (N=508) 2.04 (N=51,036)
Job Placement Assistance 1.95 (N=285) 1.80 (N=31, 524)
Indicate HOW SATISFIED you are with the following services? (Responses 0-N/A, 1-Not at all, 2-Somewhat, 3-Very)
Career Counseling 2.41 (N=735) 2.30(N=84,910)
Job Placement Assistance 2.07 (N=726) 2.03 (N=83,762

Employment Data
Perkins Indicators regarding Employment:
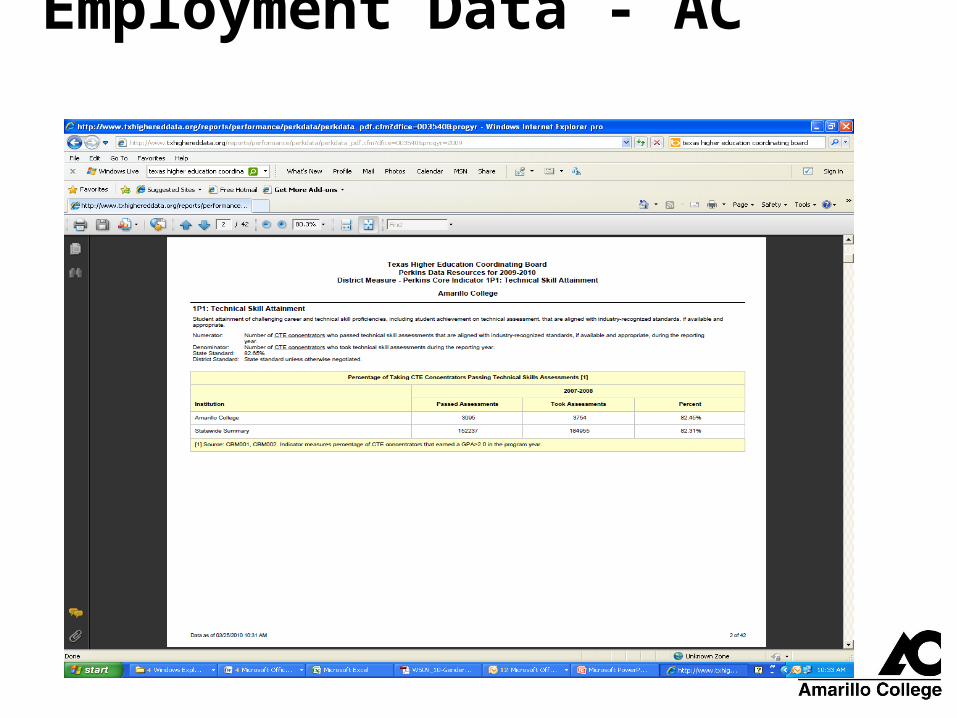
Perkins Core Indicator 1P1: Technical Skill Attainment
Student attainment of challenging career and technical skill proficiencies, including student achievement on technical assessment, that are aligned with industry-recognized standards, if available and
appropriate.
Numerator: Number of CTE concentrators who passed technical skill assessments that are aligned with industry-recognized standards, if available and appropriate, during the reporting
year.
Denominator: Number of CTE concentrators who took technical skill assessments during the reporting year.
State Standard: 82.65%
District Standard: State standard unless otherwise negotiated.Source: THECB Perkins Data (Note: Only employment data available is for CTE programs.)

Employment Data
Perkins Indicators regarding Employment:
Perkins Core Indicator 4P1: Student Placement
Student placement in military service or apprenticeship programs or placement or retention in employment, including placement in high skill, high wage or high demand occupations or professions.
Numerator: Number of CTE concentrators who were placed or retained in employment, or placed in military service or apprenticeship programs in the 2nd quarter following the program year in which
they left postsecondary education (i.e., unduplicated placement status for CTE concentrators who graduated by June 30, 2007 would be assessed between October 1, 2007 and December 31, 2007).
Denominator: Number of CTE concentrators who left postsecondary education during the reporting year.
State Standard: 73.80%
District Standard: State standard unless otherwise negotiated.
Source: THECB Perkins Data (Note: Only employment data available is for CTE programs.)

Employment Data – AC Percent of Graduates from Preceding Fiscal Year
Who Were Employed or Enrolled inFour-year Institution the Following Fall
In-State Peers
FY 2008 90.2% 85.4%
Employed 59.5% 48.1%
Enrolled 7.4% 9.8%
Both Empl. 23.3% 27.5%
& Enrolled Source: THECB Online Resume for Prospective Students, Parents and Public
Employment Data - AC

Employment Data - AC
Employment Data by Discipline
Source: THECB Perkins Data (Note: Only employment data available is for CTE programs.)
Summary of Tables in Following Slides:• Titles are by Division and Department• 3 years of trend line employment • Employed = # of graduates/completers of the program that are
employed in the field• Completers = # of graduates/completers with opportunity for
employment in the field• % = Percentage of graduates/completers employed in the field
data
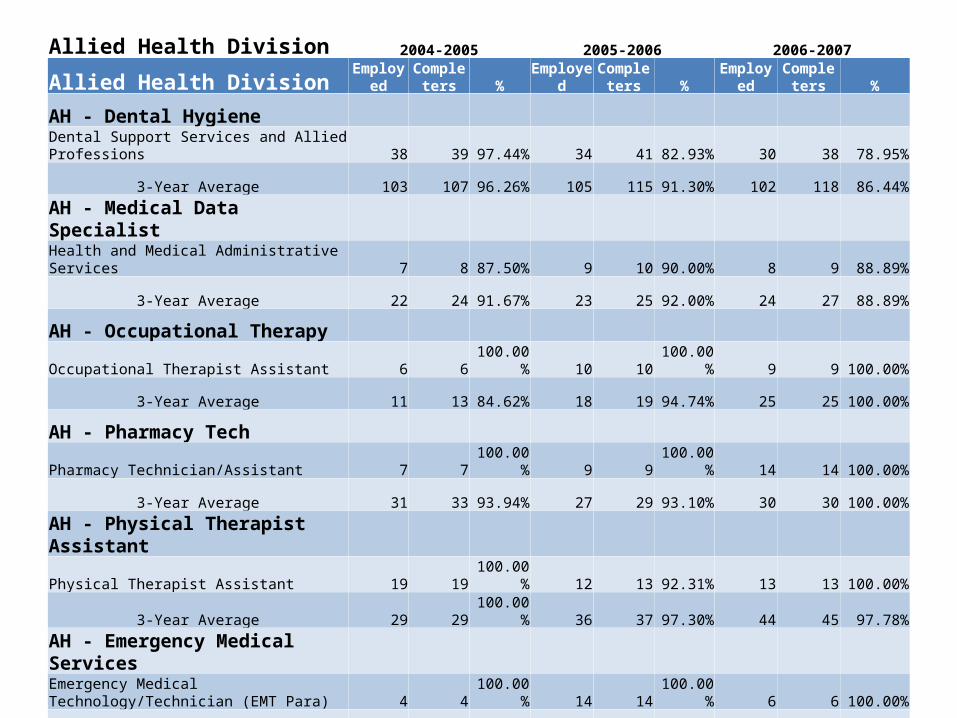
Allied Health Division 2004-2005 2005-2006 2006-2007
Allied Health DivisionEmploye
dComplete
rs % EmployedComplete
rs % EmployedComplete
rs %
AH - Dental Hygiene
Dental Support Services and Allied Professions 38 39 97.44% 34 41 82.93% 30 38 78.95%
3-Year Average 103 107 96.26% 105 115 91.30% 102 118 86.44%
AH - Medical Data Specialist
Health and Medical Administrative Services 7 8 87.50% 9 10 90.00% 8 9 88.89%
3-Year Average 22 24 91.67% 23 25 92.00% 24 27 88.89%
AH - Occupational Therapy
Occupational Therapist Assistant 6 6 100.00% 10 10 100.00% 9 9 100.00%
3-Year Average 11 13 84.62% 18 19 94.74% 25 25 100.00%
AH - Pharmacy Tech
Pharmacy Technician/Assistant 7 7 100.00% 9 9 100.00% 14 14 100.00%
3-Year Average 31 33 93.94% 27 29 93.10% 30 30 100.00%
AH - Physical Therapist Assistant
Physical Therapist Assistant 19 19 100.00% 12 13 92.31% 13 13 100.00%
3-Year Average 29 29 100.00% 36 37 97.30% 44 45 97.78%
AH - Emergency Medical ServicesEmergency Medical Technology/Technician (EMT Para) 4 4 100.00% 14 14 100.00% 6 6 100.00%
3-Year Average 25 26 96.15% 29 30 96.67% 24 24 100.00%

Allied Health Division 2004-2005 2005-2006 2006-2007
Allied Health Division Employed Completers % EmployedCompleter
s %Employ
edCompleter
s %AH - Nuclear Medicine TechnologyNuclear Medical Technology/Technologist 16 16 100.00% 16 16
100.00% 15 15
100.00%
3-Year Average 40 40 100.00% 45 45100.00
% 47 47100.00
%
AH - Radiation Therapy TechMedical Radiologic Tech/Science - Radiation Ther 7 11 63.64% 4 7 57.14% 10 10
100.00%
3-Year Average 20 27 74.07% 16 25 64.00% 21 28 75.00%
AH - Respiratory Care
Respiratory Care Therapy 12 13 92.31% 15 15100.00
% 9 9100.00
%
3-Year Average 24 25 96.00% 37 38 97.37% 36 37 97.30%
AH - Surgical TechnologySurgical Technology/Technologist 11 11 100.00% 18 18
100.00% 23 23
100.00%
3-Year Average 45 46 97.83% 49 50 98.00% 52 52100.00
%
AH - Radiography TechnologyRadiologic Tech/Science - Radiographer 23 25 92.00% 19 22 86.36% 16 17 94.12%
3-Year Average 70 74 94.59% 68 73 93.15% 58 64 90.63%
AH - Medical Lab TechnologyClinical/Medical Laboratory Technician 5 5 100.00% 4 4
100.00% 9 10 90.00%
3-Year Average 20 20 100.00% 14 14100.00
% 18 19 94.74%

Behavioral Studies Division 2004-2005 2005-2006 2006-2007
Behavioral Studies DivisionEmploye
dComplet
ers %Employe
dComplet
ers %Employe
dComplet
ers %
BEHS - Child Development
Human Development, Family Studies, and Related Serv 7 7 100.00% 66 71 92.96% 7 7 100.00%
3-Year Average 46 48 95.83% 88 93 94.62% 80 85 94.12%
BEHS - Substance Abuse Counseling
Mental and Social Health Services and Allied Professions 2 3 66.67% 4 4 100.00% 6 7 85.71%
3-Year Average 7 9 77.78% 8 9 88.89% 12 14 85.71%

Business Division 2004-2005 2005-2006 2006-2007
Business DivisionEmploye
dComplet
ers %Employe
dComplet
ers %Employe
dComplet
ers %
BUS - Computer Information Systems
Computer Programming 16 18 88.89% 9 11 81.82% 7 7 100.00%
3-Year Average 61 67 91.04% 46 50 92.00% 32 36 88.89%
BUS - Computer Information Systems TDCJ
Data Processing 9 10 90.00% 3 4 75.00% 2 2 100.00%
3-Year Average 18 19 94.74% 18 20 90.00% 14 16 87.50%
BUS - Paralegal
Legal Support Services 10 11 90.91% 12 13 92.31% 15 18 83.33%
3-Year Average 37 38 97.37% 30 32 93.75% 37 42 88.10%
BUS - Business Admin, Management, Travel/Tourism
Business Administration, Management and Operations 16 17 94.12% 25 30 83.33% 24 26 92.31%
3-Year Average 65 68 95.59% 62 68 91.18% 65 73 89.04%
BUS - Accounting
Accounting and Related Services 4 4 100.00% 5 6 83.33% 5 5 100.00%
3-Year Average 19 21 90.48% 16 18 88.89% 14 15 93.33%
BUS - Office Administration
Business Operations Support and Assistant Services 11 11 100.00% 2 4 50.00% 15 17 88.24%
3-Year Average 30 33 90.91% 22 25 88.00% 28 32 87.50%
BUS - Real Estate
Real Estate 6 7 85.71% 7 9 77.78% 3 4 75.00%
3-Year Average 12 13 92.31% 16 19 84.21% 16 20 80.00%

Criminal Justice Division 2004-2005 2005-2006 2006-2007
Criminal Justice DivisionEmploy
edCompleters %
Employed
Completers %
Employed
Completers %
CJ - Criminal Justice
Criminal Justice & Corrections 0 0 1 1100.00
% 0 0
3-Year Average 1 1100.00
% 1 1100.00
% 1 1 100.00%
CJ - Criminal Justice
Criminal Justice/Police Science 83 84 98.81% 62 64 96.88% 63 67 94.03%
3-Year Average 160 162 98.77% 194 197 98.48% 208 215 96.74%

Industrial and Transportation Technology Division
2004-2005 2005-2006 2006-2007
Employed
Completers %
Employed
Completers %
Employed
Completers %
ITT - Environmental Health Technology
Quality Control and Safety Technologies/Technicians 3 3 100.00% 2 3 66.67% 2 3 66.67%
3-Year Average 10 10 100.00% 8 9 88.89% 7 9 77.78%
ITT - Industrial Maintenance Technology
Environmental Control Technologies/Technicians 0 0 0 0 4 4 100.00%
3-Year Average 0 0 0 0 4 4 100.00%
ITT - Fire Protection Technology
Fire Protection 0 0 2 2 100.00% 2 2 100.00%
3-Year Average 3 3 100.00% 3 3 100.00% 4 4 100.00%
ITT - Fire Protection Technology
Fire Science/Firefighting 2 2 100.00% 1 2 50.00% 21 21 100.00%
3-Year Average 3 3 100.00% 3 4 75.00% 24 25 96.00%
ITT - Auto Body Technology
Vehicle Maintenance and Repair Technologies 88 93 94.62% 55 65 84.62% 58 64 90.63%
3-Year Average 149 162 91.98% 187 208 89.90% 201 222 90.54%

Industrial and Transportation Technology Division 2004-2005 2005-2006 2006-2007
Employed
Completers % Employed
Completers % Employed Completers %
ITT - Auto Body Technology
Autobody/Collision and Repair Technology/Technician 12 14 85.71% 6 8 75.00% 10 10 100.00%
3-Year Average 27 30 90.00% 27 32 84.38% 28 32 87.50%
ITT - Automotive Technology
Automobile/Automotive Mechanics Technology/Tech 16 17 94.12% 8 12 66.67% 11 13 84.62%
3-Year Average 39 42 92.86% 35 40 87.50% 35 42 83.33%
ITT - Diesel Engine Mechanics
Diesel Mechanics Technology/Technician 9 33 27.27% 11 11 100.00% 13 18 72.22%
3-Year Average 24 49 48.98% 31 56 55.36% 33 62 53.23%
ITT - Machining Technology
Welding Technology/Welder 12 12100.00
% 5 10 50.00% 10 11 90.91%
3-Year Average 35 36 97.22% 30 36 83.33% 27 33 81.82%
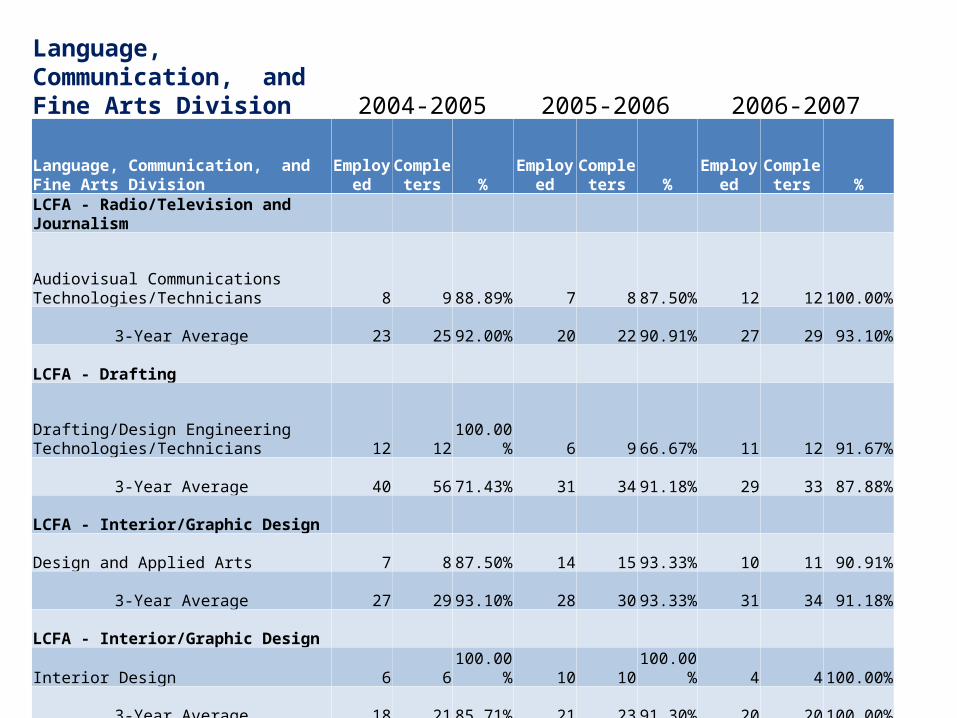
Language, Communication, and Fine Arts Division 2004-2005 2005-2006 2006-2007
Language, Communication, and Fine Arts Division
Employed
Completers %
Employed
Completers %
Employed
Completers %
LCFA - Radio/Television and Journalism
Audiovisual Communications Technologies/Technicians 8 9 88.89% 7 8 87.50% 12 12 100.00%
3-Year Average 23 25 92.00% 20 22 90.91% 27 29 93.10%
LCFA - Drafting
Drafting/Design Engineering Technologies/Technicians 12 12 100.00% 6 9 66.67% 11 12 91.67%
3-Year Average 40 56 71.43% 31 34 91.18% 29 33 87.88%
LCFA - Interior/Graphic Design
Design and Applied Arts 7 8 87.50% 14 15 93.33% 10 11 90.91%
3-Year Average 27 29 93.10% 28 30 93.33% 31 34 91.18%
LCFA - Interior/Graphic Design
Interior Design 6 6 100.00% 10 10 100.00% 4 4 100.00%
3-Year Average 18 21 85.71% 21 23 91.30% 20 20 100.00%
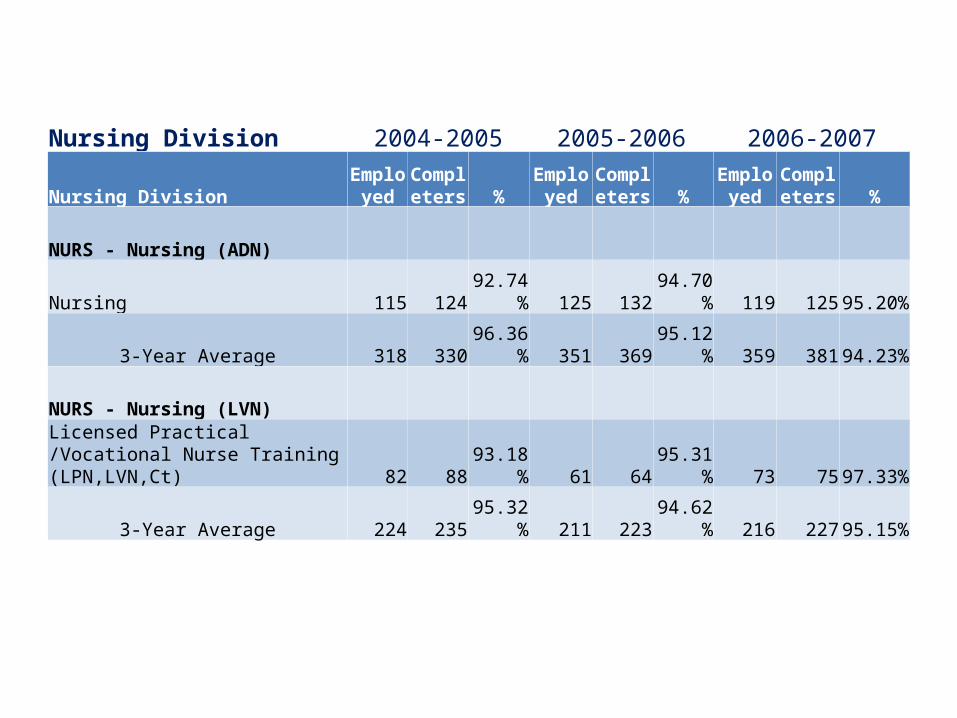
Nursing Division 2004-2005 2005-2006 2006-2007
Nursing DivisionEmploy
edCompleters %
Employed
Completers %
Employed
Completers %
NURS - Nursing (ADN)
Nursing 115 124 92.74% 125 132 94.70% 119 125 95.20%
3-Year Average 318 330 96.36% 351 369 95.12% 359 381 94.23%
NURS - Nursing (LVN)
Licensed Practical /Vocational Nurse Training (LPN,LVN,Ct) 82 88 93.18% 61 64 95.31% 73 75 97.33%
3-Year Average 224 235 95.32% 211 223 94.62% 216 227 95.15%

Science and Engineering Division 2004-2005 2005-2006 2006-2007
Science and Engineering DivisionEmploy
edComple
ters %Employ
edComple
ters %Employ
edComple
ters %
SE - Mortuary Science
Funeral Service and Mortuary Science 9 10 90.00% 29 30 96.67% 25 27 92.59%
3-Year Average 28 29 96.55% 47 49 95.92% 63 67 94.03%
SE - Electronic Systems Technology
Electrical and Electronic Engineering Technologies/Tech 25 28 89.29% 16 20 80.00% 9 10 90.00%
3-Year Average 64 72 88.89% 65 76 85.53% 50 58 86.21%
SE - Instrumentation Technology
Electromechanical and Instrumentation and Maint Tech 34 39 87.18% 22 28 78.57% 30 33 90.91%
3-Year Average 102 112 91.07% 87 99 87.88% 86 100 86.00%

Questions
Delton MooreDirector of Institutional [email protected]
Kara Larkan-SkinnerDirector of Outcomes [email protected]
Copyright 2009
Copyright Amarillo College 2009