topic 1 - global population density and...
TRANSCRIPT

TOPIC 1 - Global Population Density and Distribution
Test yourself on Topic 1. Do you know the following things off by heart? 1. The definitions of these key terms: population density densely populated sparsely populated population distribution
2. 3 factors that lead to a dense population 3. 3 factors that lead to a sparse population 4. The names of two densely populated areas of the world
and the reasons (with factual detail) about why it is densely populated there.
5. The names of two sparsely populated areas of the world and the reasons (with factual detail) about why it is sparsely populated there.

TOPIC 1 - Global Population Density and Distribution
You need to know these definitions: Population Density: How crowded or empty a place is (measured in people per square km) Population Distribution: The pattern of where people live. Densely Populated: A crowded area Sparsely Populated: An empty area

Factors that lead to a dense population (you need to know at least three of these).
Vegetation - Areas of open woodland and grassland are easy to settle in. e.g. The Pampas in Argentina.
Accessibility - Coastal areas with easy access to transport and trade
Economic - Good infrastructure such as roads, railways etc as well as a skilled and varied labour force
Climates - Moderate climates with enough rain and warm temperatures to allow crops to grow and ripen e.g. W. Europe & Japan.
Soil - Thick fertile soil that increase agricultural production such as S.E. England.
Resources - Plenty of water, timber, minerals such as coal, oil and copper enable countries to develop. e.g. Western Europe & Eastern America
Relief - Lowland areas which are flat are easier to farm and build settlements and transport links

Factors that lead to a sparse population (you need to know at least three of these). Climates - Very cold, very hot and too dry affect the growing season and make cultivation (growing food) impossible - also unpleasant to live in such areas. e.g. The Arctic, Sahara Desert, etc.
Relief - Mountainous areas are too steep to farm easily and are difficult to build on and get around easily.
Economic - Poor trading links and markets, poor infrastructure with few roads and services such as Central Africa, Amazon Basin and limited job opportunities for the inhabitants
Accessibility - Interior areas of large continents such as Africa and Asia struggle to develop
Vegetation - Very dense jungle and swamps make it difficult to penetrate and use productively. e.g. Amazon Rainforest.
Soil - Thin, rocky and acidic soils all cause low agricultural production such as hot deserts and mountainous areas.
Resources – Poverty that makes it difficult for a country to trade with other countries
.

1a. The Distribution of the Global Population
KEY TERMS: Population Density: How crowded or empty a place is (measured in people per square km) Population Distribution: The pattern of where people live. Densely Populated: A crowded area Sparsely Populated: An empty area
Factors densely populated areas: 1.Accessibility – coastal areas with good transport and trade links 2.Moderate climates – warm enough and enough rain to grow food 3.Resources – water, timber, minerals, coal etc allow a country to develop 4.Fertile soil 5.Infrastructure – roads, railways 6.Flat relief – lowland areas easy to build on
Examples of densely populated areas and reasons: ①SE England - Water supply and trading links via River Thames. Employment eg. finance sector at Canary Wharf. Transport links (Heathrow, Gatwick, City and Eurostar). ②Eastern China - Flat land close to sea level, trading links via the Yellow Sea and South China Sea. Water supply (Yellow and Yangtze Rivers). Record economic growth, focused on industrial growth in coastal cities (eg. Guangzhou). ③Northern India/Bangladesh – Water supply via Ganges River flowing from Himalayas, trading links via Bay of Bengal, colonial powers (ie. Britain) developed cities and rail links, spreading the population around the country, cities like Dhaka growing because of industry (eg. textiles), attracting works from rural areas).
TEST YOURSELF!!! Can you: Describe the distribution of the global population, including continent names and compass directions? ie. ‘The world population is unevenly distributed, densely populated areas include…. And sparsely populated areas include…’ Explain the reasons for the distribution of the world population? ‘ie. It is densely/sparsely populated in xxx because of… ‘ Name factors that make a place densely populated? Name factors that make a place sparsely populated? Define these key terms?
Population distribution Population density Sparsely populated Densely populated
Factors sparsely populated areas: 1.Inaccessible – eg. places in the centre of large continents far from trading links 2.Extreme climates – very cold/hot/dry/wet make life unpleasant and growing food difficult 3.Dense vegetation – eg. rainforest makes it difficult to build 4.Infertile soil 5.Steep relief – eg. mountains 6.Lack of water supply
Examples of sparsely populated areas and reasons: ①North Africa – The Sahara Desert (extreme climate, lack of water, infertile soil) ②The Amazon Rainforest/central northern South America – dense vegetation and inaccessible ③Northern Russia/Siberia – Extreme climate, coldest place on Earth limits food supply. ④Southwest China – The Himalayas = steep relief and extreme climate ⑤Mongolia – The Gobi Desert

TOPIC 2 – World Population Growth
Test yourself on Topic 2. Do you know the following things off by heart? 1. The meaning of these key terms:
1. Birth rate 2. Death rate 3. Natural change 4. Fertility rate
2. The size of the world population 3. How the world population has changed since 1800 and the
reasons why it changed 4. How the world population is predicted to change in the
future 5. What is meant by the term Peak Child

TOPIC 2 - World Population Growth
You need to know these definitions:
1. Birth rate - The number of births per 1000 people per year
2. Death rate – The number of deaths per 1000 people per year
3. Natural change – The difference between the birth rate or death rate
4. Fertility rate – The average number of children a woman has over her lifetime


7 billion = Total world
population (the
total number of
people living on
Earth)

Before 1800 the total world population was very low, it was under 1 billion.
Between 1800 and 1920 the world population increased slowly and doubled from 1 billion to 2 billion.
After 1950 the world’s population increased very rapidly from 2.5 billion to 7 billion today.
Over the next 90 years, the world population is predicted to increase at a slower rate and reach a total of 11 billion by 2100.
(Use this line when reading the numbers from the graph)
Level 5 – Describe using number facts how the world population has grown, and how it will change in the future.

Explain the population changes How much has the world population grown from 1800 to today? Answer: From 1 billion to 7 billion How much will the world population increase to by 2100? Answer: Up to 11 billion The world has hit Peak Child, what does this mean? The number of children that families are having has stabilised at 2 per couple. There will never be more than 2 billion children in the world. Why did the world population grow so much after 1800? Answer: The Industrial Revolution brought about improvements such as sanitation, health care and clean water which reduced death rates. Before 1800, for every 6 children born, 4 died. People are having fewer children, so why has the population continued to grow? Answer: Because people are living for longer. Why will the world population grow by 4 billion by 2100, even though the total number of children will never increase above 2 billion? Answer: Because people are living for longer (adding 1 billion more people) and also the generations who are currently children are bigger than the generations above them, meaning population increases as they get older (and fill in the gaps in the population pyramid up to 60).

TOPIC 3 – Demographic Transition Model (Changing
Birth and Death Rates)
Test yourself on topic 3. Do you know the following things off by heart?
Factors that affect birth rates (and whether up or down)
Factors that affect death rates (and whether up or down)
What happens in each stage of the Demographic Transition Model
Reasons why birth and death rates change in each stage of the Demographic Transition Model
Examples of countries in each stage of the model

Factors that affect birth and death rates
TEST YOURSELF!!! Can you: Define the following key terms:
Birth rate Death rate Fertility rate Natural increase
Name 5 factors that increase birth rates? Name 5 factors that reduce birth rates? Name 5 factors that increase birth rates? Name 5 factors that reduce birth rates?
Hint – make sure you can explain these factors in more depth (think about a 2 or 4 mark question). eg. Lack of pensions or care for the elderly increases birth rates because families have more children to ensure that there are plenty of offspring who can look after them in their old age.
FACTORS CAUSING HIGH BIRTH RATES ① High infant mortality rates ② Lack of contraception ③ Poor health care for children and
pregnant mothers ④ Lack of education for women ⑤ Lack of rights for women ⑥ Early ages of marriage ⑦ Societies in which large families are
traditional, or religious custom ⑧ Children have to work to support
their parents ⑨ Lack of pensions or care for the
elderly ⑩ Political policies to encourage
people to have more children
FACTORS CAUSING LOWER BIRTH RATES ① Immunisations for children ② Good quality healthcare for
children and pregnant mothers ③ Education for girls ④ Rights for women ⑤ Availability of free contraception ⑥ Later age of marriage ⑦ Women have careers ⑧ High costs of bringing up a child
(childcare and university) ⑨ Political policies to reduce how
many children someone can have
FACTORS CAUSING HIGH DEATH RATES ① High infant mortality ② Poor quality healthcare ③ Lack of clean water or
sewage systems ④ HIV and AIDS ⑤ Lack of contraception ⑥ Poverty and unemployment ⑦ Poor nutrition and diet
FACTORS CAUSING LOWER DEATH RATES ① Childhood immunisation
programmes ② Free healthcare ③ Clean water and sewage
system ④ Healthy diet ⑤ Wealth ⑥ Access to contraception ⑦ Public health campaigns (eg.
cancer screening, awareness campaigns about sexually transmitted diseases)
KEY TERMS: Birth rate: The number of births per year per 1000 people Death rate: The number of deaths per year per 1000 people. Fertility rate: The number of births per woman over her whole life time. Natural increase: The difference between birth and death rates.

You should be able to explain: Why does children having to work to support their family increase the birth rate?
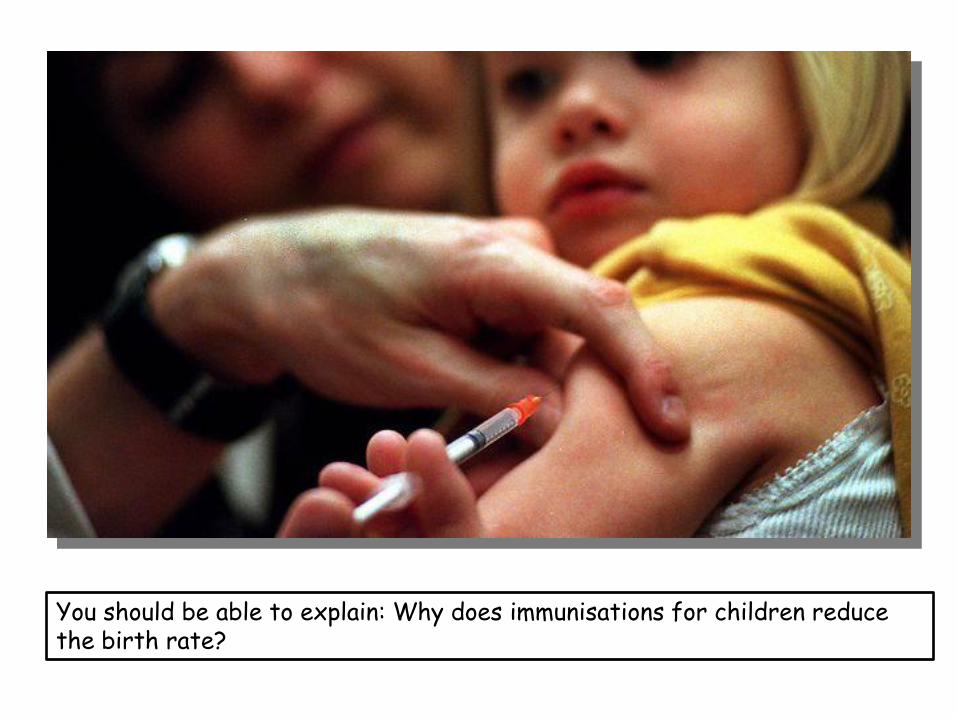
You should be able to explain: Why does immunisations for children reduce the birth rate?

You should be able to explain: Why does a lack of pensions and care for the elderly increase the birth rate?

You should be able to explain: Why does educating women and increasing their rights reduce the birth rate?

Factors that affect birth and death rates – The Demographic Transition Model (DTM)
STAGE 1: (High stationary) Total population low but balanced due to high birth rates and death rates. WHY? Lack of contraception; lack of clean water/sewerage; lack of immunisations; a poor diet. eg. Amazonian Tribes
STAGE 2: (Early expanding) Total population increases as death rates fall due to improvements in health care and sanitation. Birth rates remain high. eg. Uganda
STAGE 3: (Late expanding) Total population is still rising quickly. The difference between birth and death rates reduces due to the availability of contraception and fewer children being needed to work - due to the tractors being introduced on farms. The natural increase is high. eg. India
STAGE 4: (Low stationary) Total population is high but it is balanced by a low birth rate and a low death rate. Birth control is widely available and there is a desire for smaller families. eg. USA/UK
STAGE 5: (Decline?) Total population is high but going into decline due to an ageing population. There is a continued desire for smaller families, with people opting to have children later in life.
The demographic transition model shows population change over time and/or economic development. It studies how birth rate and death rate affect the total population of a country. As a country passes through the demographic transition model, the total population rises. Most LICs are at stage 2 or 3 (with a growing population and a high natural increase). Most HICs are now at stage 4 of the model and some such as Japan have entered stage 5.
TEST YOURSELF!!! Can you answer these questions: How many stages are
there in the DTM? The DTM has three
different lines on the graph. What do they show?
Name an example in each stage of the DTM.
What happens to the death rate and total population in Stage 2?
What begins to happen to the birth rate in Stage 3? Why?
What does the model say population is like in Stage 4? Why?
What begins to happen to the total population size in Stage 5? Why?

TOPIC 4 – Reading Population Pyramids
By the end of your revision of topic 4 you should know the following things off by heart: 1. The definition of the following key terms:
Population structure Elderly dependents Working age population Young dependents
2. How to read a population pyramid 3. The name of a country with a youthful population (and what its
population pyramid looks like) 4. The name of a country with an ageing population (and what its
population pyramid looks like) 5. Some of the problems that you get in countries with an ageing
population, and some of the problems that you get in countries with a youthful population.
6. (Higher) The shape of the population pyramid at each stage of the Demographic Transition Model.

This is a population pyramid. It shows the population structure for the United Kingdom. What do you think we mean by ‘population structure’?

Population structure = how the population is divided up between males and females of different age groups
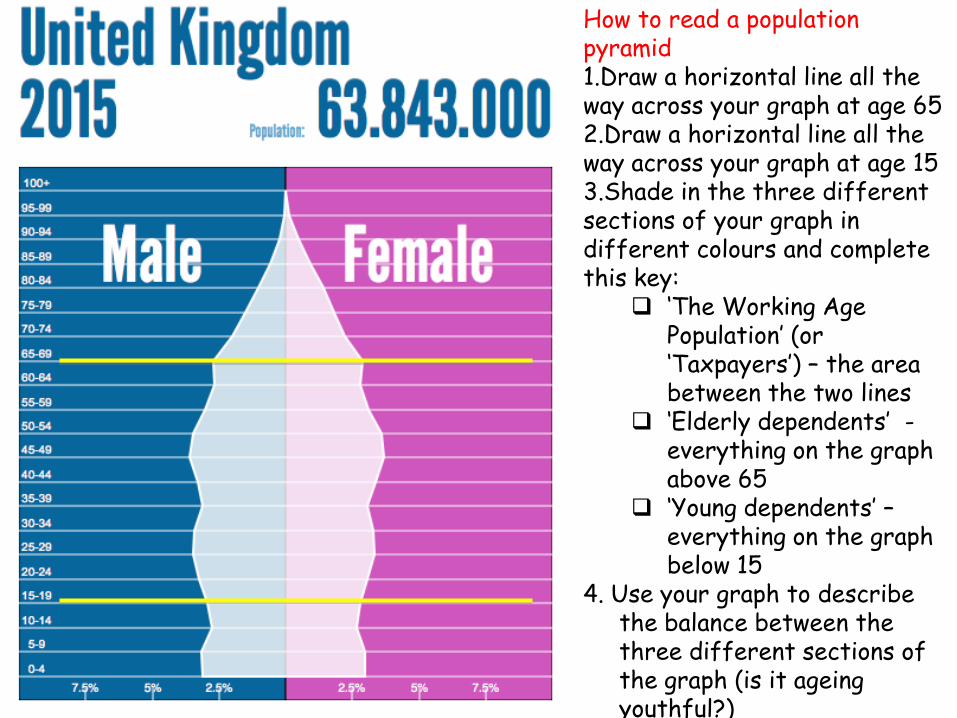
How to read a population pyramid 1.Draw a horizontal line all the way across your graph at age 65 2.Draw a horizontal line all the way across your graph at age 15 3.Shade in the three different sections of your graph in different colours and complete this key:
‘The Working Age Population’ (or ‘Taxpayers’) – the area between the two lines
‘Elderly dependents’ - everything on the graph above 65
‘Young dependents’ – everything on the graph below 15
4. Use your graph to describe the balance between the three different sections of the graph (is it ageing youthful?)

Uganda is a country with a YOUTHFUL population structure. It has a wide base and a narrow top, indicating lots of children and a low life expectancy. In fact, over
50% of people here are under 16.
Some of the problems that countries with YOUTHFUL populations face are:
a) The government finds it hard to find enough
money to pay for schools and education. b) Families find it hard to feed their children, often
their farms don’t produce enough food to feed everyone.
c) Young people find it hard to get a job
Japan is a country with an AGEING population structure. It has a narrowing base and a wider top, indicating people
are having fewer children and there is a high life expectancy. Japan is the oldest population in the world.
Some of the problems that countries with AGEING
populations face are:
a) The government finds it hard to find enough money to pay for pensions and care for elderly people
b) Lots of elderly relatives are placed in care homes as their children can’t cope with looking after them.
c) People are being told that they will have to work much later in life before they are allowed to retire.
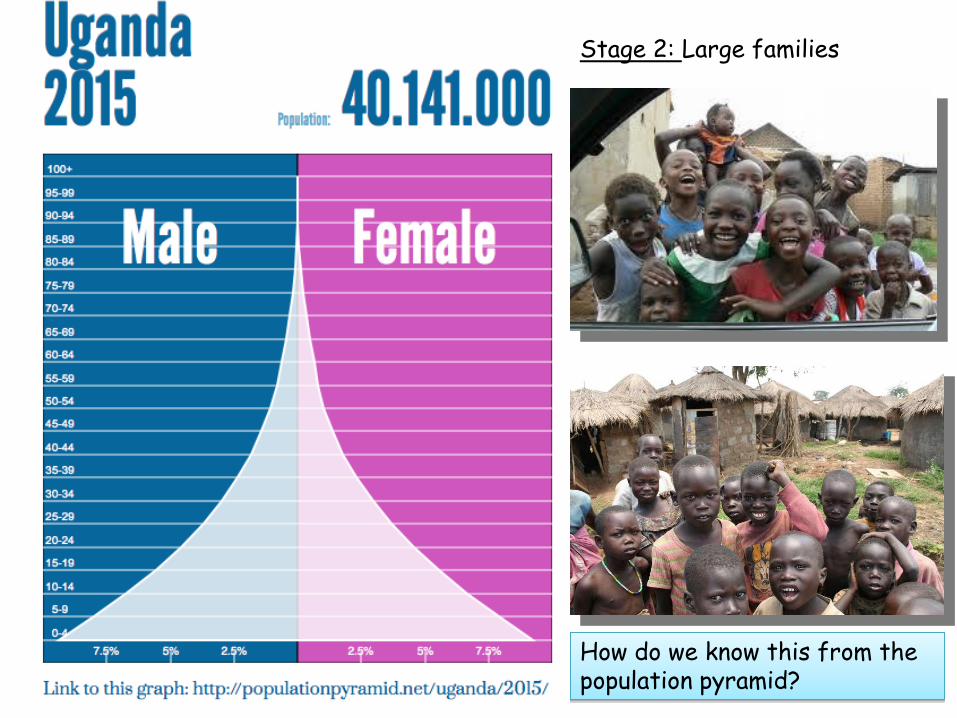
Stage 2: Large families
How do we know this from the population pyramid?

Stage 3: Smaller families and increasing numbers of elderly How do we know this from the population pyramid?

Stage 4: 2 child families most common, lots of one child families. Most children have grandparents
How do we know this from the population pyramid?

Stage 5: One child families very common and many adults choose not to have children. Lots of elderly people.
How do we know this from the population pyramid?

TOPIC 5 – An ageing population in Japan
By the end of your revision of topic 5 you should know the following things off by heart:
1. The shape of the population pyramid in Japan 2. The definitions of the following key terms:
1. Ageing population 2. Pension 3. Retirement age 4. Retiree 5. Life expectancy 6. Centenarian
3. The 2 key factors that have caused an ageing population in Japan
4. Key descriptive detail about Japan’s changing population structure
5. 4 key impacts (with facts) of Japan’s ageing population

Get thinking Describe the shape of the population pyramid and explain why the sale of adult nappies (‘diapers’) now outsells nappies for babies in Japan?
Japan has the ‘oldest’ population in the world. The number of elderly people far outweighs the number of young children being born. It is what we call an ageing population.

KEY WORDS:
Ageing population
Pension
Life expectancy
Retiree
Centenarians
Retirement age
A payment paid by the government (or from people’s private pensions) to retired people to enable them to survive without a job
When the average age of a population increases because of rising life expectancy and falling birth rates.
The age at which people can retire and start claiming their state pension (this will be at least 68 for you but is currently 65).
A retired person.
The average length of time that people live for in a country.
People who have lived for over a century (100 years)

Stage 5: One child families very common and many adults choose not to have children. Lots of elderly people as life expectancy is very high..
How do we know this from the population pyramid?

There are two key factors that mean overall, Japan has an ageing population:
Japan’s fertility rate
Overall there are a lot more elderly than young people
Women are having fewer children (just 1.25 per woman). A couple doesn’t replace itself so there are fewer and fewer children.
Life expectancy is increasing rapidly (it is now over 85 years) and so there are a lot more elderly people surviving.

Describing the population structure: 1. Life expectancy is 83 2. 500,000 centenarians 3. 38% of the population will be elderly by
2050 4. The fertility rate is falling very quickly 5. This is causing Japan’s population to
shrink. Some believe the population of Tokyo could halve in the next 90 years

Problems caused by an ageing population in Japan: 1. There aren’t enough workers to pay the taxes to pay for pensions
or healthcare for the elderly. There are now only 2 workers for every retired person (it used to be 9)
2. 3.8 million Japanese live alone 3. Taxes have had to increase by 10% 4. The retirement age has increased from 65 to 70 5. Hospitals can’t cope with all the elderly people

TOPIC 6 – An ageing population in the UK
By the end of your revision of topic 6 you should know the following things off by heart:
1. The difference between the population structure in 2010 and what it is expected to be in 2070.
2. Problems our government faces because of an ageing population (at least 3 including facts)
3. Solutions to the problem of an ageing population (at least 4)

Let’s now think about an ageing population in the UK.

This graph shows how the population structure of the UK will become an ageing population by 2070.
The number of Working Age Population
(Taxpayers): Falling
The number of Young Dependents: Smaller & falling slightly
The number of Elderly Dependents:
Growing & continuing to rise

Pensions will cost an extra £10 billion a year by 2050 because there will be so many more elderly people.
The NHS will be under pressure. The elderly use £5,200 worth of NHS services each year, compared to £2,800 for under 65s.
There will be increased demand for residential care in ‘old people’s homes’ (345,000 places are needed today, increasing to 825,000 by 2041). It costs a £25,000 per year for a place in a care home. Many people will have to sell their houses to pay for the care.
An ageing population could lead to a shortage of workers and mean companies have to pay higher wages (meaning less profit).
With fewer taxpayers and more elderly people needing care and pensions, many fear that tax levels will have to increase for those in work.
As people are living longer, they don’t move out of their houses. This means there is a national shortage of housing of over 3 million homes.
An ageing population poses key problems for the government:

Those in work may have to pay higher taxes to pay for pensions, the NHS and care for the elderly.
Increase immigration (people moving into Britain from abroad) because immigration is often from younger people who work and pay taxes.
Raising the retirement age (it has already increased from 65 to 68) for most people.
Make people who are working at the moment start saving more of their incomes towards their pensions so they can pay for their care when they are older.
Make cuts to other public services (eg. Children’s Centres)
Fact Sheet 2: What are some of the solutions to the UK’s ageing population?

TOPIC 7 – Migration By the end of your revision of topic 7 you should know the following things off by heart:
1. The definitions of the 10 migration key words.
2. What we mean by ‘push factors’ and ‘pull factors’
3. At least 5 push factors (and the matching pull factor)
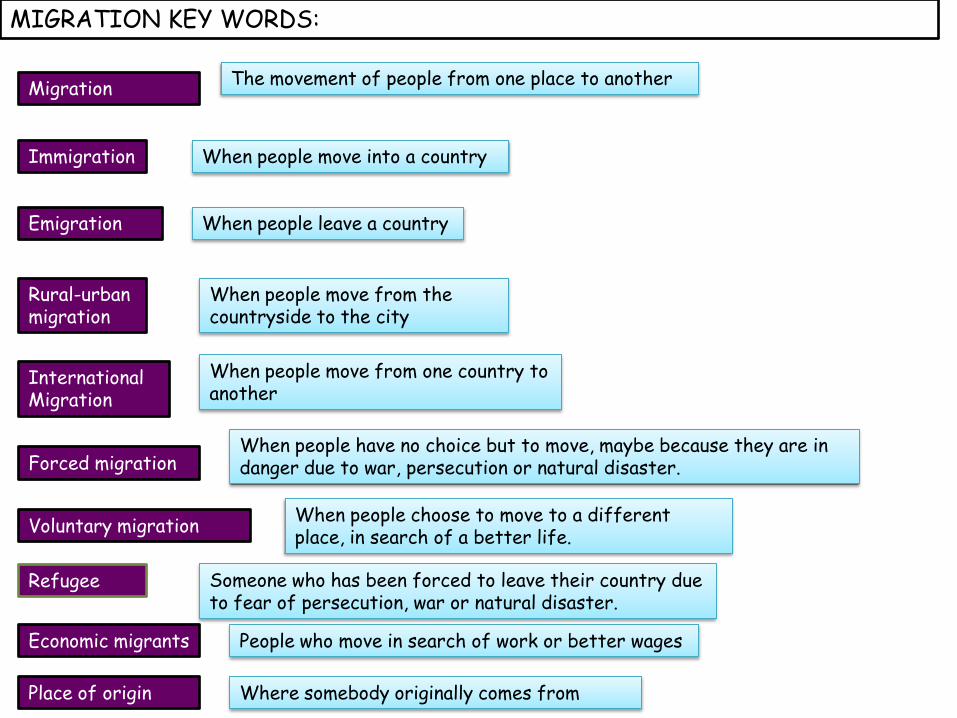
MIGRATION KEY WORDS:
Migration
Emigration
International Migration
Voluntary migration
Place of origin
Economic migrants
Refugee
Immigration
Rural-urban migration
Forced migration
When people move from the countryside to the city
Someone who has been forced to leave their country due to fear of persecution, war or natural disaster.
When people leave a country
When people have no choice but to move, maybe because they are in danger due to war, persecution or natural disaster.
When people move into a country
People who move in search of work or better wages
When people choose to move to a different place, in search of a better life.
Where somebody originally comes from
The movement of people from one place to another
When people move from one country to another
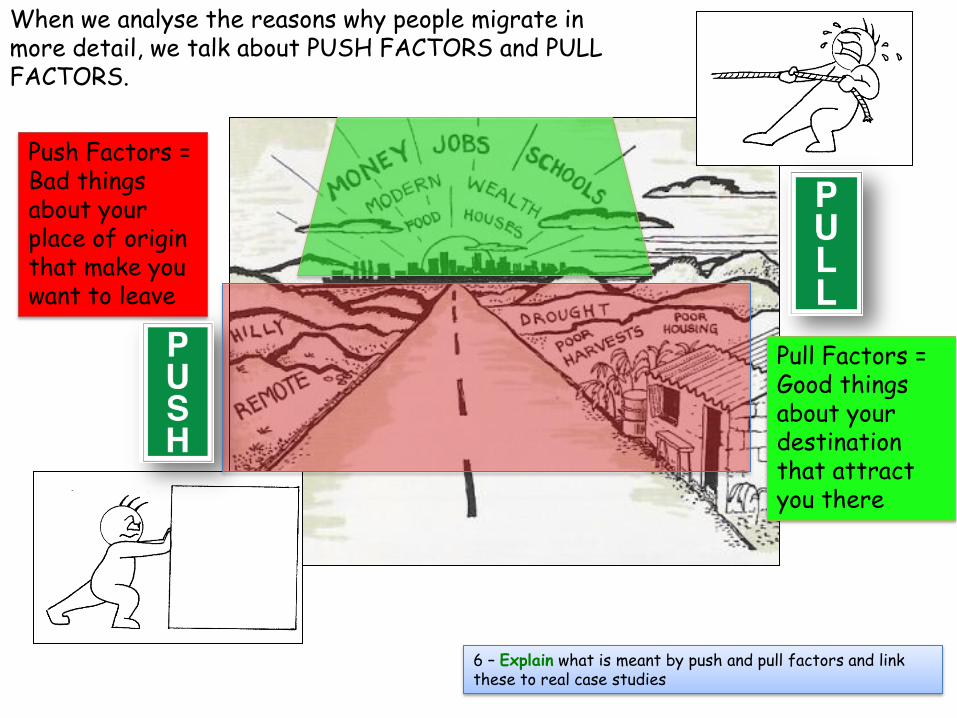
When we analyse the reasons why people migrate in more detail, we talk about PUSH FACTORS and PULL FACTORS.
6 – Explain what is meant by push and pull factors and link these to real case studies
Push Factors = Bad things about your place of origin that make you want to leave
Pull Factors = Good things about your destination that attract you there
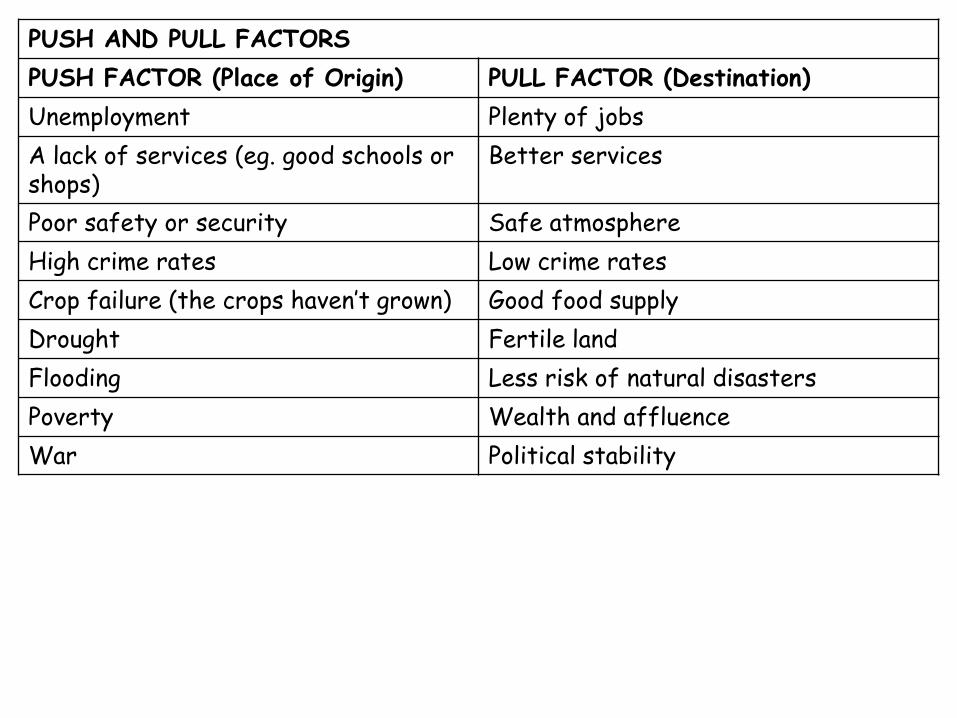
PUSH AND PULL FACTORS
PUSH FACTOR (Place of Origin) PULL FACTOR (Destination)
Unemployment Plenty of jobs
A lack of services (eg. good schools or shops)
Better services
Poor safety or security Safe atmosphere
High crime rates Low crime rates
Crop failure (the crops haven’t grown) Good food supply
Drought Fertile land
Flooding Less risk of natural disasters
Poverty Wealth and affluence
War Political stability
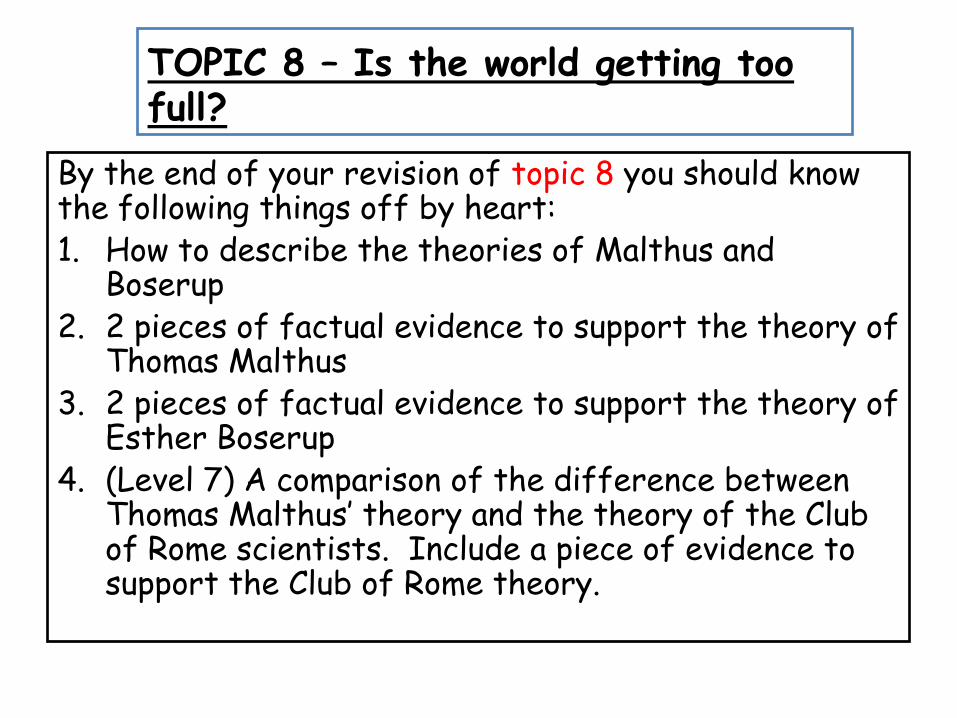
TOPIC 8 – Is the world getting too full?
By the end of your revision of topic 8 you should know the following things off by heart: 1. How to describe the theories of Malthus and
Boserup 2. 2 pieces of factual evidence to support the theory of
Thomas Malthus 3. 2 pieces of factual evidence to support the theory of
Esther Boserup 4. (Level 7) A comparison of the difference between
Thomas Malthus’ theory and the theory of the Club of Rome scientists. Include a piece of evidence to support the Club of Rome theory.

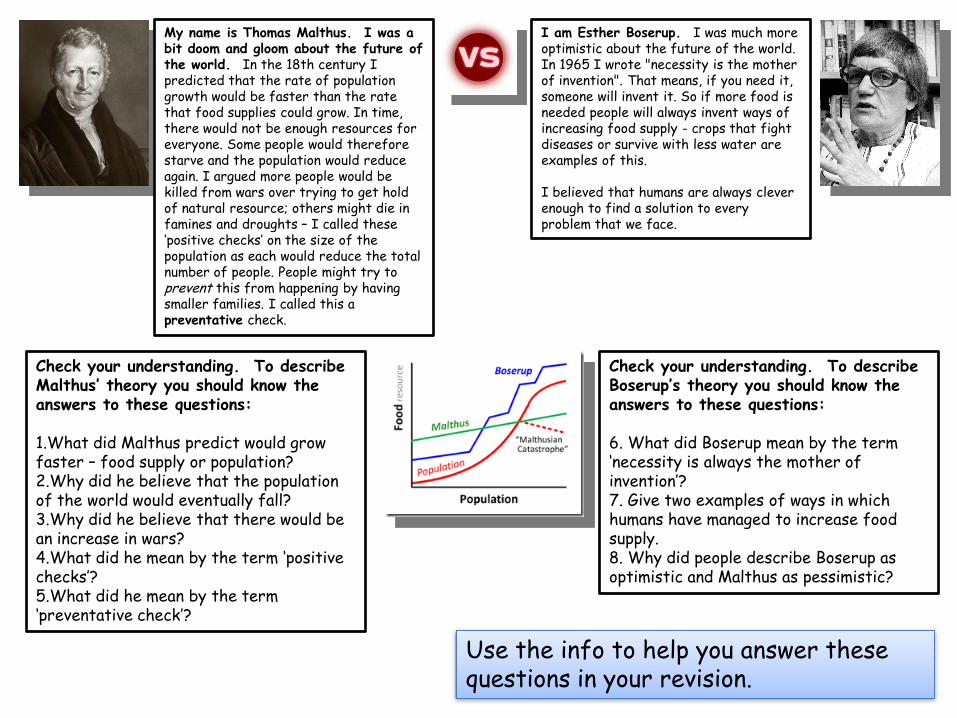
My name is Thomas Malthus. I was a bit doom and gloom about the future of the world. In the 18th century I predicted that the rate of population growth would be faster than the rate that food supplies could grow. In time, there would not be enough resources for everyone. Some people would therefore starve and the population would reduce again. I argued more people would be killed from wars over trying to get hold of natural resource; others might die in famines and droughts – I called these ‘positive checks’ on the size of the population as each would reduce the total number of people. People might try to prevent this from happening by having smaller families. I called this a preventative check.

Here’s a diagram to explain what I mean.
After this point, people would die either in famines or wars over food and other resources.

I am Esther Boserup. I was much more optimistic about the future of the world. In 1965 I wrote "necessity is the mother of invention". That means, if you need it, someone will invent it. So if more food is needed people will always invent ways of increasing food supply - crops that fight diseases or survive with less water are examples of this. I believed that humans are always clever enough to find a solution to every problem that we face.

Malthus Boserup
With me so far?....
My name is Thomas Malthus. I was a bit doom and gloom about the future of the world. In the 18th century I predicted that the rate of population growth would be faster than the rate that food supplies could grow. In time, there would not be enough resources for everyone. Some people would therefore starve and the population would reduce again. I argued more people would be killed from wars over trying to get hold of natural resource; others might die in famines and droughts – I called these ‘positive checks’ on the size of the population as each would reduce the total number of people. People might try to prevent this from happening by having smaller families. I called this a preventative check.
I am Esther Boserup. I was much more optimistic about the future of the world. In 1965 I wrote "necessity is the mother of invention". That means, if you need it, someone will invent it. So if more food is needed people will always invent ways of increasing food supply - crops that fight diseases or survive with less water are examples of this. I believed that humans are always clever enough to find a solution to every problem that we face.
Check your understanding. To describe Malthus’ theory you should know the answers to these questions: 1.What did Malthus predict would grow faster – food supply or population? 2.Why did he believe that the population of the world would eventually fall? 3.Why did he believe that there would be an increase in wars? 4.What did he mean by the term ‘positive checks’? 5.What did he mean by the term ‘preventative check’?
Check your understanding. To describe Boserup’s theory you should know the answers to these questions: 6. What did Boserup mean by the term ‘necessity is always the mother of invention’? 7. Give two examples of ways in which humans have managed to increase food supply. 8. Why did people describe Boserup as optimistic and Malthus as pessimistic?
Use the info to help you answer these questions in your revision.

Population growth in parts of Africa such as the Sahel has caused farmers to use their fields too much. This has damaged the soil and caused soil erosion – making it impossible to grow food there any more. People have had to move away or die from famine.
EVIDENCE IN FAVOUR OF MALTHUS

World food prices increased rapidly in 2008 partly due to global shortages. This caused riots in countries such as Bangladesh where it was estimated that 30 million people became malnourished because they couldn’t afford food.
EVIDENCE IN FAVOUR OF MALTHUS

In the late 1960s scientists developed new types of crops called ‘high yielding varieties’ which grew more quickly and produced more food from each field. This was the Green Revolution and saved India from a devastating famine.
EVIDENCE IN FAVOUR OF BOSERUP

Population growth is beginning to slow down, because more educated women and more child immunisations mean families across the world now have an average of only 2 children.
EVIDENCE IN FAVOUR OF BOSERUP

We can import and export food, bringing it in from other countries if there is a shortage.
EVIDENCE IN FAVOUR OF BOSERUP
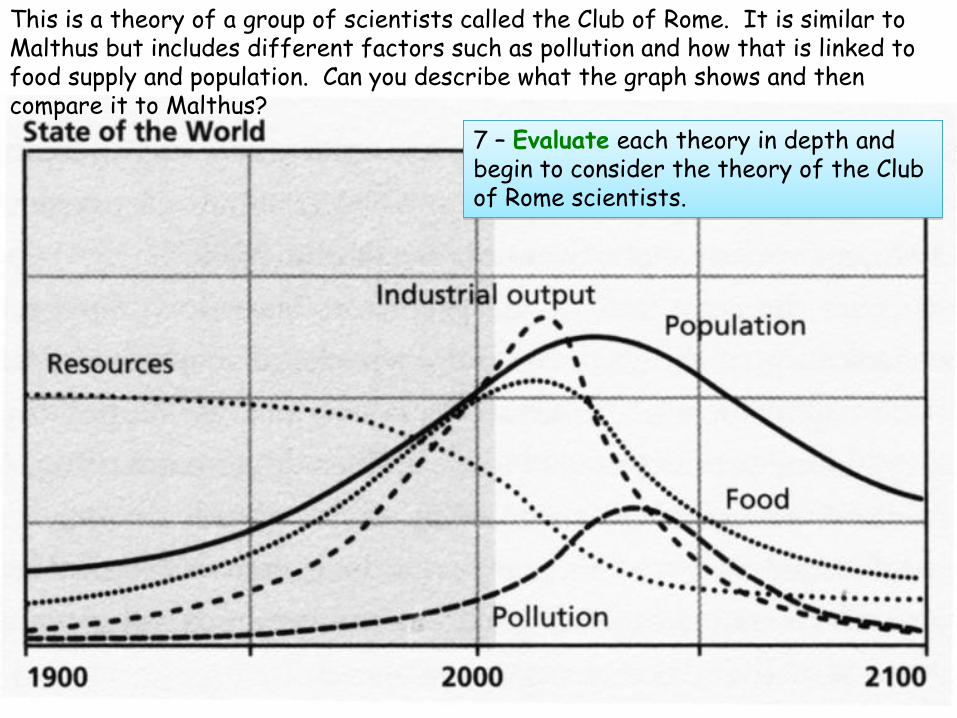
This is a theory of a group of scientists called the Club of Rome. It is similar to Malthus but includes different factors such as pollution and how that is linked to food supply and population. Can you describe what the graph shows and then compare it to Malthus?
7 – Evaluate each theory in depth and begin to consider the theory of the Club of Rome scientists.

Climate change is affecting how much food each field produces (this is called crop yields). Floods, droughts and changing weather patterns mean that over 2/3 of Africa is expected to see reduce yields in the future.
EVIDENCE IN FAVOUR OF THE CLUB OF ROME

Acid rain is having a big impact on food supply. In India, the amount of crops grown on farms near to power plants has fallen by 49%.
EVIDENCE IN FAVOUR OF THE CLUB OF ROME