topco technologies corp · in terms of sales regions, in addition to the original taiwan and china...
TRANSCRIPT

1
Stock Code: 3388
TOPCO TECHNOLOGIES CORP TOPCO TECHNOLOGIES CORP
2018 ANNUAL REPORT
Annual Report Website: http://www.topcocorp.com
Declaration Website: http://mops.twse.com.tw
Published Date April 15, 2019
Notice to readers:
This English-version annual report is a summary
translation of the Chinese version and is not an official
document of the shareholders’ meeting. If there is any
discrepancy between the English and Chinese versions, the
Chinese version shall prevail.

2
I. The names, titles, telephone numbers and email addresses of the Spokesperson and Deputy
Spokesperson
Spokesperson’s Name: Kun-Ming Wu. Title: Chief Financial Officer
Deputy Spokesperson’s Name: Wen-Hua Tsai. Title: Deputy Chief Executive Officer
TEL:(02) 2751-7878 Fax:(02) 2751-7979
Email: Spokesperson – [email protected]
Deputy Spokesperson – [email protected]
II. Company and factory address and telephone:
Company Address: 14F, No.102, Section 4, Civic Blvd., Taipei City
TEL:(02) 2751-7878 Fax:(02) 2751-7979
III. Name, address, telephone number and website link of the stock transfer agent:
Name: Shareholders Service Dept., Taishin International Commercial Bank Co., Ltd.
Address: B1, No.96, Sec. 1, Jianguo N. Rd., Taipei City
TEL:(02) 2504-8125 Fax:(02) 2515-4900
Website: http://www.taishinbank.com.tw
IV. The CPA’s name and the accounting firm’s name, address, telephone number and website for the most recent
annual financial report:
Accounting firm’s name: KPMG
CPA’s name: Ruilan Luo, Yi-Wen Wang
Address: 68F, No. 7, Section 5, Xinyi Road, Xinyi District, Taipei City
TEL:(02) 8101-6666 Fax:(02) 8101-6667
Website: http://www.kpmg.com.tw
V. Name of any exchanges where the Company's securities are traded offshore, and the method by which to
access information on said offshore securities: N/A
VI. Company website: http://www.topcocorp.com

3
Table of Contents
1. Letter to Shareholders ............................................................................................................................................ 5
2. Company Profile ..................................................................................................................................................... 7
2.1 Company profile: ......................................................................................................................................... 7
3. Corporate Governance Report .............................................................................................................................. 8
3.1 Organization: .................................................................................................................................................. 8 3.2 Directors, supervisors, general managers, deputy general managers, associates, managers of various
departments and branches: ......................................................................................................................... 10 3.3 Corporate governance operations: .............................................................................................................. 24 3.4. Information on auditing fees : .................................................................................................................... 49 3.5. Information of changing accountants: ........................................................................................................ 50 3.6 For the company’s chairman, general manager, manager responsible for financial or accounting
affairs, and personnel who have worked in the auditor’s office or its affiliates in the most recent year ... 50 3.7. Equity transfer and equity pledge changes of directors, supervisors, managers and shareholders with
a shareholding of more than 10% in the most recent year and up to the publication date of the annual
report .......................................................................................................................................................... 50
3.8 Information of the top ten shareholding ratio shareholders, related to each other as defined in the SFAS
No.6……………………………………………………………………………………………………….52
3.9 Share holding ratio of the re-invested business of the company, the company’s directors, supervisors,
managers and corporations directly or indirectly controlled by the company, and the comprehensive
shareholding ratio ....................................................................................................................................... 53
4. Capital Overview .................................................................................................................................................. 54
4.1 Capital and shares: ..................................................................................................................................... 54 4.2 Issuance of corporate bonds:None ............................................................................................................. 59 4.3 Issuance of preferred shares: None. ........................................................................................................... 59 4.4 Issuance of GDRs: None. ........................................................................................................................... 60 4.5 Issuance of employee stock warrants: None. ............................................................................................. 60 4.6 Issuance of new restricted employee shares ............................................................................................... 60 4.7 Issuance of new shares upon any merger and acquisition with other companies: None. ........................... 62 4.8 Implementation of fund utilization plan: .................................................................................................... 62
5. Operational Profile ............................................................................................................................................... 63
5.1 Business content: ........................................................................................................................................ 63 5.2 Marketing and production profile: ............................................................................................................. 67 5.3 Basic information of employees:................................................................................................................ 72 5.4 Information of environmental protection expenditure: .............................................................................. 72 5.5 Labor relations: .......................................................................................................................................... 72 5.6 Important contracts: ................................................................................................................................... 76
6. Financial overview ................................................................................................................................................ 77
6.1 Condensed financial information of the most recent five years: ................................................................ 77 6.2 Financial analysis of the most recent five years: ........................................................................................ 81 6.3 2018 Supervisor’s review of the most recent annual financial report ........................................................ 85 Date:March 4, 2019 ......................................................................................................................................... 85
6.4 2018 Consolidated financial reports audited by CPA: ............................................................................... 86 6.5 2018 Individual financial reports audited by CPA: .................................................................................... 86 6.6 The impact on the Company’s financial status if there are any financial difficulties for the Company
and its affiliates in the most recent year and up to the date of publication of the financial report shall
be clarified: None ....................................................................................................................................... 86

4
7. Review, analysis and risk of the financial status and financial performance .................................................. 87
7.1 Comparative analysis of financial conditions: ........................................................................................... 87 7.2 Comparative analysis of financial performance: ........................................................................................ 88 7.3 Cash flow analysis: .................................................................................................................................... 88 7.4 Industry-specific key performance indicators (KPI): ................................................................................. 89 7.5 Impact of significant capital expenditures on financial and operational conditions for the most recent
years: .......................................................................................................................................................... 89 7.6 The investment policy for the most recent year, the main reason for profit or loss, improvement plan
and investment plan for the upcoming year: .............................................................................................. 89 7.7 Analysis and assessment of risk for the most recent year up to the printed date of the annual report: ...... 90 7.8 Other important matters: ............................................................................................................................ 94
8. Special Disclosures ................................................................................................................................................ 95
8.1 Information of affiliates: ............................................................................................................................ 95 8.2 For the private equity securities managing status in the most recent year and as of the publication
date of the annual report: No such issues happened. .................................................................................. 98 8.3 Holding or disposal of shares in the Company by the Company's subsidiaries in the most recent year
and until the date of publication of the annual report: No such issues happened. ..................................... 98 8.4 Other necessary supplementary explanations: No such issues happened. ................................................. 98 8.5 In the most recent year and as of the publication date of the annual report, if there are any matters
determined in Term 2, Item 2, Article 36 of the Securities Exchange Act that have significant impacts
on shareholders’ equity or securities prices:No such issues happened. ................................................... 98

5
1. Letter to Shareholders
Dear shareholders,
Topco has been working in the special material field (especially Silicone) for more than 40 years.
Supported by many suppliers (especially the Shin-Etsu Chemical Group of Japan), Topco is now able to
become a professional special materials distributor. In addition to the original Silicone products, other
silicone-related materials such as cosmetics, antistatic agents, adhesives and structural adhesives, etc., are
also being developed. Suppliers have also increased, such as Konishi, Sika, Gunze and Fujikasei
Chemicals, among others. In recent years, apart from materials, the Company has also introduced
VUV-related equipment and atmospheric plasma equipment, hoping to provide customers with more
comprehensive services by applying the equipment-material sales approach.
In terms of sales regions, in addition to the original Taiwan and China area, the Company also officially
established branches in Indonesia and Vietnam in 2015, focusing on operating the Southeast Asian market.
Since operation commenced, a number of important new customers have been sought, bringing good
vision to the overall operation. In view of the current political and economic situation and the future
US-China trade development, in the foreseeable future we must work extra hard on the Southeast Asian
market layout to trigger the next growth momentum.
Ever since Silicone’s global supply and demand began to change at the end of 2016, the price hikes in the
Greater China region and the period of goods shortages ended around the first half of 2018. In 2018, our
new prducts on automobile, cosmetics, medical care, and consumer electronics sales gradually
contributed. Therefore, our revenue and profit in 2018 were singficantly better compared to previous
years, the best performance in recent years.
Consolidated business result: Unit: hundred million/ NT$
2017 2018 Growth rate
Operating Revenue 76.72 85.45 11.38%
Net Income 3.50 4.63 32.29%
Earning Per Share( in dollar) 5.65 7.41 -
Operating Performance and Profitability analysis:
Item 2017 2018
Operating Performance
Analysis
Account receivable
turnover (times) 4.02 4.23
Inventory turnover (times) 9.17 8.32
Profitability Analysis
Return on total assets (%) 8.22 10.11
Return on equity (%) 12.35 15.25
Net margin (%) 4.83 5.64

6
(I) The main products successfully developed in 2018:
1. Ingredients for cosmetics
2. Various special powders used in make-up and foundations
3. Silicone materials of medical mask
4. Materials for the related product of game machine
5. Consuming electronic waterproof silicone materials
6. Antistatic conductive polymers applied in small and medium size displays
7. Pollution-free modified silicone building materials
8. PU building adhesive
9. Inflammable PC material additives
10. UV surface hydrophilic treatment equipment
(II) Prospects for operational planning for 2019:
1. Four major development focuses for cosmetics, medical care, consuming electronics and
automobiles
2. In response to suppliers’ capacity increase, sales expansion, new clients’ development and new
material development continue to take place.
3. Deep operational expansion and growth in Southeast Asia branches of Indonesia and
Vietnam.
4. Enhance material distributor value: integrate information from domestic and overseas
customers and of silicone materials to let material suppliers develop new materials that
meet customers’ needs and rapidly expand sales.
5. Eveluate to expand Southeast Asia branches for the US-China trade war.
6. Corporate Social Responsibility (CSR) activities: caring for employees to implement the
internal culture of the company and promote activities in which businesses contribute to the
society.
(III) Advanced development objective
Looking ahead on Silicone’s global supply and demand situation in 2019, major companies
around the world have announced production capacity and equipment expansion. How to
fully grasp the market pulse, seek the support of suppliers, actively develop new clients,
expand new markets, and certify new mateirals, use Silicone’s key materials applied in all
walks of life as a niche, and develop an overll supply chain solution that provides more
in-depth customer services, and bring out the best in the companies’ sales management
talents will definitely bring performance to new heights.
Sincerely yours,
Chairman: Chen-Cheng Pan
CEO: Sheng-Ho Chang
CFO: Kun-Ming Wu
April 15, 2019

7
2. Company Profile
2.1 Company profile:
(I) Company history:
Years Milestones
1981: Chun-Chien Wang, Honorary Chairman and others co-founded TOPCO Trading Co., Ltd.,
and began the agency and distribution business of silicone products and other related products
of Japan Shin-Etsu Chemical Co., Ltd.
1986: A joint venture with Shin-Etsu Chemical Co., Ltd. was established in Hsinchu to form
Shin-Etsu Chemical Co., Ltd., which engages in the production of silicone products.
1992: Hong Kong TOPCO Trading Co., Ltd. was established to take charge of the sales of silicone
products in Hong Kong and South China areas.
1994: TOPCO Electronics Co., Ltd. was established to design, manufacture, and sell CCTV
cameras, digital cameras and other related products.
1997: TOPCO Trading (Shanghai Pudong District) Co., Ltd. was established to take charge of the
sales of silicone products in East China and North China areas.
2001: TOPCO (Guangzhou) Trading Co., Ltd. was established to take charge of the sales of silicone
products in South China area.
2004: TOPCO Trading Co., Ltd. merged with TOPCO Electronics Co., Ltd. and changed its name to
TOPCO Technologies Co., Ltd.
2006: The Company’s stocks started to trade at Taipei Exchange.
2006: TOPGLOW Trading Co., Ltd. was merged and became a subsidiary of the Company.
2007: The Beijing branch of TOPCO Trading (Shanghai Pudong District) Co., Ltd. was established.
2010: The electronic business group split and established TOPVIEW Co., Ltd. (a 100% owned
subsidiary).
2010: The Company released 70% shares of TOPVIEW Co., Ltd.
2011: The original Chairman, Mr. Chun-Chien Wang, was transferred to serve as the Honorary
Chairman. Mr. Chun-Ming Weng served as the Chairman, and Mr. Zhencheng Pan served as
CEO.
2011: The Company increased its capital in cash. After the capital increase, the paid-in capital
amounted to NT$ 620 million.
2012: The Company released the remaining 30% shares of TOPVIEW Co., Ltd.
2013: The Company expanded the distribution in Mainland China and formally established the
Suzhou, Ningbo and Xiamen branches.
2014: The Company issued new restricted employee shares of 2,400,000 shares.
2015: TOPCO in Indonesia and Vietnam formally obtained business licenses and began operations.
2017: Mr. Chen-Cheng Pan began to serve as the Chairman and Mr. Sheng-Ho Chang began to
serve as the CEO.
2018: The Company increased its capital in cash. After the capital increase, the paid-in capital
amounted to NT$ 740,610 thousands.
2019: The Hanoi branch of TOPCO (Vietnam) Trading Co., Ltd. was established.
8
3. Corporate Governance Report
3.1 Organization:
(I) Corporate organization:
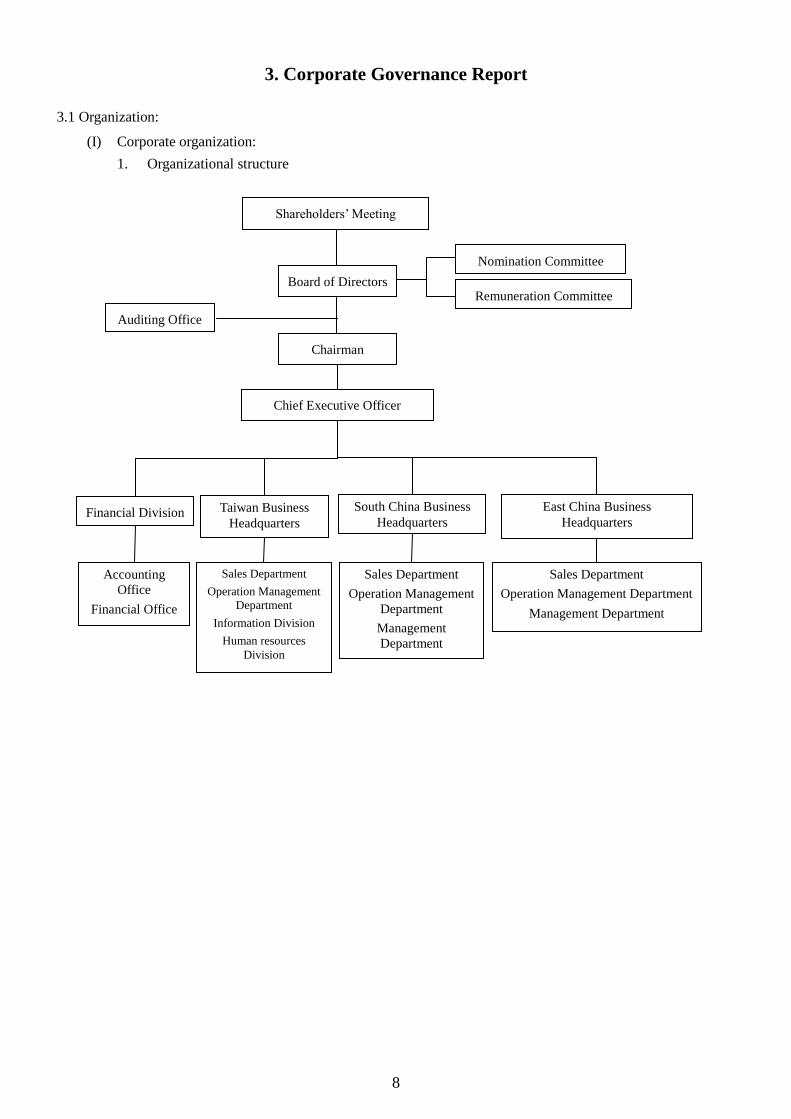
1. Organizational structure
Taiwan Business
Headquarters
Sales Department
Operation Management
Department
Information Division
Human resources
Division
Chairman
Chief Executive Officer
Board of Directors
Shareholders’ Meeting
South China Business
Headquarters
Sales Department
Operation Management
Department
Management
Department
East China Business
Headquarters
Sales Department
Operation Management Department
Management Department
Financial Division
Accounting
Office
Financial Office
Auditing Office
Nomination Committee
Remuneration Committee

9
2. Department functions:
Department Main responsibilities
Chairman’s Office Planning for operation and development blueprints for the Company.
Implement corporate governance.
Supervising the internal control of internal audit.
CEO Office Planning for medium-and-long-term business strategies and developing new business directions and
market layout.
Operational performance control and benefit evaluation of various domestic and overseas invested
companies or projects.
Auditing Office Auditing and evaluating the lack and effectiveness of internal control systems of the Company's
various departments and subsidiaries, and providing audit reports and suggestions for improvement.
Financial Division Responsible for financial and investment strategy planning, financial risk assessment of the invested
items and management of the invested business.
Serving as the Company’s spokesperson, managing company image, and operating investor
relations, shareholder service and legal compliance.
Decision support and operational risk management.
Financial Office Funding, scheduling, planning and operational managing, and monitoring of cash flow changes.
Accounting Office Accounting and tax processing operations, and preparation and implementation of annual reports
and annual budget.
Taiwan Business
Headquarters Coordinating the business promotion, operational management, personnel dispatching and resource
allocation in Taiwan and Indonesia’s business units, and achieving business objectives,
performance tracking and improvement.
East China
Business
Headquarters
Coordinating business promotion, operational management, personnel dispatching and resource
allocation in East China and North China’s business units, and achieving business objectives,
performance tracking and improvement.
South China
Business
Headquarters
Coordinating business promotion, operational management, personnel dispatching and resource
allocation in South China and Hong Kong’s business units, and achieving business objectives,
performance tracking and improvement.
Sales Department Achieving business performance and profit goals, conducting market intelligence surveys, product
pricing, sales statistics, cost and profit analysis and account collection, coordinating shipments,
replying customer complaints, and tracking progress.
Operation
Management
Department
Processing customer order, product sales statistics, cost and profit analysis, account collection, and
coordinating shipments.
Information
Division Planning for information system, and conducting process design, programming and hardware and
software resources management.
Human Resources
Division The planning and implementation of various human resources management systems, operation of
selection, education, use and retention, and general administrative affairs management.

10
3.2 Directors, supervisors, general managers, deputy general managers, associates, managers of various departments and branches:
(I) Directors and supervisors:
1. Basic information:
April 2, 2019 Unit: per share
Title
Nationality
or
Registration
Place
Name Gender
Date
Elected /
Appointed
Term
(Year)
First
Elected
Date
Shareholding When Elected Current Shareholding
Current Shares Held by
Spouse and Underaged
Children
Shareholding Under
Others’ Names Main Education and
Working
Experiences
Current Concurrent
Positions in the
Company and Other
Companies
Other Managers, Directors or
Supervisors having the Relationship of
Spouse or Relatives Within the Second
Degree
Number of
Shares
Shareholdings
Percentage (%)
Number of
Shares
Shareholdings
Percentage (%)
Number of
Shares
Shareholdings
Percentage (%)
Number
of Shares
Shareholdings
Percentage (%) Title Name Relationship
Chairman Taiwan,
R.O.C
Chen-Cheng
Pan Male
Jan. 10,
2017 3 yrs
Jun. 21,
2006 565,885 0.88 999,041 1.35 127,217 0.17 0 0
Department of
International Trade,
Chinese Culture
University
Deputy General
Manager, TOPCO
Trading Co., Ltd.
Head of Silicon
Business Unit,
TOPCO
Technologies Co.,
Ltd.
CEO, TOPCO
Technologies Co.,
Ltd.
Vice Chairman,
Taiwan Shin-Etsu
Silicone Co., Ltd.
Supervisor,
Chung-Shin Ltd.
Director, Topco
Development Co.,
Ltd.
Director, TOPCO
(Guangzhou) Trading
Co., Ltd.
Director, TOPCO
Trading (Shanghai
Pudong District) Co.,
Ltd.
Director, Hong Kong
TOPCO Trading Co.,
Ltd.
None None None
Director
Taiwan,
R.O.C
Topco
Development
Co., Ltd.
Jun. 17,
2006 3 yrs
Sept. 2,
2004 15,511,136 24.13 16,631,136 22.46 0 0 0 0 None None None None None
Taiwan,
R.O.C
Chun-Chien
Wang, Rep. of
Topco
Development
Co., Ltd.
Male Jun. 17,
2006 3 yrs
Sept. 2,
2004 647,846 1.01 585,846 0.91 1,562,052 2.11 0 0
Army Academy,
Taiwan, R.O.C
Chairman, TOPCO
Trading Co.
Chairmen, TOPCO
Electronics Co.
Chairmen, TOPCO
Technologies Co.,
Ltd.
Chairmen, Topco
Development Co.,
Ltd.
Director, Topco
Development Co.,
Ltd.
Director, Chung-Shin
Ltd.
Director Juo-pei
Wang
Father and
daughter
Director Taiwan,
R.O.C Juo-pei Wang Female
Jun. 17,
2006 3 yrs
Jun. 17,
2010 500,247 0.78 473,852 0.64 40,000 0.05 0 0
Department of
Foreign Language,
Aletheia University
Chairman, Sign Co.,
Ltd
Supervisor,
Kikukawa Metal &
Engineering Co., Ltd.
Director Chun-Chien
Wang
Father and
daughter
Director
Japan
Shin-Etsu
Chemical Co.,
Ltd.
Jun. 17,
2006 3 yrs
Sept. 2,
2004 2,815,296 4.38 2,815,296 3.80 0 0 0 0 None None None None None
Japan
Tadaki Inoue ,
Rep. of
Shin-Etsu
Chemical Co.,
Ltd.
Male Jun. 17,
2006 3 yrs
Oct. 01,
2014 0 0 0 0 0 0 0 0
Keio University
Sector Director of
management
department of Main
Silicone Business
Unit, Shin-Etsu
Chemical Co., Ltd
Vice Director, Main
Silicone Business
Unit of Shin-Etsu
Chemical Co., Ltd.
None None None

11
Title
Nationality
or
Registration
Place
Name Gender
Date
Elected /
Appointed
Term
(Year)
First
Elected
Date
Shareholding When Elected Current Shareholding
Current Shares Held by
Spouse and Underaged
Children
Shareholding Under
Others’ Names Main Education and
Working
Experiences
Current Concurrent
Positions in the
Company and Other
Companies
Other Managers, Directors or
Supervisors having the Relationship of
Spouse or Relatives Within the Second
Degree
Number of
Shares
Shareholdings
Percentage (%)
Number of
Shares
Shareholdings
Percentage (%)
Number of
Shares
Shareholdings
Percentage (%)
Number
of Shares
Shareholdings
Percentage (%) Title Name Relationship
Director Taiwan,
R.O.C
Chun-Ming
Weng Male
Jun. 17,
2006 3 yrs
Sept. 2,
2004 1,218,201 1.89 1,387,204 1.87 606,301 0.82 0 0
Department of
Tourism, Chinese
Culture University
General Manager,
TOPCO Trading
Co., Ltd.
CFO, TOPCO
Technologies Co.,
Ltd.
CEO, TOPCO
Technologies Co.,
Ltd.
Chairmen, TOPCO
Technologies Co.,
Ltd.
Chairman,
Chung-Shin Ltd.
Kikukawa Metal &
Engineering Co., Ltd.
Director
Director, Hong Kong
TOPCO Trading Co.,
Ltd.
Chairmen, Topco
Development Co.,
Ltd.
Chairman,
TOPGLOW Trading
Co., Ltd.
Chairman, Vitalizing
Engineering
Construction Co.,
Ltd.
Director, Topco
Trade (Indonesia)
Co., Ltd.
None None None
Independent
Director
Taiwan,
R.O.C
Chiung-Shin
Wu Male
Jun. 17,
2006 3 yrs
Sept. 2,
2004 0 0 0 0 0 0 0 0
National Chang-Hua
Senior School of
Commerce
General Manager,
Chang-Hua Bank
General Manager,
Taikai Trust and
Investment Co., Ltd.
Permanent
Supervisor, Taiwan
Business Bank
None None None None
Independent
Director
Taiwan,
R.O.C Ming-Hui Guo Male
Jun. 17,
2006 3 yrs
Jun. 20,
2013 0 0 0 0 0 0 0 0
Department of
Economics, National
Taiwan University
Deputy Manager of
Sales Department,
Headquarter of
Hua-Nan
Commercial Bank
None None None None
Supervisor Taiwan,
R.O.C
Chung-Sheng
Lin Male
Jun. 17,
2006 3 yrs
Sept. 2,
2004 1,051,889 1.64 1,104,508 1.49 190,472 0.26 0 0
Xinzhuang
Agricultural
Vocational School
Associate Manager,
TOPCO Trading
Co., Ltd.
Director, Chung-Shin
Ltd.
Supervisor, Topco
Development Co.,
Ltd.
Director, Long
Ma-Hao Investment
Co., Ltd.
None None None

12
Title
Nationality
or
Registration
Place
Name Gender
Date
Elected /
Appointed
Term
(Year)
First
Elected
Date
Shareholding When Elected Current Shareholding
Current Shares Held by
Spouse and Underaged
Children
Shareholding Under
Others’ Names Main Education and
Working
Experiences
Current Concurrent
Positions in the
Company and Other
Companies
Other Managers, Directors or
Supervisors having the Relationship of
Spouse or Relatives Within the Second
Degree
Number of
Shares
Shareholdings
Percentage (%)
Number of
Shares
Shareholdings
Percentage (%)
Number of
Shares
Shareholdings
Percentage (%)
Number
of Shares
Shareholdings
Percentage (%) Title Name Relationship
Supervisor Taiwan,
R.O.C
Chang-Wei
Wu Male
Jun. 17,
2006 3 yrs
Jun. 20,
2013 0 0 0 0 16,196 0.02 0 0
Department of
Accounting,
Soochow University
Manager of
Financial
Department, Shin
Kong Construction
and Development
Co., Ltd.
Manager/Associate
Manager of Real
Estate and Loan
Department, Shin
Kong Life Insurance
Co.,Ltd
Deputy General
Manager of Real
Estate Department
and Chairman
Office, Shin Kong
Life Insurance
Co.,Ltd
Chainman, Guang Yu
Jhih Di International
Co., Ltd.
None None None
Supervisor
Taiwan,
R.O.C
De Rong
Investment
Co., Ltd.
Jun. 21,
2017 2 yrs
Jun. 21,
2017 1,470,000 2.29 1,653,574 2.23 0 0 0 0 None None None None None
Taiwan,
R.O.C
Tzu-Cheng
Chiu, Rep. of
De Rong
Investment
Co., Ltd.
Male Jun. 21,
2017 2 yrs
Jun. 21,
2017 80,000 0.12 242,510 0.33 0 0 0 0
Ching Yun
University of
Science and
Technology
Director, Formosa
21 Construction and
Development Co.,
Ltd.
Director, De Rong
Investment Co., Ltd. None None None

13
2. Top 10 shareholders and their share percentage of TOPCO’s directors and supervisors that are
institutional shareholders:
April 2, 2019
Institutional Shareholder Name Main Shareholders of Institutional Shareholders
Topco Development Co., Ltd.
Chun-Chien Wang (10.0%), Chun-Ming Weng (6.7%), Bao-yu Lin (9.1%), Bao
Ruo Ltd. (8.8%) (Note), Long Ma-Hao Investment Co., Ltd. (4%) (Note), Jing-Yi
Hsu (3.5%), Chung-Sheng Lin (3.3%), Liang-Min Chen (0.8%), Jhih-Jia
Investment Co., Ltd. (10.8%) (Note)
Shin-Etsu Chemical Co., Ltd.
(Source:Annual Report of Shin-Etsu
Chemical)
The Master Trust Bank of Japan, Ltd(Trust account) (11.47%)
Japan Trustee Services Bank,Ltd(Trust account)(8.31%)
Nippon Life Insurance Company(5.14%)
The HachijuniBank,Ltd(2.76%)
Japan Trustee Services Bank,Ltd(Trust account4)(2.86%)
Meiji Yasuda Life Insurance Company(2.51%)
SSBTC CLIENT OMNIBUS ACCOUNT (2.35%)
Japan Trustee Services Bank,Ltd(Trust account5)(1.58%)
JP MORGAN CHASE BANK 380055 (1.42%)
JP MORGAN CHASE BANK 385151 (1.40%)
De Rong Investment Co., Ltd. Liang-Min Chen (41.8%), Tzu-Cheng Chiu (19.4%), Jia-Ling Chiu (19.4%),
Jia-Hong Chiu (19.4%)
Note:
Institution Name Main Shareholders of Institutional Shareholders
Bao Ruo Investment Ltd. Chun-Chien Wang 40%, Bao-yu Lin 40%, Juo-pei Wang 20%
Long Ma-Hao Investment Co., Ltd. Jia-hong Lin45.8%, Jia-te Lin 45.8%
Jhih-Jia Investment Co., Ltd. Pei-fen Chang (42.3%)

14
3. Whether or not directors or supervisors are qualified with at least 5 years of working experience in
commerce, law, finance or sales and meet the requirement listed in the table below:
Information of Directors and Supervisors
Criteria
Name
Whether or not have at least 5 years of working experience
and the following professional qualifications
Independence (Note 1)
Number of other public
listed
companies in which
concurrently
serving as an independent
director
Lecturer or
above in
commerce, law, finance,
accounting or
subjects required by the
business of the
Company in
public or
private colleges
or universities
Judge, public
prosecutor, attorney-at-law,
certified public
accountant, or other professional
or technical
specialist who has passed a national
examination and
been awarded a
certificate in a
profession
necessary for the business of the
Company.
Required
working experience in
commerce, law,
finance, accounting or
other fields
required by the
business of the
Company
1 2 3 4 5 6 7 8 9 10
Chen-Cheng
Pan None
Chun-Chien
Wang, Rep. of Topco
Development
Co., Ltd.
None
Juo-pei Wang None
Tadaki Inoue ,
Rep. of
Shin-Etsu Chemical Co.,
Ltd.
None
Chun-Ming
Weng None
Chiung-Shin
Wu None
Ming-Hui Guo None
Chung-Sheng
Lin None
Chang-Wei Wu None
Tzu-Cheng
Chiu, Rep. of
De Rong Investment Co.,
Ltd.:
None
Note 1: For the directors and supervisors meeting any of the following situations two years before being elected and during
their term of office, please write “” in the appropriate corresponding boxes.
(1) Not an employee of the Company or any of its affiliates;
(2) Not a director or supervisor of the Company or any of its affiliates (the same does not apply, however, in cases
where the person is an independent director of the Company or its parent company, which directly or indirectly
holds more than 50% voting shares of the subsidiary);
(3) Not a natural-person shareholder or holder of shares, together with those held by a spouse, minor children, or
held by the person under other names, in an aggregate amount of one percent or more of the total number of
issued shares of the company or ranking within the top 10 in holdings;
(4) Not a spouse, relative within the third degree of kinship, or lineal relative within the fifth degree of kinship, of
any of the persons mentioned in the above three paragraphs;
(5) Not a director, supervisor, or employee of a corporate/institutional shareholder that indirectly holds five percent
or more of the total number of issued shares of the Company or ranks as its top five shareholders;
(6) Not a director, supervisor, officer, or shareholder holding five percent or more of the shares of a specified
company or institution that has a financial or business relationship with the Company;
(7) Not a professional individual who, or an owner, partner, director, supervisor, or officer of a sole proprietorship,
partnership, company, or institution that, provides commercial, legal, financial, accounting services or

15
consultation to the company or to any affiliate of the company, or a spouse thereof, provided that this restriction
does not apply to any member of the compensation committee who exercises powers pursuant to Article 7 of the
“Regulations Governing the Establishment and Exercise of Powers of Compensation Committees of Companies
whose Stock is Listed on the TWSE or Traded on the GTSM”;
(8) Not having a marital relationship with, or not a relative within the second degree of kinship of any other director
of the Company;
(9) Not under any circumstances as noted in Article 30 of Company Act.
(10) Not a governmental, juridical person or its representative as defined in Article 27 of Company Act.
4. Implementation status of board member diversity policy:
(1) The Company is aware and convinced that board diversity will enhance the Company's
operational performance and management efficiency. Therefore, when setting up board
members, the diversification of board members is considered from various aspects, including
but not limited to gender, age, culture and educational background, race, professional
experience, skills, knowledge, and service term. The board members are all appointed with
meritocratic principles. The candidates are considered under objective conditions to take fully
into account the importance of board members diversity.
(2) Implementation of board member diversity:
Core item of
diversity
Director name
Gender Accounting
and
financial
analysis
skills
Operational
and
management
skills
Crisis
management
capability
Leadership Decision-making
ability Global
market
outlook
Industrial
knowledge
Chairman
Chen-Cheng
Pan Male
Director
Representative,
Topco
Development
Co., Ltd.:
Chun-Chien
Wang
Male
Director
Juo-pei Wang Female
Director
Representative,
Shin-Etsu
Chemical Co.,
Ltd.:
Tadaki Inoue
Male
Director
Chun-Ming
Weng Male
Independent
director
Chiung-Shin
Wu
Male
Independent
director
Ming-Hui
Guo
Male

16
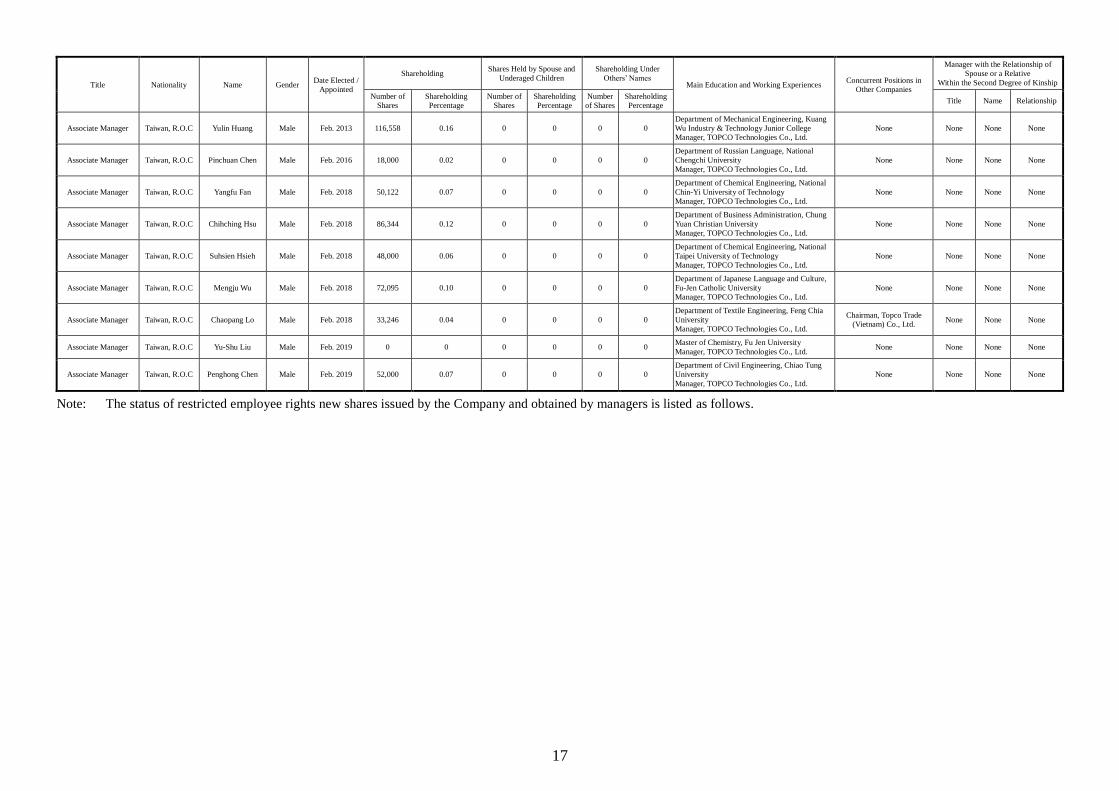
(II) Information of general managers, deputy general managers, associates, managers of various departments and branches:
April 2, 2019
Title Nationality Name Gender Date Elected /
Appointed
Shareholding Shares Held by Spouse and
Underaged Children
Shareholding Under
Others’ Names Main Education and Working Experiences
Concurrent Positions in
Other Companies
Manager with the Relationship of
Spouse or a Relative
Within the Second Degree of Kinship
Number of
Shares
Shareholding
Percentage
Number of
Shares
Shareholding
Percentage
Number
of Shares
Shareholding
Percentage Title Name Relationship
Chief Executive Officer Taiwan, R.O.C Sheng-Ho Chang Male Jan. 2017 298,299 0.40 0 0 0 0
Engineering PhD. of Gunma University, Japan
Manager and Associate Manager, TOPCO
Technologies Co., Ltd.
General Manager, Taiwan Business Headquarter,
TOPCO Technologies Co., Ltd.
Supervisor, TOPCO
(Guangzhou) Trading Co.,
Ltd.
Supervisor, TOPCO Trading
(Shanghai Pudong District)
Co., Ltd.
None None None
Deputy CEO Taiwan, R.O.C Wen-Hua Tsai Male Jan. 2017 224,999 0.30 93,771 0.13 0 0
Department of Textile, National Taipei Institute
of Technology
Manager and Associate Manager, TOPCO
Technologies Co., Ltd.
Deputy General Manager, TOPCO Technologies
Co., Ltd.
Supervisor, TOPGLOW
Trading Co., Ltd. None None None
South China Business
Headquarters
-Chairman, TOPCO
(Guangzhou) Trading
Co., Ltd.
Taiwan, R.O.C Ching-Hung Lin Male Jan. 2011 417,073 0.56 1,187 0 0 0
Department of Agricultural Chemistry, National
Chung Hsing University
Manager and Associate Manager, TOPCO
Technologies Co., Ltd.
None None None None
General Manager,
Taiwan Business
Headquarters
Taiwan, R.O.C Fu-Jen Cheng Male Jan. 2017 468,688 0.63 28,221 0.04 0 0
Department of Medicine and Applied Chemistry,
Kaohsiung Medical University
EMBA, National Taiwan University
Manager and Associate Manager, TOPCO
Technologies Co., Ltd.
Deputy General Manager, TOPCO Technologies
Co., Ltd.
None None None None
CFO Taiwan, R.O.C Kun-Ming Wu Male Jan. 2010 268,985 0.36 69,742 0.09 0 0
MBA in Finance, National Taiwan University
Securities Investment Department, Cathay Life
Insurance
Manager, Capital Market Division of Taiwan
Securities Co., Ltd.
Security Analyst
Financial and Accounting Manger, TOPCO
Technologies Co., Ltd.
Director, Topco
Development Co., Ltd.
Director, TOPGLOW
Trading Co., Ltd.
Supervisor, Vitalizing
Engineering Construction
Co., Ltd.
None None None
Executive Assistant for
Chairman Taiwan, R.O.C Ching-Hsiung Wen Male Jan. 2017 92,244 0.12 1,320 0 0 0
Department of Economics, Wako University, JP
Associate, Deputy General Manager, Sales
Director, and Deputy CEO, TOPCO
Technologies Co., Ltd.
Chairman, TOPCO Trading
(Shanghai Pudong District)
Co., Ltd.
Chairman, Topco Trade
(Indonesia) Co., Ltd.
None None None
Executive Assistant for
Chairman Taiwan, R.O.C Chung-Yen Wang Male Oct. 2018 148,080 0.20 0 0 0 0
Department of Business Administration,
Tamkang University
Manager ,Associate Manager and General
Manager, East China Business Headquarters,
TOPCO Technologies Co., Ltd.
None. None None None
General Manager, South
China Business
Headquarters
Taiwan, R.O.C Ming-Tso Hsiao Male Feb.2019 86,000 0.12 0 0 0 0
Department of Chemistry, Soochow University
Manager ,Associate Manager and Deputy
Manager, South China Business Headquarters,
TOPCO Technologies Co., Ltd.
Director, TOPCO
(Guangzhou) Trading Co.,
Ltd.
None None None
General Manager, East
China Business
Headquarters
Taiwan, R.O.C Tsai-Meng Wang Male Oct. 2018 109,685 0.15 5,624 0.01 0 0
Department of Business Management, Tokyo
International University
Manager and Associate Manager and Deputy
Manager, East China Business Headquarters,
TOPCO Technologies Co., Ltd.
Director, TOPCO Trading
(Shanghai Pudong District)
Co., Ltd.
Deputy General
Manager, East China
Business Headquarters
Taiwan, R.O.C Liang-Hsin Hsieh Male Feb. 2018 50,000 0.07 0 0 0 0
Department of Business Management,
University of Asia, JP
Manager and Associate Manager, TOPCO
Technologies Co., Ltd.
None
Associate Manager Taiwan, R.O.C Pin-Nan Liao Male Jan. 2012 55,400 0.07 4,800 0.01 0 0 Department of Tourism, Ming Chuan University
Manager, TOPCO Technologies Co., Ltd. None None None None
17
Title Nationality Name Gender Date Elected /
Appointed
Shareholding Shares Held by Spouse and
Underaged Children
Shareholding Under
Others’ Names Main Education and Working Experiences
Concurrent Positions in
Other Companies
Manager with the Relationship of
Spouse or a Relative
Within the Second Degree of Kinship
Number of
Shares
Shareholding
Percentage
Number of
Shares
Shareholding
Percentage
Number
of Shares
Shareholding
Percentage Title Name Relationship
Associate Manager Taiwan, R.O.C Yulin Huang Male Feb. 2013 116,558 0.16 0 0 0 0
Department of Mechanical Engineering, Kuang
Wu Industry & Technology Junior College
Manager, TOPCO Technologies Co., Ltd.
None None None None
Associate Manager Taiwan, R.O.C Pinchuan Chen Male Feb. 2016 18,000 0.02 0 0 0 0
Department of Russian Language, National
Chengchi University
Manager, TOPCO Technologies Co., Ltd.
None None None None
Associate Manager Taiwan, R.O.C Yangfu Fan Male Feb. 2018 50,122 0.07 0 0 0 0
Department of Chemical Engineering, National
Chin-Yi University of Technology
Manager, TOPCO Technologies Co., Ltd.
None None None None
Associate Manager Taiwan, R.O.C Chihching Hsu Male Feb. 2018 86,344 0.12 0 0 0 0
Department of Business Administration, Chung
Yuan Christian University
Manager, TOPCO Technologies Co., Ltd.
None None None None
Associate Manager Taiwan, R.O.C Suhsien Hsieh Male Feb. 2018 48,000 0.06 0 0 0 0
Department of Chemical Engineering, National
Taipei University of Technology
Manager, TOPCO Technologies Co., Ltd.
None None None None
Associate Manager Taiwan, R.O.C Mengju Wu Male Feb. 2018 72,095 0.10 0 0 0 0
Department of Japanese Language and Culture,
Fu-Jen Catholic University
Manager, TOPCO Technologies Co., Ltd.
None None None None
Associate Manager Taiwan, R.O.C Chaopang Lo Male Feb. 2018 33,246 0.04 0 0 0 0
Department of Textile Engineering, Feng Chia
University
Manager, TOPCO Technologies Co., Ltd.
Chairman, Topco Trade
(Vietnam) Co., Ltd. None None None
Associate Manager Taiwan, R.O.C Yu-Shu Liu Male Feb. 2019 0 0 0 0 0 0 Master of Chemistry, Fu Jen University
Manager, TOPCO Technologies Co., Ltd. None None None None
Associate Manager Taiwan, R.O.C Penghong Chen Male Feb. 2019 52,000 0.07 0 0 0 0
Department of Civil Engineering, Chiao Tung
University
Manager, TOPCO Technologies Co., Ltd.
None None None None
Note: The status of restricted employee rights new shares issued by the Company and obtained by managers is listed as follows.
18
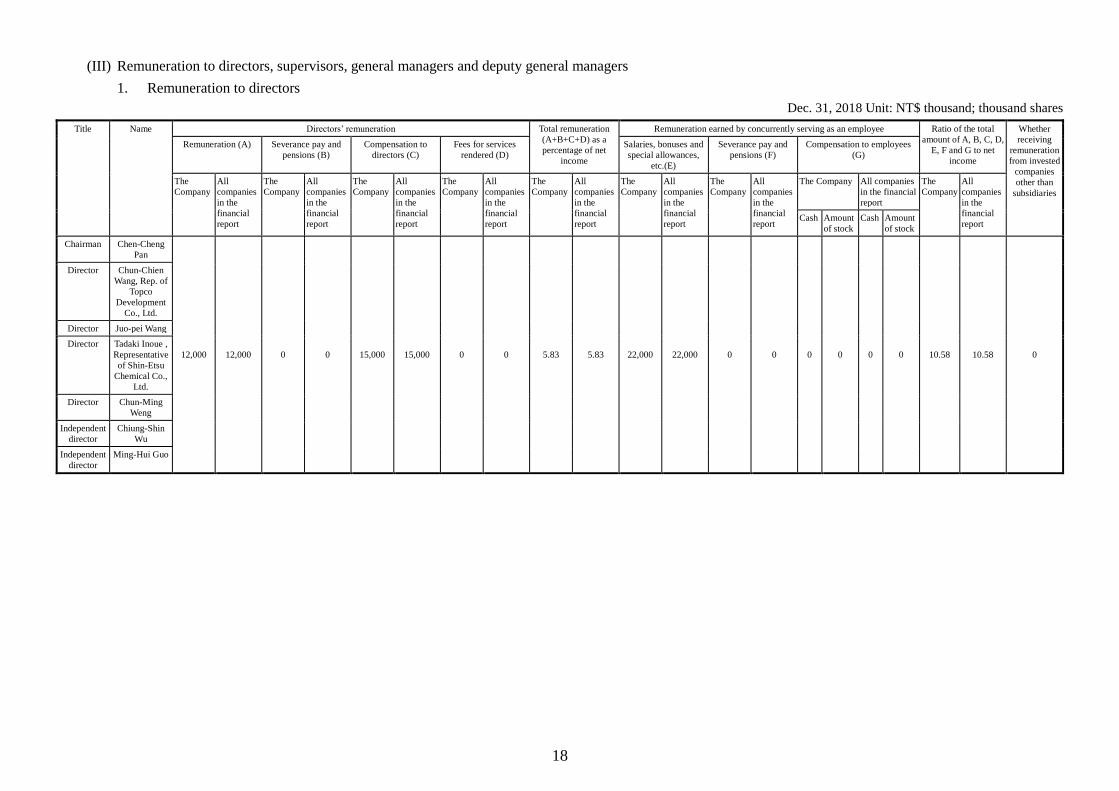
(III) Remuneration to directors, supervisors, general managers and deputy general managers
1. Remuneration to directors
Dec. 31, 2018 Unit: NT$ thousand; thousand shares Title Name Directors’ remuneration Total remuneration
(A+B+C+D) as a
percentage of net
income
Remuneration earned by concurrently serving as an employee Ratio of the total
amount of A, B, C, D,
E, F and G to net
income
Whether
receiving
remuneration
from invested
companies
other than
subsidiaries
Remuneration (A) Severance pay and
pensions (B)
Compensation to
directors (C)
Fees for services
rendered (D)
Salaries, bonuses and
special allowances,
etc.(E)
Severance pay and
pensions (F)
Compensation to employees
(G)
The
Company
All
companies
in the
financial
report
The
Company
All
companies
in the
financial
report
The
Company
All
companies
in the
financial
report
The
Company
All
companies
in the
financial
report
The
Company
All
companies
in the
financial
report
The
Company
All
companies
in the
financial
report
The
Company
All
companies
in the
financial
report
The Company All companies
in the financial
report
The
Company
All
companies
in the
financial
report Cash Amount
of stock
Cash Amount
of stock
Chairman Chen-Cheng
Pan
12,000 12,000 0 0 15,000 15,000 0 0 5.83 5.83 22,000 22,000 0 0 0 0 0 0 10.58 10.58 0
Director Chun-Chien
Wang, Rep. of
Topco
Development
Co., Ltd.
Director Juo-pei Wang
Director Tadaki Inoue ,
Representative
of Shin-Etsu
Chemical Co.,
Ltd.
Director Chun-Ming
Weng
Independent
director
Chiung-Shin
Wu
Independent
director
Ming-Hui Guo

19
Table of Remuneration Range
Range of the Remuneration Paid to Each Director of the
Company
Director name
Total remuneration (A+B+C+D) Total remuneration
(A+B+C+D+E+F+G)
The Company
From All
Consolidated
Entities G
The Company
From All
Consolidated
Entities H
< NT$ 2,000,000
Juo-pei Wang,
Tadaki Inoue ,
Chiung-Shin Wu,
Ming-Hui Guo
″
Juo-pei Wang,
Tadaki Inoue ,
Chiung-Shin Wu,
Ming-Hui Guo
″
NT$ 2,000,000 (inclusive) ~ NT$ 5,000,000 (exclusive)
NT$ 5,000,000 (inclusive) ~ NT$ 10,000,000 (exclusive)
Chun-Ming
Weng,
Chun-Chien
Wang
NT$ 10,000,000 (inclusive) ~ NT$ 15,000,000 (exclusive) Chen-Cheng Pan ″
Chun-Ming
Weng,
Chen-Cheng Pan,
Chun-Chien
Wang
″
NT$ 15,000,000 (inclusive) ~ NT$ 30,000,000 (exclusive)
Total 7 7 7 7
Total remuneration paid to directors for the last two fiscal years as a percentage of net income
From the Company All companies in the financial
statements
2018 10.58% 10.58%
2017 12.94% 12.94%
2. Remuneration to Supervisors
Unit: NT$ thousand
Title Name
Supervisors’ remuneration The ratio of the total
amount of A, B, and C
to net income Whether
receiving
remuneration
from invested
companies other
than subsidiaries
Remuneration (A) Compensation (B) Fees for services rendered
(C)
The
Company
All companies in
the financial
report
The Company
All companies in
the financial
report
The
Company
All
companies
in the
financial
report
The
Company
All
companies
in the
financial
report
Supervisor Chung-Sheng
Lin
0 0 3,000 3,000 0 0 0.65% 0.65% 0
Supervisor Chang-Wei Wu
Supervisor
Tzu-Cheng Chiu,
Rep. of De Rong
Investment Co.,
Ltd.

20
Table of Remuneration Range
Range of the Remuneration Paid to Each Director of the
Company
Name of Supervisors
Total Remuneration (A+B+C)
From the Company From All Consolidated Entities D
< NT$ 2,000,000 Chung-Sheng Lin, Chang-Wei Wu,
Tzu-Cheng Chiu
Chung-Sheng Lin, Chang-Wei Wu,
Tzu-Cheng Chiu
NT$ 2,000,000 (inclusive) ~ NT$ 5,000,000 (exclusive)
NT$ 5,000,000 (inclusive) ~ NT$ 10,000,000 (exclusive)
NT$ 10,000,000 (inclusive) ~NT$ 15,000,000 (exclusive)
Total 3 3
Total remuneration paid to supervisors for the last two fiscal years as a % of net income
From the Company All companies in the financial statements
2018 0.65% 0.65%
2017 0.51% 0.51%
Policy of the remuneration paid to directors and supervisors, standards and packages, procedures of
setting remuneration, and the linkage to operating performance and future risk exposure:
1. Remuneration policy, standards and packages:
(1) Remuneration paid to directors and supervisors is divided into base compensation, pensions,
fees for services rendered and earnings distributed.
2. Procedures of setting remuneration:
(1) Procedures of setting remuneration: Remuneration is referred to that of the relevant industry
and listed companies and then approved. An earnings distributed is 5% to 10% without 5%
higher than what is paid to directors and supervisors according to Article 23 of the Company's
Articles of Association. In case of accumulated loss of the company, the amount shall be
reserved to compensate for the amount, followed by calculating the compensation to
employees and directors based on the balance. Employee compensation can be stocks or cash,
and the parties to be distributed include the employees of the associate companies who satisfy
a certain criteria. The profit of the current year mentioned in Item 1 refers to the pre-tax profit
of the year minus the compensation distributed to employee, directors and supervisors.
Distribution of compensation to employees, directors and supervisors shall be agreed by the
Board of Directors with more than two-thirds of directors attending and resolved by more than
a half of the attending directors, and shall be reported to the Shareholders’ Meeting. The
company determines the pension for senior management personnel in accordance with the
Rules for Retirement. The determined quota shall be submitted to the Remuneration
Committee for discussion in accordance with the regulations.
3. The linkage to operating performance and future risk exposure:
(1) Since compensation is referred to the current year's surplus, it is highly correlated with the
Company's operating performance.

21
(2) Remuneration paid to the Company’s directors and supervisors refers but not limits to the
Company’s past operating performance. The standards, structure and system will also be
adjusted accordingly on the basis of future risks. That is, remuneration paid to directors and
supervisors will be decreased when economic recession is expected or the risk of operation is
lifted. It shall also be adjusted depending on the evaluation of directors’ performance. For
example, the attendance of the board of directors, training situation, participation in company
accounting and financial situation, audit reports, participation in company management, and
accomplishment are thoroughly considered to seek the balance between sustainable operation
and risk management.
3. Remuneration to General Managers and Deputy General Managers
Unit: NT$ thousand; thousand shares
Title Name
Salary (A) Severance pay and
pensions (B) Bonus and special
allowances (C) Amount of employee compensation (D)
(Estimated) Total remuneration (A+B+C+D) as a
percentage of Net Income (%) (Note1)
Whether receiving remuneration from
invested companies other than subsidiaries The
Company
All
companies
in the financial
statements
The
Company
All
companies
in the financial
statements
The
Company
All
companies
in the financial
statements
From the Company
All companies in
the financial
statements The Company All companies in the
financial statements Cash
bonuses
Stock
bonuses
Cash
bonuses
Stock
bonuses
Chief Executive Officer Sheng-Ho
Chang
10,740 10,740 0 0 24,400 24,400 10,000 0 10,000 0 9.74 9.74 0
Deputy CEO Wen-Hua
Tsai
General Manager, Taiwan Business
Headquarters
Fu-Jen Cheng
General Manager,
South China Business
Headquarters
Ming-Tso
Hsiao
General Manager, East
China Business
Headquarters
Tsai-Meng
Wang
Deputy General
Manager, East China
Business Headquarters
Liang-Hsin
Hsieh
Table of Remuneration Range
Range of the compensation paid to each general
manager and deputy general manager of the
Company
Name of general managers and deputy general managers
From the Company From All Consolidated Entities (D)
< NT$ 2,000,000
NT$ 2,000,000 (inclusive) ~ NT$ 5,000,000
(exclusive) ″
NT$ 5,000,000 (inclusive) ~ NT$ 10,000,000
(exclusive)
Sheng-Ho Chang,
Wen-Hua Tsai, Fu-Jen Cheng
Liang-Hsin Hsieh, Ming-Tso
Hsiao, Tsai-Meng Wang
″
NT$ 10,000,000 (inclusive) ~ NT$ 15,000,000
(exclusive) ″
NT$ 15,000,000 (inclusive) ~ NT$ 30,000,000
(exclusive)
Total 6 6
Total remuneration paid to general managers and deputy general managers as a percentage of net Income
From the Company All companies in the financial statements
2018 9.74% 9.74%
2017 14.75% 14.75%
Note:The number of employees above the rank of the vice manager decreased after 2018. Hence, the total
amount of remuneration in the net profit ratio decreased sigfnicantly.

22
Policy of the remuneration paid to directors and supervisors, standards and packages, procedures of
setting remuneration, and the linkage to operating performance and future risk exposure:
1. Remuneration policy, standards and packages:
(1) The remuneration paid to general managers and deputy general managers is divided into fixed
salary and variable salary. Fixed salary is the monthly salary regardless of a profit or loss;
variable salary is the compensation granted to employees, business development reward and
year-end performance bonus, and the amount depends on the Company’s profitability and
performance review.
(2) The total compensation paid to general managers and deputy general managers is based on the
factors such as job responsibility, contribution to the Company’s operation, overall
environment and market level, etc., on the purpose of setting a reward which is sufficient to
reflect working performance.
2. Procedures of setting remuneration:
(1) The employee bonus of earnings distributed is 5% to 10% without 5% higher than the
compensation paid to directors and supervisors according to Article 23 of the Company's
Articles of Association. In case of accumulated loss of the company, the amount shall be
reserved to compensate for the amount, followed by calculating the compensation to
employees and directors based on the balance. Employee compensation can be stocks or cash,
and the parties to be distributed include the employees of the associate companies who satisfy
a certain criteria. The profit of the current year mentioned in Item 1 refers to the pre-tax profit
of the year minus the compensation distributed to employee, directors and supervisors.
Distribution of compensation to employees, directors and supervisors shall be agreed by the
Board of Directors with more than two-thirds of directors attending and resolved by more than
a half of the attending directors, and shall be reported to the Shareholders’ Meeting.
(2) The Company determines the year-end performance bonus quota based on annual operating
performance. The determined quota regardless of year-end performance bonuses or employee
compensation shall be submitted to the Remuneration Committee for discussion.
3. The linkage to operating performance and future risk exposure:
(1) Employees compensation and year-end performance bonuses are referred to the earnings of
current year and are therefore highly correlated with the Company's operating performance.
(2) The Company’s remuneration paid to general managers and deputy general managers refers
but not limits to the relevant industry standards and the Company’s past operating performance.
The standards, structure and system will also be adjusted in time based on operating status and
relevant laws and regulations. The Company is forbidden to guide managers to pursue
remuneration by engaging in behaviors beyond the Company’s risk, in order to seek the
balance between sustainable operation and risk management.

23
(IV) Name of managers receiving employee compensation and the distribution status (Note)
Unit: NT$ thousand
Title Name
Cash bonuses Stock bonuses
Total
Total amount as a
percentage of net income (%) Amount
Number of
Shares
Market
price Amount
Man
ager
Chief Executive
Officer Sheng-Ho Chang
22,000 0 0 0 22,000 4.75%
Deputy CEO Wen-Hua Tsai
South China Business
Headquarters
-Chairman, TOPCO
(Guangzhou)
Trading Co., Ltd.
Ching-Hung Lin
General Manager, Taiwan Business
Headquarters
Fu-Jen Cheng
General Manager,
East China
Business Headquarters
Tsai-Meng Wang
General Manager,
South China
Business Headquarters
Ming-Tso Hsiao
CFO Kun-Ming Wu
Executive
Assistant for
Chairman
Ching-Hsiung Wen
Executive Assistant for
Chairman
Chung-Yen Wang
Deputy General
Manager, East China Business
Headquarters
Liang-Hsin Hsieh
Associate
Manager Pin-Nan Liao
Associate
Manager Yu-Lin Huang
Associate Manager
Pin-Chuan Chen
Associate
Manager Yang-Fu Fan
Associate
Manager Chih-Ching Hsu
Associate
Manager Su-Hsien Hsieh
Associate Manager
Meng-Ju Wu
Associate
Manager Chao-Pang Lo
Associate
Manager Yu-Shu Liu
Associate
Manager Peng-Hong Chen
Note: The employee compensation is an estimated figure.
The comparison of the remuneration paid from the Company and from all consolidated entities to Company’s
directors, supervisors, general managers and deputy general managers for the latest two years:
The total remuneration paid from the Company and all consolidated entities to Company’s directors, supervisors,
general managers and deputy general managers for the latest two years as a percentage of net income is as below:
20.97% for 2018 and 28.20% for 2017. The annual remuneration ratio in 2018 decreased. Other than the absolute
increase in profit in 2018, the number of employees above the rank of the vice manager in 2018 decreased.

24
(V) Information of Top 10 compensation granted to employees of the Company:
December 31, 2018 Unit: NT$ thousands
Name Title
Amount of the Company’s employee compensation
Cash bonuses
(Note)
Stock bonuses
Number of
Shares Market price Amount
Sheng-Ho Chang Chief Executive Officer
16,000
0 0 0
Wen-Hua Tsai Deputy CEO 0 0 0
Ching-Hung Lin
South China Business
Headquarters -Chairman,
TOPCO (Guangzhou) Trading
Co., Ltd.
0 0 0
Fu-Jen Cheng General Manager, Taiwan
Business Headquarters 0 0 0
Tsai-Meng Wang General Manager, East China
Business Headquarters 0 0 0
Ming-Tso Hsiao General Manager, South China
Business Headquarters 0 0 0
Kun-Ming Wu CFO 0 0 0
Ching-Hsiung Wen Executive Assistant for
Chairman 0 0 0
Chung-Yen Wang Executive Assistant for
Chairman 0 0 0
Liang-Hsin Hsieh Deputy General Manager, East
China Business Headquarters 0 0 0
Note: Cash bonuses are estimated figures.
3.3 Corporate governance operations:
(I) Operation status of board meetings: Number of meetings, attendance rate of each director, objectives and
execution of strengthening the function of the Board of Directors during the current and the most recent
years
1. Information of the operation status of the Board of Directors
In 2018 and 2019, until the date on which the annual report was printed, there were 8 meetings in
total (A), and the participation status of directors and supervisors is listed below:
Title Name Attendance
in person (B) By proxy
Attendance rate in
person [B/A]% Notes
Chairman Chen-Cheng Pan 8 0 100% None
Director Chun-Chien Wang,
Rep. of Topco
Development Co., Ltd. 0 8 0%
Delegate other
directors to attend
Director Juo-pei Wang 8 0 100% None
Director Tadaki Inoue , Rep. of
Shin-Etsu Chemical
Co., Ltd. 1 7 13%
Delegate other
directors to attend
Director Chun-Ming Weng 8 0 100% None
Independent director Chiung-Shin Wu 4 4 50% Delegate other
independent
directors to attend
Independent director Ming-Hui Guo 8 0 100% None
Supervisor Chung-Sheng Lin 7 0 88% None
Supervisor Chang-Wei Wu 7 0 88% None
Supervisor Tzu-Cheng Chiu, Rep.
of De Rong Investment
Co., Ltd. 8 0 100% None

25
Other items that shall be recorded:
I. If one of the following situations occurs during the board meetings, the date, period, contents of the proposal, opinions of
all the independent directors and the Company’s corresponding actions should be clarified:
(I) Matters listed in Article 14-3 of Securities and Exchange Act
Board Meeting Summary of motions Independent director’s
opinions
Response to the independent
director’s opinons
The 10th
meeting
of the 9 th
term.
2018/03/26
The earnings distribution of 2017. Approved as proposed To be executed in accordance
with the resolution reached.
To discuss the compensation to
directors, supervisor and managers and
adjust the salaries of 2018.
Approved as proposed To be executed in accordance
with the resolution reached.
Amendment the Articles of
Incorporation and Rules of Procedure
for Shareholder Meetings.
Approved as proposed To be executed in accordance
with the resolution reached.
The 14th
meeting
of the 9 th
term.
2018/09/17
The incapitalization of TOPCO
TOPCO Trading (Shanghai Pudong
District) Co., Ltd and TOPCO
(Guangzhou) Trading Co., Ltd.
Approved as proposed
To be executed in accordance
with the resolution reached.
The 17th
meeting
of the 9 th
term.
2019/03/04
The earnings distribution of 2018. Approved as proposed To be executed in accordance
with the resolution reached.
To discuss the compensation to
directors, supervisor and managers and
adjust the salaries of 2019.
Approved as proposed To be executed in accordance
with the resolution reached.
Amendment the Operational
procedures for Acquisition and
Disposal of Assets
Approved as proposed To be executed in accordance
with the resolution reached.
To approve the new company secretary Approved as proposed To be executed in accordance
with the resolution reached.
To approve the Standard Operating
Procedures required by the Board of
Directors and the Company’s code of
governance practice.
Approved as proposed To be executed in accordance
with the resolution reached.
To discuss the candidates of the 10 th
directors (include independent
directors) and supervisors.
Approved as proposed To be executed in accordance
with the resolution reached.
(II) In addition to matters mentioned above, others that are opposed or reserved by the independent directors and have
records or written statements. The Company did not have any board meeting resolution matters that are opposed or
reserved by independent directors.
II. For the implementation status of director’s avoidance of conflict of interest, the director’s name, contents of the proposal,
reasons of avoidance of conflict of interest and participation in the voting are required to be clarified: The Company did
not have any situations regarding to director’s avoidance of conflict of interest.
26
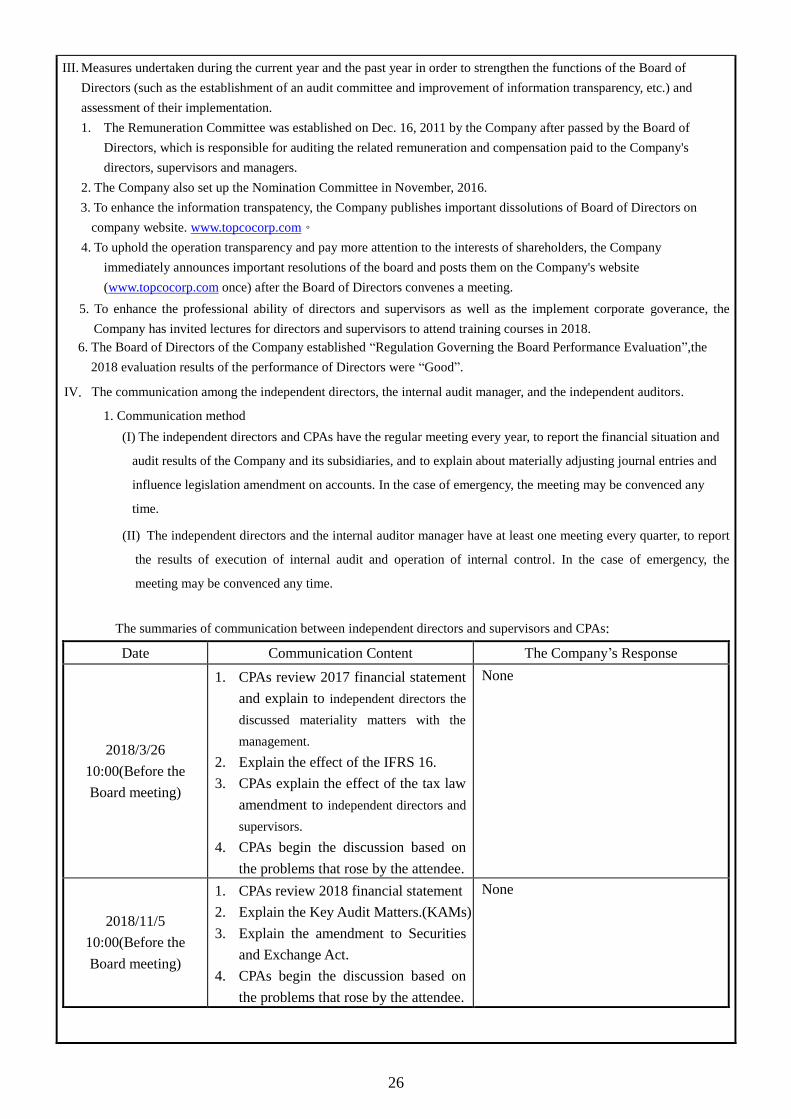
III. Measures undertaken during the current year and the past year in order to strengthen the functions of the Board of
Directors (such as the establishment of an audit committee and improvement of information transparency, etc.) and
assessment of their implementation.
1. The Remuneration Committee was established on Dec. 16, 2011 by the Company after passed by the Board of
Directors, which is responsible for auditing the related remuneration and compensation paid to the Company's
directors, supervisors and managers.
2. The Company also set up the Nomination Committee in November, 2016.
3. To enhance the information transpatency, the Company publishes important dissolutions of Board of Directors on
company website. www.topcocorp.com。
4. To uphold the operation transparency and pay more attention to the interests of shareholders, the Company
immediately announces important resolutions of the board and posts them on the Company's website
(www.topcocorp.com once) after the Board of Directors convenes a meeting.
5. To enhance the professional ability of directors and supervisors as well as the implement corporate goverance, the
Company has invited lectures for directors and supervisors to attend training courses in 2018.
6. The Board of Directors of the Company established “Regulation Governing the Board Performance Evaluation”,the
2018 evaluation results of the performance of Directors were “Good”.
IV. The communication among the independent directors, the internal audit manager, and the independent auditors.
1. Communication method
(I) The independent directors and CPAs have the regular meeting every year, to report the financial situation and
audit results of the Company and its subsidiaries, and to explain about materially adjusting journal entries and
influence legislation amendment on accounts. In the case of emergency, the meeting may be convenced any
time.
(II) The independent directors and the internal auditor manager have at least one meeting every quarter, to report
the results of execution of internal audit and operation of internal control. In the case of emergency, the
meeting may be convenced any time.
The summaries of communication between independent directors and supervisors and CPAs:
Date Communication Content The Company’s Response
2018/3/26
10:00(Before the
Board meeting)
1. CPAs review 2017 financial statement
and explain to independent directors the
discussed materiality matters with the
management.
2. Explain the effect of the IFRS 16.
3. CPAs explain the effect of the tax law
amendment to independent directors and
supervisors.
4. CPAs begin the discussion based on
the problems that rose by the attendee.
None
2018/11/5
10:00(Before the
Board meeting)
1. CPAs review 2018 financial statement
2. Explain the Key Audit Matters.(KAMs)
3. Explain the amendment to Securities
and Exchange Act.
4. CPAs begin the discussion based on
the problems that rose by the attendee.
None
27
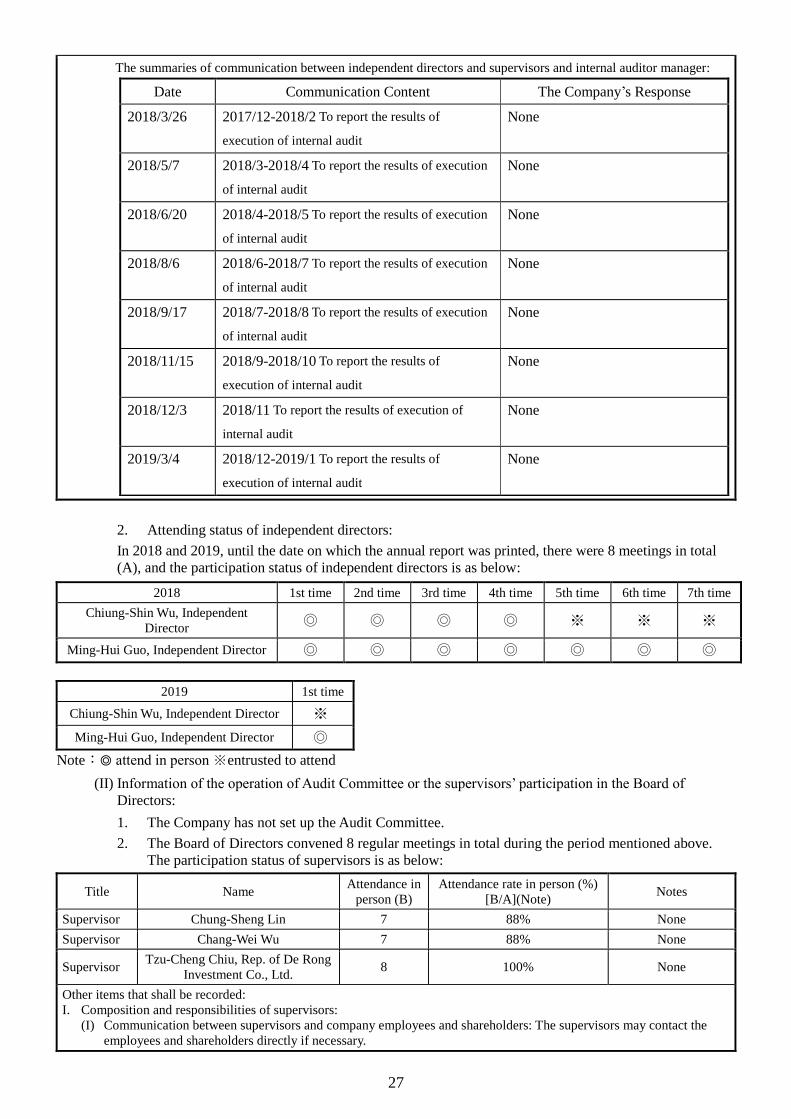
The summaries of communication between independent directors and supervisors and internal auditor manager:
Date Communication Content The Company’s Response
2018/3/26 2017/12-2018/2 To report the results of
execution of internal audit
None
2018/5/7 2018/3-2018/4 To report the results of execution
of internal audit
None
2018/6/20 2018/4-2018/5 To report the results of execution
of internal audit
None
2018/8/6 2018/6-2018/7 To report the results of execution
of internal audit
None
2018/9/17 2018/7-2018/8 To report the results of execution
of internal audit
None
2018/11/15 2018/9-2018/10 To report the results of
execution of internal audit
None
2018/12/3 2018/11 To report the results of execution of
internal audit
None
2019/3/4 2018/12-2019/1 To report the results of
execution of internal audit
None
2. Attending status of independent directors:
In 2018 and 2019, until the date on which the annual report was printed, there were 8 meetings in total
(A), and the participation status of independent directors is as below:
2018 1st time 2nd time 3rd time 4th time 5th time 6th time 7th time
Chiung-Shin Wu, Independent
Director ◎ ◎ ◎ ◎ ※ ※ ※
Ming-Hui Guo, Independent Director ◎ ◎ ◎ ◎ ◎ ◎ ◎
2019 1st time
Chiung-Shin Wu, Independent Director ※
Ming-Hui Guo, Independent Director ◎
Note:◎ attend in person ※entrusted to attend
(II) Information of the operation of Audit Committee or the supervisors’ participation in the Board of
Directors:
1. The Company has not set up the Audit Committee.
2. The Board of Directors convened 8 regular meetings in total during the period mentioned above.
The participation status of supervisors is as below:
Title Name Attendance in
person (B) Attendance rate in person (%)
[B/A](Note) Notes
Supervisor Chung-Sheng Lin 7 88% None
Supervisor Chang-Wei Wu 7 88% None
Supervisor Tzu-Cheng Chiu, Rep. of De Rong
Investment Co., Ltd. 8 100% None
Other items that shall be recorded:
I. Composition and responsibilities of supervisors:
(I) Communication between supervisors and company employees and shareholders: The supervisors may contact the
employees and shareholders directly if necessary.

28
(II) Communication between supervisors, internal auditor manager and CPA:
1.The internal auditor manager attends the board meeting and makes a report. The supervisors have no objections.
2. The supervisor appoints the CPA to review the financial statement and prepares the review report.
3. The supervisor and the internal auditor manager irregularly communicate with the CPA face-to-face or via
tele-conference on the financial and business status.
II. If a supervisor attends the board meeting and makes a statement, the date, period, contents of the proposal, resolutions of
the board, and the Company's handling of the opinions expressed by the supervisor shall be clarified: If the Company’s
supervisors attend the board meeting and make a statement, all the statements will be recorded in the board meeting
handbook.
(1) Information about Remuneration Committee members
Identity
(Note 1)
Criteria
Name
Whether or not have at least 5 years
of working experience
and the following professional
qualifications
Status of independence (Note
2)
Number of public
companies
where the person holds
the title as a
member of Remuneration
Committee
Notes (Note 3)
The End
Lecturer or
above in commerce,
law,
finance, accounting
or subjects
required by the business
of the
Company in public or
private
colleges or universities
Judge, public
prosecutor, attorney-at-law,
certified public
accountant, or other
professional or
technical specialist who
has passed a
national examination and
been awarded a
certificate in a profession
necessary for the
business of the Company.
Required
work
experience in
commerce,
law, finance,
accounting
or others required by
the
business of the
Company
1 2 3 4 5 6 7 8
Independent
director Chiung-Shin
Wu None
Independent
director Ming-Hui
Guo None
Others Shoulu
Chang 1
Note 1: Please fill in director, independent director or other in the identification.
Note 2: For members who meet any of the following situations during the two years before being elected and during the term
of office, please tick the appropriate corresponding boxes with “”.
(1) Not an employee of the Company or any of its affiliates
(2) Not a director or supervisor of the company or any of its affiliates. The same does not apply, however, in cases
where the person is an independent director of the Company or its parent company, which directly or indirectly
holds more than 50% voting shares of the subsidiary.
(3) Not a natural-person shareholder or holder of shares, together with those held by a spouse, minor children, or
held by the person under other names, in an aggregate amount of one percent or more of the total number of
issued shares of the company or ranking within the top 10 in holdings;
(4) Not a spouse, relative within the second degree of kinship, or lineal relative within the third degree of kinship,
of any of the above persons mentioned in the above three paragraphs;
(5) Not a director, supervisor, or employee of a corporate/institutional shareholder that indirectly holds five percent
or more of the total number of issued shares of the Company or ranks as its top five shareholders;
(6) Not a director, supervisor, manager or shareholder holding five percent or more of the shares of a specified
company or institution that has a financial or business relationship with the Company;
(7) Not a professional individual, or the owner, partner, director, supervisor, manager and spouse of a sole
proprietorship, partnership, company, or institution, who provides commercial, legal, financial, accounting
services or consultation to the Company or to any of its affiliates.
(8) Not under any circumstances as noted in Article 30 of Company Act.
Note 3: If the member is also a director, please describe whether he or she also meets the regulation requirement of Item 5,
Article 6 of the “Regulations Governing the Appointment and Exercise of Powers by the Remuneration Committee of
a Company Whose Stock is Listed on the Stock Exchange or Traded Over the Counter.”

29
Note 4: The responsibilities of Remuneration Committee:
The Remuneration Committee shall pay attention as good managers and faithfully perform the following functional
powers and submit recommendations to the Board of Directors for discussion.
(1) The Remuneration Committee shall pay attention as good managers and faithfully perform the following
functional powers and submit recommendations to the Board of Directors for discussion.
(2) Set up and regularly review the evaluation standard for the performance of the Company’s directors, supervisors,
and managers, the annual and long-term performance goals, and the remuneration policy, system, standard, and
structure.
(3) Regularly evaluate the performance accomplishment of the Company’s directors, supervisors, and managers and
set individual remuneration contents and amounts based on the evaluation results obtained through the
performance evaluation standard.
(4) Ensure the Company’s remuneration arrangements are in line with relvant laws and regulations and are sufficient
in attracting outstanding talents.
(5) The evaluation of the performance of directors, supervisors, and mangers and remuneration shall be in reference to
usual payment standards of others in the same line of work. Additionally, personal performance evaluation results,
input time, job duties undertaken, personal goal accomplishment, performance serving other posts, and
remunerations given by the Company to those holding the same posts in recent years are taken into account.
Through the Company’s short-term and long-term business goal accomplishment and financial situation, the
connection and reasonability of personal performance, the Company’s business performance, and future risks are
evaluated.
(6) Directros and managers shall not engage in conducts that violate the risk appetite in the pursuit of remunerations.
(7) Targeting the ratios of directors and senior managers’ sohrt-term performance-based remunerations and partially
changed remuneration payment time, the industry’s characteristics and the Company’s business nature shall be
taken into consideration during decision-making.
(8) Set up the contents and amonuts of remunerations for the directors, supervisors, and managers, taking into account
their reasonability. Decisions on remunerations for directros, supervisors, and mangers shall not seriously
contradict fincial performance. In the event of major profits, decline or long-term losses, remunerations are not to
be higher than the previous year; if they are higher than the previous year, a descritipion of their reasonability shall
be disclosed in the annual report and shall be reported at the Board of Directors Meeting.
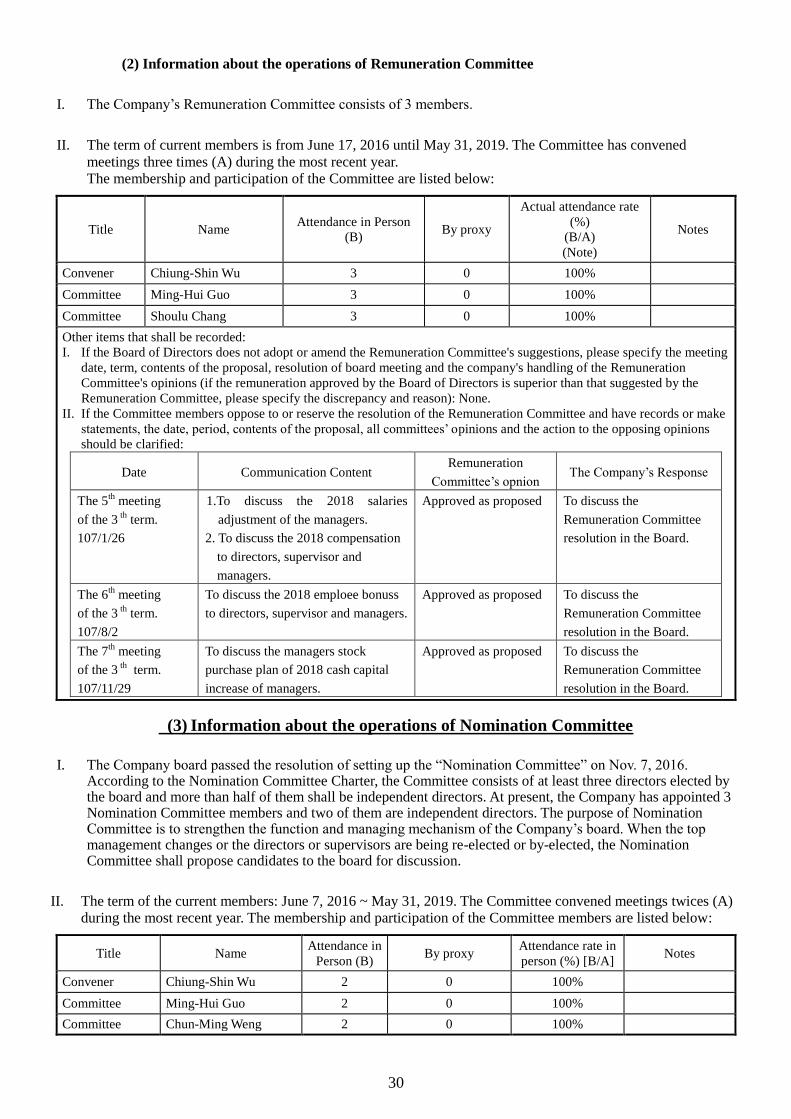
30
(2) Information about the operations of Remuneration Committee
I. The Company’s Remuneration Committee consists of 3 members.
II. The term of current members is from June 17, 2016 until May 31, 2019. The Committee has convened
meetings three times (A) during the most recent year.
The membership and participation of the Committee are listed below:
Title Name Attendance in Person
(B) By proxy
Actual attendance rate
(%)
(B/A)
(Note)
Notes
Convener Chiung-Shin Wu 3 0 100%
Committee Ming-Hui Guo 3 0 100%
Committee Shoulu Chang 3 0 100%
Other items that shall be recorded:
I. If the Board of Directors does not adopt or amend the Remuneration Committee's suggestions, please specify the meeting
date, term, contents of the proposal, resolution of board meeting and the company's handling of the Remuneration
Committee's opinions (if the remuneration approved by the Board of Directors is superior than that suggested by the
Remuneration Committee, please specify the discrepancy and reason): None.
II. If the Committee members oppose to or reserve the resolution of the Remuneration Committee and have records or make
statements, the date, period, contents of the proposal, all committees’ opinions and the action to the opposing opinions
should be clarified:
Date Communication Content Remuneration
Committee’s opnion The Company’s Response
The 5th
meeting
of the 3 th
term.
107/1/26
1.To discuss the 2018 salaries
adjustment of the managers.
2. To discuss the 2018 compensation
to directors, supervisor and
managers.
Approved as proposed To discuss the
Remuneration Committee
resolution in the Board.
The 6th
meeting
of the 3 th
term.
107/8/2
To discuss the 2018 emploee bonuss
to directors, supervisor and managers.
Approved as proposed To discuss the
Remuneration Committee
resolution in the Board.
The 7th
meeting
of the 3 th term.
107/11/29
To discuss the managers stock
purchase plan of 2018 cash capital
increase of managers.
Approved as proposed To discuss the
Remuneration Committee
resolution in the Board.
(3) Information about the operations of Nomination Committee
I. The Company board passed the resolution of setting up the “Nomination Committee” on Nov. 7, 2016. According to the Nomination Committee Charter, the Committee consists of at least three directors elected by the board and more than half of them shall be independent directors. At present, the Company has appointed 3 Nomination Committee members and two of them are independent directors. The purpose of Nomination Committee is to strengthen the function and managing mechanism of the Company’s board. When the top management changes or the directors or supervisors are being re-elected or by-elected, the Nomination Committee shall propose candidates to the board for discussion.
II. The term of the current members: June 7, 2016 ~ May 31, 2019. The Committee convened meetings twices (A)
during the most recent year. The membership and participation of the Committee members are listed below:
Title Name Attendance in
Person (B) By proxy
Attendance rate in
person (%) [B/A] Notes
Convener Chiung-Shin Wu 2 0 100%
Committee Ming-Hui Guo 2 0 100%
Committee Chun-Ming Weng 2 0 100%

31
(I) The state of the Company's implementation of corporate governance, any departure of such
implementation from the Corporate Governance Best-Practice Principles for TWSE/GTSM Listed
Companies, and the reason for any such departure
Item
Implementation Status Difference from the
Corporate Governance
Best-Practice Principles for
TWSE/GTSM Listed
Companies and the reasons
Yes No Summary
I. Does the company follow the
“Corporate Governance
Best-Practice Principles for
TWSE/GTSM Listed
Companies” to establish and
disclose its corporate governance
practices?
The Company has established a code of practice for
corporate governance and announced it on the
company website.
No obvious discrepancy.
II. Shareholding structure and
shareholders’ interests
(I) Does the company set up
internal operation
procedures for
recommendations, concerns,
disputes, and litigation
raised by shareholders, and
implement such matters in
accordance with the
procedures?
The Company has set up the position of
spokesperson and the Company's agent for stock
affairs, "Taishin International Bank's Stock Agency
Department" to handle the relevant issues and
suggestions from the shareholders. If any legal
issues are involved, the lawyers appointed by the
Company will be invited to assist.
No obvious discrepancy.
(II) Does the company have a
roster of its major, actual
controlling shareholders as
well as the ultimate
controllers?
The Financial Division has the control over the
roster of major actual controlling shareholders and
the ultimate controllers of the Company, and shall
apply for the stockholder declaration in accordance
with the Operational Procedures for Information
Reporting of TWSE/GTSM Listed Companies.
No obvious discrepancy.
(III) Has the company built and
executed risk management
and firewall system between
the Company and its
affiliates?
Both the Company and its affiliates are independent
business and financial operating entities. The
Company has established the “ Procedures for
Transaction with Related Parties, Specific
Companies and Groups.” The risk control
mechanisms and firewalls between related
companies have been properly built.
No obvious discrepancy.
(IV) Has the company
established internal rules
prohibiting insider trading
on undisclosed information?
The Company has set up the “Material Information
Management Procedure” to prohibit insiders from
exploiting undisclosed market information to buy
and sell securities, and has announced it on the
company website.
No obvious discrepancy.
III. Composition and responsibilities
of the Board of Directors
(I) Has the company
established a diversification
policy for the composition
of its Board of Directors and
implemented it accordingly?
The Company’s board has set up a board
diversification policy and announced it on the
company website. The relevant information can be
referred to the annual report.
No obvious discrepancy.
(II) Other than the
Compensation Committee
and the Audit Committee
which are established in
accordance with laws, does
the company plan to set up
other functional
committees?
The Company has set up the Nomination Committee
in November, 2016. The relevant information can be
referred to the annual report.
No obvious discrepancy.
(III) Has the company
established methodology for
evaluating the performance
of its Board of Directors on
the annual basis?
1. The Company has proposed the Regulations for
the Board Performance Evaluation and
conducted performance appraisals regularly. It
has also announced the results on the company
website.
2. The 2018 Board Performance Evaluation please
refers to Note 1.
No obvious discrepancy.

32
Item
Implementation Status Difference from the
Corporate Governance
Best-Practice Principles for
TWSE/GTSM Listed
Companies and the reasons
Yes No Summary
(IV) Does the company regularly
evaluate its auditor’s
independence?
The assigned accountants are not directors,
supervisors, executive fficers, emploees or
shareholders of the Company ot its affiliated
companies and have been confirmed as
non-stakeholders, which meets with the regulation
of independent judgment of government.The
company annually evaluate the specialization and
independence of CPAs. Also, the CPAs have
completed independent report for the appointed
auditing affair. (Please refer to Note2 for the CPAs
evaluation.)
No obvious discrepancy.
IV. Does the company established a
full-time (concurrent) corporate
governance unit or personnel to
be in charge of corporate
governance affairs (including but
not limited to providing
information required for business
execution by directors and
supervisors, handling matters
related to board meetings and
shareholders’ meetings in
accordance with laws, handling
corporate registration and
amendment registration, and
producing handbooks of board
meetings and shareholders
meetings, etc.)?
1. The Company’s chief financial officer
(Disclosed as the chief financial officer and
accountant on the public information observatory
by the Compayn, with the signature affixed in
the accountant column in line with the definition
of the manager). Since the Company’s listing in
2006, the officer has served in the Company for
more than ten years engaged in finance,
accounting, stock matters, board of directors and
share holders’ meetings, and other relvant
management work. The officer has had over
three years of experience in finance, stock
matters, or dliberation management work. The
Board of Directors appointed the chief financial
officer as the corporate governance director on
March 4th, 2019 and passed “Fiancial officers
shall serve as corporate governance officers
responsible for corporate governance related
matters.
2. The Company’s corporate goverance team is
responsible for implementing various
governance related matters, including board of
directors and shareholders’ meeting related
matters in accordance with the law, producing
board of directors and shareholders’ meeting
records, conducting company change
registration, regularly review and revise the
Company’s code of corporate goverance and
relevant guidlelines for compliance by the board
of directors and the Remuneration Committee
when executing data for business needs and in
compliance with relevant laws and regulations,
thereby enahcing ifnoramtion disclosure
transparency, protecting the rights and interests
of sharehodlers, and implementing corporate
governance.
No obvious discrepancy.
V. Has the company provided
proper communication channels
with stakeholders (including but
not limited to shareholders,
employees, customers and
suppliers, etc.), and created
dedicated sections on its website
to address corporate social
responsibility issues that are of
significant concern to
stakeholders?
The Company communicates with each of its
stakeholders, including but not limited to clients,
suppliers and employees, etc., through
the ”Stakeholder Engagement / Contact Information
for Investors” section on the company website to
properly answer the questions raised by the
stakeholders.
VI. Has the company appointed a
professional shareholders service
agent to process the affairs
related to shareholders’
meetings?
The Company appoints the "Taishin International
Bank's Stock Agency Department" to handle
relevant stock affairs including those for
shareholders’ meetings.
No obvious discrepancy.

33
Item
Implementation Status Difference from the
Corporate Governance
Best-Practice Principles for
TWSE/GTSM Listed
Companies and the reasons
Yes No Summary
VII. Information disclosure
(I) Has the company
established a company
website to disclose
information regarding its
financial, operational and
corporate governance status?
The Company has revealed the Company's financial,
operational and corporate governance issues in the
“Shareholder Service” section. Please refer to the
following website for more detail:
http://www.topcocorp.com
No obvious discrepancy.
(II) Does the company use other
information disclosure
channels (e.g. maintaining
an English-language
website, designating staff to
handle information
collection and disclosure,
appointing spokespersons,
and webcasting investors
conference to be put on the
company website, etc.)?
The Company’s website is set with traditional
Chinese, Simplified Chinese, English, Indonesian
and Vietnamese versions, and a responsible staff is
designated to handle information disclosure. The
website has also disclosed the spokesperson's
information. If an investor conference is convened,
the contents will also be revealed on the website as
required.
No obvious discrepancy.
VIII. Has the company disclosed
other information to facilitate a
better understanding of its
corporate governance practices
(including but not limited to
employee rights, employee care,
investor relations, supplier
relations, rights of stakeholders,
training of directors and
supervisors, implementation of
risk management policies and
risk evaluation measures,
implementation of customer
relations policies, and purchasing
insurance for directors and
supervisors)?
(1) Employee rights:
The Company always treats employees with
good faith and protects employees’ rights and
interests in accordance with the Labor Standards
Act.
(2) Employee care:
The Company has built a mutual trust
relationship with the employees through various
welfare systems and educational and training
systems, such as arranging cultural and
recreational activities and providing healthcare
subsidies, etc.
(3) Investor relationship:
The Company has appointed a responsible staff
to handle proposals from shareholders.
(4) Supplier relationship:
The Company has always maintained good
relationship and communication channels with
its suppliers.
(5) Rights of related parties:
In order to maintain the legitimate rights and
interests, related parties have access to the
Company for communication and proposals.
(6) Implementation status of risk control policies
and risk measuring standards:
The Company has defined various internal
regulations in accordance with laws to conduct
risk management and evaluation.
(7) Implementation status of customer policies:
The Company has maintained a stable and good
relationship with its customers to create
corporate profits.
(8) Status of the liability insurance for directors and
supervisors purchased by the Company: The
Company has purchased liability insurances for
directors and supervisors since 2017.
No obvious discrepancy.
IX. Please state the corrective actions
already taken and also propose
the matters to be improved as the
first priority and
countermeasures against them,
based on the corporate
governance evaluation results
released by the Corporate
Governance Center of TWSE in
the most recent year.
None

34
Note1:The evaluation results of Board of Director of 2018
The Board evaluation
Average Score (Full score :100) 90
Evaluation Result Good Note2:CPA Independence Evaluation
Item The
evaluation
Whether meet the
independence
1. As of the last certification, no change has been made over the past seven years. Conformity Conformity
2. There is no major conflict of interest with the principal. Conformity Conformity
3. Avoid any inaporpaite relation with the principal. Conformity Conformity
4. The accountant shall ensure their assistants are honest, impartial, and independent. Conformity Conformity
5. The financial report of the institution of service two years prior shall not be certified Conformity Conformity
6. The accountant’s name shall not be used by others. Conformity Conformity
7. There shall be no event of the holding of the Company’s shares and those of its conglomerates. Conformity Conformity
8. There is shall be no event of loaning from the Compay and its conglomerates. Conformity Conformity
9. There shall be no joint investment or profit sharing with the Company or its conglomerates. Conformity Conformity
10. A fixed shall be received provided there is no concurrent work at the Company or regular
work at its conglomerates.
Conformity Conformity
11. Functional powers not involving the decision-making of the Company or its conglomerates. Conformity Conformity
12. Other businesses concurrently undertaken that may lead to deprivation of independence. Conformity Conformity
13. There is no spouse, direct blood relatives, relatives by marriage, or second-degree relatives
who serve as the Company’s management personnel.
Conformity Conformity
14. No business related commsions are received. Conformity Conformity
15. To date, there is no event of disciplinary action or damage to the principle of independence. Conformity Conformity
(II) Implementation status of CSR and corporate governance:
1. The discrepancy and reason between the social responsibility implementation and the Corporate
Social Responsibility Best Practice Principles for TWSE/GTSM-Listed Companies:
Item Implementation Status
Differences from the
Corporate Social
Responsibility Best Practice
Principles for
TWSE/GTSM-Listed
Companies and the reasons
Yes No Summary
I. Implementation of corporate
governance
(I) Does the company have a
corporate social
responsibility policy and
evaluate its implementation?
The Company has set up the Corporate Social
Responsibility Practices and assigned the Financial
Division to review the implementation status
regularly.
No obvious discrepancy.
(II) Does the company hold
regular CSR training? The Company conducts propagation on corporate
social responsibility to the staff in monthly or
quarterly meetings at least 4 times a year.
No obvious discrepancy.
(III) Does the company have a
dedicated (or concurrent)
CSR organization which is
taken charge of by the senior
management under the
authorization of the board
and reports to the Board of
Directors?
The Company has established a concurrent unit to
facilitate the implementation of corporate social
responsibility, in which the Chairman personally
assumes the position of team member and reports
the related implementation status to the board
quarterly. The Corporate Social Responsibility
(CSR) Promotion Team convenes a meeting at least
once a year to review the implementation status for
current year and sets the direction for the next year.
The implementation status of corporate social
responsibility will also be reviewed and adjusted
with reference to the opinions of the board when
submitting.
No obvious discrepancy.
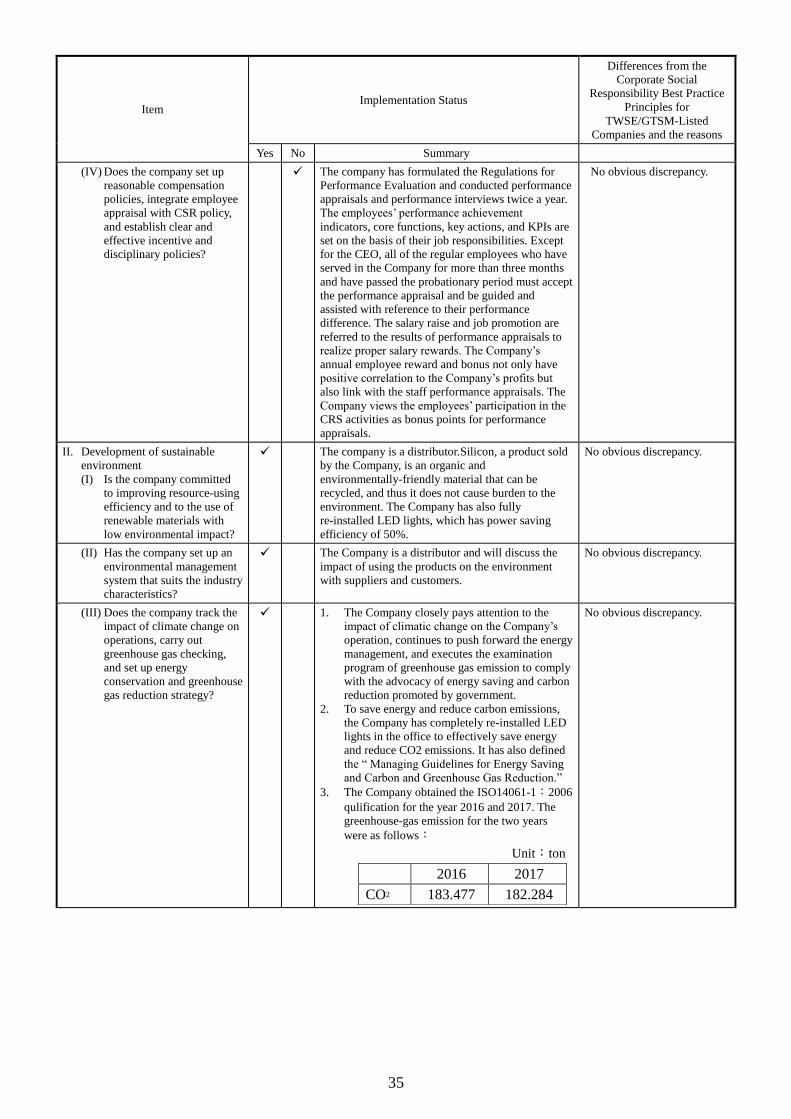
35
Item Implementation Status
Differences from the
Corporate Social
Responsibility Best Practice
Principles for
TWSE/GTSM-Listed
Companies and the reasons
Yes No Summary
(IV) Does the company set up
reasonable compensation
policies, integrate employee
appraisal with CSR policy,
and establish clear and
effective incentive and
disciplinary policies?
The company has formulated the Regulations for
Performance Evaluation and conducted performance
appraisals and performance interviews twice a year.
The employees’ performance achievement
indicators, core functions, key actions, and KPIs are
set on the basis of their job responsibilities. Except
for the CEO, all of the regular employees who have
served in the Company for more than three months
and have passed the probationary period must accept
the performance appraisal and be guided and
assisted with reference to their performance
difference. The salary raise and job promotion are
referred to the results of performance appraisals to
realize proper salary rewards. The Company’s
annual employee reward and bonus not only have
positive correlation to the Company’s profits but
also link with the staff performance appraisals. The
Company views the employees’ participation in the
CRS activities as bonus points for performance
appraisals.
No obvious discrepancy.
II. Development of sustainable
environment
(I) Is the company committed
to improving resource-using
efficiency and to the use of
renewable materials with
low environmental impact?
The company is a distributor.Silicon, a product sold
by the Company, is an organic and
environmentally-friendly material that can be
recycled, and thus it does not cause burden to the
environment. The Company has also fully
re-installed LED lights, which has power saving
efficiency of 50%.
No obvious discrepancy.
(II) Has the company set up an
environmental management
system that suits the industry
characteristics?
The Company is a distributor and will discuss the
impact of using the products on the environment
with suppliers and customers.
No obvious discrepancy.
(III) Does the company track the
impact of climate change on
operations, carry out
greenhouse gas checking,
and set up energy
conservation and greenhouse
gas reduction strategy?
1. The Company closely pays attention to the
impact of climatic change on the Company’s
operation, continues to push forward the energy
management, and executes the examination
program of greenhouse gas emission to comply
with the advocacy of energy saving and carbon
reduction promoted by government.
2. To save energy and reduce carbon emissions,
the Company has completely re-installed LED
lights in the office to effectively save energy
and reduce CO2 emissions. It has also defined
the “ Managing Guidelines for Energy Saving
and Carbon and Greenhouse Gas Reduction.”
3. The Company obtained the ISO14061-1:2006
qulification for the year 2016 and 2017. The
greenhouse-gas emission for the two years
were as follows:
Unit:ton
2016 2017
CO2 183.477 182.284
No obvious discrepancy.

36
Item Implementation Status
Differences from the
Corporate Social
Responsibility Best Practice
Principles for
TWSE/GTSM-Listed
Companies and the reasons
Yes No Summary
III. Enforcement of public welfare
(I) Does the company set up
policies and procedures in
compliance with regulations
and internationally
recognized human rights
principles?
All the Company's management policies and
procedures comply with the spirit of international
human rights conventions. The Company has also
proposed the “Human Rights Commitments and
Policies,” ”International Labor Standards”, “The
UN Global Compact” and “Business & Human
Rights Resource Centre” , which can be referred
from the company website (in the section of CSR,
Human Rights Commitments and Policies) and are
completely implemented in accordance with labor
laws.
No obvious discrepancy.
(II) Does the company have
system and channel through
which employees may raise
complaints? Are employee
complaints handled
properly?
The Company has set up Sexual Harassment
Prevention and Control Measures, Complaints and
Disciplinary Sanctions Measures, providing
complaints channels to prevent employees from the
threat of sexual harassment and building a friendly
working environment. The complaint submitted to
the department head or the management department
shall be investigated by the investigation team
assigned by the receiving department within 5 days,
and the investigation shall be completed within two
months of the receiving period. All the relevant
materials are kept confidential, and an opportunity
of statement by the respondent is provided to realize
the protection and commitment of the Company’s
goal of gender equality.
No obvious discrepancy.
(III) Does the company provide
employees with a safe and
healthy working
environment, and regular
safety and health trainings?
The Company has banned on smoking in the office
and the office is equipped with fire-fighting
equipment such as fire extinguishers and simple first
aid kits. The building security guards regularly
conduct patrolling and strictly set the access time for
visitors to prevent strangers from accessing the
office. The Company holds regular physical
examinations and provides regular safety and health
trainings to the staff. The Company has also
mandated the “Protection Measures for Working
Environment and Personal Safety.”
No obvious discrepancy.
(IV) Has the company
established a mechanism for
regular communication with
employees? Does it use
reasonable measures to
notify employees of
operational changes which
may cause significant
impact to them?
The Company provides the emploees with a
complete communication. For example an internal
monthly meeting for emploees and internal website
such as Notes to make an effective communication
with emplees to help them understand the relative
policies.
No obvious discrepancy.
(V) Has the company
established effective career
development training plans?
To cultivate talents and strengthen the professional
competence of employees, the Company has set up
the “On-the-job Training Practices” to dedicatedly
arrange various internal training courses. The
Company also encourages the staff to participate in
diversified external trainings, including the courses
on professional knowledge and skills, short-term
studies, and long-term degree and language courses.
The Company also provides training subsidies for
the above-mentioned courses to the staff. The
Company develops a diversified learning
environment and helps its personnel to learn and
grow continually to achieve the Company's business
growth and personal development needs.
No obvious discrepancy.

37
Item Implementation Status
Differences from the
Corporate Social
Responsibility Best Practice
Principles for
TWSE/GTSM-Listed
Companies and the reasons
Yes No Summary
(VI) Has the company set up
consumer protection policies
and grievance procedures
regarding its R&D,
procurement, production,
operations, and service
processes?
The Company is a distributor and the sales targets
are not the general publics but the business clients.
The clients may present a problem to the Company
about using the products, and the Company also
deals with customer complaints by designating
responsible personnel.
No obvious discrepancy.
(VII) Does the company follow
related regulations and
international standards
regarding the marketing and
labelling of its products and
services?
The products sold by the Company are all from
famous companies, and the product labels are all in
compliance with the regulations.
No obvious discrepancy.
(VIII) Does the company
evaluate environmental and
social track records before
engaging with potential
suppliers?
The Company has set up a supplier evaluation
system. All the past records relating to impacts on
the environment and society are listed in the
evaluation items. The Company will stop transaction
with suppliers if they have serious adverse effects
on the environment recorded.
No obvious discrepancy.
(IX) Does the company’s
contracts with major
suppliers include
termination clauses if they
violate CSR policy and
cause significant
environmental and social
impact?
If the main suppliers of the Company violate CSR
or have obvious adverse effects on the environment,
the Company has to require the suppliers to improve
and shall stop business transactions with the
suppliers if the situation is serious.
No obvious discrepancy.
IV. Enhancing information
disclosure
(I) Does the company disclose
relevant and reliable CSR
information on its website
and the MOPS?
The Company has disclosed relevant information of
CSR practices and other related information on the
two websites, and disclosed CSR participation and
plans on the company website.
No obvious discrepancy.
V. If the company has established its code of practice for corporate social responsibility according to the “Corporate Social Responsibility
Code of Practice for TWSE/GTSM Listed Companies,” please describe the operational status and discrepancy: No obvious
discrepancy.
VI Other important information to facilitate better understanding of the company’s implementation of corporate social responsibility:
Please refer to the Company’s announcement of the implementation status of CSR on the company website.
VII. If the Company’s Corporate Responsibility Report has been verified by relevant certifying bodies, it shall be clarified: The Company’s
agency product of Silicon is a toxic-free and environmentally-friendly organic material. The product can replace PVC, halogen and
phosphorus flame retardant and has passed the EU environmental protection regulations.

38
(III) Status of performance of ethical corporate management
Item
Implementation Status Deviation and causes of
deviation from Integrity
Best-Practice Principles for
TWSE/GTSM Listed
Companies
Yes No Summary
I. Establishment of integrity
policies and solutions
(I) Has the company stated in
its Memorandum or external
correspondence about the
policies and practices it has
to maintain ethical corporate
management? Are the Board
of Directors and the
management committed in
fulfilling this commitment?
The Company has defined the Ethical Corporate
Management Best Practice Principles, which have
been passed by the Company board.
The management irregularly propagates it to all staff
and posts it on the company website.
No obvious discrepancy.
(II) Has the company
established solutions for the
prevention of unethical
conduct and specify relevant
operating procedures,
guidelines, disciplinary
actions for violations and
complaining system and
carried out relevant
operations accordingly?
The Company has set a program for preventing
dishonest behavior, related operating procedures and
disciplinary and complaint systems. The Company
has also signed the Honesty and Integrity Agreement
with its main customers and made announcement on
the company website.
No obvious discrepancy.
(III) Has the company taken steps
to prevent occurrences listed
in Item, Article 7 of the
"Ethical Corporate
Management Best Practice
Principles for TWSE/GTSM
Listed Companies" or
business conducts that are
prone to integrity risks?
Besides propagating it to all the staff, an auditing
team is assigned to conduct the auditing to prevent
dishonest behaviors.
No obvious discrepancy.
II. Implementation of ethical
corporate management
(I) Does the company evaluate
the integrity of all
counterparts it has business
relationships with? Are there
any integrity clauses in the
agreements it signs with
business partners?
The company has signed the Honesty and Integrity
Agreement with main suppliers and customers to
realize integrity management.
No obvious discrepancy.
(II) Does the company set up a
unit which is dedicated to or
tasked with promoting the
company’s ethical standards
and reports directly to the
Board of Directors with
periodical updates on
relevant matters?
The Company’s Financial Division concurrently
takes responsibilities of promoting integrity
management and quarterly reporting to the board
according to the implement status.
No obvious discrepancy.
(III) Does the company establish
policies to prevent conflict
of interests, provide
appropriate communication
and complaint channels and
implement such policies
properly?
The Company has set a policy of preventing conflict
of interests in both the “Code of Ethics and Business
Conduct” and “Code of Ethics and Business Conduct
for Company Managers, Directors and Supervisors,”
and provided an internal channel for opinion
statement and an complaint system.
No obvious discrepancy.
(IV) Has the company fulfilled
the ethical management by
establishing an effective
accounting system and
internal control system and
had an internal audit unit
conduct periodic audits or
Integrity management has been regarded as an
important policy of the Company and is the check
point of the annual auditing conducted by the
Auditing Office.
No obvious discrepancy.

39
Item
Implementation Status Deviation and causes of
deviation from Integrity
Best-Practice Principles for
TWSE/GTSM Listed
Companies
Yes No Summary
appointed an external
auditor to conduct audits?
(V) Does the company provide
internal and external ethical
conduct training programs
on a regular basis?
The company management propagates concepts
related to integrity management to the staff through
occasions such as monthly and quarterly meetings.
No obvious discrepancy.
III. Implementation of the company’s
complaint system
(I) Does the company establish
specific complaint and
reward procedures, set up
conveniently accessible
complaint channels, and
designate responsible
individuals to handle the
complaint received?
The Company has set up the complaint system and
channel and announced it on the company website.
The reporting email address is as bellows:
No obvious discrepancy.
(II) Does the company establish
standard operating
procedures for investigating
the complaints received and
ensuring such complaints
are handled in a confidential
manner?
The Company has set up the complaint system and
reporting channel and announced it on the company
website. The reporting email address is:
[email protected]. All the reporting issues will
be investigated by the internal complaint handling
process. All the related investigation is confidentially
conducted and the results are reported to the board
directly.
No obvious discrepancy.
(III) Does the company adopt
proper measures to protect a
complainant from improper
treatment for the filing of
the complaint?
The Company has clarified the left items in the
complaint system to protect the complainant from
improper treatment.
No obvious discrepancy.
IV. Enhancing information
disclosure
(I) Does the company disclose
its guidelines on business
ethics as well as information
about implementation of
such guidelines on its
website and the Market
Observation Post System
(MOPS)?
The Company has disclosed the content and
achievement of the Code of Ethics and Business
Conduct on the company website, including the
monthly propagation of related issues.
No obvious discrepancy.
V. If the company has established corporate governance policies based on the “Corporate Conduct and Ethics Best Practice Principles for
TWSE/GTSM-Listed Companies,” please describe any discrepancy between the policies and their implementation: No obvious
discrepancy.
VI. Other important information for facilitating better understanding of the company’s implementation of Code of Ethics and Business
Conduct (e.g., review the company’s corporate conduct and ethics policy): Regulations such as the “Code of Ethics and Business
Conduct” and “Code of Ethics and Business Conduct for Company Managers, Directors and Supervisors” can be checked on the
company website.

40
(IV) Other information of corporate governance
1. Continuing eduation:
(1) Managers:
Title Name Date
Organizer Course name Hours From To
CFO Kun-Ming Wu
Feb. 22, 2018 Feb. 22, 2018
Accounting
Research and
Development
Foundation
CSR Trend Issue
-Corproate social govnerance
report related laws and
regulations, practicdes, and
analysis of lastet trends.
3
Feb. 23, 2018 Feb. 23, 2018
Accounting
Research and
Development
Foundation
M&A Case-From the
Perspective of Prosecutors
-Discussion of Mergers and
Acquisitions-Legal issues and
related legal responsibiliites.
3
Mar. 29, 2018 Mar. 29, 2018
Accounting
Research and
Development
Foundation
The Rise of the FinTech
Wave-The trend of FinTech
development and coping
measuers of enterprises.
3
Aug. 10, 2018 Aug. 10, 2018
Accounting
Research and
Development
Foundation
Cross-strait Anti-tax Avoidance:
Latest News-The impact of
cross-strait Anti-tax Avoidance
Act on finance and coping
strategy of enterprises.
3
Auditing
manager Hsinjung Su
Dec. 4, 2018 Dec. 4, 2018
Accounting
Research and
Development
Foundation
The enteprises’ “cost savings”
and “competitive strategies”
audit control practices.
6
Dec. 19, 2018 Dec. 19, 2018
Accounting
Research and
Development
Foundation
Digital audit & ERP risk control 6
(2) Directors and supervisors
Title Name Date
Organizer Course name Hours From To
Independent
director
Chiung-Shin
Wu
Jun. 22,
2018
Jun. 22,
2018
Accounting Research
and Development
Foundation
M&A Case-From the
Perspective of Prosecutors
-Discussion of Mergers and
Acquisitions-Legal issues
and related legal
responsibiliites.
3
Independent
director
Ming-Hui
Guo
Apr. 18,
2018
Apr. 18,
2018
Accounting Research
and Development
Foundation
“New Labor Law
Revision-Coping Measures
for Corproate Goverannce”
Corproaet GOvereance
Practices: The Impact and
Coping of the New Labor
Law” Revision on
Enterprises
3
May. 30,
2018
May. 30,
2018
Accounting Research
and Development
Foundation
Risk Coping Measures: Key
to Success: Corporate
Goverannce Practices:
“Enterprise Risk” Coping
Strategies and Case Analyses
3

41
Title Name Date
Organizer Course name Hours From To
Supervisor
Tzu-Cheng
Chiu, Rep.
of De Rong
Investment
Co., Ltd.
July. 26,
2018
July. 26,
2018
Accounting Research
and Development
Foundation
Digital Finance-Block Chain
Practices
Digital Finance Workshop:
Analysis from the Issue of
“Block Chain” Practices
3
July. 27,
2018
July. 27,
2018
Accounting Research
and Development
Foundation
Digital Finance-Block Chain
Applications
Digital Finance Workshop:
Viewing Enterprise
Application Development
Trends from the “Block
Chain” Perspective
3
2. Corporate Risk Management (CRM) organization:
Organization Authorities and responsibilities
Board and top
decision-making
organization
1. Defining CRM cultures and policies
2. Supervising and guiding the responsive direction to significant risks and ensuring effectiveness of
risk management mechanism
CEO Office 1. Making risk management decision
2. Warning the future and current major risks, evaluating potential losses, tracking the action plans
and notification of risk releasing
3. Summarizing the handling results of significant risk events
Each department of
the headquarter and
each branch
1. Department duties of daily risk management activities
2. Implementation of CRM decisions
3. Proactively reporting the concrete decisions, progresses and execution effectiveness of the listed
significant corporate risk events

42
3. Risk and management structure:
Important risk item Competent authority for
risk management Review mechanism Decision and monitoring
1
Market risk
- Customer development
- Competitors’ action
- Fluctuation in product price
Sales Department / CEO
Office Operating decision
meeting
Board of Directors:
The top decision-making
body for risk responses and
handlings
2 Information risk
- Abnormal operation in IT System Information Division
Operating decision
meeting
Auditing Office:
Responsible for monitoring
and tracking risk events
3 Policy and regulation compliance Financial Division Operating decision
meeting
4 Benefits from investment,
re-investment and M&As Financial Division /
CEO Office Operating decision
meeting
5 Risk of interests rate, exchange rate
and financial activities Financial Division
Operating decision
meeting
6 Funds lending, endorsement,
derivative product transactions and
management of fund utilization Financial Division
Operating decision
meeting
7 Financial statement presentation
and information disclosure Financial Division
Operating decision
meeting
8 Litigation and non-contentious
issues Financial Division /
CEO Office Operating decision
meeting
9 Changes in equities of directors,
supervisors and major shareholders Financial Division Board of Directors
10 Board meeting management Financial Division Board of Directors
(V) Status of obtaining the related licenses specified by the competent authority by the staff who are relevant
with corporate financial information transparency:
1. Certified Securities Investment Analysis Test held by SITCA: 1 person from the Financial
Department.
2. Internal Controller of Corporation Test held by STI: 1 person from the Auditing Office.
3. Internal controller of R.O.C: 1 person from the Auditing Office.
4. Certified Internal Auditor, CIA
(VI) Access to Corporate Governance Practices and relevant regulations: Please refer to the company
website.
(VII) The implementation status of the internal control system regarding the following issues shall be
disclosed:
1. Operation of internal control organization:
The Company’s Auditing Office has dedicated auditors, and is directly subjected to the board. The
auditing targets include the Company and all its subsidiaries. The auditing scope covers all financial
and business operations and management activities, and the auditing activity is divided into auditing
execution as required. The auditing is mainly conducted on the basis of the annual auditing plan and
performs case-by-case if necessary to timely discover defects in the internal control system and
provides improvement proposals. After completing the auditing, the Auditing Office reports to the
Chairman, independent directors and supervisors. The auditing manager regularly reports the
implementation status and results to the board to implement the spirit of corporate governance.
Furthermore, the Auditing Office also supervises each department and subsidiary of the Company to
perform self-auditing, build a self-supervising mechanism, and the the self-auditing results serve as
the reference for the board and CEO in issuing the internal control system statement.
2. While entrusting an accountant to review the internal control system on project basis, the review
report shall be disclosed. It does not apply to this case.

43
(VIII)Punishment of the Company and its internal personnel in accordance with the laws, the Company's
punishment of its internal personnel for violating internal control system regulations, main deficiencies
and improvements during the most recent year up to the printed date of this annual report. No such issues
happened.
(IX) Other important information to enhance the understanding of corporate governance operations:
1. The Company has set up the “Internal Material Information Management Procedure,” and all the
departments and staff shall follow the related procedures and laws when handling and disclosing the
material information.
2. Internal Material Information Management Procedure:
(1) Purpose of the Procedure
This operating procedure is set up and shall be followed in order to establish the Company's
internal material information processing and disclosure mechanism, avoid inappropriate
disclosure of information, and ensure the consistency and accuracy of the Company's
disclosure of information.
(2) Internal material information shall be managed by the the regulations and the Procedure.
Handling and disclosure of internal material information shall be conducted in accordance with
the relevant laws, orders, the regulations of TWSE or TPEX, and the Procedure.
(3) Subjects applied
The Procedure is applicable to the Company’s directors, supervisors, managers and employees.
For others who are aware of the Company’s internal material information due to their identity,
occupation or control relationship, the Company shall urge them to comply with the relevant
provisions of the Procedure.
(4) Coverage of internal material information
The internal material information referred to in the Procedure is defined by the internal
dedicated unit (the Financial Division) and approved by the board. Rules of Securities and
Exchange Act, related laws and orders, and regulations of TWSE or TPEX shall be considered
when defining the internal material information.
(5) Dedicated unit for managing internal material information
The Company shall set up a dedicated unit dealing with internal material information, and the
unit shall be composed of the competency and the appropriate number of members in
accordance with the company size, business condition and management needs. The dedicated
unit setting is approved by the board and its responsibilities are as follows:
(A) Drafting and amending the Procedure.
(B) Receiving inquiries, deliberations, and proposals on internal material information
processing and the related procedures.
(C) Receiving reports concerning the disclosure of internal material information, and
planning countermeasures.
(D) Formulating the preservation system for all documents, files and electronic records
related to the Procedure.
(6) Confidential firewall operation – personnel
The Company’s directors, supervisors, managers and employees shall take good care and
fiduciary duty to operating business and sign the confidentiality agreement.
The directors, supervisors, managers and employees who are aware of the Company’s internal
material information shall not disclose it to others.
The Company's directors, supervisors, managers and employees shall not inquire or collect
undisclosed internal material information not affiliated with their personal duties. The
undisclosed internal material information being aware of not due to business operation shall
not be released to others.
44
(7) Confidential firewall operation – objects
When delivering the Company’s internal material information in written formats, there shall be
proper protection. When sending by e-mail or other electronic means, it must be handled with
appropriate security technologies such as encryption or electronic signature.
The files regarding the Company’s internal material information shall be backed up and stored
in a safe place.
(8) Confidential firewall operation
The Company shall ensure the establishment of the confidential firewall as prescribed in the
first two articles and take the following measures:
(A) Adopt appropriate confidential firewall controls and test on a regular basis.
(B) Strengthen the custody and confidentiality measures of the internal material information
documents.
(9) Non-disclosure agreement of external institutions or personnel
External organizations or personnel shall sign the confidentiality agreement for participation in
the company’s M&As, important memorandums, strategic alliances, other business
cooperation plans, or signing of important contracts, and shall not disclose any significant
internal material information of the Company to others.
(10) Principles of internal material information disclosure
The Company shall comply with the following principles to disclose internal material
information:
(A) Information revealed shall be correct, complete and timely.
(B) Information revealed shall have specific basis.
(C) Information shall be fairly revealed.
(11) Implementation of the spokesman system
The reveal of the Company’s internal material information shall be conducted by the corporate
spokesperson or the deputy spokesperson except as otherwise stipulated by laws or orders, and
the orders of proxy shall be confirmed. The owner of the Company can directly conduct the
disclosure if necessary.
The contents of the statements made by the corporate spokesperson and the deputy
spokesperson shall be limited to the scope of the Company's authorization. Except for the
owner, spokesperson and deputy spokesperson, the staff of the Company shall not disclose any
internal material information without authorization.
(12) Records of internal material information disclosure
(A) The personnel, date and time of the disclosure.
(B) The methods of information disclosure.
(C) The disclosure contents.
(D) The delivery of written information.
(E) Other relevant information.
(13) Responds to unreal media reports
If the contents of media coverage are inconsistent with the information revealed by the
Company, the Company should clarify it at the Market Observation Post System and request
correction from the media.
(14) Report on abnormal circumstances
The Company’s directors, supervisors, managers and employees shall report to the dedicated
unit and the internal Auditing Office as soon as possible when they are aware of the disclosure
of internal material information.

45
After accepting the prescribed report, the dedicated unit shall propose countermeasures, invite
internal Auditing Office and other departments for discussion and handle the results when
necessary, and file the results of the investigation for future reference. The internal Auditing
Office shall also conduct auditing within the scope of its responsibility.
(15) Violation
If one of the following issues happen, the Company shall investigate the legal liability of
related personnel and take appropriate legal measures:
(A) The company staff arbitrarily discloses internal material information or violates the
Procedure or other regulations.
(B) The Company’s spokesperson or deputy spokesperson surpasses the authorized scope of
the Company or violate the Procedure or other regulations.
If there are damages to the Company’s property or interests caused by the disclosure of the
Company’s internal material information by external personnel, the Company shall investigate
the legal liability through relevant channels.
(16) Internal control system
The Procedure shall be incorporated into the Company’s internal control system. Internal
auditors shall regularly check the implementation status and make audit reports to implement
the managing procedures for internal material information.
(17) Educational propaganda
The Company educates and propagates the Procedure and related laws and regulations to
directors, supervisors, managers and employees at least once a year.
The educational propaganda shall be provided to the newly elected directors, supervisors,
managers and employees timely.
(18) The Procedure is implemented and amended after the board approves, and the same when it is
amended.
In addition, the Company has also defined the “Code of Ethics and Business Conduct for
Managers, Directors and Supervisors,” “Code of Ethics and Business Conduct,” “Corporate
Social Responsibility Practice” and “Corporate Governance Practices” to enhance corporate
governance operations. Please refer to the company website for details.
3. The Company has set up a CSR management unit and the Chairman takes the position of a convener.
The unit members include the CEO, members of the GM Office, Financial Division and
Management Department. The responsibilities of the unit include making annual CSR plans, setting
annual CSR implement direction and all related matters such as CSR implementation review.

46
4. The Company’s CSR specific promotion plan and implementation results are shown in the table
below for the year of 2018 up to the printed date of the annual report. The future goal is to
continuously participate in CSR every quarter.
Period Promotion plan Implementation effectiveness
2018Q1
Participation in activities of
Eden Social Welfare
Foundation
1. The Chairman leads key managers to participate in the Elder
Caring Charitable Concert held by the Eden Social Welfare
Foundation on March 25, 2018.
2. The Company donated NT 300,000 dollar to the Eden
Social Welfare Foundation.
2018Q2 Participation in the marathon
on World Earth Day
There are approximately 50 employees participating in the
marathon held by National Geographic Channel on World Earth
Day on Apr. 1, 2018.
2018Q2 Participation in activities of
John Tung Foundation
1. Participated in the seminar on Accompanying the Elderly
held by the John Tung Foundation on May 10, 2018.
2. The Company donated NT 100,000 dollar to the John Tung
Foundation.
2018Q3 The coastal cleanup event of
north coast
The Chairman and 50 emplees of the company to join the
coastal cleanup event in the Gongliao Dist of New Taipei City
at July 28, 2018.
2018Q4 John Tung Foundation
Relieve stress workshop
The employees to be the volunteers of the relieve stress
workshop at Oct.3, 2018.
2019Q1
To be the sponsor of the
Chinese New Year
Dinner event by the Eden
Social Welfare
Foundation.
1. The employees to be the volunteers of the Chinese
New Year Dinner event at Jan. 25, 2019.
2. The Company sponsors 100 thousand to Eden
Social Welfare Foundation.
2019Q1 Benefit concert
1. The Company held the benefit concert with Autism
musician association at Mar.9, 2019.
2. The Company sponsors 200 thousand to Autism
musician association.
2019Q2 Autism Speaks - Light It
Up Blue
The Chairman and employees attend the “Autism
Speaks - Light It Up Blue” at Apr.2, 2019.
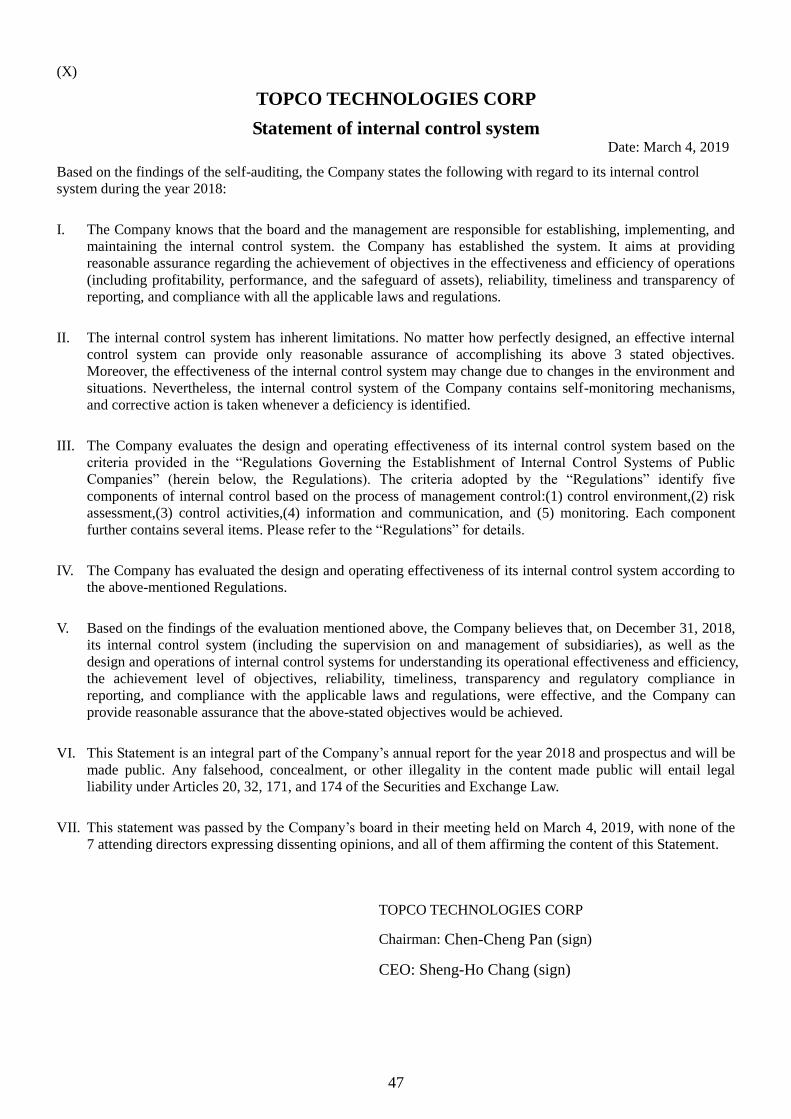
47
(X)
TOPCO TECHNOLOGIES CORP
Statement of internal control system Date: March 4, 2019
Based on the findings of the self-auditing, the Company states the following with regard to its internal control
system during the year 2018:
I. The Company knows that the board and the management are responsible for establishing, implementing, and
maintaining the internal control system. the Company has established the system. It aims at providing
reasonable assurance regarding the achievement of objectives in the effectiveness and efficiency of operations
(including profitability, performance, and the safeguard of assets), reliability, timeliness and transparency of
reporting, and compliance with all the applicable laws and regulations.
II. The internal control system has inherent limitations. No matter how perfectly designed, an effective internal
control system can provide only reasonable assurance of accomplishing its above 3 stated objectives.
Moreover, the effectiveness of the internal control system may change due to changes in the environment and
situations. Nevertheless, the internal control system of the Company contains self-monitoring mechanisms,
and corrective action is taken whenever a deficiency is identified.
III. The Company evaluates the design and operating effectiveness of its internal control system based on the
criteria provided in the “Regulations Governing the Establishment of Internal Control Systems of Public
Companies” (herein below, the Regulations). The criteria adopted by the “Regulations” identify five
components of internal control based on the process of management control:(1) control environment,(2) risk
assessment,(3) control activities,(4) information and communication, and (5) monitoring. Each component
further contains several items. Please refer to the “Regulations” for details.
IV. The Company has evaluated the design and operating effectiveness of its internal control system according to
the above-mentioned Regulations.
V. Based on the findings of the evaluation mentioned above, the Company believes that, on December 31, 2018,
its internal control system (including the supervision on and management of subsidiaries), as well as the
design and operations of internal control systems for understanding its operational effectiveness and efficiency,
the achievement level of objectives, reliability, timeliness, transparency and regulatory compliance in
reporting, and compliance with the applicable laws and regulations, were effective, and the Company can
provide reasonable assurance that the above-stated objectives would be achieved.
VI. This Statement is an integral part of the Company’s annual report for the year 2018 and prospectus and will be
made public. Any falsehood, concealment, or other illegality in the content made public will entail legal
liability under Articles 20, 32, 171, and 174 of the Securities and Exchange Law.
VII. This statement was passed by the Company’s board in their meeting held on March 4, 2019, with none of the
7 attending directors expressing dissenting opinions, and all of them affirming the content of this Statement.
TOPCO TECHNOLOGIES CORP
Chairman: Chen-Cheng Pan (sign)
CEO: Sheng-Ho Chang (sign)

48
(XI) Important resolutions approved by the board for the most recent year up to the printed date of the annual report
1. Shareholders’ meeting
Date
Category Resolutions Implementation status
Jun. 20, 2018 Shareholders’
Meeting I. Reporting matters:
1. 2017 Business Report
2. 2017 Supervisor Audit Report
3. 2017 Compensation Report on Directors, Supervisors and
Employees
II. Points of ratification:
1. 2017 Business Report and Financial Statement Proposal
2. 2017 Earnings Distribution Proposal
III. Discussions:
1. Capital surplus cash payment.
2. Amendment to articles of "Articles of Incorporation".
1. The board meeting after the shareholders’ meeting set the date of
July 14, 2018 as the ex-dividend date and issued cash dividends on
Aug. 3, 2018.
2. Completion of amendment to"Articles of Incorporation"

49
2. Board of Directors:
Meeting date Major resolutions
Mar. 26, 2018
1. 2017 Business Report and Financial Statement Proposal
2. 2017 Audit Report issued by the CPA for Annual Financial Statements
3. 2017 Earnings Distribution Proposal
4. 2017 Statement of Internal Control System
5. Discussion on 2018 Annual Budget Plan
6. Approval on 2017 compensation policy of directors, supervisors and managers, and 2018
Compensation Adjustment Proposal
7. Proposal of Capital Surplus Cash Dividend
8. Amendment to some articles of the Company's "Articles of Association"
9. Amendment to the Procedure of Board Meetings
10. Proposal on Bank Line of Credit
11. Setting matters relating to general shareholders’ meetings
May 7, 2018 1. Reviewing Report issued by the CPA for three months ended March 31, 2018 Financial Report
June 20, 2018
1. Set the “Cancellation of Restrictions on Employees’ Rights of New Shares and Capital Reduction
Case
2. Setting the ex-dividend date
3. The banl loan amount application of the company.
Aug. 6, 2018 1. Reviewing Report issued by the CPA for the Financial Report of the first half year of 2018
2. Compensation to directors, supervisors and Employees proposed by the Remuneration Committee
Sept. 17, 2018 1. To approved capital increased by cash.
2. To approve capital increased the subsidiaries in China by cash.
Nov. 5, 2018
1. Reviewing Report issued by the CPA for the nine months ended September 30 2018 Financial
Report
2. 2019 Auditing Plan
Dec. 3, 2018 To disuss the detail of the capital increased.
Mar. 4, 2019
1. 2018 Business Report and Financial Statement Proposal
2. 2018 Audit Report issued by the CPA for Annual Financial Statements
3. 2018 Earnings Distribution Proposal
4. 2018 Statement of Internal Control System
5. Discussion on 2019 Annual Budget Plan
6. Approval on 2018 compensation policy of directors, supervisors and managers, and 2019
Compensation Adjustment Proposal
7. Amendment to the article " Operational procedures for Acquisition and Disposal of Assets "
8. To approval the new placement company secretary.
9. Set the Standard Opearting Procedures required by the Board of Directors.
10. Setting the “Corporate Government Best Practice Principles”
11. To discuss the candidates of the 10 th directors (include independent directors) and supervisors.
12. Setting matters relating to general shareholders’ meetings
(XII) Recorded or written statements made by any director or independent director who specified dissent to
important resolutions passed by the Board of Directors during the most recent year and up to the date of
publication of the annual report: No such issues happened.
(XIII) A summary of the resignation status of the corporate relevant persons (including the Chairman, General
Manager, Accounting Supervisor, Internal Audit Supervisor, and R&D Supervisor, etc.): None.
3.4. Information on auditing fees :
Accounting firm Name of CPA Audit period Notes
KPMG Ruilan Luo Yi-Wen Wang Jan. 1, 2018 - Dec. 31, 2018

50
Unit: NT$ thousand
Fee
Amount range Audit fee Non-audit fee Total
1 0 ~NT$ 1,999,999 310 310
2 NT$ 2,000,000 ~NT$ 3,999,999
3 NT$ 4,000,000 ~NT$ 5,999,999 4,050 4,050
4 NT$ 6,000,000 ~NT$ 7,999,999
5 NT$ 8,000,000 ~NT$ 9,999,999
6 NT$ 10,000,000 and more
Note: The audit fees for major subsidiaries themselves and the related are included.
Unit: NT$ thousand
Name of
CPA firm
Name of
CPA Audit fee
Non-audit fee Audit period of
CPA Note System
design
Company
registration
Human
resource Others Total
KPMG
Ruilan
Luo
4,050 0 0 0 310 310 Jan. 1, 2018 -
Dec. 31, 2018
1. Certification of
auditing fee
with direct
deduction
method for
dual -status
business
entities is NT$
50,000.
2. Certification of
auditing fee for
transfer pricing
report is NT$
260,000.
Yi-Wen
Wang
While one of the following issues happens to the company, it shall disclose following items:
(I) While the non-audit fee paid to CPAs, their subjected and other affiliated firms accounts for more than
one-fourth of the audit fee, the company shall disclose the amount of audit fee and non-audit fee and the
non-audit services: No such issue happened.
(II) While there is any change of accounting firm and the audit fee paid in the replacement year is less than
that paid in the preceding year, the company shall disclose the decreased amount, ratio and reasons for
audit fee: No such issue happened.
(III) While the ratio of audit fee for the preceding year decreases by 15% or more, the company shall disclose
the decreased amount, ratio and reasons for audit fee. The audit fee mentioned above refers to the
corporate payment to CPAs for auditing, reviewing, re-auditing of corporate financial statements and
projections and certification of business income tax.
3.5. Information of changing accountants:
If the company changes the CPAs within the most recent two years and the subsequent periods, it shall
disclose the contents below: The change of CPAs to Miss Ruilan Luo and Miss Yi-Wen Wang of KPMGs
since 2017 has been due to the internal rotation in KPMG.
3.6 For the company’s chairman, general manager, manager responsible for financial or accounting affairs, and
personnel who have worked in the auditor’s office or its affiliates in the most recent year
The names, positions, term of office and its affiliates shall be disclosed: No such issue happened.
3.7. Equity transfer and equity pledge changes of directors, supervisors, managers and shareholders with a
shareholding of more than 10% in the most recent year and up to the publication date of the annual report
While the transferees of the stock transferring and pledge of stock rights are also corporate related parties, the
name of the transferee, its relationship with the directors, supervisors and shareholders with 10%
shareholdings and more, and the number of shares acquired or pledged shall be disclosed.

51
3.7.1 Changes in Shareholding of the Directors, Supervisors, Managers, and Major Shareholders
Unit: shares
Title Name
2018 As of Apr. 2, 2019
Increase
(decrease) in
shares held
Increase
(decrease) in
shares pledged
Increase
(decrease) in
shares held
Increase
(decrease) in
shares pledged
Chairman Chen-Cheng Pan 100,000 0 333,156 0
Director
Topco Development Co., Ltd. 0 0 1,000,000 0
Topco Development Co., Ltd.
Representative: Chun-Chien Wang 0 0 0 0
Director Juo-pei Wang (79,000) 0 52,605 0
Director Tadaki Inoue , Rep. of Shin-Etsu
Chemical Co., Ltd. 0 0 0 0
Director Chun-Ming Weng 15,000 0 154,003 0
Independent director Chiung-Shin Wu 0 0 0 0
Independent director Ming-Hui Guo 0 0 0 0
Supervisor Chung-Sheng Lin 0 0 122,619 0
Supervisor Chang-Wei Wu 0 0 0 0
Supervisor
De Rong Investment Co., Ltd. 0 0 183,574 0
De Rong Investment Co., Ltd.
Representative: Tzu-Cheng Chiu
135,588
Note1 0 26,922 0
Chief Executive Officer Sheng-Ho Chang 120,000 0 134,460 0
Deputy CEO Wen-Hua Tsai 82,000 0 56,982 0
South China Business
Headquarters -Chairman,
TOPCO (Guangzhou) Trading Co., Ltd.
Ching-Hung Lin 120,000 0 78,305 0
General Manager, Taiwan
Business Headquarters Fu-Jen Cheng 82,000 0 128,484 0
Deputy General Manager,
East China Business
Headquarters
Tsai-Meng Wang 50,000 0 37,068 0
Deputy General Manager,
South China Business
Headquarters
Ming-Tso Hsiao 60,000 0 26,000 0
CFO Kun-Ming Wu 120,000 0 148,985 0
Executive Assistant for
Chairman Ching-Hsiung Wen 50,000 0 42,244 0
General Manager, East
China Business
Headquarters
Chung-Yen Wang 112,000 0 25,000 0
Deputy General Manager,
East China Business
Headquarters
Liang-Hsin Hsieh 34,000 0 16,000 0
Associate Manager Pin-Nan Liao 26,000 0 18,000 0
Associate Manager Yu-Lin Huang 55,000 0 28,941 0
Associate Manager Pin-Chuan Chen 0 0 18,000 0
Associate Manager Yang-Fu Fan(Note2) 25,000 0 25,122 0
Associate Manager Chih-Ching Hsu(Note2) 40,000 0 11,363 0
Associate Manager Su-Hsien Hsieh(Note2) 26,000 0 22,000 0
Associate Manager Meng-Ju Wu(Note2) 38,000 0 24,005 0
Associate Manager Chao-Pang Lo(Note2) 24,000 0 9,246 0
Associate Manager Yu-Shu Liu(Note3) 0 0 0 0
Associate Manager Peng-Hung Chen(Note3) 0 0 0 0
Note 1: Inherited
Note 2: Feb.1 2018 On board
Note 3: Feb.1 2019 On board

52
3.7.2 Informatiom of stcck transfer: None
3.7.3 Informatiom of stcck pledged:None
3.8 Information of the top ten shareholding ratio shareholders, related to each other as defined in the SFAS
No.6
Related Party Relationship among TOPCO’s Top Ten Shareholders
April 2, 2019
Name (Note1)
Shareholding Shares held by spouses and
dependents Shares held by third parties
Name and relationship between
the company’s top ten
shareholders,or spouses or relatives within two degrees
Notes
Number of Shares
Shareholding percentage %
Number of Shares
Shareholding percentage %
Number of Shares
Shareholding percentage %
Name Relationship
Topco Development
Co., Ltd.
16,631,136 22.46 0 0 0 0 - -
Representative:
Chun-Chien Wang
585,846 0.79 1,562,052 2.11 0 0 Baoyu Lin Spouse
Shin-Etsu Chemical Co.,
Ltd.
2,815,296 3.80 0 0 0 0 - -
Representative:
Tadaki Inoue 0 0 0 0 0 0 - -
De Rong
Investment Co., Ltd.
1,653,574 2.23 0 0 0 0 - -
Representative: Tzu-Cheng Chiu
242,510 0.33 0 0 0 0 - -
Bao-Yu Lin 1,562,052 2.11 585,846 0.79 0 0 Chun-Chien
Wang Spouse
Chun-Ming
Weng 1,387,204 1.87 606,301 0.82 0 0
TOPCO
DEVELOPMENT Chairman
Chung-Sheng
Lin 1,104,508 1.49 190,472 0.26 0 0
TOPCO
DEVELOPMENT Supervisor
Chen-Cheng Pan 999,041 1.35 127,217 0.17 0 0 - Chairman
HSIN CHI LI
Investment Co.,
Ltd
920,904 1.24 0 0 0 0 - -
Representative:
Shu-Chen Yeh 606,301 0.82 1,387,204 1.87 0 0
Chun-Ming
Weng Spouse
LIN,CHIA-TE 615,865 0.83 0 0 0 0 - -
Note 1: The name of the shareholders shall be listed individually (for corporate shareholders, its corporate and representative
name shall be listed respectively)
Note 2: Calculation on the shareholding ratio refers to the total shares held by the shareholders, spouses, minor children and
any other nominees.

53
3.9 Share holding ratio of the re-invested business of the company, the company’s directors, supervisors,
managers and corporations directly or indirectly controlled by the company, and the comprehensive
shareholding ratio
Date: December 31, 2018 Unit: Share %
Re-invested business
Investment by the Company
Investment by directors,
supervisors, managers and
directly or indirectly owned
subsidiaries
Comprehensive investment
Shares Shareholding
ratio Shares
Shareholding
ratio Shares
Shareholding
ratio
TOPCO AMERICA
INC.
12,260,000
shares 100.00% - -
12,260,000
shares 100.00%
Hong Kong TOPCO
Trading Co., Ltd. - 100.00% - - - 100.00%
TOPCO (Guangzhou)
Trading Co., Ltd. - 100.00% - - - 100.00%
TOPCO Trading
(Shanghai Pudong
District) Co., Ltd.
- 100.00% - - - 100.00%
TOPCO (Indonesia)
Trading Co., Ltd.
(Note1)
- - - 100.00% - 100.00%
TOPCO (Vietnam)
Trading Co., Ltd.
(Note1)
- - - 100.00% - 100.00%
TOPGLOW Trading
Co., Ltd.
9,146,000
shares 65.33% - -
9,146,000
shares 65.33%
Top Glory Trading
Co.,Ltd. (Note2) - - - - - 65.33%
TOPGLOW Advanced
Materials (Shanghai)
Ltd. (Note2)
- - - 100.00% - 65.33%
Shin-Etsu (Taiwan)
Chemical Co., Ltd.
1,520,000
shares 6.67%
19,760,000
shares 86.67%
21,280,000
shares 93.34%
MEI HO International
Co., Ltd.
1,445,000
shares 3.38% - -
1,445,000
shares 3.38%
Note 1: 100% investment via the sub-subsidiary, Hong Kong TOPCO Trading Co., Ltd.
Note 2: 100% re-invested by TOPGLOW Trading Co., Ltd.

54
4. Capital Overview
4.1 Capital and shares:
(I) Source of capital:
Unit: thousand shares in thousand dollars
Month/Year
Issuing
price
(Face
value)
Authorized capital Paid-up capital Notes
Number of
Shares Amount
Number
of
Shares
Amount Source of capital stock
Paid in
properties
other than
cash
Date of
approval
&
document
No.
Feb., 1994 NT$ 10 2,000 20,000 1,000 10,000 Capital for incorporation by cash: NT$ 10,000,000 None (Note 1)
Jun., 1995 NT$ 10 2,400 24,000 2,400 24,000 Capital increase by cash: NT$ 14,000,000 None (Note 2)
Apr., 1997 NT$ 10 3,400 34,000 3,400 34,000 Capital increase by cash: NT$ 10,000,000 None (Note 3)
Jul., 1998 NT$ 10 5,000 50,000 5,000 50,000 Capital increase by cash: NT$ 16,000,000 None (Note 4)
Aug., 2000 NT$ 10 9,000 90,000 9,000 90,000
Capital increase by retained
earnings: NT$ 30,000,000
Capital increase by employee
bonuses transferred to common
stock: NT$ 10,000,000
None (Note 5)
Jun., 2001 NT$ 10 15,000 150,000 15,000 150,000
Capital increase by retained
earnings: NT$ 18,000,000
Capital increase by cash: NT$
42,000,000
None (Note 6)
Jun., 2003 NT$ 10 15,500 155,000 15,500 155,000 Capital increase by cash: NT$
5,000,000 None (Note 7)
Jul., 2004 NT$ 10 80,000 800,000 37,328 373,280
Issuance of common stock through
merger: NT$ 21,328,000
Employee bonuses transferred to
common stock: NT$ 5,000,000
None (Note 8)
Mar., 2006 NT$ 10 80,000 800,000 41,995 419,950 Capital increase by cash: NT$
46,670,000 None (Note 9)
Aug., 2007 NT$ 10 80,000 800,000 46,400 464,000
Capital increase by retained
earnings: NT$ 41,995,000
Employee bonuses transferred to
common stock: NT$ 2,055,000
None (Note 10)
Aug., 2008 NT$ 10 80,000 800,000 55,680 556,800 Capital increase by retained
earnings: NT$ 92,800,000 None (Note 11)
Sep., 2011 NT$ 10 80,000 800,000 62,000 620,000 Capital increase by cash: NT$
63,200,000 None (Note 12)
Sep., 2014 NT$ 10 80,000 800,000 64,400 644,000 Issuance of Restricted Stock
Awards (RSA): NT$ 24,000,000 None (Note 13)
Apr., 2015 NT$ 10 80,000 800,000 64,375 643,750 Reacquisition of RSA: NT$
250,000 None (Note 14)
Jul., 2015 NT$ 10 80,000 800,000 64,350 643,500 Reacquisition of RSA: NT$
250,000 None (Note 15)
Nov., 2015 NT$ 10 80,000 800,000 64,346 643,460 Reacquisition of RSA: NT$
40,000 None (Note 16)
Apr., 2016 NT$ 10 80,000 800,000 64,294 642,940 Reacquisition of RSA: NT$
520,000 None (Note 17)
Jul., 2016 NT$ 10 80,000 800,000 64,266 642,660 Reacquisition of RSA: NT$
280,000 None (Note 18)
Nov., 2016 NT$ 10 80,000 800,000 64,106 641,060 Reacquisition of RSA: NT$
160,000 None (Note 19)
Jun., 2017 NT$ 10 80,000 800,000 64,101 641,010 Reacquisition of RSA: NT$
50,000 None (Note 20)
June, 2018 NT$ 10 80,000 800,000 64,061 640,610 Reacquisition of RSA: NT$
400,000 None (Note 21)
Feb., 2019 NT$ 10 80,000 800,000 74,061 740,610 Capital increase by cash: NT$
100,000,000 None (Note 22)
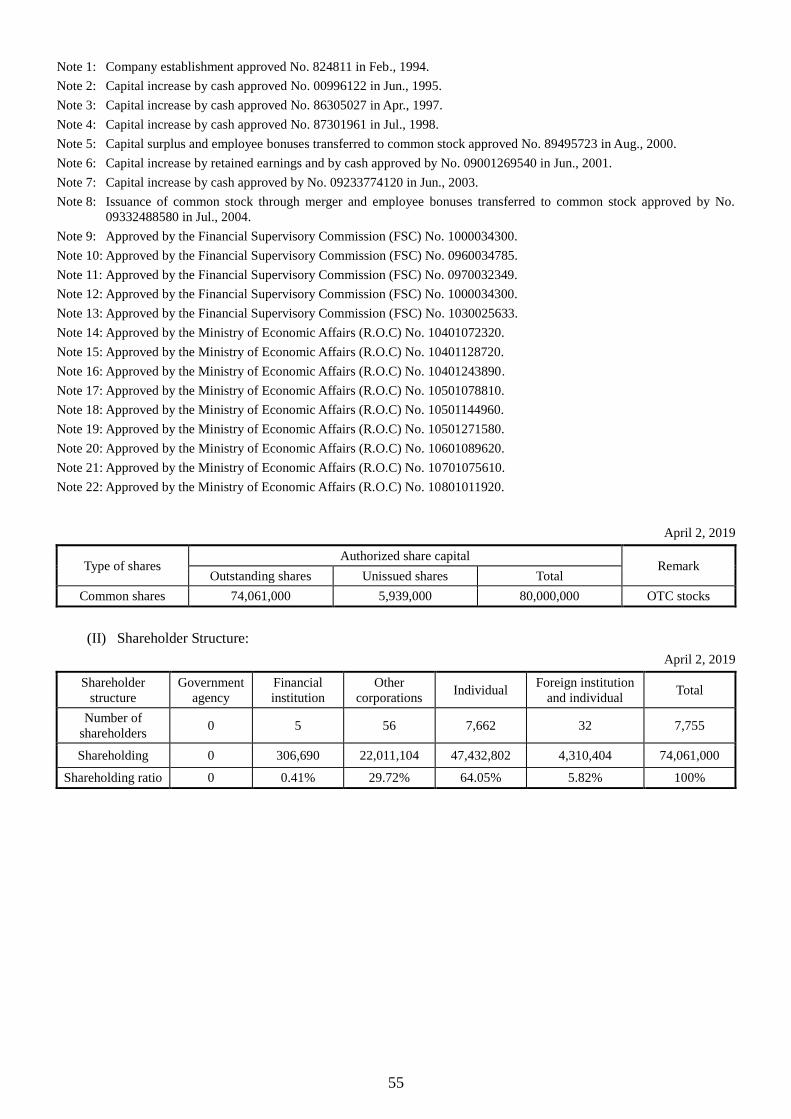
55
Note 1: Company establishment approved No. 824811 in Feb., 1994.
Note 2: Capital increase by cash approved No. 00996122 in Jun., 1995.
Note 3: Capital increase by cash approved No. 86305027 in Apr., 1997.
Note 4: Capital increase by cash approved No. 87301961 in Jul., 1998.
Note 5: Capital surplus and employee bonuses transferred to common stock approved No. 89495723 in Aug., 2000.
Note 6: Capital increase by retained earnings and by cash approved by No. 09001269540 in Jun., 2001.
Note 7: Capital increase by cash approved by No. 09233774120 in Jun., 2003.
Note 8: Issuance of common stock through merger and employee bonuses transferred to common stock approved by No.
09332488580 in Jul., 2004.
Note 9: Approved by the Financial Supervisory Commission (FSC) No. 1000034300.
Note 10: Approved by the Financial Supervisory Commission (FSC) No. 0960034785.
Note 11: Approved by the Financial Supervisory Commission (FSC) No. 0970032349.
Note 12: Approved by the Financial Supervisory Commission (FSC) No. 1000034300.
Note 13: Approved by the Financial Supervisory Commission (FSC) No. 1030025633.
Note 14: Approved by the Ministry of Economic Affairs (R.O.C) No. 10401072320.
Note 15: Approved by the Ministry of Economic Affairs (R.O.C) No. 10401128720.
Note 16: Approved by the Ministry of Economic Affairs (R.O.C) No. 10401243890.
Note 17: Approved by the Ministry of Economic Affairs (R.O.C) No. 10501078810.
Note 18: Approved by the Ministry of Economic Affairs (R.O.C) No. 10501144960.
Note 19: Approved by the Ministry of Economic Affairs (R.O.C) No. 10501271580.
Note 20: Approved by the Ministry of Economic Affairs (R.O.C) No. 10601089620.
Note 21: Approved by the Ministry of Economic Affairs (R.O.C) No. 10701075610.
Note 22: Approved by the Ministry of Economic Affairs (R.O.C) No. 10801011920.
April 2, 2019
Type of shares Authorized share capital
Remark Outstanding shares Unissued shares Total
Common shares 74,061,000 5,939,000 80,000,000 OTC stocks
(II) Shareholder Structure:
April 2, 2019
Shareholder
structure
Government
agency
Financial
institution
Other
corporations Individual
Foreign institution
and individual Total
Number of
shareholders 0 5 56 7,662 32 7,755
Shareholding 0 306,690 22,011,104 47,432,802 4,310,404 74,061,000
Shareholding ratio 0 0.41% 29.72% 64.05% 5.82% 100%

56
(III) Distribution of shares:
April 2, 2019
Shareholder ownership Number of
shareholders Shareholding Shareholding ratio
1 ~ 999 1,063 220,136 0.30%
1,000 ~ 5,000 5,198 10,093,769 13.63%
5,001 ~ 10,000 703 5,124,169 6.92%
10,001 ~ 15,000 309 3,763,148 5.08%
15,001 ~ 20,000 122 2,154,821 2.91%
20,001 ~ 30,000 133 3,209,262 4.33%
30,001 ~ 40,000 58 2,033,841 2.75%
40,001 ~ 50,000 40 1,828,252 2.47%
50,001 ~ 100,000 61 4,187,622 5.65%
100,001 ~ 200,000 31 4,392,421 5.93%
200,001 ~ 400,000 19 4,969,299 6.71%
400,001 ~ 600,000 8 3,788,379 5.12%
600,001 ~ 800,000 2 1,222,166 1.65%
800,001 ~ 1,000,000 2 1,919,945 2.59%
Over 1,000,000 6 25,153,770 33.96%
Total 7,755 74,061,000 100.00%
(IV) List of major shareholders:
April 2, 2019
Major shareholders Shareholding Shareholding ratio
Topco Development Co., Ltd. 16,631,136 22.46%
Shin-Etsu Chemical Co., Ltd. 2,815,296 3.80%
De Rong Investment Co., Ltd. 1,653,574 2.23%
Bao-Yu Lin 1,562,052 2.11%
Chun-Ming Weng 1,387,204 1.87%
Chung-Sheng Lin 1,104,508 1.49%
Chen-Cheng Pan 999,041 1.35%
HSIN CHI LI Investment Co., Ltd 920,904 1.24%
LIN,CHIA-TE 615,865 0.83%
Shu-Chen Yeh 606,301 0.82%

57
(V) Market price per share, net worth, earnings, and dividends for the most recent 2 years:
Unit: NT$; per share
Item Year 2017 2018 As of
Apr. 15, 2019
(Note 7)
Market price per
share (Note 1)
Highest 73.60 84.00 75.00
Lowest 60.90 64.50 66.00
Average 65.96 75.57 70.66
Net worth per share
(Note 2)
Before distribution 47.81 50.78 -
After distribution 43.21(Note 2) (Note 3) -
EPS
Weighted average shares 64,101,000 62,515,000 -
EPS 5.65 7.41 -
EPS - retroactive adjustment - - -
Dividends per share
Cash dividends 4.6 5.1 -
Stock grants
Stock dividends from
retained earnings - - -
Stock dividends from
capital reserve - - -
Accumulated undistributed dividend - - -
Analysis of return
on investment
P/E Ratio (Note 4) 11.67 10.20 -
P/D Ratio (Note 5) 14.34 14.82 -
Cash dividend yield (Note 6) 6.97% 6.75% -
Note 1: List the highest and lowest market price for each year and calculate the average market price for each year based on
the annual transaction value and volume.
Note 2: Based on the distribution of resolved by the shareholders’ meeting next year.
Note 3: Pending for shareholders resolution of 2019.
Note 4: P/E = Current average closing price per share/EPS.
Note 5: P/D Ratio = Current average closing price per share/Cash dividends per share.
Note 6: Cash dividend yield = Cash dividends per share /Current average closing price per share.
Note 7: The Company’s financial statements as of March 31, 2019 haven’t been reviewed by independent auditors.

58
(VI) Dividend policy and its implementation status:
1. Dividend policy:
The dividend policy defined in the Company’s Articles of Association is as follows:
Article 23-1: If the Company’s annual financial statement shows surpluses, the business income tax
shall be paid first to compensate for the previous losses and the remaining 10% is distributed to the
legal reserve, except when the legal reserve has reached the Company’s paid-in capital. Based on
the Company’s operating needs and the regulations, special reserve is distributed. The board shall
provide a earnings distribution proposal submitted to the shareholders’ meeting for resolution if
there are surpluses and undistributed earnings at the beginning of the period.
The Company’s dividend policy is based on the corporate funding needs in the future and is
determined by the corporate earnings, financial structure, and funding needs of the future business
plan. 10%~90% of the cumulative distributable earnings are also appropriated and distributed after
the Board drafts an earnings distribution motion and submits to the shareholders’ meeting for
resolution on the distribution of shareholders’ dividends. As for the distribution ratio of stocks or
cash dividends, the stock dividend is limited to 50%. The annual shareholders’ meeting can still
decide the most suitable way of dividend distribution depending on the industry condition, with the
Company’s benefits and development served as the highest principle. The Company expects no
major change in dividend policy.
Take the dividends distributed by the Company in the past three years as an example, the dividend
pay-out ratio of 2016, 2017 and 2018 is listed in the table below. The cash dividend distribution rate
is not less than 50% of the total dividends distributed of the year, and the amount of distribution is
10% to 90% of the distributable earnings.
Unit: NT Dollar per share
Year After-tax EPS
(A)
Cash distributed
with retained
earnings (B)
Cash distributed
with capital
reserve (C)
Total cash
dividends
(B+C=D)
Dividend payout
ratio (D/A)
Cash dividend
payout ratio
(B+C)/D
2016 4.68 4.0 0 4.0 85% 100%
2017 5.65 4.0 0.6 4.6 81% 100%
2018 7.41 5.1 0 5.1 69%(Note) 100%
Note: Due to the completion of a capital increases in early 2019, if calculated by the total amount distributed, the
distribution ratio is 81%. Unit: NT$ thousand
Year Distributable earnings Amount Issued Issuing ratio
2016 890,538 256,404 28.79%
2017 944,357 294,865 31.22%
2018 1,080,293 377,711 34.96%
2. The resolution of dividends distribution approved by the Board of Directors on March 4, 2019 will
be reported to the general shareholders’ meeting and implemented thereafter:
2018 Distribution status of stock dividends
Unit: NT$ thousand
Stock dividend item Amount Dividends per share
Shareholders’ dividends 377,711 NT$ 5.1 in cash
Employee cash bonus 42,000 -
Compensation to directors and supervisors 18,000 -
(VII) The effect of current year’s proposed stock grants on corporate operating performance and EPS:
There are no proposed stock grants this year, and thus is not applicable.
(VIII) Compensation to directors, supervisors and employees:
1. Related information of the profit sharing bonus to employees and compensation to directors and
supervisors as listed in the Company’s Article of Association:

59
According to the regulations of the Company’s Articles of Association, if there is any annual
earnings surplus, 5%~10% of them shall be appropriated as employee remuneration, and a
percentage not higher than 5% shall be remuneration of directors and supervisors. If the Company
still has accumulated losses, the earnings shall be retained for refilling the loss amount, and the
compensation to employees, directors and supervisors are then calculated based on the balance
amount.
Employee compensation can be stocks or cash, and the parties to be distributed include the
employees of the associate companies who satisfy a certain criteria. The profit of the current year
mentioned in Item 1 refers to the pre-tax profit of the year minus the compensation distributed to
employee, directors and supervisors. Distribution of compensation to employees, directors and
supervisors shall be agreed by the Board of Directors with more than two-thirds of directors
attending and resolved by more than a half of the attending directors.
2. Accounting treatments for estimated basis of employee compensation and remuneration for
directors and supervisors in the current period, calculation basis for number of shares for stock
bonus distribution and the difference from the actual distribution: When the Company’s estimated
amount in 2018 is different from the actual amount, it is incorporated in the adjustment of profit and
loss account for the estimated changes in 2018.
3. Information of the distribution resolution of employee compensation approved by the board:
(1) The Company’s board resolution on Mar. 4, 2019 that the earnings surplus of 2018 shall be
distributed as the compensation to employees, directors and supervisors, and the difference
from the estimated amount in the expense recognition year are as follows:
Unit: NT$ thousand
Distribution item
Distribution status
Employee
compensation
Compensation to directors
and supervisors
Dealing with
differences
Estimated amount for the expense
recognition year (A) 42,000 18,000
No difference Issues proposed by the board (B) 42,000 18,000
Difference (B) - (A) 0 0
(2) Employee stock remuneration proposed as a percentage of the total amount of current net
income and employee compensation:
The earnings surplus for the current year is expected to be distributed in cash, and thus is not
applicable.
(3) The imputed EPS for the proposed stock remuneration paid to employees, directors and
supervisors: NT$ 7.41.
4. Distribution of last year’s earnings surplus paid to employees, directors and supervisors:
The resolution of the Company’s board meeting and the shareholders’ meeting on Mar. 26, 2018 and
Jun. 20, 2018 on the 2017 earnings distribution proposal for compensation paid to employees,
directors and supervisors, and the difference from the estimated amount in the expense recognition
year:
Unit: NT$ thousand
Distribution item
Distribution status Employee compensation
Compensation to directors
and supervisors
Dealing with
differences
Amount proposed by the board (A) 31,000 13,000
No difference Issues proposed by the board (B) 31,000 13,000
Difference (B) - (A) 0 0
(IX) Buyback of common stocks: None.
4.2 Issuance of corporate bonds:None
4.3 Issuance of preferred shares: None.

60
4.4 Issuance of GDRs: None.
4.5 Issuance of employee stock warrants: None.
4.6 Issuance of new restricted employee shares
(I) The new restricted employee shares had the expiration date at Sept.30 2018.
Type of employees restricted shares First issue of employees restricted shares in 2014
Effective date of declaration Jul., 8, 2014
Issuing date (record date for capital
increase)
Sep. 30, 2014
Employees restricted shares issued 2,400,000 shares
Issuing price NT$ 23
Number of employees restricted
shares issued as a percentage of total
shares issued
3.87%
Vesting condition on employees
restricted shares
Employees who have been employed and passed the performance assessment since the four-year
period after they were granted with new shares (on the record date for capital increase) will obtain
100% of the vesting new shares. Otherwise, they will not be able to obtain new shares.
Limited rights of new restricted
employee shares
1. The restricted new shares allotted to employees have to be in trust custody by the Company
before achieving vesting conditions.
The trust contract is signed between the representative assigned by the Company on behalf of
the allotted employees and the stock custody institution assigned by the Company. At the expiry
of 4 years and the vesting conditions are met, the vested shares will be transferred to
employee’s individual depository account.
2. During the vested period, employees must not sell, pledge, transfer, give or dispose of the
restricted new shares in any other form. However, participation in stock and yield distribution is
allowable and the distributed stock is not covered by trust custody. Other rights and obligations
are the same as the outstanding common stock.
3. The attendance, proposals, speeches and voting rights of shareholders' meetings shall be
executed by the custody institution in accordance with laws.
Custody status of restricted
employee shares
Taishin International Commercial Bank Restricted Stock Entrust Account
Issues on failing to meet vesting
conditions after the employees are
assigned or subscribed for new
shares
While failing to meet the vesting conditions, the issue shall be handled in accordance with the
following ways:
1. Employees who resign, retire, suffer from occupational disability, die or take a leave of absence
without pay are deemed to be ineligible for meeting the vesting conditions on the day of
resignation, lay-off, retirement, or death. The Company will buy back the shares at the issue
price.
2. If employees are transferred to the affiliated businesses due to the corporate operating needs,
the ratio of the vesting condition achievement can be approved by the Chairman.
Number of new restricted employee
shares recovered or bought back
339,000 shares
Number of released restricted new
shares
None
Number of restricted new shares 2,061,000 shares
Ratio of restricted new shares to
total shares issued (%)
None
Effects on shareholders’ equity The number of employee restricted new shares issued this time is 2,400,000 shares. It composes
3.87% of the total outstanding shares prior to the issue. The transfer of the new restricted shares is
prohibited before meeting the vesting conditions. The amount that may be expensed in the issue has
no significant effect on shareholders' equity.(The actual issued shares are 2,061,000 shares)

61
(II) Information of the acquisition of restricted new shares by the management and the Top 10 employees
Sept. 30, 2018 thousand shares; NT$ thousands
Title Name
Number of
restricted
new shares
acquired
Ratio of
acquired
restricted
new shares
to total
shares
issued
Released restricted rights Non-released restricted rights
Numbers of
released
restricted
shares
Issueprice IssueAmount
Ratio of
released
restricted
shares to
total shares
issued
Number of
non-released
restricted
sharesNumber of
Shares
Issueprice IssueAmount
Ratio of
non-released
restricted shares
to total shares
issued
Man
ager
Chief
Executive
Officer
Sheng-Ho
Chang
1,146 1.85% 1,146 NA NA 1.85% 0 NA NA 0
Deputy CEO Wen-Hua Tsai
South China
Business
Headquarters
-Chairman,
TOPCO
(Guangzhou)
Trading Co., Ltd
Chinghung Lin
General
Manager,
Taiwan
Business
Headquarters
Fu-Jen Cheng
General
Manager, East
China Business
Headquarters
Tsai-Meng
Wang
General
Manager, South
China Business
Headquarters
Ming-Tso
Hsiao
CFO Kun-Ming Wu
Executive
Assistant for
Chairman
Ching-Hsiung
Wen
Executive
Assistant for
Chairman
Chung-Yen
Wang
Deputy General
Manager, East
China Business
Headquarters
Liang-Hsin
Hsieh
Associate
Manager Pin-Nan Liao
Associate
Manager Yulin Huang
Associate
Manager
Pin-Chuan
Chen
Associate
Manager Yang-Fu Fan
Associate
Manager
Chih-Ching
Hsu
Associate
Manager
Su-Hsien
Hsieh
Associate
Manager Meng-Ju Wu
Associate
Manager Chao-Pang Lo
Associate
Manager Yu-Shu Liu
Associate
Manager
Peng-Hung
Chen
Em
plo
yee
Manager Cheng-Yen Wu
292 0.47% 292 NA NA 0.47% 0 NA NA 0
Manager Shih-Wei Gu
Manager Cheng-Lin Li
Manager Yu-Chun Sun
Manager Hsin-Jung Su
Manager Wei-Lun Ho
Deputy manager
Tai-Yuan Wu
Deputy manager
Kuo-Chang
Tsai
Associate
manager Tai-Wei Chiu
Associate
manager
Hung-Chih
Hsu

62
4.7 Issuance of new shares upon any merger and acquisition with other companies: None.
4.8 Implementation of fund utilization plan:
Issuance Plan Cash Capital Increase of 2018
Issuance Amount The total amount is 6 hundred million, 10, million shares issued at par
value10dollars, and the issuance pirice is 60 dollars per share.
Item
Use of Capital
First Quarter of 2019
The proposal amount The Actual Drawdown Completion Rate
1. Reinvestment of
TOPCO Trading
(Shanghai Pudong
District) Co., Ltd.
155,000
thousand dollars
0
0(Note)
2. Reinvestment of
TOPCO
(Guangzhou)
Trading Co., Ltd.
155,000
thousand dollars
0
0(Note)
3. Enrich the working
capital in Taipei.
290,000
thousand dollars
290,000
thousand dollars
100%
(Note) The subsidieries are lookimg for the suitable office. Therefore first quarter has no actual drawdown

63
5. Operational Profile
5.1 Business content:
(I) Business scope:
1. Main areas of business operations:
(1) International trade;
(2) Wholesale of industrial catalyst;
(3) Wholesale of chemistry raw materials;
(4) Retail sale of industrial catalyst;
(5) Retail sale of chemistry raw materials;
(6) Other comprehensive retail sales.
2. Main business content and proportion:
Item 2018 (Consolidated revenue)
Revenue Percentage
Silicone related products, PTFE (Poly tetra
fluoroethylene), COLCOAT (silicate, anti-static
agents), cosmetic materials, UV curing adhesive, AF
coating agent, VUV washing machines, construction
products and other trading products, etc.
8,545 million dollars 100%
3. Current products (services):
Business item
Agent for Silicone related products:
Silicone fluid and modified Silicone fluid, Silicone defoaming agent, Silicone release agent, Silicone foam
stabilizer, Silicone fiber treatment, Silicone paint additives, Silicone resin, Silicone coupling agent, paper
release agent, Silicone PSA, Silicone powder, HTV, LIMS, RTVI, RTV II, Silicone grease, sealant, MS-RTV,
grease, thermal pad material, LED application materials and AF coating agent.
Konishi products: Sealant materials and various adhesives.
Sumitomo products: PTFE film and so on.
Sika Group products: Construction structural adhesives and various types of sealants.
Den Braven product: Free nail glue, etc.
Others: Environmental catalysts, micro-capsule foam materials, COLCOAT (silicate, anti-static agents),
cosmetic raw materials and finished products, Gunze fluorine sleeves, UV curing glues, atmospheric plasma,
VUV washing machines, conductive polymers and other trade products.
(II) Industry overview:
1. Current state and development of the industry: (The Company's main products are based on
Silicone, and therefore only Silicone related industries will be introduced.)
Silicone products base silicon dioxide (SiO2) as a basic raw material to extract metal Si, and methyl
chloride is added to form a series of chemical reactions and polymerization to form compounds
composed by Si/O and various organic. Polymers are then subjected to various processes such as
refining and hydrolysis to form a variety of Silicone products. Due to its special molecular structure,
Silicone has the characteristics of heat resistance, cold resistance, weather resistance, defoaming,
foaming, softness, chemical stability, electrical insulation, defoaming, release and water repellency
through the addition of different chemical elements. Its product shape may also be oily, resin, rubber
and other types. Due to its wide aspects of application, manufacturers of Silicone products must
meet the individual needs of downstream customers to adjust product characteristics. Therefore,
manufacturers have thousands of kinds of products, and now have extensively entered the electrical
and electronic, plastic, paper, textile, medical, cosmetics, construction, automotive and other
industries. Silicone adds additional value to these related products. In terms of the properties of

64
products, it can be divided into Silicone fluid (modified Silicone fluid), various additives (e.g.,
coatings and cosmetics, etc.), defoaming agent, fiber treatment, release agent, PSA, Silicone resin,
silane, HTV, LIMS, RTV, lubricating oil and sealant. In terms of product application, it can be
roughly divided as follows:
(1) Energy-saving related applications:
A. Wind power industry: used in raw materials of large wind power blade. Example: Add
carbon fiber or glass fiber to epoxy resin to increase the strength and adhesion.
B. Transformer oil for high speed oil
C. LED industries: LED packaging, solid crystal, LENS and other materials.
D. Power supply Inverter: LED and the usage of solar power insulation and potting.
E. The application of high-voltage electric insulation barriers, replacing the old ceramic
materials, and can reduce the attenuation of power transmission and prolong the service
life of the insulation barrier.
(2) 3C related products:
A. Shell of PC, NB, PRINT M/C; using a flame resistant PC with Silicone added.
B. Various keyboards which are used extensively. For example: mobile phones, keyboards,
and remote controls, etc.
C. Antistatic materials.
D. Waterproof accessories for smart phones、tablet PC、game machine and wearable devices
E. Upstream materials for electronic products: copper foil treatment, glass fiber cloth
processing, and the adjunction of Silicone in EMC to improve its characteristics, etc.
F. All kinds of thermal materials for electronic products.
G. Rollers and electronic components for multifunction machine.
H. Anti-fouling coating agent for touch panel material.
(3) Environmental issues:
A. MARK for Silicone rubbers replacing PVC for the production of footwear and apparel.
B. Silicone replaces halogen or phosphorous flame retardants and produces products such as
flame-resistant PCs and flame- resistant wires.
C. The related applications of 3C products mentioned above are in line with the EU
environmental protection regulations.
(4) Application products for daily life:
A. Cotton, fiber and wool clothing are softer and better after the treatment of Silicone
material. For example: Silicone is used in the wire industry as lubricant for rapid winding.
B. Curtain wall, interior waterproofing of buildings, external wall waterproofing and surface
coating applications.
C. Materials for components of automotive engine piping, oil seals, and mars plug caps.
Automotive industry also includes application in electric vehicle batteries, tire pressure
detectors, reversing radar, potting, and subsequent, etc.
D. Cosmetic materials, Silicone adhesives for high temperature adhesive tapes, and release
agents for trademark papers.
E. Pacifiers, diving masks and other products.
F. Cake bakeware and kitchen supplies.
G. Electric vehicle battery module gluing and heat dissipation.
H. Coating for boats and yachts.
(5) Medical related:
A. First aid masks, snore devices, medical tapes, and various medical catheters.
The application scope of Silicone products has spread throughout the food and clothing
industry. It has become an indispensable cornerstone of modern life, and its non-toxic and
harmless characteristics are more in line with the requirements of modern people for
environmental protection. In terms of global usage, the largest market is in the United
States, the second are Europe, China and Japan. Therefore, its usage status has a positive
relationship with the country's economic growth and development. Therefore, if the
economy continues to grow, the market size of Silicone products will continue to grow.

65
2. Correlation among upstream, midstream and downstream sections of the industry:
The main business of the Company is the sale of Silicone products. The products have a wide range
of usage. The application range in downstream end reaches food, clothing, housing, transportation,
education and entertainment related industries. The upstream association industry table of Silicone
products is as follows:
Si
C6H5Cl
CH3Cl
Methyl silaneVinyl silane
Phenyl silane
Monomer synthesis
Hydrolysis
Import special functional group
Refine
Polymerization
Polymerization
Liquid Injection Molding System
Silane
Silicone oil
Resin
Silastic
Silane
Silicone oil
Modified Silicone Oil
Lubricating oil/compound oil
Release Agent
Fiber Treatment Agent
Paper Release Agent
Defoamer
Foaming Agent
Silicone resin
Paint Additives
One-Liquid Type RTV
Two-Liquid Type RTV (Mold Gel)
sealant
Silicone Rubber
LIMS
Two-Liquid RTV (for Electronic Appliance Use)
Coupling agent
Heat shrink tubing/heat durable, electroconductive
rubber
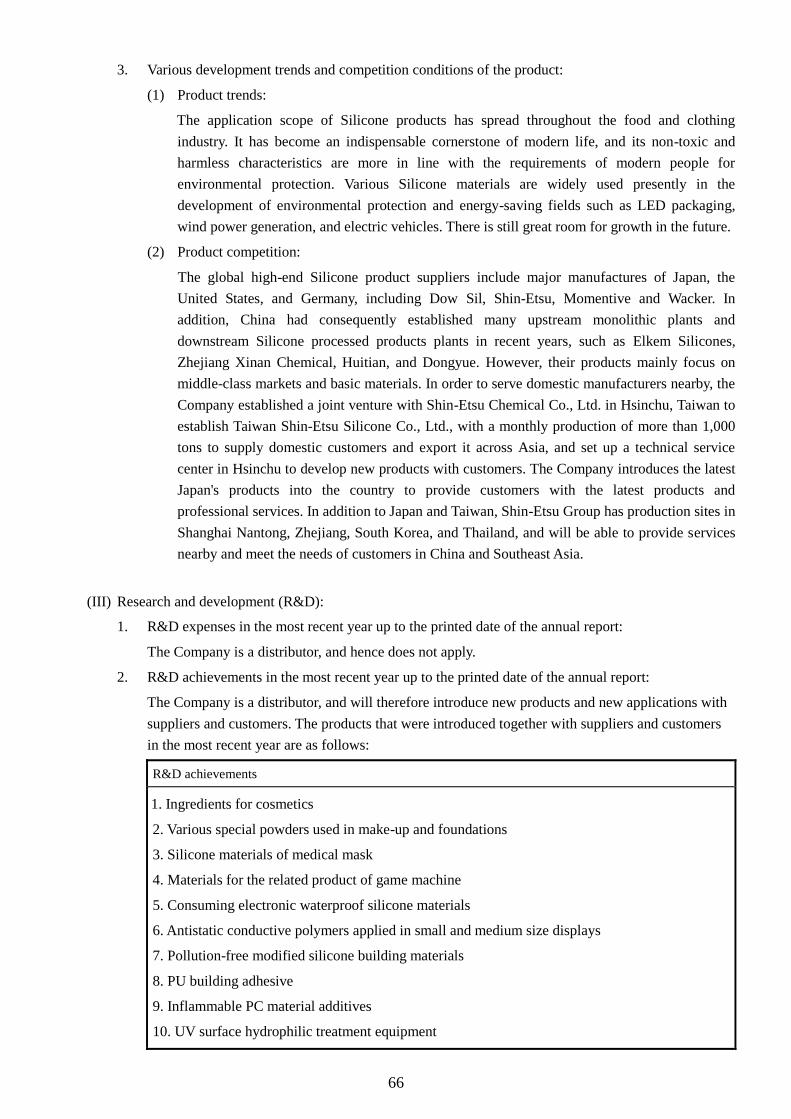
66
3. Various development trends and competition conditions of the product:
(1) Product trends:
The application scope of Silicone products has spread throughout the food and clothing
industry. It has become an indispensable cornerstone of modern life, and its non-toxic and
harmless characteristics are more in line with the requirements of modern people for
environmental protection. Various Silicone materials are widely used presently in the
development of environmental protection and energy-saving fields such as LED packaging,
wind power generation, and electric vehicles. There is still great room for growth in the future.
(2) Product competition:
The global high-end Silicone product suppliers include major manufactures of Japan, the
United States, and Germany, including Dow Sil, Shin-Etsu, Momentive and Wacker. In
addition, China had consequently established many upstream monolithic plants and
downstream Silicone processed products plants in recent years, such as Elkem Silicones,
Zhejiang Xinan Chemical, Huitian, and Dongyue. However, their products mainly focus on
middle-class markets and basic materials. In order to serve domestic manufacturers nearby, the
Company established a joint venture with Shin-Etsu Chemical Co., Ltd. in Hsinchu, Taiwan to
establish Taiwan Shin-Etsu Silicone Co., Ltd., with a monthly production of more than 1,000
tons to supply domestic customers and export it across Asia, and set up a technical service
center in Hsinchu to develop new products with customers. The Company introduces the latest
Japan's products into the country to provide customers with the latest products and
professional services. In addition to Japan and Taiwan, Shin-Etsu Group has production sites in
Shanghai Nantong, Zhejiang, South Korea, and Thailand, and will be able to provide services
nearby and meet the needs of customers in China and Southeast Asia.
(III) Research and development (R&D):
1. R&D expenses in the most recent year up to the printed date of the annual report:
The Company is a distributor, and hence does not apply.
2. R&D achievements in the most recent year up to the printed date of the annual report:
The Company is a distributor, and will therefore introduce new products and new applications with
suppliers and customers. The products that were introduced together with suppliers and customers
in the most recent year are as follows:
R&D achievements
1. Ingredients for cosmetics
2. Various special powders used in make-up and foundations
3. Silicone materials of medical mask
4. Materials for the related product of game machine
5. Consuming electronic waterproof silicone materials
6. Antistatic conductive polymers applied in small and medium size displays
7. Pollution-free modified silicone building materials
8. PU building adhesive
9. Inflammable PC material additives
10. UV surface hydrophilic treatment equipment

67
(IV) Long- and short-term development:
1. Short-term development:
(1) Product development strategy
A. Develop special materials and special applications with customers and upstream suppliers,
such as electric power, medical care, and automotive applications, etc.
B. Continue to develop environmental friendly and energy-saving application materials.
(2) Marketing plans
A. Cultivate marketing staff with professional backgrounds in Japanese and various
industries to provide the most professional services for customers.
B. Establish marketing service bases in China to serve customers nearby.
C. Establish companies in Southeast Asia to expand the Southeast Asian market.
D. Further sales of related equipment based on sales materials to provide customers with full
integration.
2. Long-term development:
(1) Product development strategy
A. Focus on Silicone as the core to develop related key materials.
B. Jointly apply patents for applications of special materials with suppliers and customers.
(2) Marketing strategies
A. Expand the marketing team in China and the Southeast Asia.
(3) Business strategy
A. Pursue excellence; create the future and the win-win situation with suppliers and
customers.
B. Emphasize on the rights of both employees and shareholders for maximum value for the
Company.
C. Look for strategic partners for share investment to strengthen business cooperation
between the two parties.
5.2 Marketing and production profile:
(I) Market analysis:
1. Main products and sales area (Consolidated revenue):
Unit: NT$ thousand
Year
Area
2017 2018
Sales amount % Sales amount %
Domestic sales 2,817,291 36.72 3,196,619 37.41
Exports
China 4,632,637 60.38 5,081,179 59.47
Other Country 222,408 2.90 266,869 3.12
Subtotal 4,855,045 63.28 5,348,048 62.59
Total 7,672,336 100.00 8,544,667 100.00

68
2. Market share
Currently there are no official or professional organizations to conduct statistical analysis.
According to the customs import data, the Company’s Silicone products are about 30% of Taiwan's
imports.
3. Future supply and demand and growth of market
(1) The Silicone products are widely used in various industries such as high-tech industries and
people's daily necessities. New application areas are continuingly being developed, and
therefore the growth of product is higher than general economic growth rate. In terms of the
supply aspect, in the past few years, China had successively produced new production capacity,
which led to the decrease of prices of some products due to supply exceeding demand.
However, since the second half year of 2016, manufacturers in China have reduced production
capacity due to environmental issues and other factors. With the regional economic growth
slowdown in China, this part came to an end in the first half of 2018. However, major
manufacturers around the world optimistic about subsequent global demand have announced
their factory expansion plans. In the future, value-added product development will remain the
major focus.
(2) Niches in competition
A. With shares investment, Shin-Etsu changed from simple agent to shareholder, which
strengthened the cooperation between two parties. Shin-Etsu's Silicone products have
high market share in the Asian market. The Company and Shin-Etsu have cooperated for
decades and show outstanding agents performance. The two parties have established a
co-existence and co-prosperity relationship. In addition, through the invested shares from
Shin-Etsu, the cooperation relationship will become closer.
B. The access to market had complete layout. In order to provide the best services for
customers, currently the Company has established marketing bases in Hong Kong,
Shanghai, Guangzhou, Suzhou, Ningbo, Xiamen and Beijing in addition to Taiwan. In
2015, the subsidiaries were officially established in Indonesia and Vietnam.
C. The establishment of Taiwan Shin-Etsu Silicone Co., Ltd. allows the development of new
products based on the need of customers. Hsinchu Shin-Etsu Technology Center is
currently the only professional Silicone product research center in the country. Through
the R&D technology cooperation between both parties, new products can be developed
for different customer orders. Meanwhile, Hsinchu Technology Center is separated from
other peers’ strategy which merely establishes domestic sales channels.
D. The product line is complete: The Company has agent for more than 4,000 products of
Shin-Etsu Group's full-range products. The products’ application fields cover all
industries, not only meeting the customers’ needs but also reducing the adverse impact of
economic fluctuations.
4. Favorable, unfavorable Factors and countermeasures in the long run:
(1) Favorable factors
A. Market for Silicone continues to grow
The demand for Silicone increases at the same level as the economic development level

69
of a country. The main selling markets of the Company’s Silicone products are Taiwan
and China. ASEAN Market is another area with developing potential in the future.
Therefore, the Company also set up marketing bases in Indonesia and Vietnam.
B. Continuingly develop new application areas
Silicone materials have continuously been developed in new application areas in recent
years. Not only the materials conform to the trend of environmental protection, but also
are more closely integrated with daily necessities, in order to achieve the goal of making
Silicone a “life technology” material.
(2) Unfavorable factors
A. Purchases focus on Shin-Etsu products
The Company mainly distributes the products of Shin-Etsu Chemical, an internationally
renowned manufacturer. The product percentage from Shin-Etsu and its related
companies from Japan is high. Thus, the stability of product agency rights has become the
key factor in the success of the Company.
Countermeasures
(a). To effectively maintain agency rights, through the way of having Shin-Etsu investing in
the Company, the relationship between the two parties has been strengthened and changed
from simple distributors to shareholder relationship.
(b). In addition to continuously acquiring the agency rights of various newly-developed
Silicone products of Shin-Etsu, the Company has also actively increased the agency of
other related brands. The Company gradually spreads the risk of single brand agency.
B. There is difficulty to collect receivables in China, and the risk of accounts receivable is
high.
Countermeasures
The Company has carried out accounts receivable insurance since 2015 to reduce the risk of
collecting receivables.

70
(II) Production procedure and important use of main products:
1. Important use of main products
(1) Silicone products from Shin-Etsu
Product type Usage
Silicone fluid Line manufacturing industry, cosmetics, and basic materials for RTV
Silicone defoaming agent Green paint for electronic products and textile use
Silicone foam stabilizer Foaming memory pillow
Fiber treatment Handle the tactile treatment of various fibers
Paper release agent Label paper and tape release layer
Silicone resin Electronic tape, heat-resistant coating
Silicone silane Fiberglass cloth, copper foil substrate, IC package
PSA Protective film for mobile phones, insulating tape, mica tape and so on.
RTV Subsequent for various electronic parts, perfusion, construction
industries, temporary molds
Lubricating oil, fluid compounds,
thermal pad material
NB-CPU heat dissipation, heat dissipation of small home appliances,
and power insulation
HTV Phone keyboards, remote control buttons
LIMS NB keyboards, pacifiers, diving masks, medical supplies
For LED Packaging and die bonding
(2) Other agency products
Product type Usage
Konishi Sealant and adhesives Construction sealant, electronic adhesives, adhesives for people's
livelihood
Sumitomo PTFE film Semiconductor, chemical industry filtration
Sika Weatherproof structural
adhesive Waterproof, weatherproof, structural edge
Den Braven products Free nail glue
Cosmetic materials
Essence, lotion, cream, foundation, lipstick, sunscreen, capsule,
whitening, anti-aging, moisturizing, skin care and powder surface
treatment, etc.
Antistatic materials Antistatic film surface coating, and so on
Gunze Fluorine tube, shrink tube (coating and anti-fouling)
Ushio VUVwashing machine (Physically improve subsequent effects)
Others UV-curable adhesive, atmospheric plasma and general trade products
2. Production process
The Company is professional distributor for Silicone products, and is not a manufacturer. Therefore,
there is no production process. For the industry-related diagram of Silicone please, please refer to
“(2) Industry Overview, B. Correlation among upstream, midstream, and downstream sections of
the industry.”
(III) Supply status of main materials:
Mainly from the Shin-Etsu Chemical Group in Japan (Shin-Etsu Shanghai, Shin-Etsu Japan, Shin-Etsu
Taiwan, Shin-Etsu Hong Kong and Shin-Etsu Singapore, etc.) and other suppliers.

71
(IV) List of customers that account for more than 10% of total sales within either of the last two years, their purchase amount and ratio:
1. Major suppliers in the most recent 2 years
Unit: NT$ thousand
2017 2018
Item Name Amount
As a
percentage to
the yearly net
purchases (%)
Relationship
with the issuer Name Amount
As a
percentage to
the yearly net
purchases (%)
Relationship
with the issuer
1 Shin-Etsu
Taiwan 2,230,564 35.62 Related party
Shin-Etsu
Taiwan 2,262,077 32.31 Related party
2 Shin-Etsu
Shanghai 1,763,461 28.16 Related party
Shin-Etsu
Shanghai 1,980,314 28.29 Related party
3 Others 2,267,252 36.22 - Others 2,758,624 39.40 -
Net purchase 6,261,277 100.00 Net purchase 7,001,015 100.00
<Note> The Company’s financial statements as of March 31, 2019 haven’t been reviewed by independent auditors.
2. List of customers that account for more than 10% of total sales within either of the last two years, their purchase amount and ratio: No clients have
accounted for more than 10% of the total sales amount.

72
(V) Production in the most recent 2 years: The Company is not a manufacturing business, and thus is not
applicable.
(VI) Consolidated sales volume in the most recent 2 years:
Unit: NT$ thousand
Year
Sales Volume
Major product
2017 2018
Domestic sales Exports Domestic sales Exports
Quantity Value Quantity Value Quantity Value Quantity Value
All kinds of
materials and
other trade
products
- 2,817,291 - 4,855,045 - 3,196,619 - 5,348,048
Note: Because of the different unit types of materials, such as kilograms, tablets, sticks, and rolls, the quantities are not
shown.
5.3 Basic information of employees:
The number, average years of service, average age, and education distribution ratio of employees in the
most recent two years up to the printed date of this annual report:
Year 2017 2018 Until April 15, 2019
Employee
number
Managing and marketing staff 237 229 241
Manufacturing staff 0 0 0
R&D personnel 0 0 0
Total 237 229 241
Average age 36.19 36.16 36.51
Average tenure (year) 9.08 9.23 9.54
Distribution
(%) of
educational
background
Percentage
(%)
Ph.D. 0.42% 0.41% 0.41%
Master 16.03% 16.26% 16.26%
Bachelor 77.22% 76.83% 76.83%
Senior high school 5.06% 5.28% 5.28%
Below senior high school 1.27% 1.22% 1.22%
5.4 Information of environmental protection expenditure:
(I) The Company’s loss due to environmental pollution (compensation), total amount of disposal, future
countermeasures and possible expenditures in the most recent two years up to the printed date of the
annual report date
1. Loss due to environmental pollution and amount of disposal: None.
2. Future countermeasures and possible expenditures: The Company's products comply with EU
environmental regulations, and therefore there are no environmental pollution problems.
5.5 Labor relations:
(I) Company's employee benefits, education, training, retirement system and their implementation, as
well as the employer/employee agreement status:
1. Staff behavior and codes:
(1) The Company has prepared work codes, employee manuals and new personnel manuals,
and has codes of conduct for employees' ethical behavior as a basis for employees to
follow on their normal work and behavior. The Company’s employees should abide by the
Codes of Ethical Conduct as follows:

73
(A) In the execution of their duties, the Company’s employees shall focus on teamwork,
abandon sectionalism, diligently comply with the principle of honesty and credibility,
be proactive, responsible and prudent.
(B) No form of preferential treatment or discrimination should take place in any form
based on race, sex, religious beliefs, political party affiliation, sexual orientation,
position, nationality, or age.
(C) The Company’s employees should work to maintain a safe and healthy environment,
and there should be no instances of harassment, or violent and threatening behavior.
(D) The Company’s employees shall faithfully execute their duties in the interests of all
shareholders, and shall prevent the following activities:
(a) Seeking an opportunity to pursue personal benefits by using the Company’s
property or information or taking advantage of their positions.
(b) Competing with the Company through any methods.
(E) The Company’s employees should treat the objects of business fairly; when dealing
with related parties, there must not be special concessions. In the performance of
their duties, the employees of the Company shall not request, contract, deliver or
receive any form of gift, entertainment, rebate, bribe or other improper interest for
the interests of their own or a third person. However, the gift or entertainment
provided by the courtesy of social etiquette or allowed by the company regulations is
not limited.
(F) For the work-related knowledge and any information that could affect the share price
of the Company’s stock, before it has been disclosed as public information, all
information shall be kept confidential pursuant to the Securities and Exchange Act
regulations and shall not be used to engage in insider trading.
(G) The Company’s employees should respect each other's personal privacy, and shall
not spread out rumors or hurt each others by rumoring. The employees’ work-related
knowledge, confidential information or customer data shall be carefully managed,
and except for that required for company disclosure or publicized as required by law,
the data should not be leaked to others or used for any other non-work matters. This
Article also applies to the employees who have left the Company.
(H) The Company’s employees are obliged to keep the information of the Company and
its clients confidential. Information shall not be disclosed prior to Company’s
authorization or as required by law, and shall not be leaked to other persons or used
for any other non-work matters. The confidential information includes, but is not
limited to, any undisclosed information that may be utilized or divulged by
competitors and can consequently cause damage or loss to the Company or its clients,
as well as information regarding the investments, inventions, business secrets,
technical data, product design, professional manufacturing knowledge, finance,
accounting and intellectual property rights of the Company.
(I) Employees of the Company should ensure that all forms of paperwork handled by
them are correct, complete and properly preserved.
(J) When employees of the Company are performing their duties, they should avoid
theft, interference, destruction, and intrusion of resources such as data, information
systems, and network equipment to protect the confidentiality, integrity, and
availability of the company's information.
(K) The employees of the Company must not influence other employees in any way to
contribute politically, support specific political parties or candidates, or participate in
other political activities.

74
(L) The employees of the Company should respect the relevant legal provisions of
intellectual property rights and prohibit the illegal use or reproduction of copyrighted
intellectual property, including books, magazines, and software.
(M) The management of the Company should strengthen the publicity of the Company’s
internal ethical values, and encourage employees to provide named report to the
director when they discover violations of the laws and regulations or these Codes.
The Company should do its utmost to protect the confidentiality and protect the
identity of the presenter from threats.
(2) In order to maintain the equality of work for both sexes and to provide employees with
protection against sexual harassment, the Company has established measures for the
prevention and treatment of sexual harassment for all employees.
(3) The computer is an essential tool for employees of the Company. In order to regulate the
employees' use of electronic tools, Regulations on Management and Usage of the Internet
have been established for all employees to follow.
(4) In order to protect intellectual property rights, the Company has established the Ethical
Commitment Contract and the Copyright Commitment Letter to regulate the work ethic of
employees.
2. Employee benefit and implementation:
(1) In addition to statutory labor and health insurance, the Company insures employees with
group insurance (including life insurance, medical insurance and accident insurance, etc.)
In addition to taking care of long-term overseas colleagues and their family dependents’
medical insurance, overseas business FPAs are provided. By a complete insurance system,
the safety of work and life of each colleague are ensured.
(2) New year and holiday rewards, employee bonuses and year-end bonuses, etc.
(3) The Company withdraws provisions for the establishment of the Employee Welfare
Committee. Its responsibility is the planning and implementation of various benefits, such
as staff travel, family day activities, birthday cash gift, birthday party, allowances for
weddings and funerals, employee sports allowances, Topco Baby Golden Coins for the
newborn baby of the year and staff disease visits care, etc.
(4) Employees enjoy educational training within and outside the Company occasionally.
(5) Employees enjoy health checks every year.
3. Employee education and trainings:
The Company provides education and training for staff to improve their quality, enhance work
knowledge of staff, and to reserve talents to meet the Company's business development. To
seek the effectiveness on the use of labor, the Education and Training Method is established.
The Company established the Employee Assistance Program (EAP) with Shiuh-Li Cultural and
Educational Foundation since 2016. In addition to regularly holding pressure relief talks, the
Company provides free telephone consultation and 6-hour face-to-face consultative services
yearly to colleagues and their dependents to help them deal with invisible stress from personal,
family, life or work. By actively caring and timely assistance, we hope each colleague can
maintain the best physical and mental state at all times and maintain the efficiency and quality
at work.

75
Item Total people Total times Total amount (NTD)
1. New staff training 53 404.5 48,000
2. Professional training 1,926 1,866 243,765
3. Executive training 1,422 900 111,075
Total 3,401 3,190.5 402,840
The Company’s training courses include:
(1) New staff training: Including basic training for new staff and induction.
(2) Professional training: Based on relevant technology and professional training required by
each unit, such as development and application of memory materials, automated
application of liquid silicone processing, chemical courses, Japanese, Indonesian and
English language courses.
(3) Talent training of managers: Management and development training activities designed
based on the needs of managers of each level for management talent and management
responsibility. For example, notices for commercial contracts, evaluation of exchange rate
risk, and caring course for managers, etc.
The Company has established the “Education and Training Method” that encourages
employees not only to accept work education but also to participate in diversified external
training. In order to achieve the Company's business and personal development needs, the
Company’s courses include short-term study courses, long-term degree and language learning,
as well as providing employees education subsidies for the above courses.
4. Retirement system and implementation:
In accordance with the regulations, the Company selected new retirement pension method to
apply to the newly recruited employees monthly since July 1, 2005. They shall pay 6% of their
monthly salary to the personal Labor Insurance Pensions Accounts. Meanwhile, the Company
continues to withdrawal appropriate retirement provision to the account in Taiwan Bank
calculated according to the pension payment standard of the original employee retirement
system method for employees who choose the original retirement system method and the
reserved working years for employees who choose the new retirement system method. The
pensions of employees of subsidiaries in overseas regions are a defined system of
proprietorship. According to local government regulations, various types of social security
funds, such as pensions and medical care, are paid monthly.
5. Employer/employee agreements: In order to protect the labor’s rights and interests and to
coordinate relations between employers and employees, the Company is committed to
strengthening the harmony between the employers and employees and adopts two-way
communication to solve the problems. Therefore, the relation between the employer and
employees have been harmonious so far, and no significant labor disputes have occurred.
(II) The Company's losses and total fines due to employer/employee disputes within the most recent two
years up to the printed date of this annual report, and the current and future estimated monetary
amount and measures to be taken in response: The Company has no significant employer/employee
disputes.

76
(III) The company’s working environment, personal safety protection measures and implementation
conditions: The Company is not a manufacturer, and the employees’ workplace is a general office,
and therefore there is no labor security issue comparatively. However, the Company values the
safety of working environment and personal safety. Related protective measures have been
implemented as follows:
Protection measures Implementation
Building security guard The building is equipped with security personnel to maintain safety 24
hours a day.
Office access control The office has set up an employee fingerprint identification system for
access control.
Fire-fighting measures Place fire extinguishers in open spaces, occasionally fire alarms testing
and keep the emergency exits open. The building has the fire drill
exercise at least twice per year
Building construction If the building is under related constructions, the Management
Committee will also set up warning signs and dispatch relevant
personnel to direct people in addition to posting notices.
Building facilities maintenance The Management Committee will carry out regular maintenance more
than twice per year for elevators and drinking facilities, etc. The
building's public spaces and parking lots will also be disinfected more
tham once per year.
Prevention of sexual harassment In addition to advocacy, the Prevention and Report Method of Sexual
Harassment will also be posted on the bulletin board.
(IV) In addition, the Company has fully disclosed the identities of stakeholders, issues to be focused on,
communication channel and communication frequency in the identification item of stakeholders in
the CSR Report. On the company website, the responsive methods are also listed to make the
communication between stakeholders and the Company a virtuous cycle.
5.6 Important contracts:
The Company’s Supply and Sales Contracts, Technical Cooperation Contracts, Engineering Contracts,
Long-term Loan Contracts, and other important contracts that would affect the shareholders' equity that
remains valid and expired in the most recent year through the printed date of this annual report are as
follows: The Company and all its major suppliers have their own supply and sales contracts. These
contracts are all generally renewed each year and there are no major restriction clauses.

77
6. Financial overview
6.1 Condensed financial information of the most recent five years:
(I) Condensed Balance Sheet and Comprehensive Income Statement (IFRSs):
Condensed Balance Sheet - Consolidated
Unit: NT$ thousands
Year(s)
Item
Financial information for the most recent five years (Note 1)
2014 2015 2016 2017 2018
Current assets 4,054,366 3,985,354 4,050,661 4,228,990 4,510,944
Property, plant and equipment
(Note 2) 88,811 223,060 229,151 223,879 225,554
Intangible assets - - - - -
Other assets (Note 2) 233,056 180,582 146,258 196,306 211,992
Total assets 4,376,233 4,388,996 4,426,070 4,649,175 4,948,490
Current
liabilities
Before
distribution 1,137,521 1,079,597 1,202,864 1,312,135 1,419,606
After distribution 1,459,396 1,336,773 1,459,268 1,606,999 (Note2)
Non-current liabilities 91,738 162,333 162,403 142,525 144,863
Total
liabilities
Before
distribution 1,229,259 1,241,980 1,365,267 1,454,680 1,564,469
After distribution 1,551,134 1,499,156 1,621,671 1,749,544 (Note2)
Equity attributable to
shareholders of the parent
company
3,028,964 3,027,956 2,936,554 3,064,743 3,252,726
Capital 644,000 643,460 641,060 641,010 641,010
Capital surplus 1,068,719 1,001,093 986,645 986,344 954,075
Retained
earnings
Before
distribution 1,301,420 1,333,816 1,364,306 1,457,592 1,688,012
After distribution 979,545 1,076,640 1,107,902 1,162,728 (Note2)
Other equity 14,825 49,587 ( 55,457) ( 20,203) ( 29,971)
Treasury stock - - - - -
Non-controlling interest 118,010 119,060 124,249 129,752 131,295
Total equity
Before
distribution 3,416,974 3,147,016 3,060,803 3,194,495 3,384,021
After distribution 3,095,099 2,889,840 2,804,399 2,899,631 (Note2)
Note 1: The financial statements have been audited by independent auditors.
Note 2: Pending shareholders’ approval.
Note 3: The Company’s financial statements as of March 31, 2019 haven’t been reviewed by independent
auditors.

78
Condensed balance sheet - parent company
Unit: NT$ thousands
Year(s)
Item
Financial information for the most recent five years (Note 1)
2014 2015 2016 2017 2018
Current assets 1,485,113 1,392,645 1,342,229 1,391,446 1,435,445
Property, plant and equipment
(Note 2) 83,158 84,133 78,626 76,459 78,863
Intangible assets - - - - -
Other assets (Note 2) 2,056,598 2,117,873 2,129,506 2,311,696 2,558,557
Total assets 3,624,869 3,594,651 3,550,361 3,779,601 4,072,865
Current
liabilities
Before
distribution 505,429 488,133 535,840 643,314 733,473
After
distribution 827,304 745,309 792,244 938,178 (Note2)
Non-current liabilities 90,476 78,562 77,967 71,544 86,666
Total liabilities
Before
distribution 595,905 566,695 613,807 714,858 820,139
After
distribution 917,780 823,871 870,211 1,009,722 (Note2)
Capital 644,000 643,460 641,060 641,060 640,610
Capital surplus 1,068,719 1,001,093 986,645 986,344 954,075
Retainedearnings
Before
distribution 1,301,420 1,333,816 1,364,306 1,457,592 1,688,012
After
distribution 979,545 1,076,640 1,107,902 1,162,728 (Note2)
Other equity 14,825 49,587 (55,457) (20,203) (29,971)
Treasury stock - - - - -
Total equity
Before
distribution 3,028,964 3,027,956 2,936,554 3,064,743 3,252,726
After
distribution 2,707,089 2,770,780 2,680,150 2,769,879 (Note2)
Note 1: The financial statements have been audited by independent auditors.
Note 2: Pending shareholders’ approval.
Note 3: The Company’s financial statements as of March 31, 2019 haven’t been reviewed by independent auditors.

79
Condensed comprehensive income statement - consolidated
Unit: NT$ thousands(except earning per share)
Year
Item
Financial information for the most recent five years (Note 1)
2014 2015 2016 2017 2018
Operating revenue 7,519,065 7,112,910 7,233,102 7,672,336 8,544,667
Gross profit 1,190,124 1,163,034 1,163,737 1,372,415 1,644,651
Net operating income 431,158 388,057 380,592 496,995 645,916
Non-operating income
and expense 19,189 4,436 19,042 (20,582) 7,443
Net income before tax 450,347 392,493 399,634 476,413 653,359
Continued business
unitNet income 341,024 309,229 307,450 370,627 481,652
Loss from
discontinued
operations
- - - - -
Net income (loss) 341,024 309,229 307,450 370,627 481,652
Other comprehensive
income or loss (Net
amount after tax)
65,601 4,524 (144,673) 12,173 (2,490)
Total comprehensive
income or loss 406,625 313,753 162,777 382,800 479,162
Net income attributed
toowner of parent
company
318,790 289,900 290,044 350,138 463,242
Net income
attributable to
non-controlling
interests
22,234 19,329 17,406 20,489 18,410
Total comprehensive
income attributable to
owner of parent
company
384,191 294,259 145,454 362,736 460,631
Total comprehensive
income attributable to
non-controlling
interests
22,434 19,494 17,323 20,062 18,531
EPS 5.14 4.68 4.68 5.65 7.41
Note 1: The financial statements have been audited by independent auditors.
Note 2: The EPS is calculated by weighted average common stock outstanding.
Note 3: The Company’s financial statements as of March 31, 2019 haven’t been reviewed by independent auditors.
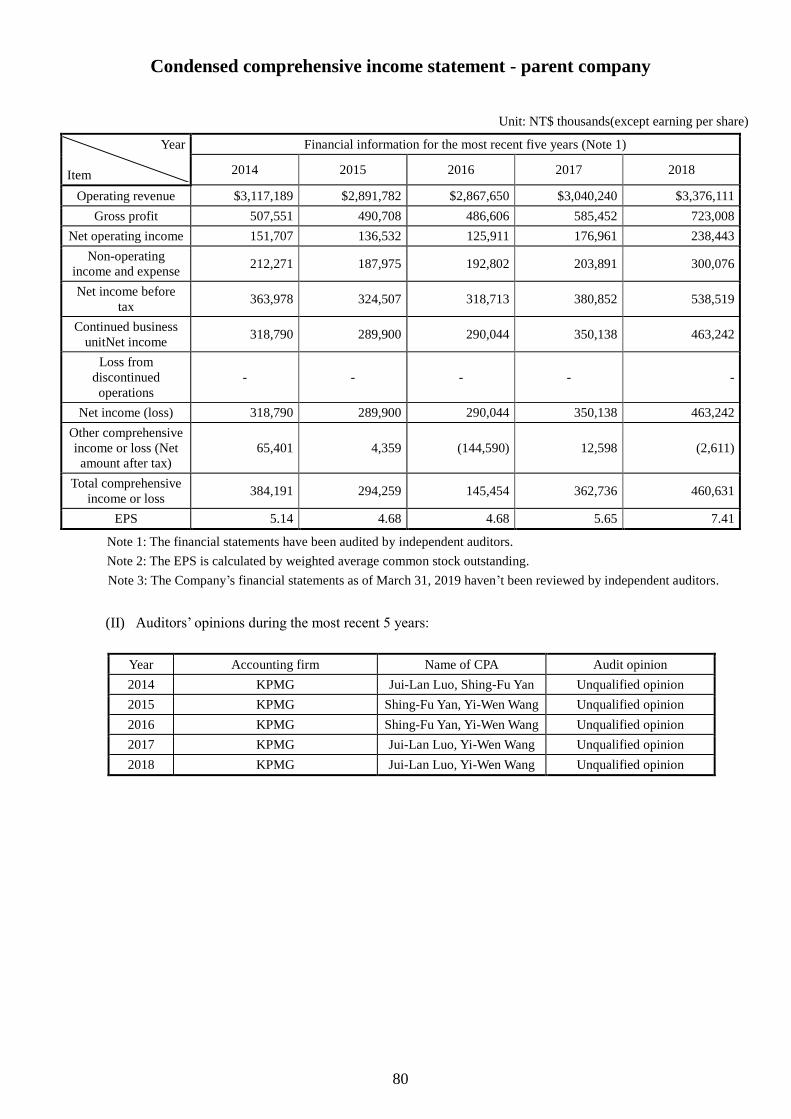
80
Condensed comprehensive income statement - parent company
Unit: NT$ thousands(except earning per share)
Year
Item
Financial information for the most recent five years (Note 1)
2014 2015 2016 2017 2018
Operating revenue $3,117,189 $2,891,782 $2,867,650 $3,040,240 $3,376,111
Gross profit 507,551 490,708 486,606 585,452 723,008
Net operating income 151,707 136,532 125,911 176,961 238,443
Non-operating
income and expense 212,271 187,975 192,802 203,891 300,076
Net income before
tax 363,978 324,507 318,713 380,852 538,519
Continued business
unitNet income 318,790 289,900 290,044 350,138 463,242
Loss from
discontinued
operations
- - - - -
Net income (loss) 318,790 289,900 290,044 350,138 463,242
Other comprehensive
income or loss (Net
amount after tax)
65,401 4,359 (144,590) 12,598 (2,611)
Total comprehensive
income or loss 384,191 294,259 145,454 362,736 460,631
EPS 5.14 4.68 4.68 5.65 7.41
Note 1: The financial statements have been audited by independent auditors.
Note 2: The EPS is calculated by weighted average common stock outstanding.
Note 3: The Company’s financial statements as of March 31, 2019 haven’t been reviewed by independent auditors.
(II) Auditors’ opinions during the most recent 5 years:
Year Accounting firm Name of CPA Audit opinion
2014 KPMG Jui-Lan Luo, Shing-Fu Yan Unqualified opinion
2015 KPMG Shing-Fu Yan, Yi-Wen Wang Unqualified opinion
2016 KPMG Shing-Fu Yan, Yi-Wen Wang Unqualified opinion
2017 KPMG Jui-Lan Luo, Yi-Wen Wang Unqualified opinion
2018 KPMG Jui-Lan Luo, Yi-Wen Wang Unqualified opinion

81
6.2 Financial analysis of the most recent five years:
Financial analysis (IFRSs) - consolidated
Year (Note 1)
Item (Note 3)
Financial analysis of the most recent five years
2014 2015 2016 2017 2018
Capital
structure
(%)
Liability to asset ratio 28 28 28 31 32
Long-term funds to
property, plant and
equipment ratio (%)
3,543 1,448 1,318 1,400 1,467
Solvency %
Current ratio 356 369 337 322 318
Quick ratio 278 300 273 262 245
Interest coverage ratio 412 339 142 181 146
Operating
performance
Accounts receivable
turnover (times) 4.35 4.06 4.04 4.02 4.23
Average collection days 84 90 90 91 86
Inventory turnover (times) 7.94 7.84 9.00 9.17 8.32
Accounts payable turnover
(times) 9.25 8.59 8.43 8.00 8.84
Average days in sales 46 47 41 40 44
Property, plant and
equipment turnover (times) 83.71 45.61 31.99 33.87 38.02
Total assets turnover (times) 1.76 1.62 1.64 1.69 1.78
Profitability
Return on total assets (%) 8.01 7.08 7.03 8.22 10.11
Return on equity (%) 11.09 9.83 10.31 12.35 15.25
To
paid-incapital
(%)
Operating
profits 66.95 60.31 59.37 77.53 100.83
Pre-tax
income 69.93 61.00 62.34 74.32 101.99
Net profit margin (%) 4.54 4.34 4.25 4.83 5.64
EPS (NT$) 5.14 4.68 4.68 5.65 7.41
Cash flow
Cash flow ratio (%) 44.10 39.11 28.31 29.01 18.35
Cash flow adequacy ratio
(%) NA(Note3) NA(Note3) NA(Note3) NA(Note3) 104.85
Cash reinvestment ratio (%) 5.87 3.01 2.56 3.68 (1.01)
Leverage Operating leverage 1.00 1.00 1.00 1.00 1.00
Financial leverage 1.00 1.00 1.00 1.00 1.01
Please state the reasons of the change in each financial ratio for the most recent two years (not required to
do so if the change does not exceed 20%):
I. Profitability:
Due to the growth in revenue and gross profit ratio, all profitability indicators have significantly
improved.
II. Cash flow:
The inventory in the end of this period was increased than last year that affected the operating
activity cash inflow decreased.
Note 1: The financial statements have been audited by independent auditors.
Note 2: The Company’s financial statements as of March 31, 2019 haven’t been reviewed by independent auditors.
Note3: The financial statements from 2014 were prepared in accordance with 2013 Taiwan- IFRSs vesion. Hence, the 5
years before 2014 couldn’t calculate.

82
Note 4: The following formulas should be presented:
1. Financial structure
(1) Liability to asset ratio = Total liability / Total asset
(2) Ratio of long-term capital to property, plant and equipment = (Total equity + Non-current liability) /
Net property, plant and equipment
2. Solvency
(1) Current ratio = Current assets / Current liability
(2) Quick ratio = (Current Assets - Inventories - Prepaid expenses) / Current liability
(3) Interest coverage ratio = Profit before income tax and interest expense / Current interest expense
3. Operating performance
(1) Accounts receivable turnover (including accounts receivable and notes receivable resulting from
business operations) = Net sales / Average accounts receivable in various periods (including accounts
receivable and notes receivable resulting from business operations)
(2) Average collection days = 365 / Accounts receivable turnover
(3) Average inventory turnover = Cost of goods sold / Average inventories
(4) Accounts payable turnover (including accounts payable and notes payable resulting from business
operations) = Cost of goods sold / Average accounts payable in various periods (including accounts
payable and notes payable resulting from business operations)
(5) Average days in sales = 365 / Inventory turnover
(6) Property, plant and equipment turnover rate = Net sales /Net average property, plant and equipment
(7) Total assets turnover = Net sales / Average total asset value
4. Profitability
(1) Return on assets (ROA) = [Gain (loss) after tax + Interest expenses × (1 – tax rate)] / Average total
asset
(2) Return on equity (ROE) = Gain (loss) after tax / Average total equity
(3) Net profit margin = Gain (loss) after tax / Net sales
(4) Earnings per share (EPS) = (Gain (loss) attributable to the owner of the parent company - dividends
of preferred shares) / Weighted average of outstanding shares (Note 4)
5. Cash flow
(1) Cash flow ratio = Net cash flow from operating activities / Current liability
(2) Net cash flow adequacy ratio = Net cash flow from operating activities in the most recent 5 years /
(Capital expenditure + inventory increase + cash dividends) in the 5 most recent years.
(3) Cash reinvestment ratio = (Net cash flow from operating activities – Cash dividends) / (Gross value
of PP&E + long-term investments + other non-current assets + operating capital) (Note 5)
6. Leverage
(1) Operating leverage = (Net operating revenue – variable operating cost and expense) / Operating
profit (Note 6)
(2) Financial leverage = Operating profit / (Operating profit – interest expenses)

83
Financial analysis (IFRSs) - parent company
Year (Note 1)
Item (Note 3)
Financial analysis of the most recent five years
2014 2015 2016 2017 2018
Capital
structure (%)
Liability to asset ratio 16 16 17 19 20
Long-term funds to property,
plant and equipment ratio (%) 3,642 3,599 3,735 4,008 4,125
Solvency %
Current ratio 294 285 250 216 196
Quick ratio 248 245 218 188 163
Interest coverage ratio 0 5,501 10,282 12,696 6,649
Operating
performance
Accounts receivable turnover
(times) 4.30 4.15 4.13 3.95 4.09
Average collection days 85 88 88 92 89
Inventory turnover (times) 11.67 11.51 13.06 13.91 12.71
Accounts payable turnover
(times) 7.75 7.79 7.13 6.41 6.72
Average days in sales 31 32 28 26 29
Property, plant and equipment
turnover (times) 37.43 34.57 35.24 39.21 43.47
Total assets turnover (times) 0.87 0.80 0.80 0.83 0.86
Profitability
Return on total assets (%) 8.91 8.03 8.12 9.55 11.80
Return on equity (%) 10.77 9.57 9.73 11.67 14.67
To
paid-incapital
(%)
Operating
profits 23.56 21.22 19.64 27.61 37.22
Pre-tax income 56.52 50.43 49.72 59.41 84.06
Net profit margin (%) 10.23 10.02 10.11 11.52 13.72
EPS (NT$) 5.14 4.68 4.68 5.65 7.41
Cash flow
Cash flow ratio (%) 74.62 51.12 47.03 23.35 44.84
Cash flow adequacy ratio (%) -(Note3) -(Note3) -(Note3) -(Note3) 89.70
Cash reinvestment ratio (%) 2.15 -2.32 -0.17 -3.36 1.07
Leverage Operating leverage 1.00 0.99 1.00 1.00 1.00
Financial leverage 1.00 1.00 1.00 1.00 1.00
Please state the reasons of the change in each financial ratio for the most recent two years (not required to do so if the change
does not exceed 20%):
I. Profitability:
Due to the growth of the Company’s revenue and the profit growth of subsidiaries, the profitability indicators
have been significantly improved.
II. Cash flow:
Due to the growth of the Company’s net income growth, the operating cash inflow increased.
Note 1: The financial statements have been audited by independent auditors.
Note 2: The Company’s financial statements as of March 31, 2019 haven’t been reviewed by independent auditors.
Note3: The financial statements from 2014 were prepared in accordance with 2013 Taiwan- IFRSs vesion. Hence, the 5 years
before 2014 couldn’t calculate.
Note 4:Calculation formula for financial analysis as follows:

84
1. Financial structure
(1) Liability to asset ratio = Total liability / Total asset
(2) Ratio of long-term capital to fixed asset = (Net shareholders’ equity + long-term liability) / Net fixed
asset
2. Solvency
(1) Current ratio = Current asset / Current liability
(2) Quick ratio= (Current asset - inventory - pre-paid expense) / Current liability
(3) Interest coverage ratio = Earnings before interests and taxes (EBIT) / Interest expense of the current
period
3. Operating performance
(1) Accounts receivable turnover (including accounts receivable and notes receivable resulting from
business operations) = Net sales / Average accounts receivable in various periods (including accounts
receivable and notes receivable resulting from business operations)
(2) Average collection day = 365 / Accounts receivable turnover
(3) Inventory turnover = Cost of goods sold / Average inventory value
(4) Accounts payable turnover (including accounts payable and notes payable resulting from business
operations) = Cost of goods sold / Average accounts payable in various periods (including accounts
payable and notes payable resulting from business operations)
(5) Average days in sales = 365 / Inventory turnover
(6) Fixed assets turnover = Net sales / Net fixed assets
(7) Total assets turnover = Net sales / Total assets
4. Profitability
(1) Return on assets (ROA) = [ Gain (loss) after tax + Interest expenses × (1 – tax rate)] / Average total
asset
(2) Return on equity (ROE) = Gain (loss) after tax / Average shareholders’ equity, net
(3) Net profit margin = Gain (loss) after tax / Net sales
(4) Earnings per share (EPS) = (Gain (loss) attributable to the owner of the parent company – dividends
of preferred shares) / Weighted average of outstanding shares
5. Cash flow
(1) Cash flow ratio = Net cash flow from operating activities / Current liability
(2) Cash flow adequacy ratio = Net cash flow from operating activities in the most recent 5 years /
(Capital expenditure + inventory increase + cash dividends) in the 5 most recent years.
(3) Cash reinvestment ratio = (Net cash flow from operating activities – cash dividends) / (Gross value
of fixed assets + long-term investments + other assets + operating capital)
6. Leverage
(1) Operating leverage = (Net operating revenue – variable operating cost and expense) / Operating
profit
(2) Financial leverage = Operating profit / (Operating profit – interest expenses)

85
6.3 2018 Supervisor’s review of the most recent annual financial report
Topco Technologies Corporation
Supervisors’ Review Report
The Board of Directors has prepared and submitted the Company’s 2018 Business Report, Individual
Financial Statements, Consolidated Financial Statements and Profit Allocation Plan to the Company’s
Supervisors review, of which the Individual Financial Statements and Consolidated Financial
Statements were audited by independent certified public accountants, Rui-Lan Luo and Yi-Wen Wang
of KPMG., pursuant to which an auditor report has been prepared. We have reviewed each of the
aforementioned documents and have not found any inaccuracies. Therefore, We hereby submit this
report in compliance with Article 219 of the Company Act.
Sincerely,
2019 Regular Shareholders’ Meeting
Topco Technologies Corporation
Supervisor: Chung-Sheng Lin
Supervisor: Chang-Wei Wu
Supervisor: De-Rong Investment Co., Ltd.
Representative: Tzu-Cheng Chiu
Date:March 4, 2019
86
6.4 2018 Consolidated financial reports audited by CPA:
Please refer to page 99~181.
6.5 2018 Individual financial reports audited by CPA:
Please refer to page 182~256.
6.6 The impact on the Company’s financial status if there are any financial difficulties for the Company and
its affiliates in the most recent year and up to the date of publication of the financial report shall be
clarified: None
.

87
7. Review, analysis and risk of the financial status and financial performance
(The followings are all consolidated data)
7.1 Comparative analysis of financial conditions:
(for changes over 20% between the first and second period, and the change amount reaching NT$10
million)
Unit: NT$ thousand
Year
Item
2017 2018
Difference
Amount %
Current assets 4,228,990 4,510,944 281,954 6.67
Property, plant and
equipment 223,879 225,554 1,675 0.75
Other assets 196,306 211,992 15,686 7.99
Total assets 4,649,175 4,948,490 299,315 6.44
Current liabilities 1,312,135 1,419,606 107,471 8.19
Non-current liabilities 142,545 144,863 2,318 1.63
Total liabilities 1,454,680 1,564,469 109,789 7.55
Source of capital stock 641,010 640,610 (400) (0.06)
Capital surplus 986,344 954,075 (32,269) (3.27)
Retained earnings 1,457,592 1,688,012 230,420 15.81
Other equity (20,203) (29,971) (9,768) 48.35
Non-controlling interest 129,752 131,295 1,543 1.19
Total Shareholder’s
equity 3,194,495 3,384,021 189,526 5.93
I. Main reasons for significant changes in assets, liabilities and shareholders' equity items within the most recent two years
(changes over 20% between the first and second period, and the change amount reaching NT$10 million), its effects, and
future response plans: No such issues happened.
II.Please provide the main reasons for the changes in current liabilities for the most recent two years and the changes in
long-term liabilities due within one year, their effects, and future response plans: Not applicable.

88
7.2 Comparative analysis of financial performance:
(I) Comparative analysis table of financial performance:
Unit: NT$ thousands
Year
Item 2017 2018
Increase (Decrease)
amount Ratio %
Net sales 7,672,336 8,544,667 872,331 11.37
Operating costs 6,299,921 6,900,016 600,095 9.53
Gross profit 1,372,415 1,644,651 272,236 19.84
Operating expenses 875,420 998,735 123,315 14.09
Operating profits 496,995 645,916 148,921 29.96
Non-operating income and expense (20,582) 7,443 28,025 136.16
Net income before tax 476,413 653,359 176,946 37.14
Income tax expense 105,786 171,707 65,921 62.32
Net income 370,627 481,652 111,025 29.96
Net income attributable to:
owner of parent company
350,138
463,242
113,104
32.30
Non-controlling interest 20,489 18,410 (2,079) (10.15)
Analysis and description of percentage change for the most recent two years (for the percentage change of gross profit that
exceeds 20% and the change amount reaching NT$10 million)
1. Operating income and net income increased for the current period: Both operating income and net income have
increased due to the increase in revenue and gross profit ratio.
2. Non-operating income and expenses decreased: The recognition of loss is due to the bankruptcy of LEDinside, in
which the Company reinvested last period.
3. Tax expense increased: Due to the tax rate increased.
4. Owner of parent company: Due to the profit growth on this period.
(II) Estimated impact on the Company's future financial operation and response plans due to the sales
volume and its basis in the upcoming year:
The Company has not prepared financial forecasts and therefore does not apply.
7.3 Cash flow analysis:
Cash flow analysis for the most recent year, future improvement plans for inadequate liquidity, and the
cash flow analysis for the upcoming year:
(I) Analysis of change in cash flows for the current year:
Unit: NT$ thousands
Cash Balance,
Beginning of year
Net Cash Provided by
Operating Activities
for the year
Net Cash Used in
Investing and Financing
Activities for the year
Cash Balance, End
of Year
Remedy for cash shortfall
Investment
Plans Financing Plans
$1,379,122 $260,543 ($337,962) $1,301,703 - -
1. Operating activities: Mainly from net income, and are expected to continue to be net cash
inflows.
2. Investment activities: Due to the certificate of deposit acquisition.
3. Financing activities: Cash dividends were distributed during the current period, resulting in
cash outflows.

89
(II) The Remedial measures for inadequate cash and liquidity analysis: Not applicable.
(III) Cash flow analysis for the upcoming year:
Unit: NT$ thousand
Cash Balance,
Beginning of year
Net Cash Provided by
Operating Activities
for the year
Net Cash Used in
Investing and
Financing Activities
for the year
Cash Balance, End
of Year
Remedy for cash shortfall
Investment
plans
Financing
plans
$1,301,703 $350,000 ($87,000) $1,564,703 - -
1. Operating Activities: The Company continues to profit and generates cash inflows.
2. Investment activities: The Company expected to obtain the office in China.
3. Financing activities: Due to the cash capital increased.
7.4 Industry-specific key performance indicators (KPI):
The Company sets the following three KPIs according to the industry and internal management
objectives:
KPI Definition Scheduled goal
for 2018
Actual achievement
for 2018
KPI achievement
rate
Accounts receivable
turnover
Net sales / Average accounts
receivable in various periods 4 times 4.23 times 106%
Inventory turnover rate Cost of goods sold / Average
inventory value 9 times 8.32 times 92%
Net profit margin Gain (loss) after tax / Net sales 4.90% 5.64% 115%
A.The operating performance was better than previous year, and thus accounts receivable turnover rate
and net profit margin of KPI completion rate exceeded 100%.
B.The custormer adjusted the stock and decrease to order in the end of the year, thus the inventory
turnover rate of KPI completion rate under 100%.
7.5 Impact of significant capital expenditures on financial and operational conditions for the most recent
years:
(I) The usage and source of fund of significant capital expenditure: This year expected to purchse the office by
cash capital increase.
(II) Impact on financial and operational conditions: Not applicable.
7.6 The investment policy for the most recent year, the main reason for profit or loss, improvement plan and
investment plan for the upcoming year:
(I) Reinvestment policy for the most recent year: The Company has prepared the “Disposal Procedures
for Acquisition or Disposition of Asset” and the internal control system for investment cycle as a
basis for managing reinvestment business. Despite the reinvestment the sub-subsidiaries to
puarchase the office, the Company has no other investment project in the coming year.

90
(II) Main causes for profit or loss from the reinvestment policy in the most recent year and the
improvement plan:
Unit: NT$ thousand
Item
Reinvested company
Income (loss) for the current
period Main causes for profit or loss
TOPCO AMERICA INC. 247,381 Due to the investment
income.
TOPGLOW Trading Co., Ltd. 34,690 Due to the operating income.
TOPCO Trading (Shanghai
Pudong District) Co., Ltd. 111,522 Due to the operating income.
Topco (Guangzhou)Trading
Co., LTD 101,633 Due to the operating income.
Hong Kong TOPCO Trading
Co., Ltd. 34,226 Due to the operating income.
Top Glory Trading Co.,Ltd. 522 Due to the operating income.
Topglow Advanced Materials
(Shanghai) Co., Ltd 403 Due to the operating income.
PT. Topco Trading Indonesia 1,304 Due to the operating income.
TOPCO(VIETNAM)
TRADING CO.,LTD. 7,478 Due to the operating income.
(III) The investment project of the coming year:
The Company will make the cash capital injection to the sub-subsidiaries TOPCO Trading (Shanghai
Pudong District) Co., Ltd. And Topco (Guangzhou)Trading Co., LTD to purchse the office.
7.7 Analysis and assessment of risk for the most recent year up to the printed date of the annual report:
(I) Effects of changes in interest rates, foreign exchange rates and inflation on the Company’s profit or
loss, and future measures to be taken in response for the most recent year up to the printed date of
the annual report:
1. Effects of changes in interest rates on the Company's profit or loss and future measures to be
taken in response:
As there is only a small amount of borrowings in the consolidated statement, the change in
interest rates has no significant impact on the Company. In addition, the Company’s
supervisors and related personnel had paid attention to the development of the global economy
anytime and effectively controlled the fluctuations of market interest rate.
2. Effects of foreign exchange rate fluctuations on the Company's profit or loss and future
measures to be taken in response:
(1) Source of exchange gains and losses:
The exchange gains and losses of the Company were mainly due to differences in the
number of days and balances of payments received between foreign currency accounts
receivable and foreign currency payments.
(2) Response measures to foreign exchange rate fluctuations:
In order to avoid exchange rate risk, the Company hedges on long-term foreign exchange
and options depending on the situation, and adjusts foreign currency receivables and
payables to reduce the exchange risk of the Company.
3. Effects of inflation on the Company's profit or loss and future measures to be taken in
response:
The government controls the situation of domestic inflation properly, and therefore there exists
no general inflation problem. In order to prevent the prices of international raw material from
rising in the future and the pressure of increased costs, the Company had reinforced on
persuading clients to accept the increased price so as to reduce the Company’s pressure of
bearing costs.
91
(II) Policies, main causes of profit or loss and future measures to be taken in response with respect to
high-risk and highly-leveraged investments, lending or endorsement guarantees, and derivatives
transactions:
1. High-risk and highly-leveraged investments: The Company has not engaged in high-risk and
highly-leveraged investments in 2018 up to the printed date of the annual report.
2. Lending: The Company has not engaged in lending in 2018 up to the printed date of the annual
report.
3. Endorsement guarantees: The Company mainly provides guarantee in bank financing quota for
its sub-subsidiary, Topco Trading (Shanghai Pu-Dong District) Co., LTD. and Topco
(Guangzhou)Trading Co., LTD., in 2018 up to the printed date of the annual report. Both
sub-subsidiaries had no bank loan at the printed date of this annual report.
4. Derivatives transactions: The Company and its subsidiaries engage in derivative transactions
based on hedges for foreign currency accounts receivable and payable. They are held for
non-trading purposes.
(III) Future R&D projects and corresponding budget:
The Company belongs to the distributor industry and has no substance R&D conduct; therefore it is
not applicable.
(IV) Effects of changes in domestic and overseas policies and regulations on the Company's financial and
operational conditions and measures to be taken in response:
1. In response to the revisions made by the competent authority to important policies and related
laws of corporate governance, the Company Act, and the Securities Exchange Act, the
Company cooperates. In addition, the Company consistently pays close attention to any
changes in local and foreign policies and takes measures to be taken in responses when
necessary, and therefore the changes did not have significant impacts on the financial and
operational conditions of the Company.
2. The European Union (EU) has successively promulgated environmental regulations such as
WEEE (Waste Electrical and Electronic Equipment Directive) and RoHS (Restriction of
Hazardous Substances Directive). The Silicone materials sold by the Company are all in
conformity with the EU environmental protection regulations, and therefore the risk does not
generate.
(IV) Effect of technological and industrial change on the Company's financial and operational conditions
and measures to be taken in response:
1. Technological Change
AI, Big Data, autopilot, new energy vehicles, and 5G have been popular topics in recent years,
and major international companies have one after another engaged in the research and
development of various resources. In the foreseeable future, major breakthroughs are expected to
be seen, which will substantially change the way of life. The Company mainly engages in the
specifical chemical material sales. These specific chemical mateirals are used by all walks of life.
Therefore, any proces involving production may likely require these specific chemical matierals,
including the abovementioned, AI, Big Data, autopilot, new energy vehicles, and 5G industries.

92
2. Industrial Change
Followng the rise of traditional consumer product sales through e-commerce network platforms, it
has had an impact on the saels channels of general merchandise. However, the sale of chemical
mateirals requires illustrations by professionals and technical document supply esrvices by material
vendors, thus its irreplaceability at preset. However, the network consumption mode may be a
possible challenge and industry change as far as the material sale mode of material distributors and
application personnel is concerned.
3. Faced with the impact of technological and industrial changes on the Company’s fiannce, the coping
measures are as follows:
(1) The Impact on Finance
The development of the new industries shall have a positive impact on the Company’s sale of
specific chemical mateirals, such as autopilot, new energy vehicles, 5G equipment, etc., which are
alllikely to use specific checimal mateirals for adhesion and heat dissipation uses, hence a possible
positive impact on the Company’s fiannce.
(2)Countermeasures
The Company and the upstream suppliers have actively engaged in the co-development of the
abovementioned materials for new technology development. Some of the said materials have passed
testing at the client’s end and have achieved sales performance; others are still undergoing
development or sample submission for testing. Therefore, the product development will be
accelerated to get a head start in the market.
With regard to possible industry changes related to the network platform sales mode, in addition to
actively selling special key materials to keep up with material sales in large quantitites, e-sales
management is strengthened to assist sales personnel more speedily serve client and boost logistic
delivery efficiency and management to cope with possible challenges. After an assessment, it is
deemed that it is not a major operating risk.
(VI) Effects of corporate image change on the Company's crisis management, and measures to be taken
in response:
Since the establishment of the Company, we had been actively working on strengthening internal
management and improving management quality and efficiency. After the Company’s shares went
listed on OTC, there were positive effects on the Company's image. In the most recent year, the
corporate image of the Company had no significant change.
(VII) Expected benefits and possible risks associated with mergers and acquisitions and measures to be
taken in response: None.
(VIII) Expected benefit and possible risk associated with plant expansion, and measures to be taken in
response:
(IX) Risks associated with purchasing or sales concentration, and measures to be taken in response:
The Company's current main operation business is the distribution of Shin-Etsu Chemical's Silicone
products. The purchases from Shin-Etsu Chemical and its affiliated companies accounted for more
than 50% of the total purchases this year, and there was concentration of purchasing.

93
Accordingly, the Company has strengthened the relationship with Shin-Etsu from simple sales
relation to shareholder relation via Shin-Etsu’s share investment. In addition, the Company actively
increases the sales of other related brands, such as PTFE of Sumitomo, adhesives of Konishi and
Sika, etc., to gradually spread the risk of single brand agency. At present, the Company is also
developing other special materials, such as environmental protection catalysts, micro-capsule
foaming materials, cosmetic materials, and VUV cleaning machines, etc. We believe that we can
improve the situation of purchase concentration in the future.
In terms of sales, the Company's customer base is extremely widespread. Any single customer has
not reached 3% of sales revenue, and there is no risk of concentration of customer sales.
(X) Effects of large share transfers or changes in shareholdings of directors, supervisors, or shareholders
with shareholdings over 10%, risk and measures to be taken in response:
The shareholdings of the Company’s directors and supervisors in the most recent year through the
printed date of this annual report, have no major transfers or swaps of shares.
(XI) Effects upon and risks to Company associated with any changes in governance personnel or top
management and measures to be taken in response:
The company has established a professional manager system to take charge of the Company's
operational items, and thus the changes in management right will not have a significant adverse
impact on the Company. No major changes have occurred in the Company's management right so
far.
(XII) Litigation or non-litigation matters: None
(XIII) Other significant risks and measures to be taken in response:
Information security risks analyze
With the popularization fo omputers and digital information and in response to bulk data
processing and retrieval, currently, almost all companies have opted for computerized
operations.The Companny’s information security assessment and coping measuers are as shown in
the table below, which should signficiantly reduce impacts arising from information security risks.
Item Information Risk Current Implication
1 System damage results in the
losses of data.
1. Secure a second host to perform synchronized data
backup. If there is a problem with the first host, the
second host can immediately function without a time gap.
2. Data is backed up in two places through dedicated line
transmission and tapes.
2 Power failure and
air-condition breakdown
1. The information control room is equipped with an
uninterruptible power system (UPS) to cope with
temporary power outages.
2. There is an emergency fan for forced convection. If the
temperature continues to rise, the various equipment in
the control room shall be shut down in order. 3 Natural Disaster
There is offsite data backup. Turn on the new equipment
and load to data to resume operation within a short time
4 Database damage
Manually turn on the virtual backup machine, retrieve the
last backup in the database and rebuild the database.
5 Storage Server Damage Turn on the backup storage server and copy the data from
the backup storage server to the original storage server.
6 Internet Equipment Damage
After calling the offline backup network equipment and
completing setting, replace the faulty equipment.
After assessment, the Company has no material operating risk of the Information security.

94
7.8 Other important matters:
(I) Regarding the assessment reference and basis of the liability evaluation accounts in the financial
statements, the Company specifically discloses as below:
1. Allowance for doubtful accounts:
Evaluation accounts of
assets and liabilities Evaluation
reference Evaluation basis
Allowance for
doubtful accounts Aging schedule (I) Age not overdue:
1. Group A: TWSE / GTSM listed companies and their
affiliates shall provide 0.001% of total amount of
receivables.
2. Group B: Non TWSE / GTSM listed companies shall
provide 0.02% of total amount of receivables.
3. Group C: Clients with higher assessed credit risks
shall provide 2.5% of total amount of receivables.
(II) Age overdue:
1. Accounts overdue for 1-30 days shall provide 5%.
2. Accounts overdue for 31-60 days shall provide 10%.
3. Accounts overdue for 61-90 days shall provide 20%.
4. Accounts overdue for 91-180 days shall provide 50%.
5. Accounts overdue for 181-360 days shall provide
80%.
6. Accounts overdue over 361 days shall provide 100%.
2. The fair value of the Company's financial assets and financial liabilities are determined as
follows:
(1) Financial assets evaluated at fair value through profit or loss - current are financial assets
that satisfy with standard terms and are transacted in active markets. Their fair value is
respectively determined by the market price.
(2) Derivatives’ fair value is determined with the valuation method. The estimations and
assumptions are referred to the quoted information of financial institutions.
(3) The fair value of the shares of Non TWSE/GTSM listed companies with no public price
in the active market is estimated with the valuation method.

95
8. Special Disclosures
8.1 Information of affiliates:
(I) Consolidated operating report of affiliates
1. Overview of affiliates
TOPCO TECHNOLOGIES CORP
TOPCO AMERICA
INC. (100%)
Topglow Trading
Co. (65.33%)
TOP GLORY
(100%) Topco
(Guangzhou)
Trading Co.,
LTD. (100%)
Topco Trading
(Shanghai
Pu-Dong New
Area) Co.,
(100%)
Hong Kong
T.T.C. Co.,
Ltd. (100%)
Topco Trade
(Indonesia) Co., Ltd.
(100%)
TOPCO (VIETNAM)
TRADIN G CO., LTD
Topglow Advances
Materials (Shanghai)
Co., (100%)

96
2. Basic information of affiliates
Dec. 31, 2017 Unit: NT$ thousand
Name of affiliates Date of
establishment Address
Actual
investment
amount
Major business projects
or production projects
TOPCO AMERICA INC. Mar. 2004
Scotia Centre,4th Floor,P.O.BOX
2804,
George Town, Grand Cayman,
Cayman Islands.
332,670 Holding company
Hong Kong TOPCO Trading
Co., Ltd. Mar. 1992
Room 617, Nan Fung Commercial
Centre, 19 Lam Lok Street, Kowloon
Bay, Kowloon, Hong Kong
USD3,260 Trading businesses of
Silicone products
TOPCO (Guangzhou)
Trading Co., Ltd. Feb. 2001
Room 1406-09, North Tower, Jinbin
Dragonfly Building, 49 Huaxia Road,
Tianhe District, Guangzhou China,
510623
USD4,500 Trading businesses of
Silicone products
TOPCO Trading (Shanghai
Pudong District) Co., Ltd. Oct. 1997
Unit 709, Nan Fang Friendship
Centre 7250, Hu Min Road,
Shanghai, China, 201102
USD4,500 Trading businesses of
Silicone products
Topco Trade (Indonesia) Co.,
Ltd.
P.T TOPCO TRADING
INDONESIA
Nov. 2014
Perwata Tower 7th Floor Suite F, J1.
Pluit Selatan-CBD Pluit, North
Jakarta 14440
USD1,000 Trading businesses of
Silicone products
TOPCO (VIETNAM)
TRADIN G CO., LTD
TOPCO (VIETNAM)
TRADING CO., LTD
Oct. 2015
2F, Petroland Tower, No.12, Tan Trao
Street, Tan Phu Ward, District 7, Ho
Chi Minh Vietnam
USD800 Trading businesses of
Silicone products
TOPGLOW Trading Co.,
Ltd. Mar. 1990
11F.-1, No.213, Chaofu Rd., Xitun
Dist., Taichung City 407, Taiwan
(R.O.C.)
82,258 General trading and
merchandising
Top Glory Trading Co. Ltd Mar. 2008
60 MARKET SQUARE,
P.O.BOX364, BELIZE CITY
BELIZE
1,537 Import and export
trading
Topglow Advanced Materials
(Shanghai) Co., Ltd Oct. 2017
Room 513, 5F, No.239-1, Gangao
Rd., Pilot Free Trade Zone, Shanghai 14,770
Import and export
trading
3. Related information of which presumed to be have relationship of controlling and affiliates:
None.
4. For the businesses covered by the overall affiliated business operations and business operations
that related to each other, the division of work shall be illustrated:
(1) TOPCO AMERICA INC.
Holding company and reinvests in Hong Kong T.T.C. Co., Ltd., Topco (Guangzhou)
Trading Co., LTD., and Topco Trading (Shanghai Pu-Dong New Area) Co., LTD.
(2) Hong Kong T.T.C. Co., Ltd.
a. Engages in the trading businesses of Silicone products in Hong Kong area.
b. Assists local clients in using products and after-sales service.
(3) Topco (Guangzhou) Trading Co., LTD. (including Xiamen subsidiary)
a. Engages in the trading businesses of Silicone products in Southern China.
b. Assists local clients in using products and after-sales service.
(4) Topco Trading (Shanghai Pu-Dong New Area) Co., LTD. (including Beijing, Suzhou, and
Ningbo subsidiaries)
a. Engages in the trading businesses of Silicone products in Eastern China.
b. Assists local clients in using products and after-sales service.

97
(5) P.T TOPCO TRADING INDONESIA
a. Engages in the trading businesses of Silicone products in Indonesia.
b. Assists local clients in using products and after-sales service.
(6) TOPCO (VIETNAM) TRADING CO., LTD
a. Engages in the trading businesses of Silicone products in Vietnam.
b. Assists local clients in using products and after-sales service.
(7) Topglow Trading Co., Ltd.
General trading and electronic components merchandising
(8) Top Glory: Import and export trading
(9) Topglow Advanced Materials (Shanghai) Co., Ltd: Import and export trading
5. Names and shareholding ratio of directors, supervisors, and General Managers of affiliates:
Unit: thousand shares
Name of affiliates Title Name or representative
Shareholding
Shares Shareholding
ratio
TOPCO AMERICA INC. PRESIDENT Representative of Topco Technologies
Corp.: Chun-Ming Weng 12,260 100.00%
Hong Kong TOPCO Trading
Co., Ltd. Director
Representative of TOPCO AMERICA
INC.: Chun-Ming Weng 3,260 100.00%
TOPCO (Guangzhou)
Trading Co., Ltd.
Director Ching-Hung Lin, Chen-Cheng Pan,
Ming-Tso Hsiao - -
Supervisor Sheng-Ho Chang
TOPCO Trading (Shanghai
Pudong District) Co., Ltd.
Director Ching-Hsiung Wen, Chen-Cheng Pan,
Tsai-Meng Wang - -
Supervisor Sheng-Ho Chang
Topco Trade (Indonesia) Co.,
Ltd. Director Chun-Ming Weng, Ching-Hsiung Wen - -
TOPCO (VIETNAM)
TRADIN G CO., LTD Director Chao-Pang Lo - -
Topglow Trading Co., Ltd.
Director (Note) Chun-Ming Weng, Kun-Ming Wu,
Chih-Hung Weng 9,146 65.33%
Supervisor Wen-Hua Tsai - -
General
Manager Chih-Hung Weng 324 2.32%
Top Glory Trading Co. Ltd Director Representative of Top Glory Trading Co.
Ltd: Chun-Ming Weng 50 100.00%
Topglow Advanced Materials
(Shanghai) Co., Ltd
General
Manager
Representative of Top Glory Trading Co.
Ltd: Chih-Hung Weng - 100.00%
Note: Topco Technologies Corp. holds 9,146,000 shares of Top Glory Trading Co. Ltd. The shareholding ratio is
65.33%. The appointed directors are: Chun-Ming Weng and Kun-Ming Wu.

98
(II) Operation overview of Affiliates:
Unit: NT$ thousand Date: Dec. 31, 2018
Name of affiliates Capital
amount
Total
assets
Total
liabilities Net worth
Operating
revenue
Net
operating
income
Net income
(after tax)
EPS
(after tax)
(NTD)
TOPCO AMERICA
INC. 332,670 2,115,180 - 2,115,180 - - 247,381 -
Hong Kong TOPCO
Trading Co., Ltd. 100,131 613,909 75,856 538,053 657,894 28,737 34,501 -
TOPCO (Guangzhou)
Trading Co., Ltd. 199,648 957,928 167,542 790,386 1,620,780 138,515 102,748 -
TOPCO Trading
(Shanghai Pudong
District) Co., Ltd.
199,648 1,056,747 265,984 790,763 2,008,702 145,314 112,487 -
Topco Trade
(Indonesia) Co., Ltd. 30,715 35,012 15,064 19,948 66,832 1,215 1,304 -
TOPCO (VIETNAM)
TRADIN G CO., LTD 24,572 68,222 42,177 26,045 147,621 9,536 7,480 -
Topglow Trading Co.,
Ltd. 140,000 728,760 350,061 378,699 1,363,259 65,618 53,100 3.79
Top Glory Trading Co.
Ltd 1,537 17,876 - 17,876 10,042 494 522 -
Topglow Advanced
Materials (Shanghai)
Co., Ltd
14,770 70,066 55,090 14,975 183,071 6,536 403
(III) Consolidated Financial Statements of Affiliates: Please refer to page 99~181.
(IV) Relationship Report on the Affiliates: Not applicable.
8.2 For the private equity securities managing status in the most recent year and as of the publication date of
the annual report: No such issues happened.
8.3 Holding or disposal of shares in the Company by the Company's subsidiaries in the most recent year and
until the date of publication of the annual report: No such issues happened.
8.4 Other necessary supplementary explanations: No such issues happened.
8.5 In the most recent year and as of the publication date of the annual report, if there are any matters
determined in Term 2, Item 2, Article 36 of the Securities Exchange Act that have significant impacts on
shareholders’ equity or securities prices:No such issues happened.

99
Representation Letter
The entities that are required to be included in the combined financial statements of Topco
Technologies Corp. as of and for the year ended December 31, 2018, under the Criteria Governing
the Preparation of Affiliation Reports, Consolidated Business Reports and Consolidated Financial
Statements of Affiliated Enterprises are the same as those included in the consolidated financial
statements prepared in conformity with the International Financial Reporting Standard 10,
“Consolidated Financial Statements” endorsed by Financial Supervisory Commission. In addition,
the information required to be disclosed in the combined financial statements is included in the
consolidated financial statements. Consequently, Topco Technologies Corp. and Subsidiaries do not
prepare a separate set of combined financial statements.
.
Topco Technologies Corp.
Chen-Cheng Pan
March 4, 2019
100
Independent Auditors’ Report
To the Board of Directors of Topco Technologies Corporation:
Opinion
We have audited the consolidated financial statements of Topco Technologies Corp. (the “Company”)
and its subsidiaries (the “Group”), which comprise the consolidated statements of financial position as
of December 31, 2018 and 2017, and the consolidated statements of comprehensive income, changes in
equity and cash flows for the years ended December 31, 2018 and 2017, and notes to the consolidated
financial statements, including a summary of significant accounting policies.
In our opinion, the accompanying consolidated financial statements present fairly, in all material
respects, the consolidated financial position of the Group as of December 31, 2018 and 2017, and its
consolidated financial performance and its consolidated cash flows for the years ended December 31,
2018 and 2017 in accordance with the Regulations Governing the Preparation of Financial Reports by
Securities Issuers and with the International Financial Reporting Standards (“ IFRSs” ), International
Accounting Standards (“ IASs” ), interpretation as well as related guidance endorsed by the Financial
Supervisory Commission of the Republic of China.
Basis for Opinion
We conducted our audit in accordance with the “Regulations Governing Auditing and Certification of
Financial Statements by Certified Public Accountants” and the auditing standards generally accepted in
the Republic of China. Our responsibilities under those standards are further described in the Auditors’
Responsibilities for the Audit of the Consolidated Financial Statements section of our report. We are
independent of the Group in accordance with the Certified Public Accountants Code of Professional
Ethics in Republic of China (“ the Code”), and we have fulfilled our other ethical responsibilities in
accordance with the Code. We believe that the audit evidence we have obtained during our audits and
the reports of the other auditors are sufficient and appropriate to provide a basis of our opinion.
Key Audit Matters
Key audit matters are those matters that, in our professional judgment, were of most significance in our
audit of the consolidated financial statements of the current period. These matters were addressed in the
context of our audit of the consolidated financial statements as a whole, and in forming our opinion
thereon, and we do not provide a separate opinion on these matters.
a. Valuation of Inventory
Please refer to Note 4 (h) Inventory of the consolidated financial statements for details of the
accounting policy concerning inventory valuation, Note 5 of the consolidated financial statements for
uncertainties in the inventory valuation, and Note 6 (h) Inventory of the consolidated financial
statements for the explanation of inventory.

101
Description of the Key Audit Matters:
The Group measured the cost and net realizable value of inventory. Since the principal business of the
Group is the import and export of chemical material-related commodities, there is a risk that the book
value of inventory may exceed its net realizable value because of the fluctuation of the commodity
sales price due to changes in the supply and market competition. Inventory valuation is therefore one of
the important valuation items in our financial statement audit.
How the matter is address in our audit:
Our main audit procedures of the above-mentioned key audit matters include examining whether the
inventory valuation policy of the Group is handled in accordance with the requirements of the IAS2. In
addition, the inventory age report is reviewed, the age changes of inventory of each period are checked,
an interval classification test of the inventory age report is performed, and a spot-check process is
performed to check the sales prices adopted by the Group and assess the reasonableness of the net
realization value of inventory.
b. Valuation of Receivables
Please refer to Note 4(f)(g) Amortization of Financial Assets of the consolidated financial statements
for the accounting policies concerning the valuation of receivables, Note 5 of the consolidated financial
statements for uncertainties in the valuation of receivables, Note 6(f) Notes and Accounts Receivables
and Other Receivables of the consolidated financial statements for the explanation of valuation of
receivables.
Description of the Key Audit Matters:
The valuation of receivables is based on lifetime expected credit loss of objective evidence showing the
recoverability of accounts receivables, so that the provision for losses can be made accordingly. Due to
the large number of customers of the Group, the recoverability of receivables is affected by factors
such as the customers’ operating conditions, external industrial environment and economic conditions.
Therefore, the valuation of receivables is one of the important valuation items for our audit of the
financial statements.
How the matter is address in our audit:
Our main audit procedures of the key audit matters above include examining whether the valuation
policy of the receivables of The Group is handled in accordance with the requirements of the
Communiqué, understanding the overdue reasons and the status of the after-sales collections for
accounts with long overdue days, and assessing the reasonableness of the management's estimates of
allowances for receivables.
102
Other items
We have also audited the parent company only financial statements of the Company as of and for the
years ended December 31, 2018 and 2017 and have expressed an unqualified opinion thereon.
Responsibilities of Management and Those Charged with Governance for the Consolidated
Financial Statements
Management is responsible for the preparation and fair presentation of the consolidated financial
statements in accordance with Regulations Governing the Preparation of Financial Reports by
Securities Issuers and with the International Financial Reporting Standards, International Accounting
Standards, IFRIC interpretations and SIC interpretations as endorsed by the Financial Supervisory
Commission of the Republic of China, and for such internal control as management determines is
necessary to enable the preparation of consolidated financial statements that are free from material
misstatement, whether due to fraud or error.
In preparing the consolidated financial statements, management is responsible for assessing the
Group’s ability to continue as a going concern, disclosing, as applicable, matters related to going
concern and using the going concern basis of accounting unless management either intends to liquidate
the Group or to cease operations, or has no realistic alternative but to do so.
Those charged with governance (including the Supervisors) are responsible for overseeing the Group’s
financial reporting process.
Accountants’ Responsibilities of the Audit of Consolidated Financial Statements
Our objectives are to obtain reasonable assurance about whether the consolidated financial statements
as a whole are free from material misstatement, whether due to fraud or error, and to issue an auditors’
report that includes our opinion. Reasonable assurance is a high level of assurance, but is not a
guarantee that an audit conducted in accordance with the auditing standards generally accepted in the
Republic of China will always detect a material misstatement when it exists. Misstatements can arise
from fraud or error and are considered material if, individually or in the aggregate, they could
reasonably be expected to influence the economic decisions of users taken on the basis of these
consolidated financial statements.
As part of an audit in accordance with auditing standards generally accepted in the Republic of China,
we exercise professional judgment and maintain professional skepticism throughout the audit. We also:
1. Identify and assess the risks of material misstatement of the consolidated financial statements,
whether due to fraud or error, design and perform audit procedures responsive to those risks, and
obtain audit evidence that is sufficient and appropriate to provide a basis for our opinion. The risk
of not detecting a material misstatement resulting from fraud is higher than for one resulting from
error, as fraud may involve collusion, forgery, intentional omissions, misrepresentations, or the
override of internal control.

103
2. Obtain an understanding of internal control relevant to the audit in order to design audit procedures
that are appropriate in the circumstances, but not for the purpose of expressing an opinion on the
effectiveness of the Group’s internal control.
3. Evaluate the appropriateness of accounting policies used and the reasonableness of accounting
estimates and related disclosures made by management.
4. Conclude on the appropriateness of management’s use of the going concern basis of accounting and,
based on the audit evidence obtained, whether a material uncertainty exists related to events or
conditions that may cast significant doubt on the Group’s ability to continue as a going concern. If
we conclude that a material uncertainty exists, we are required to draw attention in our auditor’s
report to the related disclosures in the consolidated financial statements or, if such disclosures are
inadequate, to modify our opinion. Our conclusions are based on the audit evidence obtained up to
the date of our auditor’s report. However, future events or conditions may cause the Group to cease
to continue as a going concern.
5. Evaluate the overall presentation, structure and content of the consolidated financial statements,
including the disclosures, and whether the consolidated financial statements represent the
underlying transactions and events in a manner that achieves fair presentation.
Obtain sufficient appropriate audit evidence regarding the financial information of the entities or
business activities within the Group to express an opinion on the consolidated financial statements.
We are responsible for the direction, supervision and performance of the group audit. We remain
solely responsible for our audit opinion.
We communicate with those charged with governance regarding, among other matters, the planned
scope and timing of the audit and significant audit findings, including any significant deficiencies in
internal control that we identify during our audit.
We also provide those charged with governance with a statement that we have complied with relevant
ethical requirements regarding independence, and to communicate with them all relationships and other
matters that may reasonably be thought to bear on our independence, and where applicable, related
safeguards.
From the matters communicated with those charged with governance, we determine those matters that
were of most significance in the audit of the consolidated financial statements of the current period and
are therefore the key audit matters. We describe these matters in our auditor’s report unless law or
regulation precludes public disclosure about the matter or when, in extremely rare circumstances, we
determine that a matter should not be communicated in our report because the adverse consequences of
doing so would reasonably be expected to outweigh the public interest benefits of such communication.

104
The engagement partners on the audits resulting in this independent auditors’ report are Jui-Lan, Lo
and I-Wen, Wang.
KPMG
Taipei, Taiwan(Republic of China)
March 4, 2019
Notes to Readers
The accompanying consolidated financial statements are intended only to present the consolidated statements of financial
position, financial performance and cash flows in accordance with accounting principles generally accepted in the Republic
of China and not those of any other jurisdictions. The standards, procedures and practices to review such consolidated
financial statements are those generally accepted and applied in the Republic of China.
The independent auditors’ report and the accompanying consolidated financial statements are the English translation of
Chinese version prepared and used in Republic of China. If there is any conflict between, or any difference in the
interpretation of English and Chinese language auditors’ report and consolidated financial statements, the Chinese version
shall prevail.

105
(English Translation of consolidated Financial Statements and Reporting Originally Issued in Chinese)
Topco Technologies Corporation and Subsidiaries
Consolidated Balance Sheet
December 31, 2018 and 2017
(EXPRESSED IN THOUSANDS OF NEW TAIWAN DOLLARS)
December 31,2018 December 31,2017 December 31,2018 December 31,2017
Assets Amount % Amount % Liabilities and shareholder’s equity Amount % Amount %
Current assets: Current liabilities:
1100 Cash and cash equivalents (note 6(a)) $1,301,703 30 $1,379,122 30 2100 Current borrowings (note 6(b)) $ 155,358 3 $ 109,358 2
1110 Current financial assets at fair value 2120 Current financial liabilities at fair value through profit
or loss (Note 6(b))
177 - - -
through profit or loss (note 6(b)) 18 1 60,166 1
1136 Current financial assets at amortized cost
(Note6(e)) 35,205 1 - - Notes and accounts payable 152,439 3 157,317 3
1170 Notes and accounts receivable, net (note 6(c)) 2,044,384 41 1,862,044 40 2170 Notes and accounts payables - Related parties (note 7) 604,801 12 645,841 14
1180 Notes and accounts receivable - related parties,
net (notes 6(c) and 7)
34,816 2 96,351 2 2180 Other payables 401,501 8 314,595 7
1476 Other current financial assets (notes 6(c) and 8) 59,696 1 44,896 1 2200 Current tax liabilities 73,753 2 51,679 1
2130 Current contract liabilities (Note 6(r)) 24,495 1 - -
1300 Inventories –Merchandising (note 6(d)) 945,837 19 712,780 15 2300 Other current liabilities 4,212 - 33,345 1
1470 Other current assets 89,285 2 73,631 2 2322 Long-term liabilities, current portion (Note 6(k)) 3,045 - - -
4,510,944 91 4,228,990 91 1,419,606 29 1,312,135 28
Non-current assets: Non-current liabilities:
1517 Non-current financial assets at fair value through
other comprehensive income (Note 6(c))
190,741 4 - - Long-term borrowings (note 6(g)) 56,955 1 70,000 1
1523 Non-current available-for-sale financial assets
(note 6(b))
- - 174,185 4 2540 Deferred tax liabilities (note 6(j)) 87,908 2 72,545 2
1600 Property, plant and equipment (note 6(i) and 8) 225,554 5 223,879 5 2570 144,863 3 142,545 3
1840 Deferred tax assets (note 6(10)) 6,012 - 4,428 - Total liabilities 1,564,469 32 1,454,680 31
1900 Other non-current assets 15,239 - 17,693 -
437,546 9 420,185 9 Equity attributable to owners of the parent (notes 6(o)
and 6(p))
3100 Capital stock 640,610 13 641,010 14
3200 Capital reserve 954,075 19 986,344 21
3300 Retained earnings 1,688,012 34 1,457,592 31
3400 Other equity (29,971) (1) (20,203) -
Total equity attributable to owners of parent 3,252,726 65 3,064,743 66
36XX Non-controlling interests 131,295 3 129,752 3
Total equity 3,384,021 68 3,194,495 69
Significant commitments and contingencies (note 9)
Total Assets $ 4,948,490 100 $ 4,649,175 100 Total liabilities and equity $ 4,948,490 100 $ 4,649,175 100
(Please see the accompanying notes to the consolidated financial statements.)

106
(English Translation of consolidated Financial Statements and Reporting Originally Issued in Chinese)
Topco Technologies Corporation and Subsidiaries
Consolidated Comprehensive Income Statement
For the years ended December 31, 2018 and 2017
(Expressed in Thousands of New Taiwan Dollars, Except for Earnings Per Share)
2018 2017
Amount % Amount %
4000 Operating revenue (note 7)
4100 Sales revenue $ 8,544,667 100 $ 7672,336 100
5000 Operating costs (notes 6(d) and 7) 6,900,016 81 6,299,921 82
Gross operating margin 1,644,651 19 1,372,415 18
Operating expenses (notes 6(h), 6(i), 6(l), 7 and 12):
6100 Selling expenses 629,842 7 576,609 8
6200 Administrative expenses 357,562 4 298,811 4
6450 Impairment loss (impairment gain and reversal of
impairment loss) determined in accordance with IFRS 9
11,331 - - -
998,735 11 875,420 12
Net operating income 645,916 8 496,995 6
Non-operating revenue and expenses:
7100 Interest revenue 8,457 - 4,671 -
7230 Foreign exchange gains(losses) (7,563) - 1,080 -
7235 Gain (loss) on financial assets (liabilities) measured at
fair value through profit or loss
366 - 513 -
7510 Interest expense (4,507) - (2,644) -
7670 Impairment loss (note 6 (b)) - - (23,400) -
7020 Other gains and losses (note 7) 10,690 - (802) -
7,443 - (20,582) -
7900 Income before income tax 653,359 8 476,413 6
7950 Less: Income tax expense (note 6 (j)) 171,707 2 105,786 1
Net income 481,652 6 370,627 5
8300 Other comprehensive income:
8310 Components of other comprehensive income that
will not be reclassified to profit or loss:
8311 Remeasurement of defined benefit plans (note 6 (i)) 182 - (448) -
8349 Less: Income tax related to components of other
comprehensive income that will not be reclassified to
profit or loss
- - - -
182 - (448) -
8360 Components of other comprehensive income that
will be reclassified to profit or loss
8361 Exchange differences on transaction of foreign financial
statements (note 6 (d))
(19,228) (1) (60,946) (1)
8362 Unrealized gains (losses) on valuation of
available-for-sale financial assets
- 1 73,567 1
8367 Gains(Loss)on financial assets at fair value through
other comprehensive income(note 6 (c))
16,556
(2,672) - 12,621 -
8300 Other comprehensive income (loss) (2,490) - 12,173 -
8500 Total comprehensive income $ 479,162 6 $ 382,800 5
Net income attributable to:
8610 Owner of parent $ 463,242 6 $ 350,138 5
8620 Non-controlling interests 18,410 - 20,489 -
Net income $ 481,652 6 $ 370,627 5
Comprehensive income attributable to:
8710 Owner of parent $ 460,631 6 $ 362,736 5
8720 Non-controlling interests 18,531 - 20,064 -
Total comprehensive income $ 479,162 5 $ 382,800 5
Earnings per share (in dollars) (note 6 (m))
9750 Basic earnings per share $ 7.41 $ 5.65
9850 Diluted earnings per share $ 7.32 $ 5.47
(Please see the accompanying notes to the consolidated financial statements.)

107
(English Translation of Financial Statements and Reporting Originally Issued in Chinese)
Topco Technologies Corporation and Subsidiaries
Consolidated Statement of Changes in Equity
For the Years Ended December 31, 2018 and 2017
(Expressed in Thousands of New Taiwan Dollars)
Retained earnings Other equity interests
Capital Capital surplus
legal reserve
Special reserve
Unappropriated
retained earnings
Total
Exchange
differences
on translation of
foreign
financial statements
Unrealized gains
on financial
assets measured at fair value
through other
comprehensive income
Unrealized
gains or
losses on available-for
-sale
financial asset
Unearned
compensation for restricted
employee
shares of stock
Total
Total
equity
attributable to
owners of
parent
company
Non-
controlling
interest
Total equity Balance on January 1, 2017 $641,010 986,645 467,405 6,363 890,538 1,364,306 (24,288) - 7,464 (38,633) (55,457) 2,936,554 124,249 3,060,803
Appropriation of earnings:
Legal reserve - - 29,005 - (29,005) - - - - - - - - -
Special reserve - - - 10,461 (10,461) - - - - - - - - -
Cash dividend for common stock - - - - (256,404) (256,404) - - - - - (256,404) - (256,404)
Retirement of employees restricted shares (50) (301) - - - - - - - 236 236 (115) - (115)
Compensation cost of issuing restricted
employee shares
- - - - - - - - - 21,972 21,972 21,972 - 21,972
Changes in non-controlling interests - - - - - - - - - - - - (14,561) (14,561)
641,010 986,344 496,410 16,824 594,668 1,107,902 (24,288) - 7,464 (16,425) (33,249) 2,702,007 109,688 2,811,695
Net profit for the period - - - - 350,138 350,138 - - - - - 350,138 20,489 370,627
Other comprehensive income (loss) - - - - (448) (448) (60,521) - 73,567 - 13,046 12,598 (425) 12,173
Total comprehensive income for the period - - - - 349,690 349,690 (60,521) - 73,567 - 13,046 362,736 20,064 382,800
Balance on December 3 1,2017 641,010 986,344 496,410 16,824 944,358 1,457,592 (84,809) - 81,031 (16,425) (20,203) 3,064,743 129,752 3,194,495
Effects of retrospective application 23,400 23,400 57,631 (81,031) - (23,400) - - -
Balance at January 1, 2018 after
adjustments
641,010 986,344 496,410 16,824 967,758 1,480,992 (84,809) 57,631 - (16,425) (43,603) 3,064,743 129,752 3,194,495
Appropriation and distribution of earnings:
Legal reserve - - 35,014 (35,014) - - - - - - - -
Special reserve - - - (10,461) 10,461 - - - - - - - -
Cash dividends of ordinary share (256,404) (256,404) - - - - - (256,404) (256,404)
Cash dividends from capital surplus - (38,461) - - - - - - - - - (38,461) (38,461)
Compensation cost of issuing shares - 8,600 - - - - - - - - - 8,600 8,600
Retirement of employees restricted shares (400) (2,408) - - - - - - - 1,888 1,888 (920) (920)
Compensation cost of issuing restricted
employee shares
- - - - - - - - - 14,537 14,537 14,537 14,537
Changes in non-controlling interests - - - - - - - - - - - - (16,988) (16,988)
640,610 954,075 531,424 6,363 686,801 1,224,588 (84,809) 57,631 - - (27,178) 2,792,095 112,764 2,904,859
Net income - - - - 463,242 463,242 - - - - 463,242 18,410 481,652
Other comprehensive income (loss) - - - - 182 182 (19,349) 16,556 - - (2,793) (2,611) 121 (2,490)
Total comprehensive income - - - - 463,424 463,424 (19,349) 16,556 - - (2,793) 460,631 18,531 479,162
Balance on December 3 1,2018 $640,610 954,075 531,424 6,363 1,150,225 1,688,012 (104,158) 74,187 - - (29,971) 3,252,726 131,295 3,384,021
(Please see the accompanying notes to the financial statements.)

108
(English Translation of consolidated Financial Statements and Reporting Originally Issued in Chinese) Topco Technologies Corporation and Subsidiaries
Consolidated of Cash Flow Statement For the years ended December 31, 2018 and 2017
(Expressed in Thousands of New Taiwan Dollars)
2018 2017
Cash flows from operating activities:
Income before income tax $ 653,359 $ 476,413
Adjustments :
Adjustments to reconcile profit (loss)
Depreciation expense 5,017 5,655
Amortization expense 1,056 739
Expected credit loss (gain) / Provision (reversal of provision) for bad debt
expense
11,331 1,826
Net loss (gain) on financial assets or liabilities at fair value through profit or loss 53 (736)
Impairment loss - 23,400
Interest expense 4,507 2,644
Interest income (8,457) (4,671)
Share-based payments 23,137 21,972
Loss (gain) on disposal of property, plant and equipment (65) 70
Total adjustments to reconcile profit (loss) 36,579 50,899
Change in operating assets and liabilities:
Change in operating assets:
Decrease (increase) in financial assets at fair value through profit or loss 60,272 (60,730)
Decrease (increase) in notes and accounts receivable (including related parties) (131,991) (104,088)
Decrease (increase) in other financial assets (13,990) 4,625
Decrease (increase) in inventory (233,057) (51,906)
Decrease (increase) in other current assets (15,654) 30,740
Others 579 558
(333,841) (180,801)
Change in operating liabilities:
Increase (decrease) in notes and accounts payable (including related parties) (45,918) 30,621
Increase (decrease) in other accounts payable and other current liabilities 57,458 92,499
Increase (decrease) in contract liabilities-current 24,495 -
36,035 123,120
Total change in operating assets and liabilities (297,806) (57,681)
Total adjustments (261,227) (6,782)
Cash inflow (outflow) from operating activities 392,132 469,631
Interests received 8,457 4,671
Interests paid (4,192) (2,676)
Income tax paid (135,854) (91,035)
Net cash inflows (used in) from operating activities 260,543 380,591
Cash flows from(used in) investment activities:
Acquisition of financial assets at amortized cost (35,205) -
Acquisition of financial assets at fair value through profit or loss - (4,954)
Acquisition of property, plant and equipment (6,803) (946)
Disposal of property, plant and equipment 139 460
Decrease (Increase)of restricted assets (810) 1,552
Decrease (Increase)in refundable deposit 1,463 4,029
Decrease (increase) in other prepayments (472) (1,062)
Net cash inflows (used in) from investment activities (41,688) (921)
Cash flows from(used in)financing activities:
Increase (Decrease) in short-term loans 45,825 (34,144)
Repayments of long-term loans (10,000) (12,610)
Cash dividends paid (294,865) (256,404)
Return of Restricted Stock Awards (RSA) (920) (115)
Change in non-controlling interest (16,988) (14,561)
Net cash flows from financing activities (276,948) (317,834)
Effect of exchange rate changes on cash and cash equivalents (31,047) (53,983)
Increase (decrease) in cash and cash equivalents for the period (163,952) (157,734)
Cash and cash equivalents at the beginning of the period 1,379,122 1,378,456
Cash and cash equivalents at the end of the period $1,301,703 $1,379,122
(Please see the accompanying notes to the consolidated financial statements.)

109
(English Translation of consolidated Financial Statements and Reporting Originally Issued in Chinese)
TOPCO TECHNOLOGIES CORP AND SUBSIDIARIES
Notes to the Consolidated Financial Statements
For the years ended December 31, 2018 and 2017
(Expressed in Thousands of New Taiwan Dollars, Unless Otherwise Specified)
(1) Company history
Topco Technologies Corp. (the “Company”) was incorporated in February 1994, as a company
limited by shares under the law of Republic of China(R.O.C) . Its register address is 14F., No.102,
Sec. 4, Civic Blvd., Da’an Dist., Taipei City 106, Taiwan (R.O.C.). It was formerly named as
Topview Technologies. On July 1, 2004, it absorbed Topco Trading Co., Ltd and was renamed as
Topco Technologies Corp. The electronic group producing and merchandising safety monitor was
then spinoff from Topco as new organization on October 1, 2010. The main operating items of the
Company and its subsidiaries (“the Group”) are import and export business of products related to
chemical materials and business of general trading activities.
(2) Approval date and procedures of the consolidated financial statements
The consolidated financial statements for the years ended December 31, 2018 and 2017 were
authorized for issuance by the Board of Directors on March 4, 2019.
(3) New standards, amendments and interpretations
(a) The impact of the International Financial Reporting Standards (“IFRSs”) endorsed by the
Financial Supervisory Commission, R.O.C. (“FSC”) which have already been adopted.
The following new standards, interpretations and amendments have been endorsed by the
FSC and effective for annual periods beginning on or after January 1,2018.
New ,Amended or Revised Standards and Interpretations
Effective date
per IASB
Amendments to IFRS 2, “Classification and Measurement of Share-based
Payment Transactions”
January 1, 2018
Amendments to IFRS 4, “Applying IFRS 9 'Financial Instruments' with IFRS
4 'Insurance Contracts'”
January 1, 2018
IFRS 9, “Financial Instruments” January 1, 2018
IFRS 15, “Revenue from Contracts with Customers” January 1, 2018
Amendments to IAS 7, “Disclosure Initiative” January 1, 2017
Amendments to IAS 12, “Recognition of Deferred Tax Assets for Unrealized
Losses”
January 1, 2017
Amendments to IAS 40, “Transfers of Investment Property” January 1, 2018
The annual improvement of IFRS 2014-2016 cycle:
Amendments to IFRS 12 January 1, 2017
Amendments to IFRS 1 and IAS 28 January 1, 2018
IFRIC 22, “Foreign Currency Transactions and Advance Consideration” January 1, 2018
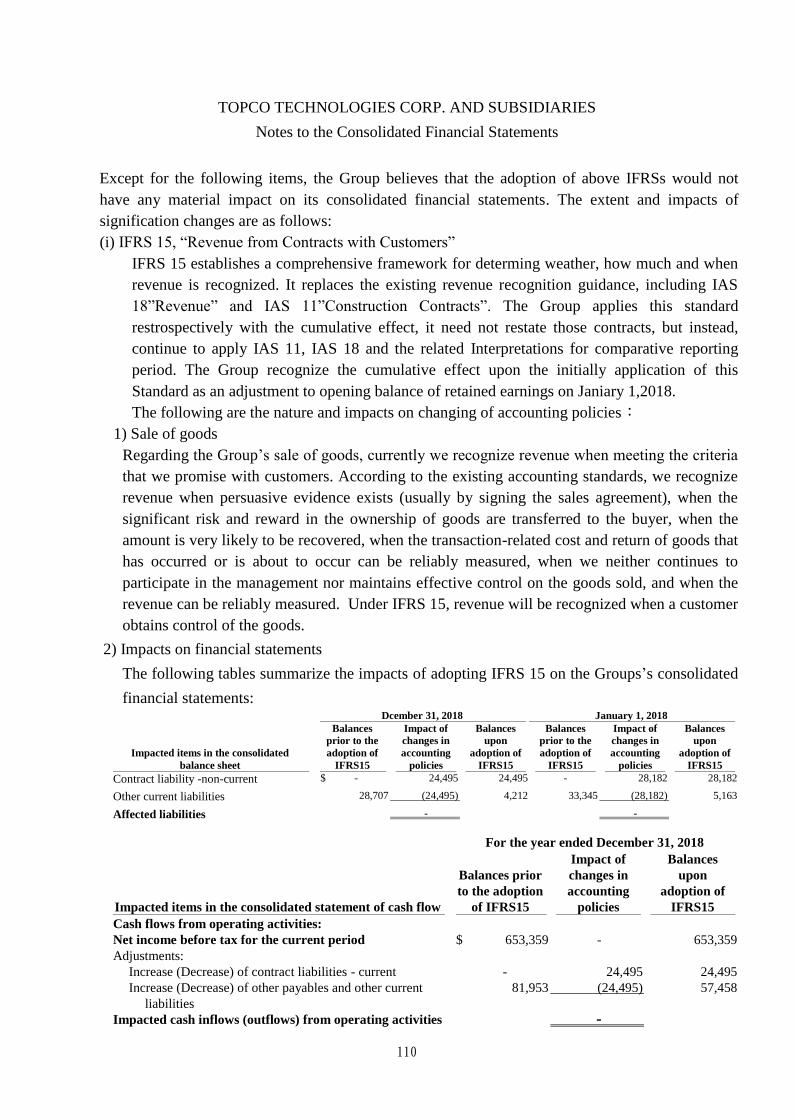
TOPCO TECHNOLOGIES CORP. AND SUBSIDIARIES
Notes to the Consolidated Financial Statements
110
Except for the following items, the Group believes that the adoption of above IFRSs would not
have any material impact on its consolidated financial statements. The extent and impacts of
signification changes are as follows:
(i) IFRS 15, “Revenue from Contracts with Customers”
IFRS 15 establishes a comprehensive framework for determing weather, how much and when
revenue is recognized. It replaces the existing revenue recognition guidance, including IAS
18”Revenue” and IAS 11”Construction Contracts”. The Group applies this standard
restrospectively with the cumulative effect, it need not restate those contracts, but instead,
continue to apply IAS 11, IAS 18 and the related Interpretations for comparative reporting
period. The Group recognize the cumulative effect upon the initially application of this
Standard as an adjustment to opening balance of retained earnings on Janiary 1,2018.
The following are the nature and impacts on changing of accounting policies:
1) Sale of goods
Regarding the Group’s sale of goods, currently we recognize revenue when meeting the criteria
that we promise with customers. According to the existing accounting standards, we recognize
revenue when persuasive evidence exists (usually by signing the sales agreement), when the
significant risk and reward in the ownership of goods are transferred to the buyer, when the
amount is very likely to be recovered, when the transaction-related cost and return of goods that
has occurred or is about to occur can be reliably measured, when we neither continues to
participate in the management nor maintains effective control on the goods sold, and when the
revenue can be reliably measured. Under IFRS 15, revenue will be recognized when a customer
obtains control of the goods.
2) Impacts on financial statements
The following tables summarize the impacts of adopting IFRS 15 on the Groups’s consolidated
financial statements: Dcember 31, 2018 January 1, 2018
Impacted items in the consolidated
balance sheet
Balances
prior to the
adoption of
IFRS15
Impact of
changes in
accounting
policies
Balances
upon
adoption of
IFRS15
Balances
prior to the
adoption of
IFRS15
Impact of
changes in
accounting
policies
Balances
upon
adoption of
IFRS15
Contract liability -non-current $ - 24,495 24,495 - 28,182 28,182
Other current liabilities 28,707 (24,495) 4,212 33,345 (28,182) 5,163
Affected liabilities - -
For the year ended December 31, 2018
Impacted items in the consolidated statement of cash flow
Balances prior
to the adoption
of IFRS15
Impact of
changes in
accounting
policies
Balances
upon
adoption of
IFRS15
Cash flows from operating activities: Net income before tax for the current period $ 653,359 - 653,359 Adjustments: Increase (Decrease) of contract liabilities - current - 24,495 24,495 Increase (Decrease) of other payables and other current
liabilities
81,953 (24,495) 57,458
Impacted cash inflows (outflows) from operating activities -

TOPCO TECHNOLOGIES CORP. AND SUBSIDIARIES
Notes to the Consolidated Financial Statements
111
(ii) IFRS 9, “Financial Instruments”
IFRS 9 replaces IAS 39“Financial Instruments: Recognition and Measurement” which
contains classification and measurement of financial Instruments and impairment. Since IFRS9 has been adopted, the Group adopts the revised IAS 1, “Presentation of
Financial Statements”. The Standard requires impairment of financial assets to be
recognized and reported as a single item in the comprehensive income statement. The
Group recognized the impairment of account receivables as administrative expense
previously. In addition, the Group adopted the consequential amendments to IFRS7
“Financial Instruments: Disclosures” that are applied to disclosure about 2018 but
generally have not been applied to comparative information.
The detail of new significant accounting policies and the nature and effect of the changes
to previous accounting policies are set out below:
1) Classification of financial assets and liabilities
IFRS 9 contains three principal classification categories for financeial assets: measured
at amortized cost, fair value through other comprehensive income (FVOCI) and fair
value through profit or loss (FVTPL). The classification of financial assets under IFRS9
is generally based on the business model in which a financial asset is managed and its
contractual cash flow characterics. The standard eliminates the previous IAS39
catagories of held to maturity, loans and receivables and available for sale. Under IFRS9,
derivatives embedded in contracts where the host is a financial asset in the scop of the
standard are never bifurcated. For an examplanation of how the Group classifies and
measures financial assets and accounts for related gains and losses under IFRS 9, please
see Notes 4(g) for details.
The adoption of IFRS 9 did not have any a significant impact on its accounting policies
of financial liabilities.
2) Impairments of financial assets
IFRS 9 replaces the “incurred loss” model in IAS39 with the “expected credit loss”
(ECL) model. The new impairment model applies to financial assets evaluated at
amortized cost, contract assets and debt investments at fair value through other
comprehensive income, but not to investments in equity instrument. Under IFRS9, the
credit losses are recognized earlier than thay are under IAS39. Please see Note 4(7) for
details.

TOPCO TECHNOLOGIES CORP. AND SUBSIDIARIES
Notes to the Consolidated Financial Statements
112
3) Transition
The adoption of IFRS 9 has been applied retrospectively, except as described blow:
‧Differences in the carring amount of financial assets and financial liabilities resulting
from the adoption of IFRS 9 are recognized in retained earnings and other equity on
January 1, 2018.Accordingly, the information presented in 2017 does not generally
reflect the requirements of IFRS9. Thus, they are not comparable with the information
disclosed under IFRS 9 in 2018.
‧The following assessments have been made on the basis of the facts and circumstances
that existed at the date of initial application:
– The determination of the business model within which the financial asset is held.
– The designation and revocation of previous designation of the financial assets and
liabilities as measured at FVTPL.
– The designation of certain investments in equity instruments not held for trading as
at FVOCI.
‧If the debt security investment had low credit risk at the date of initial application of
IFRS9, then the Group assumed that the credit risk on its asset will not increase
significantly since its initial recognition.
4) Classification of financial assets on the date of initial application of IFRS 9
The following table shows the original measurement categories under IAS39 and the
new measurement categories under IFRS 9 foe each class of the Group’s financial
assets as January 1, 2018. IAS39 IFRS9
Measurement Categories Carring Amount
Measurement Categories
Carring Amount
Financial asset
Cash and cash equivalent Loans and receivables (Note 1) 1,379,122 Amortized cost 1,379,122
Debt instruments Designated at fair value through profit or loss (Note 2)
60,166 Mandatorily measured at fair value through profit or loss
30,406
Designated at fair value through profit or loss
29,760
Notes and accounts receivable (including related parties)
Loans and receivables (Note 1) 1,958,395 Amortized cost 1,948,889
Fair Value through profit or loss
9,506
Other financial assets--current (other receivables)
Loans and receivables (Note 1) 44,896 Amortized cost 44,896
Equity instrument investments Available-for-sale financial assets(Note 3)
174,185 Fair Value through other comprehensive income
174,185
Other non-current assets (refundable deposit)
Loans and receivables (Note 1) 13,196 Amortized cost 13,196

TOPCO TECHNOLOGIES CORP. AND SUBSIDIARIES
Notes to the Consolidated Financial Statements
113
Note 1: Under IAS39, cash and cash equivalent, notes and accounts receivable,
other receivable and refundable deposit are classified as loans and
receivables. Now, they are classified as financial assets evaluated at
amortized cost. At initial application of IFRS9, there is no need to
additionally recognize cumulative impairment losses and adjust the
retained earnings on Jan. 1, 2018.
Note 2: Under IAS39, the debt instrument is designated at fair value through profit
or loss. Since the Group manages based on fair value, the financial asset has
been classified as evaluated at fair value through profit or loss in accordance
with IFRS9.
Note 3: The equity instruments (including the financial assets evaluated at cost)
represent investments that the Group intends to hold for the long term for
strategic purposes. As permitted by IFRS9, the Group has designated these
investments at the date of initial application as measured at FAOCI.
Accordingly, a decrease of $23,400 in other equity and an increase of
$23,400 in retained earnings were recognized on January 1, 2018,
respectively.
The following tables reconcile the carring amount of financial assets under IAS39 to the
carring amounts under IFRS 9 upon transition toIFRS 9 on January 1,2018:
2017.12.31 2018.1.1 2018.1.1 2018.1.1
IAS 39
Carring
Amount Reclassifications
Re-
evaluations
IFRS 9
Carring
Amount
Adjustment
amount of
retained
earnings
Adjustment
amount of
other
equities
Financial assets at fair value through other
comprehensive income
Beginning balance of FVOCI( IAS 39) $ 174,185 - - - -
Equity instrument investments:
From available for sale - 174,185 - 23,400 (23,400)
Reclassified as evaluated at fair value
through other comprehensive income
-
(174,185)
___-______
-
-
Total $ 174,185 _______-____ - 174,185 23,400 (23,400)
(iii) Amendments to IAS 7, “Disclosure Initiative”
The amendments require discloures that enable users of financial statements to evaluate
changes in liabilities arising from financial activities, including both changes arising
from cash flow and non-cash changes.

TOPCO TECHNOLOGIES CORP. AND SUBSIDIARIES
Notes to the Consolidated Financial Statements
114
To satisfy the new disclosure requirements, the Group presents a reconciliation between
the opening and closing balances for liabilities with changes arising from financing
activities as Note 6(w).
(b) The impact of IFRS issued by IASB but not yet endorsed by the FSC
The following new standards, interpretations and amendmends have been endorsed by the
FSC and are effected for annual period beginning on or after January 1, 2019 in accordance
with Ruling No.1070324857 issued by FSC on July 17,2018:
New, Amended or Revised Standards and Interpretations
Effective date
per IASB IFRS 16, “Leases” January 1, 2019
IFRIC 23, “Uncertainty over Income Tax Treatments” January 1, 2019
Amendments to IFRS 9, “Prepayment Features with Negative Compensation” January 1, 2019
Amendments to IAS 19, “Plan Amendment, Curtailment or Settlement” January 1, 2019
Amendments to IAS 28, “Long-term Interests in Associates and Joint Ventures”
January 1, 2019
The annual improvement of IFRS 2015-2017 cycle January 1, 2019
Except for the following items, application of the aboved IFRS will not cause significant
impact on the consolidated financial statements. The extent and impact of the significant
changes are as below:
(i) IFRS 16, “Leases”
IFRS 16 replaces the existing lease guidance, including IAS 17 “Lease”,IFRIC 4
“Determining whether an Arrangement contains a Lease” ,SIC-15 “Operating Leases –
Incentives” and SIC 27, “Evaluating the Substance of Transactions in the Legal Form of
a Lease.”
IFRS16 introduces a single and an on-balance sheet lease accounting model for leases.
A lease recognizes a right-of-use asset representing its right to use the underlying asset
and a lease liability representing its obligation to make lease payments. In addition, the
expenses related to the lease will now be changed since IFRS 16 replaces the
straight-line operating lease expense with a depreciation charge foe right-to-use assets
and interest expense on lease liabilities. There are recognition exemptions for short-term
leases and lease of low-value items. The accounting principles regarding the lessor
remain similar to the existing Standards. That is, the lessor shall still classify lease into
operating lease or finance lease.
1) Determing wheather an arrangement contains to lease
On transition to IFRS16, the Group can choose to apply either of the following:
‧apply IFRS 16 definition of a lease to all contracts; or

TOPCO TECHNOLOGIES CORP. AND SUBSIDIARIES
Notes to the Consolidated Financial Statements
115
‧apply a pratical expendient that does not need any reassessment weather a contract is,
or contains, a lease.
The Group expects to adopt expedient procedures and exempt from the re-evaluation of
lease definition during the transfer. This meas the Group will identify the contracts it
entered into before January 1,2019 as lease in accordance with IAS17 and IFRIC 4.
2) Transition As a lease, the Group can either apply the standard using the following:
‧restropective approach;or
‧modified restropective approach with optional practical expedients
On January 1, 2019 the Group plans to initially apply IFRS16 using the modified
restropective approach. Accordingly, the cumulative effects of adopting IFRS16 will be
recognized as an adjustment to the opening balance of retained earnings at January 1,
2019, with no restatement of comparative information.
When applying the modified retrospective approach to lease previously claasified as
operating lease under IAS17, the lease can elect, on a lease-by-lease basis, weather to
apply a number of pratical expendients on transition. The Group assessment adopts the
following practical expediencies:
‧Targeting lease portfolios with similar characteristics, a single discount rate shall
apply;
‧Just before the first applicable date, the IAS37 Onerous Contract assessment results
shall serve as the alternative method for assessing appropriate rights asset
impairment.
‧Targeting leases to expire within twelve months after the first appropriative date
during the lease period, appropriative right assets and lease obligations applicable for
exemptions without recognition.
‧Not inclusive of original and direct costs in the appropriative right asset measurement
on the first applicable date.
‧The lease contract shall include the lease period determination through hindsight under
a lease extension or termination option.

TOPCO TECHNOLOGIES CORP. AND SUBSIDIARIES
Notes to the Consolidated Financial Statements
116
3) The material impact identified is that the Group will have to recognize the additional
right-of-use assets and lease liabilities for its offices, public vehicles, and warehouse
which were currently accounted for under the operating lease. The aforementioned
impact would lead to the increase in right-of-use assets and lease liabilities by 114,379,
respectively. The Group does not expect the adoption of IFRS16 to have any impact on
its ability to comply with the maximum laverage threshold in the loan covenant.
(ii) IFRIC 23, “Uncertainty over Income Tax Treatments”
In assessing wheather and how an uncertain tax treatment affects the determination of
taxable profit (tax loss), tax bases, unused tax credits, as well as tax rates, an entity shall
assume that taxation authority will examine the amounts it has the right to examine and
have a full knowledge on all related information when making those examinations.
If an entity concludes that it is probable that the taxation authority will accept an uncetain
tax treatment, the entity shall determine the tax profit(tax loss),tax bases, unused tax
losses,unused tax credits, as well as tax rates consistently with the tax treatment used or
planned to be used in its income tax filing.Otherwise, an entity shall reflect the effect of
uncertainty for reach uncertain tax treatment by using either the most likely amount or the
expected value, depending on which method the entity expects to better predict the
resolution of the uncertainty.
Up to now, the Group has deferred income tax liabilities and retained earnings on January
1st, 2019 have not exerted a major influence.
The aforementioned estimated situation of influence in the new bulletin may change with
the future environment or situation.
(c) The impact of IFRS issued by IASB but not yet endorsed by the FSC
As of the date, the following IFRSs have been issued by the IASB, but have yet to be
endorsed by the FSC:
New ,Amended or Revised Standards and Interpretations
Effective date
per IASB Amendments to IFRS 3, “Definition of a business” January 1, 2020
Amendments to IFRS 10 and IAS 28 — Sales or contributions of assets between an investor and its associate orjoint venture
Effective date to be determined by IASB
IFRS 17, “Insurance Contracts” January 1, 2021
Amendments to IAS 1 and IAS 8— The definition of material. January 1, 2020

TOPCO TECHNOLOGIES CORP. AND SUBSIDIARIES
Notes to the Consolidated Financial Statements
117
Those which may be relevant to the Group are set out below:
Issuance / Release
Dates Standards or Interpretations Content of amendment October 31,2018 Amendments to IAS 1 and IAS
8— The definition of material. Elaborate on the definition of materiality and how to apply the materiality guidelines mentioned in the existing criteria. Materiality definition related explanations are improved to ensure the consistency of materiality in all the criteria.
The Group is evaluating the impact on its consolidated financial position and consolidated
financial performance upon the initial adoption of the abovementioned standards or
interpretations. The results thereof will be disclosed when the Group completes its
evaluation.
(4) Summary of significant accounting policies
The significant accounting policies presented in the consolidated financial statements are
summarized as follows. And the accounting policies have been applied consistently to all periods
presented in these consolidated financial statements.
(a) Statement of compliance
The accompanying consolidated financial statements have been prepared in accordance with
the Guidelines Governing the Preparation of Financial Reports by Securities Issuers
(hereinafter referred to the Guidelines) and the International Financial Reporting Standards,
International Accounting Standards, IFRIC interpretations and SIC interpretations as
endorsed by the Financial Supervisory Commission of the Republic of China (hereinafter
referred to IFRSs as endorsed by the FSC).
(b) Basis of preparation
(i) Basis of measurement
The consolidated financial statements have been prepared on historical cost basis, except
for the following material items in the statement of financial position.
1) Financial instruments measured at fair value through profit or loss, including
derivative financial instruments
2) Financial assets at fair value through other comprehensive income
(Available-for-sale financial assets )
3) The net defined benefit liabilities are measured as the fair value of the plan
assets, less the present value of the defined benefit obligation and the maximum
number of influences mentioned in Note 4 (o).

TOPCO TECHNOLOGIES CORP. AND SUBSIDIARIES
Notes to the Consolidated Financial Statements
118
(ii) Functional and presentation currency
The functional currency of the Group is determined based on the primary economic
environment in which the entities operate. The consolidated financial statements are
presented in New Taiwan Dollar, which is the Company’s functional currency. All
financial information presented in New Taiwan Dollar has been rounded to the nearest
thousand.
(c) Basis of consolidation
1. Principles of preparing consolidated financial statements
The consolidated financial statements comprise the Company and its subsidiaries. The
financial statements of subsidiaries are included in the consolidated financial statements
from the date that control commences until the date that control ceases. Losses applicable
to the non-controlling interests in a subsidiary are allocated to the non-controlling
interests even if doing so causes the non-controlling interests to have a deficit balance.
Intra-group balances and transactions, and any unrealized income and expenses arising
from intra-group transactions are eliminated in preparing the consolidated financial
statements.
Changes in the ownership interest in a subsidiary that do not result in a loss of control are
accounted for as equity transactions. The difference between the non-controlling equity
adjustment and the fair value of the consideration paid or received is directly recognized
in equity and belongs to the owners of the company.
List of subsidiaries in the consolidated financial statements
Name of
Investors:
Percentage ownership
Name of subsidiaries:
Nature of business December 31,
2018 December 31,
2017
Explanation The
Company
Topco America Inc. (Topco
America)
General Investment
Industry
100% 100%
〃 Topglow Trading Co., Ltd.
(Topglow)
Import and export
trading industry
65% 65%
Topco
America
Topco Trading (Shanghai Pu
Dong New Area) Co.,Ltd
(Topco Shanghai)
Merchandising
business of chemical
material related
products
100% 100%
〃 Topco (Guang Zhou) Trading
Co., Ltd.
(Topco Guang Zhou)
〃
100% 100%
〃 Hong Kong T.T.C. Co., Ltd.
(Hong Kong T.T.C.)
〃
100% 100%
Topglow Top Glory
Trading Co., Ltd. (Top Glory)
Import and export
trading industry
100% 100%
〃 Topglow Advanced Materials
(Shanghai) Co., Ltd.
(Topglow Shanghai)
〃
100% -% Note 1
Topco
Hong Kong
PT. Topco Trading Indonesia
(PT. Topco)
Merchandising
business of chemical
material related
products
100% 100% Note 2
〃 TOPCO (VIETNAM)
TRADING CO., LTD
(TOPCO VIETNAM)
〃
100% 100%

TOPCO TECHNOLOGIES CORP. AND SUBSIDIARIES
Notes to the Consolidated Financial Statements
119
Note 1: Topglow Advanced Materials (Shanghai) Co., Ltd. was established in October 2017.
Note 2: PT.Topco was set up in April 2015. Considering the requirements of Indonesia, the 0.04% shareholding
in obtaining PT.Topco’s equity was held with the third party. Topco Hong Kong signed a contract with
the third party, in which the rights and obligations of the both parties are listed, to protect asset safety.
(d) Foreign currency
(i) Foreign currency transaction
Transactions in foreign currencies are translated to the respective functional currency of
the Group at exchange rates at the dates of the transactions. Monetary assets and liabilities
denominated in foreign currencies at the reporting date are retranslated to the functional
currency at the exchange rate at that date. The foreign currency gain or loss on monetary
assets and liabilities is the difference between amortized cost in the functional currency at
the beginning of the period, adjusted for the effective interest and payments during the
period, and such assets and liabilities reported in foreign currency translated at the
exchange rate at the end of the reporting period. Foreign currency denominated
non-monetary assets and liabilities measured at fair value are retranslated to the functional
currency at the exchange rate on the date when fair value was determined. Foreign
currency denominated non-monetary items measured at historical cost is translated using
the exchange rate at the date of the transaction. Foreign currency differences arising on
translation are recognized in profit or loss, except for the equity instrunment at fair value
through other comprehensive income differences which are recognized in other
comprehensive income arising on the transaction.
(ii) Foreign operating institutions
The assets and liabilities of foreign operations, including goodwill and fair value
adjustments arising on acquisition, are translated to the Group’ s functional currency at
exchange rates at the reporting date. The income and expenses of foreign operations,
excluding foreign operations in hyperinflationary economies, are translated to the
Group’s functional currency at average rate. Foreign currency differences are recognized
in other comprehensive income.
When a foreign operation is disposed of such that control, significant influence or joint
control is lost, the cumulative amount in the translation reserve related to that foreign
operation is reclassified to profit or loss as part of the gain or loss on disposal. When the
Group disposes of any part of its interest in a subsidiary that includes a foreign operation
while retaining control, the relevant proportion of the cumulative amount is reattributed
to non-controlling interest.When the Group disposes of only part of investment in an
associate of joint venture that includes a foreign operation while retaining significant or
joint control, the relevant proportion of the cumulative amount is reclassified to profit or
loss.

TOPCO TECHNOLOGIES CORP. AND SUBSIDIARIES
Notes to the Consolidated Financial Statements
120
When the settlement of a monetary item receivable from or payable to a foreign operation
is neither planed nor likely in the foreseeable future, foreign currency gains and losses
arising from such items are considered to form part of a net investment in the foreign
operation and are recognized in other comprehensive income.
(e) Classification standard of current and non-current assets and liabilities
An asset is classified as current under any one of the following conditions. All other assets
are classified as non-current:
i. It is expected to be realized, or intended to be sold or consumed, in the normal operating
cycle;
ii. It is held primarily for the purpose of trading;
iii. It is expected to be realized within twelve months after the reporting period; or
iv. The asset is cash and cash equivalent unless the asset is restricted from being exchanged or
used to settle a liability for at least twelve months after the balance sheet date.
A liability is classified as current under any one of the following conditions. All other
liabilities are classified as non-current.
i. The liability is expected to be settled during the Group’s normal operating cycle;
ii. The liability is held primarily for the purpose of trading;
iii. The liability is due to be settled within twelve months after the reporting period; or
The Group does not have any unconditional right to defer settlement of the liability for at
least twelve months after the reporting period. Terms of a liability that could, at the option
of the counterparty, result in its settlement by issuing equity instruments do not affect its
classification.
(f) Cash and cash equivalents
Cash comprises cash on hand and cash in bank. Cash equivalents are short-term, highly
liquid investments that are readily convertible to known amounts of cash and which are
subject to an insignificant risk of changes in value. Time deposits are held for the purpose of
meeting short-term cash commitments rather than for investment or other purposes are
classified under cash equivalents.
(g) Financial Instruments
(i). Financial asset (applicable from January 1, 2018)
Financial asset are classified into the following categories: measured at amortised cost,
fair value through other comprehensive income (FVOCI) and fair value through profit or
loss (FVTPL).
The Group shall reclassify all affected financial assets only when it changes its business
model for managing its financial asset.

TOPCO TECHNOLOGIES CORP. AND SUBSIDIARIES
Notes to the Consolidated Financial Statements
121
1) Finacial asset measured at amortised cost
A finacial asset is measured at cost if meets both of the following conditions and is not
designated as at FVTPL:
‧The financial asset is held under the business mode targeted at receiving contractual
cash flows.
‧All cash flows of specific date generated by the contract provisions of the financial
asset are for paying the principal and interest of outstanding principal
A financial asset measured at amortised cost is initially recognized at fiar value plus any
directly attributable transaction cost. These assets are subsequently measured at
amortised cost using the effective interest method. The amortised cost is reduced by
impairment loses. Interest income, foreign exchange gains and loses, and impairment
losses are recognized in profir or loss. Any gain or loss on derecognition is recognized
in profit or loss. A regular way of purchase or sale of financial assets shall be
recognized and derecognized, as applicable, using trade date accounting.
2) Fair value through other comprehensive income (FVOCI)
A debt investment is measured at FVOCI if it meets both of the following conditions
and is not designated as at FVTPL:
‧it is held within a business model whose objective is achieved by both collecting
contractual cash flows and selling financial assets; and
‧its contractual terms give rise on specific dates to cash flows that are soley payments of
principal and interest on the principal amount outstanding.
On initial recognition of an equity investment that is not held for trading, the Group may
irrevocably elect to present subsequent changes in the investment’s fair value in othe
comprehensive income. This election is made on an instrument-by-instrument basis.
A financial asset measured at FVOCI is initially recognized at fiar value, plus any
directly attributable transaction cost. These assets are subsequently measured at fair
value. Interest income calculated using the effective interest method, foreign exchange
gains and losses, and impairment losses, deriving from debt investments are recognized
in profit or loss; whereas dividends deriving from equity investments are recognized as
income in profit or loss, unless the dividend clearly represents a recovery of part of the
cost of investment. Other net gains and losses of financial assets measured at FVOCI are
recognized in OCI. On derecognition, gains and losses accumulated in OCI of debt
investments are reclassified to profit or loss. However, gains and losses accumulated in
OCI of equity investments are reclassified to retained earnings instead of profit or loss.
Dividend income derived from equity investments is recognized on the date that the
Group’s right to receive payment is established, which in the case of quoted securities is
normally the ex-dividend date.

TOPCO TECHNOLOGIES CORP. AND SUBSIDIARIES
Notes to the Consolidated Financial Statements
122
3) Fair value through profit or loss (FVTPL)
All financial assets not classified as amortized cost or FVOCI described as above are
measured at FVTPL, including derivative financial assets and accounts
receivable.However, for those presented as account receivable but measured at FVTPL.
On initial recognition, the Group may irrevocably designate a financial asset, which
meets the requirements to be measured at amortized cost or at FVOCI, as at FVTPL if
doing so eliminates or significantly reduces an accounting mismatch that would
otherwise arise.
Financial asset in this category are measured at fair value at initial recognition.
Attributable transaction costs are recognized in profit or loss as incurred. Subsequent
changes that are measured at fair value, which take into account any dividend and
interest income, are recognized in profit or loss.
A regular way of purchase or sale of financial assets shall be recognized and
derecognized, as applicable, using trade date accounting.
4) Assessment of operation mode
The Group evaluates the aims of the operation mode of holding financial assets with
combination level. This can mostly reflect management approach and the way of
providing data to the management. The information taken into account includes:
‧The policy and goal of the mentioned investment portfolio and the operation of the
policy. Including whether the management’s strategy focuses on earning contractual
cash flows, maintaining specific interest yield portfolio, matching the duration of
financial assets and the duration of related liabilities or expected cash outflows, or
realizing cash flows by selling financial assets.
‧The performance of the operation mode and how to evaluate the financial assets held
under the operation mode, and how to report to the business’ major management
personnel.
‧The risk affecting the performance of the operation mode (and the financial assets held
under the operation mode) and the management approach of the risk;
‧The frequency, dollar amount and time point of selling the financial assets in each of
the previous period, the reasons for the sale and the expectation of future selling
activities.
According to the above-mentioned operation goal, if the transaction of transferring
the financial asset to the third party does not meet the criteria of derecognition, then
they are do not belong to the sales mentioned above. This is consistent with the
Group’s aim of continuing recognizing the asset.
Financial assets held for trading and financial assets managed and evaluated based on
fair value are evaluated at fair value through income or loss.

TOPCO TECHNOLOGIES CORP. AND SUBSIDIARIES
Notes to the Consolidated Financial Statements
123
5) Assessment whether contractual cash flows are soley payment of principal and interests
For the purpose of this assessment,’principal’ is defined as the fair value of the
financial assets on initial recognition.’Interest’ is defined as consideration for the time
value of money and for the credit risk associated with the principal amount
outstanding during a particular period of time and for other basic leading risks and
costs, as well as a profit margin.
In assessing whether the contractual cash flows are solely payments of principal and
interest, the Group considers the contractual terms of the instrument. This includes
assessing whether the financial asset contains a contractual term that could change the
timing or amount of contractual cash flows such that it would not meet this condition.
In making this assessment, the Group considers:
‧contingent events that would change the amount or timing of cash flows;
‧terms that may adjust the contractual upon rate, including variable rate features;
‧prepayment and extension; and
‧ terms that limit the Group’s claim to cash flows from specified assets(e.g.
non-recourse features)
6) Impairment of financial assets
The Group recognizes loss allowance regarding financial assets evaluated at amortized
cost (including cash and cash equivalent, financial assets evaluated at amortized cost,
note and account receivables, other receivables, refundable deposits and other financial
assets, etc.), debt instrument investments evaluated at fair value through other
comprehensive income, account receivables and expected credit loss of contract assets.
The Group measures loss allowances at an amount equal to lifetime expected credit loss
(ECL), except for the following which are measured as 12-month ECL:
‧Determining that the credit risk of the debt security is low on the reporting day; and
‧The credit risk of other debt securities, other receivable and bank deposits (i.e., the
default risk of the financial instrument during its expected lifetime) has not
significantly increased since initial recognition.
The loss allowance of account receivables and contract assets are measured at an
amount equal to lifetime ECL.
Lifetime ECLs are the ECLs that result from all possible default events over the
expected life of a financial instrument.
12-month ECLs are the portion of ECLs that result from default events that are
possible within the 12 months after the reporting date (or in a shorter period if the
expected lifetime of the instrument is less than 12 months). The maximum period considered when eatimating ECLs is the maximum contractual
period over which the Group is exposed in credit risk.

TOPCO TECHNOLOGIES CORP. AND SUBSIDIARIES
Notes to the Consolidated Financial Statements
124
When determining whether credit risk of a financial asset has increased significantly
since initial recognition and when eatimating ECL, the Group considers reasonable
and supportable information that is relevant and available without undue cost or effort.
This includes both qualitative and quantitative information and the analysis based on
the Group’s historical experience and informed credit assessment as well as
forward-looking information. If the credit risk of the financial instrument is equivalent to the global definition of
“investment grade” (which is, or higher than, the BBB rating -of S&P, the Baa3
rating of Moody’s or the twA rating of Taiwan Ratings), the Group regards the debt
security as having low credit risk.
Since for the certificates of deposits, time deposits and other receivables held by the
Group, the transaction parties and obligation fulfilling places are the financial
institutions with ratings above the investment grade, they are regarded as having low
credit risk. If the contract payment is more than 30 days past due, the Group would assume the
credit risk of the financial asset has significantly increased. If the contract payment is more than 360 days past due, or if the borrower is not very
likely to fulfill its obligation by paying the full amount to the Group, the Group
would regard the financial asset as default.
ELCs are the probability weighted estimate of credit loss. Credit losses are measured
as the present value of all cash shortfalls. That is, it is the difference between the cash
flows due to the Group in accordance with the contract and the cash flows that the
Group expects to receive. ECLs are discounted at the effective interest rate of the
financial asset. At each repotind date, the Group accesses whether the financial assets carried at
amortized cost and debt securities at FVOCI are credit-impairmed. A financial asset
is ‘credit-impairmed’ when one or more events that have a determental impact on the
estimated future cash flows of the financial asset have occurred.
The evidence that the financial asset has realized credit-impairmened includes the
observable data related to the following items:
‧Significant financial difficulties of the borrower or the issuer;
‧Default, such as delay or overdue over 360 days;
‧Due to the economic or contractual reason related to the borrower’s financial
difficulties, the Group gives the borrower concession that it would not consider
originally;
‧The borrower is very likely to file for bankruptcy or engage in other financial
restructurings; or
‧The active market for the financial asset has disappeared due to financial difficulties.

TOPCO TECHNOLOGIES CORP. AND SUBSIDIARIES
Notes to the Consolidated Financial Statements
125
The asset loss allowance evaluated at amortized cost is deducted from the book value of
the asset. The loss allowance or reversed amount is recognized in the income statement.
For debt securities at FVOCI, the loss allowance is recognized in other comprehensive
income instead of reducing the carring amounts of the assets.
The gross carring amount of a financial asset is written off (either partially or in full) to
the extent that there is no realistic prospect of recovery. This is generally the case when
the Group determines that the debtor does not have assets or sources of income that
could generate sufficient cach flows to repay amounts subject to the write-off.However,
financial assets that are writen off still be subject enforcement activities in order to
comply with the Group’s procedures for recovery of amounts due.
7) Derecognition of financial assets
Financial aseets are derecognized when the contractual rights to the cash flows from the
assets expire, or when the Group transfers substantially all the risks and rewards of
ownership of the financial assets.
When the entire single debt instrument investment is derecognized, the difference
between its book value and the total amount of the consideration that can be collected or
has already been collected plus the amount recognized in other comprehensive income
and accumulated in “other equity – unrealized gains or losses from financial assets
evaluated at fair value through other comprehensive income” is recognized in the
income statement and presented under non-operating revenue and expenditure.
When the entire single debt instrument is not derecognized, the Group allocates the
original book value of that financial asset to the part that is continuously recognized due
to continued participation and the part that is d-recognized, on the basis of the relative
fair value of each part on the transfer day. The difference between any cumulative gain
from the consideration collected from the de-recognized part and the book value
allocated to the part that is de-recognized, or the sum allocated to the de-recognized part
in the loss, is recognized in the income statement, and presented in non-operating gains
and expenditure. Cumulative gains or losses already recognized in other comprehensive
income are allocated to the continuously recognized part and the de-recognized part,
based on the relative fair value.
(ii) Financial assets (applicable before January 1, 2018)
The Group classifies financial assets into the following categories: financial assets at fair
value through profit or loss, loans, receivables and available-for-sale financial assets.

TOPCO TECHNOLOGIES CORP. AND SUBSIDIARIES
Notes to the Consolidated Financial Statements
126
1) Financial assets at fair value through profit or loss
The financial asstes is acquired principally for the purpose of selling in the short term.
Financial asstes in this category are measured at fair value at initial recognition.
Attributible transaction costs are recognized at profit and loss as incurred. Financial
asstes at fair value through profit or loss are measured at fair value subsequently and
changes therein, which takes into account any dividend and interest income, are
recognized in profit or loss, and accounted for under other income.
2) Available-for-sale financial assets
Available-for-sale financial assets are non-derivative financial assets that are designated
as available-for-sale or are not classified in any of the other categories of financial
assets. Available-for-sale financial assets are recognized initially at fair value plus any
directly attributable transaction cost. Subsequent to initial recognition, they are
measured at fair value and changes therein, other than impairment losses, interest
income calculated using the effective interest method, dividend income, and foreign
currency differences on available-for -sale debt instruments, are recognized in other
comprehensive income and presented in the fair value reserve in equity. When an
investment is derecognized, the gain or loss accumulated in equity is reclassified to
profit or loss, under other income and other gains and losses of non-operating income
and expense. A regular way of purchase or sale of financial assets shall be recognized
and derecognized, as applicable, using trade date accounting.
Investments in equity instruments that do not have a quoted market price in an active
market, and whose fair value cannot be reliably measured, are measured at amortized
cost, and are included in financial assets measured at cost.
Dividend income is recognized in profit or loss on the date that the Group’s right to
receive payment is established, which in the case of quoted securities is normally the
ex-dividend date. Such dividend income is included in other income of non-operating
income and expenses.
3) Loans and receivables
Loans and receivables are financial assets with fixed or determinable payments that are
not quoted in an active market. Loans and receivables comprise trade receivables and
other receivables. Such assets are recognized initially at fair value, plus, any directly
attributable transaction costs. Subsequent to initial recognition, receivables are
measured at amortized cost using the effective interest method, less any impairment
losses other than insignificant interest on short-term receivables. A regular way
purchase or sale of financial assets is recognized and derecognized, as applicable, using
trade date accounting.

TOPCO TECHNOLOGIES CORP. AND SUBSIDIARIES
Notes to the Consolidated Financial Statements
127
Interest income is recognized in profit or loss, under other income of non-operating
income and expenses.
4) Impairment of financial assets
Except for financial assets at fair value through profit or loss, financial assets are
assessed for impairment at each reporting date. A financial asset is impaired if, and only
if, there is objective evidence of impairment as a result of one or more events that
occurred after the initial recognition of the asset (a ‘loss event’) and that loss event (or
events) has an impact on the estimated future cash flows of the financial asset that can
be estimated reliably.
Objective evidence that financial assets are impaired includes default or delinquency by
a debtor, restructuring of an amount due to the Group on terms that the Group would not
consider otherwise, indications that a debtor or issuer will enter bankruptcy, adverse
changes in the payment status of borrowers or issuers, economic conditions that
correlate with defaults, or the disappearance of an active market for a security. In
addition, for an investment in an equity security, a significant or prolonged decline in its
fair value below its cost is considered objective evidence of impairment.
All individually significant receivables are assessed for specific impairment.
Receivables that are not individually significant are collectively assessed for impairment
by grouping together assets with similar risk characteristics. In assessing collective
impairment, the Group uses historical trends of the probability of default, the timing of
recoveries, and the amount of loss incurred, adjusted for management’s judgment as to
whether current economic and credit conditions are such that the actual losses are likely
to be greater or less than those suggested by historical trends.
An impairment loss in respect of a financial asset is deducted from the carrying amount
except for accounts receivable, for which an impairment loss is reflected in an
allowance account against the receivables. When it is determined a receivable is
uncollectible, it is written off from the allowance account. Changes in the amount of the
allowance account are recognized in profit or loss.
Impairment losses on available for sale financial assets are recognized by reclassifying
the losses accumulated in the fair value reserve in equity to profit or loss.
If, in a subsequent period, the amount of impairment loss on a financial asset measured
at amortized cost decreases and the decrease can be related objectively to an event
occurring after the impairment was recognized, the decrease in impairment loss is
reversed through profit or loss to the extent that the carrying value of the asset does not

TOPCO TECHNOLOGIES CORP. AND SUBSIDIARIES
Notes to the Consolidated Financial Statements
128
exceed its amortized cost before impairment was recognized at the reversal date.
Impairment losses recognized on an available for sale equity security are not reversed
through profit or loss. Any subsequent recovery in the fair value of an impaired
available for sale equity security is recognized in other comprehensive income, and
accumulated in other equity. If, in a subsequent period, the fair value of an impaired
available for sale debt security increases and the increase can be related objectively to
an event occurring after the impairment loss was recognized, then the impairment loss is
reversed, with the amount of the reversal recognized in profit or loss.
Impairment losses and recoveries of accounts receivable are recognized in sales
expenses; impairment losses and recoveries of other financial assets are recognized in
other gains and losses of non-operating income and expenses.
5) Derecognition of financial assets
Financial assets are derecognized when the contractual rights of the cash inflow from the
asset are terminated, or when the Group transfer substantially all the risks and rewards
of ownership of financial assets.
On derecognition of a financial asset in its entity, the difference between the carrying
amount and the sum of the consideration received or receivable and any cumulative gain
or loss that had been recognized in other comprehensive income and presented in other
equity – unrealized gains or losses from available for sale financial assets are recognized
in profit or loss, under other gains and losses of non-operating income and expenses.
When the Group does not derecognize a financial assets in its entity, it separates the part
that continue to be recognized and the part that is derecognized, based on the relative
fair values of those parts on the date of the transfer. The difference between the carrying
amount of and the consideration received for financial assets derecognized and any
cumulative gain or loss allocated to such financial assets that had been recognized in
other comprehensive income, are recognized in profit or loss under other gains or losses
of non-operating revenues and expenses. A cumulative gain or loss that had been
recognized in other comprehensive income is allocated between the part that continues
to be recognized and the part that is derecognized, based on the relative fair values of
those parts.
(iii) Financial liabilities and equity instruments
1) Classification of debt or equity
Debt or equity instruments issued by the Group are classified as financial liabilities or
equity instruments in accordance with the substance of the contractual agreement.
Equity instruments refer to surplus equities of the assets after the deduction of all the
debts for any contracts.

TOPCO TECHNOLOGIES CORP. AND SUBSIDIARIES
Notes to the Consolidated Financial Statements
129
2) Financial liabilities at fair value through profit or loss
A financial liability is acquired principally for the purpose of selling in the short term.
Attributable transaction costs are recognized in profit or loss as incurred. Financial
liabilities at fair value through profit or loss are measured at fair value and changes
therein, which takes into account any interest expense, are recognized in profit or loss,
under other gains and losses of non-operating income and expenses.
3) Other financial liabilities
Financial liabilities not classified as held-for-trading, or designated as at fair value
through profit or loss, which comprise of loans and borrowings, and trade and other
payables, are measured at fair value plus any directly attributable transaction cost at the
time of initial recognition. Subsequent to initial recognition, they are measured at
amortized cost calculated using the effective interest method. Interest expense not
capitalized as capital cost is recognized in profit or loss, under financial costs of
non-operating income and expenses.
4) Derecognition of financial liabilities
A financial liability is derecognized when its contractual obligation has been discharged
or cancelled or expired. The difference between the carrying amount of a financial
liability removed and the consideration paid (including any non-cash assets transferred
or liabilities assumed) is recognized in profit or loss, under other gains and losses of
non-operating income and expenses.
5) Offsetting of financial assets and liabilities
The Group presents financial assets and liabilities on a net basis in the statements of
financial position when the Group has the legally enforceable rights to offset, and
intends to settle such financial assets and liabilities on a net basis or to realize the assets
and settle the liabilities simultaneously.
(iv) Derivative financial instruments, including hedge accounting
The Group holds derivative financial instruments to hedge its foreign currency and
interest rate exposures. Derivatives are recognized initially at fair value and
attributable transaction costs are recognized in profit or loss as incurred. Subsequent to
initial recognition, derivatives are measured at fair value, and changes therein are
recognized in profit or loss, under other gains and losses of non-operating income and
expenses. When a derivative is designated as a hedging instrument, the timing for
recognizing gain or loss is determined based on the nature of the hedging relationship.
When the fair value of derivative instrument is positive, it is classified as a financial
asset; otherwise, it is classified as a financial liability.

TOPCO TECHNOLOGIES CORP. AND SUBSIDIARIES
Notes to the Consolidated Financial Statements
130
(h) Inventories
Inventories are measured at the lower of cost and net realizable value. The cost of inventories
is based on the weighted average method, and includes expenditure incurred in acquiring the
inventories, and other costs incurred in bringing them to their existing location and condition.
Net realizable value is the estimated selling price in the ordinary course of business, less the
estimated costs of completion and selling expenses.
(i) Investment in Associates
Associates are those entities in which the Group has significant influence, but not control or
joint control, over the financial and operating policies.
Investments in associates are accounted for using the equity method and are recognized
initially at cost. The cost of the investment includes transaction costs. The carrying amount
of the investment in associates includes goodwill arising from business acquisition, less, any
accumulated impairment losses.
The consolidated financial statements include the Group’s share of the profit or loss and
other comprehensive income of equity accounted investees after adjustments to align the
accounting policies with those of the Group from the date that significant influence
commences until the date that significant influence ceases. When the associates incur
changes in equity arising from nonprofit-or-loss items and other comprehensive income, the
Group recognizes changes in equity proportionately to shareholding percentage as capital
surplus. Unrealized profits resulting from the transactions between the Group and an
associate are eliminated to the extent of the Group’s interest in the associate. Unrealized
losses on transactions with associates are eliminated in the same way, except to the extent
that the underlying asset is impaired.
When the Group’s share of losses exceeds its interest in associates, the carrying amount of
the investment, including any long-term interests that form part thereof, is reduced to zero,
and the recognition of further losses is discontinued except to the extent that the Group has
an obligation or has made payments on behalf of the investee.
(j) Property, Plant, and Equipment
(i) Recognition and measurement
Items of property, plant and equipment are measured at cost less accumulated
depreciation and accumulated impairment losses. Cost includes expenditure that is
directly attributed to the acquisition of the asset. Furthermore, cost also includes the
purchase of real estates, plants and equipment in foreign currency. Software purchased to
integrate functions of the relevant equipment is also capitalized as part of the equipment.

TOPCO TECHNOLOGIES CORP. AND SUBSIDIARIES
Notes to the Consolidated Financial Statements
131
Each part of an item of property, plant and equipment with a cost that is significant in
relation to the total cost of the item shall be depreciated separately, unless the useful life
and the depreciation method of the significant part of an item of property, plant and
equipment are the same as the useful life and depreciation method of another significant
part of that same item.
The gain or loss arising from the derecognition of an item of property, plant and
equipment shall be determined as the difference between the net disposal proceeds, if any,
and the carrying amount of the item, and shall be recognized in profit or loss, under net
other income and expenses.
(ii) Subsequent cost
Subsequent expenditure is capitalized only when it is probable that future economic
benefits associated with the expenditure will flow to the Group. The carrying amount of
those parts that are replaced is derecognized. Ongoing repairs and maintenance is
expensed as incurred.
(iii) Depreciation
The depreciable amount of an asset is determined after deducting its residual amount, and
it shall be allocated on a systematic basis over its useful life. Items of property, plant and
equipment with the same useful life may be grouped in determining the depreciation
charge. The remainder of the items may be depreciated separately. The depreciation
charge for each period shall be recognized in profit or loss.
Leased assets are depreciated by using straight-line method during the period of expected
use, consistent with the depreciation policy the lessee adopts for depreciable assets that are
owned. If there is reasonably certainty that the lessee will obtain ownership by the end of
the lease term, the period of expected use is the useful life of the asset; otherwise, the asset
is depreciated over the shorter of the lease term and its useful life.
Land has an unlimited useful life and therefore is not depreciated.
The estimated useful lives for the current and comparative years of significant items of
property, plant and equipment are as follows:
1) Buildings:10~50 years
2) Machine and equipment:5 years
3) Furniture, fixtures and other equipment:3~10 years

TOPCO TECHNOLOGIES CORP. AND SUBSIDIARIES
Notes to the Consolidated Financial Statements
132
Depreciation methods, useful lives, and residual values are reviewed at each reporting date.
If expectation differs from the previous estimates, the change is accounted for as a change
in an accounting estimate.
(k) Leases
For operating rentals of tenants, the paid rent (not including service costs such as insurance
and maintenance) of the rental period is recognized as fees according to straight-line basis.
The net profit provided by the lessor for incentive of rental purpose during the period of
rental is recognized as a decrease of rental expense according to straight-line method.
Contingent rent is recognized as expense in the periods in which they are incurred.
(l) Intangible Assets
(i) Research and development
The research stage refers to the estimated activities to be conducted for achieving and
understanding new scientific and technological knowledge. The relevant expenses
occurred are recognized as profit or loss.
During the development stage, the expenses are recognized as intangible assets if they
meet all of the below conditions; for expenses that do not meet all 6 of the below
conditions, they are recognized as profit or gain immediately when occurred:
1) The technical feasibility of completing the intangible asset has been achieved, the
intangible asset is thus available for use or sale.
2) The intent is to complete, use and sell the intangible asset.
3) The Group possess the adequate talent to use or sell the intangible asset under discussion.
4) The intangible asset is likely to generate future economic profit.
5) The Group possess the adequate technology, financial conditions and other resources to
complete the development, use and sell the intangible asset under discussion.
6) Costs attributable to the stage of development of the intangible asset is measurable.
The expense of capitalized stage of development is the cost of which deducted by
accumulated amortization and cumulative impairment.
(ii) Other Intangible Assets
Other intangible assets that are acquired by the Group are measured at cost less
accumulated amortization and any accumulated impairment losses.
(iii) Subsequent Expenditure
Subsequent expenditure is capitalized only when it increases the future economic
benefits embodied in the specific asset to which it relates. All other expenditures,
including expenditure on internally generated goodwill and brands, are recognized in
profit or loss as incurred.
(iv) Amortization
Amortization amount of intangible asset is calculated based on the cost of an asset less
its residual values.

TOPCO TECHNOLOGIES CORP. AND SUBSIDIARIES
Notes to the Consolidated Financial Statements
133
The cost of the Group’s main intangible asset, computer software, is estimated to have a
durability of 1~5 years based on straight-line amortization since it is first available for use.
The amortized value is recognized as profit or loss.
The residual value, amortization period, and amortization method for an intangible asset
with a finite useful life shall be reviewed at least annually at each fiscal year-end. Any
change shall be accounted for as a change in accounting estimate.
(m) Impairment of Non-Financial Assets
The Group assesses non-financial assets for impairment (except for inventories, deferred tax
assets and assets arising from employee benefit) at every reporting date, and estimates its
recoverable amount. If it is not possible to determine the recoverable amount (fair value less
cost to sell and value in use) for an individual asset, then the Group will have to determine
the recoverable amount for the asset's cash-generating unit (CGU).
The recoverable amount for individual asset or a cash-generating unit is the higher of its fair
value, less, costs to sell and its value in use. If, and only if, the recoverable amount of an
asset is less than its carrying amount, the carrying amount of the asset shall be reduced to its
recoverable amount. That reduction is an impairment loss. An impairment loss shall be
recognized immediately in profit or loss.
The Group assesses at the end of each reporting period whether there is any indication that
an impairment loss recognized in prior periods for an asset other than goodwill may no
longer exist or may have decreased. If any such indication exists, the entity shall eliminate
the recoverable amount of that asset.
(n) Revenue
(i) Revenue from customer’s contract (applicable from Jan. 1, 2018)
Revenue is measured basing on the consideration to which the Group expected to be
entitled in exchange for transferring goods or services to a customer. The Group
recognizes revenue when it satisfies a performace obligation by transferring control of a
good or service to a customer. The accounting policies to the Group’s main types of the
revenue are explained below:
1) Sale of goods
Revenue is measured at the fair value of the consideration received or receivable less
estimated returns, trade discounts, and volume allowances. Our company recognizes
revenue when persuasive evidence exists (usually by signing the sales agreement), when
the significant risk and reward in the ownership of goods are transferred to the buyer,
when the amount is very likely to be recovered, when the transaction-related cost and

TOPCO TECHNOLOGIES CORP. AND SUBSIDIARIES
Notes to the Consolidated Financial Statements
134
return of goods that has occurred or is about to occur can be reliably measured, when
our company neither continues to participate in the management nor maintains effective
control on the goods sold, and when the revenue can be reliably measured. If the
discount is very likely to occur and the amount can be reliably measured, it is treated as
a contra item of revenue and recognized when the sale is recognized.
The timing of transferring the risk and reward depends on individual conditions of the
sales contract.
2) Commissions income
When the Group serves as the agent but not the principal, revenue is recognized at the
net commission received.
3) Financing component
The Group does not expect to have almost constracts where the period btween the
transfer of the promised goods or services to the customer and payment by the customer
exceeds one year. As a consequence, the Group does not adjust any of the transaction
prices for the time value of money.
(ii) Revenue (applicable before Jan. 1, 2018)
1) Goods sold
Revenue from the sale of goods in the course of ordinary activities is measured at the
fair value of the consideration received or receivable, net of returns, trade discounts and
volume rebates. Revenue is recognized when persuasive evidence exists, usually in the
form of an executed sales agreement, that the significant risks and rewards of ownership
have been transferred to the customer, recovery of the consideration is probable, the
associated costs and possible return of goods can be estimated reliably, there is no
continuing management involvement with the goods, and the amount of revenue can be
measured reliably. If it is probable that discounts will be granted and the amount can be
measured reliably, then the discount is recognized as a reduction of revenue as the sales
are recognized.
The timing of the transfer of risks and rewards varies depending on the individual terms
of the sales agreement.
2) Commission income
When the Group acts as an agent rather than the client in a transaction, the income is
recognized on the basis of the commission received.
(o) Employee Benefits
(i) Defined contribution plans

TOPCO TECHNOLOGIES CORP. AND SUBSIDIARIES
Notes to the Consolidated Financial Statements
135
Obligations for contributions to defined contribution pension plans are recognized as an
employee benefit expense in profit or loss in the periods during which services are
rendered by employees.
(ii) Defined benefit plans
A defined benefit plan is a post-employment benefit plan other than a defined
contribution plan. The Group’s net obligation in respect of defined benefit pension plans
is calculated separately for each plan by estimating the amount of future benefit that
employees have earned in return for their service in the current and prior periods; that
benefits is discounted to determine its present value. Any unrecognized past service
costs and the fair value of any plan assets are deducted. The discount rate is the yield at
the reporting date (market yields of high-quality corporate bonds or government bonds)
on bonds that have maturity dates approximating the terms of the Group’s obligations
and that are denominated in the same currency in which the benefits are expected to be
paid.
The calculation is performed annually by a qualified actuary using the projected unit
credit method. When the calculation results in a benefit to the Group, the recognized
asset is limited to the total of any unrecognized past service costs and the present value
of economic benefits available in the form of any future refunds from the plan or
reductions in future contributions to the plan. In order to calculate the present value of
economic benefits, consideration is given to any minimum funding requirements that
apply to any plan in the Group. An economic benefit is available to the Group if it is
realizable during the life of the plan, or on settlement of the plan liabilities.
When the benefits of a plan are improved, the portion of the increased benefit relating to
past service by employees is recognized in profit or loss.
Remeasurements of the net defined benefit liability (asset), which comprise (1) actuarial
gains and losses, (2) the return on plan assets (excluding interest) and (3) the effect of the
asset ceiling (if any, excluding interest), are recognized immediately in other
comprehensive income. The Group reclassifies the amounts recognized in other
comprehensive income to retained earnings.
The Group recognizes gains or losses on the curtailment or settlement of a defined
benefit plan when the curtailment or settlement occurs. The gain or loss on curtailment
comprises any resulting change in the fair value of plan assets and any change in the
present value of the defined benefit obligation.

TOPCO TECHNOLOGIES CORP. AND SUBSIDIARIES
Notes to the Consolidated Financial Statements
136
(iii) Short-term employee benefits
Short-term employee benefit obligations are measured on an undiscounted basis and are
expensed as the related service is provided.
A liability is recognized for the amount expected to be paid under short-term cash bonus
or profit-sharing plans if the Group has a present legal or constructive obligation to pay
this amount as a result of past service provided by the employee, and the obligation can
be estimated reliably.
(p) Share-based payment
The grant-date fair value of share-based payment awards granted to employee is recognized as
employee expenses, with a corresponding increase in equity, over the period that the emplyees
become unconditionally entitled to the awards. The amount recognized as an expense is
adjusted to reflect the number of awards which the related service and non-market performance
conditions are expected to meet, such that the amount ultimately recognized as an expense is
based on the number of award that meet the related service amd non-market performance
conditions at the vesting date.
For share-based payment awards with non-vesting conditions, the grant-date fair value of the
share-based payment is measured to reflect such contions and there is no true-up for differences
between expected and actual outcomes.
The stock appreciation rights to be paid to employees are measured by the fair value of the
stock appreciation rights and then paid by cash. During the period when the employees are
qualified for the unconditional remuneration, relative liabilities are added to the recognized the
expenses. The relevant liabilities should be re-measured on each reporting date and closing date.
Any changes in fair values are recognized as staff costs under profit and loss.
(q) Income Taxes
Income tax expenses include both current taxes and deferred taxes. Except for expenses
related to business combinations or recognized directly in equity or other comprehensive
income, all current and deferred taxes shall be recognized in profit or loss.
Current taxes include tax payables and tax deduction receivables on taxable gains (losses) for
the year calculated using the statutory tax rate on the reporting date or the actual legislative
tax rate, as well as tax adjustments related to prior years.
Deferred taxes arise due to temporary differences between the carrying amounts of assets and
liabilities for financial reporting purposes and their respective tax bases. Deferred taxes are
recognized except for the following:

TOPCO TECHNOLOGIES CORP. AND SUBSIDIARIES
Notes to the Consolidated Financial Statements
137
(i) Assets and liabilities that are initially recognized but are not related to the business
combination and have no effect on net income or taxable gains (losses) during the
transaction.
(ii) Temporary differences arising from equity investments in subsidiaries or joint ventures
where there is a high probability that such temporary differences will not reverse.
(iii ) Initial recognition of goodwill.
Deferred tax assets and liabilities shall be measured at the tax rates that are expected to apply
to the period when the asset is realized or the liability is settled, based on tax rates that have
been enacted or substantively enacted by the end of the reporting period.
Deferred tax assets and liabilities may be offset against each other if the following criteria
are met:
(i) The entity has the legal right to settle tax assets and liabilities on a net basis; and
(ii) The taxing of deferred tax assets and liabilities fulfill one of the below scenarios:
(1) levied by the same taxing authority; or
(2) levied by different taxing authorities, but where each such authority intends to settle tax
assets and liabilities (where such amounts are significant) on a net basis every year of
the period of expected asset realization or debt liquidation, or where the timing of asset
realization and debt liquidation is matched.
A deferred tax asset is recognized for the carry-forward of unused tax losses, unused tax
credits, and deductible temporary differences to the extent that it is probable that future
taxable profit will be available against which the unused tax losses, unused tax credits, and
deductible temporary differences can be utilized. Such unused tax losses, unused tax credits,
and deductible temporary differences shall also be re-evaluated every year on the financial
reporting date, and adjusted based on the probability that future taxable profit will be
available against which the unused tax losses, unused tax credits, and deductible temporary
differences can be utilized.
The undistributed surplus profit-making income tax portion and is recognized as the income
tax expense for the current period after the shareholders' meeting of the next year passes the
surplus distribution.
(r) Earnings per Share
The Group discloses the Company’s basic and diluted earnings per share attributable to
ordinary equity holders of the Company. The calculation of basic earnings per share is based

TOPCO TECHNOLOGIES CORP. AND SUBSIDIARIES
Notes to the Consolidated Financial Statements
138
on the profit attributable to the ordinary shareholders of the Company divided by the
weighted-average number of ordinary shares outstanding. The calculation of diluted earnings
per share is based on the profit attributable to ordinary shareholders of the Company, divided
by the weighted-average number of ordinary shares outstanding after adjustment for the
effects of all dilutive potential ordinary shares, such as unvested restriction stock and accrued
employee compensation.
(s) Operating Segments
An operating segment is a component of the Group that engages in business activities from
which it may incur revenues and incur expenses (including revenues and expenses relating to
transactions with other components of the Group). Operating results of the operating
segment are regularly reviewed by the Group’s chief operating decision maker to make
decisions about resources to be allocated to the segment and assess its performance. Each
operating segment consists of standalone financial information.
(5) Significant accounting assumptions and judgments, and major sources of estimates
uncertainty
The preparation of the consolidated financial statements in conformity with the IFRSs
endorsed by the FSC requires management to make judgments, estimates, and assumptions
that affect the application of the accounting policies and the reported amount of assets,
liabilities, income, and expenses. Actual results may differ from these estimates.
The management continues to monitor the accounting estimates and assumptions. The
management recognizes any changes in accounting estimates during the period and the
impact of those changes in accounting estimates in the next period.
Information about estimation uncertainties that have a significant risk of resulting in a
material adjustment within the next financial year is as follows:
(a) Valuation of inventories:
As inventories are stated at the lower of cost or net realizable value and evaluation is based
on an estimated future sales price, and therefore is subject to change due to changes in the
industry and in the market. Please refer to Note 6(h) for further details on stock evaluation.
(b) Receivables evaluation:
The valuation of receivables is based on lifetime expected credit loss of objective evidence
showing the recoverability of accounts receivables, so that the provision for losses can be
made accordingly. They may be subject to change due to customer operating conditions,
external industrial environment and economic conditions. Please refer to Note 6(f) for further
details on receivables evaluation.

TOPCO TECHNOLOGIES CORP. AND SUBSIDIARIES
Notes to the Consolidated Financial Statements
139
(6) Explanations on significant accounts
(a) Cash and cash equivalent December 31,
2018 December 31,
2017 Petty cash and cash on hand $ 3,126 19,540
Demand and check deposits 1,081,071 1,264,532
Term deposits 217,506 95,050
$ 1,301,703 1,379,122
Please refer to Note 6(t) for the disclosure on the foreign exchange rate risk and sensitivity
analysis of the financial assets.
(b) Financial assets and liabilities at fair value through profit or loss
1. Details of financial assets and liabilities are as follows:
December 31,
2018 December 31,
2017 Financial assets at fair value through profit or loss,
mandatorily measured at fair value:
Derivatives instrunments not used for hedging
Foreign currency forward contracts $ 18
Financial asset held for trading:
Derivatives instrunments not used for hedging
Foreign currency forward contracts - 79
Non-derivative financial assets
Certificate of Deposit - 29,760
Open-end funds - 30,327
$ 18 60,166
Financial lisbilities at fair value through profit or loss,
mandatorily measured at fair value:
Derivatives instrunments not used for hedging
Foreign currency forward contracts $ 177 -

TOPCO TECHNOLOGIES CORP. AND SUBSIDIARIES
Notes to the Consolidated Financial Statements
140
The Group uses derivatives financial instruments to hedge the certain foreign exchange rate
risk and interest rate risk the Group is exposed to, arising from its operating, financing and
investing activities. The details of the derivatives financial instruments that are not
recognized and reported as held-for-trading financial assets and liabilities since the Group is
not applicable to hedge accounting are as follows (i.e., the financial assets and liabilities at
fair value through profit or loss, mandatorily measured at fair value on December 31, 2018,
and the financial assets and liabilities held for trading on December 31, 2017)
Foreign currency forward contracts:
Foreign currency unit: in thousands December 31, 2018 December 31, 2017
Contract
amount
Currency Expiry
duration Contract
amount
Currency Expiry
duration
Derivative financial
assets:
Forward foreign
exchange sold USD300 NTD/USD 2019.1.1~
2019.1.18 USD300 NTD/USD 2018.1.1~
2018.1.12
Derivative financial
liabilities:
Forward foreign
exchange bought USD1,296 NTD/USD 2019.1.28~
2019.4.29
On December 31, 2018 and December 31, 2017, the Group’s financial assets at fair value
through profit or loss were not pledged as collateral.
(c) Financial assets at fair value through other comprehensive income
December 31,
2018 Equity investments at fair value through other
comprehensive income
Domestic non-listed companies $ 190,741
The Group designated the investments shown above as equity securities as at fair value
through other comprehensive income because these equity securities represent those
investments that the Group intends to hold for long-term strategic purpose. These
investments were classified as available-for-sale financial assets and financial assets carried
at cost on December. 31, 2017.
No strategic investments were disposesd as of December 31, 2018, and there were no
transfers of any cumulative gain or loss within equity relating to these investments.
For market risk, please refer to Note 6(t).
As of December 31, 2018, the financial assets at fair value through other comprehensive
income were not pledged.

TOPCO TECHNOLOGIES CORP. AND SUBSIDIARIES
Notes to the Consolidated Financial Statements
141
(d) Available-for-sale financial assets December
31, 2017
Domestic non-listed companies $ 174,185
The shares of Lustrous Technology Ltd. held by the Group are recognized as
available-for-sale financial assets. Since the company had debt difficulties and could not
file for bankruptcy to the court, the Group recognized impairment loss of $ 23,400 on the
shares held after evaluation in 2017.
The investments shown above as non-current financial assets at fair value through other
comprehensive income , please refer to Note 6(c).
For market risk, please refer to Note 6(t).
As of December 31, 2017, the available-for-sale financial assets were not pledged.
(e) Financial assets at amortised cost December 31,
2018
Certificate of Deposit $ 35,205
Since the Group evaluates that it will hold the asset until the maturity date to obtain
contract cash flows, and that the cash flows of the financial asset are completely for
paying the interests of the principal and outstanding principal, it is recognized and
reported in financial assets evaluated at amortized cost.
(i) The certificate of deposits held by the Group has face value of US$ 1,000 thousands
and RMB 1,000 thousands, respectively. The coupon rate is 2.33 % and 4.00 %
respectively. The maturity date is April 18, 2019 and April 17, 2019, respectively. On
December 31, 2017, 2017, the debt instrument investment was classified as financial
assets held for trading.
(ii) For credit risk, please refer to Note 6(t)
As of December 31, 2018, the financial assets at amortised cost were not pledged.

TOPCO TECHNOLOGIES CORP. AND SUBSIDIARIES
Notes to the Consolidated Financial Statements
142
(f) Notes and accounts receivable December 31,
2018
December
31, 2017
Note receivables - raised because of regular business $ 281,160 258,028
Account receivables - measured at amortized cost 1,783,857 1,621,484
Notes and accounts receivable - related parties -
measured at amortized cost 34,816 96,351
Account receivables - measured at FVTPL 7,121 -
2,106,954 1,975,863
Less: Loss allowance (27,754) (17,468)
$ 2,079,200 1,958,395
Notes and accounts receivable, net $ 2,044,384 1,862,044
Notes and accounts receivable - related parties, net $ 34,816 96,351
The Group evaluated that the operation mode that sell financial assets to reach its goals held
part of the account receivables, and since January 1, 2018, the account receivables have been
measured at fair value through profit or loss.
The Group adopts a simplified approach to estimate expected credit loss regarding all notes
and accounts receivable on December 31, 2018. Namely, the lifetime expected credit loss for
measurement is used. For measurement purposes, notes and accounts receivable are grouped
by mutual credit risk characteristics, including each customer’s ability to repay according to
the contract provisions, as well as forward-looking information such as macroeconomic and
industry prospects. The loss allowance provision as of December 31, 2018 was determined
as follows: Book value of
notes and
accounts
receivable
Weighted-
average
expected loss
rate
Allowance for
lifetime
expected
credit loss Current $ 1,924,136 0.02% 296
Within 30 days past due 95,881 4.94% 4,732
31 to 180 days past due 75,802 15.41% 11,683
More than 181 days past due 11,135 99.17% 11,043
$ 2,106,954 27,754
As of December 31,2017, the Group applies the inccured loss model to consider the loss
allowance provision of notes and account receivable, and the aging analysis of notes and
account receivable which were past due but not impaired, were as follows:

TOPCO TECHNOLOGIES CORP. AND SUBSIDIARIES
Notes to the Consolidated Financial Statements
143
December
31,2017
Past due 0~30 days $ 54,434
Past due 31~180 days 21,944
Past due over 181 days 1,516
$ 77,894
The movement in the allowance for nots and account receivable were as follows:
For the years ended December
31,2017
For the years
ended
December
31,2018
Individually
assessed
impairment
Collectivly
assessed
impairment Balance on January 1,per IAS39 $ 17,468 - 16,740
Adjustment on initial application of IFRS9
-
Balance on January 1,per IFRS 9 17,468
Impairment loss recognized 11,331 - 1,826
Written off unrecoverable amount
(900) - (842)
Effect of changes in foreign exchange rates
(145) - (256)
Balance on December 31 $ 27,754 - 17,468
On December 31, 208 and 2017, the notes and accounts receivable were not pledged.
The Group signed a contract with the bank in selling the claim for accounts receivable.
According to the requirement of the contract, the Group does not need to guarantee the
account receivable debtor’s ability to pay when the claim is transferred and fulfilled within
the selling quota. When the accounts receivable are sold, the Group obtains the amount
according to the contract, and is obligated to pay interests with the agreed interest rate until
the customer pays. The remaining amount will be recovered after the customer actually pays.
In addition, the Group has to afford the fees of a certain percentage. On December 31, 2018
and 2017, the amount of the sold clam that has not been recovered was $ 38,109 and $
24,507, respectively. They are accounted under the account of other current financial assets.
As of December 31, 2018 and 2017, the factored accounts receivable that conformed to
the derecognition criteria were as follows:

TOPCO TECHNOLOGIES CORP. AND SUBSIDIARIES
Notes to the Consolidated Financial Statements
144
December 31,2018
Buyer
Amount of
derecognition
Advance
amount Colleteral
Important
derecognition
clause
Factoring
credit limit
Non-related party $ 38,109 - N/A N/A 120,000
December 31,2017
Buyer
Amount of
derecognition
Advance
amount Colleteral
Important
derecognitio
n clause
Factoring
credit limit
Non-related party $ 24,507 - N/A N/A 120,000
For the credit risk, please refer to Note 6(t).
(g) Other receivables December 31,
2018
December 31,
2017
Other receivables
(reported other current financial assets) $ 38,951 24,961
Less: Loss allowance - -
$ 38,951 24,961
For the credit risk, please refer to Note 6(t)
(h) Inventory
December 31,
2018
December 31,
2017
Products $ 945,837 712,780
Products incurred loss of the Group in 2018 and 2017are as follows:
For the years ended December 31 2018 2017
Losses on inventory valuation $ (893) (1,664)
Losses on inventory obsolescence 1,513 2,473
Inventory profit or loss 186 77
$ 806 886
Due to the sale of the slow-moving inventory during the years ended December 31, 2018 and
2017 , the net present value of inventory bounced back and reversal of inventory valuation
and obsolescence loss was $ 893 and $1,664, respectively.
As of December 31, 2018 and 2017, the inventory was not pledged.

TOPCO TECHNOLOGIES CORP. AND SUBSIDIARIES
Notes to the Consolidated Financial Statements
145
(i) Property, plant, and equipment
The cost, depreciation, and impairment loss of the property, plant and equipment of the
Group as of and for the years ended December 31, 2018 and 2017, were as follows:
Land
Buildings
and
structures
Machinery
and
equipment
Office
equipment
and others
Total
Book value:
Blance at January 1, 2018 $ 139,624 103,169 673 26,715 270,181
Additions - - 419 6,384 6,803
Disposal - - - (931) (931)
Effect of movements in
exchange rate - - - (241) (241)
Blance at December 31, 2018 $ 139,624 103,169 1,092 31,927 275,812
Blance at January 1, 2017 $ 139,624 103,169 673 27,973 271,439
Additions - - - 946 946
Disposal - - - (2,021) (2,021)
Effect of movements in
exchange rate - - - (183) (183)
Blance at December 31, 2017 $ 139,624 103,169 673 26,715 270,181
Depreciation and impairment
losses:
Blance at January 1, 2018 $ 4,020 20,780 423 21,079 46,302
Depreciation for the period - 3,100 137 1,780 5,017
Disposal - - - (857) (857)
Effect of movements in
exchange rate - - - (204) (204)
Blance at December 31, 2018 $ 4,020 23,880 560 21,798 50,258
Blance at January 1, 2017 $ 4,020 17,679 311 20,278 42,288
Depreciation for the period - 3,101 112 2,442 5,655
Disposal - - - (1,491) (1,491)
Effect of movements in
exchange rate - - - (150) (150)
Blance at December 31, 2017 $ 4,020 20,780 423 21,079 46,302
Book values:
Blance at December 31, 2018 $ 135,604 79,289 532 10,129 225,554
Blance at December 31, 2017 $ 135,604 82,389 250 5,636 223,879
Please refer to the Note 8 for the detail of the property, plant, and equipment pledged as
collateral

TOPCO TECHNOLOGIES CORP. AND SUBSIDIARIES
Notes to the Consolidated Financial Statements
146
(j) Short-term loans
December 31,
2018
December
31, 2017
L/C loan $ 155,183 109,385
Unused credit line $ 1,049,255 1,112,830
Interest rate 0.53%~3.86% 0.53%~2.65%
(i) The association guarantor for part of the loans is the major management personnel of the
Company and its subsidiaries.
(ii) For the collectral for bank loans, please refer to Note 8.
(k) Long-term loans
December 31,
2018
December
31, 2017
Secured bank loans $ 60,000 70,000
Less: current portion (3,045) -
$ 56,955 70,000
Unused credit line $ 17,390 17,390
Interest rate 1.8% 1.8%
For the collectral for bank loans, please refer to Note 8.
(l) Operating leases
Lessee
Rental payables of non-cancellable opetaing lease were as follows: December 31,
2018
December
31, 2017
Within one year $ 47,033 53,413
Between one and five years 29,354 30,666
Over five years 35 -
$ 76,422 84,079
The Group leases several offices, garages, and company vehicles, etc. under operating
leases. The lease term is usually 1~5 years and is attached with the right of continued
renting once the term is reached.
For the years ended December 31,2018 and 2017, expenses recognized in profit or
loss in respect of operating leases were $ 73,031 and $ 66,345, respectively.
(m) Employee benefit
(i) Defined benefit plan

TOPCO TECHNOLOGIES CORP. AND SUBSIDIARIES
Notes to the Consolidated Financial Statements
147
The Group determined the movement in the present value of the defined benefit
obligations and fair value of plan assets as follows: December 31,
2018
December 31,
2017
Present value of benefit obligations $ 46,829 44,528
Fair value of plan assets (48,948) (47,044)
Recognized liabilities (assets) for defined benefit obligations
$ (2,119) (2,516)
The Group makes defined benefit plan contributions to the pension fund account at Bank
of Taiwan that provides pensions for employees upon retirement. The plans (covered by
the Labor Standards Law) entitle a retired employee to receive an annual payment based
on years of service and average salary for the six months prior to retirement.
1) Composition of plan assets
The Company allocates pension funds in accordance with the Regulations for
Revenues, Expenditures, Safeguard and Utilization of the Labor Retirement Fund, and
such funds are managed by the Bureau of Labor Funds, Ministry of Labor. With regard
to the utilization of the funds, minimum earnings shall be no less than the earnings
attainable from two-year time deposits with interest rates offered by local banks.
The Company’s Bank of Taiwan labor pension reserve account balance amounted to
$48,948 as of December 31, 2018. For information on the utilization of the labor
pension fund assets, including the asset allocation and yield of the fund, please refer to
the website of the Bureau of Labor Funds, Ministry of Labor.
2) Movements in present value of the defined benefit obligations
The movements in present value of defined benefit obligations for the Company were
as follows: For the Years Ended
December 31, 2018 2017
Defined benefit obligation at January 1 $ 44,528 43,062
Current service costs and interest 1,341 1,201
Remeasurement on the net defined benefit assets
─Actuarial losses arising from changes in
financial assumptions 960 265
Defined benefit obligation at December 31 $ 46,829 44,528

TOPCO TECHNOLOGIES CORP. AND SUBSIDIARIES
Notes to the Consolidated Financial Statements
148
3) Movements of defined benefit plan assets
The movements in the present value of the defined benefit plan assets for the Company
were as follows: For the Years Ended
December 31, 2018 2017
Fair value of plan assets at January 1 $ 47,044 46,584
Interest income 762 639
Remeasurement of net defined obligation assets
-return on plan assets (excluding interest
income)
1,142
(183)
Contributions from employer - 4
Fair value of plan assets at December 31 $ 48,948 47,044
4) Expenses recognized in profit or loss
The expenses recognized in profit or losses for the Company were as follows: For the Years Ended
December 31, 2018 2017
Current service costs $ 620 611
Net interest of net assets for defined benefit
obligations (41) (49)
$ 579 562
Selling expenses 195 187
General and administrative expenses 384 375
$ 579 562
5) Remeasurement on the net defined benefit assets recognized in other comprehensive
income
The Company’s remeasurement on the net defined benefit assets recognized in other
comprehensive income for the years were as follows: For the Years Ended
December 31, 2018 2017
Cumulative amount at January 1 $ (5,963) (5,515)
Recognized during the period 182 (448)
Cumulative amount at December 31 $ (5,781) (5,963)

TOPCO TECHNOLOGIES CORP. AND SUBSIDIARIES
Notes to the Consolidated Financial Statements
149
6) Actuarial assumptions
The following are the principal actuarial assumptions as of December 31, 2018 and
2017: For the Years Ended
December 31, 2018 2017
Discount rate 1.375% 1.625%
Future salary increases rate 3.000% 3.000%
The Compamy expects to make contributions of $0 to defined benefit plans in 2018.
The weighted average duration of the defined benefit plans is 15.77 years.
7) Sensitivity analysis
As of December 31, 2018 and 2017, the effects of the present value of the defined
benefit obligation arising from changes in principal actuarial assumptions were as
follows:
Influences of defined benefit
obligations Increased0.25% Decreased0.25%
December 31, 2018
Discount rate $ (1,420) 1,481
Future salary increasing rate 1,428 (1,380)
December 31, 2016
Discount rate (1,483) 1,495
Future salary increasing rate 1,445 (1,399)
The sensitivity analysis presented above may not be representative of the actual change
in the present value of the defined benefit obligation as it is unlikely that the change in
assumptions would occur in isolation of one another as some of the assumptions may be
correlated. The sensitivity analysis adopts the same methods for determining the pension
liabilities (assets) at balance sheet date.
The methods and assumptions used on current sensitivity analysis is the same as those
of the prior year.

TOPCO TECHNOLOGIES CORP. AND SUBSIDIARIES
Notes to the Consolidated Financial Statements
150
(ii) Defined contribution plans
The Company and the subsidiaries in Taiwan contribute an amount equal to 6% of the
employee’s monthly wages to the Labor Pension personal account with the Bureau of
the Labor Insurance in accordance with the provisions of the Labor Pension Act, under
which, the Company is not required to bear the regulated or putative obligation
subsequent to the payment of fixed-rate contribution.
The pension costs of the Group's Taiwan subsidiaries under the defined contribution
method were $6,248 and $5,884 for the years ended December 31, 2018 and 2017,
respectively. Payment was made to the Bureau of the Labor Insurance.
The pension costs of the Group's foreign subsidiaries under the local laws were $4,666 and
$4,094 for the years ended December 31, 2018 and 2017, respectively.
(n) Income taxes
Under the amendments to the Income Tax Act which was promulgated by the president of the
Republic of China on February 7,2018 , the Company and Topglow’s applicable income tax
rate were raised from 17% to 20% effective from January 1, 2018.
(i) Income tax expense
1) The details of income tax expense for the years ended December 31, 2018 and 2017,
were as follows:
For the Years Ended
December 31, 2018 2017
Current tax expense
Current period $ 150,635 112,297
10% surtax on undistributed earnings 7,292 375
157,927 112,672
Deferred tax expense
Effect of tax rate changes 12,037 -
Origination and reversal of temporary differences 1,743 (6,886)
Income tax expense $ 171,707 105,786

TOPCO TECHNOLOGIES CORP. AND SUBSIDIARIES
Notes to the Consolidated Financial Statements
151
2) Reconciliations between income tax and profit before tax for the years ended December
31, 2018 and 2017, were as follows: For the Years Ended
December 31, 2018 2017
Income tax calculated on pretax financial
income at the statutory rate
$ 199,600 135,493
Unrecognized Deferred Tax Liabilities (49,662) (31,103)
Tax-exempt income and investment income
recognized under equity method
(6,996)
(6,575)
Income tax not including impairment loss of
financial assets
- 3,978
10% surtax on undistributed earnings 7,292 375
Effect of tax rate changes 12,037 -
Others 9,436 3,618
$ 171,707 105,786
(ii) Deferred tax liabilities
1) Unrecognized Deferred Tax Liabilities
The Group did not recognize any temporary differences related to investment in
subsidiaries since the Group has the ability to control the time point when temporary
differences are reversed, and it is certain that the differences will not be reversed in the
foreseeable future. Related information for the years ended December 31, 2018 and
2017, were as follows: December 31,
2018
December 31,
2017
Temporary differences related to investment in subsidiaries
$ 286,902 201,655
2) Unrecognized Deferred Tax Assets:None
3) Recognized deferred tax assets and liabilities
Changes in the amount of deferred tax assets and liabilities for the years ended
December 31, 2018 and 2017, were as follows:

TOPCO TECHNOLOGIES CORP. AND SUBSIDIARIES
Notes to the Consolidated Financial Statements
152
Recognized
gain on
foreign
investment
for equity
method
Defined
benefit plan
Others
Total
Deferred tax liabilities
Balance as of January 1, 2018 $ 70,364 2,021 160 72,545
Recognized in profit or loss 15,073 241 49 15,363
Balance as of December 31, 2018 $ 85,437 2,262 209 87,908
Balance as of January 1, 2017 $ 76,251 2,117 1,425 79,793
Recognized in profit or loss (5,887) (96) (1,265) (7,248)
Balance as of December 31, 2017 $ 70,364 2,021 160 72,545
Unrealized losses on
inventory valuation
and obsolescence
Others
Total Deferred tax assets:
Balance as of January 1, 2018 $ 667 3,761 4,428
Recognized in profit or loss 118 1,466 1,584
Balance as of December 31, 2018 $ 785 5,227 6,012
Balance as of January 1, 2017 $ 1,483 3,307 4,790
Recognized in profit or loss (816) 454 (362)
Balance as of December 31, 2017 $ 667 3,761 4,428
(iii) The tax returns assessment and approval
The tax returns of the Company and Topglow have been assessed and approved
through 2015 and 2016 by the Tax Authority.
(o) Capital and other equity
As of December 31, 2018 and 2017, the total value of authorized ordinary shares amounted
to $800,000 thousand, with par value of $10 (NT dollars) per share, of which 80,000
thousand shares, 64,061 thousand shares and 64,101 thousand shares were issued,
respectively. All issued shares were paid up upon issuance.
(i) Common stock issuance
In 2018 and 2017, when some of the employees assigned new employee rights restrictions
of the Company failed to meet the vested conditions, their shares were bought back by the
Company at the issue price of 40,000 shares and 5,000 shares respectively, the changes
has already been registered.

TOPCO TECHNOLOGIES CORP. AND SUBSIDIARIES
Notes to the Consolidated Financial Statements
153
The board of directors approved the cash capital increase at 100 millions and issued 10,000
thousand shares on September17, 2018 with par value $10 (NT dollars) per share.
It had been appvoved by the Financial Supervisory Commission (FSC) No. 1070340878.
The cash capital increase was issuance at $60 dollars per share and the record date is
January 16,2019. The registration had been completed on February 12, 2019.
A recomciliation of the Company’s outstanding shares of the year 2018 and 2017 were as
follows:
Common shares (thousand of shares) For the Years Ended
December 31, 2018 2017
Balance as of January 1, 2018 64,101 64,106
Retirement of employees restricted shares (40) (5)
Balance as of December 31, 2018 64,061 64,101
(ii) Capital surplus
The details of capital surplus were as follows:
December
31,2018
December
31,2017
Paid-in capital in excess of par value $ 492,060 530,521
Premium from merger 329,343 329,343
Share-based payment transaction- issuing shares 8,600 -
Share-based payment transaction-restricted employee shares of stock 124,072 126,480
$ 954,075 986,344
The shareholder’s meeting approved the distribution of cash dividend from capital reserve
of $38,461 ($0.6 dollars per share) on June 20, 2018. In accordance with the amended R.O.C. Company Act, realized capital reserves can only
be reclassified as share capital or distributed as cash dividends after offsetting losses. The
aforementioned capital reserves include share premiums and donation gains. In accordance
with Securities Offering and Issuance Guidelines, the amount of capital reserves to be
reclassified under share capital shall not exceed 10% of the actual share capital amount.
(iii) Legal reserve
According to the Company Act, the Company must retain 10% of its after-tax annual
earnings as legal reserve until such retention equals the amount of total capital. When a
company incurs no loss, it may, pursuant to a resolution by a shareholder's meeting,
distribute its legal reserve by issuing new shares or by distributing cash and only the
portion of legal reserve which exceeds 25% of capital may be distributed.

TOPCO TECHNOLOGIES CORP. AND SUBSIDIARIES
Notes to the Consolidated Financial Statements
154
(iv) Special reserve
When the Group first adopted the International Financial Reporting Standards as approved
by the Financial Supervisory Commission, due to the application of exemption items as
stated in No.1 of the International Financial Reporting Standards, “Initial adaptation of the
International Financial Reporting Standards”, the cumulative conversion adjustment under
the original account’s shareholder equity is presumed to be zero, and increased retained
earnings to $ 17,368. However, the adopted retained earnings increased by $ 8,680 on the
conversion date as it was the first adaptation of IFRSs. In accordance with Ruling No.
1010012865 issued by the Financial Supervisory Commission on April 6, 2012, retained
earnings are increased to $ 8,680. After the deduction of penalized relevant assets in 2012,
which is $ 2,317 by proportion, the special reserve for its net value is $ 6,363, as recognized
on January 1, 2013. The balance of special reserve for which on December 31, 2018 and
2017 is $ 6,363.
In accordance with the above-mentioned stipulations, a portion of current-period earnings
and undistributed prior-period earnings shall be reclassified as a special earnings reserve
during earnings distribution. The amount to be reclassified should equal to the current-period
total net reduction of other shareholders’ equity. Similarly, a portion of undistributed prior
period earnings shall be reclassified as a special earnings reserve (and does not qualify for
earnings distribution) to account for cumulative changes to other shareholders’ equity
pertaining to prior periods. Amounts of subsequent reversals pertaining to the net reduction
of other shareholders’ equity shall qualify for additional distributions.
(v) The restriction of earnings distribution and dividend policy
The Company’s Articles of Incorporation provide that, when allocating the net profit for
each fiacal year, the Company shall first offset its losses in previous years and then set aside
the leagel reserve at 10% of net profit until the accumulated leagal reserve equals the
Company’s capital; and also set aside special capital reserve in accordance with relevant
regulations or as requested by the authorities.Any balance left over and the beginning
balance of retaining earnings ,the Company’s appropriations of earnings are approved in the
meeting of the Board of Directors and presented for approval in the Company’s shareholders’
meeting.
The Company’s dividend policy considers the Company’s future funding needs, and is
decided based on the Company’s earnings, financial structure and the finding needs for
future operating plans. 10%~90% of the cumulative distributable earnings are also
appropriated and distributed after the Board proposes a resolution for the distribution of
earnings which will be approved at shareholders’ meeting. Besides, for the distribution ratio
of stock or cash dividends, stock dividends shall not exceed 50%. The annual shareholders’

TOPCO TECHNOLOGIES CORP. AND SUBSIDIARIES
Notes to the Consolidated Financial Statements
155
meeting can still decide the most suitable way of dividend distribution depending on the
industry condition, with the Company’s benefits and development served as the highest
principle.
(vi) The appropriation of 2017 and 2016 earnings that were approved at shareholder’s meetings
on June 20, 2018 and June 21, 2017, respectively were as follows: 2017 2016 Distribution
rate (Dollar)
Amount
Distribution
rate (Dollar)
Amount
Cash diviends $4 256,404 4 256,404
The appropriation of 2018 earnings that was drafted at Board of Directors on March 4, 2019.
Unappropriated retained earning is allocated as cash dividends , details of the dividends
allocated to owners are as follows: 2017 Distribution rate (Dollar) Amount
Cash diviends $5.1 377,711
The 2018 surplus allocation is still awaiting resolution of the shareholders’ meeting, details
of which can be found on Market Observation Post System website after shareholders’
meeting.
(vii) Other equities (net of tax)
Exchange
differences on
translation of
foreign
financial
statements
Unrealized
gain or loss
from financial
assets at fair
value through
other
comprehensive
income and
loss
Unrealized
gains (losses)
on available
for sale
financial
assets
Unearned
compensation
of reatricted
employee
shares of stock Total
Balance, January 1, 2018 $ (84,809) - 81,031 (16,425) (20,203)
Effects of retrospective application - 57,631 (81,031) - (23,400)
Balance at January 1, 2018 after adjustments (84,809) 57,631 - (16,425) (43,603)
Foreign currency translation differences (19,349) - - - (19,349)
Unrealized gain or loss from financial assets at
fair value through other comprehensive
income and loss - 16,556 - - 16,556
Retirement of employees restricted shares - - - 1,888 1,888
Compensation cost of issuing restricted
employee shares - - - 14,537 14,537
Balance,December 31, 2018 $ (104,158) 74,187 - - (29,971)

TOPCO TECHNOLOGIES CORP. AND SUBSIDIARIES
Notes to the Consolidated Financial Statements
156
Exchange
differences on
translation of
foreign
financial
statements
Unrealized
gain or loss
from financial
assets at fair
value through
other
comprehensive
income and
loss
Unrealized
gains (losses)
on available
for sale
financial
assets
Unearned
compensation
of reatricted
employee
shares of stock Total
Balance, January 1, 2017 $ (24,288) - 7,464 (38,633) (55,457)
Foreign currency translation differences (60,521) - - - (60,521)
Unrealized gain or loss from
available-for-sale financial assets - - 50,167 - 50,167
Reclassification adjustment of the
impairment of available-for-sale
financial assets - - 23,400 - 23,400
Retirement of employees restricted shares - - - 236 236
Compensation cost of issuing restricted
employee shares - - - 21,972 21,972
Balance, ,December 31, 2017 $ (84,809) - 81,031 (16,425) (20,203)
(p) Share-based payment transaction-new restricted employee shares
(i) New restricted employee shares
During the meeting on June 20,2014 , the Company’s shareholders approved a resolution to
issue 2,400,000 shares of stock to those full-time employees who comformed to the
company’s certain requirements. These restricted employee shres of stock have been
registered and approved by the ROC Securities and Futures Bureau of Financial Supervisory
Commission.On August 11,2014, the board of directors approved a resolution to issue
2,400,000 restricted employee shres and set September 30, 2014 as the record date for capital
increase of issued new shares.
These emplyees are entitled to purchase the restricted shres of stock at the price of $23, with
the condition at these employees will continue to provide service to the Company for the 4
years (from the grant date) and qulify with the Company’s certain requirement.The restricted
shres of stock for emplyees are kept by tust, which is appointed by the Company before they
are vested. These shres shall not be sold, pledged, transferred, gifted or by any other means
of disposal to third parties during the custody period. If there are any employees who fail to
meet the vested conditions, their shares will be bought back by the Company at the full price
of issuance. However, restricted employee shares of stock may still participate in share
allotments, interest distribution, and cash capital increase and subscriptions. New shares that
are obtained as a result of allotment or capital increase subscriptions are not restricted to
employee rights shares.

TOPCO TECHNOLOGIES CORP. AND SUBSIDIARIES
Notes to the Consolidated Financial Statements
157
The number of the restricted employee shares of stock(in thousands) for the years ended December
31,2018 and 2017 were as follows: 2018 2017
Outstanding at the beginning of year 2,101 2,106
Retired (40) (5)
Vested (2,061) -
Outstanding at the end of year - 2,101
The Company’s above-mentioned restricted employee shares of stock are measured at fair
value with a closing price of $ 70.20 for the grant date of company stocks, resulting in a
capital reserve of $ 144,480 restricted employee shares. In December 31, 2018 and 2017, the
unearned balance of employee salary was $0 and $ 16,425 respectively.
For the years ended December 31,2018 and 2017, the accrued compensation cost for the
restricted employee shares of stock amounted to $14,537 and $21,972.
(ii) Employee stock options at cash capital increase
On September 17,2018 the Company’s board of directors approved to cash capital increase,
and 1,000,000 shres to the employee stock options. The related informations are as
follows:
Type
Employee stock options at cash
capital increase
Vesting date December 19,2018
Options granted 1,000,000 shares
Exercise Amount 1,000,000 shares
Vesting Period Immediate vesting
The capital increase retention and the fair value of employee stock options at cash capital
increase is $8.6. The recognized reward cost as of 2018 is $8,600,000, which is listed under
Operating Costs.

TOPCO TECHNOLOGIES CORP. AND SUBSIDIARIES
Notes to the Consolidated Financial Statements
158
(q) Earnings per share
For the years ended December 31, 2018 and 2017, the basic and diluted earnings per share
were calculated as follows For the Years ended December 31 2018 2017
Basic earnings per share
Profit attributable to ordinary shareholders of the Company $ 463,242 350,138
Weighted average number of ordinary shares (basic) 62,515 62,000
Basic earnings per share(in dollars) $ 7.41 5.65
Diluted earnings per share
Profit attributable to ordinary shareholders of the Company $ 463,242 350,138
Weighted average number of ordinary shares (basic) 62,515 62,000
Employee compensation 726 513
Restricted employee shares of stock - 1,537
Employee stock options at cash capital increase 4 -
Weighted average number of ordinary shares (diluted) 63,245 64,050
Diluted earnings per share(in dollars) $ 7.32 5.47
(r) Revenue from contracts with customers
(i) Disagregation Revenue
For the Years ended December 31,2018
Taipei
Department
Overseas
Department
Taichung
Department Total
Major markets
Taiwan $ 2,361,284 - 835,335 3,196,619
China 375,247 4,165,601 540,331 5,081,179
Other 232,948 - 33,921 266,869
$ 2,969,479 4,165,601 1,409,587 8,544,667
Major product:
Related products of
chemical material
$ 2,969,479 4,165,601 - 7,135,080
General trades - - 1,407,920 1,407,920
Other - - 1,667 1,667
$ 2,969,479 4,165,601 1,409,587 8,544,667

TOPCO TECHNOLOGIES CORP. AND SUBSIDIARIES
Notes to the Consolidated Financial Statements
159
(ii) Balance of contract
December
31,2018
January 1,
2018
Notes and accounts receivable $ 2,106,954 1,975,863
Less: loss allowance (27,754) (17,468)
$ 2,079,200 1,958,395
Current contract liabilities- Advance sales receipts
$ 24,495 28,182
For details on notes, accounts receivable and loss allowance, please see Note 6(f).
The amount of revenue recognized for the years ended December 31, 2018 that was
included in the contract liability balance at the beginning of the period was 27,535.
The major change in the balance of contract liabilities is the difference between the
time of the performance oblgation to be satisfied and the payment to be received.
(s) Employees’ and directors’ compensation
According to the Company’s Article of Incorporation, if the compay has profit, 5%~10% of
them shall be appropriated as employee remuneration, and a percentage not higher than 5%
shall be remuneration of directors. In case of accumulated loss of the Company, the amount
shall be reserved to compensate for the amount, followed by calculating the employee
remuneration and director remuneration according to the balance. Employee remuneration
can be stocks or cash, and the parties to be distributed include the employees of the associate
companies who satisfy a certain criteria.
For the years ended December 31, 2018 and 2017 the appropriated employee compensations
amounted to $42,000, and $31,000 and directors’ compensations amounted to $18,000 and
$13,000 respectively. These amounts were calculated based on the Company’s article of
incorporation and the net profit before tax after deducting employee and director
compensations, and was recognized under operating expenses, which were consistent with
the actual distributions. Related information can be accessed from the Market Observation
Post System website.
(t) Financial instruments
(i) Credit risk
1) Credit risks exposure
The carrying amounts of financial assets represents the maximum credit risk exposure
of the Group.

TOPCO TECHNOLOGIES CORP. AND SUBSIDIARIES
Notes to the Consolidated Financial Statements
160
2) Concentration of credit risk
As the Group has a large customer base and does not have a significant concentration of
transactions with a single customer and the sales area is dispersed, the credit risk of
accounts has no significant concentration.
3) Credit risk of account receivables and debt securities
Please refer to the Note 6(f) of the disclosure of the risk exposure information of notes
and accounts receivable. Please refer to Note 6(e) and Note 6(g), for the details of
certificate of deposits and other receivables and the recognition of impairment for the
years ended December 31, 2018.
The following table lists the above-mentioned financial assets, loss allowance
recognized on December 31, 2018 and whether there is credit impairment according to
12-month expected credit loss or lifetime expected credit loss:
December 31, 2018
Evaluated at amortized cost
12-month
expected
loss
Expected
loss - not
impaired
expected
loss -
impaired Total
Total Book value $ 106,634 2,099,833 - 2,206,467
Loss allowance - (27,754) - (27,754)
Amortized cost $ 106,634 2,072,079 - 2,178,713
Book value, net $ 106,634 2,072,079 - 2,178,713
(ii) Liquidity risk
The following were the contractual maturities of financial liabilities, not including the
impact of estimated interests.
Book value
Contract
cash flows
Within 1
years
Within 1~2
years
More than
2 years
December 31, 2018
Non-derivative financial liabilities
Unsecured bank loan $ 155,183 (155,183) (155,183) - -
Secured bank loans (including current
portion) 60,000 (60,000) (3,045) (3,100) (53,855)
Notes payable and trades (including
related parties) 757,240 (757,240) (757,240) - -
Other payable 16,116 (16,116) (16,116) - -
Derivatives not for hedging:
Forward foreign exchange contract: 177 (177) (177) - -
$ 988,716 (988,716) (931,761) (3,100) (53,855)

TOPCO TECHNOLOGIES CORP. AND SUBSIDIARIES
Notes to the Consolidated Financial Statements
161
Book value
Contract
cash flows
Within 1
years
Within 1~2
years
More than
2 years
December 31, 2017
Non-derivative financial liabilities
Unsecured bank loan $ 109,358 (109,358) (109,358) - -
Secured bank loan 70,000 (70,000) - (3,552) (66,448)
Notes payable and trades (including
related parties) 803,158 (803,158) (803,158) - -
Other payable 10,715 (10,715) (10,715) - -
$ 993,231 (993,231) (923,231) (3,552) (66,448)
The Group does not expect that the cash flows included in the maturity analysis could
occur significantly earlier or at significantly different amounts.
(iii) Market risk
1) Currency risk
The Group’s significant exposure to foreign currency risk was as follows:
Foreign currency unit: in thousand December 31, 2018 December 31, 2017
Foreign
currency
Exchange rate
NTD Foreign
currency
Exchange rate
NTD
Financial asset
Monetary items
USD $ 16,588 USD/NTD=
30.715
509,495 15,497 USD/NTD=
29.76
461,206
USD 3,327 USD/RMB=
6.868
102,193 2,484 USD/RMB=
6.512
73,928
USD 5,795 USD/HKD=
7.834
177,988 9,339 USD/HKD=
7,815
277,935
USD 23 USD/VND=
25.596
717 165 USD/VND=
25,008
4,916
USD 33 USD/IDR=
14,420
1,022 46 USD/IDR=
13,345
1,386
Financial liabilities
Monetary items
USD 11,166 USD/NTD=
30.715
342,965 11,495 USD/NTD=
29.76
342,096
USD 6,792 USD/RMB=
6.868
208,613 6,450 USD/RMB=
6.512
191,937
USD 2,028 USD/HKD=
7.834
62,290 2,753 USD/HKD=
7.815
81,938
USD 1,153 USD/VND=
25,596
35,429 489 USD/VND=
25,008
14,558
USD 422 USD/IDR=
14,420
12,949 178 USD/IDR=
13,345
5,294

TOPCO TECHNOLOGIES CORP. AND SUBSIDIARIES
Notes to the Consolidated Financial Statements
162
2) Sensitive analysis
The Group’s exposure to foreign currency risk arises from the translation of the foreign
currency exchange gains and losses on cash and cash equivalents, receivables and other
receivables, loans, account payables and other payable that are denominated in foreign
currency. Assuming other variable remain the same, a 5% depreciation or appreciation
of the NTD against the USD, RMB, JPY, HKD and EUR, etc. as of December 31, 2018
and 2017, the before-tax income will increase or decrease by $ 5,416 and $ 9,957,
respectively. The analysis assumes that all other variables remain constant.
3) Gain or loss on foreign exchange
A Group deals with diverse foreign currencies, therefore, the gains or losses on foreign
exchange were summarized as a single amount. For the nine months ended December
31, 2018 and 2017, the foreign exchange gain(loss), including realized and unrealized,
amounted to loss of $7,563 and profit of $1,080, respectively.
(iv) Interest rate analysis
The Group's interest rate exposure as follows: Carring value December 31,
2018 December 31,
2017
Variable interest rate instruments:
Financial assets $ 1,074,834 1,262,338
Financial liabilities 215,183 179,358
The Group's sensitivity analysis in interest rates is based on the risk exposure to interest
rates on the derivative and the non-derivative financial instruments on the reporting date.
For variable rate instruments, the sensitivity analysis assumes the variable rate liabilities
are outstanding for the whole year on the reporting date.
If the interest rate increases or decreases by 0.25%, the Group’s profit will increase or
decrease by $2,149 and $2,707 for the years ended December 31, 2018 and 2017,
respectively, due to the floating rate borrowings and deposits of the Group. This analysis
assumes that all other variables remain constant.
(v) Fair value information
1) Evaluation process
The Group’s accounting policy and disclosure include evaluating its financial assets and
liabilities at fair value. The Group’s management personnel are responsible for
conducting independent fair value verification, making the evaluation result close to
market conditions with data of independent source, ensuring the data source is

TOPCO TECHNOLOGIES CORP. AND SUBSIDIARIES
Notes to the Consolidated Financial Statements
163
independent, reliable, consistent with other resources and representative of strike price,
periodically calibrate the evaluation model, renew the input values and data needed by
the evaluation model, and other necessary fair value adjustment, in order to make sure
the result is reasonable.
The Group uses observable market data to evaluate its assets and liabilities when it is
possible. The different inputs of levels the of fair value hierarchy in determining the fair
value are as follows:
● Level 1:quoted prices (unadjusted) in active markets for identifiable assets or
liabilities.
● Level 2:inputs other than quoted prices included within Level 1 that are observable
for the asset or liability, either directly(ie as prices) or directly (ie derived
from prices).
● Level 3:inputs for the assets or liability that are not based on observable market
data.
2) The categories and fair values of financial instruments
The measurement basis of the financial assets and liabilities at fair value through profit
or loss and the financial assets at fair value through other comprehensive income
(available-for-sale) is repetitive the carrying amount and fair value of the Group’s
financial assets and liabilities, including the information on fair value hierarchy were as
follows; however, except as described in the following paragraphs, for financial
instruments not measured at fair value whose carrying amount is reasonably close to the
fair value, and for equity investments that has no quoted prices in the active markets and
whose fair value cannot be reliably measured, disclosure of fair value information is not
required : December 31, 2018 Fair value Carring
amount Level 1 Level 2 Level 3 Total
Financial assets at fair value through
profit or loss, mandatorily
measured at fair value:
Derivatives not for hedging $ 18 - 18 - 18
Financial assets at fair value through
other comprehensive income:
Domestic non-listed companies 190,741 - - 190,741 190,741
Financial assets at fair value through
profit or loss:
Account receivables 7,121 - - - -
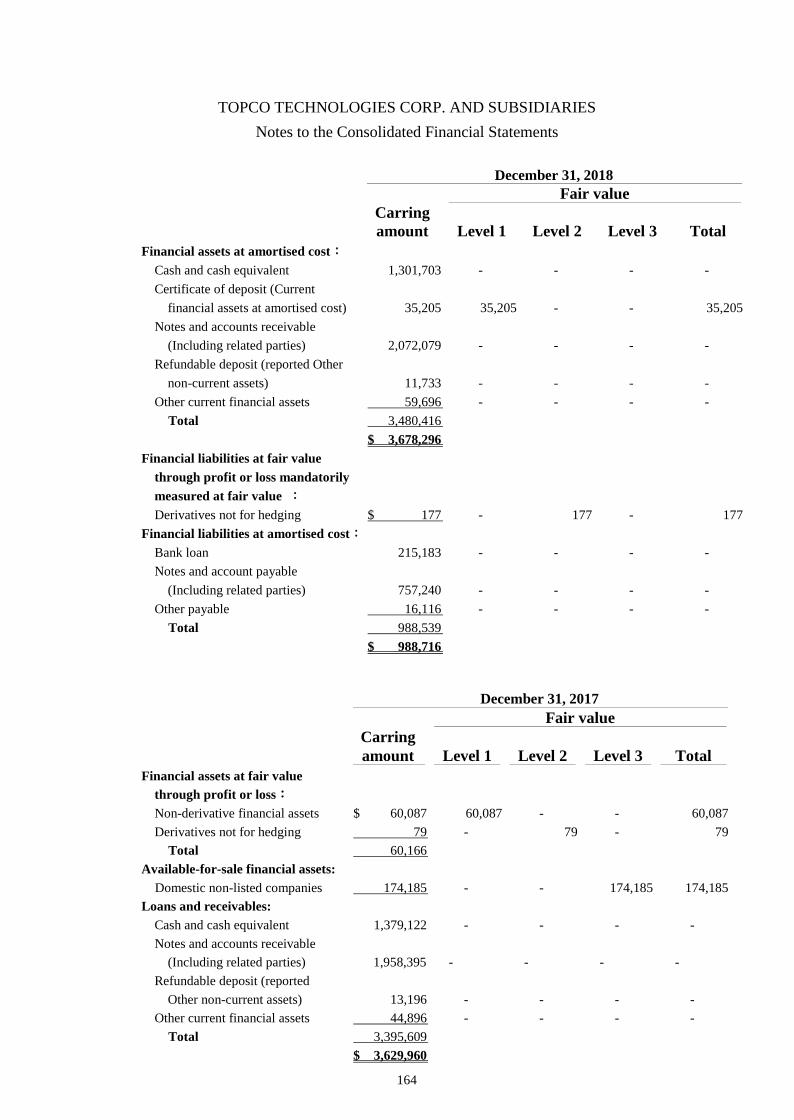
TOPCO TECHNOLOGIES CORP. AND SUBSIDIARIES
Notes to the Consolidated Financial Statements
164
December 31, 2018 Fair value Carring
amount Level 1 Level 2 Level 3 Total
Financial assets at amortised cost:
Cash and cash equivalent 1,301,703 - - - -
Certificate of deposit (Current
financial assets at amortised cost) 35,205 35,205 - - 35,205
Notes and accounts receivable
(Including related parties) 2,072,079 - - - -
Refundable deposit (reported Other
non-current assets) 11,733 - - - -
Other current financial assets 59,696 - - - -
Total 3,480,416
$ 3,678,296
Financial liabilities at fair value
through profit or loss mandatorily
measured at fair value :
Derivatives not for hedging $ 177 - 177 - 177
Financial liabilities at amortised cost:
Bank loan 215,183 - - - -
Notes and account payable
(Including related parties) 757,240 - - - -
Other payable 16,116 - - - -
Total 988,539
$ 988,716
December 31, 2017
Fair value
Carring
amount Level 1 Level 2 Level 3 Total
Financial assets at fair value
through profit or loss:
Non-derivative financial assets $ 60,087 60,087 - - 60,087
Derivatives not for hedging 79 - 79 - 79
Total 60,166
Available-for-sale financial assets:
Domestic non-listed companies 174,185 - - 174,185 174,185
Loans and receivables:
Cash and cash equivalent 1,379,122 - - - -
Notes and accounts receivable
(Including related parties)
1,958,395
-
-
-
-
Refundable deposit (reported
Other non-current assets) 13,196 - - - -
Other current financial assets 44,896 - - - -
Total 3,395,609
$ 3,629,960

TOPCO TECHNOLOGIES CORP. AND SUBSIDIARIES
Notes to the Consolidated Financial Statements
165
December 31, 2017
Fair value
Carring
amount Level 1 Level 2 Level 3 Total
Financial liabilities at amortised
cost:
Bank loan $ 179,358 - - - -
Notes and account payable
(Including related parties) 803,158 - - - -
Other payables 10,715 - - - -
$ 993,231
3) Valuation techniques for financial instruments not measured at fair value
The method and assumption used by the Group in estimating instruments not evaluated
at fair value are as follows:
A. Financial assets and liabilities at amortised cost
If there are quote data of the dealer, then the nearest price and quote data are the
basis of estimating fair value. If no market price is available for reference, the
evaluation method is used. The estimation and assumption used in the evaluation
method is the estimated fair value of discounted cash flows.
4) Valuation techniques for financial instruments measured at fair value
A. Non-derivative financial instruments
The fair value of financial instruments traded in an active market is based on quoted
market price.
A financial instrument is regarded as being quoted in an active market if quoted price
are readily and regularly available from an exchange, dealer, broker, industry group,
pricing service, or regulatory agency and those prices represent actual and regularly
occurring market transactions on an arm’s-length basis. Whether transactions are
taking place ‘regularly’ is a matter of judgement and depends on the facts and
circumstances of the market for the instrument. Quoted market prices may not be
indicative of the fair value of the instrument if the activity in the market is
infrenquent, the market is not well-established, only small volumes are traded, or
bid-ask srpeads are very wide. Determining whether a market is active involves
judgment.
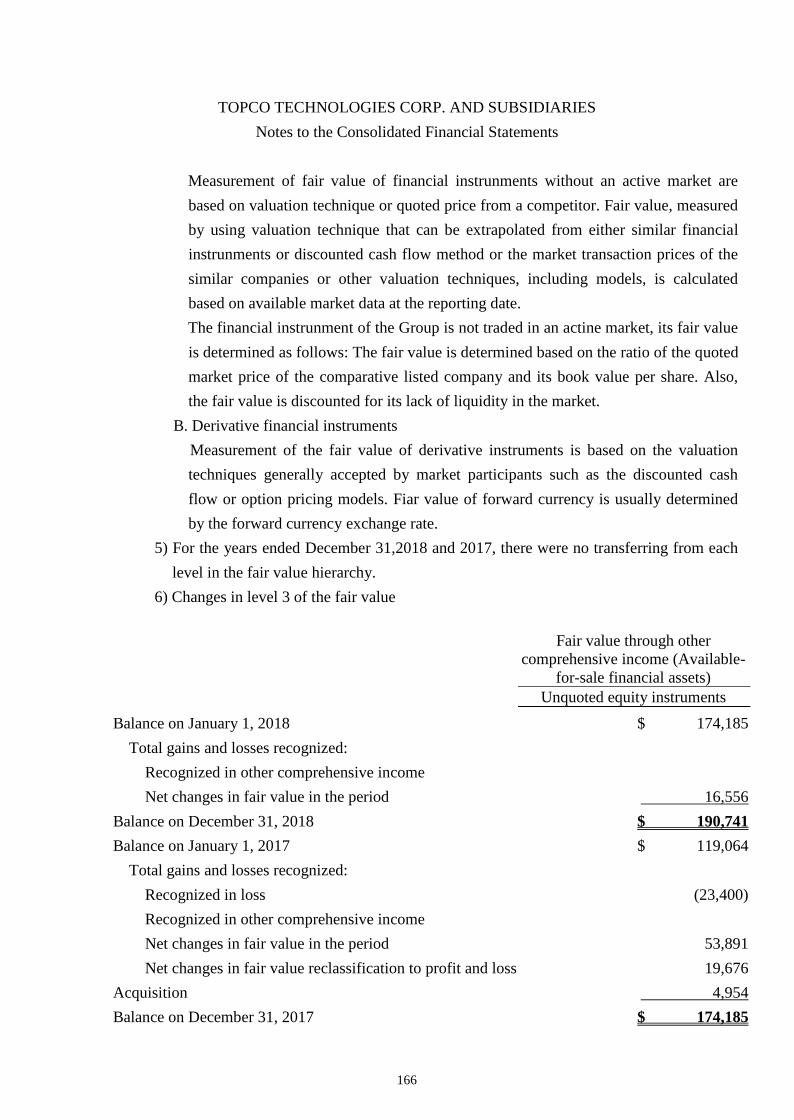
TOPCO TECHNOLOGIES CORP. AND SUBSIDIARIES
Notes to the Consolidated Financial Statements
166
Measurement of fair value of financial instrunments without an active market are
based on valuation technique or quoted price from a competitor. Fair value, measured
by using valuation technique that can be extrapolated from either similar financial
instrunments or discounted cash flow method or the market transaction prices of the
similar companies or other valuation techniques, including models, is calculated
based on available market data at the reporting date.
The financial instrunment of the Group is not traded in an actine market, its fair value
is determined as follows: The fair value is determined based on the ratio of the quoted
market price of the comparative listed company and its book value per share. Also,
the fair value is discounted for its lack of liquidity in the market.
B. Derivative financial instruments
Measurement of the fair value of derivative instruments is based on the valuation
techniques generally accepted by market participants such as the discounted cash
flow or option pricing models. Fiar value of forward currency is usually determined
by the forward currency exchange rate.
5) For the years ended December 31,2018 and 2017, there were no transferring from each
level in the fair value hierarchy.
6) Changes in level 3 of the fair value
Fair value through other
comprehensive income (Available-
for-sale financial assets) Unquoted equity instruments
Balance on January 1, 2018 $ 174,185
Total gains and losses recognized:
Recognized in other comprehensive income
Net changes in fair value in the period 16,556
Balance on December 31, 2018 $ 190,741
Balance on January 1, 2017 $ 119,064
Total gains and losses recognized:
Recognized in loss (23,400)
Recognized in other comprehensive income
Net changes in fair value in the period 53,891
Net changes in fair value reclassification to profit and loss 19,676
Acquisition 4,954
Balance on December 31, 2017 $ 174,185

TOPCO TECHNOLOGIES CORP. AND SUBSIDIARIES
Notes to the Consolidated Financial Statements
167
The aforementioned total gains and losses were recognized in “other gains and
losses”,“unrealized gains and losses from available-for-sale financial assets” and
“unrealized gains and losses from financial assets fair value through other
comprehensive income”. The details of the assets which the Group still held as of
December 31, 2018 and 2017, were as follows: For the Years Ended December 31, 2018 2017
Total gains and losses recognized:
In other comprehensive income (accounted as Unrealized
gains on financial assets measured at fair value through
other comprehensive income)
$ 16,556
In profit or loss (accounted as “other gains and losses”) $ (23,400)
In other comprehensive income (accounted as “unrealized
gains (losses) on available-for-sale financial assets”)
$ 73,567
7) Quantified information for significant unobservable inputs (level 3) used in fair value
measurement
The Group’s financial instruments that use level 3 inputs to measure the fair values
include financial assets measured at available-for-sale financial assets-equity
investments.
The financial instruments of the Group is not traded in an active market, its equity
instruments classified as Level 3 fair value have multiple significant unobservable input
values. The significant unobservable inputs of the equity invsestments are independent
from each otheras a result, there is no relevance between them.
The quantified information for significant unobservable inputs is as follows:
Item
Evaluation
technique
Significant
unobservable input
value
Relation between
significant
unobservable
input value and
fair value Financial assets at
fair value through other comprehensive income (Available-for-sale financial assets)-equity instruments without active market
Comparable listed company’s approach
‧PB ratio (1.83~3.13 and 1.96~2.97 on December 31, 2018 and 2017, respectively)
‧PE ratio ((12.91 and 16.67 on December 31, 2018 and 2017, respectively)
‧Market liquidity discount rate (25% on December 31, 2018 and)
‧The estimate fair value would increase if the multiplier was higher
‧The estimate fair value would decrease if market liquidity discount rate was higher

TOPCO TECHNOLOGIES CORP. AND SUBSIDIARIES
Notes to the Consolidated Financial Statements
168
8) Sensitivity analysis for fair values of financial instruments using Level 3 inputs
The Group’s fair value measurement on financial instruments is reasonable. However,
the measurement would be different if different valuation models or valuation
parameters are used. For financial instruments using level 3 inputs, the impact on the net
income or loss and other comprehensive income or loss will be as follows if the
valuation parameters changed:
Input value
Increase or
decrease
Impacts of fair value change
on other comprehensive
income or loss Favorable Unfavorable
December 31, 2018
Financial assets at fair
value through other
comprehensive
income
PB ratio 5%
$ 5,149 5,139
Financial assets at fair
value through other
comprehensive
income
PE ratio 5%
$ 4,395 4,398
Financial assets at fair
value through other
comprehensive
income
Market
liquidity
discount rate
5%
$ 9,550 9,531 December 31, 2017
Available-for-sale
financial assets
PB ratio 5% $ 4,954 4,966
PE ratio 5% $ 3,749 3,760
Market
liquidity
discount rate
5%
$ 8,709
8,720
The favorable and unfavorable effects represent the changes in fair value, and fair value
is based on variety of unobservable inputs calculated using a valuation technique. The
analysis above only reflects the effects of changes in a single input, and it does not
include the interrelationships with another input.
(w) Financial risk management
(i) Overview
The Group is exposured to the following risks from its financial instruments:
1) credit risk
2) liquidity risk
3) market risk

TOPCO TECHNOLOGIES CORP. AND SUBSIDIARIES
Notes to the Consolidated Financial Statements
169
The note discloses information about the Group’s explosure to the aforemaentioned
risks, and its goals, policys and procedurs regarding the measurement and
management of these risks. For additional quantitative disclosures of these risks,
please refer to the notes regarding each risk disclosed throughout the financial report.
(ii) Risk management framework
The Group’s risk management policies are established to identify and analyze the risks
faced by the Group, to set appropriate risk limits and controls, and to monitor risks and
adherence to limits. Risk management policies and systems are reviewed regularly to
reflect changes in market conditions, products and services offered. The Group, through
its training and management standards and procedures, aim to develop a disciplined and
constructive control environment, in which all employees understand their roles and
obligations.
The Group’ s Internal Audit oversees how management monitors compliance with the
Group’ s risk management policies and procedures and reviews the adequacy of the risk
management framework in relation to the risks faced by the Group. Internal Audit
undertakes both regular and ad hoc reviews of risk management controls and procedures,
the results of which are reported to the Board of Directors.
(iii) Credit risk
Credit risk is the risk of financial loss to the Group if a customer or counterparty to
financial instruments fails to meet its contractual obligations that arise principally from
the Group’s account receivables and securities investment.
1) Accounts receivables and other receivables
The Group has established a credit policy, and according to the policy, the Group must
analyze its individual credit rating for each new customer before giving the standard
payment and delivery terms. The review of the Group includes, if available, an external
review, and, in some cases, a note from the bank. Purchase quotas are established on
individual customers. This limit is reviewed regularly. Customers who do not comply
with the Company's benchmark credit rating are only allowed to advance the transaction
with the Group.
Accounts receivables cover a large number of customers and are dispersed in different
industries and geographical areas. The Group will continue to evaluate the financial
status of accounts customers and, if necessary, purchase credit guarantee insurance
contracts.
As the Group has a large customer base and does not significantly focus on trading with a
single customer and the sales area is scattered, there is no significant concentration of
credit risks on accounts. In order to reduce credit risk, the Group also regularly reviews
the financial status of its customers, but usually does not require customers to provide
collateral.

TOPCO TECHNOLOGIES CORP. AND SUBSIDIARIES
Notes to the Consolidated Financial Statements
170
2) Investment
The Group reduces credit risk by investing only in liquid securities with good credit
ratings. As managers actively monitor credit ratings and the Group can only invest in
securities with high-quality credit ratings, managers do not expect any traders to not be
able to perform their obligations.
(iv) Liquidity risk
Liquidity risk is the risk that the Group will encounter difficulty in meeting the
obligations associated with its financial liabilities that are settled by delivering cash or
another financial asset.
The Group maintains sufficient cash and cash equivalents so as to cope with its
operations and mitigate the effects of fluctuations in cash flows. The Group’s
management supervises the bank loan facilities and ensures in compliance with the
terms of the loan agreements.
The loan was an important source of liquidity for the Group. As of December 31,2018
and 2017, the Group has unused credit facilities for short-term and long-term loans
please refer to note 6(j) and 6(k).
(v) Market risk
Market risk is the risk that changes in market prices, such as foreign exchange rates,
interest rates and equity prices, and credit spreads will affect the Group’s income or the
value of its holdings of financial instruments. The objective of market risk management
is to manage and control market risk exposures within acceptable parameters, while
optimizing the return on risk.
1) Currency risk
The Group is exposed to currency risk on sales and purchase that denominated in a
currency other than the respective functional currencies used in these transactions are
denominated in TWD, USD, RMB and HKD. The functional currency of the Group
enterprise is NTD, with USD, RMB and HKD available as well. Around 30% of the
Group’s sale is not priced in the functional currency of the individual company in
which the transaction happens in, and approximately 60% of the cost is not priced in
the functional currency of the individual company in which the transaction happens in.
The immense currency exchange risk management of the Group is limited within
permission of its policies, and makes use of long-term foreign currency contracts for
risk management.
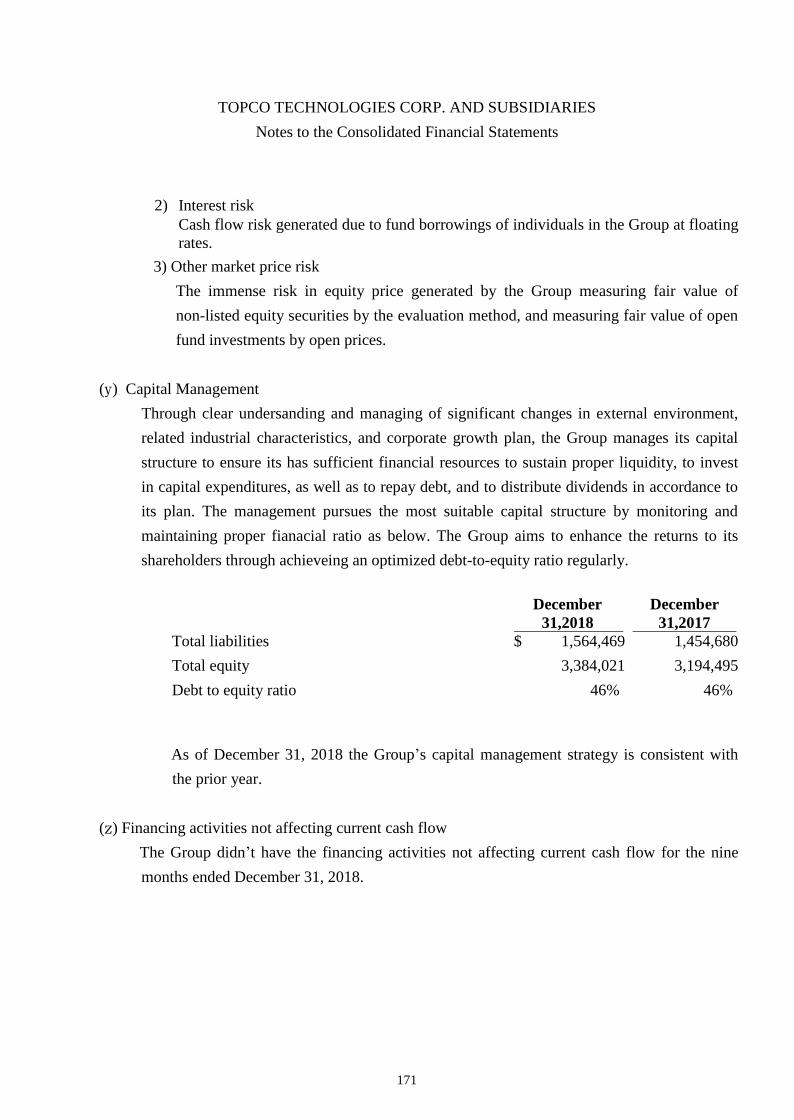
TOPCO TECHNOLOGIES CORP. AND SUBSIDIARIES
Notes to the Consolidated Financial Statements
171
2) Interest risk Cash flow risk generated due to fund borrowings of individuals in the Group at floating
rates.
3) Other market price risk
The immense risk in equity price generated by the Group measuring fair value of
non-listed equity securities by the evaluation method, and measuring fair value of open
fund investments by open prices.
(y) Capital Management
Through clear undersanding and managing of significant changes in external environment,
related industrial characteristics, and corporate growth plan, the Group manages its capital
structure to ensure its has sufficient financial resources to sustain proper liquidity, to invest
in capital expenditures, as well as to repay debt, and to distribute dividends in accordance to
its plan. The management pursues the most suitable capital structure by monitoring and
maintaining proper fianacial ratio as below. The Group aims to enhance the returns to its
shareholders through achieveing an optimized debt-to-equity ratio regularly.
December
31,2018
December
31,2017
Total liabilities $ 1,564,469 1,454,680
Total equity 3,384,021 3,194,495
Debt to equity ratio 46% 46%
As of December 31, 2018 the Group’s capital management strategy is consistent with
the prior year.
(z) Financing activities not affecting current cash flow
The Group didn’t have the financing activities not affecting current cash flow for the nine
months ended December 31, 2018.

TOPCO TECHNOLOGIES CORP. AND SUBSIDIARIES
Notes to the Consolidated Financial Statements
172
(7) Related-Party Transactions
(a) Names and relationship with related parties
The related parties that have trading relationship with the Company in the period covered by
the consolidated financial statements are as follows: Name of Related Parties Relationship
Shin-Etsu Chemical Co., Ltd. Corporate directors of the
Company
Shin-Etsu Silicone International Trading (Shanghai) Co,.
Ltd. (Shin-Etsu Shanghai)
The Company’s corporate
director, subsidiaries of
Shin-Etsu Chemical Co.,
Ltd.
Shin-Etsu Chemical Co., Ltd. (Shin-Etsu Taiwan) 〃
Shin-Etsu Silicone (Nantong) Co., Ltd. 〃
Shin-Etsu Astech Co., Ltd. 〃
Shin-Etsu Film Co., Ltd. 〃
Shin-Etsu (Hong Kong) Co., Ltd. 〃
Shin Etsu Polymer Hong Kong Ltd. 〃
Shin-Etsu Polymer Co., Ltd. 〃
Shin-Etsu Singapore Pte Ltd. 〃
Chung-shin Limited Company An affiliate
Topglow International Trading (Shanghai) Co., Ltd. 〃
Sign Co., Ltd. 〃
Kikukawa Metal & Engineering Co., Ltd 〃
Mr. Pan, Chen-Cheng Chairperson of the
Company
Mr. Weng, Chun-Ming Director of the Company
Mr. Weng, Chih-Hung General Manager of the
subsidiary, Topglow
(b) Transaction of major management personnel
(i) Transactions with key management personnel:
For the Years Ended December 31,
2018 2017
Short-term employee benefits $ 104,723 89,688
Post-employment benefit 1,826 1,826
$ 106,549 91,514
(ii) Provide security
For part of the Group’s credit lending contracts, the major management personnel of the
Group serve as the association guarantor.

TOPCO TECHNOLOGIES CORP. AND SUBSIDIARIES
Notes to the Consolidated Financial Statements
173
(c) Significant transactions with related parties
(i) Revenues to related parties
The amounts of significant sales between the Group and related parties were as follows:
For the Years Ended December 31,
2018 2017
Other related parties $ 132,907 261,857
There is no significant difference in terms and conditions of the sales to associates
between those provided to third parties. The credit lending period for other related parties
are 30~120 days, which is not significantly different with the third parties.
(ii) Purchases
The amounts of purchase transaction between the Group and related parties were as
follows:
For the Years Ended December 31, 2018 2017
Other related parties
Shin-Etsu Shanghai $ 1,980,314 1,763,461
Shin-Etsu Taiwan 2,262,077 2,230,563
Others 661,689 512,958
$ 4,904,080 4,506,982
The Group’s related products of chemical material are mainly purchased from other
related parties. There are no non-related party purchase prices for comparison. The
adoption of prepayment or 30~180 days open account during the payment period by
other related parties, and the payment period is 30~120 days for other suppliers.
(iii) Providing labor to other related parties
For the Years Ended December 31,
2018 2017
Commission revenue
(reported other operating revenue)
Other related parties $ 655 204

TOPCO TECHNOLOGIES CORP. AND SUBSIDIARIES
Notes to the Consolidated Financial Statements
174
(iv) Receivables from related parties
Receivables from related parties were as follows:
Account
Category of Related
party
December
31,2018
December
31,2017
Notes and accounts
receivable
Other related parties $ 34,816 96,351
(v) Payables to related parties
Payables to related parties were as follows:
Account
Category of Related
party
December
31,2018
December
31,2017
Notes and accounts
payable
Other related parties:
Shin-Etsu Taiwan $ 357,548 359,160
Shin-Etsu Shanghai 183,545 202,033
Others 63,708 84,648
$ 604,801 645,841
(vi) Lease expenses
When the Group rents a garage from other related parties, the rent is decided by the
Market price and paid monthly. For the years ended of December 31 of 2018 and 2017,
the rent expenses are both $2,880.
(8) Pledged assets
The book values of pledged assets were as follows:
Pledged assets
Object December
31,2018
December
31,2017
Certificates of deposits
(reported current other
financial assets)
Collateral of loans from bank $ 20,745 19,935
Property, plant, and
equipment
Long-term borrowings and
quota collateral
131,823 132,844
$ 152,568 152,779
(9) Significant Commitments and Contingencies
The amounts of unused letters of credit due to the Group’s purchase of raw materials are as
follows: December
31,2018
December
31,2017
Unused letters of credit $ 46,680 63,222

TOPCO TECHNOLOGIES CORP. AND SUBSIDIARIES
Notes to the Consolidated Financial Statements
175
(10) Losses Due to Major Disasters: None.
(11) Subsequent Events: None.
(12) Others
The employee benefits, depreciation, depletion and amortization expenses categorized by function
were as follows: By function For the Years Ended December 31, 2018 2017
By item Operating
expenses Operating
expenses
Employee benefits
Salary 487,469 438,666
Labor and health insurance 19,234 17,436
Pension 11,493 10,540
Others 18,191 16,484
Depreciation 5,017 5,655
Amortization 1,056 739
(13) Other disclosures:
(a) Information on significant transactions
The following is the information on significant transactions required by the “ Regulations
Governing the Preparation of Financial Reports by Securities Issuers” for the Group for the
year ended December 31, 2018:
(i) Financing provided:None.
(ii) Guarantees and endorsements provided:
No.
(Note 1)
Name of the
company
Counter-party of guarantee and endorsement
Limits on Endorsements/
guarantee
amount provided to
each
guarantee party
Maximum
Balance for
the Period
Ending
Balance for
the Period
Actual
drawdown
Property pledged on
guarantees and
endorsement
Ratio of accumulated
amounts of guarantees
and endorsements to net
worth of the latest
financial statements
Maximum amount for
guarantees and
endorsements
Parent company
endorses/
guarantees to third parties on
behalf of
subsidiary
Subsidiary endorses/
guarantees to
third parties on behalf of
parent
company
Endorsements/
guarantees to
third parties on behalf of
companies in
Mainland China
Name
Relationship
with the
Company
0 The Company
Topco Shanghai
sub-subsidiary 650,545 123,960 122,860 - - 3.78% 1,626,364
(Note2)
v - v
〃 〃 Topco
Guang Zhou 〃 650,545 123,960 122,860 - - 3.78% 1,626,364
(Note 2)
v - v
1 Topglow
(Note2)
Top Glory Subsidiaries 113,610 27,891 27,711 - - 7.32% 189,350
(Note 3)
v - -
Note 1: Fill in the number as the following rules:
1. Zero represents owners of parent. 2. Subsidiaries are numbered starting from “1”.
Note 2: The Company’s endorsement/guarantee amount limit to a single business shall not exceed 20% of the Company’s net worth in the latest financial
statements; the total amount of external endorsement/ guarantee shall not exceed 50% of the Company’s net worth in the latest financial
statements. Note 3: Topglow’s total external endorsement/ guarantee amount shall not exceed 50% of the net worth reported in the financial statements; the
endorsement/ guarantee amount limit to a single business shall not exceed 30% of Topglow’s net worth. Note 4: The companies in the transaction mentioned above are all reporting entities of the consolidated financial statements.
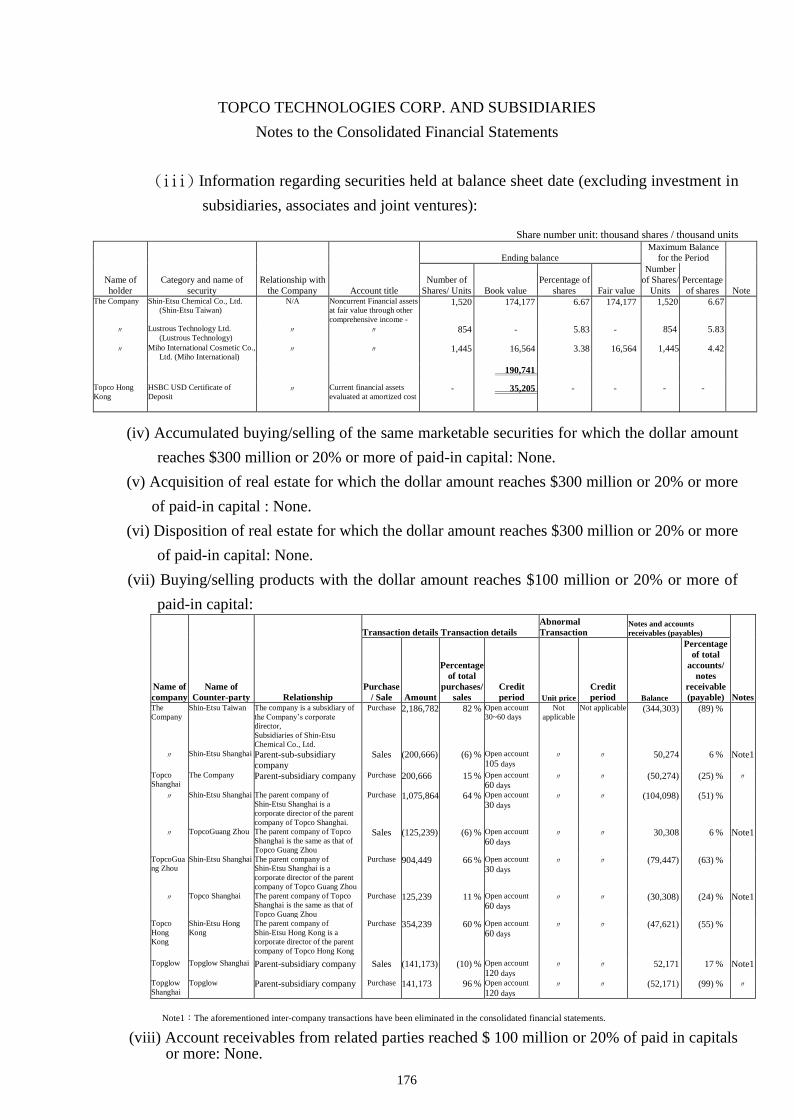
TOPCO TECHNOLOGIES CORP. AND SUBSIDIARIES
Notes to the Consolidated Financial Statements
176
(iii) Information regarding securities held at balance sheet date (excluding investment in
subsidiaries, associates and joint ventures):
Share number unit: thousand shares / thousand units
Name of
holder
Category and name of
security
Relationship with
the Company Account title
Ending balance
Maximum Balance
for the Period
Number of
Shares/ Units Book value
Percentage of
shares
Fair value
Number
of Shares/
Units
Percentage
of shares
Note
The Company Shin-Etsu Chemical Co., Ltd.
(Shin-Etsu Taiwan)
N/A Noncurrent Financial assets
at fair value through other
comprehensive income -
1,520 174,177 6.67 174,177 1,520 6.67
〃 Lustrous Technology Ltd.
(Lustrous Technology) 〃 〃 854 - 5.83 - 854 5.83
〃 Miho International Cosmetic Co.,
Ltd. (Miho International) 〃 〃 1,445 16,564
3.38 16,564 1,445 4.42
190,741
Topco Hong
Kong HSBC USD Certificate of
Deposit 〃 Current financial assets
evaluated at amortized cost - 35,205
- - - -
(iv) Accumulated buying/selling of the same marketable securities for which the dollar amount
reaches $300 million or 20% or more of paid-in capital: None.
(v) Acquisition of real estate for which the dollar amount reaches $300 million or 20% or more
of paid-in capital : None.
(vi) Disposition of real estate for which the dollar amount reaches $300 million or 20% or more
of paid-in capital: None.
(vii) Buying/selling products with the dollar amount reaches $100 million or 20% or more of
paid-in capital:
Name of
company Name of
Counter-party
Transaction details Transaction details Abnormal
Transaction Notes and accounts
receivables (payables)
Relationship Purchase
/ Sale
Amount
Percentage
of total
purchases/
sales
Credit
period
Unit price
Credit
period
Balance
Percentage
of total
accounts/
notes
receivable
(payable) Notes The
Company Shin-Etsu Taiwan The company is a subsidiary of
the Company’s corporate
director,
Subsidiaries of Shin-Etsu
Chemical Co., Ltd.
Purchase 2,186,782 82 % Open account
30~60 days Not
applicable Not applicable (344,303) (89) %
〃 Shin-Etsu Shanghai Parent-sub-subsidiary
company Sales (200,666) (6) % Open account
105 days 〃 〃 50,274 6 % Note1
Topco
Shanghai The Company Parent-subsidiary company Purchase 200,666 15 % Open account
60 days 〃 〃 (50,274) (25) % 〃
〃 Shin-Etsu Shanghai The parent company of
Shin-Etsu Shanghai is a
corporate director of the parent
company of Topco Shanghai.
Purchase 1,075,864 64 % Open account
30 days 〃 〃 (104,098) (51) %
〃 TopcoGuang Zhou
The parent company of Topco
Shanghai is the same as that of
Topco Guang Zhou
Sales (125,239) (6) % Open account
60 days 〃 〃 30,308 6 % Note1
TopcoGua
ng Zhou
Shin-Etsu Shanghai The parent company of
Shin-Etsu Shanghai is a
corporate director of the parent
company of Topco Guang Zhou
Purchase 904,449 66 % Open account
30 days 〃 〃 (79,447) (63) %
〃 Topco Shanghai The parent company of Topco
Shanghai is the same as that of
Topco Guang Zhou
Purchase 125,239 11 % Open account
60 days 〃 〃 (30,308) (24) % Note1
Topco
Hong
Kong
Shin-Etsu Hong
Kong The parent company of
Shin-Etsu Hong Kong is a
corporate director of the parent
company of Topco Hong Kong
Purchase 354,239 60 % Open account
60 days 〃 〃 (47,621) (55) %
Topglow Topglow Shanghai Parent-subsidiary company Sales (141,173) (10) % Open account
120 days 〃 〃 52,171 17 % Note1
Topglow
Shanghai Topglow Parent-subsidiary company Purchase 141,173 96 % Open account
120 days 〃 〃 (52,171) (99) % 〃
Note1:The aforementioned inter-company transactions have been eliminated in the consolidated financial statements.
(viii) Account receivables from related parties reached $ 100 million or 20% of paid in capitals or more: None.

TOPCO TECHNOLOGIES CORP. AND SUBSIDIARIES
Notes to the Consolidated Financial Statements
177
(ix) Derivative transactions: Please refer to Note 6 (b) for related information.
(x) Business relationships and significant inter-company transactions: Existing
relationship
with the
counter-party
(Note2)
Transaction details
No.
(Note 1)
Name of the
company
Name of the
counter-party Account name No.
(Note 1) Name of the company
Name of the
counter-party
0 The Company Topco Shanghai 1 Operating
revenue
200,666 The price and credit
term have no significant
difference with that of
the third parties.
2.35%
0 〃 〃 1 Purchase 14,534 〃 0.17%
0 〃 〃 1 Account
payable
6,812 〃 0.14%
0 〃 〃 1 Account
receivables
50,274 〃 1.02%
0 〃 Topco Guang Zhou 1 Operating
revenue
82,111 〃 0.96%
0 〃 〃 1 Account
receivables
4,444 〃 0.09%
0 〃 Topco Hong Kong 1 Operating
revenue
78,447 〃 0.92%
0 〃 〃 1 Purchase 11,032 〃 0.13%
0 〃 〃 1 Account
receivables
2,982 〃 0.06%
0 〃 〃 1 Account
payable
2,692 〃 0.05%
0 〃 〃 1 Service
revenue
13,850 Repaid depending on
funding 0.16%
0 〃 〃 1 Other
receivables
3,545 〃 0.07%
0 〃 Topglow 1 Operating
revenue
8,371 The price and credit
term have no significant
difference with that of
the third parties.
0.10%
0 〃 〃 1 Account
receivables
3,134 〃 0.06%
0 〃 PT.Topco 1 Operating
revenue
18,800 〃 0.22%
0 〃 〃 1 Account
receivables
7,488 〃 0.15%
0 〃 TOPCOVIETNAM 1 Operating
revenue
18,237 〃 0.22%
0 〃 〃 1 Account
receivables
6,851 〃 0.14%
1 Topco Shanghai Topco Guang Zhou 3 Operating
revenue
125,239 〃 1.47%
1 〃 〃 3 Account
receivables
30,308 〃 0.61%
1 〃 Topco Hong Kong 3 Operating
revenue
61 〃 - %
1 〃 TOPCOVIETNAM 3 Operating
revenue
239 〃 - %
1 〃 Topglow Shanghai 3 Purchase 472 〃 - %
1 〃 〃 3 Account
payable
14 〃 - %
2 Topco Guang
Zhou Topco Shanghai 3 Operating
revenue
73,438 〃 0.86%
2 〃 〃 3 Account
receivables
21,000 〃 0.42%
2 〃 Topglow Shanghai 3 Purchase 1,555 〃 0.02%
2 〃 TOPCOVIETNAM 3 Operating
revenue
71 〃 - %
2 〃 〃 3 Account
receivables
81 〃 - %
3 Topco Hong
Kong Topco Guang Zhou 3 Operating
revenue
43,359 〃 0.51%

TOPCO TECHNOLOGIES CORP. AND SUBSIDIARIES
Notes to the Consolidated Financial Statements
178
Existing
relationship
with the
counter-party
(Note2)
Transaction details
No.
(Note 1)
Name of the company
Name of the counter-party Account name
No.
(Note 1) Name of the company
Name of the counter-party
3 〃 〃 3 Account
receivables
4,792 〃 0.10%
3 〃 Topco Shanghai 3 Operating
revenue
178 〃 - %
3 〃 〃 3 Account
receivables
63 〃 - %
3 〃 TOPCOVIETNAM 3 Operating
revenue
60,417 〃 0.71%
3 〃 〃 3 Account
receivables
29,709 〃 0.60%
3 〃 〃 3 Purchase 7,660 〃 0.09%
4 Topglow Topglow Shanghai 3 Operating
revenue
141,173 〃 1.65%
4 〃 〃 3 Purchase 3,585 〃 0.04%
4 〃 〃 3 Account
receivables
52,171 〃 1.05%
Note 1: Fill in the number as the following rules:
1. Zero represents owners of parent. 2. Subsidiaries are numbered starting from “1”.
Note 2: Relationships
1. Transaction between parent company and subsidiary 2. Transaction between subsidiary and parent company 3. Transaction between subsidiary and subsidiary
(b) Information on investees:
For the year ended December 31, 2018, the following is the information on investees
(excluding investees in Mainland China): Foreign currency unit: in thousand
Name of the
investor
Name of
investee
Major
operations
Initial investment
amount Ending balance
Net income
of the
investees in
current
period
Investment
income
recognized
in current
period
Location
Ending
balance
Beginning
balance
Shares (in
thousands) Percentage
(%) Book value Remarks
The Company
Topco
America Cayman
Islands
Holdings
overseas 332,670 332,670 12,260 100 2,107,369 247,381 247,381
Note 1, 2 and 3
〃 Topglow Taichung Import and
export trading 82,258 82,258 9,146 65 247,405 53,100 34,690
Note 1and 3
Topco
America
Topco Hong
Kong Hong Kong
Merchandising
business of
chemical
material related
products
100,131
(USD3,260)
97,018
(USD3,260)
- 100 537,011 34,501 34,226
Note 1and 3
Topglow Top Glory Belize Import and
export trading 1,537 1,537 50 100 17,876 522 522
Note 1and 3
Topco Hong
Kong PT. Topco Indonesia
Merchandising
business of
chemical
material related
products
30,715
(USD1,000)
29,760
(USD1,000)
- 100 19,948 1,304 1,304
Note 1, 3 and 4
〃 Topco
Vietnam Vietnam
Merchandising
business of
chemical
material related
products
24,572
(USD800)
23,808
(USD800)
- 100 26,045 7,478 7,478
Note 1and 3
Note 1: Subsidiaries with controlling power.
Note 2: Original investment amount includes the reinvestment amount of US$ 800,000 with the cash dividends distributed from Topco Hong Kong.
Note 3: The transactions on the left have been written off when preparing the consolidated financial statements.
Note 4: PT.Topco considers the requirements of Indonesia. The 0.04% shareholding in obtaining PT.Topco’s equity was held with the name of a third
party. Topco Hong Kong signed a contract with the third party, in which the rights and obligations of the both parties are listed, to protect asset
safety.
Note 5: The NTD amount in this table is transformed with the exchange rate on the balance sheet date.

TOPCO TECHNOLOGIES CORP. AND SUBSIDIARIES
Notes to the Consolidated Financial Statements
179
(c) Information on investment in Mainland China:
(i) Related information of the business invested in Mainland China: Foreign currency unit: in thousand
Name of the
investee in
Mainland China
Major
operations
Paid-in
capital
Investment
method
Cumulative
investment
amount from
Taiwan in
the beginning
of the period
Current
remittance/
recoverable
investment
(amount)
Ending
remittance
balance -
Cumulative
investment
(amount) from
Taiwan
Net income
(loss) of the
investee
Shareholding
ratio directly
or indirectly
held by the
Company
Investment gain
(loss) recognized
in the current
period (Note 2)
Book value of
investment at
end of the
period
Accumulated
Inward
Remittance of
Earnings
Remittance
amount
Recoverable
amount
Remittance
amount
Recoverable
amount
Topco Shanghai Merchandising
business of
chemical
material related
products
198,413
(USD6,500)
(Note 4)
Note 1 113,646
(USD3,700)
- - 113,646
(USD3,700)
112,487
(USD3,731)
100 % 111,522
(USD3,699)
788,945
(USD25,686)
-
Topco Guang Zhou 〃 198,413
(USD6,500)
(Note 5)
〃 113,646
(USD3,700)
- - 113,646
(USD3,700)
102,748
(USD3,408)
100 % 101,633
(USD3,371)
789,222
(USD25,695)
-
Topglow Shanghai Import and
export trading 14,770 Note 6 - - - 14,770 403 65 % 403 12,668 -
Note 1:Direct investment in Mainland China with remittance through a third region.
Note 2:Recorded per audited financial statements of the investees.
Note 3:The NTD amount in this table is transformed with the exchange rate on the balance sheet date.
Note 4:Includes the capitalization of retained earnings of USD2,000,000 and the reinvestment of the stock dividends of USD800,000 distributed by
Topco Hong Kong (in Hong Kong area) via the third region investment business, Topco America.
Note 5:Includes the capitalization of retained earnings of USD2,000,000 and the reinvestment of the stock dividends of USD800,000 distributed by
Topco Hong Kong (in Hong Kong area) via the third region investment business, Topco America.
Note 6:The investee company of Topglow established with its own funds.
Note 7:The transactions mentioned above have been written off when preparing the consolidated financial statements.
(ii) Limitation on investment in Mainland China:
Accumulated balance from Taiwan
to
Mainland China
Approved investment amount by
Ministry of Economic Affairs
Investment Commission
Limitation on investment in
Mainland China in accordance
with regulations of Ministry of
Economic Affairs Investment
Commission
242,649 (USD 7,900,000)
614,300 (USD 10,000,000) (Note 2)
1,951,636
Note 1:The NTD amount in this table is transformed with the exchange rate on the balance sheet date.
Note 2: Includes the reinvestment of the stock dividends distributed by Topco Hong Kong (in Hong Kong area) via the third region investment
business, Topco America. The amount for the subsidiary of subsidiary in Mainland China is USD 1,600,000.
(iii) Significant transactions:
The significant inter-company transactions with the subsidiary in Mainland China,
which were eliminated in the preparation of consolidated financial statements, are
disclosed in “Information on significant transactions”

TOPCO TECHNOLOGIES CORP. AND SUBSIDIARIES
Notes to the Consolidated Financial Statements
180
(14) Segment Information
The Group has three departments that shall be reported: Taipei Department, Overseas Department
and Taichung Department. Taipei Department and Overseas Department are responsible for the
merchandising business of importing and exporting chemical material related products according
to different regions. Taichung Department is responsible for the general import and export trading
business.
The income or loss of the Group’s operating department is evaluated with net income before tax
and is served as the basis for evaluating performance. The Group has not allocated assets and
liabilities to the departments that shall be reported. For the accounting policy of the operating
department, please refer to the illustration of Note 4. The reported amount is consistent with that
reported by the operation decision maker.
The Group’s operating segments financial information and adjustments were as follows: For the Year Ended December 31, 2018
Taipei
Department
Overseas
Department
Taichung
Department
Adjustments
and
elimination
Total
Operating revenue:
Revenue from external customers $ 2,969,479 4,165,601 1,409,587 - 8,544,667
Inter-segment revenue 406,632 336,228 146,785 (889,645) -
$ 3,376,111 4,501,829 1,556,372 (889,645) 8,544,667
Reportable segment profit (loss) $ 256,448 330,095 66,816 - 653,359
Reportable segment asset $ 4,948,490
For the Year Ended December 31, 2017
Taipei
Department
Overseas
Department
Taichung
Department
Adjustments
and
elimination
Total
Operating revenue:
Revenue from external customers $ 2,610,734 3,845,870 1,215,732 - 7,672,336
Inter-segment revenue 429,506 341,076 - (770,582) -
$ 3,040,240 4,186,946 1,215,732 (770,582) 7,672,336
Reportable segment profit (loss) $ 162,309 242,395 70,955 754 476,413
Reportable segment asset $ 4,649,175

TOPCO TECHNOLOGIES CORP. AND SUBSIDIARIES
Notes to the Consolidated Financial Statements
181
(a)Imformation about the products
Imformation about the Group’s revenue from external customers was as follows: Products 2017
Chemical materials and related goods $ 6,456,604
Standard trading 1,215,528
Others 204
$ 7,672,336
Imformation about the Group’s revenue from external customers for the year ened December
31, 2018, please refer to Note 6(18).
(b) Geographical information
In presenting information on the basis of geograghy, segment revenue is based on the
geographical location of customers and segment assets that are based on the geographical
location of the assets.
(i)Revenue from external customers for ther year 2017: Geograghy 2017
Mainland China $ 4,632,637
Taiwan 2,817,291
Others 222,408
$ 7,672,336
Imformation about the Group’s revenue from external customers for the year ened
December 31, 2018, please refer to Note 6(r).
(ii)Non-current assets:
Geograghy December
31,2018 December
31,2017
Taiwan $ 231,466 230,869
Mainland China 7,209 8,187
$ 238,675 239,056
(iii) Revenue from main customers
Business of the Group has gained no operating income with customers with more than
10% of the income as stated in the consolidated comprehensive profit or loss table in
2018 and 2017.

182
Independent Auditors’ Report
To the Board of Directors of Topco Technologies Corporation:
Opinion
We have audited the parent-company-only financial statements of Topco Technologies
Corporation(“the Company”), which comprise the balance sheet as of December 31, 2018 and 2017
and the statement of comprehensive income, changes in equity and cash flows for the years ended
December 31, 2018 and 2017, and notes to the financial statements, including a summary of significant
accounting policies.
In our opinion, the accompany parent-company-only financial statements present fairly, in all material
respects, the financial position of the Company as at December 31, 2018 and 2017, and its financial
performance and its cash flows for the years ended December 31, 2018 and 2017 in accordance with
the Regulations Governing the Preparation of Financial Reports by Securities Issuers.
Basis for Opinion
We conducted our audit in accordance with the “Regulations Governing Auditing and Attestation of
Financial Statements by Certified Public Accountants” and the auditing standards generally accepted
in the Republic of China. Our responsibilities under those standards are further described in the
Auditor’s Responsibilities for the audit of the Financial Statements section of our report. We are
independent of the company accordance with the Certified Public Accounts Code of Professional
Ethics in Republic of China(“the Code”), and we have fulfilled our other ethical responsibilities in
accordance with the Coed. We believe that the audit evidence we have obtained is sufficient and
appropriate to provide a basis of our opinion.
Key Audit Matters
Key audit matters are those matters that, in our professional judgment, were of most significance in
our audit of the financial statements of the current period. These matters were addressed in the context
of our audit of the financial statements as a whole, and in forming our opinion thereon, and we do not
provide a separate opinion on these matters. Key audit matters for the Company's financial statements
are stated as follows:
1.Valuation of Inventories
Please refer to Note 4 (g) Inventory of the individual financial statements for details of the
accounting policy concerning inventory evaluation, Note 5 of the individual financial statements for
uncertainties in the inventory valuation, and Note 6 (g) Inventory of the individual financial
statements for the explanation of inventory.
The Company measured the cost and net realizable value of inventory. Since the principal business
of the Company is the import and export of chemical material-related commodities, there is a risk
that the book value of inventory may exceed its net realizable value because of the fluctuation of the
commodity sales price due to changes in the supply and market competition. Inventory valuation is
therefore one of the important valuation items in our financial statement audit.

183
How the matter is address in our audit:
Our main audit procedures of the above-mentioned key audit matters include examining whether
the inventory valuation policy of the Company is handled in accordance with the requirements of
the IAS2. In addition, the inventory age report is reviewed, the age changes of inventory of each
period are checked, an interval classification test of the inventory age report is performed, and a
spot-check process is performed to check the sales prices adopted by the Company and assess the
reasonableness of the net realization value of inventory.
2.Valuation of Receivables
Please refer to Note 4(vi)(f) Amortization of Financial Assets of the financial statements for the
accounting policies concerning the valuation of receivables, Note 5 of the financial statements for
uncertainties in the valuation of receivables, Note 6(e) Notes and Accounts Receivables and
Other Receivables of the financial statements for the explanation of valuation of receivables.
Description of the Key Audit Matters:
The valuation of receivables is based on lifetime expected credit loss of objective evidence
showing the recoverability of accounts receivables, so that the provision for losses can be made
accordingly. Due to the large number of customers of the Company, the recoverability of
receivables is affected by factors such as the customers’ operating conditions, external industrial
environment and economic conditions. Therefore, the valuation of receivables is one of the
important valuation items for our audit of the financial statements.
How the matter is address in our audit:
Our main audit procedures of the key audit matters above include examining whether the
valuation policy of the receivables of the Company is handled in accordance with the
requirements of the Communiqué, understanding the overdue reasons and the status of the
after-sales collections for accounts with long overdue days, and assessing the reasonableness of
the management's estimates of allowances for receivables.
Responsibilities of Management and Those Charged with Governance for the Financial Statements
Management is responsible for the preparation and fair presentation of the financial statements in
accordance with Regulations Governing the Preparation of Financial Reports by Securities Issuers and
for such internal control as management determines is necessary to enable the preparation of financial
statements that are free from material misstatement, whether due to fraud or error.
In preparing the financial statements, management is responsible for assessing the Company’ s ability
to continue as a going concern, disclosing, as applicable, matters related to going concern and using
the going concern basis of accounting unless management either intends to liquidate the Company or
to cease operations, or has no realistic alternative but to do so.
Those charged with governance (including the Supervisors) are responsible for overseeing the
Company’s financial reporting process.

184
Auditors’ Responsibilities for the Audit of the Financial Statements
Our objectives are to obtain reasonable assurance about whether the financial statements as a whole
are free from material misstatement, whether due to fraud or error, and to issue an auditor’s report that
includes our opinion. Reasonable assurance is a high level of assurance, but is not a guarantee that an
audit conducted in accordance with the auditing standards generally accepted in the Republic of China
will always detect a material misstatement when it exists. Misstatements can arise from fraud or error
and are considered material if, individually or in the aggregate, they could reasonably be expected to
influence the economic decisions of users taken on the basis of these financial statements.
As part of an audit in accordance with auditing standards generally accepted in the Republic of China,
we exercise professional judgment and maintain professional skepticism throughout the audit. We
also:
1. Identify and assess the risks of material misstatement of the financial statements, whether due to
fraud or error, design and perform audit procedures responsive to those risks, and obtain audit
evidence that is sufficient and appropriate to provide a basis for our opinion. The risk of not
detecting a material misstatement resulting from fraud is higher than for one resulting from error,
as fraud may involve collusion, forgery, intentional omissions, misrepresentations, or the override
of internal control.
2. Obtain an understanding of internal control relevant to the audit in order to design audit procedures
that are appropriate in the circumstances, but not for the purpose of expressing an opinion on the
effectiveness of the Company’s internal control.
3. Evaluate the appropriateness of accounting policies used and the reasonableness of accounting
estimates and related disclosures made by management.
4. Conclude on the appropriateness of management’s use of the going concern basis of accounting and,
based on the audit evidence obtained, whether a material uncertainty exists related to events or
conditions that may cast significant doubt on the Company’s ability to continue as a going concern.
If we conclude that a material uncertainty exists, we are required to draw attention in our auditor’s
report to the related disclosures in the financial statements or, if such disclosures are inadequate, to
modify our opinion. Our conclusions are based on the audit evidence obtained up to the date of our
auditor’s report. However, future events or conditions may cause the Company to cease to continue
as a going concern.
5. Evaluate the overall presentation, structure and content of the financial statements, including the
disclosures, and whether the financial statements represent the underlying transactions and events in
a manner that achieves fair presentation.
6. Obtain sufficient appropriate audit evidence regarding the financial information of the investment in
other entities accounted for using the equity method to express an opinion on this financial
statements. We are responsible for the direction, supervision and performance of the audit. We
remain solely responsible for our audit opinion.
We communicate with those charged with governance regarding, among other matters, the planned
scope and timing of the audit and significant audit findings, including any significant deficiencies in
internal control that we identify during our audit.

185
We also provide those charged with governance with a statement that we have complied with relevant
ethical requirements regarding independence, and to communicate with them all relationships and
other matters that may reasonably be thought to bear on our independence, and where applicable,
related safeguards.
From the matters communicated with those charged with governance, we determine those matters that
were of most significance in the audit of the financial statements of the current period and are therefore
the key audit matters. We describe these matters in our auditor’s report unless law or regulation
precludes public disclosure about the matter or when, in extremely rare circumstances, we determine
that a matter should not be communicated in our report because the adverse consequences of doing so
would reasonably be expected to outweigh the public interest benefits of such communication.
The engagement partners on the audits resulting in this independent auditors’ report are Jui-Lan, Lo
and I-Wen, Wang.
KPMG
Taipei, Taiwan(Republic of China)
March 4, 2019
Notes to Readers
The accompanying financial statements are intended only to present the statements of financial position, financial
performance and cash flows in accordance with accounting principles generally accepted in the Republic of China and not
those of any other jurisdictions. The standards, procedures and practices to review such financial statements are those
generally accepted and applied in the Republic of China.
The independent auditors’ report and the accompanying financial statements are the English translation of Chinese version
prepared and used in Republic of China. If there is any conflict between, or any difference in the interpretation of English
and Chinese language auditors’ report and financial statements, the Chinese version shall prevail.

186
(English Translation of Financial Statements and Reporting Originally Issued in Chinese)
Topco Technologies Corporation Balance Sheet
December 31, 2018 and 2017 (EXPRESSED IN THOUSANDS OF NEW TAIWAN DOLLARS)
December 31,2018 December 31,2017 December 31, 2018
December 31, 2017
Assets Amount % Amount % Liabilities and Owner’s Equity Amount % Amount %
Current assets: Current liabilities:
1100 Cash and cash equivalents (note 6(a)) $ 372,193 9 $ 343,847 9 2170 Notes and accounts payable $25,931 2 $ 33,598 1
1110 Current financial assets at fair value
through profit or loss (note 6(b))
18 1 30,406 1 2180 Notes and accounts payables -
Related parties (note7)
362,899 9 366,782 10
1170 Notes and accounts receivable, net
(note 6(e))
711,830 17 728,764 19 2200 Other payables (note 7) 293,319 7 209,404 5
1180 Accounts receivables from related
parties, net (notes 6(e) and 7)
108,945 3 100,156 3 2230 Current tax liabilities 50,015 1 24,322 1
1476 Other current financial assets (notes
6(6) and 7)
3,545 - 3,455 - 2130 Current contract liabilities(note
6(q))
1,309 - - -
1300 Inventories- Merchandising (note 6(g)) 235,423 6 182,166 5 2300 Other current liabilities - - 9,208 -
1470 Other current assets (note 7) 3,491 - 2,652 - 733,473 19 643,314 17
1,435,445 35 1,391,446 37 Non-current liabilities:
Deferred tax liabilities (note
6(m))
86,666 2 71,544 2
Non-current assets: 2570 Total liabilities $820,139 21 $714,858 19
1517 Non-current financial assets at fair value
through other comprehensive income
190,741
5
-
-
1523 Non-current available-for-sale
financial assets (note6(d))
- - 174,185 5
3100
Equity:
Capital stock (note 6(n))
640,610 16 641,060 17
1550 Investment using equity method (note
6(h))
2,354,774 58 2,124,671 56 3200 Capital surplus (notes 6(n) and
6(o))
954,075 23 986,344 26
1600 Property, plant and equipment (note 6(i)) 78,863 2 76,459 2 3300 Retained earnings (note 6(n)) 1,688,012 41 1,457,592 39
1975 Net defined benefit asset - non-current
(note6(l))
2,119 - 2,516 - 3400 Other equity interest (note 6(o)) (29,971) (1) (20,203) (1)
1840 Deferred tax assets (note 6(m)) 4,013 - 3,212 -
1900 Other non-current assets 6,910 - 7,112 - Total equity 3,252,726 79 3,064,743 81
2,637,420 65 2,388,155 63
Total Assets $ 4,072,865 100 $ 3,779,601 100 Total liabilities and equity $4,072,865 100 $3,779,601 100
(Please see the accompanying notes to the financial statements.)

187
(English Translation of Financial Statements and Reporting Originally Issued in Chinese)
Topco Technologies Corporation
Comprehensive Income Statement
For the years ended December 31, 2018 and 2017
(Expressed in Thousands of New Taiwan Dollars, Except for Earnings Per Common Shares)
(Please see the accompanying notes to the financial statements.)
2018 2017
Amount % Amount %
4100 Operating revenue ( notes 6(g) and 7) $3,376,111 100 $ 3,040,240 100
5000 Operating costs (notes 6(d) and 7) 2,653,103 79 2,454,788 81
Gross profit 723,008 21 585,452 19
5910 Unrealized profit (loss) from sales (608) - (770) -
722,400 21 584,682 19
Operating expenses (notes 6(h), 6(i), 6(l), 7 and 12):
6100 Selling expenses 253,105 7 219,933 7
6200 Administrative expenses 230,899 7 187,788 6
6450 Impairment loss (impairment gain and reversal of impairment
loss) determined in accordance with IFRS 9
(47)
-
-
-
483,957 14 407,721 13
Net operating income 238,443 7 176,961 6
Non-operating income and expenses:
7100 Interest revenue 648 - 566 -
7230 Foreign exchange gains(losses) 3,285 - (7,853) -
7235 Gains on financial assets (liabilities) at fair value through profit
or loss
(522) - 867 -
7375 Share of income of subsidiaries, affiliates and joint ventures
recognized by equity method
282,071 8 218,543 7
7510 Interest expense (81) - (30) -
7670 Impairment loss - - (23,400) (1)
7020 Other interests and losses (note 7) 14,675 - 15,198 -
300,076 8 203,891 6
7900 Income before income tax 538,519 15 380,852 12
7950 Less: Income tax expense (note 6 (j)) 75,277 2 30,714 1
8200 Net income $ 463,242 13 $ 350,138 11
8300 Other comprehensive income :
8310 Components of other comprehensive income that will not be
reclassified to profit or loss
8311 Remeasurements of defined benefit plans (note 6 (i)) 182 - (448) -
8349 Less: Income tax related to components of other comprehensive
income that will not be reclassified to profit or loss (Note 6 (i))
- - - -
182 - (448) -
8360 Components of other comprehensive income that will be
reclassified to profit or loss
8361 Exchange differences on translation of financial statements (19,579) (1) (59,721) (2)
8362 Unrealized gains (losses) on valuation of available-for-sale
financial assets
- - 73,567 2
8363 Gains(Loss)on financial assets at fair value through other
comprehensive income
16,556 -
8380 Shares of other comprehensive income of subsidiaries,
associates and joint ventures accounted for using equity method
230 - (800) -
8300 Total other comprehensive income (2,611) (1) 12,598 -
8500 Total comprehensive income $ 460,631 12 $ 362,736 11
Earnings per share (in dollars),(note 6 (m)):
9750 Basic earnings per share $ 7.41 $ 5.65
9850 Diluted earnings per share $ 7.32 $ 5.47

188
(English Translation of Financial Statements and Reporting Originally Issued in Chinese)
Topco Technologies Corporation
Statement of Changes in Equity
For the Years Ended December 31, 2018 and 2017 (Expressed in Thousands of New Taiwan Dollars)
Retained earnings Other equity interests
Capital
Capital
surplus
legal
reserve
Special
reserve
Unappropriated retained
earnings
Total
Exchange
differences on
translation of
foreign financial
statements
Unrealized gains
(losses) on
financial assets measured at fair
value through
other comprehensive
income
Unrealized
gains or losses on
available-f
or-sale financial
asset
Unearned compensation
for restricted
employee shares of
stock
Others
Total other
equity
interests
Total
equity Balance on January 1, 2017 $641,010 986,645 467,405 6,363 890,538 1,364,306 (24,746) - 7,464 (38,633) 458 (55,457) 2,936,554 Appropriation of earnings: Legal reserve - - 29,005 - (29,005) - - - - - - - - Special reserve - - - 10,461 (10,461) - - - - - - - - Cash dividend for common stock - - - - (256,404) (256,404) - - - - - - (256,404)
Retirement of employees restricted shares (50) (301) - - - - - - - 236 - 236 (115)
Compensation cost of issuing restricted
employee shares
- - - - - - - - - 21,972 - 21,972 21,972
641,010 986,344 496,410 16,824 594,668 1,107,902 (24,746) - 7,464 (16,425) 458 (33,249) 2,702,007 Net profit for the period - - - - 350,138 350,138 - - - - - - 350,138
Other comprehensive income (loss) - - - - (448) (448) (59,721) - 73,567 - (800) 13,046 12,598 Total comprehensive income for the period - - - - 349,690 349,690 (59,721) - 73,567 - (800) 13,046 362,736
Balance on December 3 1,2017 641,010 986,344 496,410 16,824 944,358 1,457,592 (84,467) - 81,031 (16,425) (342) (20,203) 3,064,743
Effects of retrospective application 23,400 23,400 57,631 (81,031) - (23,400) - Balance at January 1, 2018 after adjustments 641,010 986,344 496,410 16,824 967,758 1,480,992 (84,467) 57,631 - (16,425) (342) (43,603) 3,064,743
Appropriation and distribution of earnings: Legal reserve - - 35,014 (35,014) - - - - - - - - Special reserve - - - (10,461) 10,461 - - - - - - - - Cash dividends of ordinary share (256,404) (256,404) - - Cash dividends from capital surplus - (38,461) - - - - - - - - - - (38,461)
Compensation cost of issuing shares - 8,600 - - - - - - - - - - 8,600
Retirement of employees restricted shares (400) (2,408) - - - - - - - 1,888 - 1,888 (920)
Compensation cost of issuing restricted
employee shares
- - - - - - - - - 14,537 - 14,537 14,537
640,610 954,075 531,424 6,363 686,801 1,224,588 (84,467) 57,631 - - (342) (27,178) 2,792,095 Net income - - - - 463,242 463,242 - - - - - 463,242 Other comprehensive income (loss) - - - - 182 182 (19,579) 16,556 - - 230 (2,793) (2,611)
Total comprehensive income - - - - 463,424 463,424 (19,579) 16,556 - - 230 (2,793) 460,631
Balance on December 3 1,2018 $640,610 954,075 531,424 6,363 1,150,225 1,688,012 (104,046) 74,187 - - (112) (29,971) 3,252,726
(Please see the accompanying notes to the financial statements.)

189
(English Translation of Financial Statements and Reporting Originally Issued in Chinese)
Topco Technologies Corporation
Statement of Cash Flows
For the Years Ended December 31, 2018 and 2017 (Expressed in Thousands of New Taiwan Dollars)
2018 2017
Cash flows from operating activities:
Income before income tax $ 538,519 $ 380,852
Adjustments :
Adjustments to reconcile profit (loss)
Depreciation expense 1,953 2,383
Amortization expense 639 353
Bad debts Expense(reversal of bad debts) (47) (90)
Net loss (gain) on financial assets or liabilities at fair value through profit or loss 30,388 (254)
Impairment loss - 23,400
Interest revenue (648) (566)
Interest expense 81 30
Share-based payments 23,137 21,972
Share of loss (profit) of associates and joint ventures accounted for using equity method (282,071) (218,543)
(Unrealized) profit (loss) from sales 608 770
Total adjustments to reconcile profit (loss) (225,960) (170,545)
Change in operating assets and liabilities:
Change in operating assets:
Decrease (increase) in financial assets at fair value through profit or loss - (30,201)
Decrease (increase) in notes and accounts receivable (including related parties) 8,192 (118,544)
Decrease (increase) in other financial assets (90) 249
Decrease (increase) in inventory (53,257) (11,400)
Decrease (increase) in other current assets (839) 348
Others 579 558
(45,415) (158,990)
Change in operating liabilities:
Increase (decrease) in notes and accounts payable (including related parties) (11,550) 34,671
Increase (decrease) in other accounts payable and other current liabilities 74,707 58,681
Increase (decrease) in contract liabilities-current 1,309 -
64,466 93,352
Total change in operating assets and liabilities 19,051 (65,638)
Total adjustments (206,909) (236,183)
Cash inflow (outflow) from operating activities 331,610 144,669
Interests received 648 566
Dividends received 32,011 27,439
Interests paid (81) (30)
Income tax paid (35,263) (22,402)
Net cash inflows (used in) from operating activities 328,925 150,242
Cash flows from(used in) investment activities:
Acquisition of financial assets available for sale – non-current - (4,954)
Acquisition of property, plant and equipment (4,357) (216)
Decrease (increase) in guarantee deposits (26) 1,470
Decrease (increase) in other prepayments (411) (639)
Net cash inflows (used in) from investment activities (4,794) (4,339)
Cash flows from(used in)financing activities:
Distribution of cash dividend (294,865) (256,404)
Return of Restricted Stock Awards (RSA) (920) (115)
Net cash flows from financing activities (295,785) (256,519)
Increase (decrease) in cash and cash equivalents for the period 28,346 (110,616)
Cash and cash equivalents at the beginning of the period 343,847 454,463
Cash and cash equivalents at the end of the period $372,193 $343,847
(Please see the accompanying notes to the financial statements.)

190
(English Translation of Financial Statements and Report Originally Issued in Chinese)
Topco Technologies Corporation
Notes to Financial Statements
For the years ended December 31, 2018 and 2017
(Expressed in Thousands of New Taiwan Dollars, Unless Otherwise Specified)
(1) Company history
Topco Technologies Corp. (the “Company”) was incorporated in February 1994, as a company
limited by shares under the law of Republic of China(R.O.C) . Its register address is 14F., No.102,
Sec. 4, Civic Blvd., Da’an Dist., Taipei City 106, Taiwan (R.O.C.). It was formerly named as
Topview Technologies. On July 1, 2004, it absorbed Topco Trading Co., Ltd and was renamed as
Topco Technologies Corp. The electronic group producing and merchandising safety monitor was
then spinoff from Topco as new organization on October 1, 2010. The main operating items of the
Company is import and export business of products related to chemical materials and business of
general trading activities.
(2) Approval date and procedures of the financial statements
The accompanying financial statements of the Company for the years ended December 31, 2018
and 2017 were approved and authorized for issue by the Board of Directors on March 4, 2019.
(3) New standards, amendments and interpretations
(a) The impact of the International Financial Reporting Standards (“IFRSs”) endorsed by the
Financial Supervisory Commission, R.O.C. (“FSC”) which have already been adopted.
The following new standards, interpretations and amendments have been endorsed by the
FSC and effective for annual periods beginning on or after January 1,2018.
New ,Amended or Revised Standards and Interpretations
Effective date
per IASB
Amendments to IFRS 2, “Classification and Measurement of Share-based
Payment Transactions”
January 1, 2018
Amendments to IFRS 4, “Applying IFRS 9 'Financial Instruments' with IFRS
4 'Insurance Contracts'”
January 1, 2018
IFRS 9, “Financial Instruments” January 1, 2018
IFRS 15, “Revenue from Contracts with Customers” January 1, 2018
Amendments to IAS 7, “Disclosure Initiative” January 1, 2017
Amendments to IAS 12, “Recognition of Deferred Tax Assets for Unrealized
Losses”
January 1, 2017
Amendments to IAS 40, “Transfers of Investment Property” January 1, 2018
The annual improvement of IFRS 2014-2016 cycle:
Amendments to IFRS 12 January 1, 2017
Amendments to IFRS 1 and IAS 28 January 1, 2018
IFRIC 22, “Foreign Currency Transactions and Advance Consideration” January 1, 2018

TOPCO TECHNOLOGIES CORPORATION
Notes to the Financial Statements
191
Except for the following items, the Company believes that the adoption of above IFRSs would not
have any material impact on its consolidated financial statements. The extent and impacts of
signification changes are as follows:
(i) IFRS 15, “Revenue from Contracts with Customers”
IFRS 15 establishes a comprehensive framework for determing weather, how much and
when revenue is recognized. It replaces the existing revenue recognition guidance,
including IAS 18”Revenue” and IAS 11”Construction Contracts”. The Company applies
this standard restrospectively with the cumulative effect, it need not restate those contracts,
but instead, continue to apply IAS 11, IAS 18 and the related Interpretations for
comparative reporting period. The Company recognize the cumulative effect upon the
initially application of this Standard as an adjustment to opening balance of retained
earnings on Janiary 1,2018.
The following are the nature and impacts on changing of accounting policies:
1) Sale of goods
Regarding the Company’s sale of goods, currently we recognize revenue when meeting
the criteria that we promise with customers. According to the existing accounting
standards, we recognize revenue when persuasive evidence exists (usually by signing
the sales agreement), when the significant risk and reward in the ownership of goods are
transferred to the buyer, when the amount is very likely to be recovered, when the
transaction-related cost and return of goods that has occurred or is about to occur can be
reliably measured, when we neither continues to participate in the management nor
maintains effective control on the goods sold, and when the revenue can be reliably
measured. Under IFRS 15, revenue will be recognized when a customer obtains control
of the goods.
2) Impacts on financial statements
The following tables summarize the impacts of adopting IFRS 15 on the financial
statements: Dcember 31, 2018 January 1, 2018
Impacted items in the consolidated
balance sheet
Balances
prior to the
adoption of
IFRS15
Impact of
changes in
accounting
policies
Balances
upon
adoption of
IFRS15
Balances
prior to the
adoption of
IFRS15
Impact of
changes in
accounting
policies
Balances
upon
adoption of
IFRS15
Contract liability -non-current $ - 1,309 1,309 - 9,180 9,180
Other current liabilities 1,309 (1,309) - 9,208 (9,180) 28
Affected liabilities - -
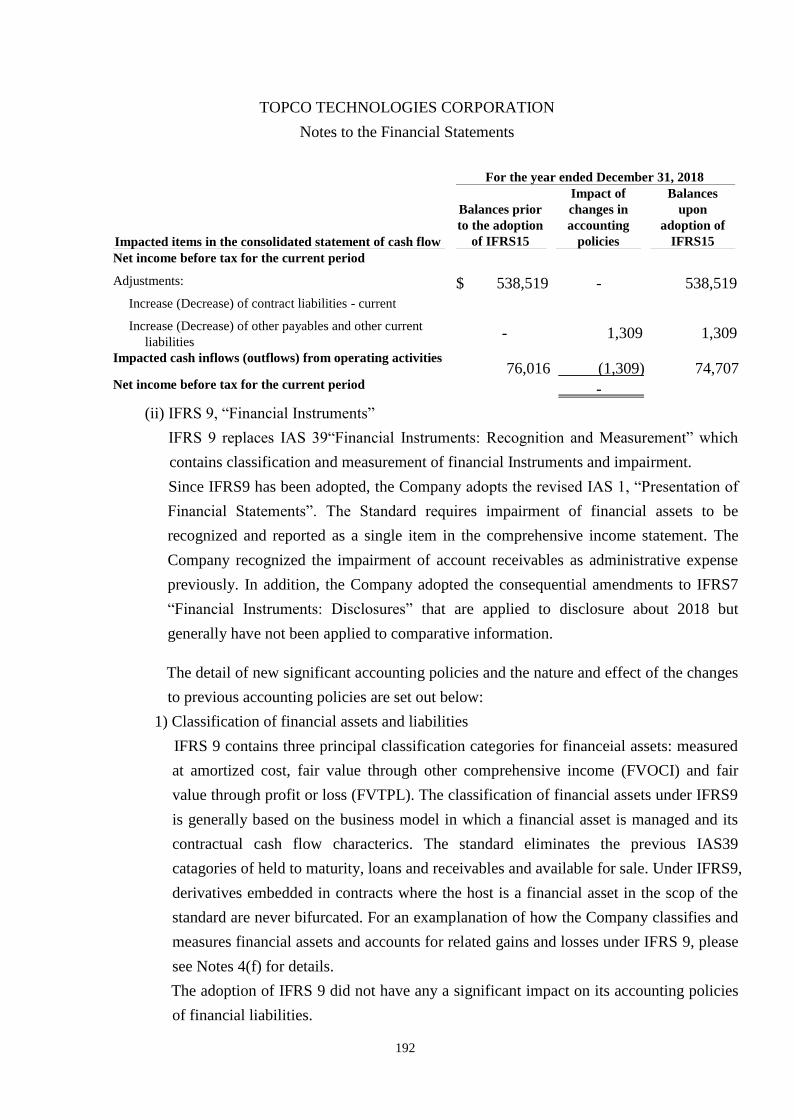
TOPCO TECHNOLOGIES CORPORATION
Notes to the Financial Statements
192
For the year ended December 31, 2018
Impacted items in the consolidated statement of cash flow
Balances prior
to the adoption
of IFRS15
Impact of
changes in
accounting
policies
Balances
upon
adoption of
IFRS15
Net income before tax for the current period
Adjustments: $ 538,519 - 538,519
Increase (Decrease) of contract liabilities - current
Increase (Decrease) of other payables and other current
liabilities - 1,309 1,309
Impacted cash inflows (outflows) from operating activities 76,016
(1,309)
74,707
Net income before tax for the current period -
(ii) IFRS 9, “Financial Instruments”
IFRS 9 replaces IAS 39“Financial Instruments: Recognition and Measurement” which
contains classification and measurement of financial Instruments and impairment.
Since IFRS9 has been adopted, the Company adopts the revised IAS 1, “Presentation of
Financial Statements”. The Standard requires impairment of financial assets to be
recognized and reported as a single item in the comprehensive income statement. The
Company recognized the impairment of account receivables as administrative expense
previously. In addition, the Company adopted the consequential amendments to IFRS7
“Financial Instruments: Disclosures” that are applied to disclosure about 2018 but
generally have not been applied to comparative information.
The detail of new significant accounting policies and the nature and effect of the changes
to previous accounting policies are set out below:
1) Classification of financial assets and liabilities
IFRS 9 contains three principal classification categories for financeial assets: measured
at amortized cost, fair value through other comprehensive income (FVOCI) and fair
value through profit or loss (FVTPL). The classification of financial assets under IFRS9
is generally based on the business model in which a financial asset is managed and its
contractual cash flow characterics. The standard eliminates the previous IAS39
catagories of held to maturity, loans and receivables and available for sale. Under IFRS9,
derivatives embedded in contracts where the host is a financial asset in the scop of the
standard are never bifurcated. For an examplanation of how the Company classifies and
measures financial assets and accounts for related gains and losses under IFRS 9, please
see Notes 4(f) for details.
The adoption of IFRS 9 did not have any a significant impact on its accounting policies
of financial liabilities.

TOPCO TECHNOLOGIES CORPORATION
Notes to the Financial Statements
193
2) Impairments of financial assets
IFRS 9 replaces the “incurred loss” model in IAS39 with the “expected credit loss”
(ECL) model. The new impairment model applies to financial assets evaluated at
amortized cost, contract assets and debt investments at fair value through other
comprehensive income, but not to investments in equity instrument. Under IFRS9, the
credit losses are recognized earlier than thay are under IAS39. Please see Note 4(g) for
details.
3) Transition
The adoption of IFRS 9 has been applied retrospectively, except as described blow:
‧Differences in the carring amount of financial assets and financial liabilities resulting
from the adoption of IFRS 9 are recognized in retained earnings and other equity on
January 1, 2018.Accordingly, the information presented in 2017 does not generally
reflect the requirements of IFRS9. Thus, they are not comparable with the information
disclosed under IFRS 9 in 2018.
‧The following assessments have been made on the basis of the facts and circumstances
that existed at the date of initial application:
– The determination of the business model within which the financial asset is held.
– The designation and revocation of previous designation of the financial assets and
liabilities as measured at FVTPL.
– The designation of certain investments in equity instruments not held for trading as
at FVOCI.
‧If the debt security investment had low credit risk at the date of initial application of
IFRS9, then the Company assumed that the credit risk on its asset will not increase
significantly since its initial recognition.
4) Classification of financial assets on the date of initial application of IFRS 9
The following table shows the original measurement categories under IAS39 and
the new measurement categories under IFRS 9 foe each class of the Company’s
financial assets as January 1, 2018.

TOPCO TECHNOLOGIES CORPORATION
Notes to the Financial Statements
194
IAS39 IFRS9
Measurement
Categories Carring Amount
Measurement Categories
Carring Amount
Financial asset
Cash and cash equivalent Loans and receivables
(Note 1)
343,847 Amortized cost 343,847
Debt instruments Designated at fair value
through profit or loss
(Note 2)
30,406 Mandatorily measured at
fair value through
profit or loss
30,406
Notes and accounts receivable
(including related parties)
Loans and receivables
(Note 1)
828,920 Amortized cost 828,920
Other financial assets--current (other receivables)
Loans and receivables
(Note 1)
3,455 Amortized cost 3,455
Equity instrument investments Available-for-sale
financial assets(Note 3)
174,185 Fair Value through other
comprehensive income
174,185
Other non-current assets
(refundable deposit)
Loans and receivables
(Note 1)
6,473 Amortized cost 6,473
Note 1: Under IAS39, cash and cash equivalent, notes and accounts receivable,
other receivable and refundable deposit are classified as loans and
receivables. Now, they are classified as financial assets evaluated at
amortized cost. At initial application of IFRS9, there is no need to
additionally recognize cumulative impairment losses and adjust the
retained earnings on Jan. 1, 2018.
Note 2: Under IAS39, the debt instrument is designated at fair value through profit
or loss. Since the Company manages based on fair value, the financial
asset has been classified as evaluated at fair value through profit or loss in
accordance with IFRS9.
Note 3: The equity instruments (including the financial assets evaluated at cost)
represent investments that the Company intends to hold for the long term
for strategic purposes. As permitted by IFRS9, the Company has
designated these investments at the date of initial application as measured
at FAOCI. Accordingly, a decrease of $23,400 in other equity and an
increase of $23,400 in retained earnings were recognized on January 1,
2018, respectively.

TOPCO TECHNOLOGIES CORPORATION
Notes to the Financial Statements
195
The following tables reconcile the carring amount of financial assets under IAS39 to the
carring amounts under IFRS 9 upon transition toIFRS 9 on January 1,2018:
2017.12.31 2018.1.1 2018.1.1 2018.1.1
IAS 39
Carring
Amount
Reclassifi
cations
Re-
evaluati
ons
IFRS 9
Carring
Amount
Adjustment
amount of
retained
earnings
Adjustment
amount of
other
equities
Financial assets at fair value through other comprehensive income
Beginning balance of FVOCI( IAS 39) $ 174,185 - - - -
Equity instrument investments:
From available for sale - 174,185 - 23,400 (23,400)
Reclassified as evaluated at fair value through other
comprehensive income
Total - (174,185) - - -
$ 174,185 - - 174,185 23,400 (23,400)
(iii) Amendments to IAS 7, “Disclosure Initiative”
The amendments require discloures that enable users of financial statements to evaluate
changes in liabilities arising from financial activities, including both changes arising
from cash flow and non-cash changes.
To satisfy the new disclosure requirements, the Company presents a reconciliation
between the opening and closing balances for liabilities with changes arising from
financing activities as Note 6(v).
(b) The impact of IFRS issued by IASB but not yet endorsed by the FSC
The following new standards, interpretations and amendmends have been endorsed by the
FSC and are effected for annual period beginning on or after January 1, 2019 in accordance
with Ruling No.1070324857 issued by FSC on July 17, 2018 :
New, Amended or Revised Standards and Interpretations
Effective date
per IASB IFRS 16, “Leases” January 1, 2019
IFRIC 23, “Uncertainty over Income Tax Treatments” January 1, 2019
Amendments to IFRS 9, “Prepayment Features with Negative Compensation”
January 1, 2019
Amendments to IAS 19, “Plan Amendment, Curtailment or Settlement” January 1, 2019
Amendments to IAS 28, “Long-term Interests in Associates and Joint Ventures”
January 1, 2019
The annual improvement of IFRS 2015-2017 cycle January 1, 2019

TOPCO TECHNOLOGIES CORPORATION
Notes to the Financial Statements
196
Except for the following items, application of the aboved IFRS will not cause significant
impact on the consolidated financial statements. The extent and impact of the significant
changes are as below:
(i) IFRS 16, “Leases”
IFRS 16 replaces the existing lease guidance, including IAS 17 “Lease”,IFRIC 4
“Determining whether an Arrangement contains a Lease” ,SIC-15 “Operating Leases –
Incentives” and SIC 27, “Evaluating the Substance of Transactions in the Legal Form of
a Lease.”
IFRS16 introduces a single and an on-balance sheet lease accounting model for leases. A
lease recognizes a right-of-use asset represating its right to use the underlying asset and a
lease liability representing its obligation to make lease payments. In addition, the
expenses related to the lease will now be changed since IFRS 16 replaces the straight-line
operating lease expense with a depreciation charge foe right-to-use assets and interest
expense on lease liabilities. There are recognition examptions for short-term leases and
lease of low-value items. The accounting principles regarding the lessor remain similar to
the existing Standards. That is, the lessor shall still classify lease into operating lease or
finance lease.
1) Determing wheather an arrangement contains to lease
On transition to IFRS16, the Company can choose to apply either of the following:
‧apply IFRS 16 definition of a lease to all contracts; or
‧apply a pratical expendient that does not need any reassessment weather a contract is,
or contains, a lease.
The Company expects to adopt expedient procedures and exempt from the re-evaluation
of lease definition during the transfer. This meas the Company will identify the
contracts it entered into before January 1,2019 as lease in accordance with IAS17 and
IFRIC 4.
2) Transition
As a lease, the Company can either apply the standard using the following:
‧restropective approach;or
‧modified restropective approach with optional practical expedients
On January 1, 2019 the Company plans to initially apply IFRS16 using the modified
restropective approach. Accordingly, the cumulative effects of adopting IFRS16 will be
recognized as an adjustment to the opening balance of retained earnings at January 1,
2019, with no restatement of comparative information.

TOPCO TECHNOLOGIES CORPORATION
Notes to the Financial Statements
197
When applying the modified retrospective approach to lease previously claasified as
operating lease under IAS17, the lease can elect, on a lease-by-lease basis, weather to
apply a number of pratical expendients on transition. The Company assessment adopts
the following practical expediencies:
‧Targeting lease portfolios with similar characteristics, a single discount rate shall
apply;
‧Just before the first applicable date, the IAS37 Onerous Contract assessment results
shall serve as the alternative method for assessing appropriate rights asset
impairment.
‧Targeting leases to expire within twelve months after the first appropriative date
during the lease period, appropriative right assets and lease obligations applicable for
exemptions without recognition.
‧Not inclusive of original and direct costs in the appropriative right asset measurement
on the first applicable date.
‧The lease contract shall include the lease period determination through hindsight under
a lease extension or termination option.
3) The material impact identified is that the Company will have to recognize the additional
right-of-use assets and lease liabilities for its offices, public vehicles, and warehouse
which were currently accounted for under the operating lease. The aforementioned
impact would lead to the increase in right-of-use assets and lease liabilities by 45,651,
respectively. The Company does not expect the adoption of IFRS16 to have any impact
on its ability to comply with the maximum laverage threshold in the loan covenant.
(ii) IFRIC 23, “Uncertainty over Income Tax Treatments”
In assessing wheather and how an uncertain tax treatment affects the determination of
taxable profit (tax loss), tax bases, unused tax credits, as well as tax rates, an entity shall
assume that taxation authority will examine the amounts it has the right to examine and
have a full knowledge on all related information when making those examinations.
If an entity concludes that it is probable that the taxation authority will accept an
uncetain tax treatment, the entity shall determine the tax profit(tax loss),tax bases,
unused tax losses,unused tax credits, as well as tax rates consistently with the tax
treatment used or planned to be used in its income tax filing.Otherwise, an entity shall
reflect the effect of uncertainty for reach uncertain tax treatment by using either the most
likely amount or the expected value, depending on which method the entity expects to
better predict the resolution of the uncertainty.

TOPCO TECHNOLOGIES CORPORATION
Notes to the Financial Statements
198
Up to now, the Company has deferred income tax liabilities and retained earnings on
January 1st, 2019 have not exerted a major influence.
The aforementioned estimated situation of influence in the new bulletin may change with
the future environment or situation.
(c) The impact of IFRS issued by IASB but not yet endorsed by the FSC
As of the date, the following IFRSs have been issued by the IASB, but have yet to be
endorsed by the FSC:
New ,Amended or Revised Standards and Interpretations Effective date
per IASB Amendments to IFRS 3, “Definition of a business” January 1, 2020
Amendments to IFRS 10 and IAS 28 — Sales or contributions of assets between an investor and its associate orjoint venture
Effective date to be determined by IASB
IFRS 17, “Insurance Contracts” January 1, 2021
Amendments to IAS 1 and IAS 8— The definition of material. January 1, 2020
Those which may be relevant to the Company are set out below:
Issuance /
Release Dates
Standards or Interpretations
Content of amendment October 31,2018 Amendments to IAS 1 and
IAS 8— The definition of material.
Elaborate on the definition of materiality and how to apply the materiality guidelines mentioned in the existing criteria. Materiality definition related explanations are improved to ensure the consistency of materiality in all the criteria.
The Company is evaluating the impact on its consolidated financial position and
consolidated financial performance upon the initial adoption of the abovementioned
standards or interpretations. The results thereof will be disclosed when the Company
completes its evaluation.
(4) Summary of significant accounting policies
The significant accounting policies presented in the financial statements are summarized as
follows. And the accounting policies have been applied consistently to all periods presented in
these financial statements.
(a) Statement of compliance
The accompanying financial statements have been prepared in accordance with the
Guidelines Governing the Preparation of Financial Reports by Securities Issuers.

TOPCO TECHNOLOGIES CORPORATION
Notes to the Financial Statements
199
(b) Basis of preparation
(i) Basis of measurement
The financial statements have been prepared on historical cost basis, except for the
following material items in the statement of financial position.
1) Financial instruments measured at fair value through profit or loss, including derivative
financial instrument
2) Financial assets at fair value through other comprehensive income (Available-for-sale
financial assets )
3) The net defined benefit liabilities are measured as the fair value of the plan assets, less
the present value of the defined benefit obligation and the maximum number of
influences mentioned in Note 4 (o).
(ii) Functional and presentation currency
The functional currency of the Company is determined based on the primary economic
environment in which the entities operate. The consolidated financial statements are
presented in New Taiwan Dollar, which is the Company’s functional currency. All
financial information presented in New Taiwan Dollar has been rounded to the nearest
thousand.
(c) Foreign currency
(i) Foreign currency transaction
Transactions in foreign currencies are translated to the respective functional currency of
the Company at exchange rates at the dates of the transactions. Monetary assets and
liabilities denominated in foreign currencies at the reporting date are retranslated to the
functional currency at the exchange rate at that date. The foreign currency gain or loss on
monetary assets and liabilities is the difference between amortized cost in the functional
currency at the beginning of the period, adjusted for the effective interest and payments
during the period, and such assets and liabilities reported in foreign currency translated at
the exchange rate at the end of the reporting period. Foreign currency denominated
non-monetary assets and liabilities measured at fair value are retranslated to the functional
currency at the exchange rate on the date when fair value was determined. Foreign
currency denominated non-monetary items measured at historical cost is translated using
the exchange rate at the date of the transaction. Foreign currency differences arising on
translation are recognized in profit or loss, except for the equity instrunment at fair value
through other comprehensive income differences which are recognized in other
comprehensive income arising on the transaction.
TOPCO TECHNOLOGIES CORPORATION
Notes to the Financial Statements
200
(ii) Foreign operating institutions
The assets and liabilities of foreign operations, including goodwill and fair value
adjustments arising on acquisition, are translated to the Company’ s functional currency at
exchange rates at the reporting date. The income and expenses of foreign operations,
excluding foreign operations in hyperinflationary economies, are translated to the
Company’s functional currency at average rate. Foreign currency differences are
recognized in other comprehensive income.
When a foreign operation is disposed of such that control, significant influence or joint
control is lost, the cumulative amount in the translation reserve related to that foreign
operation is reclassified to profit or loss as part of the gain or loss on disposal. When the
Company disposes of any part of its interest in a subsidiary that includes a foreign
operation while retaining control, the relevant proportion of the cumulative amount is
reattributed to non-controlling interest. When the Company disposes of only part of
investment in an associate of joint venture that includes a foreign operation while retaining
significant or joint control, the relevant proportion of the cumulative amount is reclassified
to profit or loss.
When the settlement of a monetary item receivable from or payable to a foreign operation
is neither planed nor likely in the foreseeable future, foreign currency gains and losses
arising from such items are considered to form part of a net investment in the foreign
operation and are recognized in other comprehensive income.
(d) Classification standard of current and non-current assets and liabilities
An asset is classified as current under any one of the following conditions. All other assets
are classified as non-current:
i. It is expected to be realized, or intended to be sold or consumed, in the normal operating
cycle;
ii. It is held primarily for the purpose of trading;
iii. It is expected to be realized within twelve months after the reporting period; or
iv. The asset is cash and cash equivalent unless the asset is restricted from being exchanged or
used to settle a liability for at least twelve months after the balance sheet date.
A liability is classified as current under any one of the following conditions. All other
liabilities are classified as non-current.
i. The liability is expected to be settled during the Company’s normal operating cycle;
ii. The liability is held primarily for the purpose of trading;
iii. The liability is due to be settled within twelve months after the reporting period; or

TOPCO TECHNOLOGIES CORPORATION
Notes to the Financial Statements
201
The Company does not have any unconditional right to defer settlement of the liability for
at least twelve months after the reporting period. Terms of a liability that could, at the
option of the counterparty, result in its settlement by issuing equity instruments do not
affect its classification.
(e) Cash and cash equivalents
Cash comprises cash on hand and cash in bank. Cash equivalents are short-term, highly
liquid investments that are readily convertible to known amounts of cash and which are
subject to an insignificant risk of changes in value. Time deposits are held for the purpose of
meeting short-term cash commitments rather than for investment or other purposes are
classified under cash equivalents.
(f) Financial Instruments
(i).Financial asset (applicable from January 1, 2018)
Financial asset are classified into the following categories: measured at amortised cost,
fair value through other comprehensive income (FVOCI) and fair value through profit or
loss (FVTPL).
The Company shall reclassify all affected financial assets only when it changes its
business model for managing its financial asset.
1) Finacial asset measured at amortised cost
A finacial asset is measured at cost if meets both of the following conditions and is not
designated as at FVTPL:
‧The financial asset is held under the business mode targeted at receiving contractual
cash flows.
‧All cash flows of specific date generated by the contract provisions of the financial
asset are for paying the principal and interest of outstanding principal.
A financial asset measured at amortised cost is initially recognized at fiar value plus any
directly attributable transaction cost. These assets are subsequently measured at
amortised cost using the effective interest method. The amortised cost is reduced by
impairment loses. Interest income, foreign exchange gains and loses, and impairment
losses are recognized in profir or loss. Any gain or loss on derecognition is recognized
in profit or loss. A regular way of purchase or sale of financial assets shall be
recognized and derecognized, as applicable, using trade date accounting.
2) Fair value through other comprehensive income (FVOCI)
A debt investment is measured at FVOCI if it meets both of the following conditions
and is not designated as at FVTPL:

TOPCO TECHNOLOGIES CORPORATION
Notes to the Financial Statements
202
‧it is held within a business model whose objective is achieved by both collecting
contractual cash flows and selling financial assets; and
‧its contractual terms give rise on specific dates to cash flows that are soley payments of
principal and interest on the principal amount outstanding.
On initial recognition of an equity investment that is not held for trading, the Company
may irrevocably elect to present subsequent changes in the investment’s fair value in
othe comprehensive income. This election is made on an instrument-by-instrument
basis.
A financial asset measured at FVOCI is initially recognized at fiar value, plus any
directly attributable transaction cost. These assets are subsequently measured at fair
value. Interest income calculated using the effective interest method, foreign exchange
gains and losses, and impairment losses, deriving from debt investments are recognized
in profit or loss; whereas dividends deriving from equity investments are recognized as
income in profit or loss, unless the dividend clearly represents a recovery of part of the
cost of investment. Other net gains and losses of financial assets measured at FVOCI are
recognized in OCI. On derecognition, gains and losses accumulated in OCI of debt
investments are reclassified to profit or loss. However, gains and losses accumulated in
OCI of equity investments are reclassified to retained earnings instead of profit or loss.
Dividend income derived from equity investments is recognized on the date that the
Company’s right to receive payment is established, which in the case of quoted
securities is normally the ex-dividend date.
3) Fair value through profit or loss (FVTPL)
All financial assets not classified as amortized cost or FVOCI described as above are
measured at FVTPL, including derivative financial assets and accounts
receivable.However, for those presented as account receivable but measured at FVTPL.
On initial recognition, the Company may irrevocably designate a financial asset, which
meets the requirements to be measured at amortized cost or at FVOCI, as at FVTPL if
doing so eliminates or significantly reduces an accounting mismatch that would
otherwise arise.
Financial asset in this category are measured at fair value at initial recognition.
Attributable transaction costs are recognized in profit or loss as incurred. Subsequent
changes that are measured at fair value, which take into account any dividend and
interest income, are recognized in profit or loss.
A regular way of purchase or sale of financial assets shall be recognized and
derecognized, as applicable, using trade date accounting.
TOPCO TECHNOLOGIES CORPORATION
Notes to the Financial Statements
203
4) Assessment of operation mode
The Company evaluates the aims of the operation mode of holding financial assets with
combination level. This can mostly reflect management approach and the way of
providing data to the management. The information taken into account includes:
‧ The policy and goal of the mentioned investment portfolio and the operation of the
policy. Including whether the management’s strategy focuses on earning contractual
cash flows, maintaining specific interest yield portfolio, matching the duration of
financial assets and the duration of related liabilities or expected cash outflows, or
realizing cash flows by selling financial assets.
‧ The performance of the operation mode and how to evaluate the financial assets held
under the operation mode, and how to report to the business’ major management
personnel.
‧ The risk affecting the performance of the operation mode (and the financial assets held
under the operation mode) and the management approach of the risk;
‧ The frequency, dollar amount and time point of selling the financial assets in each of the
previous period, the reasons for the sale and the expectation of future selling activities.
According to the above-mentioned operation goal, if the transaction of transferring the
financial asset to the third party does not meet the criteria of derecognition, then they
are do not belong to the sales mentioned above. This is consistent with the Company’s
aim of continuing recognizing the asset.
Financial assets held for trading and financial assets managed and evaluated based on
fair value are evaluated at fair value through income or loss.
5) Assessment whether contractual cash flows are soley payment of principal and interests
For the purpose of this assessment,’principal’ is defined as the fair value of the financial
assets on initial recognition.’Interest’ is defined as consideration for the time value of
money and for the credit risk associated with the principal amount outstanding during a
particular period of time and for other basic leading risks and costs, as well as a profit
margin.
In assessing whether the contractual cash flows are solely payments of principal and
interest, the Company considers the contractual terms of the instrument. This includes
assessing whether the financial asset contains a contractual term that could change the
timing or amount of contractual cash flows such that it would not meet this condition. In
making this assessment, the Company considers:
‧contingent events that would change the amount or timing of cash flows;
‧terms that may adjust the contractual upon rate, including variable rate features;
‧prepayment and extension; and

TOPCO TECHNOLOGIES CORPORATION
Notes to the Financial Statements
204
‧terms that limit the Company’s claim to cash flows from specified assets(e.g.
non-recourse features)
6) Impairment of financial assets
The Company recognizes loss allowance regarding financial assets evaluated at
amortized cost (including cash and cash equivalent, financial assets evaluated at
amortized cost, note and account receivables, other receivables, refundable deposits and
other financial assets, etc.), debt instrument investments evaluated at fair value through
other comprehensive income, account receivables and expected credit loss of contract
assets.
The Company measures loss allowances at an amount equal to lifetime expected credit
loss (ECL), except for the following which are measured as 12-month ECL:
‧Determining that the credit risk of the debt security is low on the reporting day; and
‧The credit risk of other debt securities, other receivable and bank deposits (i.e., the
default risk of the financial instrument during its expected lifetime) has not
significantly increased since initial recognition.
The loss allowance of account receivables and contract assets are measured at an
amount equal to lifetime ECL.
Lifetime ECLs are the ECLs that result from all possible default events over the
expected life of a financial instrument.
12-month ECLs are the portion of ECLs that result from default events that are possible
within the 12 months after the reporting date (or in a shorter period if the expected
lifetime of the instrument is less than 12 months).
The maximum period considered when eatimating ECLs is the maximum contractual
period over which the Company is exposed in credit risk.
When determining whether credit risk of a financial asset has increased significantly
since initial recognition and when eatimating ECL, the Company considers reasonable
and supportable information that is relevant and available without undue cost or effort.
This includes both qualitative and quantitative information and the analysis based on the
Company’s historical experience and informed credit assessment as well as
forward-looking information.
If the credit risk of the financial instrument is equivalent to the global definition of
“investment grade” (which is, or higher than, the BBB rating -of S&P, the Baa3 rating
of Moody’s or the twA rating of Taiwan Ratings), the Company regards the debt
security as having low credit risk.
If the contract payment is more than 30 days past due, the Company would assume the
credit risk of the financial asset has significantly increased.

TOPCO TECHNOLOGIES CORPORATION
Notes to the Financial Statements
205
If the contract payment is more than 360 days past due, or if the borrower is not very
likely to fulfill its obligation by paying the full amount to the Company, the Company
would regard the financial asset as default.
ELCs are the probability weighted estimate of credit loss. Credit losses are measured as
the present value of all cash shortfalls. That is, it is the difference between the cash
flows due to the Company in accordance with the contract and the cash flows that the
Company expects to receive. ECLs are discounted at the effective interest rate of the
financial asset.
At each repotind date, the Company accesses whether the financial assets carried at
amortized cost and debt securities at FVOCI are credit-impairmed. A financial asset is
‘credit-impairmed’ when one or more events that have a determental impact on the
estimated future cash flows of the financial asset have occurred.
The evidence that the financial asset has realized credit-impairmened includes the
observable data related to the following items:
‧Significant financial difficulties of the borrower or the issuer
‧Default, such as delay or overdue over 360 days;
‧Due to the economic or contractual reason related to the borrower’s financial
difficulties, the Company gives the borrower concession that it would not consider
originally;
‧The borrower is very likely to file for bankruptcy or engage in other financial
restructurings; or
‧The active market for the financial asset has disappeared due to financial difficulties.
The asset loss allowance evaluated at amortized cost is deducted from the book value of
the asset. The loss allowance or reversed amount is recognized in the income statement.
For debt securities at FVOCI, the loss allowance is recognized in other comprehensive
income instead of reducing the carring amounts of the assets.
The gross carring amount of a financial asset is written off (either partially or in full) to
the extent that there is no realistic prospect of recovery. This is generally the case when
the Company determines that the debtor does not have assets or sources of income that
could generate sufficient cach flows to repay amounts subject to the write-off.However,
financial assets that are writen off still be subject enforcement activities in order to
comply with the Company’s procedures for recovery of amounts due.

TOPCO TECHNOLOGIES CORPORATION
Notes to the Financial Statements
206
7) Derecognition of financial assets
Financial aseets are derecognized when the contractual rights to the cash flows from the
assets expire, or when the Company transfers substantially all the risks and rewards of
ownership of the financial assets.
When the entire single debt instrument investment is derecognized, the difference
between its book value and the total amount of the consideration that can be collected or
has already been collected plus the amount recognized in other comprehensive income
and accumulated in “other equity – unrealized gains or losses from financial assets
evaluated at fair value through other comprehensive income” is recognized in the
income statement and presented under non-operating revenue and expenditure.
When the entire single debt instrument is not derecognized, the Company allocates the
original book value of that financial asset to the part that is continuously recognized due
to continued participation and the part that is d-recognized, on the basis of the relative
fair value of each part on the transfer day. The difference between any cumulative gain
from the consideration collected from the de-recognized part and the book value
allocated to the part that is de-recognized, or the sum allocated to the de-recognized part
in the loss, is recognized in the income statement, and presented in non-operating gains
and expenditure. Cumulative gains or losses already recognized in other comprehensive
income are allocated to the continuously recognized part and the de-recognized part,
based on the relative fair value.
(ii) Financial assets (applicable before January 1, 2018)
The Company classifies financial assets into the following categories: financial assets at
fair value through profit or loss, loans , receivables and available-for-sale financial
assets.
1) Financial assets at fair value through profit or loss
The financial asstes is acquired principally for the purpose of selling in the short term.
Financial asstes in this category are measured at fair value at initial recognition.
Attributible transaction costs are recognized at profit and loss as incurred. Financial
asstes at fair value through profit or loss are measured at fair value subsequently and
changes therein, which takes into account any dividend and interest income, are
recognized in profit or loss, and accounted for under other income.
2) Available-for-sale financial assets
Available-for-sale financial assets are non-derivative financial assets that are designated
as available-for-sale or are not classified in any of the other categories of financial
assets. Available-for-sale financial assets are recognized initially at fair value plus any

TOPCO TECHNOLOGIES CORPORATION
Notes to the Financial Statements
207
directly attributable transaction cost. Subsequent to initial recognition, they are
measured at fair value and changes therein, other than impairment losses, interest
income calculated using the effective interest method, dividend income, and foreign
currency differences on available-for -sale debt instruments, are recognized in other
comprehensive income and presented in the fair value reserve in equity. When an
investment is derecognized, the gain or loss accumulated in equity is reclassified to
profit or loss, under other income and other gains and losses of non-operating income
and expense. A regular way of purchase or sale of financial assets shall be recognized
and derecognized, as applicable, using trade date accounting.
Investments in equity instruments that do not have a quoted market price in an active
market, and whose fair value cannot be reliably measured, are measured at amortized
cost, and are included in financial assets measured at cost.
Dividend income is recognized in profit or loss on the date that the Company’s right to
receive payment is established, which in the case of quoted securities is normally the
ex-dividend date. Such dividend income is included in other income of non-operating
income and expenses.
3) Loans and receivables
Loans and receivables are financial assets with fixed or determinable payments that are
not quoted in an active market. Loans and receivables comprise trade receivables and
other receivables. Such assets are recognized initially at fair value, plus, any directly
attributable transaction costs. Subsequent to initial recognition, receivables are
measured at amortized cost using the effective interest method, less any impairment
losses other than insignificant interest on short-term receivables. A regular way
purchase or sale of financial assets is recognized and derecognized, as applicable, using
trade date accounting.
Interest income is recognized in profit or loss, under other income of non-operating
income and expenses.
4) Impairment of financial assets
Except for financial assets at fair value through profit or loss, financial assets are
assessed for impairment at each reporting date. A financial asset is impaired if, and only
if, there is objective evidence of impairment as a result of one or more events that
occurred after the initial recognition of the asset (a ‘loss event’) and that loss event (or
events) has an impact on the estimated future cash flows of the financial asset that can
be estimated reliably.

TOPCO TECHNOLOGIES CORPORATION
Notes to the Financial Statements
208
Objective evidence that financial assets are impaired includes default or delinquency by
a debtor, restructuring of an amount due to the Company on terms that the Company
would not consider otherwise, indications that a debtor or issuer will enter bankruptcy,
adverse changes in the payment status of borrowers or issuers, economic conditions that
correlate with defaults, or the disappearance of an active market for a security. In
addition, for an investment in an equity security, a significant or prolonged decline in its
fair value below its cost is considered objective evidence of impairment.
All individually significant receivables are assessed for specific impairment.
Receivables that are not individually significant are collectively assessed for impairment
by Companying together assets with similar risk characteristics. In assessing collective
impairment, the Company uses historical trends of the probability of default, the timing
of recoveries, and the amount of loss incurred, adjusted for management’s judgment as
to whether current economic and credit conditions are such that the actual losses are
likely to be greater or less than those suggested by historical trends.
An impairment loss in respect of a financial asset is deducted from the carrying amount
except for accounts receivable, for which an impairment loss is reflected in an
allowance account against the receivables. When it is determined a receivable is
uncollectible, it is written off from the allowance account. Changes in the amount of the
allowance account are recognized in profit or loss.
Impairment losses on available for sale financial assets are recognized by reclassifying
the losses accumulated in the fair value reserve in equity to profit or loss.
If, in a subsequent period, the amount of impairment loss on a financial asset measured
at amortized cost decreases and the decrease can be related objectively to an event
occurring after the impairment was recognized, the decrease in impairment loss is
reversed through profit or loss to the extent that the carrying value of the asset does not
exceed its amortized cost before impairment was recognized at the reversal date.
Impairment losses recognized on an available for sale equity security are not reversed
through profit or loss. Any subsequent recovery in the fair value of an impaired
available for sale equity security is recognized in other comprehensive income, and
accumulated in other equity. If, in a subsequent period, the fair value of an impaired
available for sale debt security increases and the increase can be related objectively to
an event occurring after the impairment loss was recognized, then the impairment loss is
reversed, with the amount of the reversal recognized in profit or loss.
Impairment losses and recoveries of accounts receivable are recognized in sales
expenses; impairment losses and recoveries of other financial assets are recognized in
other gains and losses of non-operating income and expenses.

TOPCO TECHNOLOGIES CORPORATION
Notes to the Financial Statements
209
5) Derecognition of financial assets
Financial assets are derecognized when the contractual rights of the cash inflow from
the asset are terminated, or when the Company transfer substantially all the risks and
rewards of ownership of financial assets.
On derecognition of a financial asset in its entity, the difference between the carrying
amount and the sum of the consideration received or receivable and any cumulative gain
or loss that had been recognized in other comprehensive income and presented in other
equity – unrealized gains or losses from available for sale financial assets are recognized
in profit or loss, under other gains and losses of non-operating income and expenses.
When the Company does not derecognize a financial assets in its entity, it separates the
part that continue to be recognized and the part that is derecognized, based on the
relative fair values of those parts on the date of the transfer. The difference between the
carrying amount of and the consideration received for financial assets derecognized and
any cumulative gain or loss allocated to such financial assets that had been recognized
in other comprehensive income, are recognized in profit or loss under other gains or
losses of non-operating revenues and expenses. A cumulative gain or loss that had been
recognized in other comprehensive income is allocated between the part that continues
to be recognized and the part that is derecognized, based on the relative fair values of
those parts.
(iii) Financial liabilities and equity instruments
1) Classification of debt or equity
Debt or equity instruments issued by the Company are classified as financial liabilities
or equity instruments in accordance with the substance of the contractual agreement.
Equity instruments refer to surplus equities of the assets after the deduction of all the
debts for any contracts.
2) Financial liabilities at fair value through profit or loss
A financial liability is acquired principally for the purpose of selling in the short term.
Attributable transaction costs are recognized in profit or loss as incurred. Financial
liabilities at fair value through profit or loss are measured at fair value and changes
therein, which takes into account any interest expense, are recognized in profit or loss,
under other gains and losses of non-operating income and expenses.
3) Other financial liabilities
Financial liabilities not classified as held-for-trading, or designated as at fair value
through profit or loss, which comprise of loans and borrowings, and trade and other
payables, are measured at fair value plus any directly attributable transaction cost at the

TOPCO TECHNOLOGIES CORPORATION
Notes to the Financial Statements
210
time of initial recognition. Subsequent to initial recognition, they are measured at
amortized cost calculated using the effective interest method. Interest expense not
capitalized as capital cost is recognized in profit or loss, under financial costs of
non-operating income and expenses.
4) Derecognition of financial liabilities
A financial liability is derecognized when its contractual obligation has been discharged
or cancelled or expired.
The difference between the carrying amount of a financial liability removed and the
consideration paid (including any non-cash assets transferred or liabilities assumed) is
recognized in profit or loss, under other gains and losses of non-operating income and
expenses.
5) Offsetting of financial assets and liabilities
The Company presents financial assets and liabilities on a net basis in the statements of
financial position when the Company has the legally enforceable rights to offset, and
intends to settle such financial assets and liabilities on a net basis or to realize the assets
and settle the liabilities simultaneously.
(iv) Derivative financial instruments, including hedge accounting
The Company holds derivative financial instruments to hedge its foreign currency and
interest rate exposures. Derivatives are recognized initially at fair value and attributable
transaction costs are recognized in profit or loss as incurred. Subsequent to initial
recognition, derivatives are measured at fair value, and changes therein are recognized
in profit or loss, under other gains and losses of non-operating income and expenses.
When a derivative is designated as a hedging instrument, the timing for recognizing
gain or loss is determined based on the nature of the hedging relationship. When the fair
value of derivative instrument is positive, it is classified as a financial asset; otherwise,
it is classified as a financial liability.
(g) Inventories
Inventories are measured at the lower of cost and net realizable value. The cost of inventories
is based on the weighted average method, and includes expenditure incurred in acquiring the
inventories, and other costs incurred in bringing them to their existing location and
condition.
Net realizable value is the estimated selling price in the ordinary course of business, less the
estimated costs of completion and selling expenses.

TOPCO TECHNOLOGIES CORPORATION
Notes to the Financial Statements
211
(h) Investment in Associates
Associates are those entities in which the Company has significant influence, but not control
or joint control, over the financial and operating policies.
Investments in associates are accounted for using the equity method and are recognized
initially at cost. The cost of the investment includes transaction costs. The carrying amount
of the investment in associates includes goodwill arising from business acquisition, less, any
accumulated impairment losses.
The consolidated financial statements include the Company’s share of the profit or loss and
other comprehensive income of equity accounted investees after adjustments to align the
accounting policies with those of the Company from the date that significant influence
commences until the date that significant influence ceases. When the associates incur
changes in equity arising from nonprofit-or-loss items and other comprehensive income, the
Company recognizes changes in equity proportionately to shareholding percentage as capital
surplus. Unrealized profits resulting from the transactions between the Company and an
associate are eliminated to the extent of the Company’s interest in the associate. Unrealized
losses on transactions with associates are eliminated in the same way, except to the extent
that the underlying asset is impaired.
When the Company’s share of losses exceeds its interest in associates, the carrying amount
of the investment, including any long-term interests that form part thereof, is reduced to zero,
and the recognition of further losses is discontinued except to the extent that the Company
has an obligation or has made payments on behalf of the investee.
(i) Subsidiaries
The Company accounts the investee companies that it possesses control using the equity. Net
income, other comprehensive income, and shareholder’ s equity in the financial reports of the
Company and the net income, other comprehensive income, and shareholder’s equity that
belongs to the Consolidated Company in the consolidated financial reports should be the
same.
The Company accounts the changes in equity, under the condition that control is still present,
as equity transactions between the proprietors.
(j) Property, Plant, and Equipment
(i) Recognition and measurement
Items of property, plant and equipment are measured at cost less accumulated
depreciation and accumulated impairment losses. Cost includes expenditure that is
directly attributed to the acquisition of the asset. Furthermore, cost also includes the
purchase of real estates, plants and equipment in foreign currency. Software purchased to

TOPCO TECHNOLOGIES CORPORATION
Notes to the Financial Statements
212
integrate functions of the relevant equipment is also capitalized as part of the equipment.
Each part of an item of property, plant and equipment with a cost that is significant in
relation to the total cost of the item shall be depreciated separately, unless the useful life
and the depreciation method of the significant part of an item of property, plant and
equipment are the same as the useful life and depreciation method of another significant
part of that same item.
The gain or loss arising from the derecognition of an item of property, plant and
equipment shall be determined as the difference between the net disposal proceeds, if any,
and the carrying amount of the item, and shall be recognized in profit or loss, under net
other income and expenses.
(ii) Subsequent cost
Subsequent expenditure is capitalized only when it is probable that future economic
benefits associated with the expenditure will flow to the Company. The carrying amount
of those parts that are replaced is derecognized. Ongoing repairs and maintenance is
expensed as incurred.
(iii) Depreciation
The depreciable amount of an asset is determined after deducting its residual amount,
and it shall be allocated on a systematic basis over its useful life. Items of property, plant
and equipment with the same useful life may be Companyed in determining the
depreciation charge. The remainder of the items may be depreciated separately. The
depreciation charge for each period shall be recognized in profit or loss.
Leased assets are depreciated by using straight-line method during the period of
expected use, consistent with the depreciation policy the lessee adopts for depreciable
assets that are owned. If there is reasonably certainty that the lessee will obtain
ownership by the end of the lease term, the period of expected use is the useful life of
the asset; otherwise, the asset is depreciated over the shorter of the lease term and its
useful life.
Land has an unlimited useful life and therefore is not depreciated.
The estimated useful lives for the current and comparative years of significant items
of property, plant and equipment are as follows:
1) Buildings:10~50 years
2) Machine and equipment:5 years
3) Furniture, fixtures and other equipment:3~10 years
Depreciation methods, useful lives, and residual values are reviewed at each reporting
date. If expectation differs from the previous estimates, the change is accounted for as
a change in an accounting estimate.

TOPCO TECHNOLOGIES CORPORATION
Notes to the Financial Statements
213
(k) Leases
For operating rentals of tenants, the paid rent (not including service costs such as insurance
and maintenance) of the rental period is recognized as fees according to straight-line basis.
The net profit provided by the lessor for incentive of rental purpose during the period of
rental is recognized as a decrease of rental expense according to straight-line method.
Contingent rent is recognized as expense in the periods in which they are incurred.
(l) Intangible Assets
(i) Research and development
The research stage refers to the estimated activities to be conducted for achieving and
understanding new scientific and technological knowledge. The relevant expenses
occurred are recognized as profit or loss.
During the development stage, the expenses are recognized as intangible assets if they
meet all of the below conditions; for expenses that do not meet all 6 of the below
conditions, they are recognized as profit or gain immediately when occurred:
1) The technical feasibility of completing the intangible asset has been achieved, the
intangible asset is thus available for use or sale.
2) The intent is to complete, use and sell the intangible asset.
3) The Company possess the adequate talent to use or sell the intangible asset under
discussion.
4) The intangible asset is likely to generate future economic profit.
5) The Company possess the adequate technology, financial conditions and other resources
to complete the development, use and sell the intangible asset under discussion.
6) Costs attributable to the stage of development of the intangible asset is measurable.
The expense of capitalized stage of development is the cost of which deducted by
accumulated amortization and cumulative impairment.
(ii) Other Intangible Assets
Other intangible assets that are acquired by the Company are measured at cost less
accumulated amortization and any accumulated impairment losses.
(iii) Subsequent Expenditure
Subsequent expenditure is capitalized only when it increases the future economic
benefits embodied in the specific asset to which it relates. All other expenditures,
including expenditure on internally generated goodwill and brands, are recognized in
profit or loss as incurred.
(iv) Amortization
Amortization amount of intangible asset is calculated based on the cost of an asset less
its residual values.

TOPCO TECHNOLOGIES CORPORATION
Notes to the Financial Statements
214
The cost of the Company’s main intangible asset, computer software, is estimated to have
a durability of 1~5 years based on straight-line amortization since it is first available for
use. The amortized value is recognized as profit or loss.
The residual value, amortization period, and amortization method for an intangible asset
with a finite useful life shall be reviewed at least annually at each fiscal year-end. Any
change shall be accounted for as a change in accounting estimate.
(iv) Amortization
Amortization amount of intangible asset is calculated based on the cost of an asset less
its residual values.
The cost of the Company’s main intangible asset, computer software, is estimated to
have a durability of 1~5 years based on straight-line amortization since it is first
available for use. The amortized value is recognized as profit or loss.
The residual value, amortization period, and amortization method for an intangible
asset with a finite useful life shall be reviewed at least annually at each fiscal year-end.
Any change shall be accounted for as a change in accounting estimate.
(m) Impairment of Non-Financial Assets
The Company assesses non-financial assets for impairment (except for inventories, deferred
tax assets and assets arising from employee benefit) at every reporting date, and estimates its
recoverable amount. If it is not possible to determine the recoverable amount (fair value less
cost to sell and value in use) for an individual asset, then the Company will have to
determine the recoverable amount for the asset's cash-generating unit (CGU).
The recoverable amount for individual asset or a cash-generating unit is the higher of its fair
value, less, costs to sell and its value in use. If, and only if, the recoverable amount of an
asset is less than its carrying amount, the carrying amount of the asset shall be reduced to its
recoverable amount. That reduction is an impairment loss. An impairment loss shall be
recognized immediately in profit or loss.
The Company assesses at the end of each reporting period whether there is any indication
that an impairment loss recognized in prior periods for an asset other than goodwill may no
longer exist or may have decreased. If any such indication exists, the entity shall eliminate
the recoverable amount of that asset.
(n) Revenue
(i) Revenue from customer’s contract (applicable from Jan. 1, 2018)
Revenue is measured basing on the consideration to which the Company expected to be
entitled in exchange for transferring goods or services to a customer. The Company
recognizes revenue when it satisfies a performace obligation by transferring control of a
good or service to a customer. The accounting policies to the Company’s main types of
the revenue are explained below:

TOPCO TECHNOLOGIES CORPORATION
Notes to the Financial Statements
215
1) Sale of goods
Revenue is measured at the fair value of the consideration received or receivable less
estimated returns, trade discounts, and volume allowances. Our company recognizes
revenue when persuasive evidence exists (usually by signing the sales agreement), when
the significant risk and reward in the ownership of goods are transferred to the buyer,
when the amount is very likely to be recovered, when the transaction-related cost and
return of goods that has occurred or is about to occur can be reliably measured, when
our company neither continues to participate in the management nor maintains effective
control on the goods sold, and when the revenue can be reliably measured. If the
discount is very likely to occur and the amount can be reliably measured, it is treated as
a contra item of revenue and recognized when the sale is recognized.
The timing of transferring the risk and reward depends on individual conditions of the
sales contract.
2) Commissions income
When the Company serves as the agent but not the principal, revenue is recognized at
the net commission received.
3) Financing component
The Company does not expect to have almost contracts where the period btween the
transfer of the promised goods or services to the customer and payment by the customer
exceeds one year. As a consequence, the Company does not adjust any of the
transaction prices for the time value of money.
(ii) Revenue (applicable before Jan. 1, 2018)
1) Goods sold
Revenue from the sale of goods in the course of ordinary activities is measured at the
fair value of the consideration received or receivable, net of returns, trade discounts and
volume rebates. Revenue is recognized when persuasive evidence exists, usually in the
form of an executed sales agreement, that the significant risks and rewards of ownership
have been transferred to the customer, recovery of the consideration is probable, the
associated costs and possible return of goods can be estimated reliably, there is no
continuing management involvement with the goods, and the amount of revenue can be
measured reliably. If it is probable that discounts will be granted and the amount can be
measured reliably, then the discount is recognized as a reduction of revenue as the sales
are recognized.
The timing of the transfer of risks and rewards varies depending on the individual terms
of the sales agreement.

TOPCO TECHNOLOGIES CORPORATION
Notes to the Financial Statements
216
2) Commission income
When the Company acts as an agent rather than the client in a transaction, the income is
recognized on the basis of the commission received.
(o) Employee Benefits
(i) Defined contribution plans
Obligations for contributions to defined contribution pension plans are recognized as an
employee benefit expense in profit or loss in the periods during which services are
rendered by employees.
(ii) Defined benefit plans
A defined benefit plan is a post-employment benefit plan other than a defined
contribution plan. The Company’s net obligation in respect of defined benefit pension
plans is calculated separately for each plan by estimating the amount of future benefit
that employees have earned in return for their service in the current and prior periods;
that benefits is discounted to determine its present value. Any unrecognized past service
costs and the fair value of any plan assets are deducted. The discount rate is the yield at
the reporting date (market yields of high-quality corporate bonds or government bonds)
on bonds that have maturity dates approximating the terms of the Company’s
obligations and that are denominated in the same currency in which the benefits are
expected to be paid.
The calculation is performed annually by a qualified actuary using the projected unit
credit method. When the calculation results in a benefit to the Company, the recognized
asset is limited to the total of any unrecognized past service costs and the present value
of economic benefits available in the form of any future refunds from the plan or
reductions in future contributions to the plan. In order to calculate the present value of
economic benefits, consideration is given to any minimum funding requirements that
apply to any plan in the Company. An economic benefit is available to the Company if it
is realizable during the life of the plan, or on settlement of the plan liabilities.
When the benefits of a plan are improved, the portion of the increased benefit relating to
past service by employees is recognized in profit or loss.
Remeasurements of the net defined benefit liability (asset), which comprise (1) actuarial
gains and losses, (2) the return on plan assets (excluding interest) and (3) the effect of
the asset ceiling (if any, excluding interest), are recognized immediately in other
comprehensive income. The Company reclassifies the amounts recognized in other
comprehensive income to retained earnings.

TOPCO TECHNOLOGIES CORPORATION
Notes to the Financial Statements
217
The Company recognizes gains or losses on the curtailment or settlement of a defined
benefit plan when the curtailment or settlement occurs. The gain or loss on curtailment
comprises any resulting change in the fair value of plan assets and any change in the
present value of the defined benefit obligation.
(iii) Short-term employee benefits
Short-term employee benefit obligations are measured on an undiscounted basis and are
expensed as the related service is provided.
A liability is recognized for the amount expected to be paid under short-term cash
bonus or profit-sharing plans if the Company has a present legal or constructive
obligation to pay this amount as a result of past service provided by the employee, and
the obligation can be estimated reliably.
(p) Share-based payment
The grant-date fair value of share-based payment awards granted to employee is recognized
as employee expenses, with a corresponding increase in equity, over the period that the
emplyees become unconditionally entitled to the awards. The amount recognized as an
expense is adjusted to reflect the number of awards which the related service and non-market
performance conditions are expected to meet, such that the amount ultimately recognized as
an expense is based on the number of award that meet the related service amd non-market
performance conditions at the vesting date.
For share-based payment awards with non-vesting conditions, the grant-date fair value of the
share-based payment is measured to reflect such contions and there is no true-up for
differences between expected and actual outcomes.
The stock appreciation rights to be paid to employees are measured by the fair value of the
stock appreciation rights and then paid by cash. During the period when the employees are
qualified for the unconditional remuneration, relative liabilities are added to the recognized
the expenses. The relevant liabilities should be re-measured on each reporting date and
closing date. Any changes in fair values are recognized as staff costs under profit and loss.
(q) Income Taxes
Income tax expenses include both current taxes and deferred taxes. Except for expenses
related to business combinations or recognized directly in equity or other comprehensive
income, all current and deferred taxes shall be recognized in profit or loss.
Current taxes include tax payables and tax deduction receivables on taxable gains (losses)
for the year calculated using the statutory tax rate on the reporting date or the actual
legislative tax rate, as well as tax adjustments related to prior years.
Deferred taxes arise due to temporary differences between the carrying amounts of assets and
liabilities for financial reporting purposes and their respective tax bases. Deferred taxes are
recognized except for the following:

TOPCO TECHNOLOGIES CORPORATION
Notes to the Financial Statements
218
(i) Assets and liabilities that are initially recognized but are not related to the business
combination and have no effect on net income or taxable gains (losses) during the
transaction.
(ii) Temporary differences arising from equity investments in subsidiaries or joint ventures
where there is a high probability that such temporary differences will not reverse.
(iii ) Initial recognition of goodwill.
Deferred tax assets and liabilities shall be measured at the tax rates that are expected to
apply to the period when the asset is realized or the liability is settled, based on tax rates that
have been enacted or substantively enacted by the end of the reporting period.
Deferred tax assets and liabilities may be offset against each other if the following criteria
are met:
(i) The entity has the legal right to settle tax assets and liabilities on a net basis; and
(ii) The taxing of deferred tax assets and liabilities fulfill one of the below scenarios:
(iii) levied by the same taxing authority; or
(iv) levied by different taxing authorities, but where each such authority intends to settle
tax assets and liabilities (where such amounts are significant) on a net basis every year
of the period of expected asset realization or debt liquidation, or where the timing of
asset realization and debt liquidation is matched.
A deferred tax asset is recognized for the carry-forward of unused tax losses, unused tax
credits, and deductible temporary differences to the extent that it is probable that future
taxable profit will be available against which the unused tax losses, unused tax credits, and
deductible temporary differences can be utilized. Such unused tax losses, unused tax credits,
and deductible temporary differences shall also be re-evaluated every year on the financial
reporting date, and adjusted based on the probability that future taxable profit will be
available against which the unused tax losses, unused tax credits, and deductible temporary
differences can be utilized.
The undistributed surplus profit-making income tax portion and is recognized as the income
tax expense for the current period after the shareholders' meeting of the next year passes the
surplus distribution.
(r) Earnings per Share
The Company discloses the Company’s basic and diluted earnings per share attributable to
ordinary equity holders of the Company. The calculation of basic earnings per share is based
on the profit attributable to the ordinary shareholders of the Company divided by the
weighted-average number of ordinary shares outstanding. The calculation of diluted earnings
per share is based on the profit attributable to ordinary shareholders of the Company, divided
by the weighted-average number of ordinary shares outstanding after adjustment for the

TOPCO TECHNOLOGIES CORPORATION
Notes to the Financial Statements
219
effects of all dilutive potential ordinary shares, such as unvested restriction stock and accrued
employee compensation.
(s) Operating segments
The Company discloses its information on operating segments in its consolidated financial
statements, so it need not disclose such information in the parent company only financial
statements.
(5) Significant accounting assumptions and judgments, and major sources of estimates
uncertainty
The preparation of the financial statements in conformity with the IFRSs endorsed by the FSC
requires management to make judgments, estimates, and assumptions that affect the application of
the accounting policies and the reported amount of assets, liabilities, income, and expenses.
Actual results may differ from these estimates.
The management continues to monitor the accounting estimates and assumptions. The
management recognizes any changes in accounting estimates during the period and the impact of
those changes in accounting estimates in the next period.
Information about estimation uncertainties that have a significant risk of resulting in a material
adjustment within the next financial year is as follows:
(a) Valuation of inventories:
As inventories are stated at the lower of cost or net realizable value and evaluation is based
on an estimated future sales price, and therefore is subject to change due to changes in the
industry and in the market. Please refer to Note 6(g) for further details on stock evaluation.
(b) Receivables evaluation:
The valuation of receivables is based on lifetime expected credit loss of objective evidence
showing the recoverability of accounts receivables, so that the provision for losses can be
made accordingly. They may be subject to change due to customer operating conditions,
external industrial environment and economic conditions. Please refer to Note 6(e) for
further details on receivables evaluation.
(6) Explanations on significant accounts
(a) Cash and cash equivalent December 31,
2018 December 31,
2017 Petty cash and cash on hand $ 290 307
Demand and check deposits 371,903 328,525
Term deposits - 15,015
$ 372,193 343,847
Please refer to Note 6(s) for the disclosure on the foreign exchange rate risk and sensitivity
analysis of the financial assets.

TOPCO TECHNOLOGIES CORPORATION
Notes to the Financial Statements
220
(b) Financial assets and liabilities at fair value through profit or loss
1. Details of financial assets and liabilities are as follows:
December 31,
2018
December 31,
2017
Financial assets at fair value through profit or loss,
mandatorily measured at fair value:
Derivatives instrunments not used for hedging
Foreign currency forward contracts $ 18
Financial asset held for trading:
Derivatives instrunments not used for hedging
Foreign currency forward contracts - 79
Non-derivative financial assets
Open-end funds - 30,327
$ 18 30,406
The Company uses derivatives financial instruments to hedge the certain foreign exchange
rate risk and interest rate risk the Company is exposed to, arising from its operating,
financing and investing activities. The details of the derivatives financial instruments that are
not recognized and reported as held-for-trading financial assets and liabilities since the
Company is not applicable to hedge accounting are as follows (i.e., the financial assets and
liabilities at fair value through profit or loss, mandatorily measured at fair value on
December 31, 2018, and the financial assets and liabilities held for trading on December 31,
2017)
Foreign currency forward contracts:
Foreign currency unit: in thousands December 31, 2018 December 31, 2017
Contract
amount
Currency Expiry
duration Contract
amount
Currency Expiry
duration
Derivative financial
assets:
Forward foreign
exchange sold USD300 NTD/USD 108.1.1~
108.1.18 USD300 NTD/USD 107.1.1~
107.1.12
On December 31, 2018 and December 31, 2017, the Company’s financial assets at fair value
through profit or loss were not pledged as collateral.

TOPCO TECHNOLOGIES CORPORATION
Notes to the Financial Statements
221
(c) Financial assets at fair value through other comprehensive income
December 31,
2018 Equity investments at fair value through other
comprehensive income
Domestic non-listed companies $ 190,741
The Company designated the investments shown above as equity securities as at fair value
through other comprehensive income because these equity securities represent those
investments that the Company intends to hold for long-term strategic purpose. These
investments were classified as available-for-sale financial assets and financial assets carried
at cost on December. 31, 2017.
No strategic investments were disposesd as of December 31, 2018, and there were no
transfers of any cumulative gain or loss within equity relating to these investments
For market risk, please refer to Note 6(t).
As of December 31, 2018, the financial assets at fair value through other comprehensive
income were not pledged.
(d) Available-for-sale financial assets
December
31, 2017
Domestic non-listed companies $ 174,185
The shares of Lustrous Technology Ltd. held by the Company are recognized as
available-for-sale financial assets. Since the company had debt difficulties and could not
file for bankruptcy to the court, the Company recognized impairment loss of $ 23,400 on
the shares held after evaluation in 2017.
The investments shown above as non-current financial assets at fair value through other
comprehensive income, please refer to Note 6(c).
For market risk, please refer to Note 6(s).
As of December 31, 2017, the available-for-sale financial assets were not pledged.

TOPCO TECHNOLOGIES CORPORATION
Notes to the Financial Statements
222
(e) Notes and accounts receivable December 31,
2018
December 31,
2017
Note receivables - raised because of regular business $ 87,091 104,257
Account receivables - measured at amortized cost 625,104 624,919
Notes and accounts receivable - related parties -
measured at amortized cost 108,945 100,156
821,140 829,332
Less: Loss allowance (365) (412)
$ 820,775 828,920
Notes and accounts receivable, net $ 711,830 728,764
Notes and accounts receivable - related parties, net $ 108,945 100,156
The Company adopts a simplified approach to estimate expected credit loss regarding all
notes and accounts receivable on December 31, 2018. Namely, the lifetime expected credit
loss for measurement is used. For measurement purposes, notes and accounts receivable are
grouped by mutual credit risk characteristics, including each customer’s ability to repay
according to the contract provisions, as well as forward-looking information such as
macroeconomic and industry prospects. The loss allowance provision as of December 31,
2018 was determined as follows: Book value of
notes and
accounts
receivable
Weighted-
average
expected loss
rate
Allowance for
lifetime
expected
credit loss Current $ 818,687 0.01% 115
Within 30 days past due 2,237 5.00% 112
31 to 180 days past due 116 50.00% 58
More than 181 days past due 100 80.00% 80
$ 821,140 365
As of December 31,2017, the Company applies the inccured loss model to consider the loss
allowance provision of notes and account receivable, and the aging analysis of notes and
account receivable which were past due but not impaired, were as follows: December
31,2017
Past due 0~30 days $ 5,142
Past due 31~180 days 191
Past due over 181 days -
$ 5,333

TOPCO TECHNOLOGIES CORPORATION
Notes to the Financial Statements
223
The movement in the allowance for nots and account receivable were as follows: For the years ended December
31,2017
For the years
ended
December
31,2018
Individually
assessed
impairment
Collectivly
assessed
impairment
Balance on January 1,per IAS39 $ 412 - 1,298
Adjustment on initial application of IFRS9
-
Balance on January 1,per IFRS 9 412
Impairment loss recognized (47) - (90)
Written off unrecoverable amount
- - (796)
Balance on December 31 $ 365 - 412
On December 31, 208 and 2017, the notes and accounts receivable were not pledged.
The credit risk of the notes and accounts receivable on December 31, 208 and 2017,
please refer to Note 6(s).
(f) Other receivables December 31,
2018
December 31,
2017
Other receivables
(reported other current financial assets) $ 3,545 3,455
Less: Loss allowance - -
$ 3,545 3,455
For the credit risk, please refer to Note 6(s)
(g) Inventory December 31,
2018
December 31,
2017
Products $ 235,423 182,166
Products incurred loss of the Company in 2018 and 2017are as follows: For the years ended December 31 2018 2017
Loss on valuation of Inventory $ 1,143 (4,685)
Inventory profit or loss 128 41
$ 1,271 (4,644)
From the year ended December 31, 2018, inventory was written off to net realizable value.

TOPCO TECHNOLOGIES CORPORATION
Notes to the Financial Statements
224
The inventory valuation losses was $1,143. This was recognized as operating costs. Due to
the sale of the slow-moving inventory during the years ended December 31, 2017 , the net
present value of inventory bounced back and reversal of inventory valuation and
obsolescence loss was $4,685.
As of December 31, 2018 and 2017, the inventory was not pledged.
(h) Investments accounted for using equity method
The components of the investments accounted for using equity method were as follows: December 31,
2018
December 31,
2017
Subsidiaries $ 2,354,774 2,124,671
1) Please refer to the consolidated financial statements for the year ended December 31,2018 .
2) As of December 31,2018 and 2017 the investment in aforementioned equity-accounted investees
were not pledged as collateral.
(i) Property, plant, and equipment
The movements of cost and accumulated depreciation and impairments of property, plant and
equipment of the Company for the years ended December 31, 2018and 2017 were as follows:
Land
Buildings
and
structures
Machinery
and
equipment
Office
equipment
and others
Total
Book value:
Blance at January 1, 2018 $ 56,746 38,906 673 11,524 107,849
Additions - - 417 3,940 4,357
Blance at December 31, 2018 $ 56,746 38,906 1,090 15,464 112,206
Blance at January 1, 2017 $ 56,746 38,906 673 11,308 107,633
Additions - - - 216 216
Blance at December 31, 2017 $ 56,746 38,906 673 11,524 107,849
Depreciation and impairment
losses:
Blance at January 1, 2018 $ 4,020 17,270 423 9,677 31,390
Depreciation for the period - 973 103 877 1,953
Blance at December 31, 2018 $ 4,020 18,243 526 10,554 33,343
Blance at January 1, 2017 $ 4,020 16,297 311 8,379 29,007
Depreciation for the period - 973 112 1,298 2,383
Blance at December 31, 2017 $ 4,020 17,270 423 9,677 31,390
Book values:
Blance at December 31, 2018 $ 52,726 20,663 564 4,910 78,863
Blance at December 31, 2017 $ 52,726 21,636 250 1,847 76,459

TOPCO TECHNOLOGIES CORPORATION
Notes to the Financial Statements
225
As of December 31,2018 and 2017 the property, plant, and equipment were not pledged as
collateral.
(j) Short-term loans 107.12.31 106.12.31
Unused credit line $ 638,218 633,920
On December 31, 2018 and 2017, the Company had not offer collateral for loan
facilities.
(k) Operating leases
Lessee
Rental payables of non-cancellable opetaing lease were as follows: December 31,
2018
December 31,
2017
Within one year $ 14,209 11,545
Between one and five years 15,842 9,118
Over five years 35 -
$ 30,086 20,663
The Company leases several offices, garages, and company vehicles, etc. under
operating leases. The lease term is usually 1~5 years and is attached with the right of
continued renting once the term is reached.
For the years ended December 31 2018 and 2017, expenses recognized in profit or
loss in respect of operating leases were $ 16,477 and $ 15,690, respectively.
(l) Employee benefit
(i) Defined benefit plan
The movements in the present value of the defined benefit obligations and fair value of
planassets were as follows: December 31,
2018
December 31,
2017
Present value of benefit obligations $ 46,829 44,528
Fair value of plan assets (48,948) (47,044)
Recognized liabilities (assets) for defined benefit obligations
$ (2,119) (2,516)
The Company makes defined benefit plan contributions to the pension fund account
with Bank of Taiwan that provides pensions for employees upon retirement. Plans
(covered by the Labor Standards Law) entitle a retired employee to receive retirement
benefits based on years of service and average monthly salary for the six months
prior to retirement.

TOPCO TECHNOLOGIES CORPORATION
Notes to the Financial Statements
226
1) Composition of the plan asset
The Company allocates pension funds in accordance with the Regulations for Revenues,
Expenditures, Safeguard and Utilization of the Labor Retirement Fund, and such funds
are managed by the Bureau of Labor Funds, Ministry of Labor. With regard to the
utilization of the funds, minimum earnings shall be no less than the earnings attainable
from two-year time deposits with interest rates offered by local banks.
The Company’s Bank of Taiwan labor pension reserve account balance amounted to
$48,948 as of December 31, 2018. For information on the utilization of the labor
pension fund assets, including the asset allocation and yield of the fund, please refer to
the website of the Bureau of Labor Funds, Ministry of Labor.
2) Movements in present value of the defined benefit obligations
The movements in present value of defined benefit obligations for the Company were as
follows:
For the Years Ended December 31, 2018 2017
Defined benefit obligation at January 1 $ 44,528 43,062
Current service costs and interest 1,341 1,201
Remeasurement on the net defined benefit
assets
─Actuarial losses arising from changes in
financial assumptions 960 265
Defined benefit obligation at December 31 $ 46,829 44,528
3) Movements of defined benefit plan assets
The movements in the present value of the defined benefit plan assets for the Company
were as follows: For the Years Ended December 31, 2018 2017
Fair value of plan assets at January 1 $ 47,044 46,584
Interest income 762 639
Remeasurement of net defined obligation
assets-return on plan assets (excluding
interest
income)
1,142
(183)
Contributions from employer - 4
Fair value of plan assets at December 31 $ 48,948 47,044

TOPCO TECHNOLOGIES CORPORATION
Notes to the Financial Statements
227
4) Expense recognized in profit or loss
The expenses recognized in profit or loss for the Company was as follows: For the Years Ended December 31, 2018 2017
Current service costs $ 620 611
Net interest of net assets for defined benefit
obligations
(41) (49)
$ 579 562
Selling expenses 195 187
General and administrative expenses 384 375
$ 579 562
5) Remeasurement on the net defined benefit assets recognized in other comprehensive
income
The Company’s remeasurement on the net defined benefit assets recognized in other
comprehensive income for the years were as follows: For the Years Ended
December 31, 2018 2017
Cumulative amount at January 1 $ (5,963) (5,515)
Recognized during the period 182 (448)
Cumulative amount at December 31 $ (5,781) (5,963)
6) Actuarial assumptions
The following are the principal actuarial assumptions as of December 31, 2018 and
2017: 107.12.31 106.12.31
Discount rate 1.375% 1.625%
Future salary increases rate 3.000% 3.000%
The Compamy expects to make contributions of $0 to defined benefit plans in 2018.
The weighted average duration of the defined benefit plans is 15.77 years.
7) Sensitivity analysis
As of December 31, 2018 and 2017, the effects of the present value of the defined
benefit obligation arising from changes in principal actuarial assumptions were as
follows:

TOPCO TECHNOLOGIES CORPORATION
Notes to the Financial Statements
228
Influences of defined benefit
obligations Increased0.25% Increased0.25%
December 31, 2018
Discount rate $ (1,420) 1,481
Future salary increases rate 1,428 (1,380)
December 31, 2017
Discount rate (1,483) 1,495
Future salary increases rate 1,445 (1,399)
The sensitivity analysis presented above may not be representative of the actual change
in the present value of the defined benefit obligation as it is unlikely that the change in
assumptions would occur in isolation of one another as some of the assumptions may be
correlated. The sensitivity analysis adopts the same methods for determining the pension
liabilities (assets) at balance sheet date.
The methods and assumptions used on current sensitivity analysis is the same as those
of the prior year.
(ii) Defined contribution plans
The Company contributes an amount equal to 6% of the employee’s monthly wages to
the Labor Pension personal account with the Bureau of the Labor Insurance in
accordance with the provisions of the Labor Pension Act, under which, the Company is
not required to bear the regulated or putative obligation subsequent to the payment of
fixed-rate contribution.
The Company’s pension costs under the defined contribution pension plan amounted to
$4,138 and $3,846 for the years ended December 31, 2018 and 2017, respectively.
(m) Income tax
Under the amendments to the Income Tax Act which was promulgated by the president of
the Republic of China on February 7,2018 , the Company and Topglow’s applicable income
tax rate were raised from 17% to 20% effective from January 1, 2018.
(i) Income tax expense
1) The details of income tax expense for the years ended December 31, 2018 and 2017,
were as follows:

TOPCO TECHNOLOGIES CORPORATION
Notes to the Financial Statements
229
For the Years Ended
December 31, 2018 2017
Current tax expense
Current period $ 54,083 36,582
10% surtax on undistributed earnings 6,873 -
60,956 36,582
Deferred tax expense
Origination and reversal of temporary
differences
2,262 (5,868)
Effect of tax rate changes 12,059 -
Income tax expense $ 75,277 30,714
2) Reconciliations between income tax and profit before tax for the years ended December
31, 2018 and 2017, were as follows: For the Years Ended
December 31, 2018 2017
Income before tax $ 538,519 380,852
Income tax calculated on pretax financial
income at the statutory rate
107,704 64,745
Unrecognized Deferred Tax Liabilities (49,476) (30,589)
Tax-exempt income and investment income
recognized under equity method
(6,996) (6,575)
Income tax not including impairment loss of
financial assets
- 3,978
Effect of tax rate changes 12,059 -
10% surtax on undistributed earnings 6,873 -
Others 5,113 (845)
$ 75,277 30,714
(ii) Deferred tax liabilities
1) Unrecognized Deferred Tax Liabilities
The Company did not recognize any temporary differences related to investment in
subsidiaries since the Company has the ability to control the time point when temporary
differences are reversed, and it is certain that the differences will not be reversed in the
foreseeable future. Related information for the years ended December 31, 2018 and
2017, were as follows:

TOPCO TECHNOLOGIES CORPORATION
Notes to the Financial Statements
230
107.12.31 106.12.31
Temporary differences related to investment in subsidiaries
$ 284,581 199,840
2) Unrecognized Deferred Tax Assets:None
3) Recognized deferred tax assets and liabilities
Changes in the amount of deferred tax assets and liabilities for the years ended
December 31, 2018 and 2017, were as follows:
Recognized
gain on
foreign
investment
for equity
method
Defined
benefit plan
Others
Total
Deferred tax liabilities
Balance as of January 1, 2018 $ 69,509 2,021 14 71,544
Recognized in profit or loss 14,891 242 (11) 15,122
Balance as of December 31, 2018 $ 84,400 2,263 3 86,666
Balance as of January 1, 2017 $ 75,325 2,117 525 77,967
Recognized in profit or loss (5,816) (96) (511) (6,423)
Balance as of December 31, 2017 $ 69,509 2,021 14 71,544
Unrealized losses on
inventory valuation
and obsolescence
Others
Total Deferred tax assets:
Balance as of January 1, 2018 $ 1,147 2,065 3,212
Recognized in profit or loss 324 477 801
Balance as of December 31, 2018 $ 1,471 2,542 4,013
Balance as of January 1, 2017 $ 1,016 2,750 3,766
Recognized in profit or loss 131 (685) (554)
Balance as of December 31, 2017 $ 1,147 2,065 3,212
3. The tax returns assessment and approval
The tax returns of the Company has been assessed and approved through 2015 by the Tax
Authority.
(n) Capital and other equity
As of December 31, 2018 and 2017, the total value of authorized ordinary shares amounted
to $800,000 thousand, with par value of $10 (NT dollars) per share, of which 80,000
thousand shares, 64,061 thousand shares and 64,101 thousand shares were issued,
respectively. All issued shares were paid up upon issuance.

TOPCO TECHNOLOGIES CORPORATION
Notes to the Financial Statements
231
(i) Common stock issuance
In 2018 and 2017, when some of the employees assigned new employee rights
restrictions of the Company failed to meet the vested conditions, their shares were
bought back by the Company at the issue price of 40,000 shares and 5,000 shares
respectively, the changes has already been registered.
The board of directors approved the cash capital increase at 100 millions and issued
10,000 thousand shares on September17, 2018 with par value $10 (NT dollars) per share.
It had been appvoved by the Financial Supervisory Commission (FSC) No. 1070340878.
The cash capital increase was issuance at $60 dollars per share and the record date is
January 16,2019. The registration had been completed on February 12, 2019.
A recomciliation of the Company’s outstanding shares of the year 2018 and 2017 were as
follows:
Common shares (thousand of shares) For the Years Ended
December 31, 2018 2017
Balance as of January 1, 2018 64,101 64,106
Retirement of employees restricted shares (40) (5)
Balance as of December 31, 2018 64,061 64,101
(ii) Capital surplus
The details of capital surplus were as follows: December
31,2018
December
31,2017
Paid-in capital in excess of par value $ 492,060 530,521
Premium from merger 329,343 329,343
Share-based payment transaction- issuing shares 8,600 -
Share-based payment transaction-restricted employee shares of stock
124,072 126,480
$ 954,075 986,344
The shareholder’s meeting approved the distribution of cash dividend from capital
reserve of $38,461 ($0.6 dollars per share) on June 20, 2018.
In accordance with the amended R.O.C. Company Act, realized capital reserves can
only be reclassified as share capital or distributed as cash dividends after offsetting
losses. The aforementioned capital reserves include share premiums and donation
gains. In accordance with Securities Offering and Issuance Guidelines, the amount of
capital reserves to be reclassified under share capital shall not exceed 10% of the
actual share capital amount.

TOPCO TECHNOLOGIES CORPORATION
Notes to the Financial Statements
232
(iii) Legal reserve
According to the Company Act, the Company must retain 10% of its after-tax annual
earnings as legal reserve until such retention equals the amount of total capital. When
a company incurs no loss, it may, pursuant to a resolution by a shareholder's meeting,
distribute its legal reserve by issuing new shares or by distributing cash and only the
portion of legal reserve which exceeds 25% of capital may be distributed.
(iv) Special reserve
When the Company first adopted the International Financial Reporting Standards as
approved by the Financial Supervisory Commission, due to the application of
exemption items as stated in No.1 of the International Financial Reporting Standards,
“Initial adaptation of the International Financial Reporting Standards”, the cumulative
conversion adjustment under the original account’s shareholder equity is presumed to
be zero, and increased retained earnings to $ 17,368. However, the adopted retained
earnings increased by $ 8,680 on the conversion date as it was the first adaptation of
IFRSs. In accordance with Ruling No. 1010012865 issued by the Financial Supervisory
Commission on April 6, 2012, retained earnings are increased to $ 8,680. After the
deduction of penalized relevant assets in 2012, which is $ 2,317 by proportion, the
special reserve for its net value is $ 6,363, as recognized on January 1, 2013. The
balance of special reserve for which on December 31, 2018 and 2017 is $ 6,363.
In accordance with the above-mentioned stipulations, a portion of current-period
earnings and undistributed prior-period earnings shall be reclassified as a special
earnings reserve during earnings distribution. The amount to be reclassified should
equal to the current-period total net reduction of other shareholders’ equity. Similarly, a
portion of undistributed prior period earnings shall be reclassified as a special earnings
reserve (and does not qualify for earnings distribution) to account for cumulative
changes to other shareholders’ equity pertaining to prior periods. Amounts of
subsequent reversals pertaining to the net reduction of other shareholders’ equity shall
qualify for additional distributions.
(v) The restriction of earnings distribution and dividend policy
The Company’s Articles of Incorporation provide that, when allocating the net profit for
each fiacal year, the Company shall first offset its losses in previous years and then set
aside the leagel reserve at 10% of net profit until the accumulated leagal reserve equals
the Company’s capital; and also set aside special capital reserve in accordance with
relevant regulations or as requested by the authorities.Any balance left over and the
beginning balance of retaining earnings ,the Company’s appropriations of earnings are
approved in the meeting of the Board of Directors and presented for approval in the
Company’s shareholders’ meeting.
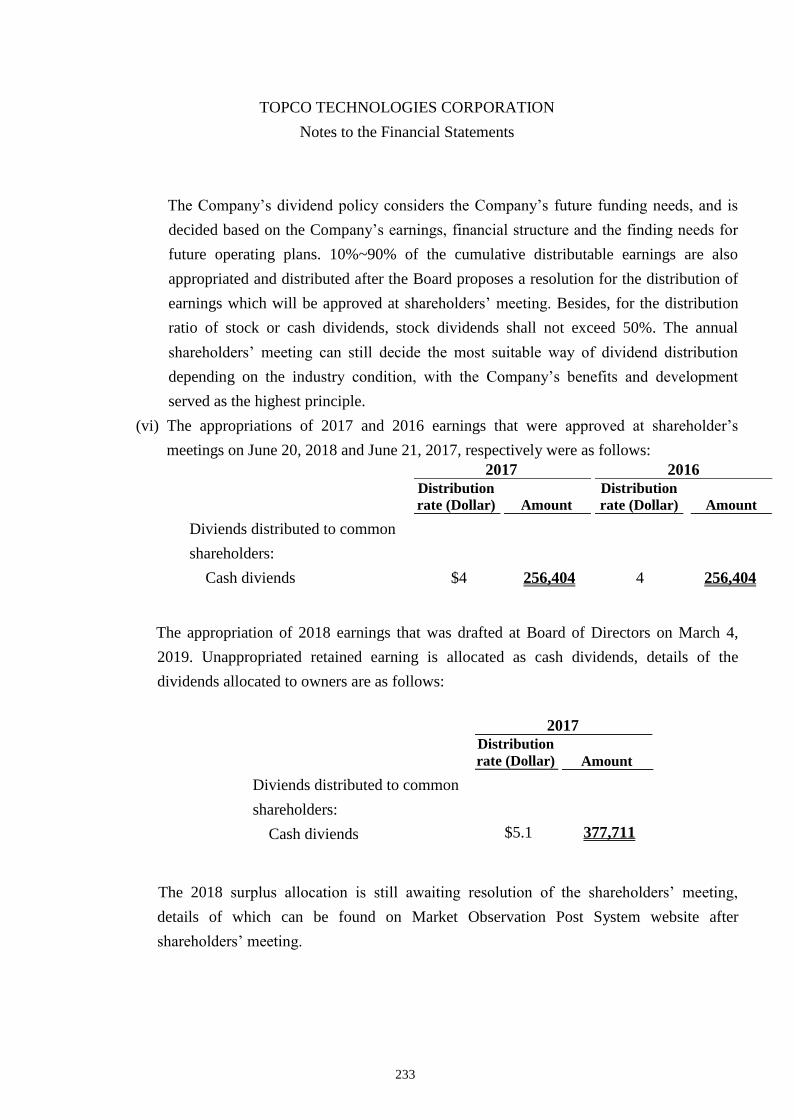
TOPCO TECHNOLOGIES CORPORATION
Notes to the Financial Statements
233
The Company’s dividend policy considers the Company’s future funding needs, and is
decided based on the Company’s earnings, financial structure and the finding needs for
future operating plans. 10%~90% of the cumulative distributable earnings are also
appropriated and distributed after the Board proposes a resolution for the distribution of
earnings which will be approved at shareholders’ meeting. Besides, for the distribution
ratio of stock or cash dividends, stock dividends shall not exceed 50%. The annual
shareholders’ meeting can still decide the most suitable way of dividend distribution
depending on the industry condition, with the Company’s benefits and development
served as the highest principle.
(vi) The appropriations of 2017 and 2016 earnings that were approved at shareholder’s
meetings on June 20, 2018 and June 21, 2017, respectively were as follows: 2017 2016 Distribution
rate (Dollar)
Amount
Distribution
rate (Dollar)
Amount
Diviends distributed to common
shareholders:
Cash diviends $4 256,404 4 256,404
The appropriation of 2018 earnings that was drafted at Board of Directors on March 4,
2019. Unappropriated retained earning is allocated as cash dividends, details of the
dividends allocated to owners are as follows:
2017 Distribution
rate (Dollar)
Amount
Diviends distributed to common
shareholders:
Cash diviends $5.1 377,711
The 2018 surplus allocation is still awaiting resolution of the shareholders’ meeting,
details of which can be found on Market Observation Post System website after
shareholders’ meeting.

TOPCO TECHNOLOGIES CORPORATION
Notes to the Financial Statements
234
(vii) Other equities (net of tax)
Exchange
differences on
translation of
foreign
financial
statements
Unrealized
gain or loss
from financial
assets at fair
value through
other
comprehensive
income and
loss
Unrealized gains
(losses) on
available for
sale financial
assets
Unearned
compensation
of reatricted
employee
shares of stock Total
Balance, January 1, 2018 $ (84,809) - 81,031 (16,425) (20,203)
Effects of retrospective application - 57,631 (81,031) - (23,400)
Balance at January 1, 2018 after adjustments (84,809) 57,631 - (16,425) (43,603)
Foreign currency translation differences (19,349) - - - (19,349)
Unrealized gain or loss from financial assets at fair
value through other comprehensive income and
loss - 16,556 - - 16,556
Retirement of employees restricted shares - - - 1,888 1,888
Compensation cost of issuing restricted employee
shares
- - - 14,537 14,537
Balance,December 31, 2018 $ (104,158) 74,187 - - (29,971)
Balance, January 1, 2017 $ (24,288) - 7,464 (38,633) (55,457)
Foreign currency translation differences (60,521) - - - (60,521)
Unrealized gain or loss from available-for-sale
financial assets - - 50,167 - 50,167
Reclassification adjustment of the impairment of
available-for-sale financial assets - - 23,400 - 23,400
Retirement of employees restricted shares - - - 236 236
Compensation cost of issuing restricted employee
shares - - - 21,972 21,972
Balance, ,December 31, 2017 $ (84,809) - 81,031 (16,425) (20,2 03)
(o) Share-based payment transaction-new restricted employee shares
(i) New restricted employee shares
During the meeting on June 20,2014 , the Company’s shareholders approved a resolution
to issue 2,400,000 shares of stock to those full-time employees who comformed to the
company’s certain requirements. These restricted employee shres of stock have been
registered and approved by the ROC Securities and Futures Bureau of Financial
Supervisory Commission.On August 11,2014, the board of directors approved a
resolution to issue 2,400,000 restricted employee shres and set September 30, 2014 as the
record date for capital increase of issued new shares.

TOPCO TECHNOLOGIES CORPORATION
Notes to the Financial Statements
235
These emplyees are entitled to purchase the restricted shres of stock at the price of $23,
with the condition at these employees will continue to provide service to the Company
for the 4 years (from the grant date) and qulify with the Company’s certain
requirement.The restricted shres of stock for emplyees are kept by tust, which is
appointed by the Company before they are vested. These shres shall not be sold, pledged,
transferred, gifted or by any other means of disposal to third parties during the custody
period. If there are any employees who fail to meet the vested conditions, their shares
will be bought back by the Company at the full price of issuance. However, restricted
employee shares of stock may still participate in share allotments, interest distribution,
and cash capital increase and subscriptions. New shares that are obtained as a result of
allotment or capital increase subscriptions are not restricted to employee rights shares.
The number of the restricted employee shares of stock(in thousands) for the years ended
December 31,2018 and 2017 were as follows:
2018 2017
Outstanding at the beginning of year 2,101 2,106
Retired (40) (5)
Vested (2,061) -
Outstanding at the end of year - 2,101
The Company’s above-mentioned restricted employee shares of stock are measured
at fair value with a closing price of $ 70.20 for the grant date of company stocks,
resulting in a capital reserve of $ 144,480 restricted employee shares. In December 31,
2018 and 2017, the unearned balance of employee salary was $0 and $ 16,425
respectively.
For the years ended December 31,2018 and 2017, the accrued compensation cost for
the restricted employee shares of stock amounted to $14,537 and $21,972.
(ii) Employee stock options at cash capital increase
On September 17,2018 the Company’s board of directors approved to cash capital
increase, and 1,000,000 shres to the employee stock options. The related informations
are as follows::
Type
Employee stock options at cash
capital increase
Vesting date December 19,2018
Options granted 1,000,000 shares
Exercise Amount 1,000,000 shares
Vesting Period Immediate vesting

TOPCO TECHNOLOGIES CORPORATION
Notes to the Financial Statements
236
The capital increase retention and the fair value of employee stock options at cash capital
increase is $8.6. The recognized reward cost as of 2018 is $8,600,000, which is listed
under Operating Costs.
(p) Earnings per share
For the years ended December 31, 2018 and 2017, the basic and diluted earnings per share
were calculated as follows
For the Years ended December 31
2018 2017
Basic earnings per share
Profit attributable to ordinary shareholders of the Company $ 463,242 350,138
Weighted average number of ordinary shares (basic) 62,515 62,000
Basic earnings per share(in dollars) $ 7.41 5.65
Diluted earnings per share
Profit attributable to ordinary shareholders of the Company $ 463,242 350,138
Weighted average number of ordinary shares (basic) 62,515 62,000
Employee compensation 726 513
Restricted employee shares of stock - 1,537
Employee stock options at cash capital increase 4 -
Weighted average number of ordinary shares (diluted) 63,245 64,050
Diluted earnings per share(in dollars) $ 7.32 5.47
(q) Revenue from contracts with customers
(i) Disagregation Revenue
For the Years ended
December 31,2018
Major markets
Taiwan $ 2,369,656
China 773,508
Other 232,947
$ 3,376,111
Major product:
Related products of chemical material $ 3,376,111

TOPCO TECHNOLOGIES CORPORATION
Notes to the Financial Statements
237
(ii) Balance of contract
December 31,2018
January 1, 2018
Notes and accounts receivable $ 821,140 829,332
Less: loss allowance (365) (412)
$ 820,775 828,920
Current contract liabilities- Advance sales receipts
$ 1,309 9,180
For details on notes, accounts receivable and loss allowance, please see Note 6(e).
The amount of revenue recognized for the years ended December 31, 2018 that was
included in the contract liability balance at the beginning of the period was 9,180.
The major change in the balance of contract liabilities is the difference between the
time of the performance oblgation to be satisfied and the payment to be received.
(r) Employees’ and directors’ compensation
According to the Company’s Article of Incorporation, if the compay has profit, 5%~10% of
them shall be appropriated as employee remuneration, and a percentage not higher than 5%
shall be remuneration of directors. In case of accumulated loss of the Company, the amount
shall be reserved to compensate for the amount, followed by calculating the employee
remuneration and director remuneration according to the balance. Employee remuneration
can be stocks or cash, and the parties to be distributed include the employees of the associate
companies who satisfy a certain criteria.
For the years ended December 31, 2018 and 2017 the appropriated employee compensations
amounted to $42,000, and $31,000 and directors’ compensations amounted to $18,000 and
$13,000 respectively. These amounts were calculated based on the Company’s article of
incorporation and the net profit before tax after deducting employee and director
compensations, and was recognized under operating expenses, which were consistent with
the actual distributions. Related information can be accessed from the Market Observation
Post System website.
(s) Financial instruments
(i) Credit risk
1) Credit risks exposure
The carrying amounts of financial assets represents the maximum credit risk exposure
of the Company.
2) Concentration of credit risk

TOPCO TECHNOLOGIES CORPORATION
Notes to the Financial Statements
238
As the Company has a large customer base and does not have a significant
concentration of transactions with a single customer and the sales area is dispersed, the
credit risk of accounts has no significant concentration.
3) Credit risk of account receivables and debt securities
Please refer to the Note 6(e) of the disclosure of the risk exposure information of notes
and accounts receivable. Please refer to Note 6(f) for the details of certificate of deposits
and other receivables and the recognition of impairment for the years ended December
31, 2018.
The following table lists the above-mentioned financial assets, loss allowance
recognized on December 31, 2018 and whether there is credit impairment according to
12-month expected credit loss or lifetime expected credit loss:
December 31, 2018
Evaluated at amortized cost
12-month
expected
loss
Expected
loss - not
impaired
expected
loss -
impaired Total
Total Book value $ 10,044 821,140 - 831,184
Loss allowance - (365) - (365)
Amortized cost $ 10,044 820,775 - 830,819
Book value, net $ 10,044 820,775 - 830,819
(ii) Liquidity risk
The following were the contractual maturities of financial liabilities, not including the
impact of estimated interests.
Book value
Contract
cash flows
Within 1
years
Within
1~2 years
More than
2 years
December 31, 2018
Non-derivative financial liabilities
Notes payable and trades
(including related parties)
$ 388,830 (388,830) (388,830) - -
Other payable 5,661 (5,661) (5,661) - -
$ 394,491 (394,491) (394,491) - -
December 31, 2017
Non-derivative financial liabilities
Notes payable and trades
(including related parties)
$ 400,380 (400,380) (400,380) - -
Other payable 3,785 (3,785) (3,785) - -
$ 404,165 (404,165) (404,165) - -
The Company does not expect that the cash flows included in the maturity analysis could
occur significantly earlier or at significantly different amounts.

TOPCO TECHNOLOGIES CORPORATION
Notes to the Financial Statements
239
(iii) Currency risk
1) Exposure to foreign currency risk
The Company’s significant exposure to foreign currency risk was as follows:
Foreign currency unit: in thousand December 31, 2018 December 31, 2017
Foreign
currency
Exchange rate
NTD Foreign
currency
Exchange rate
NTD
Financial asset
Monetary items
USD $ 11,583 USD/NTD=
30.715
355,761 10,351 USD/NTD
=29.760
308,054
Financial liabilities
Monetary items
USD 7,452 USD/NTD
=30.715
228,877 8,009 USD/NTD =
29.760
238,354
2) Sensitive analysis
The Company’s exposure to foreign currency risk arises from the translation of the
foreign currency exchange gains and losses on cash and cash equivalents, receivables
and other receivables, account payables and other payable that are denominated in
foreign currency. Assuming other variable remain the same, a 5% depreciation or
appreciation of the NTD against the USD, RMB, JPY, HKD and EUR, etc. as of
December 31, 2018 and 2017, the before-tax income will increase or decrease by $
6,144 and $ 3,354, respectively. The analysis assumes that all other variables remain
constant.
3) Gain or loss on foreign exchange
The Company deals with diverse foreign currencies, therefore, the gains or losses on
foreign exchange were summarized as a single amount. For the nine months ended
December 31, 2018 and 2017, the foreign exchange gain(loss), including realized and
unrealized, amounted to gain of $3,285 and loss of $7,853, respectively.
(iv) Interest rate analysis
The Company's interest rate exposure as follows: Carring value December 31,
2018 December 31,
2017
Variable interest rate instruments:
Financial assets $ 371,878 328,455

TOPCO TECHNOLOGIES CORPORATION
Notes to the Financial Statements
240
The Company's sensitivity analysis in interest rates is based on the risk exposure to interest
rates on the derivative and the non-derivative financial instruments on the reporting date.
For variable rate instruments, the sensitivity analysis assumes the variable rate liabilities
are outstanding for the whole year on the reporting date.
If the interest rate increases or decreases by 0.25%, the Company’s profit will increase or
decrease by $930 and $821 for the years ended December 31, 2018 and 2017, respectively,
due to the floating rate deposits of the Company. This analysis assumes that all other
variables remain constant.
(v) Fair value information
1) Evaluation process
The Company’s accounting policy and disclosure include evaluating its financial assets
and liabilities at fair value. The Company’s management personnel are responsible for
conducting independent fair value verification, making the evaluation result close to
market conditions with data of independent source, ensuring the data source is
independent, reliable, consistent with other resources and representative of strike price,
periodically calibrate the evaluation model, renew the input values and data needed by
the evaluation model, and other necessary fair value adjustment, in order to make sure
the result is reasonable.
The Company uses observable market data to evaluate its assets and liabilities when it is
possible. The different inputs of levels the of fair value hierarchy in determining the fair
value are as follows:
● Level 1:quoted prices (unadjusted) in active markets for identifiable assets or
liabilities.
● Level 2:inputs other than quoted prices included within Level 1 that are observable
for the asset or liability, either directly(ie as prices) or directly (ie derived
from prices).
● Level 3:inputs for the assets or liability that are not based on observable market
data.
2) The categories and fair values of financial instruments
The measurement basis of the financial assets and liabilities at fair value through profit
or loss and the financial assets at fair value through other comprehensive income
(available-for-sale) is repetitive the carrying amount and fair value of the Company’s
financial assets and liabilities, including the information on fair value hierarchy were
as follows; however, except as described in the following paragraphs, for financial
instruments not measured at fair value whose carrying amount is reasonably close to

TOPCO TECHNOLOGIES CORPORATION
Notes to the Financial Statements
241
the fair value, and for equity investments that has no quoted prices in the active
markets and whose fair value cannot be reliably measured, disclosure of fair value
information is not required :
December 31, 2018
Fair value
Carring
amount Level 1 Level 2 Level 3 Total
Financial assets at fair value
through profit or loss,
mandatorily measured at fair
value:
Derivatives not for hedging $ 18 - 18 - 18
Financial assets at fair value
through other comprehensive
income:
Domestic non-listed companies 190,741 - - 190,741 190,741
Financial assets at amortised
cost:
Cash and cash equivalent 372,193 - - - -
Notes and accounts receivable
(Including related parties) 820,775 - - - -
Refundable deposit (reported
Other non-current assets) 6,499 - - - -
Other current financial assets 3,545 - - - -
Total 1,203,012
$ 1,393,771
Financial liabilities at amortised
cost:
Notes and account payable
(Including related parties) $ 388,830 - - - -
Other payables 5,661 - - - -
Total 394,491
$ 394,491

TOPCO TECHNOLOGIES CORPORATION
Notes to the Financial Statements
242
December 31, 2017 Fair value Carring
amount Level 1 Level 2 Level 3 Total Financial assets at fair value
through profit or loss:
Non-derivative financial assets $ 30,327 30,327 - - 30,327
Derivatives not for hedging 79 - 79 - 79
Total 30,406
Available-for-sale financial
assets:
Domestic non-listed companies 174,185 - - 174,185 174,185
Loans and receivables:
Cash and cash equivalent 343,847 - - - -
Notes and accounts receivable
(Including related parties)
828,920
-
-
-
-
Refundable deposit (reported
Other non-current assets)
6,473
-
-
-
-
Other receivable (reported Other
current financial assets)
3,455
-
-
-
-
Total 1,182,695
$ 1,387,286
Financial liabilities at amortised
cost:
Notes and account payable
(Including related parties)
$ 400,380
-
-
-
-
Other payables 3,785 - - - -
$ 404,165
3) Valuation techniques for financial instruments not measured at fair value
The method and assumption used by the Company in estimating instruments not
evaluated at fair value are as follows:
A. Financial liabilities at amortised cost
If there are quote data of the dealer, then the nearest price and quote data are the
basis of estimating fair value. If no market price is available for reference, the
evaluation method is used. The estimation and assumption used in the evaluation
method is the estimated fair value of discounted cash flows.
4) Valuation techniques for financial instruments measured at fair value
A. Non-derivative financial instruments
The fair value of financial instruments traded in an active market is based on quoted
market price.

TOPCO TECHNOLOGIES CORPORATION
Notes to the Financial Statements
243
A financial instrument is regarded as being quoted in an active market if quoted price
are readily and regularly available from an exchange, dealer, broker, industry group,
pricing service, or regulatory agency and those prices represent actual and regularly
occurring market transactions on an arm’s-length basis. Whether transactions are
taking place ‘regularly’ is a matter of judgement and depends on the facts and
circumstances of the market for the instrument. Quoted market prices may not be
indicative of the fair value of the instrument if the activity in the market is
infrenquent, the market is not well-established, only small volumes are traded, or
bid-ask srpeads are very wide. Determining whether a market is active involves
judgment.
Measurement of fair value of financial instrunments without an active market are
based on valuation technique or quoted price from a competitor. Fair value, measured
by using valuation technique that can be extrapolated from either similar financial
instrunments or discounted cash flow method or the market transaction prices of the
similar companies or other valuation techniques, including models, is calculated
based on available market data at the reporting date.
The financial instrunment of the Company is not traded in an actine market, its fair
value is determined as follows: The fair value is determined based on the ratio of the
quoted market price of the comparative listed company and its book value per share.
Also, the fair value is discounted for its lack of liquidity in the market.
B. Derivative financial instruments
Measurement of the fair value of derivative instruments is based on the valuation
techniques generally accepted by market participants such as the discounted cash
flow or option pricing models. Fiar value of forward currency is usually determined
by the forward currency exchange rate.
5) For the years ended December 31, 2018 and 2017, there were no transferring from each
level in the fair value hierarchy.
6) Changes in level 3 of the fair value

TOPCO TECHNOLOGIES CORPORATION
Notes to the Financial Statements
244
Fair value through other
comprehensive income
(Available-for-sale
financial assets) Unquoted equity
instruments
Balance on January 1, 2018 $ 174,185
Total gains and losses recognized:
Recognized in other comprehensive income
Net changes in fair value in the period 16,556
Balance on December 31, 2018 $ 190,741
Balance on January 1, 2017 $ 119,064
Total gains and losses recognized:
Recognized in loss (23,400)
Recognized in other comprehensive income
Net changes in fair value in the period 53,891
Net changes in fair value reclassification to profit and loss 19,676
Acquisition 4,954
Balance on December 31, 2017 $ 174,185
The aforementioned total gains and losses were recognized in “other gains and
losses”,“unrealized gains and losses from available-for-sale financial assets” and
“unrealized gains and losses from financial assets fair value through other
comprehensive income”. The details of the assets which the Company still held as of
December 31, 2018 and 2017 were as follows:
For the Years Ended December 31,
2018 2017
Total gains and losses recognized:
In other comprehensive income (accounted
as“ unrealized gains on financial assets
measured at fair value through other
comprehensive income”)
$ 16,556
In profit or loss (accounted as “other gains
and losses”)
$ (23,400)
In other comprehensive income (accounted
as “unrealized gains (losses) on
available-for-sale financial assets”)
$ 73,567

TOPCO TECHNOLOGIES CORPORATION
Notes to the Financial Statements
245
7) Quantified information for significant unobservable inputs (level 3) used in fair value
measurement
The Company’s financial instruments that use level 3 inputs to measure the fair values
include financial assets measured at available-for-sale financial assets-equity
investments.
The financial instruments of the Company is not traded in an active market, its equity
instruments classified as Level 3 fair value have multiple significant unobservable input
values. The significant unobservable inputs of the equity invsestments are independent
from each other as a result, there is no relevance between them.
The quantified information for significant unobservable inputs is as follows:
Item
Evaluation
technique
Significant
unobservable
input value
Relation between
significant
unobservable
input value and
fair value Financial assets at
fair value through other comprehensive income (Available-for-sale financial assets)-equity instruments without active market
Comparable listed
company’s
approach
‧PB ratio
(1.83~3.13 and
1.96~2.97 on
December 31,
2018 and 2017,
respectively)
‧PE ratio ((12.91
and 16.67 on
December 31,
2018 and 2017,
respectively)
‧Market liquidity
discount rate
(25% on
December 31,
2018 and)
‧The estimate fair
value would
increase if the
multiplier was
higher
‧The estimate fair
value would
decrease if
market liquidity
discount rate was
higher
8) Sensitivity analysis for fair values of financial instruments using Level 3 inputs
The Company’s fair value measurement on financial instruments is reasonable.
However, the measurement would be different if different valuation models or valuation
parameters are used. For financial instruments using level 3 inputs, the impact on the net
income or loss and other comprehensive income or loss will be as follows if the
valuation parameters changed:

TOPCO TECHNOLOGIES CORPORATION
Notes to the Financial Statements
246
Increase
or
decrease
mpacts of fair value
change on other
comprehensive income or
loss Input value Favorable Unfavorable
December 31, 2018
Financial assets at fair value through other comprehensive income
PB ratio 5% $ 5,149 5,139
Financial assets at fair value through other comprehensive income
PE ratio 5% $ 4,395 4,398
Financial assets at fair value through other comprehensive income
Market liquidity discount rate
5% $ 9,550 9,531
December 31, 2017
Available-for-sale financial assets
PB ratio 5% $ 4,954 4,966
Available-for-sale financial assets
PE ratio 5% $ 3,749 3,760
Available-for-sale financial assets
Market liquidity discount rate
5% $ 8,709 8,720
The favorable and unfavorable effects represent the changes in fair value and fair value
is based on variety of unobservable inputs calculated using a valuation technique. The
analysis above only reflects the effects of changes in a single input, and it does not
include the interrelationships with another input.
(w) Financial risk management
(i) Overview
The Company is exposured to the following risks from its financial instruments:
1) credit risk
2) liquidity risk
3) market risk
The note discloses information about the Company’s explosure to the aforemaentioned
risks, and its goals, policys and procedurs regarding the measurement and management of
these risks. For additional quantitative disclosures of these risks, please refer to the notes
regarding each risk disclosed throughout the financial report.
(ii) Risk management framework
The Company’s risk management policies are established to identify and analyze the
risks faced by the Company, to set appropriate risk limits and controls, and to monitor

TOPCO TECHNOLOGIES CORPORATION
Notes to the Financial Statements
247
risks and adherence to limits. Risk management policies and systems are reviewed
regularly to reflect changes in market conditions, products and services offered. The
Company, through its training and management standards and procedures, aim to
develop a disciplined and constructive control environment, in which all employees
understand their roles and obligations.
The Company’ s Internal Audit oversees how management monitors compliance with
the Company’ s risk management policies and procedures and reviews the adequacy of
the risk management framework in relation to the risks faced by the Company. Internal
Audit undertakes both regular and ad hoc reviews of risk management controls and
procedures, the results of which are reported to the Board of Directors.
(iii) Credit risk
Credit risk is the risk of financial loss to the Company if a customer or counterparty to
financial instruments fails to meet its contractual obligations that arise principally from
the Company’s account receivables and securities investment.
1) Accounts receivables and other receivables
The Company has established a credit policy, and according to the policy, the Company
must analyze its individual credit rating for each new customer before giving the
standard payment and delivery terms. The review of the Company includes, if available,
an external review, and, in some cases, a note from the bank. Purchase quotas are
established on individual customers. This limit is reviewed regularly. Customers who do
not comply with the Company's benchmark credit rating are only allowed to advance
the transaction with the Company.
Accounts receivables cover a large number of customers and are dispersed in different
industries and geographical areas. The Company will continue to evaluate the financial
status of accounts customers and, if necessary, purchase credit guarantee insurance
contracts.
As the Company has a large customer base and does not significantly focus on trading
with a single customer and the sales area is scattered, there is no significant
concentration of credit risks on accounts. In order to reduce credit risk, the Company
also regularly reviews the financial status of its customers, but usually does not require
customers to provide collateral.
2) Investment
The Company reduces credit risk by investing only in liquid securities with good credit
ratings. As managers actively monitor credit ratings and the Company can only invest in
securities with high-quality credit ratings, managers do not expect any traders to not be
able to perform their obligations.

TOPCO TECHNOLOGIES CORPORATION
Notes to the Financial Statements
248
(iv) Liquidity risk
Liquidity risk is the risk that the Company will encounter difficulty in meeting the
obligations associated with its financial liabilities that are settled by delivering cash or
another financial asset.
The Company maintains sufficient cash and cash equivalents so as to cope with its
operations and mitigate the effects of fluctuations in cash flows. The Company’s
management supervises the bank loan facilities and ensures in compliance with the
terms of the loan agreements.
The loan was an important source of liquidity for the Company. As of December
31,2018 and 2017, the Company has unused credit facilities for short-term and
long-term loans please refer to note 6(j).
(v) Market risk
Market risk is the risk that changes in market prices, such as foreign exchange rates,
interest rates and equity prices, and credit spreads will affect the Company’s income or
the value of its holdings of financial instruments. The objective of market risk
management is to manage and control market risk exposures within acceptable
parameters, while optimizing the return on risk.
1) Currency risk
The Company is exposed to currency risk on sales and purchase that denominated in a
currency other than the respective functional currencies used in these transactions are
denominated in TWD, USD ,RMB and HKD. The immense currency exchange risk
management of the Company is limited within permission of its policies, and makes
use of long-term foreign currency contracts for risk management.
2) Interest risk
The company manages interest rate risk by maintaining an appropriate fixed and
variable interest rate portfolio.
3) Other market price risk
The immense risk in equity price generated by the Company measuring fair value of
non-listed equity securities by the evaluation method, and measuring fair value of open
fund investments by open prices.
(x) Capital Management
Through clear undersanding and managing of significant changes in external environment,
related industrial characteristics, and corporate growth plan, the Company manages its
capital structure to ensure its has sufficient financial resources to sustain proper liquidity, to
invest in capital expenditures, as well as to repay debt, and to distribute dividends in
accordance to its plan. The management pursues the most suitable capital structure by
monitoring and maintaining proper fianacial ratio as below. The Company aims to enhance
the returns to its shareholders through achieveing an optimized debt-to-equity ratio regularly.

TOPCO TECHNOLOGIES CORPORATION
Notes to the Financial Statements
249
December
31,2018
December
31,2017
Total liabilities $ 820,139 714,858
Total equity 3,252,726 3,064,743
Debt to equity ratio 25% 23%
As of December 31, 2018 the Company’s capital management strategy is consistent with the
prior year.
(y) Financing activities not affecting current cash flow
The Company didn’t have the financing activities not affecting current cash flow for the nine
months ended December 31, 2018.
(7) Related-Party Transactions
(a) Names and relationship with related parties
The followings are entities that have had transactions with related during the periods covered
in the financial statements:
Name of Related Parties Relationship
Topco America Inc. (Topco America) Subsdiary
Topglow Trading Co., Ltd. (Topglow) 〃
Topco Trading (Shanghai Pu-Dong New Area) Co., LTD Subsdiary of Topco America
Topco (Guangzhou) Trading Co., LTD. 〃
Hong Kong TOPCO Trading Co., Ltd. 〃
Top Glory Trading Co., Ltd. (Top Glory) Subsdiary of Topglow
PT. Topco Trading Indonesia (PT. Topco) Sub-subsidiary of Topco
America
TOPCO (VIETNAM) TRADING CO., LTD (TOPCO
VIETNAM)
Sub-subsidiary of Topco
America
Shin-Etsu Chemical Co., Ltd. Corporate directors of the
Company
Shin-Etsu Silicone International Trading (Shanghai) Co,.
Ltd. (Shin-Etsu Shanghai)
The Company’s corporate
director, subsidiaries of
Shin-Etsu Chemical Co., Ltd.
Shin-Etsu Chemical Co., Ltd. (Shin-Etsu Taiwan) 〃
Shin-Etsu Astech Co., Ltd. 〃
Shin-Etsu (Hong Kong) Co., Ltd. 〃

TOPCO TECHNOLOGIES CORPORATION
Notes to the Financial Statements
250
Name of Related Parties Relationship
Shin Etsu Polymer Hong Kong Ltd. 〃
Shin-Etsu Polymer Co., Ltd. 〃
Shin-Etsu Silicones (Thailand), Ltd. 〃
Shin-Etsu Singapore Pte Ltd. 〃
Chung-shin Limited Company An affiliate
Sign Co., Ltd. 〃
Kikukawa Metal & Engineering Co., Ltd 〃
Mr. Pan, Chen-Cheng Chairperson of the Company
Mr. Weng, Chun-Ming Director of the Company
(b) Significant transactions with related parties
(i) Revenues to related parties
The amounts of significant sales between the Company and related parties were as
follows:
For the Years Ended December 31, 2018 2017
Subsdiaries:
Topco Shanghai $ 200,666 240,132
Others 205,966 189,373
Other related parties 127,158 86,669
$ 533,790 516,174
There is no significant difference in terms and conditions of the sales to associates
between those provided to third parties. The credit lending period for other related
parties are 30~120 days, which is not significantly different with the third parties.

251
(ii) Purchases
The amounts of purchase transaction between the Company and related parties were as
follows:
For the Years Ended December 31, 2018 2017
Subsdiaries: $ 27,042 11,205
Other related parties
Shin-Etsu Taiwan 2,186,782 2,132,822
Others 190,175 134,882
$ 2,403,999 2,278,909
The Company’s related products of chemical material are mainly purchased from
other related parties. There are no non-related party purchase prices for comparison.
The adoption of prepayment or 30~60 days open account during the payment period
by other related parties, and the payment period is 30~120 days for other suppliers.
(iii) Providing labor to other related parties
For the Years Ended December 31, 2018 2017
Service income (reported other profits and losses):
Subsdiaries:
Topco Hong Kong $ 13,850 13,989
(iv) Receivables from related parties
The details of the amounts due from the sales and services provided by the company
were as follows:
Account
Category of Related
party
December
31,2018
December
31,2017
Notes and accounts receivable Subsdiaries $ 75,172 74,402
Notes and accounts receivable Other related parties 33,773 25,754
Other receivable Subsdiary-Topco Hong Kong 3,545 3,455
$ 112,490 103,611

252
(v) Payables to related parties
Payables to related parties were as follows:
Account
Category of Related
party
December
31,2018
December
31,2017
Accounts payable Subsdiaries $ 9,504 2,706
Notes and accounts
payable
Other related parties:
Shin-Etsu Taiwan 344,303 352,640
Others 9,092 11,436
Other payable Other related parties 1,157 2,251
$ 364,056 369,033
(vi) Guarantees
Guarantees to related parties were as follows: December
31,2018
December
31,2017
Subsdiaries $ 245,720 238,080
(vii) Lease expenses
When the Company rents a garage from other related parties, the rent is decided by
the market price and paid monthly. For the years ended of December 31 of 2018 and
2017, the rent expenses are both $2,880.
(c) Transaction of major management personnel
Transactions with key management personnel: For the Years Ended December 31, 2018 2017
Short-term employee benefits $ 98,141 82,458
Post-employment benefit 1,556 1,556
$ 99,697 84,014
(8) Pledged assets:None.
(9) Significant Commitments and Contingencies:None.
(10) Losses Due to Major Disasters: None.
(11) Subsequent Events: None.
(12) Others

253
The employee benefits, depreciation, depletion and amortization expenses categorized by
function were as follows: By function For the Years Ended December 31, 2018 2017
By item
Operating
expenses Operating
expenses
Employee benefits
Salary $ 276,071 241,686
Labor and health insurance 12,417 11,086
Pension 4,717 4,408
Remuneration of directors 15,000 11,200
Others 4,739 4,384
Depreciation 1,953 2,383
Amortization 639 353
As of December 31, 2018 and 2017 , the Company had 122 and 114 employees, and of which 5
directors were not in concurrent employment, respectively.
(13) Other disclosures:
(a) Information on significant transactions
The following is the information on significant transactions required by the “ Regulations
Governing the Preparation of Financial Reports by Securities Issuers” for the Company for
the year ended December 31, 2018:
(i) Financing provided:None.
(ii) Guarantees and endorsements provided:
No.
(Note 1)
Name of the
company
Counter-party of
guarantee and
endorsement
Limits on
Endorsements
/ guarantee
amount
provided to
each
guarantee
party
Maximum
Balance for
the Period
Ending
Balance for
the Period
Actual
drawdown
Property
pledged on
guarantees
and
endorsement
Ratio of accumulated
amounts of guarantees
and
endorsements to net
worth of the latest
financial statements
Maximum
amount for
guarantees
and
endorsements
Parent
company
endorses/
guarantees to
third parties
on behalf of
subsidiary
Subsidiary
endorses/
guarantees to
third parties
on behalf of
parent
company
Endorsements/
guarantees to
third parties on
behalf of
companies in
Mainland
China
Name
Relationship
with the
Company
0 The
Company
Topco
Shanghai
sub-subsidiar
y
650,545 123,960 122,860 - - 3.78% 1,626,364
(Note2)
v - v
〃 〃 Topco
Guang
Zhou
〃 650,545 123,960 122,860 - - 3.78% 1,626,364
(Note 2)
v - v
1 Topglow
(Note2)
Top Glory Subsidiaries 113,610 27,891 27,711 - - 7.32% 189,350
(Note 3)
v - -
Note 1: The Company’s endorsement/guarantee amount limit to a single business shall not exceed 20% of the Company’s net worth in the latest
financial statements; the total amount of external endorsement/ guarantee shall not exceed 50% of the Company’s net worth in the latest
financial statements. Note 2: Topglow’s total external endorsement/ guarantee amount shall not exceed 50% of the net worth reported in the financial statements; the
endorsement/ guarantee amount limit to a single business shall not exceed 30% of Topglow’s net worth.
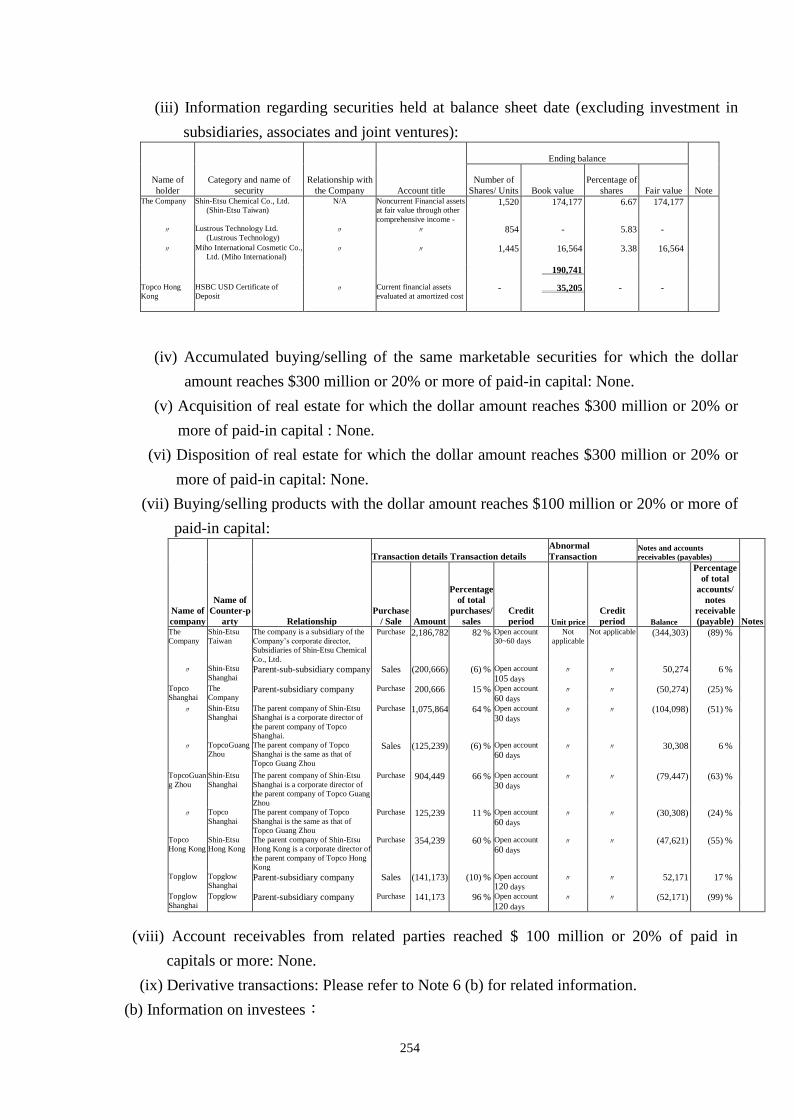
254
(iii) Information regarding securities held at balance sheet date (excluding investment in
subsidiaries, associates and joint ventures):
Name of
holder
Category and name of
security
Relationship with
the Company Account title
Ending balance
Number of
Shares/ Units Book value
Percentage of
shares
Fair value
Note
The Company Shin-Etsu Chemical Co., Ltd.
(Shin-Etsu Taiwan)
N/A Noncurrent Financial assets
at fair value through other
comprehensive income -
1,520 174,177 6.67 174,177
〃 Lustrous Technology Ltd.
(Lustrous Technology) 〃 〃 854 - 5.83 -
〃 Miho International Cosmetic Co.,
Ltd. (Miho International) 〃 〃 1,445 16,564
3.38 16,564
190,741
Topco Hong
Kong HSBC USD Certificate of
Deposit 〃 Current financial assets
evaluated at amortized cost - 35,205
- -
(iv) Accumulated buying/selling of the same marketable securities for which the dollar
amount reaches $300 million or 20% or more of paid-in capital: None.
(v) Acquisition of real estate for which the dollar amount reaches $300 million or 20% or
more of paid-in capital : None.
(vi) Disposition of real estate for which the dollar amount reaches $300 million or 20% or
more of paid-in capital: None.
(vii) Buying/selling products with the dollar amount reaches $100 million or 20% or more of
paid-in capital:
Name of
company
Name of
Counter-p
arty
Transaction details Transaction details Abnormal
Transaction Notes and accounts
receivables (payables)
Relationship Purchase
/ Sale
Amount
Percentage
of total
purchases/
sales
Credit
period
Unit price
Credit
period
Balance
Percentage
of total
accounts/
notes
receivable
(payable) Notes The
Company Shin-Etsu
Taiwan The company is a subsidiary of the
Company’s corporate director,
Subsidiaries of Shin-Etsu Chemical
Co., Ltd.
Purchase 2,186,782 82 % Open account
30~60 days Not
applicable Not applicable (344,303) (89) %
〃 Shin-Etsu
Shanghai Parent-sub-subsidiary company Sales (200,666) (6) % Open account
105 days 〃 〃 50,274 6 %
Topco
Shanghai The
Company Parent-subsidiary company Purchase 200,666 15 % Open account
60 days 〃 〃 (50,274) (25) %
〃 Shin-Etsu
Shanghai The parent company of Shin-Etsu
Shanghai is a corporate director of
the parent company of Topco
Shanghai.
Purchase 1,075,864 64 % Open account
30 days 〃 〃 (104,098) (51) %
〃 TopcoGuang
Zhou
The parent company of Topco
Shanghai is the same as that of
Topco Guang Zhou
Sales (125,239) (6) % Open account
60 days 〃 〃 30,308 6 %
TopcoGuan
g Zhou
Shin-Etsu
Shanghai The parent company of Shin-Etsu
Shanghai is a corporate director of
the parent company of Topco Guang
Zhou
Purchase 904,449 66 % Open account
30 days 〃 〃 (79,447) (63) %
〃 Topco
Shanghai The parent company of Topco
Shanghai is the same as that of
Topco Guang Zhou
Purchase 125,239 11 % Open account
60 days 〃 〃 (30,308) (24) %
Topco
Hong Kong
Shin-Etsu
Hong Kong The parent company of Shin-Etsu
Hong Kong is a corporate director of
the parent company of Topco Hong
Kong
Purchase 354,239 60 % Open account
60 days 〃 〃 (47,621) (55) %
Topglow Topglow
Shanghai Parent-subsidiary company Sales (141,173) (10) % Open account
120 days 〃 〃 52,171 17 %
Topglow
Shanghai Topglow Parent-subsidiary company Purchase 141,173 96 % Open account
120 days 〃 〃 (52,171) (99) %
(viii) Account receivables from related parties reached $ 100 million or 20% of paid in
capitals or more: None.
(ix) Derivative transactions: Please refer to Note 6 (b) for related information.
(b) Information on investees:

255
For the year ended December 31, 2018, the following is the information on investees
(excluding investees in Mainland China): Foreign currency unit: in thousand
Name of the
investor
Name of
investee
Major
operations
Initial investment
amount Ending balance
Net income
of the
investees in
current
period
Investment
income
recognized
in current
period
Location
Ending
balance
Beginning
balance
Shares (in
thousands) Percentage
(%) Book value Remarks
The Company
Topco
America Cayman
Islands
Holdings
overseas 332,670 332,670 12,260 100 2,107,369 247,381 247,381
Note 1, 2
〃 Topglow Taichung Import and
export trading 82,258 82,258 9,146 65 247,405 53,100 34,690
Note 1
Topco
America
Topco Hong
Kong Hong Kong
Merchandising
business of
chemical
material related
products
100,131
(USD3,260)
97,018
(USD3,260)
- 100 537,011 34,501 34,226
Note 1
Topglow Top Glory Belize Import and
export trading 1,537 1,537 50 100 17,876 522 522
Note 1
Topco Hong
Kong PT. Topco Indonesia
Merchandising
business of
chemical
material related
products
30,715
(USD1,000)
29,760
(USD1,000)
- 100 19,948 1,304 1,304
Note 1 and 3
〃 Topco
Vietnam Vietnam
Merchandising
business of
chemical
material related
products
24,572
(USD800)
23,808
(USD800)
- 100 26,045 7,478 7,478
Note 1
Note 1: Subsidiaries with controlling power.
Note 2: Original investment amount includes the reinvestment amount of US$ 800,000 with the cash dividends distributed from Topco Hong Kong.
Note 3: PT.Topco considers the requirements of Indonesia. The 0.04% shareholding in obtaining PT.Topco’s equity was held with the name of a third
party. Topco Hong Kong signed a contract with the third party, in which the rights and obligations of the both parties are listed, to protect asset
safety.
Note4: The NTD amount in this table is transformed with the exchange rate on the balance sheet date.
(c) Information on investment in Mainland China:
(i) Related information of the business invested in Mainland China: Foreign currency unit: in thousand
Name of the
investee in
Mainland China
Major
operations
Paid-in
capital
Investment
method
Cumulative
investment
amount from
Taiwan in
the beginning
of the period
Current
remittance/
recoverable
investment
(amount)
Ending
remittance
balance -
Cumulative
investment
(amount) from
Taiwan
Net income
(loss) of the
investee
Shareholding
ratio directly
or indirectly
held by the
Company
Investment gain
(loss) recognized
in the current
period (Note 2)
Book value
of investment
at end of the
period
Accumulated
Inward
Remittance
of Earnings
Remittance
amount
Recoverable
amount
Remittance
amount
Recoverable
amount
Topco Shanghai Merchandising
business of
chemical
material related
products
198,413
(USD6,500)
(Note 4)
Note 1 113,646
(USD3,700)
- - 113,646
(USD3,700)
112,487
(USD3,731)
100 % 111,522
(USD3,699)
788,945
(USD25,686)
-
Topco Guang Zhou 〃 198,413
(USD6,500)
(Note 5)
〃 113,646
(USD3,700)
- - 113,646
(USD3,700)
102,748
(USD3,408)
100 % 101,633
(USD3,371)
789,222
(USD25,695)
-
Topglow Shanghai Import and
export trading
14,770 Note 6 - - - 14,770 403 65 % 403 12,668 -
Note 1:Direct investment in Mainland China with remittance through a third region.
Note 2:Recorded per audited financial statements of the investees.
Note 3:The NTD amount in this table is transformed with the exchange rate on the balance sheet date.
Note 4:Includes the capitalization of retained earnings of USD2,000,000 and the reinvestment of the stock dividends of USD800,000 distributed by
Topco Hong Kong (in Hong Kong area) via the third region investment business, Topco America.
Note 5:Includes the capitalization of retained earnings of USD2,000,000 and the reinvestment of the stock dividends of USD800,000 distributed by
Topco Hong Kong (in Hong Kong area) via the third region investment business, Topco America.
Note 6:The investee company of Topglow established with its own funds.
(ii) Limitation on investment in Mainland China:
Accumulated balance from Taiwan
to
Mainland China
Approved investment amount by
Ministry of Economic Affairs
Investment Commission
Limitation on investment in
Mainland China in accordance
with regulations of Ministry of
Economic Affairs Investment
Commission
242,649 (USD 7,900,000)
614,300 (USD 10,000,000) (Note 2)
1,951,636
Note 1:The NTD amount in this table is transformed with the exchange rate on the balance sheet date.
Note 2: Includes the reinvestment of the stock dividends distributed by Topco Hong Kong (in Hong Kong area) via the third region investment
business, Topco America. The amount for the subsidiary of subsidiary in Mainland China is USD 1,600,000.

256
(iii) Significant transactions:
The significant inter-company transactions with the subsidiary in Mainland China,
which were eliminated in the preparation of consolidated financial statements, are
disclosed in “Information on significant transactions”
(14) Segment Information
Please refer to the consolidated financial statements for the year ended December 31,2018 .