toondah harbour€¦ · 4.1 residential analysis ... 5.3 marina berth price point analysis 27. 6...
TRANSCRIPT
Toondah Harbour Market Assessment and Development Strategy
August 2013
Prepared for Redland City Council

Toondah Harbour: Market Assessment and Development Strategy
Table of Contents
1 Executive Summary 1
2 Introduction 6
3 Project Programme Objectives and Framework 8
3.1 Vision and objectives 8
3.2 Key stakeholders and their drivers 9
3.3 Communication protocols 9
3.4 Programme timeframes, deliverables and milestones 9
3.5 Role of Redland City Council in the project 9
3.6 Role of the State in supporting the facilitation process for the PDA 10
3.7 Other Relevant Background Information to the Project 10
4 Toondah Residential Market Overview 11
4.1 Residential Analysis – House Market 12
4.2 Raby Bay v. Cleveland Housing Markets 15
4.3 Residential Analysis – Cleveland Apartment Market 16
4.4 Target Markets 19
4.5 Recent Transactions Analysis 20
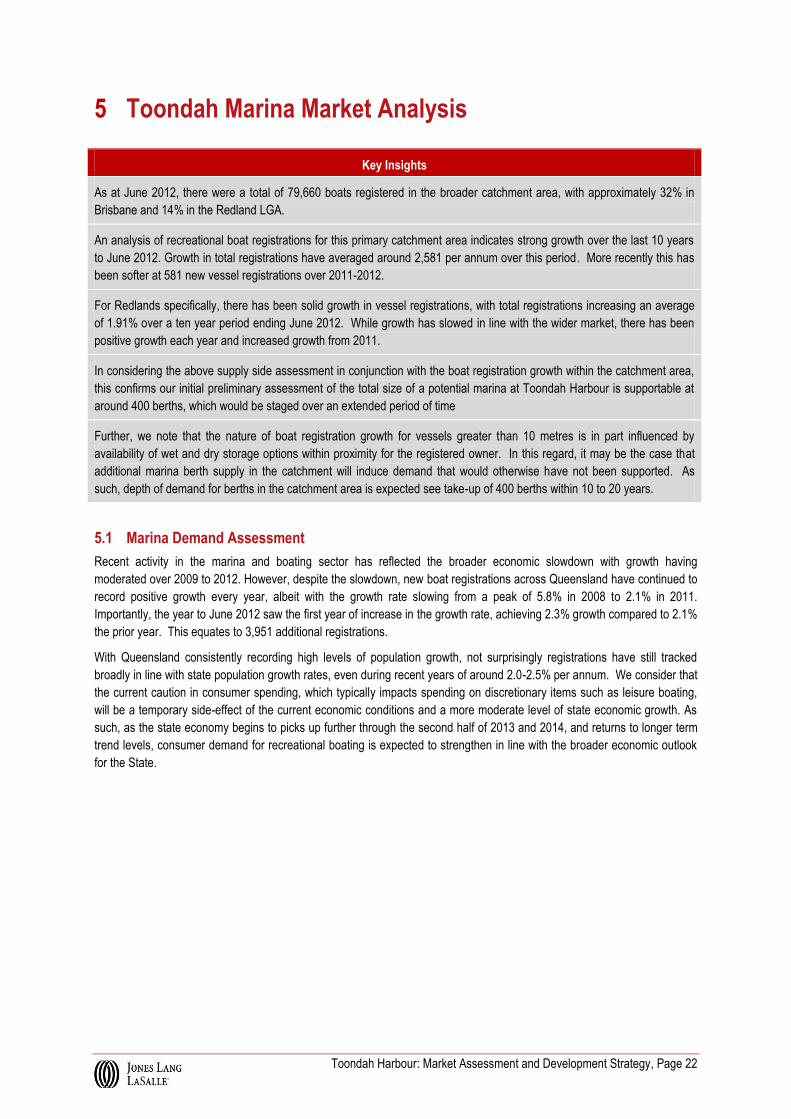
5 Toondah Marina Market Analysis 22
5.1 Marina Demand Assessment 22
5.2 Marina Supply Assessment 25
5.3 Marina Berth Price Point Analysis 27
6 Toondah Harbour Retail Market Analysis 31
6.1 Review of Existing Cleveland CBD Retail Offerings 31
6.2 Review of Key Recommendations within the Cleveland CBD Commercial Investment
Attraction 32
6.3 Retail Spending and Demand within the Toondah Harbour Catchment Area (Cleveland
SLA) 32
6.4 Retail Opportunities 34
6.5 Conclusions 37
7 Case Studies 38
7.1 Targeted Restaurant/Bar (with Function Centre element) Tenant Types 38
7.2 Marina Focussed Mixed Use Developments 43
8 Feasibility Testing 51
8.1 Overview 51
8.2 Construction Cost Assessment 51
8.3 Scenario Testing 53
8.4 Feasibility Assumptions 53

Toondah Harbour: Market Assessment and Development Strategy
8.5 Development Scenario Outcomes and Discussion 56
9 Developer Market Sounding 61
9.1 Overview 62
9.2 Residential Development 62
9.3 Marina Development 64
9.4 Bar/Restaurant Space with Function Capacity 64
9.5 Marketability of Development at Toondah Harbour 66
10 Financier Market Sounding 67
10.1 General Views on lending to infill projects 68
10.2 Typical Loan Conditions 69
10.3 Project Characteristics 69
10.4 Lending on Land & Planning Issues 71
10.5 Locational Preferences 72
10.6 Marina Development Lending 73
10.7 Proposed Development Agreement Structure For Toondah Harbour 73
10.8 Key Requirements to Select Optimal Procurement Framework 75
Toondah Harbour: Market Assessment and Development Strategy
List of Tables
Table 1: Recent Sales Unit - 2012 to YTD2013 ............................................................................................................ 20
Table 2: Recent Sales Houses - 2012 to YTD2013 ...................................................................................................... 21
Table 3: Recent Sales Townhouse - 2012 to YTD2013 ............................................................................................... 21
Table 4: Existing Marina Supply and Future Development Potential ............................................................................ 25
Table 5: Raby Bay Marina Advertised Marina Berth Information, July 2013 ................................................................ 27
Table 6: RQYS – 28 year lease terms remaining ......................................................................................................... 28
Table 7: Indicative Retail Spending, Toondah Catchment Area ................................................................................... 32
Table 8: Indicative Retail Demand, Toondah Catchment Area ..................................................................................... 33
Table 10: Small Format Supermarket/Convenience Store Leasing Evidence .............................................................. 36
Table 11: Speciality Stores including Cafes ................................................................................................................. 37
Table 12: Recommended Retail Mix ............................................................................................................................. 37
Table 13: Dwelling Type Level of Finish ....................................................................................................................... 53
List of Figures
Figure 1: Cleveland Housing Market Sales Cycle 1980 to 2013 ................................................................................. 12
Figure 2: Cleveland Housing Market - Proportion of Total Sales Greater Than $1million ........................................... 13
Figure 3: Cleveland House Market Resales Analysis 2002 to 2013 ............................................................................ 14
Figure 4: Cleveland v. Raby Bay House Market Analysis 1980 to 2013 ..................................................................... 15
Figure 5: Cleveland Residential Apartment Market Sales Cycle 1980 to 2013 ........................................................... 16
Figure 6: Cleveland Apartment Market Resales Analysis 2002 to 2013 ...................................................................... 17
Figure 7: Proportion of House Sales V. Median Sale Price ......................................................................................... 18
Figure 8: Queensland change in boat registrations (1997 – 2012) ............................................................................... 23
Figure 9: Boat registrations in primary catchment (2002-2012) ................................................................................... 23
Figure 10: Total Boat Registration by Size: Redland LGA, June 2003 - June 2013 .................................................... 24
Figure 11: Boat registrations over 6m, Redland LGA 2003-2013 ................................................................................ 25
Figure 12: Comparative Berth Sales Prices, Asking $ per lineal metre by Marina, 2013 ............................................. 29
Figure 13: Marina Berth Rental Rates, $ per lineal metre per annum, 2013 ................................................................ 29
Figure 14: Queensland Building Approvals .................................................................................................................. 52
Figure 15: Regional Residential Approvals ................................................................................................................... 52
Toondah Harbour: Market Assessment and Development Strategy
Disclaimer
The material contained in this report is confidential and was provided by Jones Lang LaSalle to the party to whom it is addressed strictly for the specific purpose to which it refers and no responsibility is accepted to any third party.
Neither Jones Lang LaSalle nor any of its associates have any other interests (whether pecuniary or not and whether direct or indirect) or any association or relationships with any of its associates that might reasonably be expected to be or have been capable of influencing Jones Lang LaSalle in providing this report.
Neither the whole of the report nor any part or reference thereto may be published in any document, statement or circular or in any communication with third parties or distributed without Jones Lang LaSalle’s prior written approval.
Whilst the material contained in the report has been prepared in good faith and with due care by Jones Lang LaSalle, no representations or warranties are made (express or implied) as to the accuracy of the whole or any part of the report.
Jones Lang LaSalle, its officers, employees, subcontractors and agents shall not be liable (except to the extent that liability under statute or by operation of law cannot be excluded) for any loss, liability, damages or expense suffered by any party resulting from their use of this report.
If a projection has been made in respect of future demand, business trends, property prices, rentals and projected take up rates, such a projection is an estimate only and represents only one possible result therefore should at best be regarded as an indicative assessment of possibilities rather than absolute certainties. The process of making forward projections of such key elements involves assumptions about a considerable number of variables that are acutely sensitive to changing conditions and variations, and any one of which may significantly affect the resulting projections. This must be kept in mind whenever such projections are considered.
The financial analysis and conclusions contained within this report do not purport to represent a valuation in the conventional sense. It is an exercise involving only relatively few variables, such as zoning information and a general knowledge of background market conditions; whereas, a valuation involves a detailed investigation of the property including, where appropriate, the nature of the locality, surrounding properties, full inspection, site peculiarities, the nature, quality and condition of improvements, comparable sales, market trends, yields, competition, design and layout and so on. The market value could be greatly affected by such factors, and by encumbrances, restrictions, or other impediments on Title which have not been considered in this report. Accordingly, the financial analysis contained herein is indicative only and not authoritative. It is merely a precursor to a formal valuation and should not be taken as a substitute for it.
Toondah Harbour: Market Assessment and Development Strategy, Page 1
1 Executive Summary
Jones Lang LaSalle has been appointed by Redland City Council to prepare a detailed development strategy to underpin the
preparation of the development scheme for the Toondah Harbour Development Area. This includes a range of tasks
including:
1. Detailed market assessment of the range of supportable land uses including the major components of residential,
retail and marina
2. Benchmarking of comparable projects to inform the scale, mix and function of each of the components and level of
integration. Key learnings relating to success factors and particularly short comings of the projects have also been
identified.
We summarise the key findings below:
o Residential Market The slow levels of sales activity can be partially attributed to land supply constraints for
detached dwellings, which is expected to continue. Slow sales activity for attached dwellings is partly attributable
to a mismatch between supply of and demand for medium density product to the local market, with demand being
for well-designed and well-priced product.
o Recently, there have been a number of strong new transactions and resales within Cleveland, particularly around
the Raby Bay Marina and canal development, illustrating that there is still strong demand from affluent residents to
reside within the region.
o Cleveland can be separated into two distinct markets, a premium residential market comprising of the Raby Bay
development and the broader Cleveland region. The distinction in the market is pronounced with the median sales
price for houses within Cleveland recorded at $535,000 during YTD2013, compared to $1.2 million for houses
within Raby Bay over the same period.
o There has been a shift towards apartment product over houses, which has been largely driven by an aged
demographic profile of the area and with limited new supply of detached dwellings in close proximity to the
Cleveland CBD. However, this medium density market is still relatively shallow and the attached product market is
in the early stages of acceptance.
o The broader slowdown in the residential market across South East Queensland has similarly impacted the
Cleveland apartment market with slow sales activity levels, with 89 sales were registered during 2012 and 32
YTD2013, below the 10 year average (2003 to 2013) of around 100 sales per annum. Sales of new products have
been particularly slow with no new project commencements for over 2 years.
o The slow levels of sales activity of medium density projects is considered to be partially attributed to a mismatch in
supply of medium density product to the local market with well-designed and well-priced product as well as sites
that were predominantly acquired at high prices and have yet to be re-based at current market prices.Toondah
Harbour is well positioned to provide a strong focus on medium density housing supply. It is quite clear that the
initial target demographic for product will be local owner occupiers due to historical purchasing trends for medium
density product in the local market. This would be via a combination of affluent older demographic that is current
residing within Raby Bay as well as broader middle income earners that will seek a more affordable product. This
will provide a diversity of product in the project and support stronger take-up rates. This will further broaden in time
with local investors expected to embrace the project more as it gathers momentum.
Toondah Harbour: Market Assessment and Development Strategy, Page 2
Marina Market
o As at June 2012, there were a total of 79,660 boats registered in the broader catchment area, with approximately
32% in Brisbane and 14% in the Redland LGA.
o An analysis of recreational boat registrations for the primary catchment area indicates strong growth over the last
10 years to June 2012. Growth in total registrations have averaged around 2,581 per annum over this period.
More recently this has been softer at 581 new vessel registrations over 2011-2012.
o In considering the above supply side assessment in conjunction with the boat registration growth within the
catchment area, this confirms our initial preliminary assessment of the total size of a potential marina at Toondah
Harbour is supportable at around 400 berths, which would be staged over an extended period of time
o For Redlands specifically, there has been solid growth in vessel registrations, with total registrations increasing an
average of 1.91% over a ten year period ending June 2012. While growth has slowed in line with the wider market,
there has been positive growth each year and increased growth from 2011.
o Further, we note that the nature of boat registration growth for vessels greater than 10 metres is in part influenced
by availability of wet and dry storage options within proximity for the registered owner. In this regard, it may be the
case that additional marina berth supply in the catchment will induce demand that would otherwise have not been
supported. As such, depth of demand for berths in the catchment area is expected see take-up of 400 berths
within 10 to 20 years.
Retail Market
o The retail component of Toondah Harbour has been assessed to ensure it caters to the local catchment and
provides a point of difference to the CBD to mitigate any direct competition.
o In this regard, the retail component of Toondah Harbour will need to have a dual role:
to cater to locally generated demand from within the new residential component in the project; and
to have a strong destinational role.
o The destinational role is particularly important given the prime oceanfront location, providing a major differentiator
to the retail offering for the broader Redland City Council area. It also recognises the importance of Toondah
Harbour in complementing and deepening the retail offering of Cleveland rather than competing with Cleveland
CBD.
o The mix within Toondah Harbour takes account of the retail role of Cleveland CBD. The CBD already has strong
performing components of the existing retail mix with the main component, the Stockland Retail Centre, having
strong performing supermarkets and some specialities, particularly those playing an ‘eat street’ role.
o The quantum of supportable retail space for Toondah Harbour is estimated to be a total of between 1,500sqm and
2,500sqm depending on the extent to which a marina is developed at Toondah Harbour and excluding the function
centre.
o The anchor component is recommended to be a waterfront pub/hotel and function/event centre with supporting
accommodation developed in time as the market considers supportable. This component will be a significant star
attractor to Toondah Harbour and is considered to have significant ‘pulling potential’ attracting a market from
across greater Brisbane and South East Queensland.
o The mix is recommended to include:
Local convenience grocery shopping (local residents and ferry passengers) with the CBD still performing
the role of major grocery shopping. Around 400sqm is considered supportable and appropriate for this
retail component.
Toondah Harbour: Market Assessment and Development Strategy, Page 3
An ‘Eat street’ with focus on restaurants, cafes and small format bars providing village and waterfront
dining opportunities. This will deliver an amenity level expected from local buyers of the new residential
and regularly cater to a broad demographic profile of residents from Raby Bay and Cleveland as well as
further afield including Victoria Point, Alexandra Hills and Capalaba.
Developer Market Sounding
o Market sounding regarding the redevelopment of Toondah Harbour has demonstrated a consistent view that in
order to be a successful development, it will need to be a high quality destinational project with supporting retail
amenity including boardwalks and recreational facilities. There will need to be a strong destination appeal to attract
the public, and embracing the waterfront position was seen as one of the more important factors.
o The greatest attribute of the site was considered to be its position at the gateway to the Moreton Bay Islands.
o The residential component of Toondah Harbour was noted by groups as the major contributor to development
returns and hence will be the component of most interest.
o The retail component will however require careful consideration to procuring the right development partner as this
will be the element that provides the strongest contribution to shaping identity for the project and contributing to
‘branding’ Cleveland. This aspect will also require careful consideration to how the retail interfaces with the
waterfront and other components of the project.
o Most groups recognised Cleveland has an aged demographic profile and that residential product would cater to
this market to appeal to this demographic.
o The Raby Bay area was confirmed by many groups as containing a significant potential purchaser market for a
new development, with a number of these residents downsizing but looking to remain the area. This is consistent
with our demographic analysis.
o Developers considered that compact townhouse and terrace stock would need to form a major part of Toondah
Harbour as it is less risky to develop than apartment developments and often delivers higher margins for this type
of stock due to considerably lower construction costs compared to apartments.
o The viability of apartments as investments was noted as challenging in Cleveland as the rental returns are not as
high as other markets within Brisbane. This is considered to be due in part to the wages in the area which are in
turn influenced by the white collar employment opportunities.
o Council infrastructure charges are considered to be high by some developer and constrain the viability of new
development. However, this should be considered in the context of some developers holding sites that were
acquired at closer to the peak of the market, and the impact of some schemes that are not considered to be well-
positioned to suit the current market.
o Nevertheless, it is considered that the discount of infrastructure charges for the Cleveland CBD should be
extended to incentivise increased medium density development activity in the broader Cleveland area for the
benefit of stimulating wider interest in investment and development opportunities and encouraging a walkable
medium density community between Toondah Harbour, the Cleveland CBD and immediate surrounds.
o Car parking ratios are recommended to be increased to a minimum of 1.5 and not a maximum rate. This will
enable the market to respond to market needs and provide sufficient parking to meet demand.
o A number of constraints will be required to be resolved in order to provide certainty to the market. These range
from a detailed dredging plan including spoil disposal plan, solutions for marine traffic management and cost
effective delivery and positioning of revetment walls. The marina component will be the most complicated to

Toondah Harbour: Market Assessment and Development Strategy, Page 4
deliver and even so may not deliver high enough returns such that offsetting on-land development is required by
the developer to secure sufficient interest in the marina.
o The importance of streamlined development conditions for private developers was highlighted, with an emphasis
on reduced red tape. Flexibility through a structure such as development management agreement / development
lease will provide Council with the ability to support viable and early development. This was viewed by developers
as a positive approach to facilitating the project.
o The current status of Cleveland’s CBD was noted as a major constraint with but identified as a major opportunity to
boost investment and renewal to enhance the overall offering of the area in order to support stronger interest in
Toondah Harbour. Suggested initiatives included:
Alfresco dining opportunities
Streamlined approval processes
Improving depth of economic drivers
o Council’s positive initiatives already made in this regard and pro-investment approach was noted by several
developers. Following an outline of the objectives and approach for the Cleveland CBD Investment Attraction
Strategy all groups consulted were highly supportive of this initiative.
Financier Market Sounding
o Most banks are generally looking for between 75% and 100% debt coverage from pre-sales, depending on the
sponsor and their equity in the project.Lenders are generally supportive of financing infill development.
o Shorter timeframes relative to staged greenfield development means financiers can be in and out of projects in
around 2 years, lowering market risks associated with timing due to greater certainty of being able to commence
and complete a project in the same part of a cycle;
o The loan ‘sponsor’ (i.e. developer) and their track record is by far the largest part of financiers’ decisions to back
projects at present;
o Toondah Harbour was noted as an attractive project to consider funding from a locational and lifestyle focus,
although all financiers noted that relatively low levels of demand would need to be evaluated closely to ensure
supply and staging was appropriately balanced.
o General lending risk aversion is still high, but some smaller banks are competing on both terms and speed of
lending to gain market share.
o Project size is a strong consideration for the major banks at present, with a need to have staging and size limited to
ensure the project can achieve pre-sales and be developed inside ‘one cycle’.
o This is equating to between 30% and 50% (on average) of residential product to be pre-sold before debt funding
can be secured to commence construction.
o Banks are supportive of innovative product and construction techniques and see a benefit of shorter and cheaper
construction lowering project risks.
o The PDA for Toondah Harbour was viewed as a positive in supporting a fast tracked development, although
planning risk would largely be resolved prior to banks requiring to commit substantial funds to the project
o Partnering arrangements with State Government and the private sector have been viewed favourably although
documentation was noted as a key issue to minimise complexities that will impact the ability to assess funding
security.
Toondah Harbour: Market Assessment and Development Strategy, Page 5
o Generally lenders were not supportive of marina developments, due to recent experiences in write downs on debt
facilities attached to marinas. A marina as part of a mixed used development was viewed more favourably,
providing that the marina was independently able to be developed (operationally and financially) and that other
components of the development were de-risked through high levels of pre-commitments and presales.
o Any marina component of a proposed development at Toondah Harbour will likely need a higher equity contribution
as debt funding levels will not likely be as high due to risk and that current valuation approaches for marina assets
means lower values for these assets. It was suggested that the marina component should not represent more than
around 20% of total costs of the overall Toondah Harbour mixed use project.
Development Partnering Arrangements
o Feedback was sought from developers with experience in mixed used and marina projects regarding the proposed
Development Agreement approach as to whether it was a) workable and b) the most effective means of optimising
the outcome at Toondah Harbour for both RCC and the Developer.
o The market response was very positive as a means to help facilitate getting a development partner on board for
such a challenging project, with some suggestions about specific approach to facilitating key outcomes for the
project such as specific land uses and outcomes that may be desired by RCC.
o Facilitating such an arrangement will require consideration of a number of elements such as land payment terms to
ensure the arrangement is more easily able to be assessed for funding by financiers. It will also require
consideration by Council of a number of elements including:
Council’s vision and objectives for the project
Risk acceptance levels. In particular Council’s preferred ranking of the various project objectives
including the relative importance of maximising development revenue;
The level of intervention / role that Council would like to play in working with the private sector to realise
an outcome. This will help identify which risks are preferred to be transferred to the private (or must be
transferred to the private sector). This will then inform the type of procurement model and how to engage
with and attract interest from the private sector;
o In addition, key factors to address in establishing the structure of the agreement will be the confirmation of
The principles for the State’s transfer of land and returns required;
Land tenure especially in relation to conversion of the reserve land to freehold; and
Dredging obligations and cost sharing arrangements

Toondah Harbour: Market Assessment and Development Strategy, Page 6
2 Introduction
Jones Lang LaSalle has been appointed by Redland City Council to prepare an economically sound and robust development
strategy to underpin the preparation of the development scheme for this landmark waterfront site at Cleveland. The
formulation of a robust development strategy for Toondah Harbour builds on our recent preliminary development strategy we
prepared for Economic Development Queensland (formerly Urban Land Development Authority) in late 2012. We recognise
the strategic waterfront location of the site carries great significance for both Cleveland and indeed the South East
Queensland region as the gateway to one of the State’s most important tourism assets, North Stradbroke Island,
affectionately known as “Straddie”. In recognition of this importance, the site has long been earmarked for upgrade and
development over many decades. Most recently, the current Redland City Council acted decisively on this opportunity and
nominated to the State Government that the site be declared a Priority Development Area (PDA). This declaration was
announced in June 2013. This will provide the platform to commence the process of facilitation of a strong development
outcome.
The primary objective of this report is to provide the commercial foundation for the development strategy for Toondah
Harbour. This will support a range of outcomes including:
o Outline the range of market supportable land uses with regard to the highest and best uses for the site,
o Outline the likely financial feasibility of each of the recommended land uses,
o Guide the formulation of the development the concept to support the preparation of the planning scheme over the
site
o Support the project team in identifying the necessary elements to facilitating a successful transaction with the
private sector to develop the site, including an outline of the recommended procurement framework and an
approach and mitigating major barriers to successful development of the site
Based on these key outcomes, the report is structured into the components as detailed below;
Market Assessment and Development Strategy
This baselines analysis concentrates on the completion of a robust assessment of the core information required to formulate the most viable development outcome and understand the key market drivers for the project.
It will also identify the major market barriers and the strategy necessary to mitigate these impacts such that successful engagement with the private sector to deliver the project can be achieved. This will set the foundation for the approach to running the process (via an EOI process) for securing the developer partner(s) for the project.
The baseline analysis and development strategy has been separated into a number of subsections, each providing crucial inputs into the strategy. This is summarised as follows:
o Establish project programme objectives and framework, which includes setting and clarifying key aspects including:
Vision and objectives
Key stakeholders and their drivers
Communication protocols
Programme timeframes, deliverables and milestones
Project team structure and resourcing plan
Role of the State in supporting the facilitation process for the PDA
Council’s key drivers and extent of preferred role in the project
Background information and key issues that Council is aware of that may directly or indirectly have a material
influence on the development of Toondah Harbour
o Refinement of Master Plan Concept Viability and Market Drivers – this subsection identifies the key
catalysts/enablers required to support development and major barriers or roadblocks and associated mitigation
Toondah Harbour: Market Assessment and Development Strategy, Page 7
strategies. This builds on the preliminary development strategy completed by Jones Lang LaSalle in late in 2012
and extends the research to explore areas of most need. This includes:
Residential – more in-depth price point and market performance analysis, supported by detailed market
consultation with developers
Marina – price points for the main competing marinas and detailed understanding of target market and
performance including comparable benchmark project assessment and consultation with marina developers
Retail – retail market conditions, outlook, supportable space and relationship with retail in the Cleveland CBD
Function centre / event space demand – further analysis of successful comparable function centres and
consultation with high profile operators.
o Feasibility Testing – developing a strong understanding of the likely financial viability of a range of uses outlined in
the recommended mix of uses in the development strategy. The output of this subsection will be to clearly
summarise the most viable uses and recommendations for actions that Council may be able to take to improve
viability.
o Preliminary Market Sounding – conducted to gauge representative views from the industry on the most viable and
suitable form of development and to inform the structure plan.
o Procurement Strategy Framework – following the completion of the above four components of work, Jones Lang
LaSalle will formulate the recommended procurement strategy.
The completion of the above components will provide the commercial foundation for the preparation of the development
scheme for the site and support the procurement process through to selection of the preferred development partner(s) for the
project.
Toondah Harbour: Market Assessment and Development Strategy, Page 8
3 Project Programme Objectives and Framework
Jones Lang LaSalle has worked with the project team from Redland City Council and the broader project team of consultants
to establish the key programme objectives and framework. This is summarised below:
3.1 Vision and objectives
A vision and strong objectives for the redevelopment of Toondah Harbour is being developed by Redland City Council. Our
understanding of the issues and drivers of the project and expected vision and objectives for the project are noted below:
1. To transform the site into a high quality destination that provides a high standard of amenity that elevates the status of
the area as the launching point to one of South East Queensland’s most important tourist destinations - Stradbroke
Island.
o The Cleveland community have long had a vision for the development of a high standard of facilities at
Toondah Harbour as the major launching point to one of South East Queensland’s ‘hidden gems’ and an
important tourist destination, Stradbroke Island. The current site is dominated by open air car parking and
provides limited amenity for local residents and visitors to Stradbroke Island.
2. Enhance the waterfront for local residents to provide a unique and attractive mixed use destinational focus in its own
right.
o This includes a range of commercial, retail, residential and marine based uses that complement Stradbroke
Island ferry infrastructure to deliver a holistic experience for local residents, and visitors alike.
3. Resolve the range of complex issues for the site to provide a workable and viable framework that will entice the
private sector to actively participate in the development of the site
o It is well documented that the site has a number of complex issues to be managed in order to successfully
deliver the redevelopment of this important location.
4. To ensure the project can be delivered at no net cost to the Council if possible, with a stretch target of delivering a
level of positive financial contributions over the life of the project
o At this early stage in the project, with limited knowledge of total site development costs Council objectives are
flexible but provide a clear preference for positive financial outcomes.
5. To ensure maximum opportunity is provided for innovative responses from the private sector.
o In doing so, Council are committed to providing high levels of commercial flexibility to deliver a quality and
timely outcome. Importantly, Council as a prudent financial manager of rate payer funds recognises this must
be balanced with an acceptable level of commercial risk transferred to the private sector to ensure that
development risks are best managed by those with expertise to do so. This will ensure the project is
appropriately managed with due regard to limiting Council’s exposures to those most readily able to be
controlled by Council.
Toondah Harbour: Market Assessment and Development Strategy, Page 9
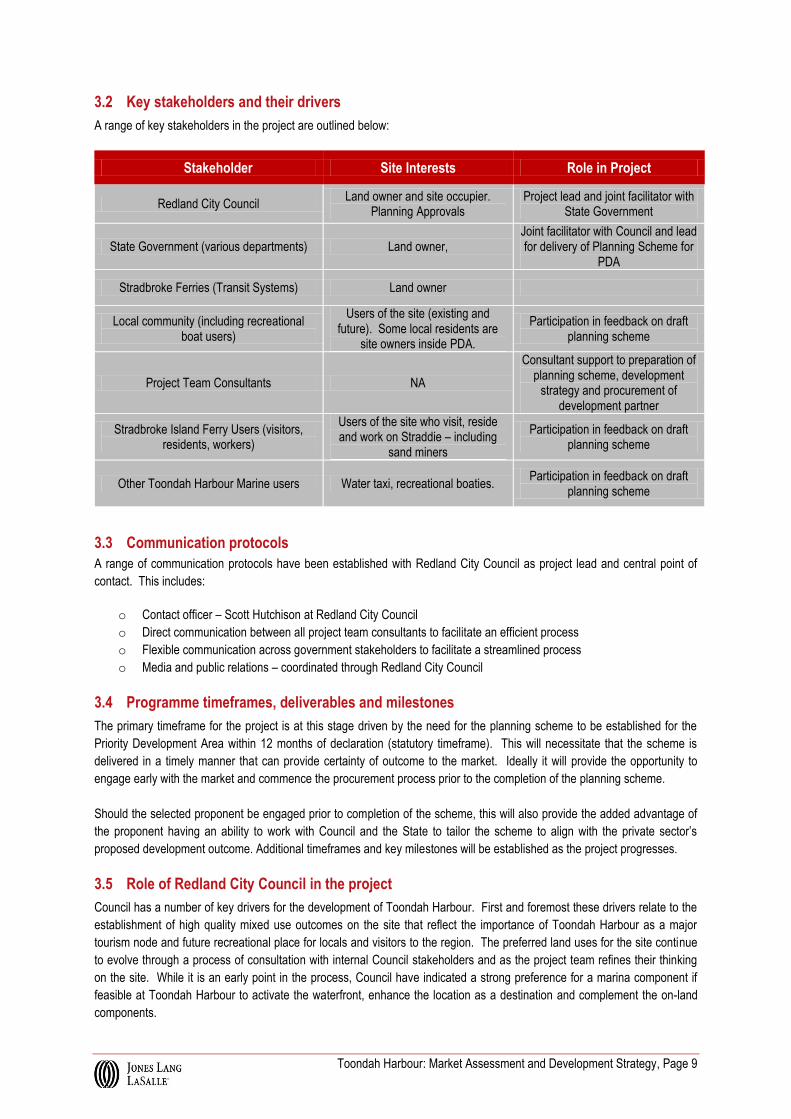
3.2 Key stakeholders and their drivers
A range of key stakeholders in the project are outlined below:
Stakeholder Site Interests Role in Project
Redland City Council Land owner and site occupier.
Planning Approvals Project lead and joint facilitator with
State Government
State Government (various departments) Land owner, Joint facilitator with Council and lead for delivery of Planning Scheme for
PDA
Stradbroke Ferries (Transit Systems) Land owner
Local community (including recreational boat users)
Users of the site (existing and future). Some local residents are
site owners inside PDA.
Participation in feedback on draft planning scheme
Project Team Consultants NA
Consultant support to preparation of planning scheme, development
strategy and procurement of development partner
Stradbroke Island Ferry Users (visitors, residents, workers)
Users of the site who visit, reside and work on Straddie – including
sand miners
Participation in feedback on draft planning scheme
Other Toondah Harbour Marine users Water taxi, recreational boaties. Participation in feedback on draft
planning scheme
3.3 Communication protocols
A range of communication protocols have been established with Redland City Council as project lead and central point of
contact. This includes:
o Contact officer – Scott Hutchison at Redland City Council
o Direct communication between all project team consultants to facilitate an efficient process
o Flexible communication across government stakeholders to facilitate a streamlined process
o Media and public relations – coordinated through Redland City Council
3.4 Programme timeframes, deliverables and milestones
The primary timeframe for the project is at this stage driven by the need for the planning scheme to be established for the
Priority Development Area within 12 months of declaration (statutory timeframe). This will necessitate that the scheme is
delivered in a timely manner that can provide certainty of outcome to the market. Ideally it will provide the opportunity to
engage early with the market and commence the procurement process prior to the completion of the planning scheme.
Should the selected proponent be engaged prior to completion of the scheme, this will also provide the added advantage of
the proponent having an ability to work with Council and the State to tailor the scheme to align with the private sector’s
proposed development outcome. Additional timeframes and key milestones will be established as the project progresses.
3.5 Role of Redland City Council in the project
Council has a number of key drivers for the development of Toondah Harbour. First and foremost these drivers relate to the
establishment of high quality mixed use outcomes on the site that reflect the importance of Toondah Harbour as a major
tourism node and future recreational place for locals and visitors to the region. The preferred land uses for the site continue
to evolve through a process of consultation with internal Council stakeholders and as the project team refines their thinking
on the site. While it is an early point in the process, Council have indicated a strong preference for a marina component if
feasible at Toondah Harbour to activate the waterfront, enhance the location as a destination and complement the on-land
components.
Toondah Harbour: Market Assessment and Development Strategy, Page 10
Council has adopted a proactive approach to facilitate positive development outcomes on the site in a timely manner. In
doing so, Council has already started to form a strong foundation for their preferred role in the project. This includes
ensuring a commercially grounded approach to supporting the procurement of a developer(s) to deliver the project through
removing barriers to development and providing for high levels of flexibility to underpin a viable and successful development
outcome. This may include Council having an enduring role in the project to support it throughout the various phases of its
development and a range of non-commercial drivers that reflect the diverse objectives of the project, with strong emphasis
on it being a community building project and not just solely profit-driven.
3.6 Role of the State in supporting the facilitation process for the PDA
Economic Development Queensland is providing a key role in facilitating the development of the site through ensuring the
planning scheme for the Priority Development Area is established within 12 months of declaration of the PDA. This also
includes assisting in resolving issues associated with various tenures and land ownership arrangements across the site and
working collaboratively with Council in working up a framework for contribution and returns associated with State owned land
for the project.
3.7 Other Relevant Background Information to the Project
Through our previous assessment of the development opportunity at Toondah Harbour, and through our further consultation
and analysis of the project, we have identified a range of issues that will require resolution in order to progress the
development of Toondah Harbour. These are critical to resolve at the earliest opportunity with the most significant potential
barriers to facilitating a development outcome briefly summarised as follows:
o Land tenure – significant parts of the site within the PDA are currently not in suitable tenure to enable
procurement of the developer(s) to deliver the project. The most significant of these issues is the Reserve tenure. Native Title is being investigated to confirm if it has been extinguished or not. This issue will need to be resolved to a level of certainty before the market can be formally engaged. EDQ are advising on the process required to work through to confirm the status of Native Title and advise on the best approach to reach a resolution. The outcomes of this will determine the area able to be developed and in-turn will influence the procurement process for how the site is taken to market.
o Dredging – the dredging of Toondah Habour is a complex issue that requires further assessment of the costs and environmental impacts of a range of options (including establishing whether the Northern Channel option is a viable option) to determine the optimal solution. This will include a cost effective and environmentally acceptable solution for disposal of dredge spoil (potentially through reclaimed land) and the need to determine a suitable funding plan amongst stakeholder groups (State, Local, Commercial operators) for both capital and maintenance dredging.
o Stradbroke Ferries Role – the role and expectations of the owner of Stradbroke Ferries (Transit Systems) are required to be established early on in the process to ensure certainty and consistency of how their land holdings and operational requirements are to be included in the procurement process. The site that Transit Systems own is at the centre of the site, making it particularly important to resolve prior to commencing the procurement process.
o Coastal Management Plan – the current mapping of the site indicates significant potential inundation under storm tide surge scenarios that are modelled on a 1:100 year event with assumed sea level rises. Development of the site will require a practical and economical solution to this issue to ensure that development viability is optimised through a combination of the most cost effective town planning and engineering based solution.
Toondah Harbour: Market Assessment and Development Strategy, Page 11
4 Toondah Residential Market Overview
Key Insights
The median sales price for houses within the suburb of Cleveland during YTD2013 was recorded at $535,500 compared to
$357,500 for apartments.
Sales rates are still slow with 189 sales during 2012 and 65 YTD 2013, which is considerably below the 10 year average
(2003 to 2013) of 236 sales per annum. This partly reflects limited land supply remaining in the immediate area for creation
of new detached dwellings.
The apartment market is also still slow with 89 sales registered during 2012 and 32 YTD2013; also well below the 10 year
average (2003 to 2013) of 100 sales per annum. Sales of new product have been particularly slow, with no new project
commencements for over 2 years.
The residential market within the suburb of Cleveland undergone two periods of significant growth, following the
introduction of the Raby Bay development in the mid 1980’s and a secondary surge in the early 2000’s. Post GFC, the
market within Cleveland has experienced limited activity with the number of transactions for houses and apartments
considerably below the long term average.
The slow levels of sales activity can be partially attributed to land supply constraints for detached dwellings which is
expected to continue with and for attached dwellings is partly attributable to a mismatch in supply of medium density
product to the local market with well-designed and well-priced product.
Recently, there have been a number of strong new transactions and resales within Cleveland, particular around the Raby
Bay Marina and canal development, illustrating that there is still strong demand from affluent residents to reside within the
region.
There has been a shift towards apartment product over houses, which has been largely driven by a shifting demographic
and affordability constraints and limited new supply of detached dwellings in close proximity to the Cleveland CBD.
Moving forward, Toondah Harbour has the opportunity to capitalise on the potential undersupply of new product within
Cleveland, which given the future development pipeline is set to continue over the short to medium term. Toondah can also
offer a diverse produce mix to target both affordability and also the shifting demographic.
Cleveland can be separated into two distinct markets, a premium residential market comprising of the Raby Bay
development and the broader Cleveland region. The distinction in the market is pronounced with the median sales price for
houses within Cleveland recorded at $535,000 during YTD2013, compared to $1.2 million for houses within Raby Bay over
the same period.
It is quite clear that the initial target demographic for product will be local owner occupiers due to historical purchasing
trends for medium density product in the local market. This would be via a combination of affluent older demographic that
is current residing within Raby Bay as well as broader middle income earners that will seek a more affordable product. This
will provide a diversity of product in the project and support strong take-up rates. This will further broaden in time with local
investors expected to embrace the project more as it gathers momentum.
The residential sales analysis has been conducted for the suburb of Cleveland and examines the residential house and
apartment markets. It should be noted that the residential data is only to Year to Date 2013 (YTD2013), therefore is only up
till July and is considered preliminary data. The suburb of Cleveland was selected because it provided the best benchmark
for the potential residential development within Toondah Harbour.

Toondah Harbour: Market Assessment and Development Strategy, Page 12
4.1 Residential Analysis – House Market
The chart below illustrates the number of settled house transactions and median sales price, on an annual basis, from 1980
to YTD2013.
Figure 1: Cleveland Housing Market Sales Cycle 1980 to 2013
Source: Jones Lang LaSalle Research & Consulting, RPData
The median sales price for residential houses within Cleveland was recorded at $535,000 for the YTD2013, based on 65
settled transactions. The median sales price has registered strong growth between 2012 and YTD 2013, with an increase in
price of 6.7%.
Market activity within Cleveland has remained subdued post GFC with the number of transactions well below the 20 year
annual average. There has been some recent positive activity within the market with the volume of transactions (number of
sales) increasing during 2012, the first such occurrences post GFC. One of the main causes in the decline in market activity
has been the lack of recent development within Cleveland. The dwelling approvals data for the suburb of Cleveland
illustrates that between 2002 and 2012, on average 42 houses have been approved for development per annum. Over the
last three year period ending 2012, this number of has declined to only 23 houses per annum. This is largely considered to
reflect the limited availability of land for new detached dwellings in the immediate area, particularly when compared to the
larger master planned estates which offer a high level of amenity which typically provide for a level of new supporting retail,
recreational and community facilities.
The limited number of new houses on the market can also be linked to the decline in the median sales price between 2009
and 2011. In a small sample size market, such as Cleveland, the sales price can be distorted by a high proportion of one
particular segment of the market being dominant for transactions. Within Cleveland almost all the premium dwellings are
located within the Raby Bay canal development. A higher proportion of more affordable transactions were evident between
2009 and 2011 with the number of transactions above $1 million declining considerably but conversely the number of
transactions for housing less than $500,000 increasingly. On the other hand during 2012 where the median sales price
registered strong growth, the number of sales above the $1 million market increased significantly, suggesting a recovery in
the more premium segment of this market.
Figure 2 illustrates the proportion of total sales greater than $1 million, highlighting how the median sales price for Cleveland
is directly linked to the premium dwelling market within Raby Bay.
$0
$100,000
$200,000
$300,000
$400,000
$500,000
$600,000
0
50
100
150
200
250
300
350
400
450
500
1982
1983
1984
1985
1986
1987
1988
1989
1990
1991
1992
1993
1994
1995
1996
1997
1998
1999
2000
2001
2002
2003
2004
2005
2006
2007
2008
2009
2010
2011
2012
2013
Med
ian
Sal
es P
rice
($)
Nu
mb
er o
f T
ran
sact
ion
s
Number of Transactions Transactions (20 Year Annual Average) Median Sales Price ($)

Toondah Harbour: Market Assessment and Development Strategy, Page 13
Figure 2: Cleveland Housing Market - Proportion of Total Sales Greater Than $1million
Source: Jones Lang LaSalle Research & Consulting, RPData
The chart below illustrates the median sales price and number of settled house transactions for both new stock and resale
stock. Resale house transactions are the subsequent transactions following the purchase of the house. The resale chart is
intended to illustrate a number of key elements including;
o The difference between the new stock median sales price and resale stock median sales price is referred to as ‘the
new dwelling premium'. The new dwelling premium is a key indicator as it illustrates the strength and affordability of
the resale market and the type of new dwellings that are currently transacting.
o The proportion of new stock transactions compared to resale transactions provides an insight to the development
conditions within a region. In regions that are undergoing significant development the proportion of new stock
transactions is relatively high. If the proportion of new stock transactions is low the market may be undersupplied
with new stock and could represent an opportunity to boost supply of new dwellings.
0.0%
5.0%
10.0%
15.0%
20.0%
25.0%
2002 2003 2004 2005 2006 2007 2008 2009 2010 2011 2012 2013
Proportion of Total Sales Greater than $1 million
Period of softening in the median sales price
corresponding with a decline in activity within
the ‘premium housing market’
Toondah Harbour: Market Assessment and Development Strategy, Page 14
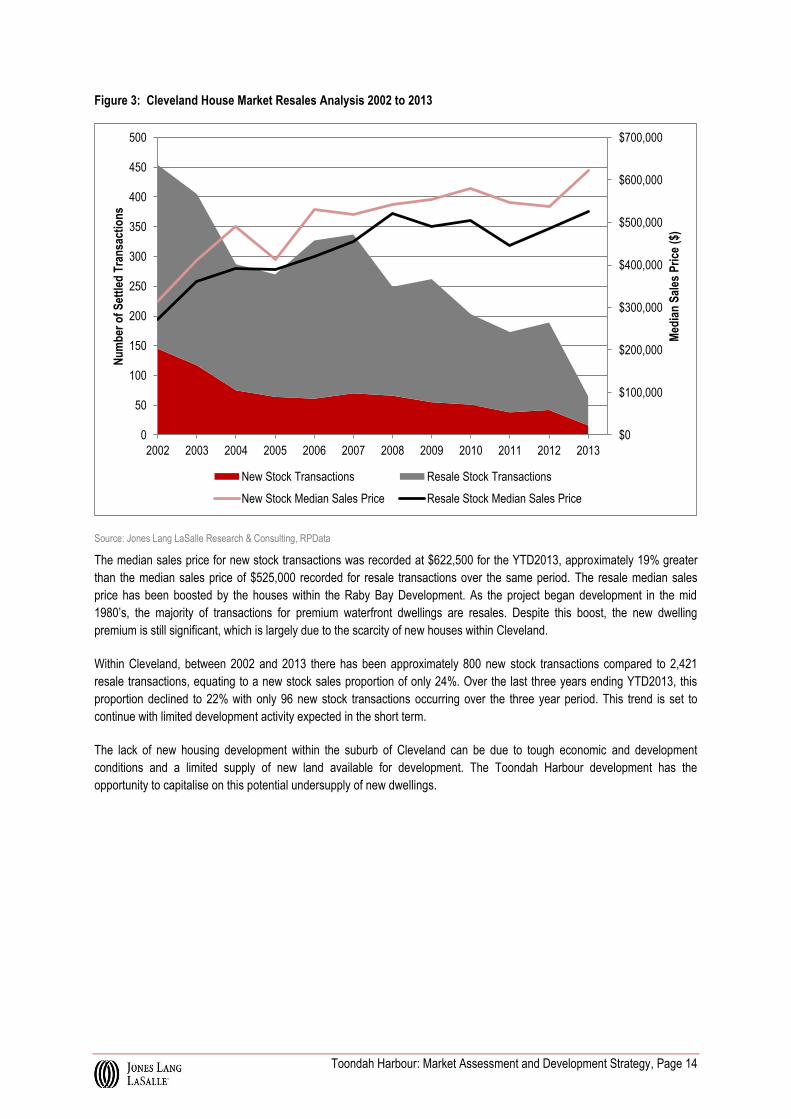
Figure 3: Cleveland House Market Resales Analysis 2002 to 2013
Source: Jones Lang LaSalle Research & Consulting, RPData
The median sales price for new stock transactions was recorded at $622,500 for the YTD2013, approximately 19% greater
than the median sales price of $525,000 recorded for resale transactions over the same period. The resale median sales
price has been boosted by the houses within the Raby Bay Development. As the project began development in the mid
1980’s, the majority of transactions for premium waterfront dwellings are resales. Despite this boost, the new dwelling
premium is still significant, which is largely due to the scarcity of new houses within Cleveland.
Within Cleveland, between 2002 and 2013 there has been approximately 800 new stock transactions compared to 2,421
resale transactions, equating to a new stock sales proportion of only 24%. Over the last three years ending YTD2013, this
proportion declined to 22% with only 96 new stock transactions occurring over the three year period. This trend is set to
continue with limited development activity expected in the short term.
The lack of new housing development within the suburb of Cleveland can be due to tough economic and development
conditions and a limited supply of new land available for development. The Toondah Harbour development has the
opportunity to capitalise on this potential undersupply of new dwellings.
$0
$100,000
$200,000
$300,000
$400,000
$500,000
$600,000
$700,000
0
50
100
150
200
250
300
350
400
450
500
2002 2003 2004 2005 2006 2007 2008 2009 2010 2011 2012 2013
Med
ian
Sal
es P
rice
($)
Nu
mb
er o
f S
ettl
ed T
ran
sact
ion
s
New Stock Transactions Resale Stock Transactions
New Stock Median Sales Price Resale Stock Median Sales Price

Toondah Harbour: Market Assessment and Development Strategy, Page 15
4.2 Raby Bay v. Cleveland Housing Markets
The residential housing market can be separated into two distinct markets, the premium Raby Bay canal estate and the
surrounding broader Cleveland market. Ray Bay commenced construction in 1983/84 and is considered one of the earliest
large scale master planned communities to embrace canal living in South East Queensland. The development was
successful in drawing a more affluent demographic to the region. With this market segment still considered premium some
30 years later, we consider that there is strong potential for Toondah Harbour to replicate this success.
The chart below illustrates the median sales price for houses located within Raby Bay when compared to the broader suburb
of Cleveland. The transactions within Raby Bay have been separated from the median sales price for Cleveland to illustrate
the differences between the two markets. The graph is also utilised to understand the potential price points that a premium
waterfront development could achieve within Toondah Harbour.
It should be noted that the median sales price for Raby Bay was based off a small sample size, which has contributed to the
fluctuations in the median sales price.
Figure 4: Cleveland v. Raby Bay House Market Analysis 1980 to 2013
Source: Jones Lang LaSalle Research & Consulting, RPData
The median sales price for houses within the Raby Bay development was recorded at $1.2 million for YTD2013 compared to
$505,000 for the broader Cleveland region. The median sales price within Raby Bay has softened since its peak of $1.49
million in 2008, consistent with the effects of the GFC on a high proportion of waterfront and premium houses.
We consider that there is similarly strong potential for Toondah Harbour to attract a similar demographic to that of Raby Bay
by offering a component of premium waterfront houses or townhouse dwellings. The high median sales price, which has
been consistently above $1 million since 2003, provides a strong indication that there is a market that would want to reside
within a premium dwelling with Toondah Harbour and that this market has fared remarkably well throughout the GFC and
recovery period suggesting a high level of price resilience, with demand outstripping supply, prices remaining relatively firm
and sufficient wealth to weather the downturn.
The size of Raby Bay also provides a good indication as to the market depth of this premium market. Between 2002 and
YTD2013, there has been 467 sales (both new and resale) within the project with an average of approximately 40 sales per
annum. Given the size of the Toondah Harbour development, the project would only need to attract a small market share of
this premium market to make the premium house or townhouse section feasible and support strong take-up rates.
$0
$200,000
$400,000
$600,000
$800,000
$1,000,000
$1,200,000
$1,400,000
$1,600,000
1980
1981
1982
1983
1984
1985
1986
1987
1988
1989
1990
1991
1992
1993
1994
1995
1996
1997
1998
1999
2000
2001
2002
2003
2004
2005
2006
2007
2008
2009
2010
2011
2012
2013
Med
ian
Sal
es P
rice
($)
Raby Bay Houses Cleveland (Not Including Raby Bay)
Toondah Harbour: Market Assessment and Development Strategy, Page 16
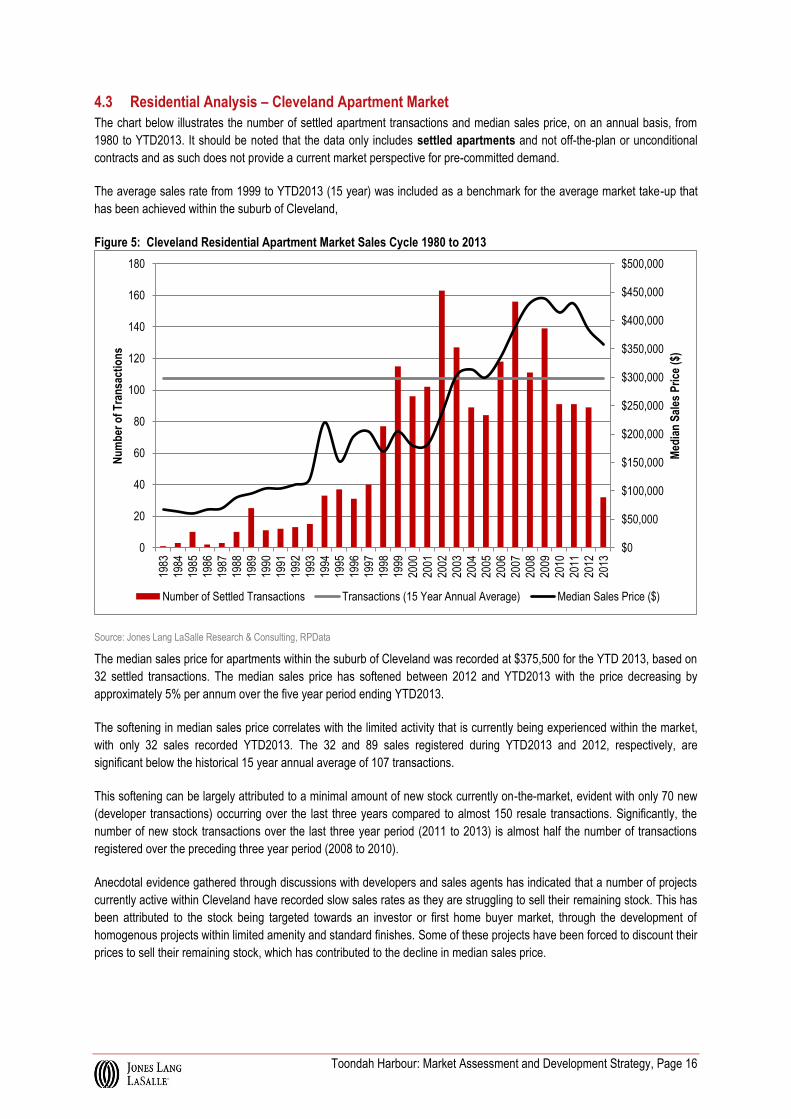
4.3 Residential Analysis – Cleveland Apartment Market
The chart below illustrates the number of settled apartment transactions and median sales price, on an annual basis, from
1980 to YTD2013. It should be noted that the data only includes settled apartments and not off-the-plan or unconditional
contracts and as such does not provide a current market perspective for pre-committed demand.
The average sales rate from 1999 to YTD2013 (15 year) was included as a benchmark for the average market take-up that
has been achieved within the suburb of Cleveland,
Figure 5: Cleveland Residential Apartment Market Sales Cycle 1980 to 2013
Source: Jones Lang LaSalle Research & Consulting, RPData
The median sales price for apartments within the suburb of Cleveland was recorded at $375,500 for the YTD 2013, based on
32 settled transactions. The median sales price has softened between 2012 and YTD2013 with the price decreasing by
approximately 5% per annum over the five year period ending YTD2013.
The softening in median sales price correlates with the limited activity that is currently being experienced within the market,
with only 32 sales recorded YTD2013. The 32 and 89 sales registered during YTD2013 and 2012, respectively, are
significant below the historical 15 year annual average of 107 transactions.
This softening can be largely attributed to a minimal amount of new stock currently on-the-market, evident with only 70 new
(developer transactions) occurring over the last three years compared to almost 150 resale transactions. Significantly, the
number of new stock transactions over the last three year period (2011 to 2013) is almost half the number of transactions
registered over the preceding three year period (2008 to 2010).
Anecdotal evidence gathered through discussions with developers and sales agents has indicated that a number of projects
currently active within Cleveland have recorded slow sales rates as they are struggling to sell their remaining stock. This has
been attributed to the stock being targeted towards an investor or first home buyer market, through the development of
homogenous projects within limited amenity and standard finishes. Some of these projects have been forced to discount their
prices to sell their remaining stock, which has contributed to the decline in median sales price.
$0
$50,000
$100,000
$150,000
$200,000
$250,000
$300,000
$350,000
$400,000
$450,000
$500,000
0
20
40
60
80
100
120
140
160
180
1983
1984
1985
1986
1987
1988
1989
1990
1991
1992
1993
1994
1995
1996
1997
1998
1999
2000
2001
2002
2003
2004
2005
2006
2007
2008
2009
2010
2011
2012
2013
Med
ian
Sal
es P
rice
($)
Nu
mb
er o
f T
ran
sact
ion
s
Number of Settled Transactions Transactions (15 Year Annual Average) Median Sales Price ($)

Toondah Harbour: Market Assessment and Development Strategy, Page 17
The chart below illustrates the median sales price and number of settled apartment transactions on an annual basis between
2002 and YTD2013 for new and resale stock.
Figure 6: Cleveland Apartment Market Resales Analysis 2002 to 2013
Source: Jones Lang LaSalle Research & Consulting, RPData
The median sales price for new apartments was recorded at $380,000 over the YTD2013, 8% greater than the median sales
price recorded for resale apartments, $352,500, over the same period. However, this is down from $450,000 in 2011
highlighting the strong price pressures evident in this segment of the market. Similar to the housing market, the median
sales price for new apartment has been consistently higher than resale stock, which is normal for most markets that are
broadly in balance. This premium has averaged around 10-15% for new dwellings compared to existing dwellings.
The apartment market within Cleveland experienced a significant influx in stock during 2002 with 109 new apartment
transactions recorded. Since 2002, the number of new stock transactions has continued to decline, indicating that there has
been a stagnation of development conditions within the region. Between 2003 and YTD2013, there has been approximately
417 new apartment sales, equating to a sales rate of 38 transactions per annum. The sales rate has declined over the last
few years with only 24 sales per annum between 2010 and 2013, highlighting the lack of new stock on the market.
Toondah Harbour has a number of distinct advantages over the new apartments currently on the market, including the
potential for water views, a master planned development and significant internal amenity. These advantages could allow any
potential density development within the region to generate a strong market share, which given that the apartments proposed
will be boutique projects should allow the development to move quickly through the stages.
$0
$50,000
$100,000
$150,000
$200,000
$250,000
$300,000
$350,000
$400,000
$450,000
$500,000
0
20
40
60
80
100
120
140
160
180
2002 2003 2004 2005 2006 2007 2008 2009 2010 2011 2012 2013
Med
ian
Sal
es P
rice
($)
Nu
mb
er o
f S
ettl
ed T
ran
sact
ion
s
New Stock Transactions Resale Stock Transactions
New Stock Median Sales Price ($) Resale Stock Median Sales Price ($)

Toondah Harbour: Market Assessment and Development Strategy, Page 18
The chart below illustrates the proportion of house sales (against total house and apartment sales within the suburb of
Cleveland) against the median sales price for both houses and apartments.
Figure 7: Proportion of House Sales V. Median Sale Price
The proportion of declining house sales illustrates the continued change in product preferences within the suburb of
Cleveland with a continued increase in the proportion of apartment sales evident. The change in product preference can be
driven by;
o Affordability – one of the key constraints on a residential market is affordability, especially the price of houses
within a region. Interestingly, when comparing detached product to apartment product within Cleveland, it can be
seen that the price of an apartment, which was boosted by a smaller sample size and high end waterfront product,
was identical to a house at $170,000 in 1997. As houses continued to be developed and the region continued to
grow the median house price increased considerably to $525,000 only 10 years later. This is considered to have
priced a lot of potential purchasers and residents out of the market shifting focus to medium density dwellings as
the only option to remain in the area. Between 1998 and 2013, the house priced increased by $365,000 compared
to only $187,500 for apartments, however; the proportion of house sales declined by 13%, illustrating the
densification that occurred within the region.
o Shifting Demographics – The suburb of Cleveland has undergone a significant demographic change between the
2001 and 2011 Census with the vast majority of population growth occurring within the 55 years and above age
bracket. Emerging market trends highlight that this market has started to look to ‘downsize’ into lower maintenance
dwellings, and for middle to upper income markets will typically do so where dwelling quality and amenity levels are
high. This demographic is generally residing within a large house; usually the family home, and no longer has the
need for the space. Lower maintenance dwellings, generally in the form of premium boutique apartments or
townhouses are now being increasingly targeted by this demographic, particularly where retail and recreational
amenity is provided for within easy walking distance.
The Toondah Harbour development has the potential to offer a diverse product mix that can provide affordability through the
development of higher density apartments situated towards the back of the site. Also, the park and water frontage provides a
unique selling point to this older demographic, if coupled with the development of lower density apartments and/or premium
townhouses.
$0
$100,000
$200,000
$300,000
$400,000
$500,000
$600,000
0%
10%
20%
30%
40%
50%
60%
70%
80%
90%
100%
1983 1985 1987 1989 1991 1993 1995 1997 1999 2001 2003 2005 2007 2009 2011 2013
Med
ian
Sal
es P
rice
($)
Pro
po
rtio
n o
f H
ou
se S
ales
Proportion House Sales Apartment Median Sales Price ($) House Median Sales Price ($)
Toondah Harbour: Market Assessment and Development Strategy, Page 19
4.4 Target Markets
Target Market One: Older ‘Downsizer’ Residents – 55+ years of age
The downsizer is generally residing within the region or has close links and is looking to move from a larger residential
dwelling into a smaller lower maintenance dwelling. Within the suburb of Cleveland approximately 38 per cent or 5,408
residents are aged 55 years of age or above, illustrating the strong market depth for this demographic. They are toward the
end of their working career and most will have a high level of net equity in their existing dwelling.
The older downsizer has a number of fundamental needs and wants including;
A lower maintenance, smaller dwelling
Walkability to key recreational and retail amenity
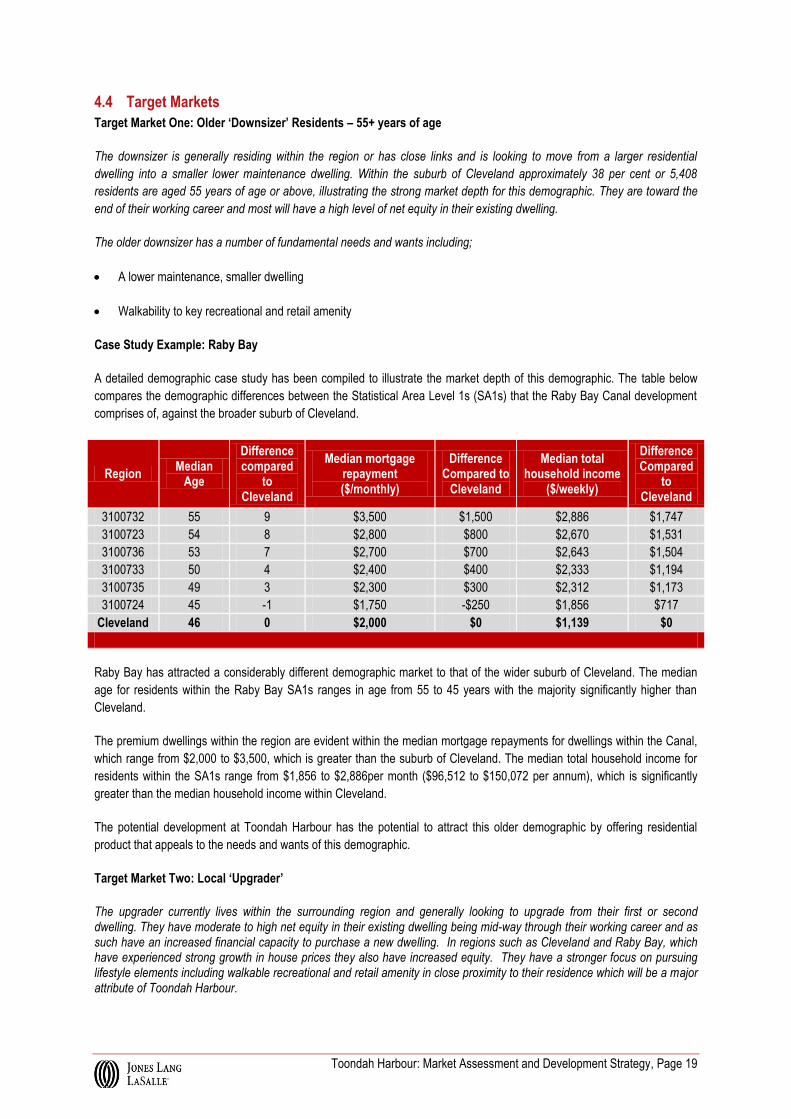
Case Study Example: Raby Bay
A detailed demographic case study has been compiled to illustrate the market depth of this demographic. The table below
compares the demographic differences between the Statistical Area Level 1s (SA1s) that the Raby Bay Canal development
comprises of, against the broader suburb of Cleveland.
Region Median
Age
Difference compared
to Cleveland
Median mortgage repayment ($/monthly)
Difference Compared to
Cleveland
Median total household income
($/weekly)
Difference Compared
to Cleveland
3100732 55 9 $3,500 $1,500 $2,886 $1,747
3100723 54 8 $2,800 $800 $2,670 $1,531
3100736 53 7 $2,700 $700 $2,643 $1,504
3100733 50 4 $2,400 $400 $2,333 $1,194
3100735 49 3 $2,300 $300 $2,312 $1,173
3100724 45 -1 $1,750 -$250 $1,856 $717
Cleveland 46 0 $2,000 $0 $1,139 $0
Raby Bay has attracted a considerably different demographic market to that of the wider suburb of Cleveland. The median
age for residents within the Raby Bay SA1s ranges in age from 55 to 45 years with the majority significantly higher than
Cleveland.
The premium dwellings within the region are evident within the median mortgage repayments for dwellings within the Canal,
which range from $2,000 to $3,500, which is greater than the suburb of Cleveland. The median total household income for
residents within the SA1s range from $1,856 to $2,886per month ($96,512 to $150,072 per annum), which is significantly
greater than the median household income within Cleveland.
The potential development at Toondah Harbour has the potential to attract this older demographic by offering residential
product that appeals to the needs and wants of this demographic.
Target Market Two: Local ‘Upgrader’
The upgrader currently lives within the surrounding region and generally looking to upgrade from their first or second dwelling. They have moderate to high net equity in their existing dwelling being mid-way through their working career and as such have an increased financial capacity to purchase a new dwelling. In regions such as Cleveland and Raby Bay, which have experienced strong growth in house prices they also have increased equity. They have a stronger focus on pursuing lifestyle elements including walkable recreational and retail amenity in close proximity to their residence which will be a major attribute of Toondah Harbour.
Toondah Harbour: Market Assessment and Development Strategy, Page 20
Target Market Three: The Investor
There is the potential for a small proportion of the development within Toondah Harbour to attract a local investor. This
investor will generally live locally and could be attracted to the development to purchase because of the perceived capital
growth and strong rental appeal provided by a master planned development. Targeted groups and marketing strategies
should include the affluent demographic market within Raby Bay and may include purchasing through their Self-Managed
Super Fund (SMSF). Investors are expected to be more prevalent within the later stages of the development as more
affordable attached product is considered to be viable to be brought on line and would likely be situated in close proximity to
the Toondah Harbour ‘village heart’ providing strong rental appeal.
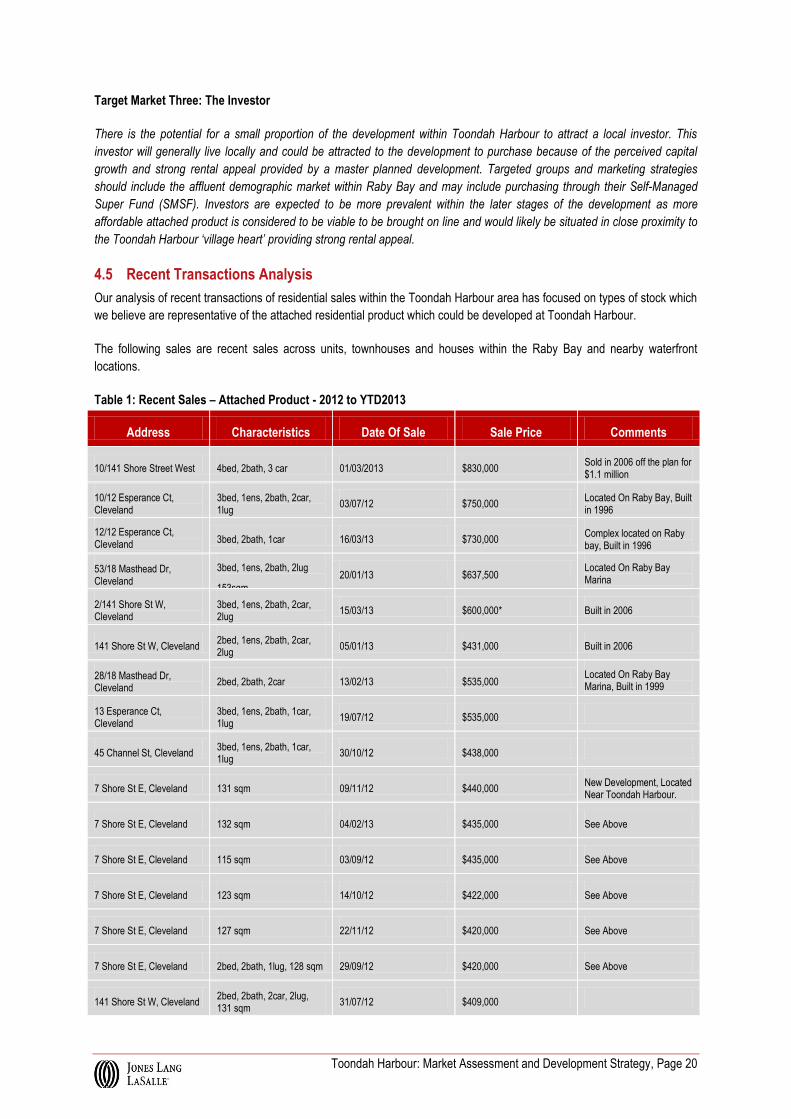
4.5 Recent Transactions Analysis
Our analysis of recent transactions of residential sales within the Toondah Harbour area has focused on types of stock which
we believe are representative of the attached residential product which could be developed at Toondah Harbour.
The following sales are recent sales across units, townhouses and houses within the Raby Bay and nearby waterfront
locations.
Table 1: Recent Sales – Attached Product - 2012 to YTD2013
Address Characteristics Date Of Sale Sale Price Comments
10/141 Shore Street West 4bed, 2bath, 3 car 01/03/2013 $830,000 Sold in 2006 off the plan for $1.1 million
10/12 Esperance Ct, Cleveland
3bed, 1ens, 2bath, 2car, 1lug
03/07/12 $750,000 Located On Raby Bay, Built in 1996
12/12 Esperance Ct, Cleveland
3bed, 2bath, 1car 16/03/13 $730,000 Complex located on Raby bay, Built in 1996
53/18 Masthead Dr, Cleveland
3bed, 1ens, 2bath, 2lug
153sqm
20/01/13 $637,500 Located On Raby Bay Marina
Built in 1999 2/141 Shore St W, Cleveland
3bed, 1ens, 2bath, 2car, 2lug
15/03/13 $600,000* Built in 2006
141 Shore St W, Cleveland 2bed, 1ens, 2bath, 2car, 2lug
05/01/13 $431,000 Built in 2006
28/18 Masthead Dr, Cleveland
2bed, 2bath, 2car 13/02/13 $535,000 Located On Raby Bay Marina, Built in 1999
13 Esperance Ct, Cleveland
3bed, 1ens, 2bath, 1car, 1lug
19/07/12 $535,000
45 Channel St, Cleveland 3bed, 1ens, 2bath, 1car, 1lug
30/10/12 $438,000
7 Shore St E, Cleveland 131 sqm 09/11/12 $440,000 New Development, Located Near Toondah Harbour.
7 Shore St E, Cleveland 132 sqm 04/02/13 $435,000 See Above
7 Shore St E, Cleveland 115 sqm 03/09/12 $435,000 See Above
7 Shore St E, Cleveland 123 sqm 14/10/12 $422,000 See Above
7 Shore St E, Cleveland 127 sqm 22/11/12 $420,000 See Above
7 Shore St E, Cleveland 2bed, 2bath, 1lug, 128 sqm 29/09/12 $420,000 See Above
141 Shore St W, Cleveland 2bed, 2bath, 2car, 2lug, 131 sqm
31/07/12 $409,000
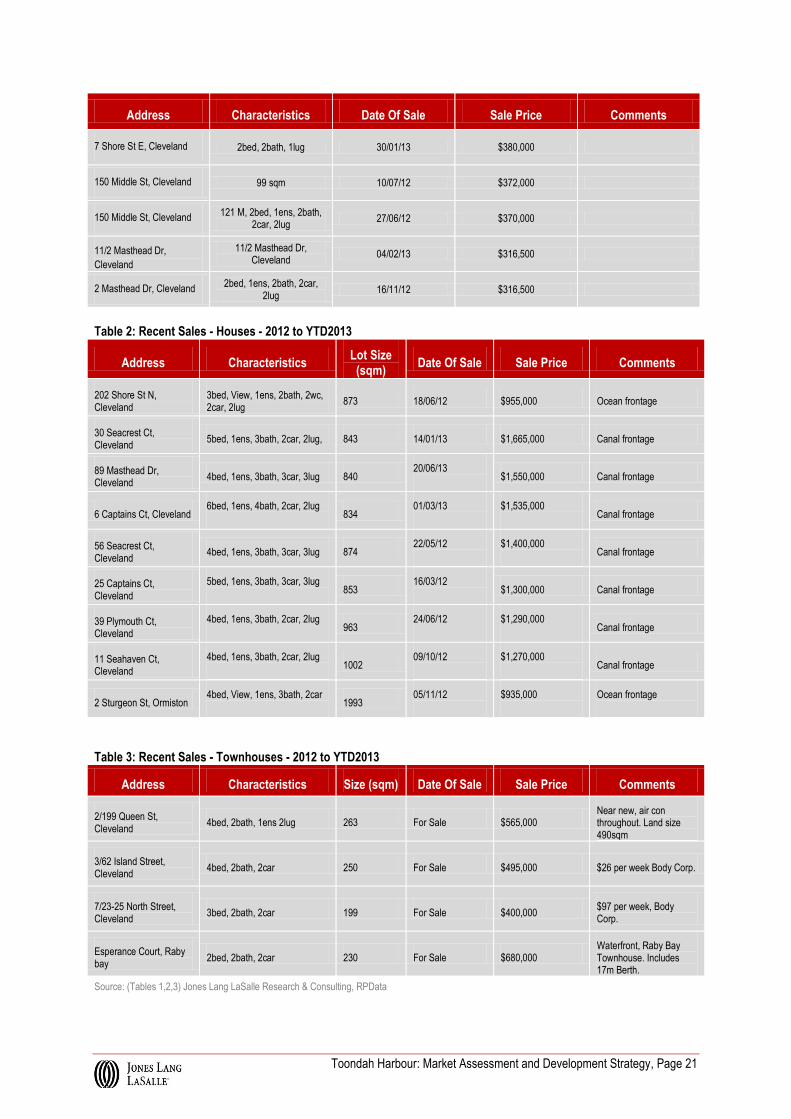
Toondah Harbour: Market Assessment and Development Strategy, Page 21
Address Characteristics Date Of Sale Sale Price Comments
7 Shore St E, Cleveland 2bed, 2bath, 1lug 30/01/13 $380,000
150 Middle St, Cleveland 99 sqm 10/07/12 $372,000
150 Middle St, Cleveland 121 M, 2bed, 1ens, 2bath,
2car, 2lug 27/06/12 $370,000
11/2 Masthead Dr,
Cleveland
11/2 Masthead Dr, Cleveland
04/02/13 $316,500
2 Masthead Dr, Cleveland 2bed, 1ens, 2bath, 2car,
2lug 16/11/12 $316,500
Table 2: Recent Sales - Houses - 2012 to YTD2013
Address Characteristics Lot Size
(sqm) Date Of Sale Sale Price Comments
202 Shore St N, Cleveland
3bed, View, 1ens, 2bath, 2wc, 2car, 2lug
873 18/06/12 $955,000 Ocean frontage
30 Seacrest Ct, Cleveland
5bed, 1ens, 3bath, 2car, 2lug, 843 14/01/13 $1,665,000 Canal frontage
89 Masthead Dr, Cleveland
4bed, 1ens, 3bath, 3car, 3lug 840 20/06/13
$1,550,000 Canal frontage
6 Captains Ct, Cleveland 6bed, 1ens, 4bath, 2car, 2lug
834
01/03/13
$1,535,000
Canal frontage
56 Seacrest Ct, Cleveland
4bed, 1ens, 3bath, 3car, 3lug 874 22/05/12
$1,400,000
Canal frontage
25 Captains Ct, Cleveland
5bed, 1ens, 3bath, 3car, 3lug
853
16/03/12
$1,300,000 Canal frontage
39 Plymouth Ct, Cleveland
4bed, 1ens, 3bath, 2car, 2lug
963
24/06/12
$1,290,000
Canal frontage
11 Seahaven Ct, Cleveland
4bed, 1ens, 3bath, 2car, 2lug
1002
09/10/12
$1,270,000
Canal frontage
2 Sturgeon St, Ormiston 4bed, View, 1ens, 3bath, 2car
1993
05/11/12
$935,000
Ocean frontage
Table 3: Recent Sales - Townhouses - 2012 to YTD2013
Address Characteristics Size (sqm) Date Of Sale Sale Price Comments
2/199 Queen St, Cleveland
4bed, 2bath, 1ens 2lug 263 For Sale $565,000 Near new, air con throughout. Land size 490sqm
3/62 Island Street, Cleveland
4bed, 2bath, 2car 250 For Sale $495,000 $26 per week Body Corp.
7/23-25 North Street, Cleveland
3bed, 2bath, 2car 199 For Sale $400,000 $97 per week, Body Corp.
Esperance Court, Raby bay
2bed, 2bath, 2car 230 For Sale $680,000 Waterfront, Raby Bay Townhouse. Includes 17m Berth.
Source: (Tables 1,2,3) Jones Lang LaSalle Research & Consulting, RPData
Toondah Harbour: Market Assessment and Development Strategy, Page 22
5 Toondah Marina Market Analysis
Key Insights
As at June 2012, there were a total of 79,660 boats registered in the broader catchment area, with approximately 32% in
Brisbane and 14% in the Redland LGA.
An analysis of recreational boat registrations for this primary catchment area indicates strong growth over the last 10 years
to June 2012. Growth in total registrations have averaged around 2,581 per annum over this period. More recently this has
been softer at 581 new vessel registrations over 2011-2012.
For Redlands specifically, there has been solid growth in vessel registrations, with total registrations increasing an average
of 1.91% over a ten year period ending June 2012. While growth has slowed in line with the wider market, there has been
positive growth each year and increased growth from 2011.
In considering the above supply side assessment in conjunction with the boat registration growth within the catchment area,
this confirms our initial preliminary assessment of the total size of a potential marina at Toondah Harbour is supportable at
around 400 berths, which would be staged over an extended period of time
Further, we note that the nature of boat registration growth for vessels greater than 10 metres is in part influenced by
availability of wet and dry storage options within proximity for the registered owner. In this regard, it may be the case that
additional marina berth supply in the catchment will induce demand that would otherwise have not been supported. As
such, depth of demand for berths in the catchment area is expected see take-up of 400 berths within 10 to 20 years.
5.1 Marina Demand Assessment
Recent activity in the marina and boating sector has reflected the broader economic slowdown with growth having
moderated over 2009 to 2012. However, despite the slowdown, new boat registrations across Queensland have continued to
record positive growth every year, albeit with the growth rate slowing from a peak of 5.8% in 2008 to 2.1% in 2011.
Importantly, the year to June 2012 saw the first year of increase in the growth rate, achieving 2.3% growth compared to 2.1%
the prior year. This equates to 3,951 additional registrations.
With Queensland consistently recording high levels of population growth, not surprisingly registrations have still tracked
broadly in line with state population growth rates, even during recent years of around 2.0-2.5% per annum. We consider that
the current caution in consumer spending, which typically impacts spending on discretionary items such as leisure boating,
will be a temporary side-effect of the current economic conditions and a more moderate level of state economic growth. As
such, as the state economy begins to picks up further through the second half of 2013 and 2014, and returns to longer term
trend levels, consumer demand for recreational boating is expected to strengthen in line with the broader economic outlook
for the State.

Toondah Harbour: Market Assessment and Development Strategy, Page 23
Figure 8: Queensland change in boat registrations (1997 – 2012)
Source: Jones Lang LaSalle Research & Consulting, DTMR
Relative to local demand generation potential for marina berth demand at Toondah Harbour, growth in boat registrations
within the primary catchment for this marina is particularly strong. The primary catchment for Toondah Harbour covers
Brisbane, Gold Coast, Logan, Redland and Ipswich Local Government Areas (LGA).
Figure 9: Boat registrations in primary catchment (2002-2012)
Source: Jones Lang LaSalle Research & Consulting, DTMR
The chart above shows total boat registrations in the aforementioned LGA’s over the past 10 years to June 2012. This
indicates:
0.0%
1.0%
2.0%
3.0%
4.0%
5.0%
6.0%
7.0%
0
2,000
4,000
6,000
8,000
10,000
12,000
Bo
at
Reg
istr
ati
on
s
New Boat Registrations Long term average Annual % change
Average annual increase
-
10,000
20,000
30,000
40,000
50,000
60,000
70,000
80,000
90,000
2002 2003 2004 2005 2006 2007 2008 2009 2010 2011 2012
Gold Coast Ipswich Logan Brisbane Redland

Toondah Harbour: Market Assessment and Development Strategy, Page 24
As at June 2012, there were a total of 79,660 boats registered in the catchment area, with approximately 32% in Brisbane
and 14% in the Redland LGA. An analysis of recreational boat registrations for this primary catchment area indicates strong
growth over the last 10 years to June 2012. Growth in total registrations have averaged around 2,199 per annum over this
period with particularly strong growth over the six years to June 2008 when growth in registrations averaged 3,019 per
annum. More recently, during 2011- 2012, boat registration growth has been softer and increased by a modest 417 vessels
within the catchment. Importantly, it is noted that each LGA within the catchment has recorded positive growth every year
with the exception of the Gold Coast in 2012, partly considered to mirror the extended period of tough economic conditions
on the Coast. The Gold Coast is also expected to comprise only a small level of market share for a marina at Toondah
Harbour, with our experience analysing market share for existing marinas in northern Gold Coast and Brisbane
demonstrating that Gold Coast residents do not tend to travel north to a marina, preferring to launch and/ store their vessel
within the more established local marina market.
For Redlands specifically, there has been strong growth in vessel registration, with total registration increasing an average of
3.1% over the 10-year period to June 2012.
Figure 10: Total Boat Registration by Size: Redland LGA, June 2003 - June 2013
Source: Jones Lang LaSalle Research & Consulting, DTMR
Within the boat sizes which will form the market for a marina development at Toondah Harbour, there has been solid growth
within all ranges that primarily require a wet berth or dry storage. This is summarised as follows:
o Over the last five years, the largest percentage growth has been in the over 18m category which has recorded an
average annual growth of 9.12% (or 11 new vessel registrations per annum), albeit with the smallest number of
vessels.
o The largest growth in real terms has come from the 6-10m category with an average annual increase of 39
registrations, with the 10-15m category also recording strong growth of 10 new vessel registrations per annum.
This indicates that there is a robust demand base that continues to sustain growth even during a slow market within the
immediate region for Toondah Harbour. We expect that a marina development at Toondah Harbour would capture a
significant portion of this continued demand, particularly given the only other source of new marina berths is expected to be
limited to Weinam Creek over the medium to longer term.

Toondah Harbour: Market Assessment and Development Strategy, Page 25
Figure 11: Boat registrations over 6m, Redland LGA 2003-2013
Source: Jones Lang LaSalle Research & Consulting, DTMR
5.2 Marina Supply Assessment
Our assessment of the current supply of marinas in the catchment area builds on our initial assessment of the existing supply
prepared in our December 2012 assessment. This is presented below;
Table 4: Existing Marina Supply and Future Development Potential
Marina Name Location Berths Distance to
Weinam Creek
Comments Future Development
Potential
Calypso Bay Marina
Gold Coast
107 20km
Master planned marina with large residential subdivision component. Strong leisure focus.
Potential to reach 300 berths
Gold Coast City Marina
Gold Coast
200 27km
The Gold Coast City Marina (GCCM) and Shipyard is a major marine industry industrial area within the Gold Coast, dedicated to manufacture, servicing / repairs and refits of recreational boats. GCCM currently has approximately 60 hectares developed at present.
Potential for additional 120 berths / 64 moor and store freehold berths
Gold Coast International Marine Precinct
Gold Coast
390 27km
The Gold Coast International Marine Precinct (GCIMP) project is a joint venture between Harbour Island Pty Ltd and Maritimo Pty Ltd.
Early planning phases are underway for a large scale development to construct a new integrated marine industry facility on 64 hectares of land adjacent to the existing Gold Coast marine precinct at Shipper Drive, Coomera.
Hope Harbour
Gold Coast
279 28km
Residential and leisure marina with strong focus to the residential component. Close proximity to the Gold Coast and
No future development potential
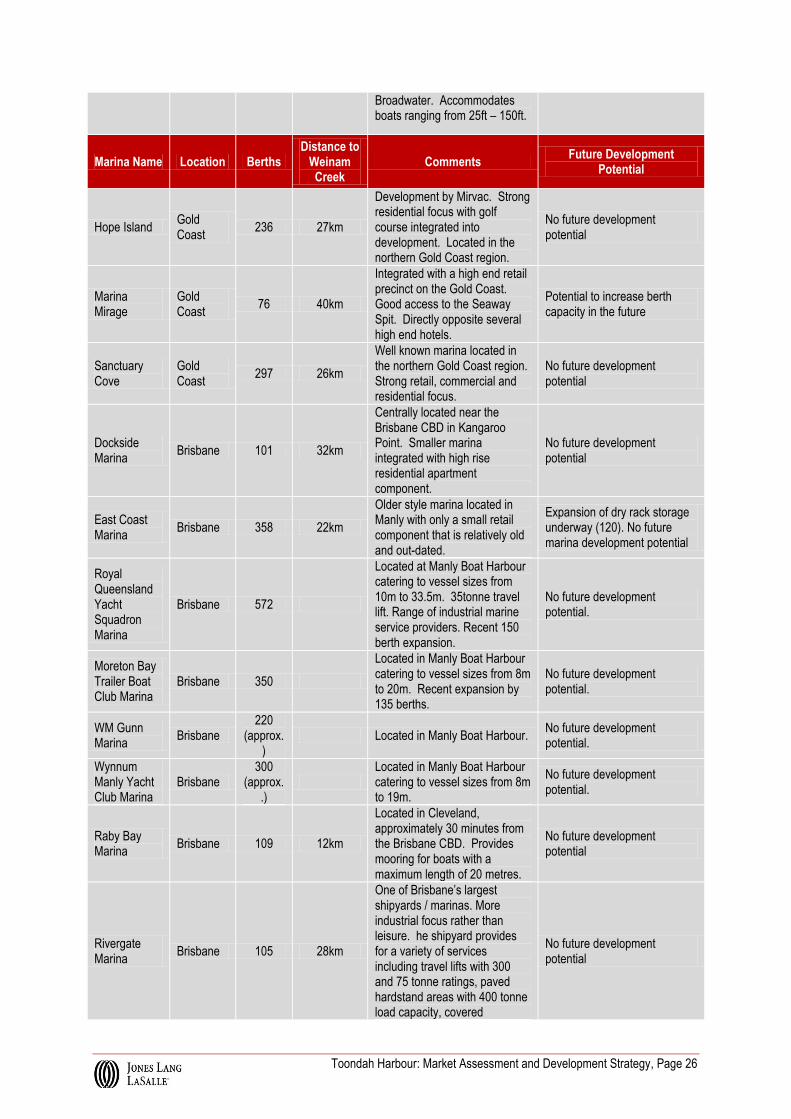
Toondah Harbour: Market Assessment and Development Strategy, Page 26
Broadwater. Accommodates boats ranging from 25ft – 150ft.
Marina Name Location Berths Distance to
Weinam Creek
Comments Future Development
Potential
Hope Island Gold Coast
236 27km
Development by Mirvac. Strong residential focus with golf course integrated into development. Located in the northern Gold Coast region.
No future development potential
Marina Mirage
Gold Coast
76 40km
Integrated with a high end retail precinct on the Gold Coast. Good access to the Seaway Spit. Directly opposite several high end hotels.
Potential to increase berth capacity in the future
Sanctuary Cove
Gold Coast
297 26km
Well known marina located in the northern Gold Coast region. Strong retail, commercial and residential focus.
No future development potential
Dockside Marina
Brisbane 101 32km
Centrally located near the Brisbane CBD in Kangaroo Point. Smaller marina integrated with high rise residential apartment component.
No future development potential
East Coast Marina
Brisbane 358 22km
Older style marina located in Manly with only a small retail component that is relatively old and out-dated.
Expansion of dry rack storage underway (120). No future marina development potential
Royal Queensland Yacht Squadron Marina
Brisbane 572
Located at Manly Boat Harbour catering to vessel sizes from 10m to 33.5m. 35tonne travel lift. Range of industrial marine service providers. Recent 150 berth expansion.
No future development potential.
Moreton Bay Trailer Boat Club Marina
Brisbane 350
Located in Manly Boat Harbour catering to vessel sizes from 8m to 20m. Recent expansion by 135 berths.
No future development potential.
WM Gunn Marina
Brisbane 220
(approx.)
Located in Manly Boat Harbour. No future development potential.
Wynnum Manly Yacht Club Marina
Brisbane 300
(approx..)
Located in Manly Boat Harbour catering to vessel sizes from 8m to 19m.
No future development potential.
Raby Bay Marina
Brisbane 109 12km
Located in Cleveland, approximately 30 minutes from the Brisbane CBD. Provides mooring for boats with a maximum length of 20 metres.
No future development potential
Rivergate Marina
Brisbane 105 28km
One of Brisbane’s largest shipyards / marinas. More industrial focus rather than leisure. he shipyard provides for a variety of services including travel lifts with 300 and 75 tonne ratings, paved hardstand areas with 400 tonne load capacity, covered
No future development potential

Toondah Harbour: Market Assessment and Development Strategy, Page 27
maintenance sheds and café.
This indicates that limited new supply of marinas in the immediate catchment area is likely within the medium to longer term.
Since our initial assessment, we note the only change with regard to potential new competing marinas for Toondah Harbour
is the potential marina that may be developed at Weinam Creek, also a Priority Development Area (PDA). However, it is
considered that Weinam Creek is some 15 minutes drive south providing for an opportunity for each marina to cater to
slightly different catchments. Additionally, it is recognised that the development potential of both these marinas is being
assessed by the project team with a view to ensure they can be staged over time, in order to underpin the financial viability of
their development and to ensure they can secure necessary funding. Further, we note that both Toondah Harbour and
Weinam Creek are expected to have a level of enduring State and Local Government control relating to their development
and in this regard will further support the sustained roll out of marina berths in order to minimise periods of oversupply.
In considering the above supply side assessment in conjunction with the boat registration growth within the catchment area,
this confirms our initial preliminary assessment of the total size of a potential marina at Toondah Harbour is supportable at
around 400 berths, which would be staged over an extended period of time. Further, we note that the nature of boat
registration growth for vessels greater than 10 metres is in part influenced by availability of wet and dry storage options
within proximity for the registered owner. In this regard, it may be the case that additional marina berth supply in the
catchment will induce demand that would otherwise have not been supported. As such, depth of demand for berths in the
catchment area is expected see take-up of 400 berths within 10 to 20 years.
5.3 Marina Berth Price Point Analysis
Our price point analysis for marina berths has considered a range of marinas across Queensland, with a concentration on
South East Queensland, but we have primarily focused on marinas which we consider are useful benchmarks for berths at
Toondah Harbour as part of the proposed development. Of particular relevance is Raby Bay Marina, due to its physical
proximity to Toondah Harbour, being less than 3kms from the site. We have provided a case study of the Raby Bay Marina in
Section 7.2 of this report.
Berth Sales (Long Term Leases)
Sales evidence for the Raby Bay Marina analysed was based on 17 leases advertised for sale as at July 2013 with prices
ranging from $55,000 for a 10 metre berth through to $190,000 for a 19 metre berth. This represents a lineal metre rate of
between $5,000 and $10,000 per metre, with an average of $6,500 per lineal metre with 17 years remaining on the lease
term. It is noted that the prices for some berths varied considerably depending on the location of the berth within the marina,
volumes of supply in that berth size and vendor circumstances. This was most evident with 15 metre berths ranging from
$75,000 to $160,000. The price, lease term remaining and advertised price are illustrated within the table below.
Table 5: Raby Bay Marina Advertised Marina Berth Information, July 2013
Berth Placement
Length (Lineal Metre)
Lease Term Remaining
(Years)
Advertised Price ($)
$/Per Linear Metre
$/Per Linear Metre/Years Remaining
A 19 17 $190,000 $10,000 $370
A 15 17 $160,000 $10,667 $395
A 15 17 $120,000 $8,000 $296
A 15 17 $110,000 $7,333 $272
C 12 17 $109,000 $9,083 $336
B 14 17 $90,000 $6,429 $238
C 12 17 $85,000 $7,083 $262
B 15 17 $80,000 $5,333 $198
A 15 17 $75,000 $5,000 $185
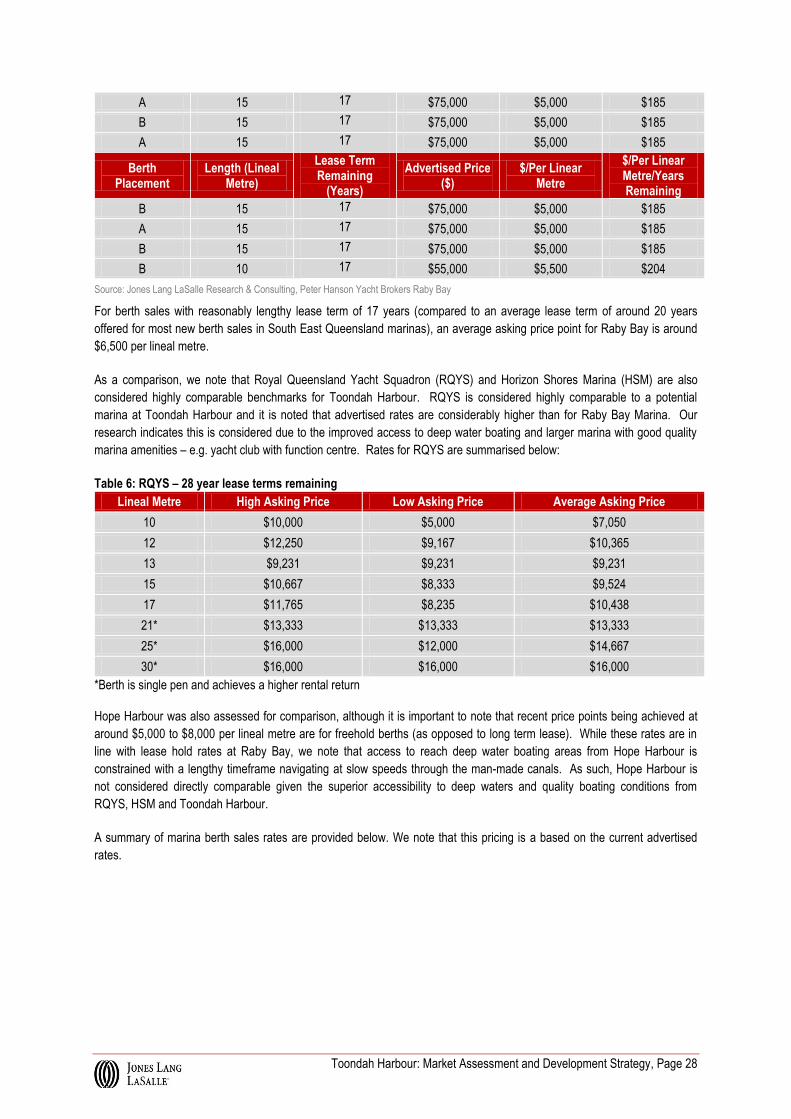
Toondah Harbour: Market Assessment and Development Strategy, Page 28
A 15 17 $75,000 $5,000 $185
B 15 17 $75,000 $5,000 $185
A 15 17 $75,000 $5,000 $185
Berth Placement
Length (Lineal Metre)
Lease Term Remaining
(Years)
Advertised Price ($)
$/Per Linear Metre
$/Per Linear Metre/Years Remaining
B 15 17 $75,000 $5,000 $185
A 15 17 $75,000 $5,000 $185
B 15 17 $75,000 $5,000 $185
B 10 17 $55,000 $5,500 $204
Source: Jones Lang LaSalle Research & Consulting, Peter Hanson Yacht Brokers Raby Bay
For berth sales with reasonably lengthy lease term of 17 years (compared to an average lease term of around 20 years
offered for most new berth sales in South East Queensland marinas), an average asking price point for Raby Bay is around
$6,500 per lineal metre.
As a comparison, we note that Royal Queensland Yacht Squadron (RQYS) and Horizon Shores Marina (HSM) are also
considered highly comparable benchmarks for Toondah Harbour. RQYS is considered highly comparable to a potential
marina at Toondah Harbour and it is noted that advertised rates are considerably higher than for Raby Bay Marina. Our
research indicates this is considered due to the improved access to deep water boating and larger marina with good quality
marina amenities – e.g. yacht club with function centre. Rates for RQYS are summarised below:
Table 6: RQYS – 28 year lease terms remaining
Lineal Metre High Asking Price Low Asking Price Average Asking Price
10 $10,000 $5,000 $7,050
12 $12,250 $9,167 $10,365
13 $9,231 $9,231 $9,231
15 $10,667 $8,333 $9,524
17 $11,765 $8,235 $10,438
21* $13,333 $13,333 $13,333
25* $16,000 $12,000 $14,667
30* $16,000 $16,000 $16,000
*Berth is single pen and achieves a higher rental return
Hope Harbour was also assessed for comparison, although it is important to note that recent price points being achieved at
around $5,000 to $8,000 per lineal metre are for freehold berths (as opposed to long term lease). While these rates are in
line with lease hold rates at Raby Bay, we note that access to reach deep water boating areas from Hope Harbour is
constrained with a lengthy timeframe navigating at slow speeds through the man-made canals. As such, Hope Harbour is
not considered directly comparable given the superior accessibility to deep waters and quality boating conditions from
RQYS, HSM and Toondah Harbour.
A summary of marina berth sales rates are provided below. We note that this pricing is a based on the current advertised
rates.

Toondah Harbour: Market Assessment and Development Strategy, Page 29
Figure 12: Comparative Berth Sales Prices, Asking Price per Lineal Metre by Marina, 2013
Source: Jones Lang LaSalle Research & Consulting
Berth Rental Rates
Berth leasing rates are typically structured on a sliding price point arrangement whereby the price per lineal metre generally
increases with the size of the berths. We have considered the leasing price points for a number of marinas, including all
marinas investigated within Section 7.2 of this report. In particular, we had strong regard for the following Raby Bay and
RQYS as outlined due to proximity and similarities in catchment.
Currently, Raby Bay marina has advertised rental rates of between $8,000 to $10,000 per vessel within the 12-15m range.
The average annual gross rental price per lineal metre equates to $660.
By comparison East Coast Marina at Manly has rental rates for a six month lease of $2,950 for a 9m vessel and up to $6,130
for a 22m vessel. Taking account of typical discounts in the SEQ marina market for 12 month leases of around 10%, the
annual gross rental price equates to around $530 to $580/lm.
Figure 13: Marina Berth Rental Rates, Asking Price per Lineal Metre per annum, 2013
Source: Jones Lang LaSalle Research & Consulting

Toondah Harbour: Market Assessment and Development Strategy, Page 30
Conclusions
Based on our assessment, we note the following conclusions in relation to a future marina at Toondah Harbour:
o The solid history of boat registration growth within the catchment area, coupled with limited supply of additional marina
berth and dry stacking facilities in the area demonstrates a stable base to support continued demand for marina berths
in the primary catchment area.
o Depending on ultimate size, configuration and supporting facilities, a marina at Toondah Harbour should achieve berth
lease and sales rates above HarbourRaby Bay but below or in line with RQYS rates. The reasons for this are:
Toondah Harbour will be part of a mixed use project with slightly superior boating access to deep water compared
to Raby Bay Marina and a direct oceanfront positioning vsersu canal.
Toondah Harbour will likely be positioned close to or slightly below RQYS as it will not be of the same scale, it is
further from Brisbane LGA (a large potential market for demand for berths) and will not offer the same level of
specialised facilities for boaties. However, we note that depending on final design and positioning of the broader
project at Toondah Harbour through elements such as the level of integration with the mixed use residential and
boutique retail components, services available (e.g. fuel, maintenance, provisioning and car parking), and
marketing initiatives such as packaging of berths with premium residential product, the marina may be able to
achieve strong leasing and sales rates in line with RQYS.
o For the purposes of this assessment and the resultant feasibility modelling we have conservatively assumed that the
marina achieves rental rates of between $600-$700 per lineal metre. While we have benchmarked sales rates for
comparison and consideration to the viability of the marina, we have not included the sales rates in the feasibility testing
due to limited emphasis placed on berth sales by valuers and hence financiers.
Toondah Harbour: Market Assessment and Development Strategy, Page 31
6 Toondah Harbour Retail Market Analysis
Key Insights
The retail component will need to have a dual role:
1) to cater to locally generated demand from within the new residential component in the project and 2) to have a strong destinational role.
The destinational role is particularly important given the prime oceanfront location, providing a major differentiator to the retail offering for the broader Redland City Council area. It also recognises the importance of Toondah Harbour in complementing and deepening the retail offering of Cleveland rather than competing with Cleveland CBD.
Cleveland CBD already has strong performing components of the existing retail mix. The main component, the Stockland Retail Centre, has strong performing supermarkets and some specialities, particularly those playing an ‘eat street’ role. The mix at Toondah Harbour takes account of this.
The quantum of supportable retail space is estimated to be a total of between 1,500sqm and 2,500sqm depending on the extent to which a marina is developed at Toondah Harbour and excluding the function centre.
The anchor component is recommended to be a waterfront pub/hotel and function/event centre with supporting accommodation developed in time as the market considers supportable. This component will be a significant star attractor to Toondah Harbour and is considered to have significant ‘pulling potential’ attracting a market from across greater Brisbane and South East Queensland.
The mix is recommended to include:
o Local convenience grocery shopping (local residents and ferry passengers) with the CBD still performing the role of major grocery shopping. Around 400sqm is considered supportable and appropriate for this retail component.
o An ‘Eat street’ with focus on restaurants, cafes and small format bars providing village and waterfront dining opportunities. This will deliver an amenity level expected from local buyers of the new residential and regularly cater to a broad demographic profile of residents from Raby Bay and Cleveland as well as further afield including Victoria Point, Alexandra Hills and Capalaba.
This section outlines likely retail performance within the Toondah Harbour catchment, which is primarily the Cleveland SLA
for the study, and highlights key retail opportunities for Toondah Harbour. The section focuses on identifying and analysing
the prime retail options that can be sustained within Toondah Harbour.
6.1 Review of Existing Cleveland CBD Retail Offerings
The Cleveland CBD Commercial Investment Attraction Strategy report reviewed the existing supply of retail within the
Cleveland CBD and surrounding region. The assessment highlighted that the current retail offering largely serves the retail
needs of nearby residents with the majority of retail located within the Stockland Cleveland Shopping Centre.
Stockland Cleveland is understood to be a strong performing retail centre, generating total retail sales of around $130 million
from around 15,000 sqm of retail floorspace. Combined, Coles and Woolworths are estimated to achieve a turnover of $80
million from 7,600 sqm of leasable space, which is around 35% higher than the ‘typical’ double supermarket based centre
(compared with the 2012 Urbis Retail Averages). The retail specialty shops also perform well, understood to be achieving
turnover rates of around $7,500 per sqm (15% above the average for Double Supermarket based Centres from the 2012
Urbis Retail Averages).
The strength of the retail turnover within Stockland Cleveland highlights that the existing retail is likely to be undercatering to
local demand in Cleveland. While this may support additional retail space, it is critical that any retail at Toondah Harbour is
complementary to the existing and future retail offerings within the Cleveland CBD, and should primarily cater to the
immediate Toondah Harbour residential catchment and visitors to the harbour.

Toondah Harbour: Market Assessment and Development Strategy, Page 32
6.2 Review of Key Recommendations within the Cleveland CBD Commercial Investment
Attraction
Jones Lang LaSalle has considered the optimum retail mix for Toondah Harbour in the context of the retail outcomes
proposed for the Cleveland CBD to ensure that both retail strategies complement and with each site’s retail strategy linked to
their respective strengths, as well as their position within the market.
The key retail outcomes for the Cleveland CBD as part of the Commercial Investment Strategy are;
An opportunity to increase the provision of supermarket floor space within the Cleveland CBD with the most likely
options being an extension on an existing supermarket within Stockland Cleveland or the introduction of another
competitive supermarket operator (ALDI or similar).
There is the potential to accommodate a Discount Department Store (DDS) within the Cleveland CBD in the short
to medium term.
A further opportunity exists to diversify the current retail offering within the Cleveland CBD by introducing enhanced
retail offers potentially in the form of an ‘eat street’; and
A potential boutique size cinema in the CBD of around 4 screens (6 screens is not considered supportable).
6.3 Retail Spending and Demand within the Toondah Harbour Catchment Area (Cleveland SLA)
The indicative retail spending assessment considered the potential spending on the primary good and services sold at
supermarkets, food and beverage outlets, cafes and specialty retail within the immediate catchment area. The table intends
to identify what market share would be necessary to attract reasonable turnover levels. It should be noted that in all cases
attracting a quality operator is paramount to a strong performing and sustainable retail outcome.
Table 7: Indicative Retail Spending, Toondah Harbour Catchment Area
$, by Quintile
Annual Household Spend by Item, 2011- 2012 Lowest Second Third Fourth Highest Ave. Ratio – Highest to Ave.
Meals - cafes, restaurants etc. 553.8 811.72 1,367 1,995 3,587 1,663 2.2
Fast Food and Takeaway 480.48 938.08 1564.68 2118.48 2831.4 1586.624 1.8
Alcohol Off Premises 400.92 691.08 1042.6 1219.4 1804.4 1031.68 1.7
Alcohol, Consumption on licensed premises 153.92 319.28 556.4 767 1333.8 626.08 2.1
All Other Food and Non-Alcoholic Beverage 4287.92 5973.24 7209.8 8642.92 10615.8 7345.936 1.4
Source: Jones Lang LaSalle Research & Consulting and ABS
Our demographic analysis of the catchment area has positioned the likely retail spend within the fourth and fifth quintile. This
is reflective of the site’s location in proximity to an affluent population within Raby Bay and factors in population demand from
both this segment of the market, as well as the wider market.
The Indicative Retail Demand table (table 5) summarises potential spending and supportable floor area that could expect to
flow to a small format supermarket based centre. It is assumed that the supermarket’s main catchment region would be;
o Future residents residing within the Toondah Harbour development
o Residents from the immediately adjoining Cleveland and Raby Bay areas that are closest to Toondah Harbour; and
o Visitors and workers to and from Stradbroke Island
o Visitors and workers associated with the village centre, waterfront retail and including the events/function space
and will include both social and corporate visitors
In this indicative modelling, Jones Lang LaSalle have used the current population for the Toondah Harbour catchment area,
and assumed that the retail component of Toondah Harbour captures a conservative market share of retailing. This market
share reflects the retail offering’s position within the market and the likely ability to capture demand from the immediate
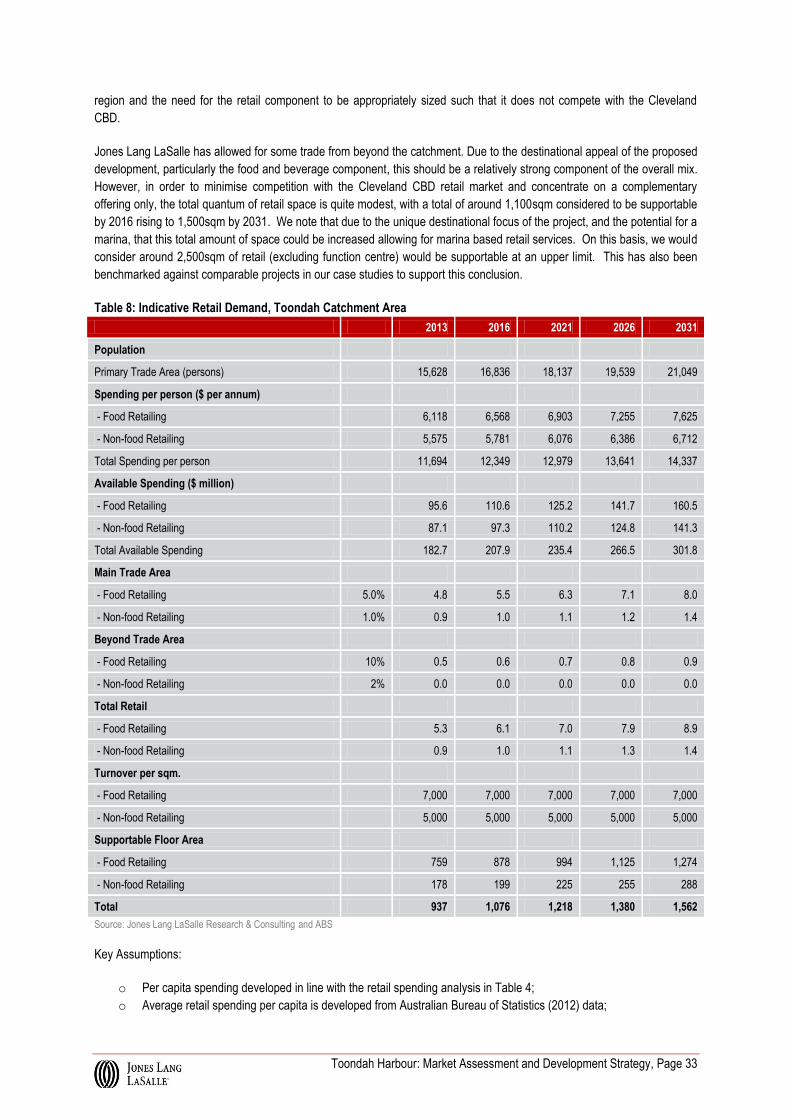
Toondah Harbour: Market Assessment and Development Strategy, Page 33
region and the need for the retail component to be appropriately sized such that it does not compete with the Cleveland
CBD.
Jones Lang LaSalle has allowed for some trade from beyond the catchment. Due to the destinational appeal of the proposed
development, particularly the food and beverage component, this should be a relatively strong component of the overall mix.
However, in order to minimise competition with the Cleveland CBD retail market and concentrate on a complementary
offering only, the total quantum of retail space is quite modest, with a total of around 1,100sqm considered to be supportable
by 2016 rising to 1,500sqm by 2031. We note that due to the unique destinational focus of the project, and the potential for a
marina, that this total amount of space could be increased allowing for marina based retail services. On this basis, we would
consider around 2,500sqm of retail (excluding function centre) would be supportable at an upper limit. This has also been
benchmarked against comparable projects in our case studies to support this conclusion.
Table 8: Indicative Retail Demand, Toondah Catchment Area
2013 2016 2021 2026 2031
Population
Primary Trade Area (persons) 15,628 16,836 18,137 19,539 21,049
Spending per person ($ per annum)
- Food Retailing 6,118 6,568 6,903 7,255 7,625
- Non-food Retailing 5,575 5,781 6,076 6,386 6,712
Total Spending per person 11,694 12,349 12,979 13,641 14,337
Available Spending ($ million)
- Food Retailing 95.6 110.6 125.2 141.7 160.5
- Non-food Retailing 87.1 97.3 110.2 124.8 141.3
Total Available Spending 182.7 207.9 235.4 266.5 301.8
Main Trade Area
- Food Retailing 5.0% 4.8 5.5 6.3 7.1 8.0
- Non-food Retailing 1.0% 0.9 1.0 1.1 1.2 1.4
Beyond Trade Area
- Food Retailing 10% 0.5 0.6 0.7 0.8 0.9
- Non-food Retailing 2% 0.0 0.0 0.0 0.0 0.0
Total Retail
- Food Retailing 5.3 6.1 7.0 7.9 8.9
- Non-food Retailing 0.9 1.0 1.1 1.3 1.4
Turnover per sqm.
- Food Retailing 7,000 7,000 7,000 7,000 7,000
- Non-food Retailing 5,000 5,000 5,000 5,000 5,000
Supportable Floor Area
- Food Retailing 759 878 994 1,125 1,274
- Non-food Retailing 178 199 225 255 288
Total 937 1,076 1,218 1,380 1,562
Source: Jones Lang LaSalle Research & Consulting and ABS
Key Assumptions:
o Per capita spending developed in line with the retail spending analysis in Table 4;
o Average retail spending per capita is developed from Australian Bureau of Statistics (2012) data;

Toondah Harbour: Market Assessment and Development Strategy, Page 34
o We have outlined the total likely spend within the catchment, and then assumed a market share for the Toondah
Harbour catchment. This market share is estimated based on our expectations of the retail offering developed at
the Site, and we have assumed a modest position given the size of the offering.
o We have applied required turnover on a per metre basis as per industry averages, and in benchmarked with regard
to achieved leasing rates for comparable centres as provided by Jones Lang LaSalle retail leasing and property
management.
6.4 Retail Opportunities
This section considers the key opportunities for retail land uses in Toondah Harbour. We have considered the various roles
that retail plays to help identify a range of retail outcomes for the project. While the retail component of large scale mixed use
projects will often only form a small part of total commercial returns, it will typically play a critical role in anchoring an urban
renewal precinct by being the main attraction in its own right. In this regard, its importance cannot be understated and it will
very much indirectly drive the total project returns. Retail will also be a fundamental component used to support a vibrant,
long term economically sustainable outcome and is often used as a key barometer for the success of a project. Other lower
profile but important roles for the retail include providing the convenience for residents, workers and visitors by providing for
the daily or weekly needs of patrons as well as more of a low key supporting role to complement other surrounding uses. In
most successful projects, retail plays all three of these roles.
The main opportunities considered fall into three broad categories. They are:
o Destination retail – the provision of a specialised retail format that will attract customers from a regional
catchment to the Toondah Harbour site. The retail provides a unique offering and identity that complements rather
than competes with the existing regional offer within the City Centre. The bay side location of the site provides an
opportunity to reinforce this retail identity;
o Neighbourhood retail – the provision of a retail precinct that provides a range of services to a local catchment.
This most certainly will service the future population on the Toondah Harbour development as well as some
surrounding population;
o Local / Ancillary retail – small scale retail supporting other uses on the precinct. This would be primarily
supported by the population living, working and visiting the precinct.
Proposed retail development within the Toondah Harbour development area will be a reasonably compact, high quality and
destinational offering which addresses these three categories.
Our retail leasing analysis has included a number of comparable retail offerings across Brisbane, in conjunction with
discussions with our retail sales and leasing team, to determine what we believe to be achievable and supportable rental
rates.
Destination Retail
Bar/Restaurant Space with Function Capabilities
The strategic location of the Toondah Harbour development on the edge of the South-East Queensland coast, under
40minutes drive from the Brisbane CBD and adjacent to Raby Bay, provides a significant opportunity for a high quality
dining, bar and function offering which establishes Toondah Harbour as a destination in its own right within South East
Queensland. We envision this development as a high quality, mid-tier priced offering which embraces the site’s location on
the cusp of the Moreton Bay and the sub-tropical climate enjoyed by the region.
We consider the success of the dining/bar component to be a critical driver of success for the whole Toondah Harbour
project. A good retail offering which has strong destinational appeal underpins the entire ability of the site to attract users,
and while it may not provide the largest financial returns, the retail offering will drive interest in the site and support a long
term sustainable economic outcome.
A bar and restaurant (with function capabilities) which successfully embraces the site’s bay side location will provide this
significant destinational appeal for the retail offering and well as creating day/night activation. Due to the untested nature of
this offering within the region, the strength of the operator will be critical to the success of the offering. A strong offering,
which achieves these outcomes, will drive demand for the wider retail component and be a key factor in the success of the
development.

Toondah Harbour: Market Assessment and Development Strategy, Page 35
The key elements which will drive the destinational appeal and ultimately the success of the bar/restaurant offering are;
o Complementary dining establishment clustering together to create an appealing destination and to drive
reciprocal demand between offerings within the site. This is evidenced in a number of ‘eat streets’ around Brisbane
which successfully leverage of each other to drive demand;
o Quality operators that build a strong client base and attract repeat visitation. This will be particularly important for
the Toondah Harbour site, to create a deeper destination appeal to capture demand from a wider population.
Attracting such operators to Toondah Harbour will involve a targeted and deliberate approach during the
procurement and EOI process;
o Iconic restaurants – This has successfully activated dining precincts such as Eagle Street Pier in Brisbane, with
celebrity chefs opening bars / restaurants. This may include attracting an interstate operator seeking to expand into
the Brisbane market. An iconic restaurant has the ability to brand a region as a food destination;
o Alfresco dining opportunities with an appealing outlook, and which make use of Brisbane’s subtropical climate.
For Toondah, there is a strong opportunity to utilise the good visual amenity stemming from its bay-side location;
o Accessible car parking for patrons;
o Support from local residents and workers – dining precincts that rely too heavily on a visitor market are likely to
be difficult to sustain. Repeat visitation from locals is critical and will be driven largely by the quality of the
operators and the convenience of visitation;
o Proximity to a workforce – the CBD workforce is a key market segment and it will be important to make sure that
there are easy and quick transport options between the two sites;
o Large catchment – in the case of Toondah Harbour, this is expected to stem from the significant residential
development within Toondah harbour, Raby Bay and the wider Cleveland region. We are also confident that
demand will be captured from the wider Brisbane population if the above factors are successfully achieved.
Neighbourhood Retail
Neighbourhood retail is certainly not unique. However, we consider a neighbourhood focused retail component as part of the
Toondah Harbour development to have the potential to provide a more satisfying shopping experience for surrounding
residents and over time attract a large, loyal customer base. In order to do this, it will need to provide a unique offering with a
strong component of quality independent operators that create a strong level of retail identity. An over representation of
national chains will diminish the market share potential and undermine the destinational appeal of the centre. Furthermore,
the strong growth in Cleveland’s residential population forecast over the next 20 years, in addition to the development of
residential properties as part of the project, will support additional demand for convenience based supermarket shopping.
Our spending analysis has outlined a supportable supermarket size of 300-400sqm to support the immediate local catchment
of Toondah Harbour, including visitors and workers without detriment to the Cleveland CBD grocery offering.
Small Format Supermarket/Convenience Store:
Small format supermarkets normally achieve gross rents of between $350 to $550 in other similarly sized retail nodes across
Brisbane. Due to the location of this development, and with the proximity of planned residential development, we believe that
a gross rental rate of $450/sqm p.a. would reflect fair market value and a sustainable gross rent level. As a point of
differentiation this may include a delicatessen / green grocer style format to generate broader market appeal and further
differentiate the offering and support strong local ‘ownership’. This also aligns with the likely target demographic profile.

Toondah Harbour: Market Assessment and Development Strategy, Page 36
Table 9: Small Format Supermarket/Convenience Store Leasing Evidence
Location Size
(sqm) Gross Rent
per sqm Comments
Carina North (Foodworks)
351 $390 (net)
5 year term. Of the comparable properties, this gives the closest indication of likely supportable rent levels for Toondah. Store is similar small format retail, with 10 other retail tenancies in the centre.
Fernbrooke (Nightowl) 191 $441 Not a new development
Calamvale (Nightowl) 177 $614 Smaller size offering, which reflects the premium attached to the gross rent
Yeronga Village Shopping Centre (IGA)
189 $600 Higher density region, not new development. Successful cluster of retail uses.
Source: Jones Lang LaSalle Research & Consulting
Ancillary Retail
Local and ancillary retailing is not aimed at being a destination in its own right but supports other land uses on the site and
will typically cluster with other retail uses. Food and beverage outlets are required to serve the local workforce and visitors;
local convenience retailing will be needed for residents; and additional uses such as gift shops and themed offerings may
co-locate with visitor attractions or Stradbroke Ferry Operations.
Specialty Stores Including Cafes:
We believe that a small offering of mid-tier, boutique retail specialty stores would be supported within the Toondah Harbour
development. As per the baseline report and our retail spending analysis above, we expect that around 500sqm of specialty
stores would be supported by the catchment by 2016. We anticipate that a large segment of this space would be comprised
of cafes and small mid to high quality dining options. To provide a level of critical mass, in time this may be increased to
around 800sqm depending on factors such as final mix, location, the size of the pub/hotel and conference space and
whether that facility includes a restaurant, and if there is a marina developed at Toondah Harbour.
The rents for these types of stores are likely to vary significantly within the offering depending on a number of factors such as
the final designs of the retail space and surrounding area, the position of the space within the development, and tenant
specific factors. We believe that an average gross rent of $650/sqm p.a. across all the speciality tenancies would reflect
likely market value and allow for these variances. We believe that this reflects a conservative forecast, and that this figure is
indicative of the lower threshold of achievable rents.

Toondah Harbour: Market Assessment and Development Strategy, Page 37
Table 10: Speciality Stores including Cafes
Location Size
(sqm)
Gross Rent
per sqm
Average Gross
Rent per Sqm
Comments
Bluewater Square
54-140
$650 - $800
$700 Located within a similar demographic, but anchored by a large format supermarket. Specialty stores are mid quality offering.
Fernbrooke 42-66 $616 - $666
$640 Neighbourhood retail, no major anchor. Basic food and beverage retailers with some basic speciality stores.
Redbank Plains
Shopping Centre
77-272
$550 - $692
$600 Neighbourhood retail centre, anchored by large major supermarket. Retail offering of a fairly basic and low quality mix. Significant growth area.
Carina North 54-85 $600-700
(Net) $700
Metropolitan location similarly sized retail offering and mix of tenants which is indicative of desired tenant mix at Toondah.
Greenslopes IGA
45-150
$640 - $755
$700 Similar tenancy mix to the desired outcomes for Toondah Harbour. The offering has been recently constructed, which demonstrates the premium which tenants are willing to pay for new space.
Source: Jones Lang LaSalle Research & Consulting
6.5 Conclusions
Given the total supportable quantum of retail space and the three key retail uses identified for Toondah Harbour, the table
below outlines our recommend retail use mix. We note that this retail mix has been determined in conjunction with due
regard to the Cleveland CBD, to ensure that the sites produce reciprocal benefits for each other, and work in a
complementary fashion. We have provided indicative rents based on evidence from comparable offerings within the wider
market. It should be noted that the mix below excludes the pub/hotel and function/events facility and is conservatively based
on the project proceeding without marina. Should the marina proceed we consider an upper limit of around 2,500sqm in total
retail area would be supportable.
Table 11: Recommended Retail Mix
Retail Component Supportable Area
sqm
Gross Rent
$p.a per sqm
Total Gross Rent
(Approx) $ p.a
Small Format Supermarket/Convenience
Store 300-400 450 135,000-180,000
Specialty Stores including
Bar/Restaurant 800-1,100 600 500,000-650,000
Total 1,100-1,500 Ave 550 (approx.) 635,000-830,000
Source: Jones Lang LaSalle Research & Consulting
The success of retailing at the Toondah harbour site is highly influential on the success of other uses within the Priority
Development Area. As such, the retail solution will be critical to ensure it is holistically incorporated as part of the broader
strategy, with careful consideration of staging to ensure each phase is a success and that the outcome is economically
sustainable over the long term.

Toondah Harbour: Market Assessment and Development Strategy, Page 38
7 Case Studies
A range of case studies are provided below to assist in forming benchmarks for potential mix of land uses, quantum of
space, key success factors and any identified constraints or failures of particular projects. In addition to the case studies
prepared in the preliminary development strategy in late 2012, those selected for inclusion in this report are:
Three hotel/conference/function centres:
o Q Station Manly
o Watsons Bay Hotel
o Stradbroke Island Hotel
Six Marinas:
o Raby Bay, Brisbane
o Hope Island, Gold Coast
o Port Coogee, Perth
o Martha Cove, Melbourne
o Holdfast Shores, Adelaide
o East Coast Marina, Manly Brisbane
7.1 Targeted Restaurant/Bar (with Function Centre element) Tenant Types
Q STATION MANLY
The Q Station Manly occupies the site of Sydney’s old quarantine station within the Sydney National Park. The station was restored at a cost of more than $19 million and includes a boutique hotel, conference facilities and a number of restaurants.
Accommodation
The Q station comprises of a Boutique Hotel of 79 rooms, which offers a number of different
room types including; Heritage Rooms/Suites, Deluxe Rooms and Historic Cottages. The
accommodation has been adapted from the old quarantine station’s original accommodation
wings. The room rates range, on average, from $180 to $550 in the lower season months to
$260 to $600 during the busier periods.
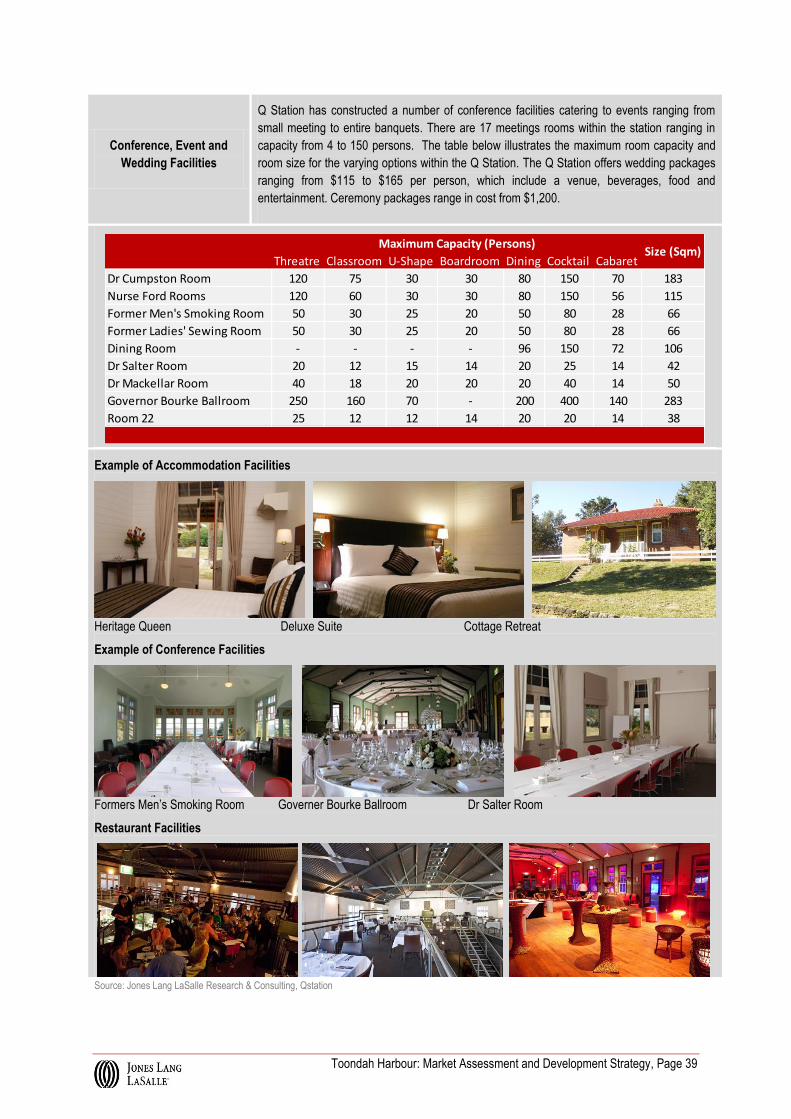
Toondah Harbour: Market Assessment and Development Strategy, Page 39
Conference, Event and
Wedding Facilities
Q Station has constructed a number of conference facilities catering to events ranging from
small meeting to entire banquets. There are 17 meetings rooms within the station ranging in
capacity from 4 to 150 persons. The table below illustrates the maximum room capacity and
room size for the varying options within the Q Station. The Q Station offers wedding packages
ranging from $115 to $165 per person, which include a venue, beverages, food and
entertainment. Ceremony packages range in cost from $1,200.
Example of Accommodation Facilities
Heritage Queen Deluxe Suite Cottage Retreat
Example of Conference Facilities
Formers Men’s Smoking Room Governer Bourke Ballroom Dr Salter Room
Restaurant Facilities
Source: Jones Lang LaSalle Research & Consulting, Qstation
Threatre Classroom U-Shape Boardroom Dining Cocktail Cabaret
Dr Cumpston Room 120 75 30 30 80 150 70 183
Nurse Ford Rooms 120 60 30 30 80 150 56 115
Former Men's Smoking Room 50 30 25 20 50 80 28 66
Former Ladies' Sewing Room 50 30 25 20 50 80 28 66
Dining Room - - - - 96 150 72 106
Dr Salter Room 20 12 15 14 20 25 14 42
Dr Mackellar Room 40 18 20 20 20 40 14 50
Governor Bourke Ballroom 250 160 70 - 200 400 140 283
Room 22 25 12 12 14 20 20 14 38
Maximum Capacity (Persons)Size (Sqm)
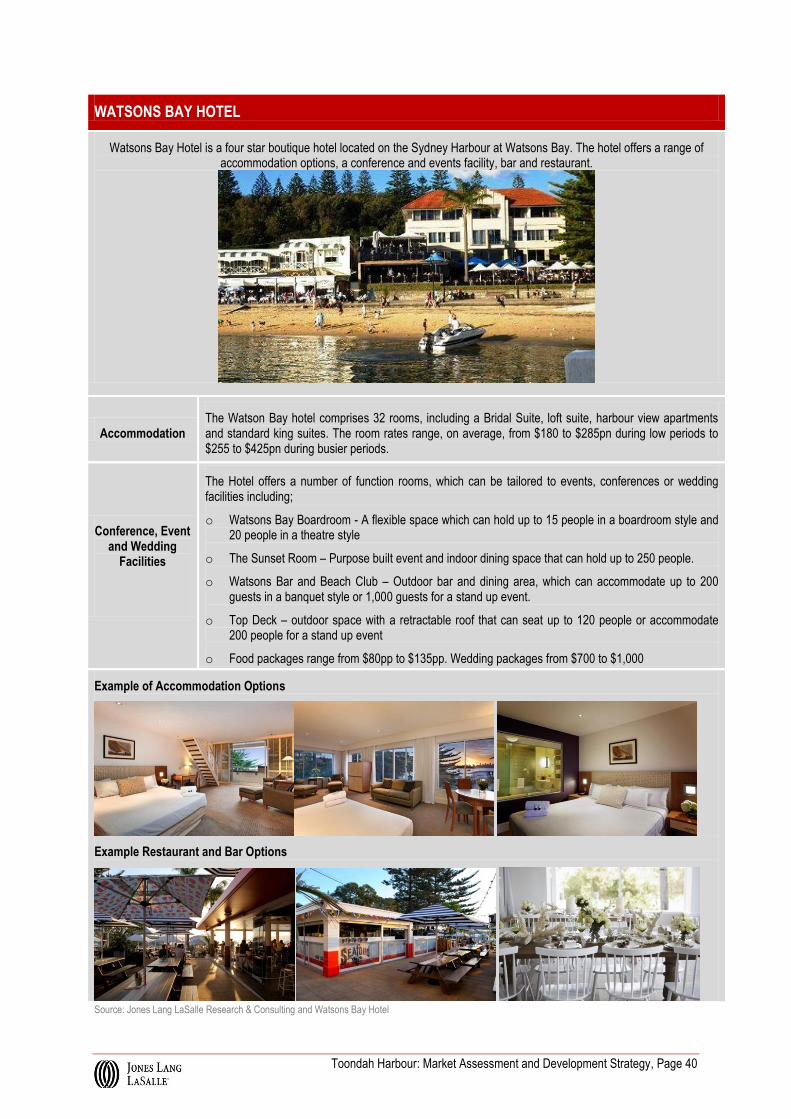
Toondah Harbour: Market Assessment and Development Strategy, Page 40
WATSONS BAY HOTEL
Watsons Bay Hotel is a four star boutique hotel located on the Sydney Harbour at Watsons Bay. The hotel offers a range of accommodation options, a conference and events facility, bar and restaurant.
Accommodation The Watson Bay hotel comprises 32 rooms, including a Bridal Suite, loft suite, harbour view apartments and standard king suites. The room rates range, on average, from $180 to $285pn during low periods to $255 to $425pn during busier periods.
Conference, Event and Wedding
Facilities
The Hotel offers a number of function rooms, which can be tailored to events, conferences or wedding facilities including;
o Watsons Bay Boardroom - A flexible space which can hold up to 15 people in a boardroom style and 20 people in a theatre style
o The Sunset Room – Purpose built event and indoor dining space that can hold up to 250 people.
o Watsons Bar and Beach Club – Outdoor bar and dining area, which can accommodate up to 200 guests in a banquet style or 1,000 guests for a stand up event.
o Top Deck – outdoor space with a retractable roof that can seat up to 120 people or accommodate 200 people for a stand up event
o Food packages range from $80pp to $135pp. Wedding packages from $700 to $1,000
Example of Accommodation Options
Example Restaurant and Bar Options
Source: Jones Lang LaSalle Research & Consulting and Watsons Bay Hotel
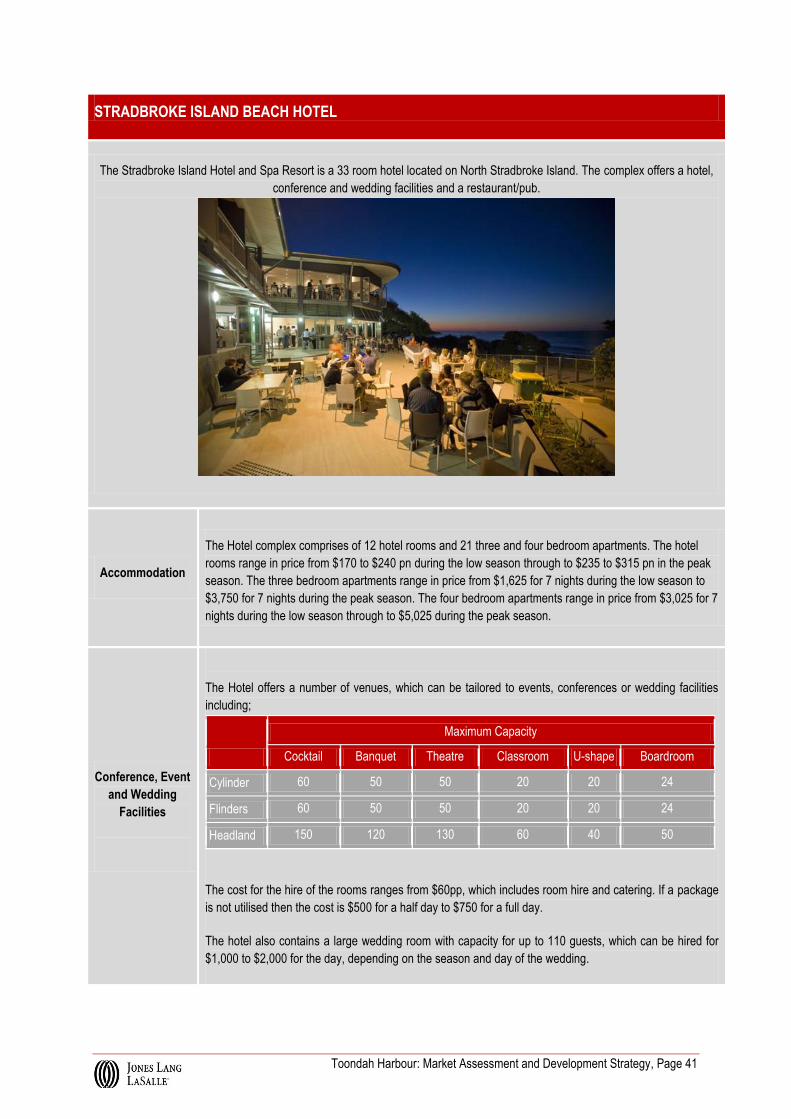
Toondah Harbour: Market Assessment and Development Strategy, Page 41
STRADBROKE ISLAND BEACH HOTEL
The Stradbroke Island Hotel and Spa Resort is a 33 room hotel located on North Stradbroke Island. The complex offers a hotel,
conference and wedding facilities and a restaurant/pub.
Accommodation
The Hotel complex comprises of 12 hotel rooms and 21 three and four bedroom apartments. The hotel
rooms range in price from $170 to $240 pn during the low season through to $235 to $315 pn in the peak
season. The three bedroom apartments range in price from $1,625 for 7 nights during the low season to
$3,750 for 7 nights during the peak season. The four bedroom apartments range in price from $3,025 for 7
nights during the low season through to $5,025 during the peak season.
Conference, Event
and Wedding
Facilities
The Hotel offers a number of venues, which can be tailored to events, conferences or wedding facilities
including;
Maximum Capacity
Cocktail Banquet Theatre Classroom U-shape Boardroom
Cylinder 60 50 50 20 20 24
Flinders 60 50 50 20 20 24
Headland 150 120 130 60 40 50
The cost for the hire of the rooms ranges from $60pp, which includes room hire and catering. If a package
is not utilised then the cost is $500 for a half day to $750 for a full day.
The hotel also contains a large wedding room with capacity for up to 110 guests, which can be hired for
$1,000 to $2,000 for the day, depending on the season and day of the wedding.

Toondah Harbour: Market Assessment and Development Strategy, Page 42
Example of Accommodation and Restaurant
Conference and Wedding Facilities
Source: Jones Lang LaSalle Research & Consulting and Stradbroke Island Beach Hotel and Spa Resort.

Toondah Harbour: Market Assessment and Development Strategy, Page 43
7.2 Marina Focussed Mixed Use Developments
This section summarises a range of relevant case studies from around Australia and highlights key lessons from the project.
We have had particular regard for marina developments that are of comparable scale and nature to Toondah Harbour and
have been assessed in relation to land use mix, staging, and scale as well as key success factors and/or identified
shortcomings that may provide relevant learnings for Toondah Harbour. The list of case studies includes:
o Raby Bay, Brisbane
o Hope Island, Gold Coast
o Port Coogee, Perth
o Martha Cove, Melbourne
o Holdfast Shores, Adelaide
o East Coast Marina, Manly Brisbane
RABY BAY, BRISBANE
Figure 9: Raby Bay Aerial Imagery
Location
The Raby Bay marina consists of 126 moorings ranging from 5m to 20m and allowing boats with drafts of up
to 5m. Our market research into the profile of the market for the marina indicates that the proximity to quality
boating destinations in Moreton Bay and relatively easy access from the surrounding catchment at Raby Bay
through to Greater Brisbane CBD has made it particularly attractive to owners of larger boats. The marina
operators have also advised that the low vacancy rate within the Marina has allowed them to be selective
about lessees when vacancies do become available.
The marina also includes a number of small commercial and retail tenancies within the Raby Bay Harbour
Centre. There are currently two commercial office tenancies available for lease with an advertised price of
$25,800 per annum (60 sqm at $430 per/sqm) and $27,000 per annum (60 sqm at $450 per/sqm). The
commercial and retail elements are well situated on Shore Street West with a large amount of open-air
parking.
The residential development surrounding the marina is characterised by residential apartments and canal
frontage houses, which reflect a typical 1990’s design. The original Harbour View Townhouse development,
located to the east of the Marina Harbour, has sold 69 new townhouses since its inception in 1999 with a sales
price of between $199,000 and $425,000. The apartments have recorded strong resales over the last 10 year

Toondah Harbour: Market Assessment and Development Strategy, Page 44
period with an average capital growth of 9 per cent, based on 79 resale transactions.
In addition to the residential component, Raby Bay Marina is also located in close proximity to the Raby Bay
canal estate, a premium residential community. The community started construction in 1983/84 and has
attracted a high proportion of higher income earners to the region, attracted by the waterfront homes and
location of the project.
Feasibility
Work commenced on the first stages of the Raby Bay Harbour in 1995, following the development of the Raby
Bay Canal development. The original berths were offered with a 28 year lease at a cost of between $34,000
and $68,000 for berths ranging in size from 12 to 28 metres.
Sales evidence for the Raby Bay Marina reveals that there are approximately 17 leases currently advertised
for sale with a price range of $55,000 for a 10 metre berth through to $190,000 for a 19 metre berth. The
berths leases’ are currently advertised for sale at between $5,000 and $10,000 (an average of $6,500) per
lineal metre with 17 years remaining on the lease term.
Berth rents are around $8,000 to $10,000 per annum for a 12m berth, and the optimal mix in the current
market is considered to be 12-15m berths. Outgoings for owners and operators within Raby Bay Marina are
an issue with sea bed leases currently being calculated at 8% of the underlying industrial land value. As a
result, outgoings have a major impact on the current net rent being achieved by marina berth lessors,
decreasing their appeal as an investment.
With regard to other land use mixes, it is understood that the office component has consistently been
problematic to lease, with relatively low demand for the space. The retail component has relatively low
patronage during weekdays but busier during evenings and on the weekend. The retail offering is mid-market
but some tenancies are somewhat dated. Pedestrian traffic through the site is considered low due to being
located on the periphery of the CBD with no other commercial or retail activators to the north, east or west of
the harbour.
Source: Jones Lang LaSalle Research & Consulting and Raby Bay Marina
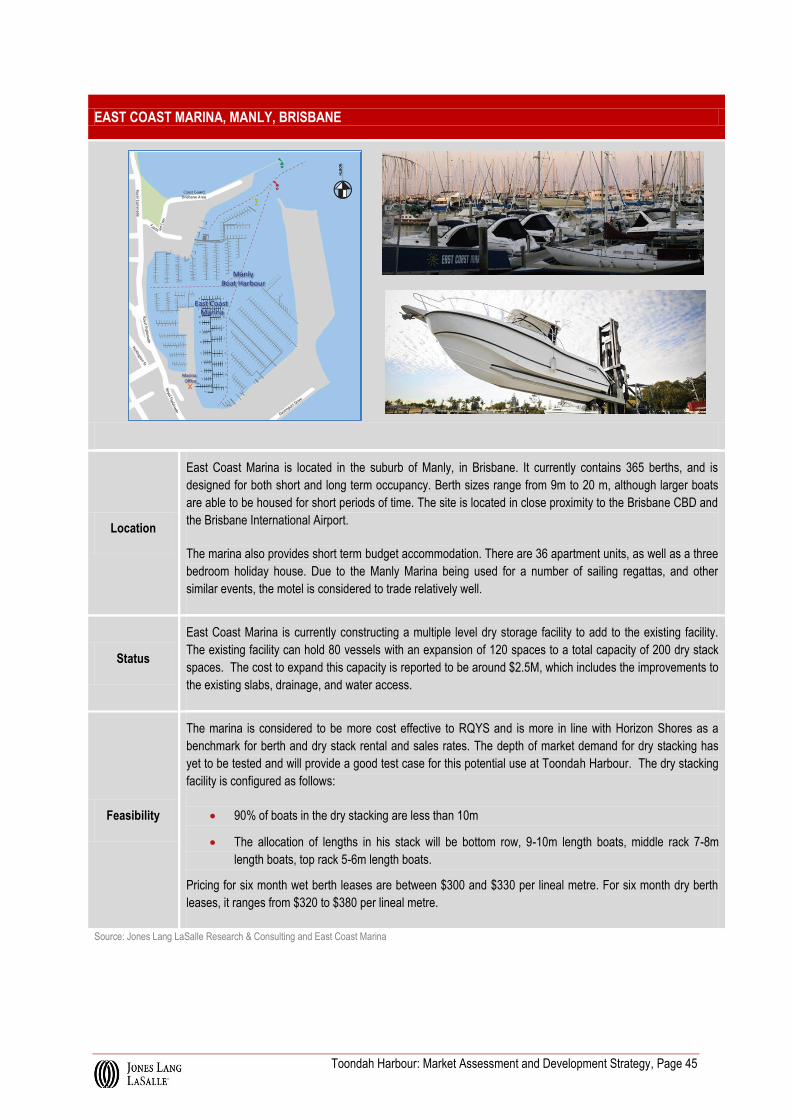
Toondah Harbour: Market Assessment and Development Strategy, Page 45
EAST COAST MARINA, MANLY, BRISBANE
Location
East Coast Marina is located in the suburb of Manly, in Brisbane. It currently contains 365 berths, and is
designed for both short and long term occupancy. Berth sizes range from 9m to 20 m, although larger boats
are able to be housed for short periods of time. The site is located in close proximity to the Brisbane CBD and
the Brisbane International Airport.
The marina also provides short term budget accommodation. There are 36 apartment units, as well as a three
bedroom holiday house. Due to the Manly Marina being used for a number of sailing regattas, and other
similar events, the motel is considered to trade relatively well.
Status
East Coast Marina is currently constructing a multiple level dry storage facility to add to the existing facility.
The existing facility can hold 80 vessels with an expansion of 120 spaces to a total capacity of 200 dry stack
spaces. The cost to expand this capacity is reported to be around $2.5M, which includes the improvements to
the existing slabs, drainage, and water access.
Feasibility
The marina is considered to be more cost effective to RQYS and is more in line with Horizon Shores as a
benchmark for berth and dry stack rental and sales rates. The depth of market demand for dry stacking has
yet to be tested and will provide a good test case for this potential use at Toondah Harbour. The dry stacking
facility is configured as follows:
90% of boats in the dry stacking are less than 10m
The allocation of lengths in his stack will be bottom row, 9-10m length boats, middle rack 7-8m
length boats, top rack 5-6m length boats.
Pricing for six month wet berth leases are between $300 and $330 per lineal metre. For six month dry berth
leases, it ranges from $320 to $380 per lineal metre.
Source: Jones Lang LaSalle Research & Consulting and East Coast Marina
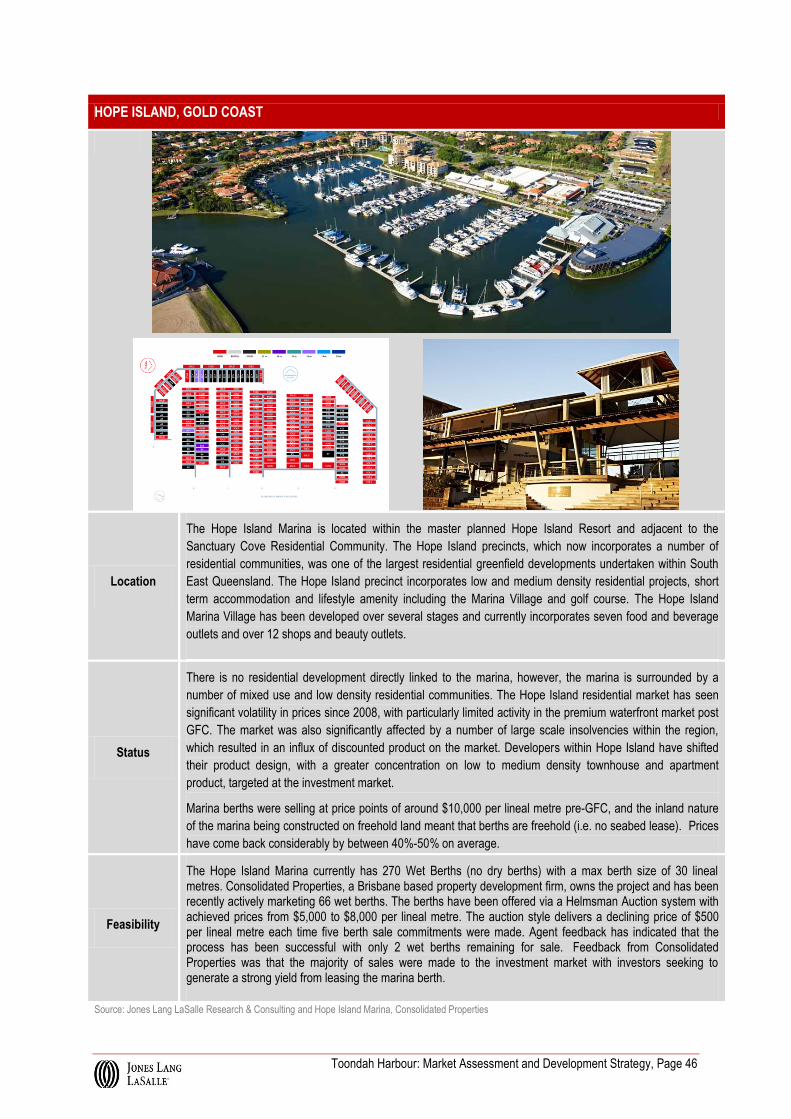
Toondah Harbour: Market Assessment and Development Strategy, Page 46
HOPE ISLAND, GOLD COAST
Location
The Hope Island Marina is located within the master planned Hope Island Resort and adjacent to the
Sanctuary Cove Residential Community. The Hope Island precincts, which now incorporates a number of
residential communities, was one of the largest residential greenfield developments undertaken within South
East Queensland. The Hope Island precinct incorporates low and medium density residential projects, short
term accommodation and lifestyle amenity including the Marina Village and golf course. The Hope Island
Marina Village has been developed over several stages and currently incorporates seven food and beverage
outlets and over 12 shops and beauty outlets.
Status
There is no residential development directly linked to the marina, however, the marina is surrounded by a
number of mixed use and low density residential communities. The Hope Island residential market has seen
significant volatility in prices since 2008, with particularly limited activity in the premium waterfront market post
GFC. The market was also significantly affected by a number of large scale insolvencies within the region,
which resulted in an influx of discounted product on the market. Developers within Hope Island have shifted
their product design, with a greater concentration on low to medium density townhouse and apartment
product, targeted at the investment market.
Marina berths were selling at price points of around $10,000 per lineal metre pre-GFC, and the inland nature
of the marina being constructed on freehold land meant that berths are freehold (i.e. no seabed lease). Prices
have come back considerably by between 40%-50% on average.
Feasibility
The Hope Island Marina currently has 270 Wet Berths (no dry berths) with a max berth size of 30 lineal metres. Consolidated Properties, a Brisbane based property development firm, owns the project and has been recently actively marketing 66 wet berths. The berths have been offered via a Helmsman Auction system with achieved prices from $5,000 to $8,000 per lineal metre. The auction style delivers a declining price of $500 per lineal metre each time five berth sale commitments were made. Agent feedback has indicated that the process has been successful with only 2 wet berths remaining for sale. Feedback from Consolidated Properties was that the majority of sales were made to the investment market with investors seeking to generate a strong yield from leasing the marina berth.
Source: Jones Lang LaSalle Research & Consulting and Hope Island Marina, Consolidated Properties
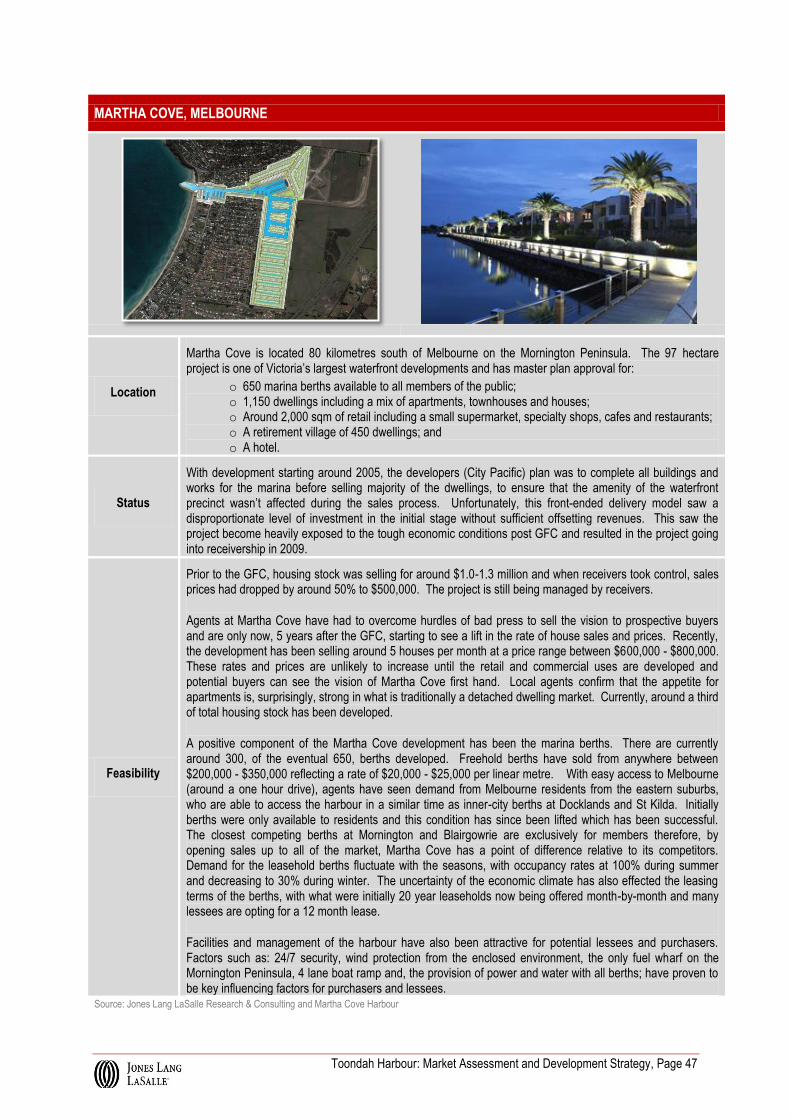
Toondah Harbour: Market Assessment and Development Strategy, Page 47
MARTHA COVE, MELBOURNE
Location
Martha Cove is located 80 kilometres south of Melbourne on the Mornington Peninsula. The 97 hectare project is one of Victoria’s largest waterfront developments and has master plan approval for:
o 650 marina berths available to all members of the public; o 1,150 dwellings including a mix of apartments, townhouses and houses; o Around 2,000 sqm of retail including a small supermarket, specialty shops, cafes and restaurants; o A retirement village of 450 dwellings; and o A hotel.
Status
With development starting around 2005, the developers (City Pacific) plan was to complete all buildings and works for the marina before selling majority of the dwellings, to ensure that the amenity of the waterfront precinct wasn’t affected during the sales process. Unfortunately, this front-ended delivery model saw a disproportionate level of investment in the initial stage without sufficient offsetting revenues. This saw the project become heavily exposed to the tough economic conditions post GFC and resulted in the project going into receivership in 2009.
Feasibility
Prior to the GFC, housing stock was selling for around $1.0-1.3 million and when receivers took control, sales prices had dropped by around 50% to $500,000. The project is still being managed by receivers.
Agents at Martha Cove have had to overcome hurdles of bad press to sell the vision to prospective buyers and are only now, 5 years after the GFC, starting to see a lift in the rate of house sales and prices. Recently, the development has been selling around 5 houses per month at a price range between $600,000 - $800,000. These rates and prices are unlikely to increase until the retail and commercial uses are developed and potential buyers can see the vision of Martha Cove first hand. Local agents confirm that the appetite for apartments is, surprisingly, strong in what is traditionally a detached dwelling market. Currently, around a third of total housing stock has been developed.
A positive component of the Martha Cove development has been the marina berths. There are currently around 300, of the eventual 650, berths developed. Freehold berths have sold from anywhere between $200,000 - $350,000 reflecting a rate of $20,000 - $25,000 per linear metre. With easy access to Melbourne (around a one hour drive), agents have seen demand from Melbourne residents from the eastern suburbs, who are able to access the harbour in a similar time as inner-city berths at Docklands and St Kilda. Initially berths were only available to residents and this condition has since been lifted which has been successful. The closest competing berths at Mornington and Blairgowrie are exclusively for members therefore, by opening sales up to all of the market, Martha Cove has a point of difference relative to its competitors. Demand for the leasehold berths fluctuate with the seasons, with occupancy rates at 100% during summer and decreasing to 30% during winter. The uncertainty of the economic climate has also effected the leasing terms of the berths, with what were initially 20 year leaseholds now being offered month-by-month and many lessees are opting for a 12 month lease.
Facilities and management of the harbour have also been attractive for potential lessees and purchasers. Factors such as: 24/7 security, wind protection from the enclosed environment, the only fuel wharf on the Mornington Peninsula, 4 lane boat ramp and, the provision of power and water with all berths; have proven to be key influencing factors for purchasers and lessees.
Source: Jones Lang LaSalle Research & Consulting and Martha Cove Harbour

Toondah Harbour: Market Assessment and Development Strategy, Page 48
PORT COOGEE, PERTH
Location
Port Coogee is a 140 hectare master planned community which is currently being developed 23 kilometres
south of Perth CBD. In 2013, the development received a prestigious award being “the best master planned
community in Australia” from the UDIA.
Status
When complete, the development is proposed to incorporate 1,900 dwellings (1,100 apartments and 800
houses), 300 marina berths and around 12,000 sqm of retail floorspace which is to include a full-line
supermarket, specialty shops, cafes and restaurants. The development is still in early stages with 150 berths
released and a number of dwellings developed.
Feasibility
Market conditions for all land use types have been strong, with key indicators being:
Demand for marina berths has exceeded expectation and currently the 150 berths are at close to full
capacity. The berths are leasehold and are currently leased for $5,500 per annum;
Waterfront townhouses are listed ‘from $700,000’ with lots ranging from 300-375 sqm;
Detached dwellings, which are located further from the marina, are listed at +$575,000 for lots
ranging from 450–600 sqm and are currently achieving sale rates of around $1,500 per sqm;
Land sale rates are slightly above $1,000 per sqm on average.
Currently there is no retail, with Dome Café due in late 2013. Nonetheless, retailer interest is very
strong. The current lack of retail is creating a hurdle in selling house and land packages, particularly
water front homes.
The most active market for residential sales at present is the retiree market, who are not downsizing on cost
but are downsizing on space. The buyers investigating higher-end waterfront product are reported to be
reluctant to invest until the retail amenity is provided. This is considered to be major factor in limiting take up
in this segment of the residential market.
Source: Jones Lang LaSalle Research & Consulting and Port Coogee Marina
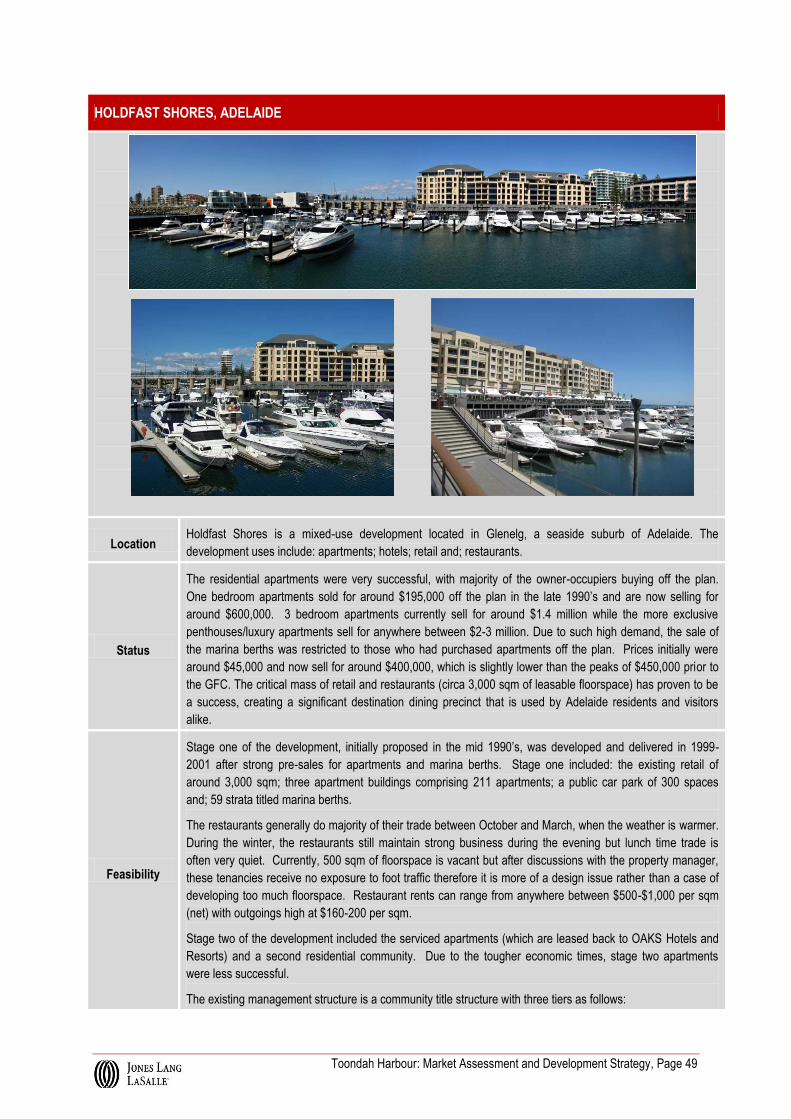
Toondah Harbour: Market Assessment and Development Strategy, Page 49
HOLDFAST SHORES, ADELAIDE
Location Holdfast Shores is a mixed-use development located in Glenelg, a seaside suburb of Adelaide. The
development uses include: apartments; hotels; retail and; restaurants.
Status
The residential apartments were very successful, with majority of the owner-occupiers buying off the plan.
One bedroom apartments sold for around $195,000 off the plan in the late 1990’s and are now selling for
around $600,000. 3 bedroom apartments currently sell for around $1.4 million while the more exclusive
penthouses/luxury apartments sell for anywhere between $2-3 million. Due to such high demand, the sale of
the marina berths was restricted to those who had purchased apartments off the plan. Prices initially were
around $45,000 and now sell for around $400,000, which is slightly lower than the peaks of $450,000 prior to
the GFC. The critical mass of retail and restaurants (circa 3,000 sqm of leasable floorspace) has proven to be
a success, creating a significant destination dining precinct that is used by Adelaide residents and visitors
alike.
Feasibility
Stage one of the development, initially proposed in the mid 1990’s, was developed and delivered in 1999-
2001 after strong pre-sales for apartments and marina berths. Stage one included: the existing retail of
around 3,000 sqm; three apartment buildings comprising 211 apartments; a public car park of 300 spaces
and; 59 strata titled marina berths.
The restaurants generally do majority of their trade between October and March, when the weather is warmer.
During the winter, the restaurants still maintain strong business during the evening but lunch time trade is
often very quiet. Currently, 500 sqm of floorspace is vacant but after discussions with the property manager,
these tenancies receive no exposure to foot traffic therefore it is more of a design issue rather than a case of
developing too much floorspace. Restaurant rents can range from anywhere between $500-$1,000 per sqm
(net) with outgoings high at $160-200 per sqm.
Stage two of the development included the serviced apartments (which are leased back to OAKS Hotels and
Resorts) and a second residential community. Due to the tougher economic times, stage two apartments
were less successful.
The existing management structure is a community title structure with three tiers as follows:
Toondah Harbour: Market Assessment and Development Strategy, Page 50
o Primary Tier. The primary management team are accountable for maintaining all common facilities
within the larger area such as footpaths, marinas etc. All costs are passed on to those included in
the secondary tier. The Primary Tier also governs any significant maintenance and building
decisions by the secondary tier.
o Secondary Tier. Secondary tier includes apartment buildings, retail and the marina. Each member
of the secondary tier is responsible for their own building costs and maintenance. They must
answer to the primary tier which will pass on costs and also govern any significant decisions that
may impact other users in the secondary tier (e.g. painting their building etc.)
o Tertiary Tier. The tertiary tier is defined by communities that, in some instances, will form the
make-up of an apartment building. These communities are often grouped together based on the
facilities they shares such as: elevator, common hallways etc.
o Below the tertiary tier is the strata title of each apartment. Speaking with the body corporate, the
system works well and keeps all parties involved accountable for their own costs and also unified in
their decision making by answering to a higher rank.
Source: Jones Lang LaSalle Research & Consulting and Holdfast Shore Marina
Toondah Harbour: Market Assessment and Development Strategy, Page 51
8 Feasibility Testing
8.1 Overview
The basis of this report has been to review and test the economic and commercial viability of proposed developments within
Toondah Harbour. The landholding incorporates land and “wet areas‟ of approximately 6.7 hectares and 1.3 hectares
respectively, as well as a mix of tenures and ownership. The majority of the site is owned or controlled by Redland City
Council and the Queensland State Government with one privately owned site owned by Stradbroke Ferries.
The feasibilities are based on adopting development densities proposed in our preliminary development strategy advice and
refined during the process of this further detailed assessment. The indicative masterplan concept scheme developed by
Economic Development Queensland (EDQ) was informed by the preliminary development strategy advice prepared by
Jones Lang LaSalle in late 2012. Without a detailed master plan develop already established it has been used as the basis
for evaluating the product positioning (e.g. premium and mid-tier) and associated price points. It is also informed by
discussions held with Stradbroke Ferries which indicated an interest by the business owner (Transit Systems) in establishing
their global head office at Toondah Harbour as an owner occupier. The report and discussions have recommended that
options for possible development consist of:
o Medium Density Townhouse Product (parklands) – a 13 townhouse development has been modelled
o High Density Residential Development – a 45 unit development has been modelled
o Commercial / Retail Development (Stradbroke Ferries as the anchor commercial tenant)
o Hotel / Function centre
o Staged Marina
For the purpose of the feasibility assessments, we have reviewed the commercial viability of each proposed development
assuming the land is serviced as indicated in the report. Under this approach we have reviewed the built form scenarios for
each development and adopted the build rates as outlined in the report.
8.2 Construction Cost Assessment
Construction Costs
Early indicators for the housing construction market suggest that 2013 will see some improvement in the number of
approvals but it is unlikely that there will be any change in lump sum construction costs, with significant competition keeping
costs from escalating. By way of example a recent survey by Department of Housing and Public Works – Building Policy
Unit of 80 prequalified contractors found that on average, contractors estimated they were operating at 53% of their total
capacity, which is the lowest level recorded since commencement of the survey in 2004. Looking ahead to the coming
quarter, the survey also concluded that 19% of contractors expected their workload to decrease and 40% expected their
workload to stay the same.
The graph below of Queensland building approvals demonstrates the erratic trends that resulted from the economic stimulus
measures and then settling activity.
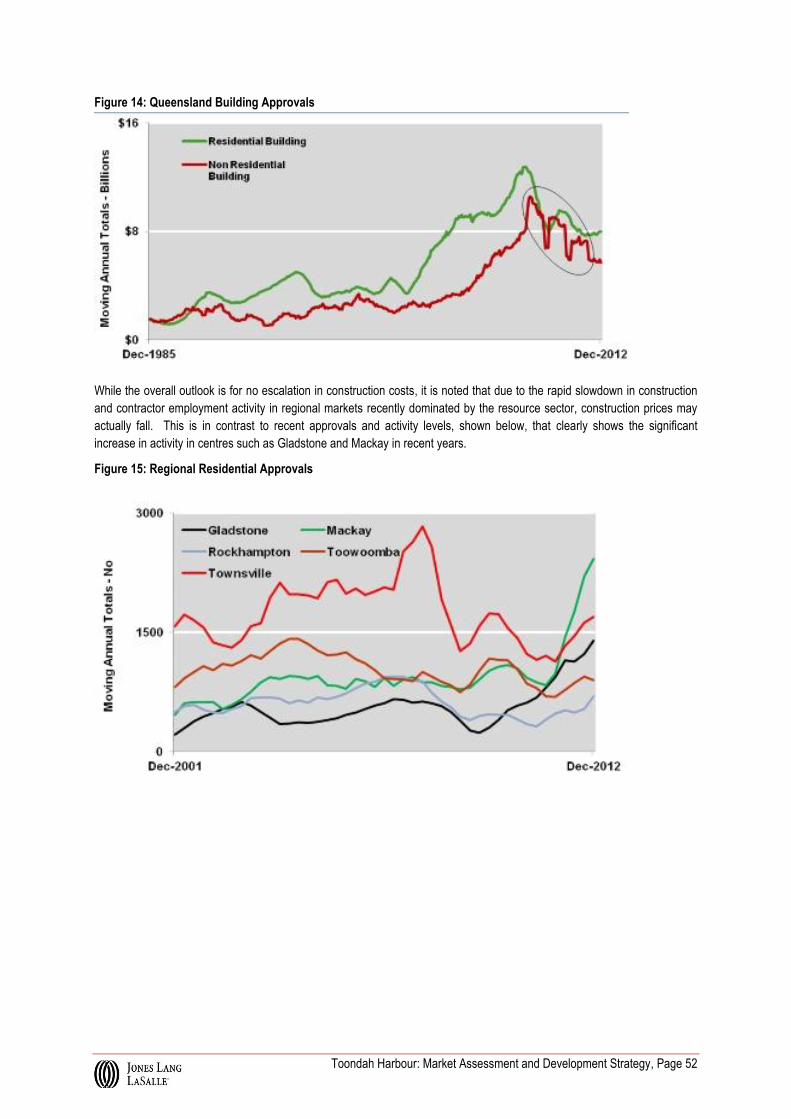
Toondah Harbour: Market Assessment and Development Strategy, Page 52
Figure 14: Queensland Building Approvals
While the overall outlook is for no escalation in construction costs, it is noted that due to the rapid slowdown in construction
and contractor employment activity in regional markets recently dominated by the resource sector, construction prices may
actually fall. This is in contrast to recent approvals and activity levels, shown below, that clearly shows the significant
increase in activity in centres such as Gladstone and Mackay in recent years.
Figure 15: Regional Residential Approvals
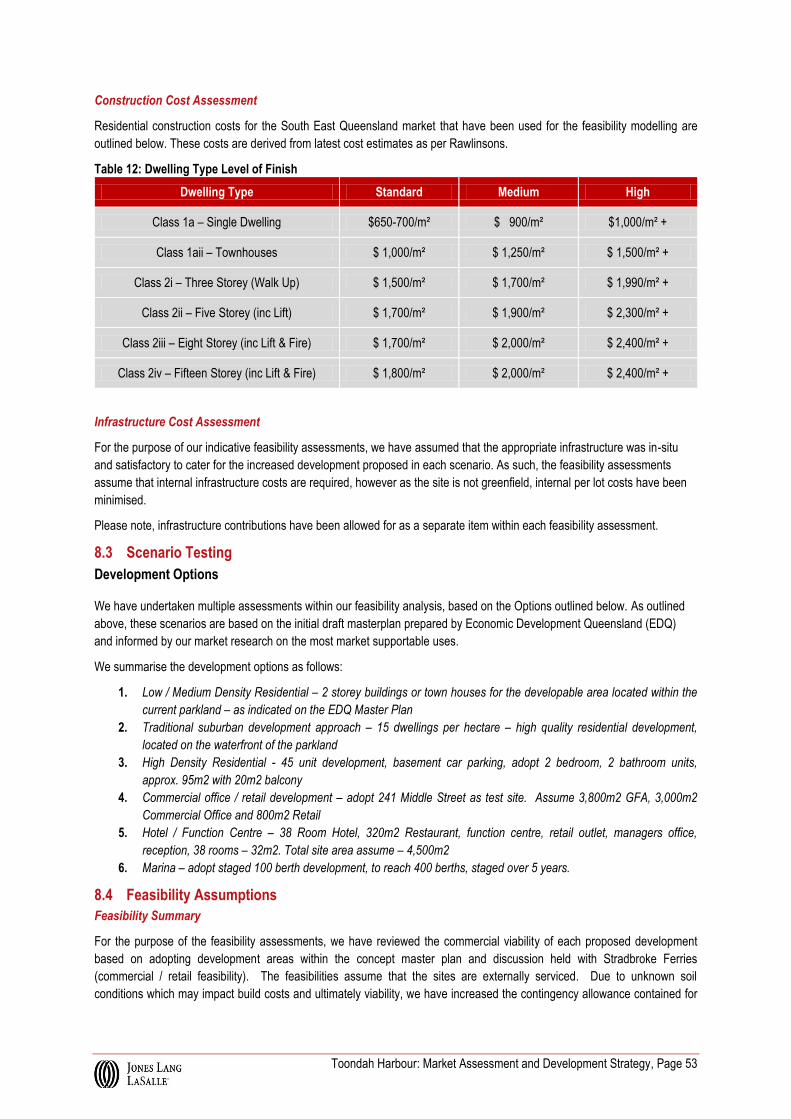
Toondah Harbour: Market Assessment and Development Strategy, Page 53
Construction Cost Assessment
Residential construction costs for the South East Queensland market that have been used for the feasibility modelling are
outlined below. These costs are derived from latest cost estimates as per Rawlinsons.
Table 12: Dwelling Type Level of Finish
Dwelling Type Standard Medium High
Class 1a – Single Dwelling $650-700/m² $ 900/m² $1,000/m² +
Class 1aii – Townhouses $ 1,000/m² $ 1,250/m² $ 1,500/m² +
Class 2i – Three Storey (Walk Up) $ 1,500/m² $ 1,700/m² $ 1,990/m² +
Class 2ii – Five Storey (inc Lift) $ 1,700/m² $ 1,900/m² $ 2,300/m² +
Class 2iii – Eight Storey (inc Lift & Fire) $ 1,700/m² $ 2,000/m² $ 2,400/m² +
Class 2iv – Fifteen Storey (inc Lift & Fire) $ 1,800/m² $ 2,000/m² $ 2,400/m² +
Infrastructure Cost Assessment
For the purpose of our indicative feasibility assessments, we have assumed that the appropriate infrastructure was in-situ
and satisfactory to cater for the increased development proposed in each scenario. As such, the feasibility assessments
assume that internal infrastructure costs are required, however as the site is not greenfield, internal per lot costs have been
minimised.
Please note, infrastructure contributions have been allowed for as a separate item within each feasibility assessment.
8.3 Scenario Testing
Development Options
We have undertaken multiple assessments within our feasibility analysis, based on the Options outlined below. As outlined
above, these scenarios are based on the initial draft masterplan prepared by Economic Development Queensland (EDQ)
and informed by our market research on the most market supportable uses.
We summarise the development options as follows:
1. Low / Medium Density Residential – 2 storey buildings or town houses for the developable area located within the
current parkland – as indicated on the EDQ Master Plan
2. Traditional suburban development approach – 15 dwellings per hectare – high quality residential development,
located on the waterfront of the parkland
3. High Density Residential - 45 unit development, basement car parking, adopt 2 bedroom, 2 bathroom units,
approx. 95m2 with 20m2 balcony
4. Commercial office / retail development – adopt 241 Middle Street as test site. Assume 3,800m2 GFA, 3,000m2
Commercial Office and 800m2 Retail
5. Hotel / Function Centre – 38 Room Hotel, 320m2 Restaurant, function centre, retail outlet, managers office,
reception, 38 rooms – 32m2. Total site area assume – 4,500m2
6. Marina – adopt staged 100 berth development, to reach 400 berths, staged over 5 years.
8.4 Feasibility Assumptions
Feasibility Summary
For the purpose of the feasibility assessments, we have reviewed the commercial viability of each proposed development
based on adopting development areas within the concept master plan and discussion held with Stradbroke Ferries
(commercial / retail feasibility). The feasibilities assume that the sites are externally serviced. Due to unknown soil
conditions which may impact build costs and ultimately viability, we have increased the contingency allowance contained for
Toondah Harbour: Market Assessment and Development Strategy, Page 54
each feasibility to allow for these latent conditions. We note that this allowance may not be sufficient and will be dependent
on geotechnical conditions which are yet to be verified.
Under this approach we have reviewed the built form scenarios for each feasibility and adopted relevant build rates and sale
rates to determine whether each development is viable in the current market.
Feasibility Methodology and Approach
a. Development Feasibility Analysis
The feasibilities have assessed the financial viability of six (6) development scenarios as outlined above. Each feasibility has
applied construction rates applicable to the specific build form. The static feasibility approach assumes that all dwellings /
retail / commercial areas are sold at the completion of the development period over a defined period depending on the size
of the development. The Development Return is calculated by dividing the project profit by the Total Development Costs
(TDC) assuming debt funding for the Total Development Costs including land. Each feasibility has been cash flowed and
time spans allocated to each item in the feasibility.
We note that we have adopted a Discounted Cashflow (DCF) Model for the hotel / function centre feasibility, assuming an
operation period, defined occupancy levels and a termination / sale period after 10 years.
The key parameters contained within the feasibility have been based on current market evidence and rates.
The feasibility models for each scenario have been used to determine the Return on Total Development Costs and profit
based on appropriate market sales figures, total development costs and land values. This feasibility model provides an
indication of the projects viability and information known at the time of preparing these models.
Detailed Feasibility Summary (each scenario)
The feasibility models for each scenario have been based on the following parameters and assumptions:
a. Land Cost
Land values have been adopted based on the market evidence for comparable transactions as outlined in this report. A
square metre rate based on land area has been adopted for each individual site contained in each scenario.
The square metre rate for land cost has been applied to the total gross land area for each area to determine the acquisition
cost. We have then applied additional costs including stamp duty and legal costs.
b. Building / Planning Costs
Individual build rates have been adopted for each scenario and have been based on the densities for each scenario. The
proposed built forms are based on:
o Low / Medium rise residential built form (townhouse)
o Residential high density built form
o Comparative Marina Build Rates
o Comparative hotel / function centre build rates
o 3 storey commercial office / ground floor retail
The build costs in each scenario have been estimated based on elemental building costs on a $/m2 basis. A contingency of
10% has been applied to the build figure reflecting any variations that may arise during the building phase, specifically latent
ground conditions (but excluding any poor quality geotechnical conditions).
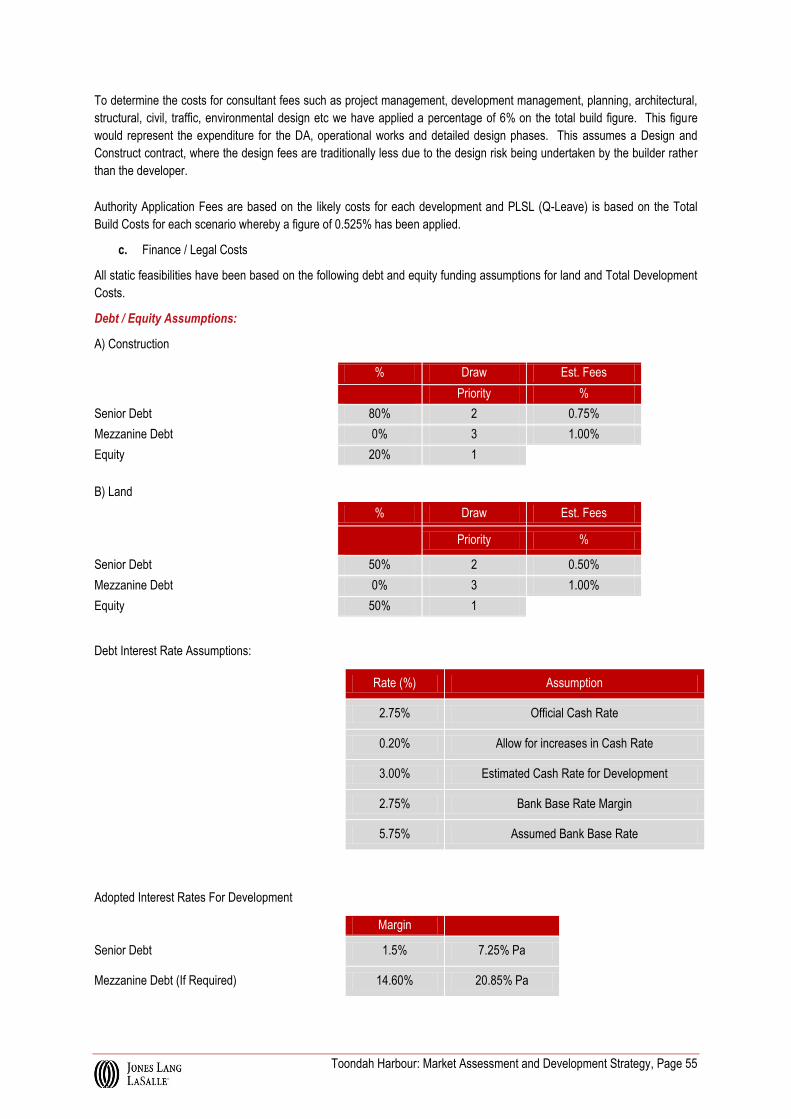
Toondah Harbour: Market Assessment and Development Strategy, Page 55
To determine the costs for consultant fees such as project management, development management, planning, architectural,
structural, civil, traffic, environmental design etc we have applied a percentage of 6% on the total build figure. This figure
would represent the expenditure for the DA, operational works and detailed design phases. This assumes a Design and
Construct contract, where the design fees are traditionally less due to the design risk being undertaken by the builder rather
than the developer.
Authority Application Fees are based on the likely costs for each development and PLSL (Q-Leave) is based on the Total
Build Costs for each scenario whereby a figure of 0.525% has been applied.
c. Finance / Legal Costs
All static feasibilities have been based on the following debt and equity funding assumptions for land and Total Development
Costs.
Debt / Equity Assumptions:
A) Construction
% Draw Est. Fees
Priority %
Senior Debt 80% 2 0.75%
Mezzanine Debt 0% 3 1.00%
Equity 20% 1
B) Land
% Draw Est. Fees
Priority %
Senior Debt 50% 2 0.50%
Mezzanine Debt 0% 3 1.00%
Equity 50% 1
Debt Interest Rate Assumptions:
Rate (%) Assumption
2.75% Official Cash Rate
0.20% Allow for increases in Cash Rate
3.00% Estimated Cash Rate for Development
2.75% Bank Base Rate Margin
5.75% Assumed Bank Base Rate
Adopted Interest Rates For Development
Margin
Senior Debt 1.5% 7.25% Pa
Mezzanine Debt (If Required) 14.60% 20.85% Pa

Toondah Harbour: Market Assessment and Development Strategy, Page 56
d. Selling Costs
Legal Fees have been applied for acquisition fees and for the preparation of leases, sale and building contracts. Marketing
and promotion fees have been based on a percentage of Gross Realisation, which is typical for development feasibility. We
note that this allows for any marketing and promotion required to secure sales. This does not include commissions for sales
and leases as this is represented as a separate figure in the feasibility.
e. Development Income / Gross Realisation
A sale rate has been applied to each component based on dwelling type to determine the Gross Realisation for the
residential feasibilities. The sale rate is adopted based on recent sales evidence of similar product, with adjustments for price
points that are considered to reflect product position and local site (e.g. ocean views or direct oceanfrontage). The hotel
model capitalises income for rooms as well as food and beverage.
8.5 Development Scenario Outcomes and Discussion
Scenario 1: Low / Medium Density Residential – 2 storey buildings or town houses for the developable area located
within the current parkland – as indicated on the concept masterplan layout prepared by EDQ.
Scenario 1 tested the viability of 13 Townhouses located within the Parkland Area adjacent to the waterfront. We note that
this area is currently being used as community parklands, however, consistent with the indicative master plan it is assumed
suitable for use development. We note that the ability to develop on this part of the site is still subject to further investigation
by Council and Economic Development Queensland.
We do however believe that this form of development and density would be viable in the current market and demand would
exist to enable projects of this size (and greater) to be undertaken.
Based on the aforementioned assumptions, this feasibility was viable, producing positive returns.
The adopted assumes for this model were:
o Sales price for Scenario 1 was $546,000 for an average GFA of 122m2 including garage and excluding exclusive use areas.
o Average build cost of $1,525/m2 plus contingency and civil costs, or $233,000 per dwelling including council contributions and design.
o Land cost of $828/m2, based on averaging the sales from the Toondah Harbour Preliminary Development Strategy Report, December 2012.
Table 11: Scenario 1 - Townhouse - Feasibility Results
Scenario Total GBA
TDC NR GR Finance Costs
Dev Profit NPV ROC
1 1,326 $4.94m $5.94m $7.1m $156k $842k N/A 17.10%
Totals 1,326 $4.94m $5.94m $7.1m $156k $842k N/A 17.10%
Scenario 2: Traditional suburban development approach – 15 dwellings per hectare – high quality residential
development, located on the waterfront of the parkland
Scenario 2 was not viable, we attribute this to the fact that typically in these types of developments, land cost typically would
be amortised over a greater number of lots (sub-division) or land purchased under ‘builder’s terms’ arrangements therefore
resulting in a lower land cost. For the purpose of this Scenario, we have assumed the development of two standard
residential house lots at current land prices. The intention in the next phase of this project will be to model a full residential
sub-division based on firm designs and civil engineering design.
Table 12: Scenario 2 – Residential - Feasibility Results
Scenario Total GFA TDC NR GR Finance Costs
Dev Profit NPV ROC
2 460m2 $2.32m $2.53 $3.003m $74k $137k N/A 6%
Totals 460m2 $2.32m $2.53 $3.003m $74k $137k N/A 6%

Toondah Harbour: Market Assessment and Development Strategy, Page 57
Scenario 3: High Density Residential - 45 unit development, basement carparking, 2 bedroom, 2 bathroom units,
approx. 95m2 with 20m2 balcony
Scenario 3 tested the viability of 45 unit multi-rise high density development located on a 3,000m2 site. The assumption
was made that this development would be located within the Toondah Harbour site and in close proximity to the waterfront,
therefore justifying higher price points.
This scenario reflected higher density projects recently developed within the area providing a number of existing
benchmarks. We note that the local area has a number of similar projects (with Development Approval) that may compete
with this proposed project; however we have assumed that the location of this site would make it superior to other offerings
currently on the market.
We believe that this form of development and density would be viable in the current market, however strongly recommend
detailed geotechnical investigations be undertaken as the site may be highly reactive and result in significant sub-structure
costs that may impact the proposed developments viability.
Based on the aforementioned assumptions, the results of this feasibility are borderline viable, however with value
engineering on the design and potential concessions on headworks / infrastructure charges, the project may become more
viable.
The adopted assumes for this model were:
o Sales price assumed 2 bed / 2 bath units – GBA 116m2. o Average sales price adopted for Scenario 3 was $498,000 o Average build cost of $2,150/m2 plus $1,000/m2 for basement area o Contingency and civil costs added to this together with council contributions and design, average cost inclusive
equated to $317k/unit o Land cost of $335/m2, based on averaging the most recent and comparable higher density development site sales
from 201 Middle Street, 215 Middle Street, 222-224 Middle Street
Table 13: Scenario 3 – High Density Multi-rise Residential Unit Development - Feasibility Results
Scenario Total GFA TDC NR GR Finance Costs
Dev Profit NPV ROC
3 4,950 $15.76m $18.83m $22.42m $820k $2.61m N/A 16.50%
Totals 4,950 $15.76m $18.83m $22.42m $820k $2.61m N/A 16.50%
Scenario 3a: High Density Residential - 45 unit development, basement carparking, adopt 2 bedroom, 2 bathroom
units, approx. 95m2 with 20m2 balcony – EXCLUDING LAND
Scenario 3a tested the viability of the same 45 unit multi-rise high density scheme and all other inputs equal with exception of
land which was assumed to be contributed at no cost to demonstrate the improvement in viability compared to Scenario 3.
The results demonstrate that nil land cost lifts Return on Cost from 17% to 22%. This level is considered sufficient to gain
bank funding for the project as it is above 20% return. This demonstrates that the viability can be improved significantly (in
this case increasing returns by around a third delivering an additional 5% for total Return on Cost). This suggests that an
option to support earlier viability of higher density projects could be through reducing land costs across the precinct to a
viable level for medium density product where the broader Toondah Harbour site is being delivered by one developer.
Table 14: Scenario 3a – High Density Multi-rise Residential Unit Development - Feasibility Results
Scenario Total GFA TDC NR GR Finance Costs
Dev Profit NPV ROC
3a 4,950 $14,718 $18.83m $22.42m $759k $3.357m N/A 22%
Totals 4,950 $15.76m $18.83m $22.42m $759k $3.357m N/A 22%
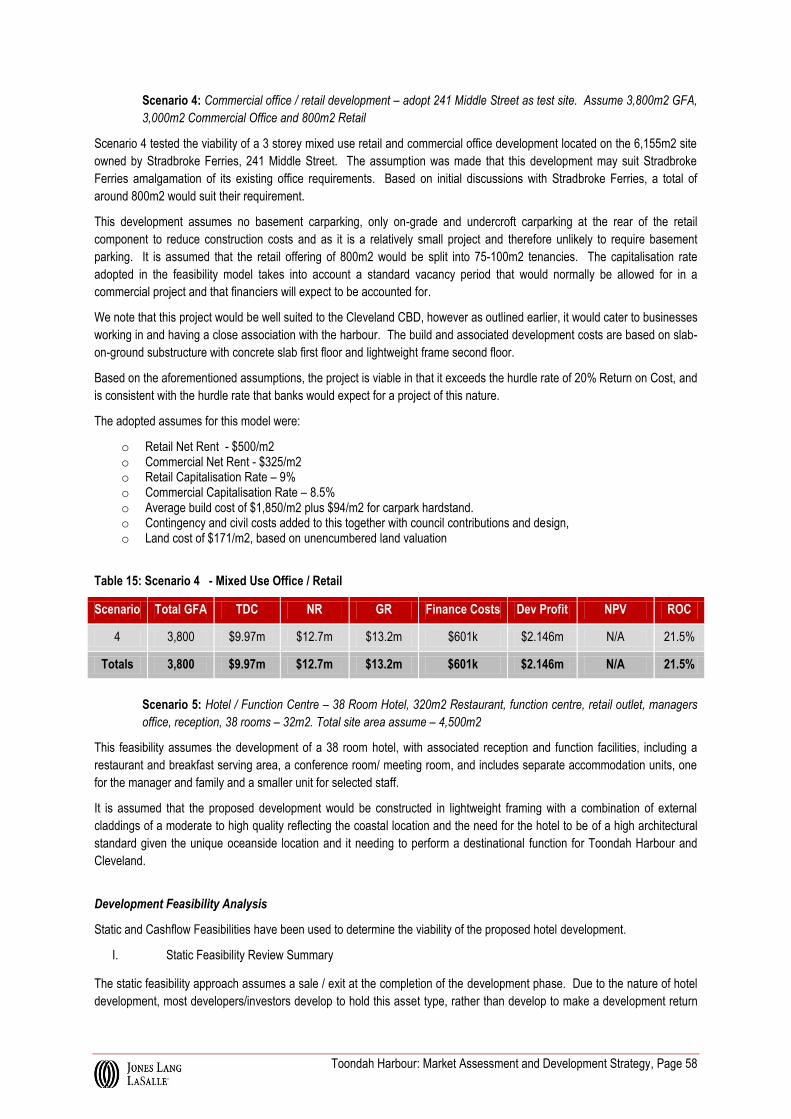
Toondah Harbour: Market Assessment and Development Strategy, Page 58
Scenario 4: Commercial office / retail development – adopt 241 Middle Street as test site. Assume 3,800m2 GFA,
3,000m2 Commercial Office and 800m2 Retail
Scenario 4 tested the viability of a 3 storey mixed use retail and commercial office development located on the 6,155m2 site
owned by Stradbroke Ferries, 241 Middle Street. The assumption was made that this development may suit Stradbroke
Ferries amalgamation of its existing office requirements. Based on initial discussions with Stradbroke Ferries, a total of
around 800m2 would suit their requirement.
This development assumes no basement carparking, only on-grade and undercroft carparking at the rear of the retail
component to reduce construction costs and as it is a relatively small project and therefore unlikely to require basement
parking. It is assumed that the retail offering of 800m2 would be split into 75-100m2 tenancies. The capitalisation rate
adopted in the feasibility model takes into account a standard vacancy period that would normally be allowed for in a
commercial project and that financiers will expect to be accounted for.
We note that this project would be well suited to the Cleveland CBD, however as outlined earlier, it would cater to businesses
working in and having a close association with the harbour. The build and associated development costs are based on slab-
on-ground substructure with concrete slab first floor and lightweight frame second floor.
Based on the aforementioned assumptions, the project is viable in that it exceeds the hurdle rate of 20% Return on Cost, and
is consistent with the hurdle rate that banks would expect for a project of this nature.
The adopted assumes for this model were:
o Retail Net Rent - $500/m2 o Commercial Net Rent - $325/m2 o Retail Capitalisation Rate – 9% o Commercial Capitalisation Rate – 8.5% o Average build cost of $1,850/m2 plus $94/m2 for carpark hardstand. o Contingency and civil costs added to this together with council contributions and design, o Land cost of $171/m2, based on unencumbered land valuation
Table 15: Scenario 4 - Mixed Use Office / Retail
Scenario Total GFA TDC NR GR Finance Costs Dev Profit NPV ROC
4 3,800 $9.97m $12.7m $13.2m $601k $2.146m N/A 21.5%
Totals 3,800 $9.97m $12.7m $13.2m $601k $2.146m N/A 21.5%
Scenario 5: Hotel / Function Centre – 38 Room Hotel, 320m2 Restaurant, function centre, retail outlet, managers
office, reception, 38 rooms – 32m2. Total site area assume – 4,500m2
This feasibility assumes the development of a 38 room hotel, with associated reception and function facilities, including a
restaurant and breakfast serving area, a conference room/ meeting room, and includes separate accommodation units, one
for the manager and family and a smaller unit for selected staff.
It is assumed that the proposed development would be constructed in lightweight framing with a combination of external
claddings of a moderate to high quality reflecting the coastal location and the need for the hotel to be of a high architectural
standard given the unique oceanside location and it needing to perform a destinational function for Toondah Harbour and
Cleveland.
Development Feasibility Analysis
Static and Cashflow Feasibilities have been used to determine the viability of the proposed hotel development.
I. Static Feasibility Review Summary
The static feasibility approach assumes a sale / exit at the completion of the development phase. Due to the nature of hotel
development, most developers/investors develop to hold this asset type, rather than develop to make a development return
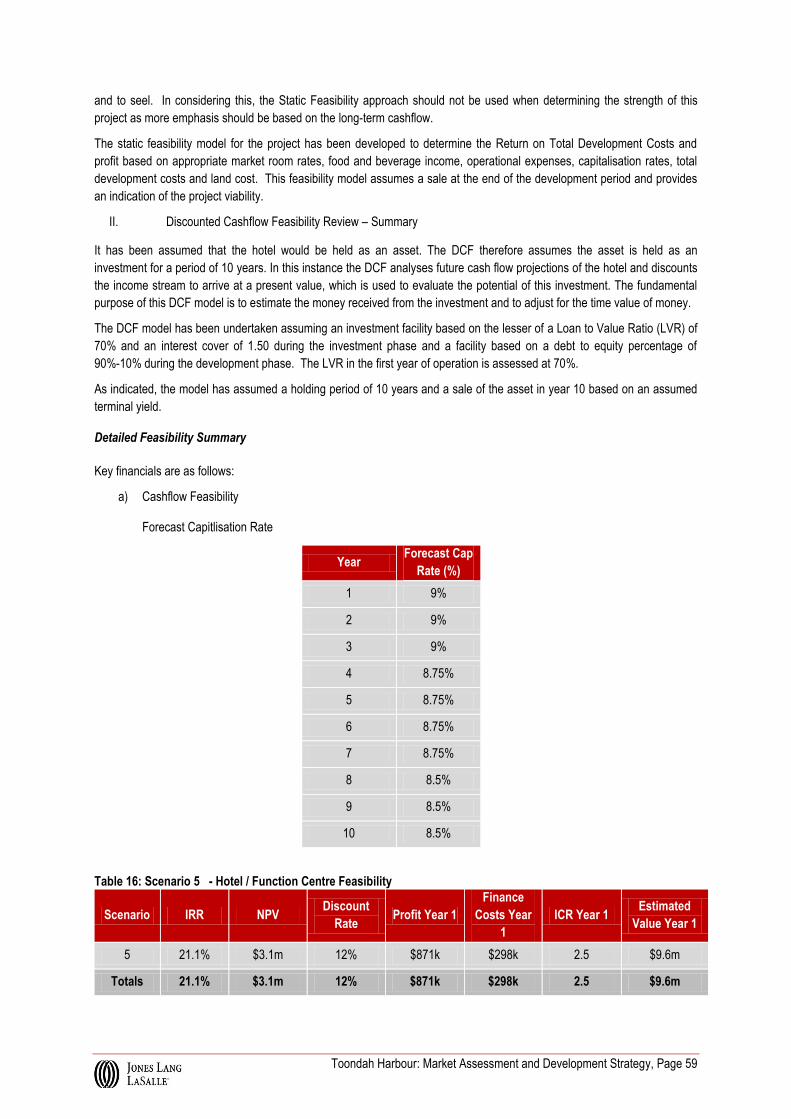
Toondah Harbour: Market Assessment and Development Strategy, Page 59
and to seel. In considering this, the Static Feasibility approach should not be used when determining the strength of this
project as more emphasis should be based on the long-term cashflow.
The static feasibility model for the project has been developed to determine the Return on Total Development Costs and
profit based on appropriate market room rates, food and beverage income, operational expenses, capitalisation rates, total
development costs and land cost. This feasibility model assumes a sale at the end of the development period and provides
an indication of the project viability.
II. Discounted Cashflow Feasibility Review – Summary
It has been assumed that the hotel would be held as an asset. The DCF therefore assumes the asset is held as an
investment for a period of 10 years. In this instance the DCF analyses future cash flow projections of the hotel and discounts
the income stream to arrive at a present value, which is used to evaluate the potential of this investment. The fundamental
purpose of this DCF model is to estimate the money received from the investment and to adjust for the time value of money.
The DCF model has been undertaken assuming an investment facility based on the lesser of a Loan to Value Ratio (LVR) of
70% and an interest cover of 1.50 during the investment phase and a facility based on a debt to equity percentage of
90%-10% during the development phase. The LVR in the first year of operation is assessed at 70%.
As indicated, the model has assumed a holding period of 10 years and a sale of the asset in year 10 based on an assumed
terminal yield.
Detailed Feasibility Summary
Key financials are as follows:
a) Cashflow Feasibility Forecast Capitlisation Rate
Year Forecast Cap
Rate (%)
1 9%
2 9%
3 9%
4 8.75%
5 8.75%
6 8.75%
7 8.75%
8 8.5%
9 8.5%
10 8.5%
Table 16: Scenario 5 - Hotel / Function Centre Feasibility
Scenario IRR NPV Discount
Rate Profit Year 1
Finance
Costs Year
1
ICR Year 1 Estimated
Value Year 1
5 21.1% $3.1m 12% $871k $298k 2.5 $9.6m
Totals 21.1% $3.1m 12% $871k $298k 2.5 $9.6m
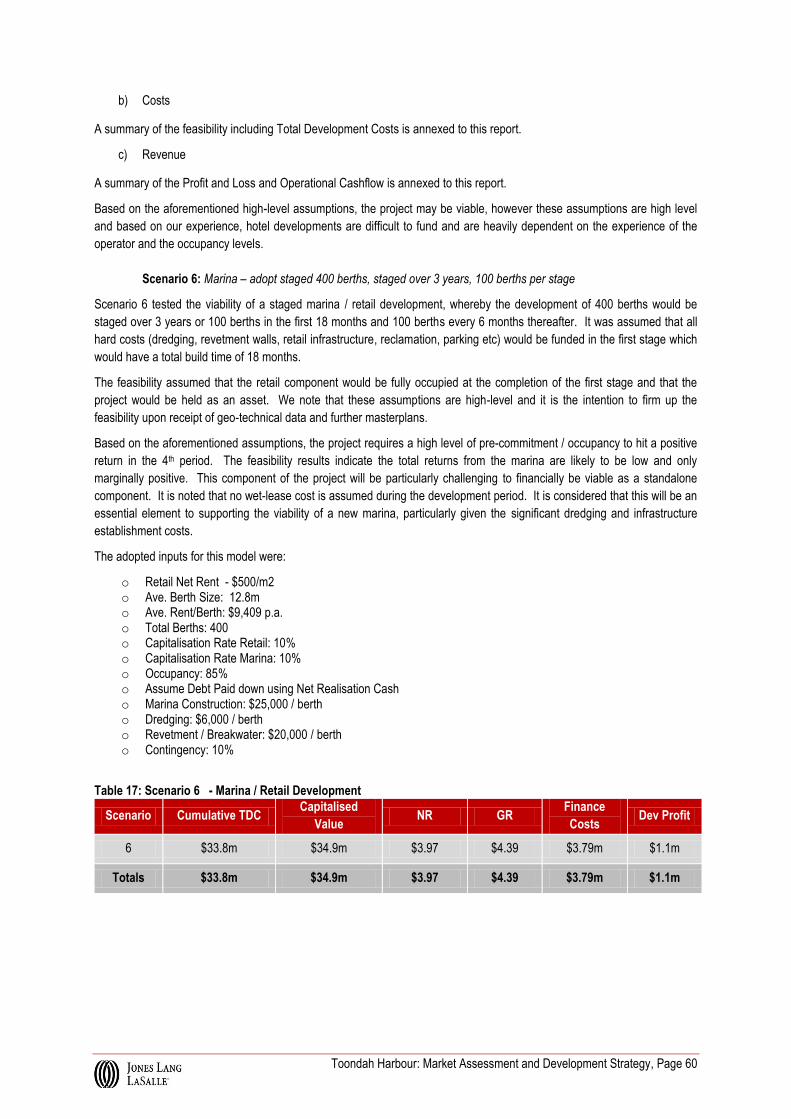
Toondah Harbour: Market Assessment and Development Strategy, Page 60
b) Costs
A summary of the feasibility including Total Development Costs is annexed to this report.
c) Revenue
A summary of the Profit and Loss and Operational Cashflow is annexed to this report.
Based on the aforementioned high-level assumptions, the project may be viable, however these assumptions are high level
and based on our experience, hotel developments are difficult to fund and are heavily dependent on the experience of the
operator and the occupancy levels.
Scenario 6: Marina – adopt staged 400 berths, staged over 3 years, 100 berths per stage
Scenario 6 tested the viability of a staged marina / retail development, whereby the development of 400 berths would be
staged over 3 years or 100 berths in the first 18 months and 100 berths every 6 months thereafter. It was assumed that all
hard costs (dredging, revetment walls, retail infrastructure, reclamation, parking etc) would be funded in the first stage which
would have a total build time of 18 months.
The feasibility assumed that the retail component would be fully occupied at the completion of the first stage and that the
project would be held as an asset. We note that these assumptions are high-level and it is the intention to firm up the
feasibility upon receipt of geo-technical data and further masterplans.
Based on the aforementioned assumptions, the project requires a high level of pre-commitment / occupancy to hit a positive
return in the 4th period. The feasibility results indicate the total returns from the marina are likely to be low and only
marginally positive. This component of the project will be particularly challenging to financially be viable as a standalone
component. It is noted that no wet-lease cost is assumed during the development period. It is considered that this will be an
essential element to supporting the viability of a new marina, particularly given the significant dredging and infrastructure
establishment costs.
The adopted inputs for this model were:
o Retail Net Rent - $500/m2 o Ave. Berth Size: 12.8m o Ave. Rent/Berth: $9,409 p.a. o Total Berths: 400 o Capitalisation Rate Retail: 10% o Capitalisation Rate Marina: 10% o Occupancy: 85% o Assume Debt Paid down using Net Realisation Cash o Marina Construction: $25,000 / berth o Dredging: $6,000 / berth o Revetment / Breakwater: $20,000 / berth o Contingency: 10%
Table 17: Scenario 6 - Marina / Retail Development
Scenario Cumulative TDC Capitalised
Value NR GR
Finance
Costs Dev Profit
6 $33.8m $34.9m $3.97 $4.39 $3.79m $1.1m
Totals $33.8m $34.9m $3.97 $4.39 $3.79m $1.1m
Toondah Harbour: Market Assessment and Development Strategy, Page 61
9 Developer Market Sounding
Key Insights
The market recognises the strong appeal of the project reinforced by major attributes of the site as the gateway to the
Moreton Bay Islands.
The market supported the recommended mix of land uses and densities proposed for the site. The marina component was
of interest to some groups.
One of the key financial drivers for the successful development of Toondah Harbour will be achieving the right mix of
residential and integration with the commercial and retail uses on the site. The residential component is the major
contributor to development returns and hence will have a strong focus for most development groups.
While the residential component is the major focus, Jones Lang LaSalle consider the retail component to be the most
important aspect to get right in the overall project. This will be one of the major drivers of the destinational elements of
Toondah Harbour, and should create a strong sense of identity for the project. As such, the retail elements will play a major
role in repositioning the broader Cleveland area as reinvigorated and vibrant location to live, work and invest. Some of the
development community recognises the importance of this aspect, although it was not immediately understood by all
groups. This will have direct implications for the procurement strategy in ensuring groups address this component
sufficiently in their response to the EOI.
Cleveland’s demographic profile is heavily weighted to an ageing population so initial stages in the proposed redevelopment
will need to appeal to this demographic, before the demand base can be broadened. However, this will be a balancing act
as targeting an older demographic too intensely may limit the ability for the project to draw from a broader demographic.
This is a crucial factor as the project should have a role to play in acting as a major drawcard for a younger to middle
working age that is currently a significant gap in the area.
Council infrastructure charges are considered by some of the local developer market to be high, making it difficult to support
new development. However, this should be considered in the context of some developers holding sites that were acquired
at closer to the peak of the market, and the impact of some schemes that are not considered to be well-positioned to suit the
current market. Nevertheless, it is considered that the discount of infrastructure charges for the Cleveland CBD should be
extended to incentivise increased medium density development activity in the broader Cleveland area for the benefit of
stimulating wider interest in investment and development opportunities.
The marina component is of interest to some groups, with the focus noted as being a vehicle to drive interest in the project
and support residential sales rather than being a strong and highly profitable component in its own right. It was viewed by
most groups as an important component that will create a sense of activity and support the location being destinational.
Only a few groups were identified and consulted that are considered to have the capacity and experience to develop both
the marina and the on-land components.
The significant challenges for developing marina facilities at Toondah Harbour are well known by the market, due to the
shallow nature of the harbour. Most groups raised the issue of obligations for upfront and maintenance dredging to be
clearly understood including a cost effective disposal solution for dredge spoil. Design considerations of the dredging will
also need to take account of marina design / orientation particularly the breakwater/revetment walls that will need to be
orientated to mitigate prevailing weather conditions from the south east and ensure pragmatic solutions to the movement of
marine traffic.
To support a successful and timely development of Toondah Harbour, some groups identified the need for a combined
commitment from State and Local Government for the promotion of the area (Toondah Harbour, Straddie, and Cleveland) as
a major destination for South East Queensland. This will require investment in developing and implementing multi-layered
marketing strategies to attract attention to the region.
A partnering arrangement via a structured agreement (Development Lease/Development Management Agreement) was
viewed very favourably and seen by many groups as the best possible means of supporting early development on the site
and underpinning a financially viable and successful scheme.
Toondah Harbour: Market Assessment and Development Strategy, Page 62
9.1 Overview
Consultation was conducted with a range of mixed-use and marina developers that have successfully developed comparable
projects, including developers operating within the Cleveland region. The objectives of this phase were:
o To provide a summary of the market view on primary commercial and economic drivers for proposed development,
as well as recommendations and feedback regarding developer partnership model and commercial terms;
o To identify key considerations for Toondah Harbour as identified by a number of mid to top tier development firms
with a demonstrated track record in completing comparable projects. We had particular regard for developers
active within the Cleveland area and with mixed use and marina development experience;
o To provide a summary of market soundings with key successful food and beverage/pub operators who have
created projects with strong destinational appeal, particularly those with function/event centre capabilities. We
focused on;
Start-up phases length;
Target market and catchment area;
Marketing and branding;
Viability;
Key success factors;
Success and drivers of creating ‘destination’; and
Similarities and key lessons for Toondah Harbour.
o To ground-truth our market research into the proposed marina component of the development. In particular we
focused on;
Developability of the site as a marina
Demand trends and implications for total marina size
Staging, and configuration
Dredging
Rental and sale rates;
Occupancy trends;
Dry stacking capabilities and achievable rental rates; and
Understanding the future of mining on Stradbroke Island, and the likely implications for the subject site
(including ferry operations);
9.2 Residential Development
Demand Drivers
One of the key financial drivers for the successful development of Toondah Harbour will be achieving the right mix of
residential and integration with the commercial and retail uses on the site. This challenge includes balancing density, mix,
heights and built form that provides an attractive scale and outlook whilst incorporating adequate recreational open space
and car parking. The residential component is the major contributor to development returns and hence had a strong focus for
most development groups.
Most groups recognised Cleveland has an aged demographic profile and that residential product would cater to this market
to appeal to this demographic. The current market for new developments within the region is considered to be largely owner-
occupiers in this older demographic, from the local region. This affects the ability of a development to obtain the required
level of presales, due to this demographic’s generally more conservative nature and preference for purchasing a completed
product as opposed to ‘off the plan’. This is in contrast, for example, to developments in central Brisbane, where investors
are more conditioned to buying off the plan developments. Developers indicated that 65-75% of apartments as part of a new
development in Cleveland will sell to owner-occupiers. This will be a major positive attribute to creating a new precinct at
Toondah Harbour that has the potential to have a strong sense of local ownership. This will also inform the type of retail
space that is developed, requiring careful attention to detail in the tenancy mix and quality to ensure it appeals to owner
occupiers as well as contributing to the destinational elements required for it to be a broader success. The viability of

Toondah Harbour: Market Assessment and Development Strategy, Page 63
apartments in Cleveland was noted as challenging as investments as the rental returns are not as high as other markets
within Brisbane. This is considered to be due in part to the wages in the area which are in turn influenced by the white collar
employment opportunities.
The Raby Bay area was confirmed by many groups as containing a significant potential purchaser market for a new
development, with a number of these residents downsizing but looking to remain in the area. This is consistent with our
demographic analysis. The majority of recent inquiries on current proposed developments in Cleveland have been from
locals-; either empty nesters wishing to stay in the area or those wishing to travel with the security of being able to secure
their apartment whilst away. Our research in medium density markets in regional locations that are not driven by tourism
(e.g. Townsville, Mackay and Rockhampton) indicates this consistent trend of an older demographic (over 50) being the
dominant source of demand for quality medium density apartments for owner occupation.
Constraints
Council infrastructure charges are considered to be high by some developer and constrain the viability of new development.
Some developers cited infrastructure charges of up to $28,000 per unit for a residential development, which they believed to
be too high and likely to limit the interest of developers for Toondah Harbour, unless addressed by Council. However, this
should be considered in the context of some developers holding sites that were acquired at closer to the peak of the market,
and the impact of some schemes that are not considered to be well-positioned to suit the current market. Nevertheless, it is
considered that the discount of infrastructure charges for the Cleveland CBD should be extended to incentivise increased
medium density development activity in the broader Cleveland area for the benefit of stimulating wider interest in investment
and development opportunities and encouraging a walkable medium density community between Toondah Harbour, the
Cleveland CBD and immediate surrounds.
Other limitations noted were:
o the five storey height limit, which restricts the ability to capitalize on water views; and
o Car parking ratios imposed at 1.25 cars per unit. This was noted as more akin to a CBD development, and not
appropriate for a suburban location with heavy reliance on cars.
o Lack of major drivers for the Cleveland CBD to activate it and refresh it
Opportunities
The current status of Cleveland’s CBD was noted as a major constraint for attracting interest in Toondah Harbour and as
such was identified as a major opportunity to boost investment and renewal to enhance the overall offering of the area in
order to support stronger interest in Toondah Harbour. Suggested initiatives included:
o Alfresco dining opportunities
o Streamlined approval processes
o Improving depth of economic drivers
Council’s positive initiatives already made in this regard and pro-investment approach was noted by several developers.
Following an outline of the objectives and approach for the Cleveland CBD Investment Attraction Strategy all groups
consulted were highly supportive of this initiative.
Car parking ratios to increase to a minimum of 1.5 and not a maximum rate. This will enable the market to respond to
market needs and provide sufficient parking to meet demand.
Planning approvals were noted as needing to take account of lack of market demand for one bedroom apartments which
were noted as generally not selling well in Cleveland. We consider a significant demographic change is required and
additional densification before this is considered to be more viable.
Developers considered that compact townhouse and terrace stock would need to form a major part of Toondah Harbour as it
is less risky to develop than apartment developments and often delivers higher margins for this type of stock due to
considerably lower construction costs compared to apartments.
9.3 Market sounding regarding the redevelopment of Toondah Harbour has demonstrated a consistent view that
in order to be a successful development, it will need to be a high quality destinational project with supporting
Toondah Harbour: Market Assessment and Development Strategy, Page 64
recreational and retail amenity including boardwalks and facilities. There will need to be a strong destination
appeal to attract the public, and embracing the waterfront position was seen as one of the more important
factors.Marina Development
Demand
At a macro level, whilst marinas have the capacity to add significant value to coastal developments such as Toondah
Harbour, the current economic climate proved challenging for many existing marinas generally along Queensland’s coast,
despite many of them benefitting from being situated in prime locations. The investment market for marinas is still
recovering, albeit with positive signs of renewed interest following several years of limited investment and a number of
marinas having entered into receivership. The downturn in this market was particularly hard due in part to the discretionary
nature of this recreational activity and the level of price growth that was sustained above market fundamentals. As such, we
have seen price points for berths sold on long term leases reduce by around 40% on average as well as values for the entire
marina operating business and supporting real estate and infrastructure declining by a similar amount in many cases.
Interestingly, short term lease rates have seen less volatility, with most boats still requiring a berth or dry storage, regardless
of ownership changes and boat registration consistently increasing, albeit at a slower rate, despite the economic slowdown.
Developers consulted on the marina component and with experience in this market segment acknowledged and supported
the findings of the demand assessment and viewed the outlook for the marina industry more positively after several years of
lack-lustre activity. The development opportunity was viewed as positive attribute for Toondah Harbour although noted the
challenges that will be faced with regard to approvals, dredging and funding. Most experienced marina developers noted
that the marina component would be a vehicle to drive interest in the project and support residential sales rather than being a
strong and highly profitable component in its own right. Only a few groups were identified and consulted that are considered
to have the capacity and experience to develop both the marina and the on-land components.
Constraints and Challenges
Developers considered that there are significant challenges for developing marina facilities at Toondah Harbour, due to the
shallow nature of the harbour which would require both substantial upfront dredging and an unknown level of maintenance
dredging. Positioning and creation of seawall protection from prevailing weather conditions was also noted as critical to
resolve with intelligent engineering solutions that achieve optimum functionality of the marina including the recreational and
commercial marine traffic. Dredging spoil material and conditions were identified as a potential constraint that needs to be
clearly understood in order to assess the viability of this component. Further work will need to be done to understand (capital
and maintenance) dredging and disposal costs and should be provided to proponents as part of any bidding process.
While the depth of demand for dry berth storage is considered untested in the Redlands Region, dry stacking was
considered to be a potentially commercially viable option if developed with the appropriate infrastructure, given that there are
limited stacking facilities of any real scale between Brisbane and the northern end of the Gold Coast. The East Coast Marina
dry stacking facilities (currently being expanded by 120 berths) will provide a good measure of the success of this storage
option with strong demand being experienced.
The marina developers and their specialised experience is of significance in the delivery of this component as it is clear this
will be the most challenging component to ‘stack up’ as well as ensure it functions well in its own right, integrates with the on-
land components and is financially sustainable. The challenge is that the marina developers will seek (and will likely need) to
develop (some or a large portion of) the on-land components to generate sufficient returns and achieve the level of
integration required. These drivers will require careful consideration in formulating the approach for the EOI.
9.4 Hotel/Bar/Restaurant Space with Function Capacity
Demand
Our assessment of the current local market and across the broader greater Brisbane region highlights a major gap in quality
waterfront pub/hotel and function spaces. Southern markets in Sydney and Melbourne have by comparison an abundance
of options and many of which are highly successful and have a tremendous ability to draw from a large catchment area. In
many ways this component of the project has a similar opportunity to help ‘brand’ Cleveland in much the same way as
Sirromet has done and similarly attracts visitors from a wide area.
Toondah Harbour: Market Assessment and Development Strategy, Page 65
Consultation with experienced operators highlights the key success factors that underpin strong demand in such facilities as
being:
o the prime oceanfront location,
o ‘people watching’ activities and/or natural beauty as key drawcards,
o Quality built form appropriate to the setting,
o Flexibility to provide corporate, social and wedding functions,
o Supplemented with restaurant/pub capabilities, lawned and outdoor areas for functions,
o Potentially the ability to accommodate guests on site or nearby, and
o A consistent quality operation that is appropriately matched to the local and visiting demographics
Constraints & Challenges
Discussions with a number of local and interstate operators indicated strong interest in the opportunity and some developers
were open to taking on this component as part of the overall development. However, other developers saw this component
as higher risk with no history of demand to draw on and a fine balance in timing for delivery to market and not too early in the
overall project. The untested nature of this type of product within the Cleveland market was highlighted by developers and
hospitality retail operators as a key concern, due to:
o Untested market depth for this product-: The lack of established bar and restaurant development around the
project and few retail projects of a comparable nature within the broader region means that the operator will be
pioneering the product in a new market with no proven demand. This represents a significant risk which will likely
need to be offset and addressed by the private sector or Council in order to attract a quality operator. This may
include sourcing an experienced third party developer that specialises in investing in such facilities that can
procure a quality operator for the facility;
o Unknown likely turnover level: due to a lack of comparable projects within the region. This presents challenges
in developing feasibility modelling, and will deter some operators who have the option of developing in a known
and understood region where turnover levels can be more readily forecast;
o Increased financial risk stemming from the above two points. The project will need to be significantly de-risked by
to attract a high quality operator. This may include upfront funding to establish the building (by developer or
Council depending on the desires of Council to manage risk, inject capital and own the facility), and ensuring that
design and pricing are commercially flexible and viable. The likely rent structure will be a turnover rent to
incentivise the right operator to invest in establishing a quality business in the location.
The Procurement Process
The procurement process will be fundamental to attracting an operator that can deliver a successful bar and restaurant and
will be anchor for the offering in their own right. The key components of this process will be;
o Targeted marketing process that actively seeks to engage experienced and successful operators;
o Develop a procurement process that is commercially attractive and facilitates entry into an untested market by a
high quality operator. This will likely involve upfront capital input by Council into developing the building or fit out
and will need to be an attractive and flexible arrangement to compete with more established and ‘known’ markets;
o Proactively de-risk the process for proponents; and
Selection of an experienced and successful party, whose vision for the precinct aligns with the broader development goals and intentions for the site as a key destinational anchor. A high quality bar / restaurant with function capacity would certainly support other uses at Toondah Harbour by drawing patrons to the precinct. However, such a facility is not expected to be the first activity to commit to Toondah Harbour. We expect that Toondah Harbour will need to first attract significant development, such as residential apartments, a marina and retail tenancies before a quality operator of bar / restaurant with function capacity will be able to be established.
Toondah Harbour: Market Assessment and Development Strategy, Page 66
9.5 Marketability of Development at Toondah Harbour
Strengths The greatest strength for the site was considered to be its position at the gateway to the Moreton Bay Islands. This may see the site evolve to play a greater role in being a ‘launchpad’ for a broader range of activities that connect to the surrounding bay in much the same way as marinas and working waterfronts do such as Freemantle, Hervey Bay, Mooloolaba, Cairns, Manly, and Glenelg. Many waterfonts all share a greater level of recreational, residential, retail and commercial diversity that mirror the attractions of the surrounding marine environment.
The residential components were considered to be the most attractive aspect to the project. The retail component will however require careful consideration to procuring the right development partner as this will be the element that provides the strongest contribution to shaping identity for the project and contributing to ‘branding’ Cleveland. This aspect will also require careful consideration to how the retail interfaces with the waterfront and other components of the project.
Constraints A number of constraints will be required to be resolved in order to provide certainty to the market. These range from a detailed dredging plan including spoil disposal plan, solutions for marine traffic management and cost effective delivery and positioning of revetment walls. The marina component will be the most complicated to deliver and even so may not deliver high enough returns such that offsetting on-land development is required by the developer to secure sufficient interest in the marina.
Facilitating Development The importance of streamlined development conditions for private developers was highlighted, with an emphasis on reduced red tape. Flexibility through a structure such as development management agreement / development lease will provide Council with the ability to support viable and early development.
Marketing as a Critical Driver of Success Developers agreed that there was massive potential within the Redlands region, and believed that the key to unlocking it lay in developing a prominent marketing strategy which targets and attracts businesses. Investment in marketing and development by Council was believed to be attractive to rate payers when demonstrated a connection with employment securing in the region and a positive contribution to population growth and activity (which will be viewed as supporting positive economic returns for the area). Our discussions highlighted that there is generally positive connotations attached to Cleveland, and that marketing was needed only to encourage investment and highlight opportunities, rather than to overcome negative perceptions about the region. The biggest perception issue that was highlighted to overcome is the perception of an older demographic and limited vibrancy.
The business conference market was deemed likely to only be successful if the operators are able to firmly establish the offering within the market as a well-known and reputable offering which will capture demand from the wider greater Brisbane metropolitan area, rather than just relying on localised social functions and events. Some developers noted the need to ultimately ensure that short term accommodation was available to support this offering. Discussions with operators highlighted that demand for accommodation would need to firmly established during the initial few years of trading prior to establish a firm business case for the type, quantity and quality of accommodation required.
Toondah Harbour: Market Assessment and Development Strategy, Page 67
10 Financier Market Sounding
Key Insights
Banks will typically lend around 80% of total development costs at present, but this will vary slightly depending on the quality
of the project and the project sponsor.
Most banks are generally looking for between 75% and 100% debt coverage from pre-sales, depending on the sponsor and
their equity in the project.
Lenders are generally supportive of financing infill development.
General lending risk aversion is still high, but some smaller banks are competing on both terms and speed of lending to gain
market share.
Project size is a strong consideration for the major banks at present, with a need to have staging and size limited to ensure
the project can achieve pre-sales and be developed inside ‘one cycle’.
Banks are supportive of innovative product and construction techniques and see a benefit of shorter and cheaper
construction lowering project risks.
Partnering arrangements with State Government and the private sector have been viewed favourably although contract
documentation was noted as a key issue to watch to minimise complexities that will impact the ability to assess funding
security.
A marina as part of a mixed used development received mixed reviews. This was due to many banks having lost money on
many such development projects in recent years. It will be carefully evaluated and was noted as needing to be financially
and operationally feasible as a standalone component of the project, stageable, and represent a low proportion of total gross
costs (suggested 20% max of total project costs).
Jones Lang LaSalle has consulted with a number of relevant industry contacts, split relatively evenly across the risk and
client relationship side of the property lending teams.
Our discussion focused on addressing the following points;
o Funding of land with / without Development Approval – willingness and applicable LVRs.
General views on infill projects
Funding of land size / vs project size
Preferences for site types / locations
o Levels of pre-sales requirements to secure development funding (% of total no of apartments, % of gross
realisation)
o Max LVR on projects – differences by total size, by location, by product types (e.g. 1’s, 2’s, 3’s, low, mid, high
quality, mixed use projects etc)
o The extent to which developing an ‘untested’ product is an inhibiting factor to securing finance (with reference to
supporting residential product examples)
o The impact of planning scheme certainty provided through the PDA
o Funding of sites in PDA vs local council areas
o Views on retail lending and the relationship with lending to the developer
Likeliness of institution to take risk with developer if they have exposure to individual owners through
presales
Caps on funding (to a certain percentage of the total apartment stock in a building)

Toondah Harbour: Market Assessment and Development Strategy, Page 68
10.1 General Views on lending to infill projects
Key points:
o Lenders were generally supportive of financing infill development;
o Shorter timeframes relative to staged greenfield development means financiers can be in and out of projects in
around 2 years, lowering market risks associated with timing due to greater certainty of being able to commence
and complete a project in the same part of a cycle;
o The loan ‘sponsor’ and their track record is by far the largest part of financiers’ decisions to back projects at
present;
o General lending risk aversion is still high, but some smaller banks are competing on both terms and speed of
lending to gain market share.
o Geographic focus for such development generally varied by size of lender, with some of the smaller banks just
re-entering the market and concentrating on more defined areas.
Overwhelmingly, the view expressed by financiers towards infill development was positive, with several recognising that it
has an important part to play in accommodating growth in the Southeast Queensland region and that it makes sense from a
planning perspective to maximise existing infrastructure. There was also acknowledgement that market acceptance of such
product has increased significantly over recent years, making it a vital part of Banks’ overall lending books.
Some banks noted that utilising existing infrastructure helps minimise both development costs and timeframes, which is
considered to lower the project risk profile. Being potentially shorter term projects relative to greenfield land development
means banks can generally be in and out within two years and minimise the chance of a project being impacted by adverse
market conditions. This was noted by financiers as being an important consideration for staging of development of Toondah
Harbour such that if market conditions deteriorate and completion of later stages is delayed that the project is able to be
financially and operationally viable at each stage.
While views on infill development were positive, strong indications were given that it still remains a funding environment
characterised by risk aversion, albeit less so than at the height of the global financial crisis (GFC). Banks of all sizes
indicated they are confident in supporting good projects, but extremely close scrutiny of the loan sponsor and their ability to
service loan interest is being undertaken. Some banks went as far as to say that the reputation and track record of the
sponsor is as much as three quarters of the funding decision at present. One bank also stressed the importance of an
acceptable builder with a stronger track record and a preference for bank guarantees from the builder.
Despite the loan sponsor remaining a very important part of the lending decision, several banks did indicate a willingness to
work with sponsors that do not have a long track record or capacity if the project has strong fundamentals. In some cases,
this may be subtle support by encouraging the sponsor to bring in reputable partners to give the bank assurance that the
project will be appropriately managed. One bank suggested it had been more proactive introducing preferred partners into
projects, including introducing a particular builder to take an equity stake in a project as well as recommending quantity
surveyors and project superintendents to oversee delivery of projects.
The major banks appear to still be the major source of funding for larger scale infill projects and will be the likely source of
funding for Toondah Harbour given the scale of the project. There clearly appeared to be a strong positive correlation
between geographic scope of potential project lending and bank size. A number of the smaller second tier banks are still in a
process of re-establishing themselves in the market and as such are taking a relatively narrow geographic scope and
concentrating generally on inner-city Brisbane. Some of these lenders are also relatively constrained in size of project they
can fund and are generally only funding project up to a range of $25 million to $40 million total debt requirement. In some
cases these banks re-entering the market and looking for market share indicated that they are trying to be competitive on
loan terms and be faster moving in approval process than the majors.

Toondah Harbour: Market Assessment and Development Strategy, Page 69
10.2 Typical Loan Conditions
Key points:
o Banks will typically lend around 80% of total development costs at present, but this will vary slightly depending on
the quality of the project and the project sponsor;
o Most banks are generally looking for between 75% and 100% debt coverage from pre-sales, depending on the
sponsor and their equity in the project;
o Acceptance thresholds for the proportion of offshore buyers in a scheme varied significantly and some banks
would accept only up to 10% of total purchases, while other institutions recognise that for particular projects
offshore investment demand is strong and are taking a more flexible project-by-project approach.
Funding Levels:
The banks surveyed all focused on a ratio of loan size to total development cost (excluding GST) rather than on an LVR
based on gross realisation. Responses showed that most banks are generally lending around 80% of total development
costs, but some were working off a slightly lower standard ratio. Most indicated there is some flexibility in this and they would
require some borrowers to accept a lower ratio if a project or sponsor was perceived to have slightly higher risk profile, or
conversely prepared to go higher if it was an exceptionally strong project and the borrower had an exceptionally strong
delivery track record.
Pre-sales:
There is some variance in the level of pre-sales that banks will accept. In most cases, it appears that banks will be looking for
between 75% and 100% of debt to be covered by pre-sales. Some banks indicated that a more conservative limit of 100% is
a minimum and higher levels may be required, in the order of 110%. One bank noted that at 100% debt coverage, it typically
translates to sales of around 50% to 60% of total stock sold in a development.
Several other banks indicated greater flexibility with requirements ranging between 75% and 100%, dependant on the
specifics of the project and the borrower. One bank noted that pre-sales requirements can vary depending on the amount
loaned. For example, if a sponsor only borrows 70% of total development costs, they may apply a pre-sale requirement of
only 80% of debt rather than 100% if the loan were for 80% of development costs.
A number of respondents indicated that the details of pre-sales are being closely scrutinised at present. Aside from overseas
buyers (discussed below), banks have restrictions on multiple buyers, exclude related-party sales, and may limit pre-sales on
deposit bonds. One bank said that they exclude all multiple sales, while two others suggested they exclude all multiple
purchases from three onwards for individual buyers. ‘Active management’ of pre-sales by developers, including regular
project updates and other communication, is one factor cited as giving banks a lot more comfort around pre-sales levels and
settlement risk.
Several banks mentioned limits of 10% of pre-sales secured by deposit bonds. However, one respondent did indicate that
deposit bonds may not necessarily be any greater risk than bank guarantees due to the buyer being more closely scrutinised
to get the deposit bond than a buyer putting forward a bank guarantee. Conversely the bank guarantee only provides
certainty of deposit funds at time of securing the guarantee and does not provide certainty of funds at settlement.
10.3 Project Characteristics
Key points:
o Project size is not a strong consideration for the major banks at present although some prefer smaller projects at
present to spread risk. Some second tier banks re-entering the market are only lending up to specified caps to limit
individual exposures;
o While banks recognise growing demand for small sized dwellings, project lending gives consideration to retail
lending restrictions to dwellings less than 50 sqm and so are cautious about funding project with such stock;
o Banks are supportive of innovative product and construction techniques and see a benefit of shorter and cheaper
construction lowering project risks.
Toondah Harbour: Market Assessment and Development Strategy, Page 70
o Ultimately market acceptance will drive widespread funding of projects with new construction techniques, but there
are some issues with offsite pre-fabrication in that borrowers generally cannot draw down funds until materials are
fixed to the site.
Project size
Several respondents noted that in a post-GFC environment there is generally more caution towards large projects at present
from both a market and banking perspective, as even in a good market they take longer to reach pre-sale hurdles and
consequently have a higher chance of striking adverse market conditions. One major bank surveyed indicated that they too
would look at projects of any size, so long as they were stageable, but noted that smaller projects are generally more
fundable at present because the bank would rather spread its risks among many ‘small bets’ rather than concentrating it on a
few ‘big bets’. Two majors also noted loans over $10 million and $15 million respectively are subjected to both credit and
capital approval which entails a more rigorous approval process.
The smaller banks are generally more constrained in their capacity to fund larger projects. Several are at various stages of
re-entering the market after working through legacy issues from their loan book post GFC and consequently are starting off
relatively small in rebuilding their lending business. One such bank is limiting its individual debt exposure to $25 million, while
another is looking at projects up to 100 units but ideally would prefer 40 to 80 unit schemes with a $30 million to $40 million
debt exposure. The other second-tier bank surveyed indicated the capacity to lend up to $100 million, but suggested not
many projects of that size are emerging at present and larger projects they are currently funding are around $20 million to
$30 million and there are a numerous projects around $10 million.
Individual dwelling size
The overwhelming majority of lenders indicated that they have no objection in principal to funding projects with a component
of compact (sub-50 sqm) apartments, but pragmatically retail lending restrictions are factored into the equation. With very
limited availability of retail lending for compact apartments end buyers are not readily able to secure finance for such
purchases and, where finance is available, it is typically at low LVRs and mortgage insurance is not available. In the
absence of these restrictions, most project lending decisions would come back to market acceptance and demand for such
product.
Several banks noted a recent softening of policy to restrict lending on dwellings above 40sqm and now treat loans on
dwellings of between 40sqm and 50sqm on a case by case basis.
Several respondents noted that there apparently is a greater market acceptance for small unit projects and that developers
are keen to capitalise on this demand and deliver product at a lower price point that is currently more palatable to buyers.
This appears to be the general trend not just in the apartment market, but also for smaller detached and semi-detached
product in the suburbs. A number of developers have been quite successful of late with small lot development. This comes
back to key issues of market acceptance and sales that are driving banks’ willingness to fund small-lot development rather
than any other factor and some re-sale evidence will ultimately sure-up the case for smaller apartment and small-lot product.
Several banks also noted that in funding apartment projects with smaller sized stock, they will closely examine the likely
target market and the overall product mix. If the product mix is skewed towards smaller stock, they may still consider funding
it if they are confident the demand (for example student demand or investor demand) supports the mix. Several contacts
mentioned very successful projects with smaller stock in Sydney and Melbourne that have hit the right target market.
Innovative product and construction methods
It was noted by most survey participants that to date there have been very few real examples in Brisbane and the main
examples in Queensland to date have surrounded temporary housing requirements for resource workers and not long term
residential housing. One exception to this that several banks (including one involved in funding) noted was an apartment
project in Kelvin Grove that involved pre-fabricated bathrooms. This process sped up dramatically the timing of moving on to
the form work for subsequent levels and was responsible for achieving a reduction of around three months off the
Toondah Harbour: Market Assessment and Development Strategy, Page 71
construction schedule. Another bank mentioned funding a very successful NRAS development on the Gold Coast with
pre-cast panel construction for the walls.
Several respondents also noted that innovative construction methods have been more prevalent in the Sydney and
Melbourne markets and that their organisations had funded quite successful developments in these markets. In the right
location, it was noted that these construction techniques can help keep end prices at an affordable price point that is
appealing to end buyers. Within Southeast Queensland, a number of banks also noted that they have been involved in
innovative small-lot projects in outer suburban locations undertaken by both small and larger developers, and that this
product has also been quite popular with buyers in the current conservative market environment. Some banks noted though
that they are limiting their exposure to this newer compact format medium density housing in outer suburban locations as it is
a relatively new product to the market and as such does yet not have the depth of demand as traditional housing stock.
The consensus to emerge from nearly all respondents is that they are supportive of innovative product in principal, even
though they had seen limited examples to date. Some suggested it aligned with their corporate ethos to support innovation,
while others focused on the fact that shorter and cheaper construction profiles lowers delivery risks to a degree.
Overwhelmingly though, the main response is that financing will ultimately be guided by market acceptance and if buyers
support such products, then funding will not be much of an issue. One major bank said that until market acceptance is more
widely proven, they would probably limit the size of their exposure to such projects to around 20-40 apartments at once and
might require slightly higher debt coverage through pre-sales.
Several banks said that they would ensure that retail lending and valuation policies would not be an issue for the particular
project proposal to avoid any undue settlement risk. Some banks also mentioned the possibility of settlement risk based on
quality of finished project, while others said they were comfortable with the building regulatory frameworks to ensure quality
standards are maintained and considered that as long as the delivery process and any product variations from conventional
product are transparent to buyers from the outset then it should not be a problem.
One potential hurdle to such development around the way standard loan contracts are struck was raised by several
respondents. That is, banks generally do not allow funds to be drawn down from the loan facility until items are ‘fixed’ to the
structure. Consequently, funds for components pre-fabricated off-site typically cannot be drawn down until they are on-site
and fixed to the structure. These restrictions are in place to avoid funding materials that are not used in the construction of
the building. This may particularly be a problem where materials are pre-fabricated overseas, but regardless it potentially
represents a cashflow and equity challenge for the developer. Some developers have tried to push this risk back onto
builders/suppliers, but have understandably received considerable resistance. While it had not done so to date, one bank
noted that from a bank-wide perspective, they would probably welcome taking on the lending exposure to the manufacturer
(unless they were offshore) as well as the developer, which could circumvent this problem.
10.4 Lending on Land & Planning Issues
Key points:
o Appetite for lending for land purchase is very low at present;
o Generally, a development approval (DA) or an immanent DA would be required and most banks would only lend up
to a maximum of 50%;
o While banks recognise the lower planning risk and faster timeframes associated with land being code accessible or
in a PDA area, they are generally insisting on DA being in place prior to funding so it is not often applicable to
banks in the current environment;
o Some banks highlighted that the PDA’s involvement and the easier approval process with the predecessor to
PDAs (UDAs) has been like a beacon to developers in some areas such as Bowen Hills and Hamilton and means
they are now watching the supply risk very closely in these areas;
o The PDA for Toondah Harbour was viewed as a positive in supporting a fast tracked development, although
planning risk would largely be resolved prior to banks requiring to commit substantial funds to the project
Toondah Harbour: Market Assessment and Development Strategy, Page 72
Lending for Land
Without exception, all lenders indicated that their appetite for funding residential land purchases at present is very low and
also extremely contingent on the quality of the loan sponsor.
Most banks indicated that they would only lend up to 50% of the site value if the site had a DA in place (or in some cases an
immanent DA on lower planning risk sites). Some banks indicated that they would potentially lend more if it were an
exceptional sponsor with strong servicing capacity and/or if there is other income sources that the sponsor can use to
demonstrate serviceability. One major bank indicated that it would only lend up to 25% and that they would prefer not to at all
on land only, while a second-tier bank said they would only lend up to 35%.
Planning regimes and Priority Development Areas (PDA)
Generally most banks were unwilling to get involved in funding land with a DA in place, so consequently planning regime
issues were largely irrelevant to them.
Nevertheless, several did acknowledge that code assessable or being within the PDA area was a significant advantage due
to reduced planning risk and development approval timeframes. One bank went as far as to suggest that they would be
much more willing to fund a site without DA in a PDA area, even though the overall appetite for land deals is low.
Several respondents noted that the predecessor to PDA areas (UDAs) in some part became a victim of their own success.
That is, the ease of planning approval has become like a beacon to investors and in some cases, like Bowen Hills and
Hamilton, has resulted in quite a large supply pipeline. While there were different views on the extent of this oversupply,
several banks noted that the supply side in these areas and the level of their existing exposure have prompted some
additional caution towards further lending in these areas.
10.5 Locational Preferences
Key points:
o There is generally a high level of comfort with infill lending with banks paying close attention to the supply pipeline
to monitor lending risk;
o There appears a strong correlation between size of the lender and their geographic focus and a number of second
tier lenders re-entering the market are keeping their focus largely on Brisbane; and
o Supply and demand will need to be evaluated and monitored closely.
Most respondents were relatively confident in the greater Brisbane market and appear comfortable to assess projects on
their merits (quality of the sponsor and the project) regardless of location. Several banks mentioned rather than being
concerned with market risks in any particular precinct or suburb, they are somewhat guided by their existing loan book and
the desire for it not to be too concentrated on one particular area. As such, all lenders indicated will actively monitor lending
exposure relative to supply and demand fundamentals in an area. For this reason, the major banks will have a strong focus
on how the product fits within the market in terms of demand trends and price points. In contrast, several of the second-tier
banks are focusing on solely on inner-city locations, with the general principal that the closer to the CBD, transport routes or
universities the better. Toondah Harbour was noted as an attractive project to consider funding from a locational and lifestyle
focus, although all financiers noted that relatively low levels of demand would need to be evaluated closely to ensure supply
and staging was appropriately balanced.
Toondah Harbour: Market Assessment and Development Strategy, Page 73
10.6 Marina Development Lending
Generally lenders were not supportive of marina developments, due to recent experiences in write downs on debt facilities
attached to marinas. A marina as part of a mixed used development was viewed more favourably, providing that the marina
was independently able to be developed (operationally and financially) and that other components of the development were
de-risked through high levels of pre-commitments and presales.
Any marina component of a proposed development at Toondah Harbour will likely need a higher equity contribution as debt
funding levels will not likely be as high due to risk and that current valuation approaches for marina assets means lower
values for these assets. The change in valuation approach to exclude berth sales is a major variation compared to pre-GFC
and in many cases has seen values of these assets written down by anywhere from 25% to 70%. Accordingly, any debt
secured against the project is based on a much lower value. This was a view shared by a number of financial institutions. It
was suggested that the marina component should not represent more than around 20% of total costs of the overall Toondah
Harbour mixed use project.
Financiers are willing to provide development finance for more clean cut, and simple deals with more complicated projects
attracting a higher degree of vigilance from risk assessment teams because of perceived documentation risk in addition to
the more traditional construction, contract and sponsor risk.
10.7 -Proposed Development Agreement Structure For Toondah Harbour
OverviewIn order to support the successful project, Council have indicated that they are willing to adopt a flexible and highly
commercial approach to partnering with the private sector to deliver the development of Toondah Harbour. This will enable
RCC to partner with the successful developer in helping achieve planning and regulatory approvals whilst having the benefit
of being actively involved in key elements such as the development and branding of the concept and retaining a level of
control throughout the delivery phase.
This arrangement will enable transfer of land to the developer at market value and importantly may also enable the RCC to
benefit from any uplift in land value as a result of the proposed development. This will be a significant assistance to the
developer in minimising its outlays, providing for earlier commencement of the project and helps to facilitate obtaining
development funding.
Market Feedback
Feedback was sought from developers with experience in mixed used and marina projects regarding the proposed
Development Agreement approach as to whether it was a) workable and b) the most effective means of optimising the
outcome at Toondah Harbour for both RCC and the Developer.
The market response was very positive as a means to help facilitate getting a development partner on board for such a
challenging project, with some suggestions about specific approach to facilitating key outcomes for the project such as
specific land uses and outcomes that may be desired by RCC.
A key point made was that the project has a number of complexities that are unlike a fairly straight forward residential infill
site that is already serviced and where the market is quantifiable with evidence available to support pricing and other metrics.
For Toondah Harbour, the developer will require assistance through the process of ‘proving up the site’ and facilitation of
planning and environmental approvals. The optimal outcome is therefore unlikely to be realised if too many restrictions are
placed on the developer, and the facilitation of development by Council will be critical.
Being able to take security over the land with reinforced step in rights in the event of builder /developer default is was noted
as an important consideration in the bank’s credit risk assessment. For example, the development partnering arrangement
at Coopers Plains triggers drawn down of debt and settlement of land at commencement of construction. This compares to
the partnering agreement at Northshore Hamilton where land settlement only occurs at project completion. The difference
between these two options from a banks perspective will be largely influenced by level of ‘contract risk’ perceived in the
partnering agreement. As such, this highlights a critical aspect to ensure that documentation is simplified as much as
possible to mitigate any unnecessary funding risks.
Developer Partnering Arrangements
Toondah Harbour: Market Assessment and Development Strategy, Page 74
Within Queensland the State government has undertaken a number of participatory developments with development
partners to achieve successful developments across the state. Schemes that have been facilitated by such participatory
models include;
o The RNA’s joint venture with Lend Lease;
o JV arrangement with Leighton Properties and Ipswich City Council via Ipswich City Properties;
o The Development Management Agreement with Graystone and the Queensland State Government for Brisbane
Technology Park;
o The Development Agreement between the Queensland State Government and the Northshore Hamilton Business
Park; and
o Development Partner Model for the Gold Coast Commonwealth Games Athletes Village.
Our experience with such agreements including facilitating major interstate projects like Melbourne Docklands provides a
broad range of variations in these structures and an understanding of the key success factors to tailor the optimal agreement
for Toondah Harbour. Each have a consistent theme though: they typically incentivise the developer to deliver built product,
pay the vendor some income throughout the development and provide a share of the profits / value up-lift that is created as
the project is delivered.
One such development agreement has been used by the State in its partnership with Consolidated Properties to deliver a
large suburban renewal project at Coopers Plains in Brisbane. The project is a master planned community which will
ultimately comprising of up to a thousand architect-designed apartments and townhouses, three parks and a community
centre.
Under the terms of the Development Agreement, Consolidated Properties purchases stages of the development site as the
development progresses. Land is purchased at market value, as determined by an independent valuer, once Consolidated
Properties satisfies a number of conditions, including adequate levels of pre sales. There is a profit share arrangement
between the developer and the State at completion of the project.
The structure of this type of development agreement produces a number of benefits for both the land owner and the
developer. The key benefits are outlined below;
For the Developer:
o Reduced up front capital expenditure needed to acquire land;
o Preconditions required to unlock purchase of next stage of land are similar to bank conditions for finance, resulting
in easier and more streamlined financing;
o Funding for land and development can be done in unison, rather than in two stages as per the traditional
development process;
o The project is significantly de risked via the pre-sale contract process, this has benefits for accessing finance as
well as reducing the developer’s risk exposure. This can mean that a developer is able to undertake higher value
or multiple projects.
For the land owner:
o Retention of greater degree of influence over the design and timing of the development, including proportion of
owner-occupiers or foreign investment;
o Ability to tie the acquisition of the land to milestones and conditions, incentivising the developer to achieve pre-set
outcomes;
o Provides the mechanism for land to be purchased at market value,
o Achieves community and development outcomes at no net cost to the land owner;
o Receives a financial benefit from the profit share;
o Control over selection of development partner, enabling selection based on track record, capacity and alignment
with vision of project and key stakeholders, ultimately supporting a greater chance of delivering a successful
outcome;
Toondah Harbour: Market Assessment and Development Strategy, Page 75
o Attracts stronger competition for the opportunity as a greater number/wider range of developers have the capacity
to deliver the project due to the lower upfront capital needed.
10.8 Key Requirements to Select Optimal Procurement Framework
o In forming a view on the appropriate framework there will need to be further assessment of the options relative to
Council’s objectives. This will require Council to outline their preferences on issues such as:
o Council’s vision and objectives for the project
o Risk acceptance levels. In particular Council’s preferred ranking of the various project objectives including the
relative importance of maximising development revenue;
o The level of intervention / role that Council would like to play in working with the private sector to realise an
outcome. This will help identify which risks are preferred to be transferred to the private (or must be transferred to
the private sector). This will then inform the type of procurement model and how to engage with and attract interest
from the private sector;
In addition, key factors to address in establishing the structure of the agreement will be the confirmation of
o The principles for the State’s transfer of land and returns required;
o Land tenures especially in relation to conversion of the reserve land to freehold; and
o Dredging obligations and cost sharing arrangements
Ben Koop
Director
Strategic Consulting
Level 33, 345 Queen Street
Central Plaza One
Brisbane
COPYRIGHT © JONES LANG LASALLE IP, INC. 2013.
This publication is the sole property of Jones Lang LaSalle IP, Inc. and must not be copied, reproduced or transmitted in any form or by any means, either in whole or in
part, without the prior written consent of Jones Lang LaSalle IP, Inc.
The information contained in this publication has been obtained from sources generally regarded to be reliable. However, no representation is made, or warranty given, in
respect of the accuracy of this information. We would like to be informed of any inaccuracies so that we may correct them.
Jones Lang LaSalle does not accept any liability in negligence or otherwise for any loss or damage suffered by any party resulting from reliance on this publication.