tools for the financial enterprise
TRANSCRIPT

Appendix 2.2 � Survey of tools in the Finance Domain 254
I n t e rn e tP C
P a lmT o p s
P h o n e M o b i l eP h o n e
K i o s k A T M P O S /E F T
C a ll C en t e r C h a n n e l In t e g r a to r S e c u r i t y M a n a g e r
P e r s o n a l i z e r
B r a n ch T e l l e r e - T e l le r e -R e m it t a n c e
e - Q u o te s
L o a nO r g a n iz e r
e - L e n d in g e F X / M M e - B i l l P a y
T r e a s u r yD e a l in g
e - L e t t e r o fC r e d it
e -S e c u r i t i e s
F in a n c ia lM a n a g e r
F r o n t o f f ic e C u s t o m er e S e r v i c e s V a l u e a d d e d e S e r v i c e s e S e r v i c e s
M u l t iC h a n n e l
e - S e r v i c e sP o r t a l
C u s to m e r p r o fi l e C u s to m e r e v e n ts
C u s to m e r K n o w l e d g e
A c c o u n t s C u s to m e r S ta t i c L im i t
e - C R M
D e p o s i t L e n d in g T r a d e T r e a s u r y I n v e s t m e n t sS a v i n g s /C h e q u e
C u s to m e rL o a n
L e t t e r o fc r e d i t s ,
B i l l s
F o r e x /M o n e yM a r k e t
S h a r e s &B o n d s
F ix e dD e p o s i t
C o r p o r a teL o a n
R e m it t a n c e D e r iv a ti v e s S e c u r i t yC u s to d y
E n t e r p r i s eR e s o u r c eP la n n in g
L iq u i d it yM g t
A c c o u n t in g e D o c u m e n tM g t
R is k M g t E n t e r p r i s eW a r eh o u s e
E n t e r p r i s eF o u n d a t io n
F ig u r e 2 .9 e -B a n k in g o p e r a t i o n s
TOOLS FOR THE FINANCIAL ENTERPRISE :: The integrated banking suite Banks are increasingly
offering online trading
and banking services.
Customers can login to
the trading and banking
services home page
subject to security
constraints and execute
orders, view their
accounts, monitor their
portfolio, fill
applications, and post
inquiries. Electronic data
interchange standards
such as SWIFT, FIX, and
OFX support online
banking and trading.
The general features of computer tools for automating banking operations are well
exemplified by a suite of tools offering electronic banking services such as depicted in Figure
2.9. The Enterprise Resource Planning (ERP), multi channel integration, customer
relationship management (CRM), electronic document management (EDM), and enterprise
foundation tools for data warehousing that constitute such a suite are overviewed below.
� Enterprise Resource Planning tools: Enterprise Resource Planning is an umbrella term for
all tools and technologies used to handle the internal operations of a banking firm (deposit,
lending, trade, treasury, investment) and to automate its processes. The term back office refers
to the IT centre where all Enterprise Resource Planning applications are handled. ERP
software used to run on mainframe, however, the advent of the year 2000 problem, and the
introduction of the euro currency is forcing all business and financial institutions to upgrade
the tools and technologies used in their back-offices and to re-engineer their internal
processes. The shift towards a client server architecture is accelerating, and the role of
Enterprise Resource Planning software tools is not limited any more to handling the internal
operation in a centralized location in the firm but is extended to manage the operations over

Appendix 2.2 � Survey of tools in the Finance Domain 255 the firms multinational network and to integrate with its online and front-end applications.
Major service providers of ERP tools include SAP1.
:: Customer Relationship Management The deregulation and the reduction of barriers to entry in the financial industry has resulted in
the establishment of new institutions offering retail banking services at competitive prices and
quality. Realising the need for new means to remain competitive in a global market place, top
manager in banks and financial institutions started to shift their focus of interest from cutting
operational cost to improving customer services and customer relationship management.
Customer relationship management is referred to as the ability to capture a customer and to
satisfy all their needs and requirements with minimum cost and high efficiency. This relies on
many tools and technologies which can capture all the relevant information about a customer
and their need via multiple channels (e.g. telephone, fax, internet), store this information in
databases, and analyse it using data-mining and business intelligence tools. The CRM concept
has matured and grown to become a subject encompassing all aspects of interaction between a
company and its customers. It encompasses client servicing, targeting, profitability, selling,
distributing channels, e-commerce, sales strategy, product strategy, and much more.
:: Electronic Document Maanagement This range of tools helps in storing, retrieving and managing the workflow of documents
across the enterprise, and in undertaking collaborative work. It is very important for banks
and financial institutions which have large amounts of important paper documents such as
faxes, credit application, checks, financial statement, etc.. Documents are not stored in one
place and are not processed by only one person. They have a workflow, that is a document is
passed from one person to another across the enterprise for approval, amendment, or
rejection. Automating this workflow is an important task to consolidate financial reporting
and reduce the accounting errors. Collaborative work on projects such as syndicating
financing, co-financing, and financial research requires the storage of documents and the
management of their workflow. This task is facilitated using specialized document
management tools for project collaboration.
1 http://www.sap.com/

Appendix 2.2 � Survey of tools in the Finance Domain 256 :: Multi-channel integration tools Survey data has shown that once e-commerce efforts were undertaken, consistency across
multiple delivery channels became the greatest implementation challenge2. Key issues
addressed in multiple channel integration are: choosing the appropriate channels, providing
customers with good service across all channels, ensuring consistent information access
across all channels, organizing a centralized policy to co-ordinate everything, and building
and maintaining customer confidence. Tools used to ensure successful multi channel
integration include tools for the data warehouse, computer-aided business process re-
engineering tools, and network management tools.
:: Business Process Modelling Business process modelling tools support the re-engineering of the financial enterprise.
Models used to document business processes and operations are often subject to standards
(the US Federal Information Processing Standard IDEF0, the ISO9000 documentation for the
manufacturing industry, etc.). Today organisations are facing a continuous change, and the
effect of this change on business efficiency is highly unpredictable and risky. Simulation
tools has been developed to take the risk out of change in several ways: by evaluating the
impact of adding a new product line, by re-engineering the business processes, by modelling
the working environment and by anticipating the implications of different business decisions.
:: Data-warehousing tools A data warehouse contains a collection of data from various operational systems and sources.
It can be used as an integrated information base for making decisions and solving problems.
Data-warehousing is the process of integrating enterprise wide corporate data into a single
repository supporting a variety of decision analysis functions as well as strategic operational
functions. The data warehouse provides a link between the operational environment and
analysis environment of an organization. Tools for building, maintaining, and using the data
warehouses in the financial enterprise are provided by Digital (Compaq)3 and Informix4.
2 Ernst & Young survey cited in Technology in Banking and Finance. 3 http://www.digital.com/alphaserver/bus-intell/index.html 4 http://www.informix.com

Appendix 2.2 � Survey of tools in the Finance Domain 257
TOOLS FOR INVESTMENT
FINANCIAL ANALYSIS AND MODELLING
:: OLAP General purpose OLAP (Online Analytical Processing) tools are a common example of
business intelligence tools. Data rich industries (such as the financial, marketing, consumer
goods production, services, and transport) have large quantities of good internal and external
data available in their databases to which they need to add value in order to gain competitive
advantages in a global marketplace. OLAP tools have been developed in response to this
need, to help conduct sales and customer behaviour analysis, budgeting, financial reporting
and consolidation, tailored and intelligent management reporting, and performance
measurement. However, the success of these tools relies on a high analytical functionality,
large data capacity, and an underlying integrated database. The efficiency of OLAP tools
might be reduced drastically in firms operating with multiple databases and low quality data
(lacking consistency, reliability, accuracy, and integration).
:: Data Mining Many databases contain valuable information that is not readily obvious. An example of
unrevealed information might be patterns of high-risk companies within a financial database.
The search for these valuable, yet hidden, patterns and relationships within a database is
known as data mining. Data mining infers rules that can guide decision making and forecasts
the results of the decision. A number of different types of data mining tools are in use today,
including: data visualization, neural networks, decision trees, and rule induction programs.
These tools help in visualizing, detecting patterns of relationship, and inferring business rules
hidden in the underlying database. The source of data analyzed by data mining tools can be
loaded from ODBC compliant databases as well as spreadsheet and statistical software
packages. Some of these tools can be also integrated into applications as activeX components.
The features in data mining tools include: data manipulation (sampling, selecting, and
merging data sets); modelling (classification, prediction, profiling, clustering, and detection
models); visual exploration (visual presentation of the different stages of the data mining
process, charts and graph plotting, and graphical trees views), and online distributed
reporting.

Appendix 2.2 � Survey of tools in the Finance Domain 258 :: Spreadsheets Spreadsheet modelling is widely used in business and finance. The ease of use, functionality,
and built-in features make spreadsheets the most popular and basic tools for simple financial
analysis and graphics reporting. Spreadsheet data models are the underlying models used in
any intelligent tool with extended analytical capability. Almost all financial analysis and
visual exploration tools import their data sources from spreadsheet applications.
:: Visual Exploration Visual exploration tools for
building Self Organized
Maps are used in finance to
perform credit scoring, risk
assessment, behaviour
modeling, knowledge
discovery in data bases,
system state monitoring,
process engineering, quality
control, and prediction. This
range of tools supports:
dependency analysis,
deviation detection,
unsupervised clustering, non-linear regression, data association, pattern recognition, animated
monitoring, as well as other enhanced visualization techniques.
Visual exploration, as its name indicates, explores the data set without needing to make any
prior assumption about its characteristics. As such, it offers an open-ended potential for
exploring the data set. Testing the significance of the results of a visual exploration method is
not formalized, and we are as yet unable to judge the relevance of our analysis. Visual
exploration has to prove itself as a reliable means for analysis.
This section considers the self organized map (SOM) as an example of a visual exploration
technique and tool used in finance. SOMs have been used to understand trends and patterns
among today’s emerging market [Deb98], to analyse data on the emerging Russian banking
system [SYa98], to translate multi-dimensional mutual fund data into simple two-dimensional
maps [Deb98-2], to approximate the distribution of the interest rates structure and its
Visual exploration in finance using self organized maps

Appendix 2.2 � Survey of tools in the Finance Domain 259 deformations over time [BGC98], and to conduct many other financial case studies where no
econometric assumptions on data can be made.
The SOM technique has found a wide application in finance because it is a numeric rather
than a symbolic method, it is a non parametric method, it demands no a priori assumption
about the distribution of the data, and it can detect unexpected structures or patterns by
learning without supervision. One of the tools used to develop SOM is Viscovery SOMine5.
:: Risk Management The risk of a financial asset is defined as the variation in its underlying value. Credit granting,
investing and trading involve risk. Hedging is a way to protect against risk, it can be achieved
by the use of derivative financial instruments which are mainly financial contracts that can
guarantee a non-loss position if all possible adverse market conditions and price movements
are taken into consideration in this contract. Risk management involves the detection of trends
and market surveillance. Self organized maps are used in visualizing some risk assessment
and classification problems, such as the classification of countries according to their risk,
where the level of risk is evaluated in term of many economic and financial factors.
:: Market Prediction Analyzing time series data in order to recognize patterns or make prediction about future
values is important in many application area such as investment, trading, etc.. The ability to
predict future values based upon past values and known future events is implemented using
statistical time series analysis or neural networks[Bow90].
:: Portfolio Management A portfolio is the total securities held by an institution or a private individual. Voluminous
amounts of rapidly changing data in financial markets create a challenging problem for
portfolio managers attempting to exploit such changes to achieve their investment objectives.
Changing market conditions should be exploited to optimize the value of individual portfolios
[Pat90]. Prices of financial assets taken from reliable sources are fed into portfolio
management models which support the decision of the buy and sell action and adjust the
portfolio holding according to current prices. Portfolio management tools enable the user to
download list of prices for stocks, options, bonds, mutual funds, or other investments directly
5 Free demo available at http://www.eudaptics.co.at

Appendix 2.2 � Survey of tools in the Finance Domain 260 from the Internet. Based upon the newly downloaded prices a portfolio is priced and reports
are generated to display the results in ways that enable the investor to make clear and precise
investment decisions based on the total portfolio behaviour. Appropriate visualization is used
to highlight profitable transaction based on a study of asset prices, and to show the portfolio
holding at any moment in time.
:: Numerical Libraries The implementation of intelligent financial analysis is supported by libraries developed by
commercial firms. These libraries include a wide range of financial computation functions.
Spreadsheet applications also support a library of financial and statistical functions. However,
human judgement is always necessary to conclude a final judgement on the investment
decision.
:: Statistical Packages / Fourth Generation Languages Statistical tools extend the features of spreadsheet tools to encompass a wider range of
numerical and econometric techniques implemented as built-in functions. Statistical packages
are used widely in academic financial research.
Fourth generation languages (4GLs) [WC88] were developed in response to the
dissatisfaction of business users with large conventional languages like COBOL. These users
are not professional programmers and wish to obtain quick results from data stored in a
computer. There is a vast variety of 4GLs including spreadsheets, application generators,
query languages, and decision support languages. Fourth generation tools for statistical and
econometric analysis include: Excel, Gauss, Matlab6, Eview, minitab, and SPSS7,
Mathematica8, Stata9 statistical software, etc..
An important issue considered in the use of fourth generation tools for statistical and
econometric analysis is numerical accuracy [Vin00]. Fourth generation tools for statistical and
econometric analysis are usually evaluated for their flexibility, power, intuitive syntax, ease-
of-sharing, and ease-of-use. Fourth generation tools have a variety of different features,
consist of different components, have different syntax and notations, and require different
learning time. For example, the GAUSS system consists of three components: the GAUSS
programming language, a publication quality graphics library, and a library of applications
6 http://www.mathworks.com/ 7 http://www.spss.com/ 8 http://www.wri.com/

Appendix 2.2 � Survey of tools in the Finance Domain 261 modules. Learning GAUSS takes about 2 weeks, while learning Excel might take hours for a
computer literate person.
TOOLS FOR INVESTMENT
EDUCATIONAL
:: OPTION! SOFTWARE OPTION! is an educational package accompanying a book on options [Kol96]. The package
is command line driven and consists of nine modules. Its procedures can compute virtually all
of the model prices and examples given in the text book [Kol96]. Where applicable, the
program can also graph option relationships. The first module, Option Values and Profits at
Expiration, computes the outcome for various option strategies that are held until expiration
of the option. Reports can be viewed or printed summarizing the results of the considered
strategy. The second module, Option Values and Profit Before Expiration, is similar to the
first module, but allows the user to price the options in their portfolio by using Black Scholes
and Merton Models. Results can be viewed or printed and graphs can be plotted. The Third
Module, European Stock Option, is composed of six sub-modules, covering the binomial
model with specified price movements, the Black Scholes model, implied volatility according
to the Black Scholes and Merton Models, simulation of stock and option prices consistent
with the Black Scholes model, the binomial approximation of the Black Scholes model using
stock prices movements, and dividend adjustment for European options. The fourth module,
American Stock Options, consists of five sub-modules that cover virtually all dimensions of
pricing American options on individual stocks. The fifth, sixth, and seventh, module cover
Stock Index Options, Options on Futures, and Foreign currency Options. The eighth module
deals with exotic options. The last module, Cumulative Unit Normal Probabilities, computes
univariate and bivariate cumulative probabilities.
9 http://www.stata.com/

Appendix 2.2 � Survey of tools in the Finance Domain 262
TOOLS FOR INVESTMENT
FINANCIAL ENGINEERING
:: Special Purpose Tool for Financial Contracts Description The following sections describe joint research work at Société Général in Paris, and Microsoft
Research in Cambridge, led by Jones et al (2000). This work attempts to develop a computer
language for the description and valuation of financial contracts. The following paragraphs
overview the proposal of Jones et al for a new “language of contracts” intended to precisely
specify arbitrarily complex contracts, to build easily-extensible libraries of contracts, to
perform valuations of complex contracts in a simple, modular way, and to perform other back
office functions. The key idea behind this research is that complex contracts are formed by
combining together simpler contracts, which in turn are formed from simpler contracts. In that
context three keywords are introduced, the first is combinators, which refers to bricks and
mortars. Bricks are elementary contracts from which all others are built (e.g. receive £100 on
1 Jan 2004). Mortars are the ways of transforming and combining contracts to make more
complicated ones. According to Jones et al (2000), defining contracts using a fixed set of
combinators, is similar to the specification and implementation of programming languages. A
programming language has primitive elements (variable, constants, etc), and combining forms
(for loops, if-then-else, procedures). The meaning, or behaviour of a complex program can be
explained in terms of the meaning, or behaviour of its component pieces). The main research
outcome is the definition of a carefully-chosen set of combinators which can be used to
describe many familiar contracts as well as processing these contracts (by giving an abstract
valuation semantic to combinators). A compositional approach is used for pricing and
hedging purposes. For this purpose, a formalized language to describe financial contracts is
being developed with the aim of facilitating back office contract execution, accelerating in a
substantial way risk analysis, graphically representing a contract as a decision tree, reminding
the front-office about any potential exercise decision that has to be taken, and generating
intuitive simulations for the marketing departments of investment banks. The following
picture, reproduced from Jones et al (2000), illustrates the main features of the formalized
language to describe financial contracts.

Appendix 2.2 � Survey of tools in the Finance Domain 263
Features of the formalized language to describe financial contracts proposed by Jones et al (2000)
In describing financial contracts, a precise vocabulary is used. This includes the following
terms: rights and obligations, observables (a time varying value whose value at any time is a
matter of legally-enforceable fact e.g. LIBOR rate, the temperature in Dover), unit of
currency (unit of currency in which a traded asset is measured), acquisition date (date of
acquiring a contract), horizon (expiry date of the contract).
A notation is used by Jones et al (2000) to define financial contract, this notation is
implemented in the functional programming language Haskell [JHA98]. A simple zero
coupon bond contract is described using this notation as follows:
C1::Contract
C1=zcb t1 100 GBP
zcb :: Date ◊ Float ◊ Currency ◊ Contract
The description of the contract, c1, Zero coupon bond contract “receive £100 in 1st January 2010” using the Haskell notation.
Extensible library
Contract construction
The primitives
Schedules for back office
Pricing and hedging
Legal and documentation
Axioms
The application of the function zcb to three arguments
Type signature for C1, that is C1 has type contract
Type signature for zcb
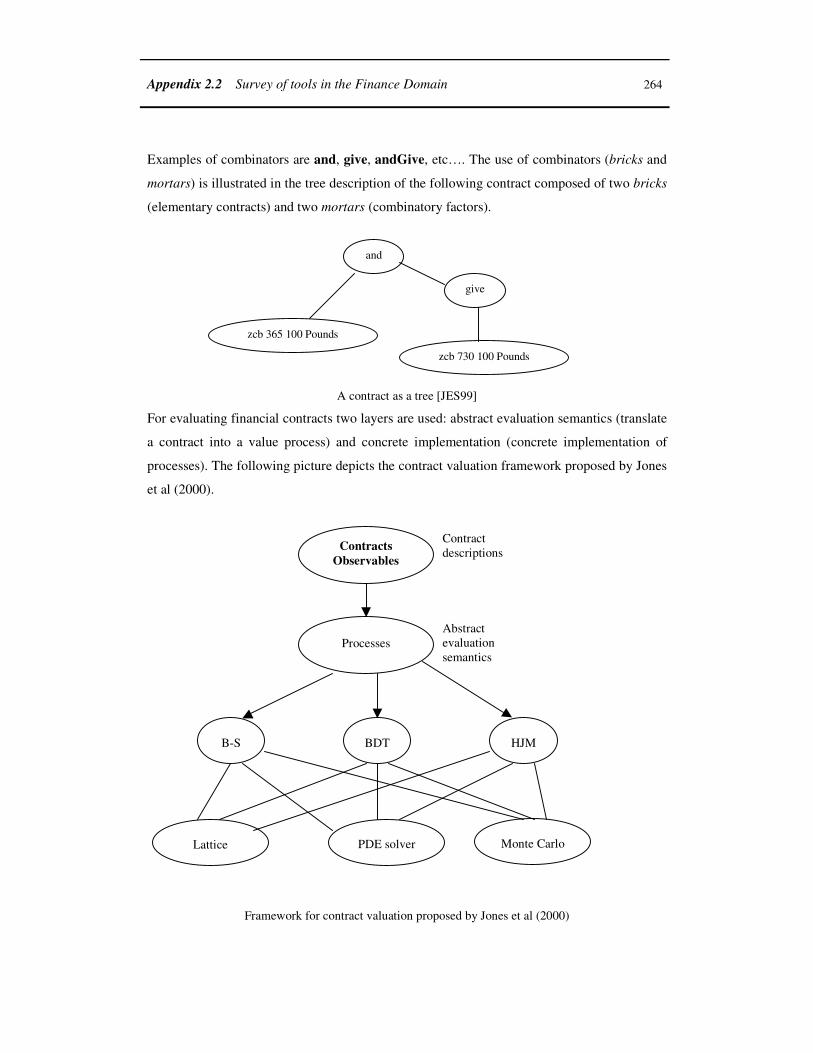
Appendix 2.2 � Survey of tools in the Finance Domain 264 Examples of combinators are and, give, andGive, etc…. The use of combinators (bricks and
mortars) is illustrated in the tree description of the following contract composed of two bricks
(elementary contracts) and two mortars (combinatory factors).
A contract as a tree [JES99]
For evaluating financial contracts two layers are used: abstract evaluation semantics (translate
a contract into a value process) and concrete implementation (concrete implementation of
processes). The following picture depicts the contract valuation framework proposed by Jones
et al (2000).
Framework for contract valuation proposed by Jones et al (2000)
zcb 365 100 Pounds
zcb 730 100 Pounds
and
give
Contracts Observables
Contract descriptions
Processes Abstract evaluation semantics
B-S
BDT
HJM
PDE solver
Lattice
Monte Carlo

Appendix 2.2 � Survey of tools in the Finance Domain 265
TOOLS FOR THE FINANCIAL MARKET
EDUCATIONAL MODELS
:: The Wall Street Trader The Wall Street trader is a wimp based
application game with multimedia support,
to help learning about the global financial
community. The game has a simulated
financial database covering two years of
trading history. The user, the player of the
game, is the investor and he/she can buy
and sell stocks and read about a company’s
history. Some tools are available to the investor: an analyst (to help the user understand the
news), an insider (to help the user uncover hard to find facts), and a spy (to see what other
investors are up to). The game has a tutorial. The news database is fictional though inspired
by real events. Each time the game is restarted the events are changing so that the game can
be played many times without being repetitive.
:: The Monopoly Dealer Simulation The monopoly dealer
simulation is a command
line application with a
simple interface but a rich
content. The simulation
reveals the complexity of
the interaction in the
financial market and the
difficulty in apprehending
financial markets
phenomena, such as the
determination of the true price of a security and the impact of the investor behaviour (trader
flow) on the decision making of a dealer.

Appendix 2.2 � Survey of tools in the Finance Domain 266
The following description of the monopoly dealer10 simulation, developed by Larry Harris,
is extracted from the corresponding homepage. The program simulates trading in a dealer
market in which there is only one dealer (the user of the simulation model). The user’s task
(the sole dealer) is to set and adjust bid and ask quotes (raise, lower quotes, or narrow and
widen the spread) to maximize his trading profits. The computer model simulates traders
arriving at random times to trade with the dealer (user) at his quoted prices. Larry Harris’s
aim in the simulation is to raise the awareness of its user (playing the role of a dealer) to the
trading behaviour of different types of investors (informed/uninformed), and the true value of
the security (changing through time and known to informed traders). The role of the user
(dealer) is to estimate the true security value by examining the order flow. While the
simulation is running, the computer estimates the user (dealer) profits by adding his cash
position to the current market value of his inventory (computed using the last trade price).
When quitting the simulation, the computer shows the true security value and the true profits
of the dealer (user). The dealer (user) should know how to attract traders by adjusting his
bid/ask quotes and spread. When the quoted bid/ask spread is wide, few uninformed traders
will trade. To encourage uninformed traders to trade the spread should be narrowed. If the
true security value is above the ask quotes, informed traders will buy from the dealer. They
will sell to the dealer if the true security value is below his bid. Informed traders will trade
more often and they will make larger trades when the dealer quotes are far from the true
security value. The dealer should watch and control his inventory carefully, holding
continuously less than 10,000 shares, long or short. The simulation will end if the dealer’s
inventory goes above 10,000 or below -10,000. Upon termination, the simulation reports
executed trades. The following diagram depicts the buy/sell reaction of the informed investor
according to bid/ask and true price value.
Investor’s behaviour in response to dealer quotes
10 http://lharris.usc.edu/trading/DealerGame\Default.htm
Bid
Ask
True price
Normal buy/sell
Bid
Ask
True price
More sellers
Bid
Ask
True price
More buyers
Bid
Ask
Wide spread
Few uniformed
trades
Bid
Ask
Dealer
Buys at his bid price
Sells at his ask price

Appendix 2.2 � Survey of tools in the Finance Domain 267 :: Web-Based Trading Model
Boutell (1996)
developed a web trading
model using CGI
(Common Gateway
Interface) implementing a
stock market trading
system. As in online
trading systems, the main
features of this web-based
model are to allow users
(investors) to perform three tasks: 1) examine their portfolio; 2) buy and sell stocks; and 3)
track the performance of stocks over time. The model does not work in real time (i.e. it has no
feed of real data), however, it could be interfaced with a real database of stock market data
with fast price updates and a large number of securities.
Boutell’s model takes into consideration security, which is an important issue in designing
any web trading or e-commerce application. Providing security means providing an
appropriate authentication system. The model adopts a simple authentication mechanism to
password-protect directories. It requires each user to enter a valid account name and password
to access any page in that directory.
The web-trading model consists of two CGI programs. The first one generates random price
fluctuations, simulating a one-day activity in the stock market. For real applications this CGI
should be replaced with an interface to a source of actual stock prices. The second CGI
program interacts with the user (which is the customer). It accepts user input and allows the
customer to monitor his portfolio, to buy and sell shares, and to track the performance of
shares. The CGI application developed to simulate stock price fluctuation accepts as input a
text-based file consisting of stock ticker symbols. After running the application the database
file will hold each stock ticker followed by up to 30 days of fluctuating stock prices, with the
current price being the last one. The main functions of the CGI trade application is the
dynamic generation of web page content from customer.dat files (each authenticated customer
has a customer.dat file, e.g. the customer soha has soha.dat file), and the stock price file
generated by the first CGI program. The dynamically generated web pages are: a portfolio
page (listing the shares holding of a customer and giving this customer the option to buy and
sell from already owned shares or to acquire new shares), a newspaper page (giving the
Trade CGI
customer.dat pricedatabase
portfolio page
Web server
customer.log
newspaperpage
transactionhistory page
plot ofhistorical price
change perstock
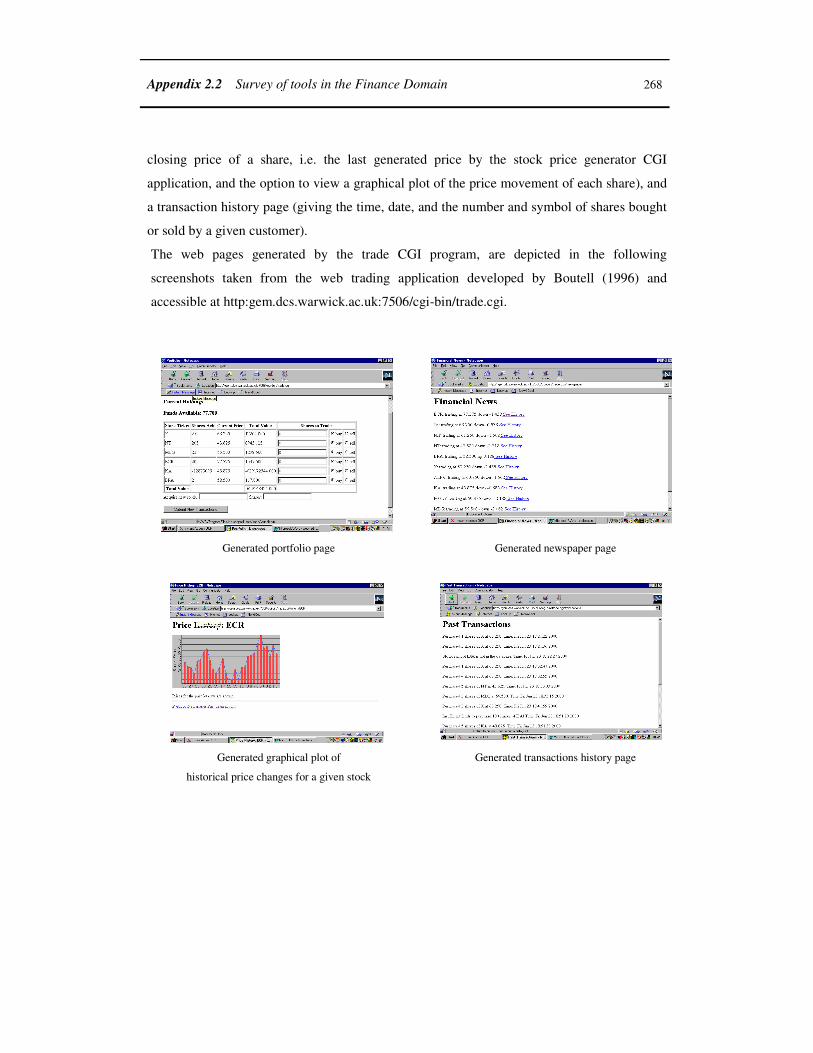
Appendix 2.2 � Survey of tools in the Finance Domain 268 closing price of a share, i.e. the last generated price by the stock price generator CGI
application, and the option to view a graphical plot of the price movement of each share), and
a transaction history page (giving the time, date, and the number and symbol of shares bought
or sold by a given customer).
The web pages generated by the trade CGI program, are depicted in the following
screenshots taken from the web trading application developed by Boutell (1996) and
accessible at http:gem.dcs.warwick.ac.uk:7506/cgi-bin/trade.cgi.
Generated portfolio page
Generated newspaper page
Generated graphical plot of
historical price changes for a given stock
Generated transactions history page
Appendix 2.2 � Survey of tools in the Finance Domain 269
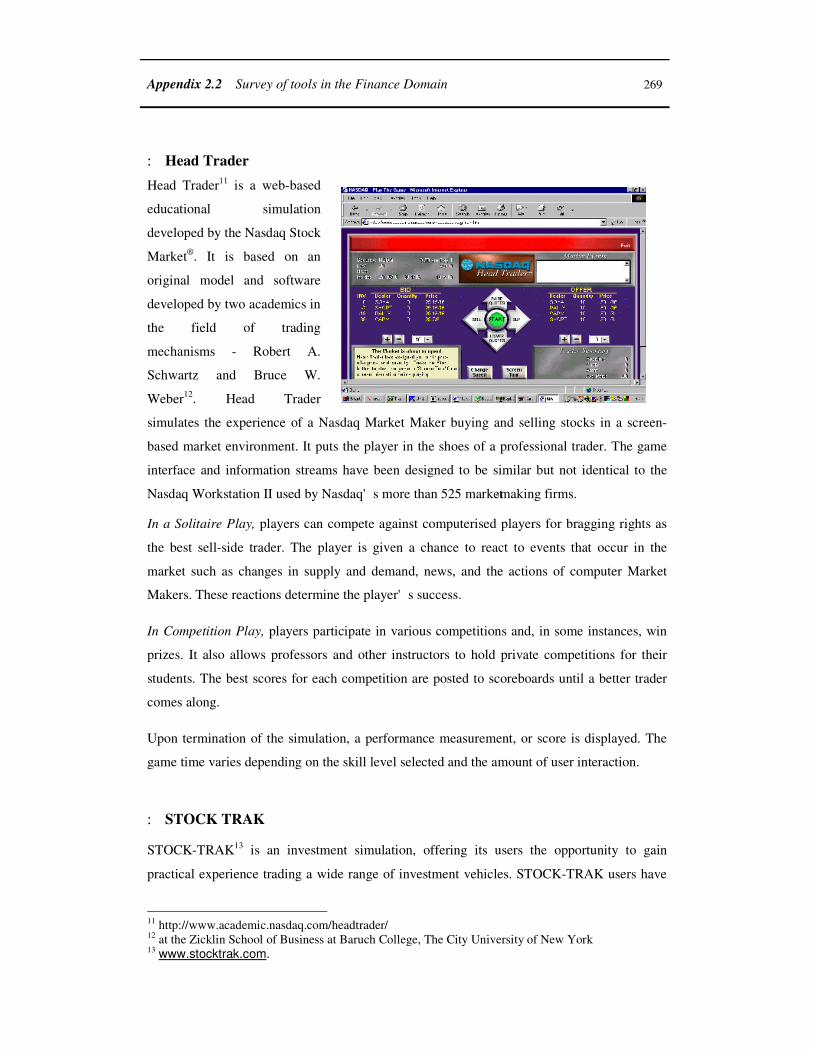
:: Head Trader Head Trader11 is a web-based
educational simulation
developed by the Nasdaq Stock
Market®. It is based on an
original model and software
developed by two academics in
the field of trading
mechanisms - Robert A.
Schwartz and Bruce W.
Weber12. Head Trader
simulates the experience of a Nasdaq Market Maker buying and selling stocks in a screen-
based market environment. It puts the player in the shoes of a professional trader. The game
interface and information streams have been designed to be similar but not identical to the
Nasdaq Workstation II used by Nasdaq's more than 525 market-making firms.
In a Solitaire Play, players can compete against computerised players for bragging rights as
the best sell-side trader. The player is given a chance to react to events that occur in the
market such as changes in supply and demand, news, and the actions of computer Market
Makers. These reactions determine the player's success.
In Competition Play, players participate in various competitions and, in some instances, win
prizes. It also allows professors and other instructors to hold private competitions for their
students. The best scores for each competition are posted to scoreboards until a better trader
comes along.
Upon termination of the simulation, a performance measurement, or score is displayed. The
game time varies depending on the skill level selected and the amount of user interaction.
:: STOCK TRAK
STOCK-TRAK13 is an investment simulation, offering its users the opportunity to gain
practical experience trading a wide range of investment vehicles. STOCK-TRAK users have
11 http://www.academic.nasdaq.com/headtrader/ 12 at the Zicklin School of Business at Baruch College, The City University of New York 13 www.stocktrak.com.

Appendix 2.2 � Survey of tools in the Finance Domain 270 $100,000 to invest in common and preferred stocks, bonds, options, index options and futures,
commodities, foreign currencies, financial futures, options on futures, spot contracts, mutual
funds, as well as international stocks. Other features of the simulation include day trading,
buying on margin, writing options covered and naked, as well as short selling. Interest is
earned on cash balances and incurred on margin balances. STOCK-TRAK offers toll free
access to live brokers, as well as twenty-four hour account access online. Users range from
junior high school students to finance majors to firms that use STOCK-TRAK to train new
employees.
TOOLS FOR THE FINANCIAL MARKET
TRADING SYSTEMS
:: (4i) System Trading, valuation, and management of financial instruments as used by practitioners is
exemplified by the Integrated Investment Intermediary Information System (4i) developed by
Consort securities systems Ltd.14. The system offers integrated investment management and
stockbroking services. The system is WIMP based, with a GUI front-end and an SQL-Server
relational database back end. The functionality of the system is detailed in the figure below.
4i system
Corporate events
Custody
Security & housekeeping
Database management system
and design
Portfolio evaluation and administration
Compliance Order Capture and routing
Market settlement
Contracts
Client accounting
The functionality of the 4i system
Appendix 2.2 � Survey of tools in the Finance Domain 271 A single core database is used by all modules of the 4i system. This database maintains client
/ counterparty / principle and static data. Enquiries and reporting, batch and online processing,
and multi currency are supported by this backend data base. Contracts are channelled to the
system via the order and capturing module. The contract module allows the issuance of
contracts (the layout of the issued contract can be user defined), the performance of
calculations related to financial contracts, the reversal of contracts (cancellation or
amendment) and settlement of the contract. The order and capturing module is designed to
capture orders from a variety of sources (both manual and automatic), to validate them against
specific criteria, and to direct them to the appropriate dealing system. The client accounting
module is a look up module for investor, account, agent and brokers details. The results of
the look up are reported through the financial reporting module. The portfolio evaluation and
administration module allows the creation and maintenance of portfolios for clients. Client
portfolio information comprises contracts, prices, indices, currencies, and valuations. In this
module, portfolio modelling and what-if analysis can be conducted, stock modelling and asset
allocation can be performed, capital gain tax can be calculated, and performance measurement
and reporting facilities are also provided. The client accounting module manages the accounts
of investors, agents and brokers and provides accounting reporting facilities. The market
settlement modules report trades to settlement agencies and regulatory bodies, and monitor
and record the progress of transaction settlement and trade execution. The custody module
allows the creation and maintenance of new information records in the database. The
compliance module provides reports for compliance officers to complete their tasks. The
security and house-keeping module contains system configuration files storing licensing data,
system program control info, and other features related to system maintenance, monitoring
and control.
:: eSpeed Commercial software packages are developed to enable timely trade execution. An example
of such type of product is the eSpeed15 system that provides instantaneous, anonymous
execution and trade confirmation. It offers a clear, comprehensive price display screen with
real-time price dissemination.
14 http://www.consort.co.uk 15 www.espeed.com