tools for the application of quality by design principles...
TRANSCRIPT

Tools for the Application of Quality
by Design Principles in HPLC
Imre Molnár
Molnár-Institute, Berlin, Germany
© Molnár-Institute 2014

Introduction
• The Institute
• In 1986 we invented isocratic modeling in HPLC
• In 1990 we invented Gradient Elution
• In 2004 we developed PeakTracking
• In 2009 we developed the Cube
• And in 2012 we started the Robustness Tool
• We developed the most visual tool for HPLC
focusing on the chromatographic part of
method development in HPLC

Overview
• What is QbD?
• What modeling tools are available?
• The most simple DoE: the Cube
• DryLab vs QbD – two languages – a
comparison
• Case Study 1: pH-influence – study 5 factors
• Case Study 2: Gradient elution modelling w. 8
factors
• Case Study 3: Acetonitrile shortage
• Robustness optimization
• Knowledge Management Document

What is Quality by Design (QbD)?
• QbD is the end of Trial & Error. You have to plan your
work, set your goals and make your experiments – and
make sure, they are reproducible.
• You should use solid science and should know, how
HPLC is working. If you are a beginner, use modeling
tools, they will help you to learn, how to make a good
separation. Use gradient elution, this is excellent for
most of the samples.
• I will demonstrate for you
– how to get the best separation
– how to find the most robust conditions for routine work
– how to select the best column for your application

What is available on the market on modeling
tools?
• The most important goal is to understand your
separation, i.e., which parameters are inducing which
peak movements.
• You can start with molecular structures, you can start to
run hundreds of experiments – however automation
should be meaningful. Some products are based only
on statistics. We think, before you use a lot of statistics,
you should understand how to make a good HPLC and
a robust separation first.
• The easiest way to generate a good method is to do the
right measurements and the right selection of them.

Simple Design of Experiments (DoE)
• There are hundreds of possible Designs for HPLC.
However the most simple one is the Gradient time, tG
vs. Temperature T, the so called tG-T-model. Why?
Because you need only 4 experiments and can predict
over 10,000!
• These 4 runs will be different in peak elution order. This
is sometimes surprising! But this is your choice to avoid
later Out of Specification (OoS) results.
• Repeating the tG-T-Design 3 x with changing pH or
ternary eluent composition (tC) you can create the
Cube in ca. 20 sec, which is containing over one
million chromatograms. You can find the best one with
just a mouseclick. And you can create a visual
chromatogram for any of your changes. This is great!

The most simple DoE
Column: 50x2.1mm, 1.7µm
tG1: 3 and tG2: 9 min
T1: 30, T2: 60°C
Eluent A: pH1: 2.0, pH2: 2.6, pH3: 3.2
Eluent B: AN, (50:50), MeOH

The ternary Cube
Baseline Resolution Regions red
= MODR, visualized Design Space Design Spaces can be different
irregular (red) bodies
Select your working point

DryLab® and QbD
Method goals
Critical separation
parameters
Run experiments.
Build & evaluate
DryLab® models
Models based on
experiments
with up to 10 factors
Multifactorial Robustness
Testing
DryLab®
expressions
Model changes to justify
progress
QbD expressions
Analytical target profile
(ATP)
Critical quality attributes
(CQA’s)
Risk assessment (RA)
Design space (DS) and Method
Operating Design Region
(MODR)
Control strategy
Continual improvement
© Molnár-Institute 2014

Case Study 1: pH-model
Robust pH-region Other variables
L, ID, F, dp,
etc.
Other variables
L, ID, F, dp,
etc.
Rs,crit
p
H
Critical peakpair in
red
Separate
your peaks

Case Study 2: Gradient time tG
model pH-Optimization
Shorten your
analysis time

Case Study 2: Develop step
gradients
Optimize
your gradient

Eluent A varied in pH, Eluent B varied in ternary
composition
Multifactorial optimization strategy of 4 measured critical HPLC
method parameters: Gradient time (tG), temperature (T), pH and
ternary composition (B1:B2), based on 12x3=36 experiments.
I.Molnár, H.J.Rieger, K.Monks, J.Chromatogr. A, 1217 (2010), 3193–3200.
Case Study 3: Acetonitrile Shortage How to replace AN with MeOH? Answer: Ternary eluent modeling

Case Study 3: The ternary Cube
We can have an excellent separation in MeOH!

Case Study 4: Separation of 22 API‘s is not sufficient in
AN
Best working point
Bad separation of 22 Active Pharmaceutical
Ingredients (API‘s)in Acetonitrile

Method Operating Design Region
Edge of failure
Case Study 4: Separation is much better in
MeOH
22 Active Pharmaceutical Ingredients (API‘s)

Case Study 4: 1. Step: Peak Tracking – fixing elution order in the tG-T-ternary eluent composition (tC)-Model
Observing a lot
of
Selectivity
Changes
Eluent B:
MeOH
50:50
AN
tG-T-tC-model
T [°C]
2
6
10

2.Step a: Peak tracking for each of the tG-T-models Peak tracking of the runs 1, 2, 3, 4 in eluent B1: AN
1.
3.
2.
4.
tG-T-tC-model 1, 2, 3, 4
T [°C]

2.Step b: Repeating Peak tracking with runs 5, 6, 7, 8 in eluent B: MeOH:AN(50:50)(V:V)
tG-T-tC-model 5, 6, 7, 8
T [°C]
5.
7.
6.
8.

2.Step c: Repeating Peak tracking 4 runs in eluent B2: MeOH
tG-T-tC-model 9, 10, 11, 12
T [°C]
9.
11.
10.
12.

Case Study 4: Calculation of the cube: tG-T-tC 3-D-Model, point of high critical resolution (1.92) in 100% MeOH
M. Euerby, G. Schad, H. J. Rieger, I. Molnár, Chromatography Today, (Dec. 2010), 13–20.

Edge of
Failure
Multifactorial Robustness Test of 6 factors at 3 levels =729 runs in
calculated in 30 seconds

Multifactorial Robustness Test of 6 factors at 3 levels =729
runs
Working Point
(WP) at the Edge
of Failure (EoF)
OoS-results (>74%) SR:
26%
MODR
The method is at this point CAN NOT BE USED in the production

If we select a better working point => we get better results
OoS-results SR:
94%
(6%)

If we have a better pump with smaller flow rate variations =
0% OoS
OoS-results =
0%
DF: 0.02
mL/min

DryLab® model
shows:
MeOH is the better
eluent!
front view
view from left side view from the top
view from the right side

10 20
Time (min)
3.33
5
4.93
75.
363
6.18
86.
643
7.20
7
8.18
7
9.16
5
11.0
24
11.8
06
13.1
8513
.680
16.0
01
17.0
54 17.5
7317
.942
18.5
62
20.1
15
21.7
03
22.5
02
0 10 20
Time (min)
3.35
4
4.95
65.
383
6.21
96.
658
7.26
4
8.18
9 9.21
1
11.1
29 11.8
58
13.1
8013
.854
16.0
72
17.2
21 17.6
8218
.056
18.6
79
20.2
56
21.8
6122
.560
DryLab® model
Experiment
Accuracy of modelling > 99%

Case Study 5: Pharmacopoe method too long, (over 60
min) and old column not available anymore:
Find new column using the pH-Cube
using tG, T and pH changes (pH-Cube):
Acquity BEH C18, 50 x 2.1mm, 1.7 µm
Acquity CSH C18, 50 x 2.1mm, 1.7 µm
YMC Triart 50 x 2.1mm, 1.7 µm
Acquity T3 50 x 2.1mm, 1.7 µm
Acquity HSS C18 50 x 2.1mm, 1.7 µm
Acquity HSS C18 SB 50 x 2.1mm, 1.7 µm
Aeris XB C18 50 x 2.1mm, 1.7 µm
Kinetex C18 50 x 2.1mm, 1.7 µm
With each column 12 runs were carried out
(takes ca. 4 h for each column):
3 tG-T-sheets at 3 pH-values (establ. in eluent A)

Different working points, but baseline resolution for each column
Acquity BEH C18 Acquity CSH C18 YMC Triart C18
Acquity HSS C18
Aeris XB C18 Kinetex XB C18
Acquity HSS C18-
SB
Acquity HSS T3

Excellent Predictions (blue) vs. Experiment
(red)
For most columns
a good separation
was found, but
also differences
in robustness
New method faster
under 6 min,
average tR-deviat.
< 0.5%.
New Method 10 x
more efficient
as in EP.
R.Kormány, I. Molnár, H.J. Rieger, Journal of Pharmaceutical and Biomedical Analysis, 80 (2013), 79-88

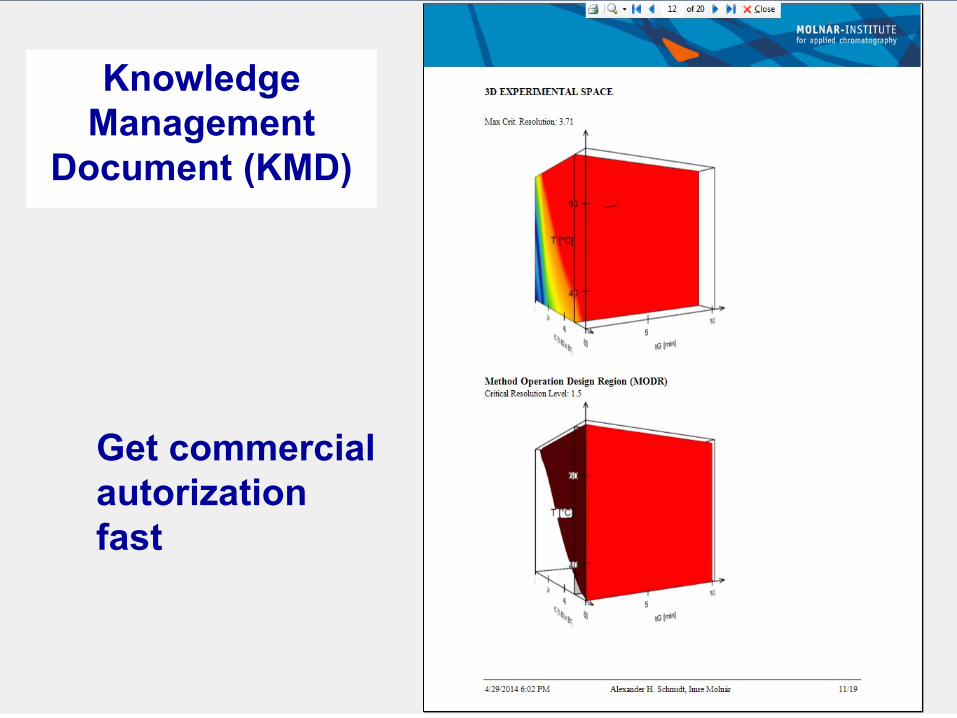
Knowledge Management Document (KMD) Contains all necessary informations for commercial authorisation
Summary
GMP Document
ATP, CQA
Risk management
Control Strategy
Make Experiments
and PeakTracking
Calculate
the Cube
Compare the
basic runs with
the modelled ones
Robustness and
OoS calculations
Adjustments in the
Design Space and
of Variabilities
Print Document and
submit to Regulators
for comm. autorization
Make your separation method
understandable

Knowledge
Management
Document (KMD)

Knowledge
Management
Document (KMD)
Knowledge
Management
Document (KMD)
Get commercial
autorization
fast
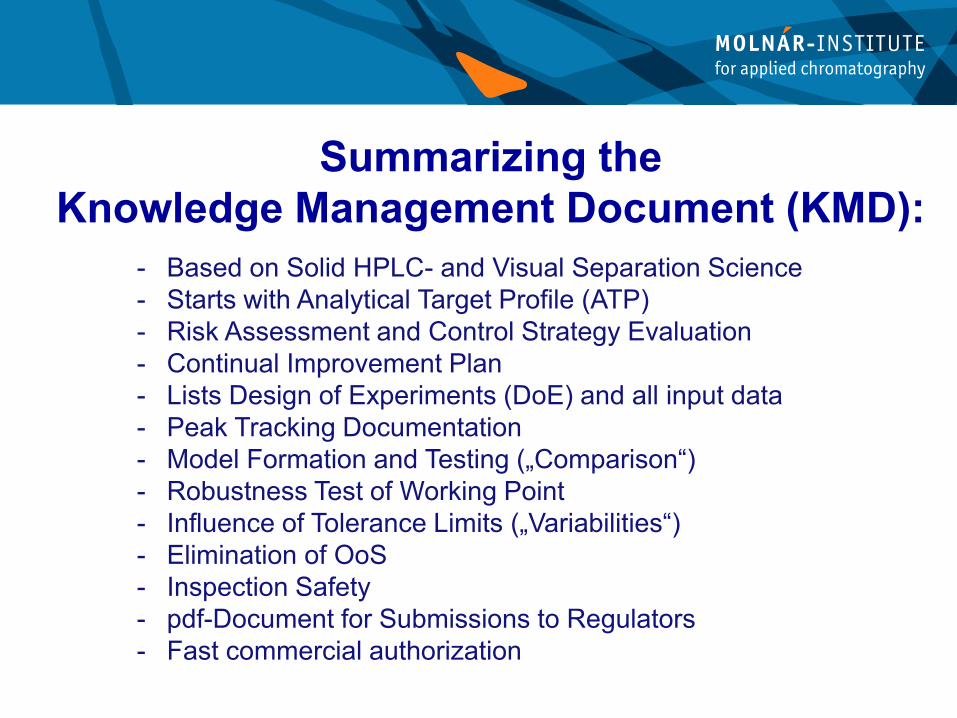
Summarizing the
Knowledge Management Document (KMD):
- Based on Solid HPLC- and Visual Separation Science
- Starts with Analytical Target Profile (ATP)
- Risk Assessment and Control Strategy Evaluation
- Continual Improvement Plan
- Lists Design of Experiments (DoE) and all input data
- Peak Tracking Documentation
- Model Formation and Testing („Comparison“)
- Robustness Test of Working Point
- Influence of Tolerance Limits („Variabilities“)
- Elimination of OoS
- Inspection Safety
- pdf-Document for Submissions to Regulators
- Fast commercial authorization

DryLab ® reinvented
HPLC

Acknowledgement
Shimadzu for HPLC-instruments
LC-Resources, Inc.
MacMod and HiChrom
for ACE- and HALO columns
www.molnar-institute.com
© Molnár-Institute 2014