tools for managing water quality from trophic state in …4)_264-275.pdf · tools for managing...
TRANSCRIPT

Tools for managing water quality from trophic state in the estuarinesystem Cienfuegos bay (Cuba).
MABEL SEISDEDO1*, ROBERTO H. HERRERA2, GUSTAVO ARENCIBIA3 & LUIS SORINAS4
1Centro de Estudios Ambientales de Cienfuegos, Cuba (Calle 17 esq. Ave. 46 s/n. Reparto Reina, C. P. 55100, Cienfuegos, Cuba)2University of Alberta (Edmonton, Alberta, Canada)3Centro de Investigaciones Pesqueras, Cuba (5ta Ave y Calle 246. Santa Fe. C.P.17100, Ciudad de La Habana, Cuba)4Instituto Superior de Tecnologías y Ciencias Aplicadas (Ave. Salvador Allende y Luaces, La Habana, Cuba)
*Corresponding author: [email protected] u
Abstract: This paper contributes to the coastal environmental management by proposing some tools formanaging water quality from trophic state, in Cuban bays with estuarine characteristics. Althougheutrophication-like symptoms have been previously reported in Cuban semi-enclosed bays with estuarinecharacteristic, there is no specific methodology for managing this environmental problem. In this study,we propose a conceptual model of water quality management from trophic state for these aquatic systemsand the methodology for implementing it supported on indicators according to the Driver–Pressure–State–Impact–Response (DPSIR) approach. As a case study, the Cienfuegos bay is presented and thestages of this methodology are carried out in order to test its feasibility as a tool for managing theeutrophication. The results obtained were favorable and showed the importance of assimilating systemicand causal approaches in this environmental management proposal.
Keywords: eutrophication, methodology, management, bay
Resumen: Herramientas para manejar la calidad del agua a partir del estado trófico en el sistemaestuarino bahía de Cienfuegos, Cuba. Este trabajo contribuye a la gestión ambiental costera mediante lapropuesta de algunas herramientas para manejar la calidad del agua desde el punto de vista trófico enbahías cubanas con características estuarinas. Aunque se han reportado síntomas de eutrofización enbahías cubanas semicerradas con características estuarinas, no existe una metodología para manejar esteproblema ambiental. En este estudio proponemos un modelo conceptual de gestión de la calidad del aguadesde el punto de vista trófico para estos sistemas acuáticos y la metodología para su implementaciónapoyada en indicadores de acuerdo a la aproximación Fuerza conductora-Presión-Estado-Impacto-Respuesta (FPEIR). Como un estudio de caso se presenta la bahía de Cienfuegos y se llevan a cabo lasetapas de esta metodología en función de probar su factibilidad como herramienta para manejar laeutrofización. Los resultados obtenidos fueron favorables y mostraron la importancia de asimilar losenfoques causal y sistémico en esta propuesta de gestión ambiental.
Palabras clave: eutrofización, metodología, manejo, bahía
IntroductionEutrophication of estuarine systems is a
widespread environmental problem (Bricker et al.2003, Nixon 2009, Cook et al. 2010). Consequencesof eutrophication include fish deaths and significanteconomic losses (Schernewski et al. 2009, Loza etal. 2013, Moreira et al. 2014)
The most commonly used tools supporting theenvironmental management of eutrophication (e.g.
Bricker et al. 2003, Vollenweider et al. 1998) onlycontribute to the diagnosis stage. The integratedmethodology for the Assessment of EstuarineTrophic State (ASSETS) proposed by Bricker et al.(2003) is one of them and it is based on pressure-state-response (PSR) indicators. However, thismethodology lacks of the needed systemic approachto guarantee the integration among the implicatedstakeholders (Gari 2010, De Jonge et al. 2013). It
Pan-American Journal of Aquatic Sciences (2016), 11(4): 264-275

Eutrophication management in Cienfuegos bay 265
also needs to consider the drivers for supporting theselection of proper management strategies as well astools for evaluating them (Whitall et al. 2007).
The systemic and causal approaches areconsidered to address eutrophication in severalcountries (Zaldivar et al. 2008, Gari 2010,Garmendia et al. 2012). The second approach basedon the Driver–Pressure–State–Impact–Response(DPSIR) indicators, links the human driving forces,the causes of alteration in the ecosystem (pressures),the state of the ecosystem, the effects of changes instate (impacts) and the management strategies(response). When considering these approaches andthe risk analysis, it is possible to obtain a useful toolfor reducing the eutrophication risk in the ecosystem(Garmendia et al. 2012, Cormier et al. 2013). Therisk analysis is an important aspect for managingthis environmental problem from a preventive pointof view, and yet it has been hardly used.
In some studies about eutrophication in theCaribbean and Latin-America region (López-Cortéset al. 2003, Herrera-Silveira et al. 2011, Alves et al.2013, Montalvo et al. 2014), different indexes wereapplied for assessing trophic state. Most of thesestudies used the index TRIX, proposed byVollenweider et al. (1998) and the ASSETS method(Bricker et al. 2003).
In Cuba, some studies have reportedeutrophication-like symptoms in semi-enclosed bayswith estuarine characteristics, such as highchlorophyll a levels and toxic algal blooms events(Gómez et al. 2006, Reyes 2008, Moreira et al.2014), though hitherto without a specificmethodology for managing this environmentalproblem.
Cienfuegos bay is one the Cuban bays that hasshowed deleterious effects, like loss of biodiversity,high nitrogen levels and toxic algae blooms events(Moreira et al. 2006, Seisdedo et al. 2009, Helgueraet al. 2011, Moreira et al. 2014). This estuarinesystem is impacted by the polluting discharges ofCienfuegos city and the nearby agricultural andindustrial zones. Even though this system shows asaverage non-eutrophic water condition (Seisdedo etal. 2014), the level of nutrient loads can still be highin some areas and increase into the future withoutapplying an appropriate management methodology.
Consequently, we apply causal (DPSIR) andsystemic approaches in order to manage waterquality based on the eutrophication risk analysis andtaking into account the unique characteristics of theestuarine system Cienfuegos bay.
Materials and methods
Study area: Cienfuegos bay is situated in thesouthern central part of Cuba (22◦1′ N, 80◦20′ W,Figure 1). It is a semi-enclosed bay with estuarinecharacteristic. It is connected to the Caribbean Seaby a narrow channel 3.6 km long. Its area is 88.46km2 and a total volume of 0.84 km3 with an averagedepth of 9.5 m (Muñoz et al. 2012). Its coastal linerepresents the most important natural resource in theCienfuegos province, due to fishing (6%) andindustrial activities (7%), agriculture (2%), maritimetransport (7%), natural parks (70%), urbanizationand tourism (8%) (Moreira et al. 2014). The bay isdivided into two natural lobes. The northern lobe hasmore anthropogenic impact: e.g. sewage dischargesfrom the city of 161,432 inhabitants (ONEI 2012)and the incidence from industrial area. There is alsofreshwater input from the Damují and Salado riversand from other less extensive river basins such as ElInglés, Calabazas and Manacas creeks. In thisregion, despite actions by the local government toreduce pollution in the bay, the wastewater treatmentis still inadequate. The southern lobe is subjected toa lesser degree of pollution arriving from the Caonaoand Arimao rivers.
Figure 1. Localization map of Cienfuegos bay, Cuba andsampling stations.
Weather conditions in the study area can bedivided into two seasons: dry (November-April) andrainy (May-October) seasons. The bay has markedvertical haline stratification, caused by runoff fromland and low tidal mixture (Moreira et al. 2014).
Conceptual model of water quality management
Pan-American Journal of Aquatic Sciences (2016), 11(4): 264-275
266 M. SEISDEDO ET AL.
from trophic state for estuarine systems: Models andsupport methodologies related to the environmentalmanagement of eutrophication with causal andsystemic approaches were consulted (Bricker et al.2003, Whitall et al. 2007, Gari 2010, Garmendia etal. 2012, Cormier et al. 2013, Butler et al. 2013) fordefining the principles, main characteristics of thismodel and indicator categories.
In order to test these aspects, expert criteriawere considered by the Delphi method (Bravo &Arrieta 2005). The determination of expert numberwas based on the method proposed by García &Fernández (2008), then nine experts with a highcompetition degree were consulted usingquestionnaires. The association among the answerswas tested by Kendall Coefficient of Concordance(Legendre 2005) using the statistical package SPSSfor Windows version 15.0. The qualifications of theprinciples, characteristics and indicator categorieswere based on a value scale: 1-indispensable, 2-verynecessary, 3-necessary, 4-not very necessary and 5-not necessary.
Methodological proposal of water qualitymanagement from trophic state for estuarinesystems: Firstly, it was needed to design thediagnosis and evaluation tools for supporting themethodology of water quality management fromtrophic state for estuarine systems. This steprequired the selection of indicators accordingDPSIR, which was developed by means of twophases: qualitative and testing. For the first one,different indicator proposals in the methodologiesconsulted (USEPA 2001, Bricker et al. 2003,Cardoso & Carmona 2004) were considered. Thetesting phase required using expert criteria by theDelphi method, which allowed:-to evaluate the indicator quality considering:relevancy, availability, simplicity, objectivity andusing a scale from 1 to 10 (up to the biggest). -to evaluate the indicator suitability, based on thecategories: very suitable (1), quite suitable (2),suitable (3), not very suitable (4) and not suitable(5). -to determine the degree of the experts' agreementby means of the Kendall coefficient (W). -to validate the indicators correlating the values ofindicator quality and suitability by means coefficientRho of Spearman.-to evaluate the sensitiveness of each proposed indicatorusing Vester matrix according to García (2013).
The evaluation scale of indicators, proposedby García (2013), was used as follows: excellent
(0.76 - 1), good (0.51 – 0.75), regular (0.26 – 0.50)and bad (≤ 0.25). This scale was based on theclassification criteria for each indicator defined bythe expert group considering some proposals in themethodologies consulted (Bricker et al. 2003, García2013, Seisdedo & Muñoz 2013). In particular, forthe indicator related to nutrient loads from river, theclassifications of Water Quality Index (WQI) appliedto Cienfuegos bay (Seisdedo & Muñoz 2013) wasused, since it considered freshwater discharge as themain nutrient source to this system (Seisdedo &Arencibia 2010). This index considers causal andresponse parameters (NH4
+, NO2-, NO3
-, PO43-,
Biochemical Oxygen Demand, chlorophyll a)related to eutrophication and the combining methodproposed by CCME (2001):
732,1100
23
22
21 FFF
ICA
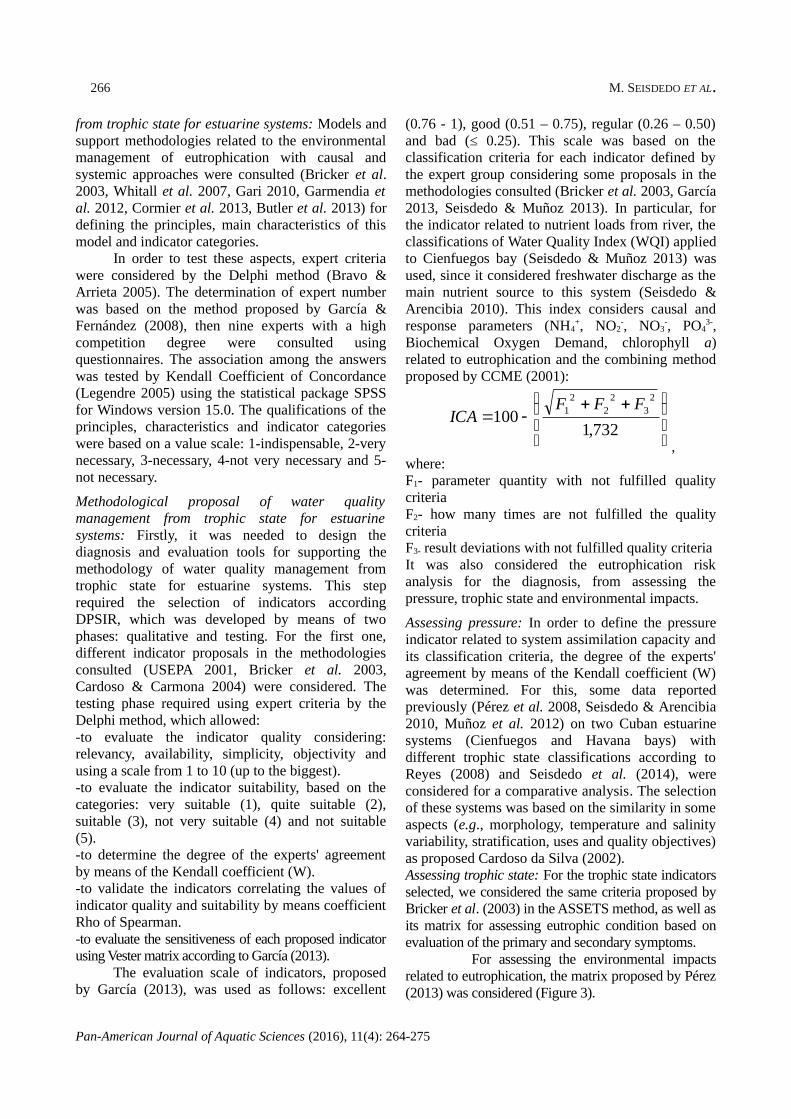
,where:F1- parameter quantity with not fulfilled qualitycriteria F2- how many times are not fulfilled the qualitycriteria F3- result deviations with not fulfilled quality criteria It was also considered the eutrophication riskanalysis for the diagnosis, from assessing thepressure, trophic state and environmental impacts.
Assessing pressure: In order to define the pressureindicator related to system assimilation capacity andits classification criteria, the degree of the experts'agreement by means of the Kendall coefficient (W)was determined. For this, some data reportedpreviously (Pérez et al. 2008, Seisdedo & Arencibia2010, Muñoz et al. 2012) on two Cuban estuarinesystems (Cienfuegos and Havana bays) withdifferent trophic state classifications according toReyes (2008) and Seisdedo et al. (2014), wereconsidered for a comparative analysis. The selectionof these systems was based on the similarity in someaspects (e.g., morphology, temperature and salinityvariability, stratification, uses and quality objectives)as proposed Cardoso da Silva (2002).Assessing trophic state: For the trophic state indicatorsselected, we considered the same criteria proposed byBricker et al. (2003) in the ASSETS method, as well asits matrix for assessing eutrophic condition based onevaluation of the primary and secondary symptoms.
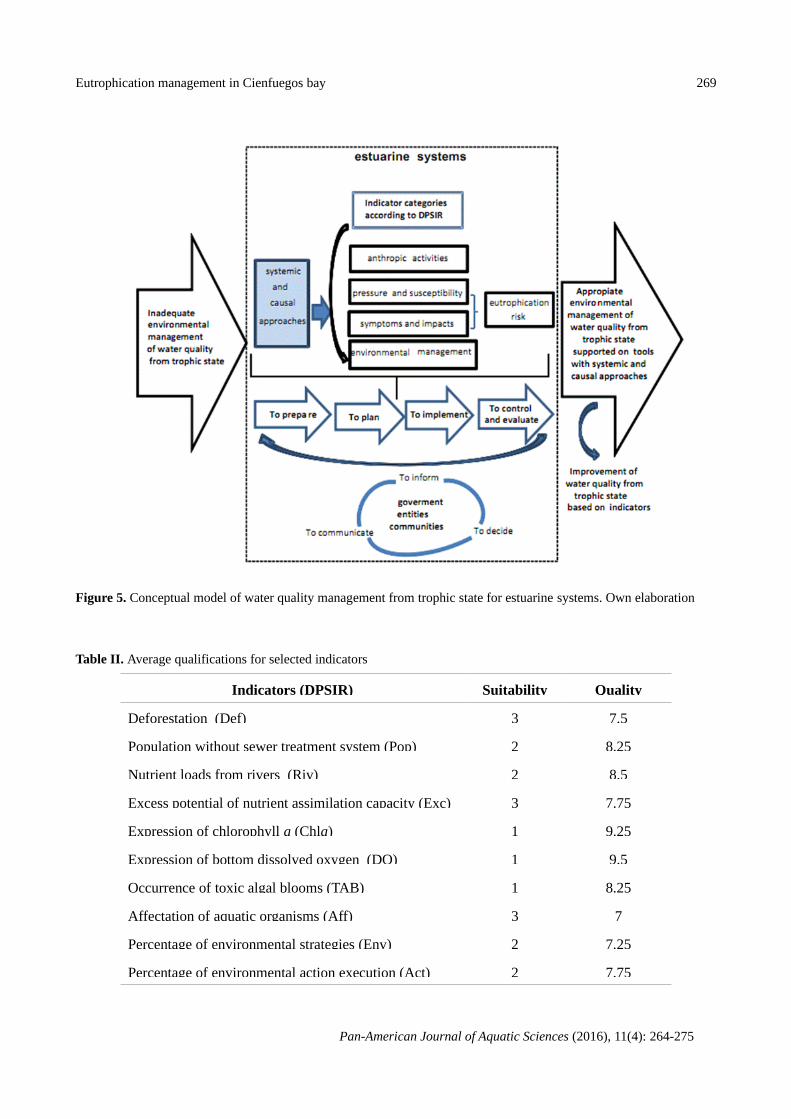
For assessing the environmental impactsrelated to eutrophication, the matrix proposed by Pérez(2013) was considered (Figure 3).
Pan-American Journal of Aquatic Sciences (2016), 11(4): 264-275
Eutrophication management in Cienfuegos bay 267
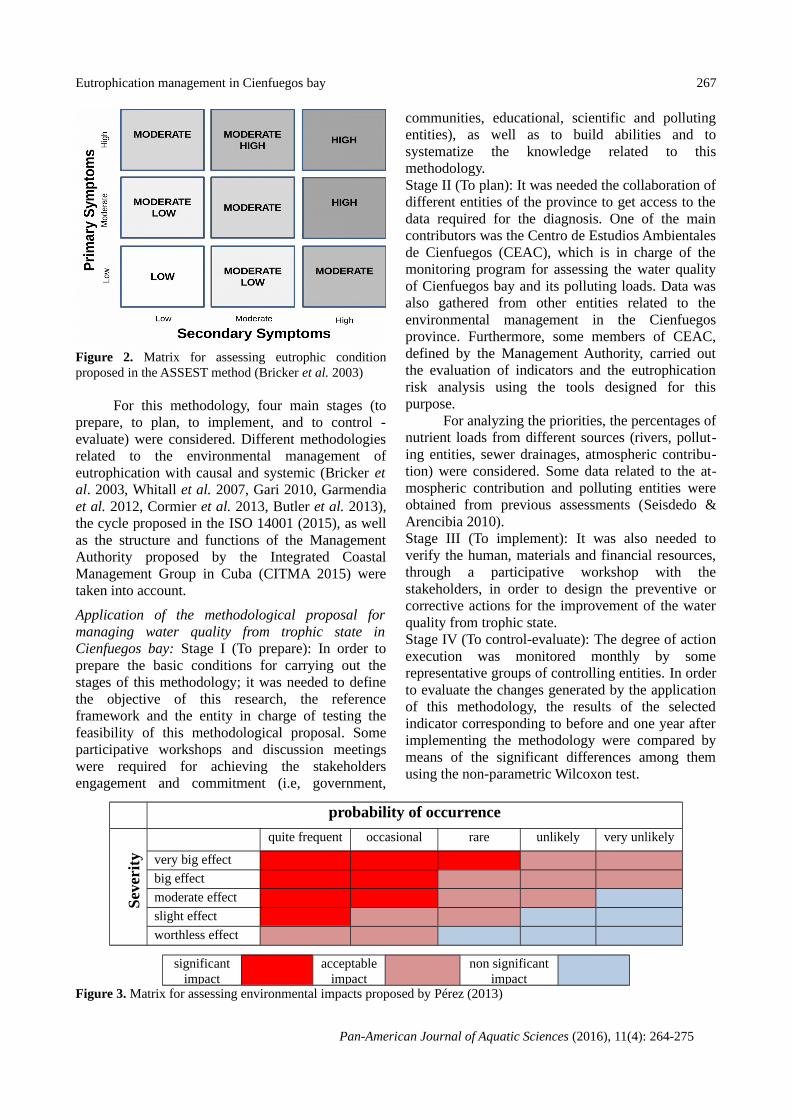
Figure 2. Matrix for assessing eutrophic conditionproposed in the ASSEST method (Bricker et al. 2003)
For this methodology, four main stages (toprepare, to plan, to implement, and to control -evaluate) were considered. Different methodologiesrelated to the environmental management ofeutrophication with causal and systemic (Bricker etal. 2003, Whitall et al. 2007, Gari 2010, Garmendiaet al. 2012, Cormier et al. 2013, Butler et al. 2013),the cycle proposed in the ISO 14001 (2015), as wellas the structure and functions of the ManagementAuthority proposed by the Integrated CoastalManagement Group in Cuba (CITMA 2015) weretaken into account.
Application of the methodological proposal formanaging water quality from trophic state inCienfuegos bay: Stage I (To prepare): In order toprepare the basic conditions for carrying out thestages of this methodology; it was needed to definethe objective of this research, the referenceframework and the entity in charge of testing thefeasibility of this methodological proposal. Someparticipative workshops and discussion meetingswere required for achieving the stakeholdersengagement and commitment (i.e, government,
communities, educational, scientific and pollutingentities), as well as to build abilities and tosystematize the knowledge related to thismethodology.Stage II (To plan): It was needed the collaboration ofdifferent entities of the province to get access to thedata required for the diagnosis. One of the maincontributors was the Centro de Estudios Ambientalesde Cienfuegos (CEAC), which is in charge of themonitoring program for assessing the water qualityof Cienfuegos bay and its polluting loads. Data wasalso gathered from other entities related to theenvironmental management in the Cienfuegosprovince. Furthermore, some members of CEAC,defined by the Management Authority, carried outthe evaluation of indicators and the eutrophicationrisk analysis using the tools designed for thispurpose.
For analyzing the priorities, the percentages ofnutrient loads from different sources (rivers, pollut-ing entities, sewer drainages, atmospheric contribu-tion) were considered. Some data related to the at-mospheric contribution and polluting entities wereobtained from previous assessments (Seisdedo &Arencibia 2010).Stage III (To implement): It was also needed toverify the human, materials and financial resources,through a participative workshop with thestakeholders, in order to design the preventive orcorrective actions for the improvement of the waterquality from trophic state.Stage IV (To control-evaluate): The degree of actionexecution was monitored monthly by somerepresentative groups of controlling entities. In orderto evaluate the changes generated by the applicationof this methodology, the results of the selectedindicator corresponding to before and one year afterimplementing the methodology were compared bymeans of the significant differences among themusing the non-parametric Wilcoxon test.
probability of occurrence
Sev
erit
y
quite frequent occasional rare unlikely very unlikely
very big effect
big effect
moderate effect
slight effect
worthless effect
significantimpact
acceptableimpact
non significantimpact
Figure 3. Matrix for assessing environmental impacts proposed by Pérez (2013)
Pan-American Journal of Aquatic Sciences (2016), 11(4): 264-275

268 M. SEISDEDO ET AL.
Trophic state/ ImpactPressure
Low Moderate HighLow/ Non significant Without risk Without risk With risk
Moderate-Low/ Non significant Without risk With risk With riskModerate/Acceptable With risk With risk With risk
Moderate-High/Acceptable With risk With risk With riskHigh/Significant With risk With risk With risk
Figure 4. Matrix for analyzing the eutrophication risk proposed by Simón et al. (2013)
Testing the feasibility of the proposed methodologyapplication in Cienfuegos bay: The Technique Iadov(López & González 2002) was applied by means ofa questionnaire and the group satisfaction index wasobtained. Thirteen stakeholders, most of members ofAuthority for the environmental management ofCienfuegos bay, were selected considering thepossibilities of offering more information.
Results
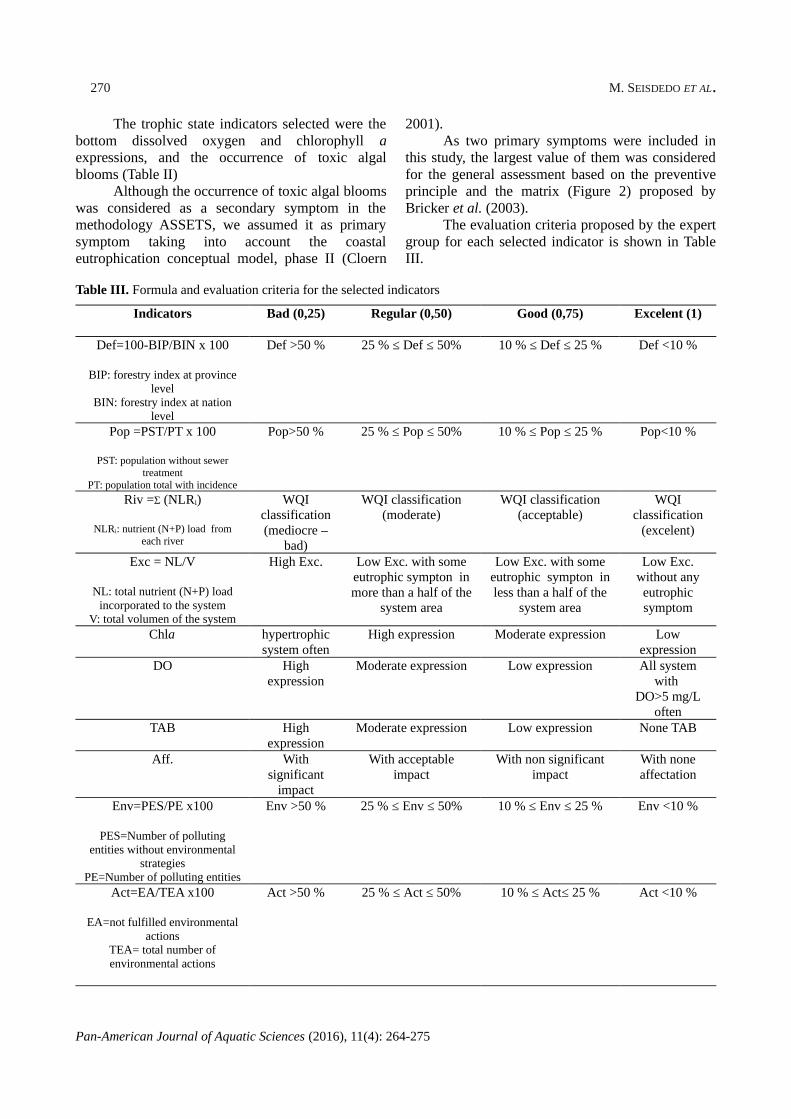
Conceptual model of water quality managementfrom trophic state for estuarine systems: Theprinciples, main characteristics and indicatorcategories selected by the expert group are shown inTable I. These aspects were evaluated as average ofvery necessary and the values of Kendall coefficient(W) and significance obtained (p<0.05) showed anappropriate association degree in the expert criteria.
The model objective is to provide aconceptual framework for the environmentalmanagement, contributing to the improvement ofwater quality from trophic state in Cuban estuarinesystems. Starting from recognizing the inadequateway of managing water quality from trophic state,due to it was not supported on tools with systemicand causal (DPSIR) approaches. Our environmentalmanagement proposal requires the following stages:preparation, planning, implementation and control-evaluation. Moreover, it considers the participativeconception from the analysis and deliberation among
the stakeholders.
Methodological proposal of water qualitymanagement from trophic state for estuarinesystems: For the diagnosis and evaluation tools ofthis methodological proposal, high qualificationswere obtained (larger than 7) in the evaluatedqualities for ten of fourteen indicators proposed.Also, the results from the Vester matrix showed assensitive indicators only those with high qualityvalues and the obtained value of Kendall coefficientwas 0.624 (p<0.05) showing an appropriate degreeof the experts' agreement. The value of coefficientRho of Spearman (0.93) allowed validate theindicators selected (Table II).
The expert group recognized importantsusceptibility aspects and nutrient (nitrogen andphosphorus) loads for the pressure indicator. Thecomparative analysis of the susceptibilities for bothselected Cuban bays showed classificationsModerate-High based on analysis of dilution,exporting and stratification criteria (Cardoso &Carmona 2004). This result allowed considering as abetter pressure indicator the excess potential ofnutrient assimilation capacity including dilutioncapacity and nutrient loads as the proposal (USEPA2001). The Kendall coefficient values showed anappropriate degree of the experts' agreement forselecting this indicator (W=0.56, p<0.05) and fordefining its threshold corresponding high pressurefrom ≥ 10 x 10-8 ton/m3d (W=0.89, p<0.05).
Table I. Principles, model characteristics and indicator categories selected and the results of association degree in theexpert criteria on these aspects.
Aspects Principles Characteristics Indicator categories-Causal approach
-Systemic approach-Continuous improvement
-Based on facts-Participative
-Integrated-Preventive-Relevancy
-Based on context-Logical consistency
-Anthropic activity-Pressure and susceptibility
-Symptoms and impacts-Management actions
Mean 2,05 1,98 2,00W 0,560 0,613 0,571
Sig. 0,000 0,001 0,002
Pan-American Journal of Aquatic Sciences (2016), 11(4): 264-275
Eutrophication management in Cienfuegos bay 269
Figure 5. Conceptual model of water quality management from trophic state for estuarine systems. Own elaboration
Table II. Average qualifications for selected indicators
Indicators (DPSIR) Suitability Quality
Deforestation (Def) 3 7.5
Population without sewer treatment system (Pop) 2 8.25
Nutrient loads from rivers (Riv) 2 8.5
Excess potential of nutrient assimilation capacity (Exc) 3 7.75
Expression of chlorophyll a (Chla) 1 9.25
Expression of bottom dissolved oxygen (DO) 1 9.5
Occurrence of toxic algal blooms (TAB) 1 8.25
Affectation of aquatic organisms (Aff) 3 7
Percentage of environmental strategies (Env) 2 7.25
Percentage of environmental action execution (Act) 2 7.75
Pan-American Journal of Aquatic Sciences (2016), 11(4): 264-275
270 M. SEISDEDO ET AL.
The trophic state indicators selected were thebottom dissolved oxygen and chlorophyll aexpressions, and the occurrence of toxic algalblooms (Table II)
Although the occurrence of toxic algal bloomswas considered as a secondary symptom in themethodology ASSETS, we assumed it as primarysymptom taking into account the coastaleutrophication conceptual model, phase II (Cloern
2001).As two primary symptoms were included in
this study, the largest value of them was consideredfor the general assessment based on the preventiveprinciple and the matrix (Figure 2) proposed byBricker et al. (2003).
The evaluation criteria proposed by the expertgroup for each selected indicator is shown in TableIII.
Table III. Formula and evaluation criteria for the selected indicators
Indicators Bad (0,25) Regular (0,50) Good (0,75) Excelent (1)
Def=100-BIP/BIN x 100
BIP: forestry index at provincelevel
BIN: forestry index at nationlevel
Def >50 % 25 % ≤ Def ≤ 50% 10 % ≤ Def ≤ 25 % Def <10 %
Pop =PST/PT x 100
PST: population without sewertreatment
PT: population total with incidence
Pop>50 % 25 % ≤ Pop ≤ 50% 10 % ≤ Pop ≤ 25 % Pop<10 %
Riv = (NLRi)
NLRi: nutrient (N+P) load fromeach river
WQIclassification(mediocre –
bad)
WQI classification(moderate)
WQI classification(acceptable)
WQIclassification
(excelent)
Exc = NL/V
NL: total nutrient (N+P) loadincorporated to the system
V: total volumen of the system
High Exc. Low Exc. with someeutrophic sympton inmore than a half of the
system area
Low Exc. with someeutrophic sympton inless than a half of the
system area
Low Exc.without anyeutrophicsymptom
Chla hypertrophicsystem often
High expression Moderate expression Lowexpression
DO Highexpression
Moderate expression Low expression All systemwith
DO>5 mg/Loften
TAB Highexpression
Moderate expression Low expression None TAB
Aff. Withsignificant
impact
With acceptableimpact
With non significantimpact
With noneaffectation
Env=PES/PE x100
PES=Number of pollutingentities without environmental
strategiesPE=Number of polluting entities
Env >50 % 25 % ≤ Env ≤ 50% 10 % ≤ Env ≤ 25 % Env <10 %
Act=EA/TEA x100
EA=not fulfilled environmentalactions
TEA= total number ofenvironmental actions
Act >50 % 25 % ≤ Act ≤ 50% 10 % ≤ Act≤ 25 % Act <10 %
Pan-American Journal of Aquatic Sciences (2016), 11(4): 264-275

Eutrophication management in Cienfuegos bay 271
Application of the methodological proposal formanaging water quality from trophic state inCienfuegos bay: Stage I (To prepare): The defined general objectiveconsisted on developing an effective environmentalmanagement of water quality from trophic state inCienfuegos bay. Then, it was achieved thecommitment of all members of the ManagementAuthority of Cienfuegos bay, which is representedby the stakeholders (government, communities,educational, scientific and polluting entities)working systematically since 2013. Consequently,participative workshops were the way used todevelop the abilities required for carrying out themethodology, where the set of indicators were alsotransferred to the implicated stakeholders.Stage II (To plan): The diagnosis was carried outusing the data obtained:
The calculation of the pressure indicator basedon the excess potential of the nutrient assimilationcapacity was 0.9 x 10⁻⁸ ton/m3d before applying themethodology, which showed a not high pressure.
The results for the chlorophyll a concentrationcorresponding to period 2009-2013 (before applyingthis methodology) showed moderated and lowexpressions for rainy and dry seasons, respectively,according to the criteria in ASSETS method (Brickeret al. 2003).
The results of dissolved oxygen concentrationat bottom corresponding to the same period, showedlow expressions in both seasons although thehypoxic level was obtained with periodic frequencyin the rainy season.
Besides, it was reported a red tide composedby the toxic dinoflagellate Heterocapsacircularisquama in June/2009, occurring in ashallow area close to sewage effluents, associated toa small fish death event (Moreira et al. 2014).
The previous analyses generatedclassifications of trophic state Moderate-Low forrainy season, and Low for dry season according tothe matrix proposed (Figure 2). However, the impactwas evaluated acceptable according to the matrixproposed by Pérez (2013), taking into account thelow probability of occurrence and the severity asslight.
From the proposed tool for analyzing theeutrophication risk, Cienfuegos bay was classifiedwith risk, although the pressure indicator was nothigh and the trophic state was not eutrophic. Thisresult justified the necessity of an effectiveenvironmental management plan, related to watereutrophication from the preventive point of view.
The results from the diagnosis and analysis ofthe main nutrient contributions were shared with thestakeholders through a participative workshop. Theanalysis of the nutrient loads showed the highestcontribution from the rivers (75%) and some of them(Caunao, Inglés, Damují) were identified as the mainnutrient sources. It was also identified the directdrainage contribution from Cienfuegos city assecond nutrient source (21 %).Stage III (To implement): The priority and resourcesanalysis with the stakeholders allowed designingpreventive actions to avoid the further detriment ofthe water quality from trophic state.
This stage included the implementation of theactions defined in the general action plan for thisenvironmental management.Stage IV (To control and evaluate): After one year ofimplementing this methodology, the value ofindicator related to environmental action executionincreased from 68% to 77%. This increase was incorrespondence with the increment of indicatorrelated to environmental strategies of pollutingentities from 52% to 83%.
The nutrient load incorporated from riversdecreased 310 ton/year, generating a positive changeon the water quality according to the result of WQI.This index showed improvement of water qualitybased on a change from mediocre to acceptablequality in the rainy season, when is greater the waterquality detriment (Figure 6). This water qualityimprovement generated a change of nutrient loadindicator evaluation from regular to very good.
Figure 6. Results of Water Quality Index (WQI) beforeand after implementing the proposed methodology
This nutrient load reduction also generated adecrease of pressure indicator value from 0.9 to 0.85x 10⁻⁸ ton/m3d. As this last value is below the
Pan-American Journal of Aquatic Sciences (2016), 11(4): 264-275

272 M. SEISDEDO ET AL.
proposed threshold, the pressure was not consideredhigh. Although the deforestation indicator valueshowed a slight decrease of 0.52%, it was stillevaluated as regular.
The state indicators based on chlorophyll aand bottom dissolved oxygen expressions wereclassified as low for both seasons (rainy and dry).We did not identify any toxic algae blooms. Neitherdid we find any associated harms to aquaticorganisms.
The comparative analysis of the indicatorresults before and one year after implementing themethodology showed a favorable change in 80% ofthe indicators and the other did not decrease (Figure7). Besides, the results of non-parametric test(Wilcoxon) showed significant difference among theindicator’s results (p<0.05).
Figure 7. Indicator results before and after implementingthe proposed methodology.
Testing the feasibility of the proposed methodologyapplication in Cienfuegos bay: One year afterimplementing this methodology, the groupsatisfaction index value was 0.69.
DiscussionIn this case, the nitrogen and phosphorus were
considered because this system shows seasonal andspatial variability on the limiting nutrient (Seisdedoet al. 2011), as proposed some eutrophicationmanagement strategies in estuarine systems (Conleyet al. 2009, Savage et al. 2010).
The results of priority analysis allowedcarrying out different campaigns by the work groupsfor identifying problems in the basins with morenutrient contributions and for proposing the requiredactions.
The slight changes obtained from the indicatorresults related to deforestation and population withsewer treatment system showed the need to increasethe investments in both aspects. Despite of the shortperiod of testing this methodology, we couldappreciate the notable investments required in orderto achieve significant changes in both indicators, andthe search of financial funds through internationalprojects was also considered.
It was recognized by the ManagementAuthority as one important achievement ofapplication of this methodology, also the increase ofcommunication and educational actions in thenearby communities. However, it is needed tocontinue working on the community engagement inall the stages of this methodology.
On the other hand, it was considered the needof evaluating the effectiveness of the environmentalactions of the main polluting entities with theimplementation of the new regulation of CITMA(2014) for controlling the emission of pollutingloads.
The group satisfaction index value showed theacceptance of this methodological proposal and itsutility for the improvement of water quality fromtrophic state.
ConclusionsThe conceptual model and the methodology of
this environmental management offered a way toimprove the water quality from trophic state inCuban estuarine systems based on the couple of theeutrophication risk analysis and systemic and causalapproaches. Also, the methodological proposalallowed to guide appropriately the actions ofenvironmental management and to evaluate itseffectiveness in Cienfuegos bay.
The proposed tools for the diagnosis andevaluation stages allowed identifying the necessityof managing the eutrophication in Cienfuegos bayfrom preventive point of view and testing itsfeasibility as a tool for managing this environmentalproblem in estuarine systems with similarcharacteristics.
AcknowledgmentsWe are very grateful to the Management Au-
thority working on the improvement of water qualityin Cienfuegos bay for its important contribution andwe thank the anonymous reviewers for providinghelpful comments and suggestions on the manu-script.
Pan-American Journal of Aquatic Sciences (2016), 11(4): 264-275

Eutrophication management in Cienfuegos bay 273
ReferencesAlves, G., Flores, M., Gaspar, F., Gomes, J. &
Feitosa, F. 2013. Eutrophication and waterquality in a tropical Brazilian estuary.Journal of Coastal Research, Special Issue:7-12
Bravo, M. & Arrieta, J. 2005. El Método Delphi. Suimplementación en una estrategia didácticapara la enseñanza de las demostracionesgeométricas. Revista Iberoamericana deEducación, 3 (5): 75-96.
Bricker, S. B., Ferreira, J. G. & Simas, T. 2003. Anintegrated methodology for assessment ofEstuarine Trophic Status. EcologicalModelling, 169: 39-60
Butler, E. C. V., Streten-Joyce, C., Tsang, J. J.,Williams, D. K., Alongi, D. M., Furnas, M.J.& McKinnon, A. D. 2013. A procedure forevaluating the nutrient assimilative capacityof Darwin Harbour. Aquatic Health Unit, NTDepartment of Land Resource Management.Australian Institute of Marine Science, 44.
Cardoso da Silva, M. 2002. Caracterização deestuarios: Proposta de metodologia paradefinição de domínios de integração espacial etemporal de variáveis. Congresso da Água,APRH.
Cardoso, M. & Carmona, A. 2004. EnvironmentalIndicators as tools for the management ofestuaries-Methodology and the case study ofthe Tejo Estuary. Journal of CoastalConservation, 10: 13-24
CCME. 2001. Recommandations canadiennes pourla qualité des eaux: Indice de qualité des eauxdu CCME 1.0: Manuel de l’utilisateur, dansRecommandations canadiennes pour la qualitéde l’environnement, 1999, Winnipeg.
CITMA. 2014. Resolución 223. Aprobación delReglamento del control administrativo defuentes contaminantes generadoras deresiduales líquidos y sólidos. Ministerio deCiencia, Tecnología y Medio Ambiente. Cuba
CITMA. 2015. Proyecto de resolución para laimplementación del Manejo IntegradoCostero. Ministerio de Ciencia, Tecnología yMedio Ambiente. Cuba
Cloern, J. E. 2001. Our evolving conceptual modelof the coastal eutrophication problem. MarineEcology Progress Series, 210: 223-253
Conley, D. J., Humborg, C. L. & Rahm, O. 2009.Ecology: Controlling eutrophication: Nitrogenand phosphorus. Science, 323: 1014–1015
Cook, P. L., Holland, D. P. & Longmore, A. R. 2010.
Effect of a food event on the dynamics ofphytoplankton and biogeochemistry in a largetemperate Australian lagoon. Limnology andOceanography, 55(3): 1123-33
Cormier, R., Kannen, A., Elliott, M., Hall, P. &Davies, I. M. 2013. Marine and coastalecosystem-based risk management handbook.ICES Cooperative Research Report (317).
De Jonge, V. N., Pinto, R. & Turner, R. K. 2013.Integrating ecological, economic and socialaspects to generate useful managementinformation under the EU Directivesecosystem approach. Ocean & CoastalManagement, 68: 169-188
García, D. 2013. Metodología de gestión ambientalpara agroecosistemas con probables riesgos ala salud por presencia de contaminaciónquímica. Tesis en opción al título de Doctoren Ciencias Técnicas. Instituto Superior deTecnologías y Ciencias Aplicadas. LaHabana.
García, L. & Fernández, S. 2008. Procedimiento deaplicación del trabajo creativo en grupos deexpertos. Ingeniería Energética, 29(2): 46-50.
Gari, S. R. 2010. The use of DPSIR and SAF for themanagement of eutrophication in the RiaFormosa. MSc Thesis. University of Algarve,Portugal.
Garmendia, M., Bricker, S., Revilla, M., Borja, A.,Franco, J., Bald, J. & Valencia, V. 2012.Eutrophication assessment in Basqueestuaries: comparing a North American and aEuropean method. Estuaries and Coasts, 35:991-1006.
Gómez, L., Díaz, U., Fernández, A., Licea, Y. &Álvarez, I. 2006. Floraciones algales nocivasen la bahía de Santiago de Cuba. IV TallerInternacional Contaminación y Protección delMedio Ambiente, CONYMA.
Helguera, Y.; Díaz-Asencio, L.; Fernández-Garcés,R.; Gómez-Batista, M.; Guillén, A.; Díaz-Asencio, M. & Armenteros, M. 2011.Distribution patterns of macrofaunalpolychaete assemblages in a polluted semi-enclosed bay: Cienfuegos, Caribbean Sea.Marine Biology Research, 7(8):757-768
Herrera-Silveira, J.A., Morales-Ojeda, S. M. &Cortes-Balan, T. O. 2011. Eutrofización en losecosistemas costeros del Golfo de México:V.1. SEMARNAT-NOAA-GEF-UNIDO. 88pp.
ISO 14001. 2015. Sistemas de gestión ambiental.
Pan-American Journal of Aquatic Sciences (2016), 11(4): 264-275

274 M. SEISDEDO ET AL.
Requisitos con orientación para su uso.Traducción oficial
Legendre, P. 2005. Species Associations: TheKendall Coefficient of ConcordanceRevisited. Journal of Agricultural,Biological and Environmental Statistics,10(2): 226–245
López, A. & González, V. 2002. La técnica deIadov. Una aplicación para el estudio de lasatisfacción de los alumnos por las clases deEducación Física. Revista Digital Lecturas:Educación Física y Deporte [en línea], 47.Buenos Aires, Argentina. Disponible en:http://www.efdeportes.com
López-Cortés, D. J., Gárate, I., Bustillos, J. J.,Alonso, R. & Murillo, I. 2003. Variabilidaddel estado trófico y la biomasa delfitoplancton en la Bahía Concepción, Golfo deCalifornia (1997-1999). Hidrobiología,13(003): 195-206.
Loza, S., Moreira, A., Comas, A., Sánchez, M.,Carmenate, M., Álamo, B., Dobal, V.,Montalvo, J., García, I., Lorenzo, S., Arriaza,L., Hernández, M., Montesinos, D., Gutiérrez,J. & Alcolado, P. 2013. A Phaeocystis bloomin Cuban Archipelago. Harmful Algae News,47: 20-21.
Montalvo, J. F., García, I. A., Almeida, M.,Betanzos, A. & García, N. 2014. Modelaciónde la eutroficación e índice de calidad delagua en algunas bahías del archipiélagoSabana Camagüey. Tecnología Química,XXXIV (3) sep-dic.: 184-196.
Moreira, A., Armenteros, M., Gómez, M., León, A.,Cabrera, R., & Castellanos, M. 2006. Varia-tion of Macroalgae Biomass in CienfuegosBay, Cuba. Revista de Investigaciones Mari-nas, 27(1): 3–12.
Moreira, A., Seisdedo, M., Muñoz, A., Comas, A. &Alonso, C. 2014. Spatial and temporaldistribution of phytoplankton as indicator ofeutrophication status in the Cienfuegos Bay,Cuba. Journal of Integrated Coastal ZoneManagement, 4 (3): 597-609
Muñoz, A., Douillet, P., Díaz-García, O., Fichez, R.,Herrera, R. H., Alcántara-Carrió, J. & García-Rodríguez, A. 2012. Flushing time in theCienfuegos Bay. Natural ResourceModeling, 25 (3): 434–455.
Nixon, S. W. 2009. Eutrophication and the macro-scope. Hydrobiología, 629: 5–19.ONEI. 2012. Censo de población y viviendas.
Informe nacional. Oficina Nacional de
Estadística e Información. República de Cuba.Pérez, M., García, E. & Simón, Y. 2008. Sistema de
información geográfica para el manejo de lasfuentes contaminantes puntuales de la bahíade La Habana. Transporte, Desarrollo yMedio Ambiente, 28 (1): 38-42
Pérez, W. 2013. Modelo de gestión integrada de lacalidad y del medio ambiente en los órganoscubanos de gobierno local. Tesis en opción algrado científico de Doctor en CienciasTécnicas. Instituto Superior de Tecnologías yCiencias Aplicadas. La Habana
Reyes, T. T. 2008. Niveles de eutrofización en lasbahías de La Habana, Mariel, Matanzas,Cárdenas y Puerto Padre, Cuba. Tesis dediploma. Universidad de La Habana.
Savage, C., Leavitt, P. R. & Elmgren, R. 2010.Effects of land use, urbanization, and climatevariability on coastal eutrophication in theBaltic Sea. Limnology and Oceanography,55(3): 1033-1046.
Schernewski, G., Neumann, T., Stybel, N., Behrendt,H. & Fenske, C. 2009. Coastal eutrophicationmanagement: Lessons learnt from long-termdata and model simulations. Coastal Changein the southern Baltic Sea Region CoastlineReports, 12: 101-111.
Seisdedo, M. & Arencibia, G. Estimación de lascargas contaminantes de nutrientes en la bahíade Cienfuegos. Transporte, Desarrollo yMedio Ambiente, 33 (1): 33-37.
Seisdedo, M., Morales, Y. & Arencibia, G. 2011.Análisis de la respuesta de la bahía deCienfuegos a las concentraciones de losnutrientes. Revista Cubana deInvestigaciones Pesqueras, 28(2): 27-33.
Seisdedo, M. & Muñoz, A. 2013. Análisis de unÍndice de calidad de las aguas para sistemasestuarinos. Caso de estudio: Bahía deCienfuegos. Transporte, Desarrollo y MedioAmbiente, 33, 1(68): 18-23.
Seisdedo, M., Moreira, A. R., Comas, A. A. &Arencibia, G. 2014. Analysis of tools fortrophic status assessment of water inCienfuegos bay, Cuba. Pan-AmericanJournal of Aquatic Sciences, 9(2):103-111.
Simón, J. C., García, R., del Barrio, G., Ruiz, A.,Márquez, S. & Sanjuán, M. E. 2013. Diseñode una metodología para la aplicación deindicadores del estado de conservación de lostipos de hábitat de interés comunitario enEspaña. Ministerio de Agricultura,Alimentación y Medio Ambiente. España
Pan-American Journal of Aquatic Sciences (2016), 11(4): 264-275

Eutrophication management in Cienfuegos bay 275
USEPA. 2001. Nutrient Criteria Technical GuidanceManual. Estuarine and Coastal Marine Waters.In U.S. Environmental Protection Agency.Office of Water 4304. No. EPA-822-B-01-003
Vollenweider, R. A., Giovanardi, F., Montanari, G. &Rinaldi, A. 1998. Characterization of theTrophic Conditions of Marine Coastal Waterswith Special Reference to the NW AdriaticSea: Proposal for a Trophic Scale, Turbidityand Generalized Water Quality Index.Environmetrics, 9: 329-357.
Whitall, D., Bricker, S., Ferreira, J., Nobre, A. M.,
Simas, T. & Silva, M. 2007. Assessment ofEutrophication in Estuaries: Pressure–State–Response and Nitrogen SourceApportionment. EnvironmentalManagement, 40: 678–690.
Zaldivar, J. M., Cardoso, A. C., Viaroli, P., Newton,A., de Wit, R., Ibanez, C., Reizopoulou, S.,Somma, F., Razinkovas, A., Basset, A.,Holmer, M. & Murray, N. 2008.Eutrophication in transitional waters: anoverview. Transitional Waters Monographs,1: 1–78.
Received: March 2016Accepted: October 2016Publiched: January 2017
Pan-American Journal of Aquatic Sciences (2016), 11(4): 264-275