too late? too little - wisconsin hope lab · amount of mathematical calculation required ... often...
TRANSCRIPT

Too Late? Too Little: The Timing of Financial Aid Applications
Russell Cannon &
Sara Goldrick-Rab
June 2016
Acknowledgments: The research reported here was supported by a grant from the
Great Lakes Higher Education Guaranty Corporation, provided via a gift to the
Wisconsin HOPE Lab. Findings and conclusions in the paper are the responsibility of
the authors and do not necessarily represent the official views of the supporting agency.

2
Introduction
The Free Application for Federal Student Aid (FAFSA) plays a critical role in
access to higher education, especially for students from low- and middle-income
families. Whether from the federal government, states, or individual institutions, the
FAFSA is the gateway through which need-based financial aid flows, and there is a
documented connection between grant aid and college success (Goldrick-Rab, Kelchen,
Harris & Benson, 2016; Novak and McKinney, 2011; King, 2004; Cochrane, 2007). This
is why there is a national push for all students to file the FAFSA. In the last year,
President Obama took action to make it easier to file the FAFSA by allowing information
on income and assets to come from year-old rather than most recent tax returns (The
White House, 2016; NACAC, 2016). This reform is intended to increase both the number
of filers and the timeliness of filing (Hopkins, 2014).
When a FAFSA is filed matters. While federal Pell Grants are awarded as long as
the FAFSA is filed by the summer following the funded academic year, most state and
institutional grants have limited funding and specific deadlines that fall more than a year
earlier. If students file after these deadlines, or if funding runs out before they file, they
receive less aid. This study uses new data to describe the prevalence of such “under-
filing.” We estimate that 46% of Pell Grant recipients living in states with deadlines or
known suspension dates for need-based grants under-file the FAFSA, submitting the
form after those deadlines have passed.
Why Under-Filing the FAFSA Is a Problem
The price of higher education is at an all-time high; between 2000 and 2015, the
cost of attendance at public four-year colleges rose nearly fifty-three percent in inflation-
3
adjusted dollars (Baum and Ma, 2014). This increase coincided with drastic reductions in
state appropriations to higher education during the most recent recession. Although state
support has been “on the rise” since 2013, the magnitude of the record funding
decreases between 2009 and 2012 paired with a growing number of students attending
postsecondary education has meant that per-student funding from states remains more
than 15% below pre-recession levels ($6,966 in 2015 vs. $8,220 in 2009 and $8,868 in
2000 in constant dollars) (Wexler, 2015; Carlson and Laderman, 2015). This same
period has also seen a significant decline in median household income, from $57,724 in
2000 to $53,657 in 2014 (Federal Reserve Bank of St. Louis, 2015). Together, these
factors combine to make need-based grants an increasingly vital mechanism for
ensuring access to college for students from low- and middle-income families.
Obtaining grants is not easy, however. One reason is that with few exceptions, the
federal government, states, and most public institutions require the annual completion and
timely submission of the Free Application for Federal Student Aid, or FAFSA. Completion
of the FAFSA is a complex process that research has shown to create barriers to both
college access and college persistence (King, 2006; Dynarski and Scott-Clayton, 2006;
Bettinger et al., 2009; Bird and Castleman, 2014; Novak and McKinney, 2011; Goldrick-
Rab, 2016). Students struggle with the difficulty of specific steps of the process as well as
with planning and motivation. In addition to the policies associated with federal aid,
students must also understand policies specific to their state and institution, creating
opportunities for confusion and under-informed decision-making.
Though piecemeal improvements have been made to the FAFSA in recent years,
its remaining complexities are well documented and include the length of the form, the
number of separate sources needed, the difficulty of obtaining those sources, and the

4
amount of mathematical calculation required (Dynarski and Wiederspan, 2012; Bettinger
et al., 2009; Wisconsin HOPE Lab, 2015; Dynarski and Scott-Clayton 2006). Challenges
arising from intermediate filing deadlines have not been as well explored, perhaps in part
because the deadlines and their impacts occur at the state and institution level and, as
such, cannot be adequately explored using the large federal datasets currently available
to researchers.
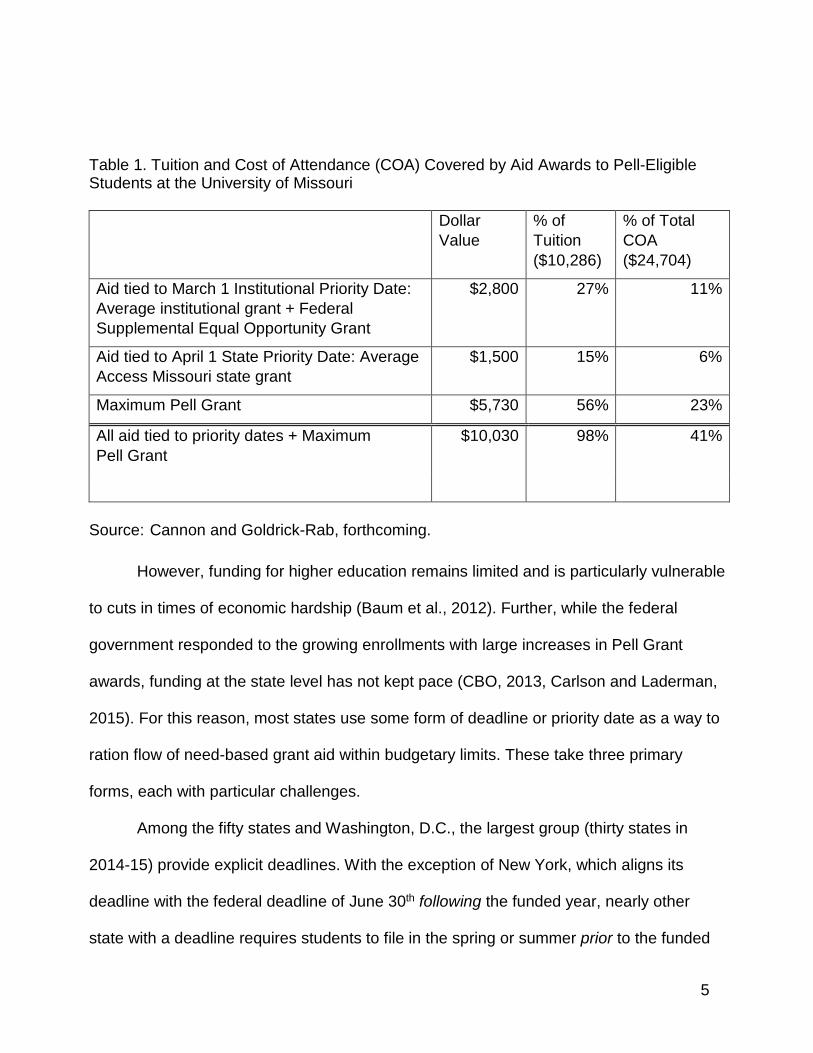
Grants appear to be an increasingly preferred strategy among states for distributing
funding to higher education. Despite the decline in state appropriations to postsecondary
institutions from $85 billion to $79 billion between 2008 and 2011, funding for state grant
aid actually increased, from $8.4 billion to $9.2 billion. While the average need-based
award varies by state, for eligible students the combination of state and institutional grant
aid can account for more than half of their total grant aid package. A recent study on
financial aid outreach at the University of Missouri provides an example of the relative
contributions of institutional, state, and federal grant aid towards total tuition and cost of
attendance (Table 1) (Cannon and Goldrick-Rab, forthcoming).
5
Table 1. Tuition and Cost of Attendance (COA) Covered by Aid Awards to Pell-Eligible Students at the University of Missouri
Dollar Value
% of Tuition ($10,286)
% of Total COA ($24,704)
Aid tied to March 1 Institutional Priority Date: Average institutional grant + Federal Supplemental Equal Opportunity Grant
$2,800 27% 11%
Aid tied to April 1 State Priority Date: Average Access Missouri state grant
$1,500 15% 6%
Maximum Pell Grant $5,730 56% 23%
All aid tied to priority dates + Maximum Pell Grant
$10,030 98% 41%
Source: Cannon and Goldrick-Rab, forthcoming.
However, funding for higher education remains limited and is particularly vulnerable
to cuts in times of economic hardship (Baum et al., 2012). Further, while the federal
government responded to the growing enrollments with large increases in Pell Grant
awards, funding at the state level has not kept pace (CBO, 2013, Carlson and Laderman,
2015). For this reason, most states use some form of deadline or priority date as a way to
ration flow of need-based grant aid within budgetary limits. These take three primary
forms, each with particular challenges.
Among the fifty states and Washington, D.C., the largest group (thirty states in
2014-15) provide explicit deadlines. With the exception of New York, which aligns its
deadline with the federal deadline of June 30th following the funded year, nearly other
state with a deadline requires students to file in the spring or summer prior to the funded

6
year.1 On average, state deadlines fall more than four hundred days before the federal
deadline (see Table 2) and often do not align with institutional aid deadlines, creating
communication challenges and increased complexity. States with deadlines typically
commit to provide aid to all students filing before the deadline. Total funding dedicated to
student aid is often set in advance, leading these states to reduce average award
amounts if applicants exceeds budgeted estimates.
A second set of states guide students to apply “as soon as possible after January
1,” referring to the January preceding the funded year, the first day students are able to
apply. This new form of guidance has arisen in only the past five years and has now been
adopted by six states.2 In these states, there is often a set pool of dollars and need-
based grant aid is allocated until this pool is exhausted. Among the states with this policy,
Illinois is the only state that publishes its “depletion” or “suspension” date, the date at
which further applications are no longer funded without appeal. Since the inception of the
policy, the depletion date has moved progressively earlier each year; in 2014-15 it fell on
February 28, a date that falls before most state deadlines. While Illinois provides the
previous year’s depletion date to applicants as well as a projection of the depletion date
for the coming year, the other states with this policy do not appear to provide this
additional guidance (ISAC, 2016). As a result, students must file without knowing their
likelihood of receiving state aid, or may incorrectly assume that federal or institutional
deadlines are their best guides (Feeney and Heroff, 2013). In these states, if more
students file than anticipated, the funds are exhausted earlier.
Finally, fifteen states provide students with guidance to “check with your financial
1 Ohio and Minnesota have deadlines in October of the funded year. 2 Illinois was the first state to adopt this filing guidance for the 2010-2011 FAFSA.

7
aid administrator.” Often in these states, aid awards are disbursed by the state to
individual institutions or institutional sectors within the state. Those institutions may then
follow a policy of either setting deadlines, and, like the first set of states, adjusting award
amounts based on the date of application or, like the second set of states, offer aid on a
rolling deadline until it is depleted. Recent research by the Wisconsin HOPE Lab provides
an illustrative example with the Wisconsin Grant. Funds for the grant are dispensed
separately to the state’s tribal colleges, technical colleges, private non-profit colleges, and
the campuses of the University of Wisconsin; each then dispenses the funds to aid
applicants on a rolling basis until the funds are exhausted. Each sector sets separate
eligibility requirements and runs out of dollars at different dates (Anderson and Goldrick-
Rab, 2016). Other states, such as Arizona, allow individual institutions to determine
distribution policies, which may include either institution-level deadlines or a rolling
deadline that continues until funds are exhausted (Osborn, 2014). While these policies
provide more institutional discretion, they also complicate communication to students
about the implications of when they file.
In many ways these latter two sets of policies may be the most challenging to
students because they provide the least amount of information to filers and may have the
earliest effective deadlines. That same complexity extends to research; it is impossible to
examine exactly how many eligible students do not receive aid in these states. An
analysis of students who miss filing deadlines in states where they are explicit, then, may
significantly under-estimate the number of students missing effective filing deadlines in
states with guidance to files “as soon as possible after January 1” or “check with your
financial aid administrator.” Similarly, nearly all institutions maintain separate deadlines for
institutional aid that often fall even earlier than state deadlines. A recent study at the

8
University of Missouri found that while a sixth of eventually filing Pell-eligible students filed
after an April 1 state deadline, more than a third missed an earlier March 1 institutional
deadline (Cannon and Goldrick-Rab, forthcoming).
Figure 1 below illustrates the distribution of these policies across the states as of
2014-15. Because gathering final tax information has been cited as a challenge to filing
(Wisconsin HOPE Lab, 2015), states with deadlines are broken out to highlight those with
filing deadlines before April 15 (the federal tax filing deadline that year) and those with
deadlines on or after 4/15.
Figure 1. FAFSA Filing Guidance Provided to Students in 2014-15, by State
State deadline policies have also become more challenging for students. A
comparison of state FAFSA filing guidance for 2014-15 with the official guidance from
2004-05 reveals that of the fifty states and Washington D.C., four states have added
9
deadlines since 2004 (USDOE, 2003; USDOE, 2013). Six states that already had
deadlines moved their deadlines to an earlier date while five states moved their deadlines
to a later date. However, an additional six states switched to a policy of encouraging
students to file “as soon as possible after 1/1,” a form of guidance that was not provided at
all in 2004-05; as noted above, this shift adds a greater level of uncertainty for students
and may result in actual cutoff dates that are earlier than most published state deadlines.
This suggests that, while not universal, there has been a general trend towards adding
deadlines or moving deadlines earlier, putting more students at risk for loss of aid from
filing after these cutoffs. Figure 2 illustrates these shifts in policy and Table 2 notes the
shift towards earlier filing deadlines among those states with deadlines, both as a raw
average across states and weighted based upon the number of filers in each state in
2014-15. While limited, state-level analysis from Illinois and Wisconsin suggests that in
states that dispense aid on a rolling basis funding is exhausted (either at the state level or
by individual institutions), there has been a similar if not more accelerated pattern of
running out of aid earlier each year (Anderson and Goldrick-Rab, 2016).

10
Figure 2. Shifts between 2004-05 and 2014-15 in State Aid Deadline Policy, by Number of States
Table 2. Average State Deadline and Number of Days Before Federal Deadline 2004-05 2014-15
Average Date May 22nd April 23rd
Average Date (Weighted) June 9th May 23rd
Average Days before Federal Deadline 403.87 432.11
Average Days before Federal Deadline
(Weighted)
385.03 402.89
Studies of single programs and qualitative studies suggest that large numbers of
students may miss intermediate deadlines and priority dates tied to state and institutional
need-based aid, even though they eventually file (Cochrane, 2007; Lamanque, 2009;
Feeney and Heroff, 2013). However, attempts to gauge the scale of the issue at the
national level have been limited by the use of datasets not well suited to the analysis and
methodological decisions of the authors.
King’s widely-cited 2004 study examined a descriptive analysis of filing data from

11
the National Postsecondary Student Aid Survey (NPSAS) 1999-2000 and used April 1 as
a proxy for state financial aid deadlines; King writes that “in most states [the state priority
deadline] is April 1” (7). Yet while the majority of states and Washington D.C. have
specific deadlines prior to the federal deadline, only one state, Missouri, had a deadline of
April 1 in the year of King’s data sample (USDOE, 1998). Using King’s methodology,
students missing deadlines in states with deadlines falling before 4/1 are counted as “on-
time” filers if they file before 4/1, while students in states with deadlines that fall after the
1st who file after 4/1 but before the state deadline will be counted as missing the deadline.
Novak and McKinney’s recent attempt to update King’s findings uses the Beginning
Postsecondary Study (BPS 04/09), and, thus, necessarily focuses only on first-time filers.
The authors attempt to be more exact than King by taking into account specific state
deadlines, although because BPS only provides the month of filing the authors use the
“conservative” approach of setting the cutoff as the month following the deadline for the
deadlines occurring after the first of the month (2015). Both King and Novak and
McKinney’s studies include all students who file a FAFSA, even though many of these
students would not meet the low-income eligibility requirements for need-based aid. Most
importantly, both NPSAS and BPS are representative nationally but not at the state level3,
and so are not appropriate sources for examining trends and subgroup variation in
policies that occur at the state level (Riccobono et al., 2002; Wine et al., 2011).
Because the term “late-filing” is sometimes used in the financial aid profession to
describe students who attempt to file after the final federal deadline, in this paper we
adopt the term “under-filing” to describe students who file the FAFSA in time to receive
3 BPS 04/09 was constructed to be representative at the state level for 12 states, but McKinney and Novak do not limit their analysis to these states.

12
federal aid but after deadlines for institutional or state grant aid for which they would have
otherwise been eligible. The primary goal of this paper is to examine the extent of under-
filing nationally, relative to state deadlines. We also seek to examine variation in rates of
under-filing among different groups of students.
While limited, the existing research on non-filing and under-filing behavior suggests
that they occur most frequently among already disadvantaged students, including those
who identify as underrepresented racial or ethnic minorities4, have no parent with a four
year degree (“first generation”), or hail from low-income families (Feeney and Heroff,
2013; LaManque, 2009). These same students are more likely to drop-out of higher
education and to take longer to graduate (Pascarella, Pierson, Wolniak, & Terenzini,
2004; Sirin, 2005). Non-filing rates also appear highest among students at community
colleges, which often have fewer supports (Bird and Castleman, 2014; Feeney and Heroff,
2013; LaManque, 2009).
Estimating Under-Filing the FAFSA
How many students miss out on grant aid because they under-file? While
interventions such as nudging via text-message are being put into place to tackle this
problem (Castleman and Page, 2016; Cannon, forthcoming), and the recent “prior-prior
year” reform is intended to address it (White House, 2016), the scope of the challenge has
not been quantified. However, the U.S Department of Education’s Office of Federal
Student Aid (FSA) collects student-level FAFSA filing data. While summarized versions of
filing trends have been made available at the state and high school level at arbitrary
4 Under-represented minority is typically defined as students who identify as either Hispanic, Black, or Native American (alone or in combination with other races/ethnicities).

13
dates, these disclosure dates have not aligned with state filing deadlines that would allow
for state-level analysis, and student-level information that would allow for subgroup
analysis is not typically made available to researchers. Therefore, in August 2015 we
submitted a Freedom of Information Act request to the Office of Federal Student Aid
requesting the 2014-15 on-time filing rates of Pell-eligible students.
Students in this sample met the following criteria: (a) submitted a FAFSA for
attendance in the fall of 2014/15, (b) were Pell eligible5 and (c) reported a state of legal
residence as one of the thirty-one states with a filing deadline or known cutoff date in that
cycle. Filing “on-time” was defined as filing by or before the date of the deadline, with all
students filing after the deadline coded as under-filers. For states listing multiple
deadlines, the earliest deadline associated with a major need-based aid program was
selected as the cutoff date.
This analysis addresses several of the challenges faced by previous attempts to
quantify under-filing. First, because the source data is at the individual level and includes
the exact filing date, the analysis is able to examine the actual filing date relative to the
actual state deadline (or the closest possible approximation). Second, the sample includes
a broader range of students than Novak and McKinney’s (which only examined first-year
students), while also focusing on the sub-group of students most likely to be eligible for
need based aid. Finally, by analyzing the complete sample population, this analysis is
able to provide conclusive evidence on the extent of the problem at both the national and
state levels.
The FSA provided two pieces of information. The first shows the number of
5 Pell-eligible students were chosen as the group of interest because, by definition, they have a significant level of financial need and are thus most likely to be eligible for need-based state aid.

14
students filing after state deadlines or explicit cutoff dates, by state. The second focuses
on the on-time filing rates by institutional type and student characteristics. Institution type
includes four-year, two-year, and less-than-two year institutions within each of the public,
private, and proprietary sectors. Student characteristics are limited to those available from
the FAFSA application and focused on those hypothesized from existing research to place
students at greater risk for missing state deadlines. These included expected family
contribution, whether or not the student was filing for the first-time, parental education,6
dependency status, and sex.
We conduct a separate, similar set of analyses for the five additional states
providing guidance to “file as soon as possible after January 1” but not publicizing a cutoff
or suspense date. For this analysis, we estimate under-filing using April 15, the federal
tax-deadline, as an arbitrary cutoff (Appendix A).
A key limitation to our approach is that we likely understate the extent of under-
filing because we only examine state deadlines. Institutional deadlines often fall before
state deadlines, and single-institution studies suggest that the proportion of students
missing these earlier deadlines is often higher. Similarly, we are only able to examine
states with explicit deadlines or cutoff dates, although information on filing rates in Illinois
provide a helpful illustration of how filing rates may play out in states with guidance to file
“As soon as possible after January 1” or “Check with your financial aid advisors.” Thus,
we believe our results are conservative estimates.
6 Applicants who reported an education level of “college or beyond” for at least one parent are defined as “Not First Generation.” All other are defined as “First Generation.”

15
Prevalence of Under-Filing the FAFSA
Nearly half (45.6%) of Pell-eligible students living in states with deadlines or known
suspension dates for need-based grants under-file the FAFSA, submitting it after those
deadlines have passed (Table 3). On-time filing rates vary by type of institution, with
students at two-year and less than two-year institutions in both the non-profit and public
sectors under-filing at rates roughly twenty percentage points higher than their
counterparts in four-year institutions. Students at proprietary institutions under-file most
often, with 60% of students at both four-year and two-year proprietary institutions filing
after their respective state deadlines, compared to 31% and 52% of their peers at public
four- and two-year institutions, respectively.
Under-filing is more common for some groups of students than others. While all
students in the sample are Pell-eligible, those with the lowest expected family
contributions ($0) are nearly nine percentage points more likely to under-file than their
peers with an EFC greater than zero. This means that the students with the greatest need
for grant aid may be the most likely to miss out on it. Men are more likely to under-file than
women, and students whose parents have not attended college are more likely to under-
file than peers with a college-educated parent, but these differences are relatively small
(1.1 and 2.6 percentage points, respectively).
However, students classified as independent for financial aid purposes—those with
children, over age 24, or otherwise on their own for paying for college—are far more likely
than dependent students to under-file. Almost 55% of independent students file after state
deadlines, compared to about 32% of dependent students. Since all students in this
sample are Pell-eligible, it is safe to assume that they would qualify for state aid—their
under-filing is unlikely to reflect ineligibility or lower need for aid, as has been suggested

16
by earlier researchers (King, 2004).
Finally, the vast majority of FAFSA-related support is targeted at first-time filers,
and, indeed, these students are seven percentage points more likely than re-filing
students to under-file. However, it is notable that 44% of students who already
successfully submitted a FAFSA in a previous year and nearly 38% of students simply
renewing their FAFSA at the same institution failed to meet state deadlines, suggesting
the need for outreach and support efforts directed towards all students – not just new
filers.

17
Table 3. 2014-15 FAFSA Under-filing Rates of Pell-eligible Applicants in States with Explicit Deadlines or Cutoff by Institutional and Student Characteristics
Filing After Deadline
Count Percent
Overall 3,596,214 45.6% School Type/Length*
Public 2,348,954 43.2% 4 Year Institutions 739,108 31.5%
2 Year Institutions 1,589,815 52.2%
Less than 2 Year 20,031 50.5%
Private 382,179 36.2% 4 Year Institutions 345,568 34.8%
2 Year Institutions 30,073 57.2%
Less than 2 Year 6,538 54.5%
Proprietary 858,252 62.0% 4 Year Institutions 490,645 60.3%
2 Year Institutions 205,927 60.3%
Less than 2 Year 161,680 70.5%
Foreign/Other 6,829 43.3%
Student Characteristics
EFC=0 2,565,443 48.4%
EFC>0 1,030,771 39.8%
Original Application to Institution 2,062,741 54.1%
Renewal 1,533,473 37.6%
First Time Filer** 950,784 51.1%
Not First Time Filer 2,645,430 43.9%
First Generation*** 2,221,249 46.6%
Not First Generation 1,374,965 44.0%

18
Table 3, Continued
Dependent 1,023,528 32.3%
Independent 2,572,686 54.5%
Female 2,183,771 45.1%
Male 1,397,823 46.2%
Blank 14,620 61.1%
Notes: * Applicants can list up to ten schools on applications. Institutional control and length are based on first reported institution on student's last transaction. **Applicants who previously had submitted an application between cycles 2006/07 to 2013/14 are defined as "not first time filer." All others are "first time filer." ***Applicants who reported an education level of "college or beyond" for at least one parent are defined as "Not First Generation." All are "First Generation."

19
There is also a great deal of state variation in under-filing (Table 4). Rates range
from 76.1% in Connecticut and 74.4% in Oklahoma to 0% in New York and 11.1% in
Ohio. There is a clear correlation between under-filing rates and priority date (Figure 3);
states with later deadlines tend to have much lower rates of under-filing. Connecticut and
Oklahoma have respective priority dates of February 15th and March 1st, two of the
earliest in the country, whereas New York is the only state where the state deadline
matches the federal deadline) and Ohio has the second latest filing date. Yet there is also
variation in under-filing even among states with the same deadlines. For example, under-
filing rates in states with March 1 filing dates range from Connecticut’s 76.1% to 49.5% in
Rhode Island.
Figure 3. Percentage of 2014-15 Pell Recipients Submitting FAFSA after State Deadline by Timing of Deadline
Note: New York, which had a priority date of 6/30/2015 and a 0% under-filing rate, is not shown for simplicity
0%
10%
20%
30%
40%
50%
60%
70%
80%
% F
iling
Afte
r Sta
te D
eadl
ine
2014 Timing of State Priority Deadline or Cutoff for 2014-15 Aid

20
Illinois was the only state included in the analysis that recommended that students
apply “As soon as possible after January 1” rather than providing an explicit deadline. For
the analysis, the state’s suspension date of February 28, 2014 was used as the cutoff;
were this deadline explicitly stated to students, it would have been the third earliest among
all published deadlines. Not surprisingly, then, Illinois had an under-filing rate (55.3%)
significantly above the national average. This places it in line with our estimated under-
filing rate of 52.5% for other states with “as soon as possible” guidance, based on a proxy
cutoff of April 15 (Appendix A).

21
Table 4. Pell Eligible Under-filing Rates by State among States with Explicit Deadlines or Cutoff
Filing After Deadline State Count Percent Deadline Notes
Alaska 7,207 37.5% 6/30/2014
Arkansas 54,356 43.9% 6/1/2014
California 949,656 54.6% 3/2/2014 “For initial awards-3/2” also “Contact your financial aid administrator”
Connecticut 80,626 76.1% 2/15/2014
Delaware 16,439 56.7% 4/15/2014
Florida 436,366 49.0% 5/15/2014
Idaho 44,402 68.5% 3/1/2014
Illinois 253,758 55.3% 2/28/2014 "ASAP after 1/1"; Feb 28 "suspense date" for 2014-15
Indiana 104,320 39.8% 3/10/2014
Iowa 27,813 31.7% 7/1/2014
Kansas 56,146 60.1% 4/1/2014
Louisiana 69,830 37.7% 7/1/2014 "June 30 2015, July 1 2014 recommended"
Maine 13,873 33.1% 5/1/2014
Maryland 118,991 58.9% 3/1/2014
Massachusetts 68,924 37.9% 5/1/2014
Michigan 287,727 69.0% 3/1/2014
Minnesota 18,362 11.3% 10/15/2014 Estimate; Policy is "30 days after start of term"
Mississippi 112,064 71.1% 3/31/2014
Missouri 126,743 56.4% 4/1/2014
Montana 18,833 63.9% 3/1/2014
New Jersey 104,233 37.4% 6/1/2014 Deadline for need-based grant recipients; all others 10/1
New York 0.0% 6/30/2015
North Dakota 8,097 57.3% 4/15/2014

22
Table 4, Continued
Ohio 47,141 11.1% 10/31/2014
Oklahoma 97,808 74.4% 3/1/2014
Oregon 98,400 62.0% 2/1/2014
Pennsylvania 141,346 38.8% 5/1/2014 8/1 for first-time filers at some institutions. All others 5/1
Rhode Island 17,445 49.5% 3/1/2014
Tennessee 165,367 63.2% 3/1/2014
Washington, D.C.
12,065 57.5% 4/1/2014
West Virginia 37,876 63.6% 3/1/2014
Discussion
Data requested from the FSA and analyzed here reveals that very large proportions
of Pell-eligible students are under-filing in states with explicit deadlines. Limited evidence
from Illinois and Wisconsin paired with our own estimates in Appendix A suggest that
rates are as high (if not higher) in states with guidance to file “as soon as possible after
1/1” or to “check with your financial aid administrator.” Furthermore, these deadlines
appear to have a disproportionate impact on subgroups of students already at higher risk
of not persisting, including students at two-year institutions, students from the lowest-
income families, independent students, and first generation students. Several implications
for outreach, policy, and research follow from these findings.
Since FAFSA deadlines affect a large number of students and disproportionately
affect at-risk students, more efforts should be undertaken to encourage on-time filing.
Institutions have the clearest incentives to encourage filing by state deadlines; each
student receiving aid from the state reduces the aid burden on the institution and
increases the likelihood of retention. Institutions may also be best equipped to
communicate to students about both state and often different institutional deadlines, as
23
well as more likely to be able to provide some form of in-person support to students
struggling with the process.
Although most institutions likely already have a communication plan in place that
provides students with information on institutional, state, and federal aid deadlines, these
plans typically rely only on e-mail, an increasingly unreliable way to contact students given
decreases in how often students engage with e-mail and exponential increases in the
number of emails received by students (Anderson and DePalma, 2012). Recent research
has taken advantage of advances in behavioral economics and an increase to nearly
100% mobile-phone ownership among college-age students to examine the impact of
phone-based outreach to students. A series of FAFSA-focused text message-based
interventions have been shown to increase fall retention at community colleges
(Castleman and Page, 2016) and a single call from a peer advisor in an office of financial
aid was been shown to increase the on-time filing of Pell-eligible students from 68% to
77% while also increasing overall filing for students with a zero EFC from 89% to 94% at a
flagship public university (Castleman and Page, 2016).
The federal government has recently taken the important step of allowing students
to use a prior year’s tax return, allowing students to file even earlier. Some commentators
have suggested that this may help to reduce under-filing (Hopkins, 2014). However,
simply allowing students to file earlier may not address the challenges noted here. It may
not simply be the obstacle of obtaining tax information that causes students to file late;
even in the current policy setting, students are able to successfully file by providing
estimates of their tax information as long as the information is later updated. Further, it is
unclear which students will take advantage of this earlier filing opportunity; without
addressing the communication challenges noted above, it is possible that this new option

24
may be used most widely by students who are the least at risk and have the lowest
eligible levels of financial need.
Finally, the policy behavior of states is also an important general consideration in
considering recommendations at the federal level. We have already noted the complexity
faced by student filers in states that encourage filing “as soon as possible after January,
1,” and the national trend towards recommending that students apply as close as possible
to January 1, currently the earliest allowable date to apply. It is possible, then, that states
may respond to this new federal option by encouraging students to file as soon as
possible after the new earliest possible date, likely in October of the previous year. This, in
effect, would likely move back the date when funds are exhausted while requiring students
to make decisions about their fall enrollment almost a full year in advance of their
attendance and nearly two years in advance of the federal financial aid deadline. At that
distance, students face not only cognitive challenges to planning but practical ones;
graduating high school seniors and students considering a transfer from community
college to a four-year institution may still be unsure of their plans well into the spring or
summer before the funded year.
Even if interventions are successful, then, it may not be enough simply to get more
students to file before deadlines. Whether negative impacts on subgroups of students are
intentional, the role of deadlines in limiting the total amount of aid distributed often is. In
most states, funding for need-based aid is a zero-sum game; a specific number of dollars
are allocated, and states either decrease average aid awards or stop awarding funds
earlier to make sure that allocations stay within budget. The ideal would be for states to
simply budget more dollars to appropriately fund the number of enrolled students eligible
for aid, rather than the number of students expected to apply on time for aid, and

25
incentivize awarding the maximum number of eligible students. Yet as many states
continue to fail to match pre-recession levels of per-student allocations to higher
education, this is unlikely in the short term.
As a general rule, the later a state deadline, the higher the on-time filing rate for
that state; where possible, states should consider moving deadlines closer to the federal
filing deadline of the summer following the funded year. While later late state deadlines
may result in lower average award packages without appropriate planning, they also are
more likely to surface the number of eligible students and to incentivize more careful
targeting based on levels of need rather than the timing of filing.
States and institutions alike, then, have a responsibility to understand how their aid
is currently targeted, and they must include in that calculus not only need-based
requirements for eligibility but the disproportionate impacts of policies like deadlines on
filing behavior and actual aid distribution. This research requires data. While we are
grateful to FSA for providing the descriptive analysis considered here, the findings
suggest that there is value in more granular analysis by providing de-identified student-
level data to qualified researchers, allowing for analysis that considers a broader range of
questions, including the impact of institutional deadlines. State agencies and researchers
at individual institutions may also be well-equipped to conduct research on filing behavior
and outreach options that are effective in reaching students who are most at risk for
under-filing. While only a piece of a larger puzzle, tackling under-filing is a crucial step
towards helping to make college accessible and students successful.
26
Appendix A. Timing of FAFSA Filing in States Advising Students to File “As Soon As Possible After January 1” and Not Providing Explicit Cutoff Dates
As with the deadline-based analysis, students were selected for inclusion in the
sample if they a) submitted a financial aid application (FAFSA) for attendance in the fall of
2014/15 and b) were determined to be Pell eligible.7 Unlike the broader analysis, students
in this group also c) had reported a state of legal residence as one of the 5 states that
provided filing guidance of “As soon as possible after January 1” but did not provide after-
the-fact cutoff or suspension dates.
For this group, April 15, the federal tax-deadline, served as an arbitrary cutoff.
Filing “on-time” was defined as filing by or before April 15, with all students filing after the
deadline coded as under-filers. For states listing multiple deadlines, the earliest deadline
associated with a major need-based aid program was selected as the cutoff date.
Total rates of non-filing follow a pattern similar to the overall group (52.5% under-
filing vs. 46.5% under-filing). Similarly, trends observed in subgroups of institutions and
students largely mirror those of states with deadlines. Notably, under-filing rates were
higher for all at-risk groups, and the gap between the at-risk student group and their less
at risk peers was larger for students with an EFC of zero, males, and first-generation
students.
7 Pell eligible students were chosen as the group of interest because, by definition, they have a significant level of financial need and are thus most likely to be eligible for state need-based aid.

27
Table A1. Estimated Pell Eligible Student FAFSA Under-Filing Rates by States Advising Students to File "As Soon as Possible After January 1" without Explicit Cutoff Date (4/15 as Proxy) State Count Percent Proxy
Deadline
Kentucky 78,899 44.0% 4/15/2014
North Carolina 244,071 57.1% 4/15/2014
South Carolina 127,477 62.1% 4/15/2014
Vermont 6,123 43.2% 4/15/2014
Washington 103,649 43.2% 4/15/2014

28
Table A2. Estimated Pell Eligible Student FAFSA Under-Filing Rates in States Advising Students to File "As Soon as Possible" (4/15 Proxy) by Institutional and Student Characteristics
Filing After Deadline
Count Percent
Overall 560,219 52.5%
School Type/Length*
Public 371,768 49.5% 4 Year Institutions 105,937 34.4%
2 Year Institutions 265,712 60.0%
Less than 2 Year 119 63.0%
Private 60,655 46.6% 4 Year Institutions 53,239 44.5%
2 Year Institutions 6,336 69.4%
Less than 2 Year 1,080 74.1%
Proprietary 126,985 69.4% 4 Year Institutions 98,719 68.7%
2 Year Institutions 15,221 68.9%
Less than 2 Year 13,045 75.6%
Foreign/Other 811 42.5%
Student Characteristics
EFC=0 410,012 55.3%
EFC>0 150,207 46.3%
Original Application to Institution 333,897 62.4%
Renewal 226,322 42.6%
First Time Filer** 153,150 62.0%
Not First Time Filer 407,069 49.7%
First Generation*** 331,394 54.3%
Not First Generation 228,825 50.1%

29
Table A2, Continued
Dependent 137,235 39.0%
Independent 422,984 59.3%
Female 352,324 52.0%
Male 205,646 53.3%
Blank 2,249 69.3%
Notes: * Applicants can list up to ten schools on applications. Institutional control and length are based on first reported institution on student's last transaction. **Applicants who previously had submitted an application between cycles 2006/07 to 2013/14 are defined as "not first time filer." All others are "first time filer". ***Applicants who reported an education level of "college or beyond" for at least one parent are defined as "Not First Generation". All are "First Generation."

30
References Anderson, D., & Goldrick-Rab, S. (2016). The Wisconsin Grant: Overview and
recommendations for evaluation. Wisconsin HOPE Lab, Madison WI.
Anderson, S. P., & De Palma, A. (2012). Competition for attention in the information (overload) age. The RAND Journal of Economics, 43(1), 1–25.
Baum, Sandy, & Steele, Patricia. (2008). The Effectiveness of Student Aid Policies: What the Research Tells Us. College Board, NY.
Baum, S., Breneman, D. W., Chingos, M. M., Ehrenberg, R. G., Fowler, P., Hayek, J. (2012). BEYOND NEED AND MERIT. Retrieved from http://www.cop.wsu.edu/docs/r_d_docs/Beyond_need_merit.pdf
Cannon, R. (forthcoming). A Text a Day: Experimental Impacts of Text Message Nudging on Performance, Engagement, and Persistence.
Cannon, R, & Goldrick-Rab, S. (forthcoming). Why Didn’t You Say So?: Experimental Impacts of Financial Aid Outreach.
Carlson, A., & Laderman, S.. (2015). State Higher Education Finance: FY 2015. Boulder, CO: State Higher Education Officers Association.
Castleman, B. L., & Page, L. C. (2016). Freshman Year Financial Aid Nudges: An Experiment to Increase FAFSA Renewal and College Persistence. Journal of Human Resources, 51(2), 389–415.
Cochrane, D. F. (2007). Green Lights & Red Tape: Improving Access to Financial Aid at California’s Community Colleges. The Institute for College Access & Success.
Congressional Budget Office (CBO). (2013, September 5). The Pell Grant Program: Recent Growth and Policy Options. Retrieved May 11, 2016, from https://www.cbo.gov/publication/44448
Dynarski, S., & Wiederspan, M. (2012). Student Aid Simplification: Looking Back and Looking Ahead (Working Paper No. 17834). National Bureau of Economic Research.
Federal Reserve Bank of St. Louis. (2015, October 21). Real Median Household Income in the United States. Retrieved May 11, 2016, from https://research.stlouisfed.org/fred2/series/MEHOINUSA672N
Feeney, M., & Heroff, J. (2013). Barriers to Need-Based Financial Aid: Predictors of Timely FAFSA Completion Among Low-Income Students. Journal of Student Financial Aid, 43(2).
Goldrick-Rab, S. (2016). Paying the Price: College Costs, Financial Aid, and the Betrayal of the American Dream. University of Chicago Press.
31
Hopkins, K. (2014, July 10). NASFAA | Under Current FASFA Timeline, Many Needy First-Years Miss Out On Aid. Retrieved May 12, 2016, from http://www.nasfaa.org/news-item/1249/Under_Current_FASFA_Timeline_Many_Needy_First_Years_Miss_Out_On_Aid
King, J. (2006). Missed Opportunities Revisited: New Information on Students Who Do Not Apply for Financial Aid (Issue Brief). American Council on Education.
King, J. (2004). Missed Opportunities: Students Who Do Not File for Financial Aid (Issue Brief). American Council on Education Center for Policy Analysis.
LaManque, A. (2009). Factors associated with delayed submission of the free application for federal financial aid. Journal of Applied Research in the Community College, 17(1), 6.
McKinney, L, & Novak, H. (2015). FAFSA filing among first-year college students: Who files on time, who doesn’t, and why does it matter? Research in Higher Education, 56(1), 1–28.
National Association for College Admission Counseling (NACAC). (2016). Prior-Prior Year Income Data for the FAFSA. Retrieved May 11, 2016, from http://www.nacacnet.org/issues-action/LegislativeNews/Pages/PPY.aspx
Novak, H., & McKinney, L. (2011). The consequences of leaving money on the table: Examining persistence among students who do not file a FAFSA. Journal of Student Financial Aid, 41(3), 5–23.
Osborn, A. (2014). Arizona Commission for Postsecondary Education ANNUAL REPORT, Fiscal Year 2014. Phoenix, AZ: Arizona Commission for Postsecondary Education.
Riccobono., J., Cominole, M., Siegel, P., Gabel, T., Link, M., Berkner, Lutz, & Malizio, A. (2002). National Postsecondary Student Aid Study 1999-2000 (NPSAS:2000) Methodology Report (Technical Report No. NCES 2002-152). Washington, D.C.: National Center for Education Statistics.
Suspension of MAP Award Announcements. (2016). Retrieved May 11, 2016, from https://www.isac.org/isac-gift-assistance-programs/map/suspense/
The White House. (2015, September 13). FACT SHEET: The President’s Plan for Early Financial Aid: Improving College Choice and Helping More Americans Pay for College. Retrieved May 10, 2016, from https://www.whitehouse.gov/the-press-office/2015/09/14/fact-sheet-president%E2%80%99s-plan-early-financial-aid-improving-college-choice
US Department of Education (USDOE). (1998). Free Application for Federal Student Aid, 1999-2000.
32
US Department of Education (USDOE). (2003). Free Application for Federal Student Aid, 2004-2005.
US Department of Education (USDOE). (2013). 2014-15 FAFSA Deadlines. Retrieved from https://fafsa.ed.gov/fotw1415/pdf/Deadlines.pdf
Wexler, E. (2016, January 25). State Support on the Rise. Retrieved May 11, 2016, from https://www.insidehighered.com/news/2016/01/25/state-support-higher-education-rises-41-percent-2016
Wine, J., Janson, N., Wheeless, S., & Hunt-White, T. (2011). 2004/09 Beginning Postsecondary Students Longitudinal Study (BPS:04/09) (Technical Report No. NCES 2012-246). Washington, D.C.: National Center for Education Statistics.
Wisconsin HOPE Lab. (2015). What We’re Learning: FAFSA (Data Brief No. 15-02). Madison, WI.