tomw_radio-romania-lecture
TRANSCRIPT
AudioTestforBroadcastFacili2es
! audio test in the studio ! evaluating on-air quality ! audio test state of the art ! case study
The recognized standard in audio test
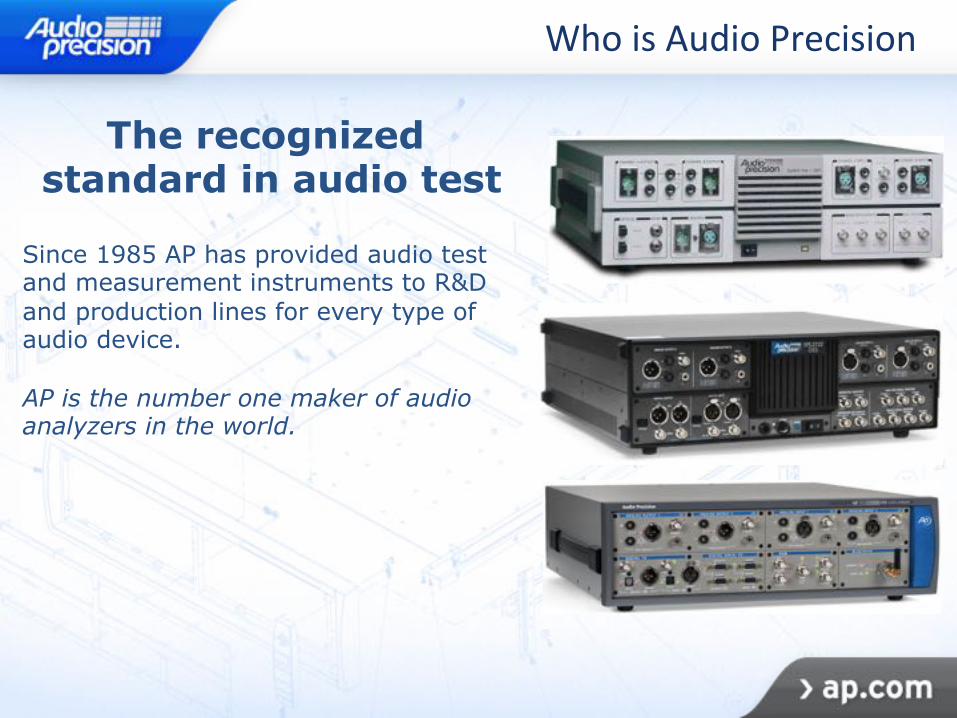
Since 1985 AP has provided audio test and measurement instruments to R&D and production lines for every type of audio device. AP is the number one maker of audio analyzers in the world.
WhoisAudioPrecision

WhousesAP?
" Audio Precision analyzers are used by makers of all types of audio technology
! Pro audio ! A/V receivers ! Broadcast ! Smartphones ! Semiconductors ! Loudspeakers ! Microphones ! Automotive head units ! Blu-ray players ! MP3 players ! Bluetooth headsets ! Tablets and PCs ! Hearing aids ! Military
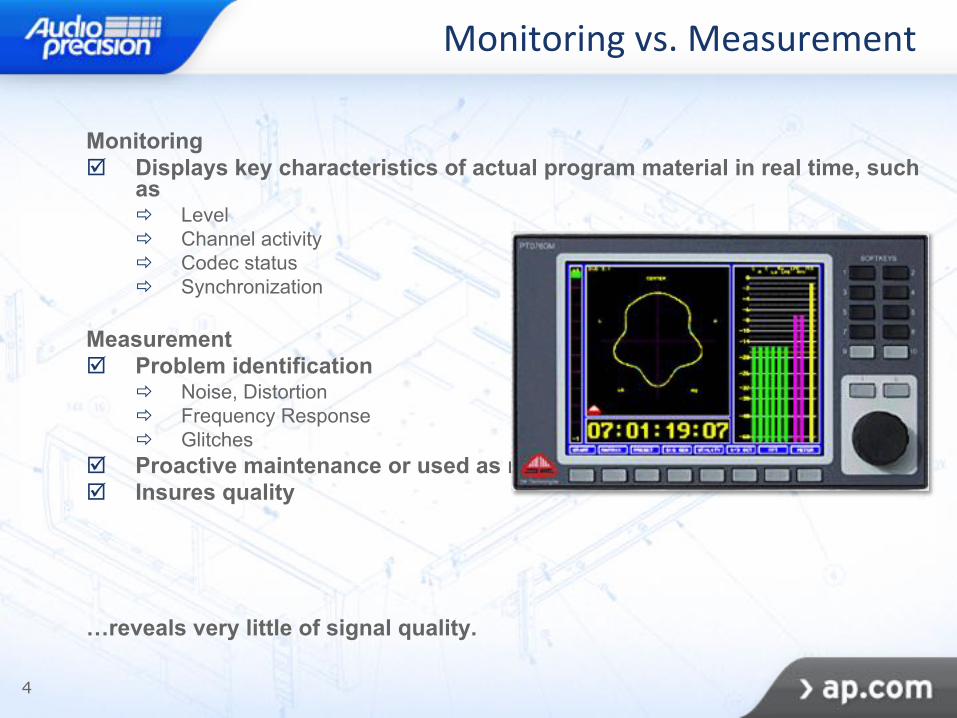
Monitoringvs.Measurement
4
Monitoring " Displays key characteristics of actual program material in real time, such
as ! Level ! Channel activity ! Codec status ! Synchronization
Measurement " Problem identification
! Noise, Distortion ! Frequency Response ! Glitches
" Proactive maintenance or used as needed " Insures quality
…reveals very little of signal quality.

Measurement
5
" Studio maintenance ! Regular servicing ! Troubleshooting audio chain ! Evaluating new equipment
" On air broadcast quality of service ! Ensure broadcast quality across the service area outside the studio
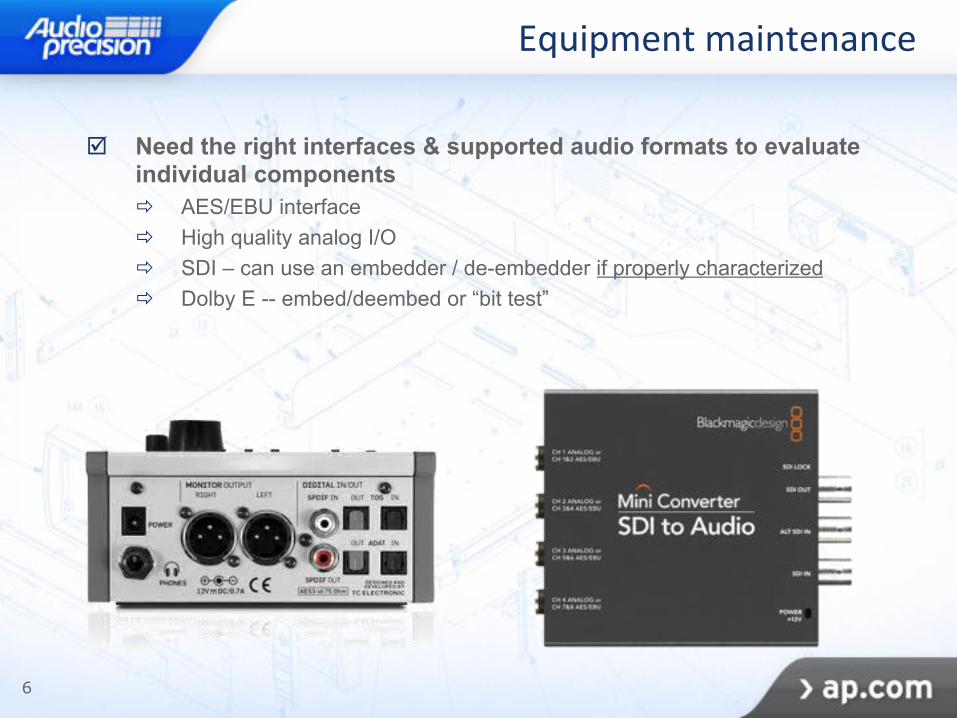
Equipmentmaintenance
6
" Need the right interfaces & supported audio formats to evaluate individual components ! AES/EBU interface ! High quality analog I/O ! SDI – can use an embedder / de-embedder if properly characterized ! Dolby E -- embed/deembed or “bit test”
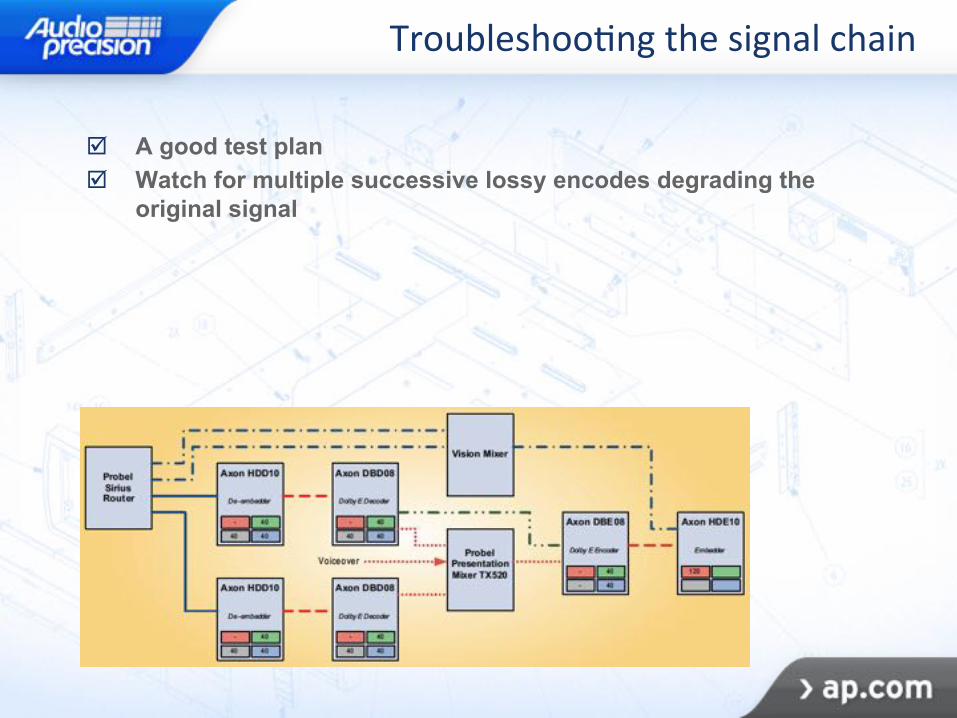
Troubleshoo=ngthesignalchain
" A good test plan " Watch for multiple successive lossy encodes degrading the
original signal
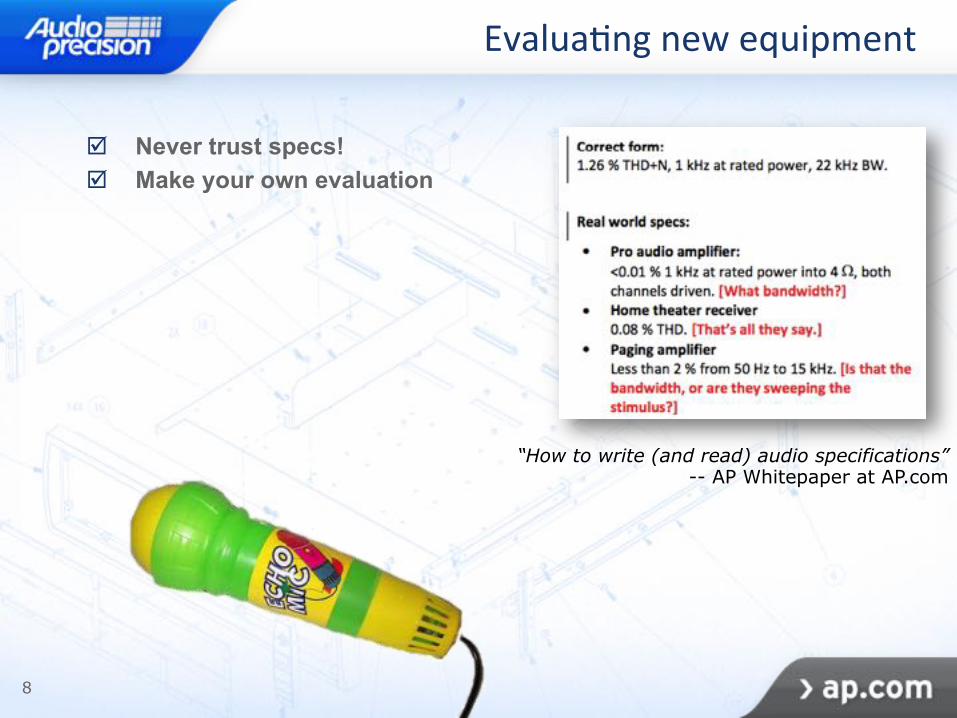
Evalua=ngnewequipment
8
" Never trust specs! " Make your own evaluation
“How to write (and read) audio specifications” -- AP Whitepaper at AP.com
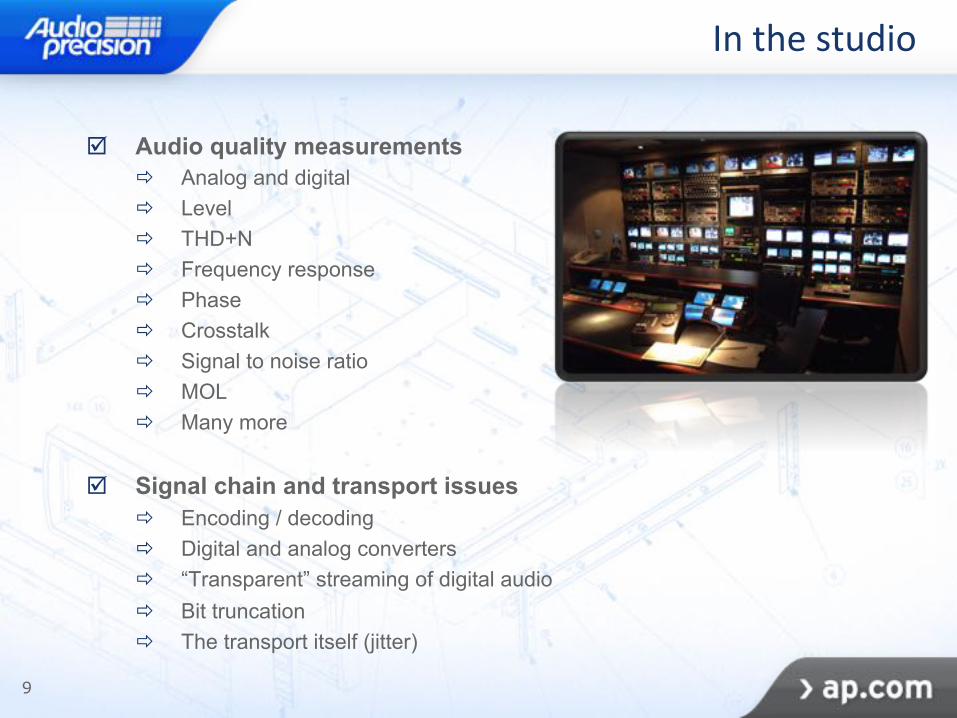
Inthestudio
9
" Audio quality measurements ! Analog and digital ! Level ! THD+N ! Frequency response ! Phase ! Crosstalk ! Signal to noise ratio ! MOL ! Many more
" Signal chain and transport issues ! Encoding / decoding ! Digital and analog converters ! “Transparent” streaming of digital audio ! Bit truncation ! The transport itself (jitter)

TheBigSix
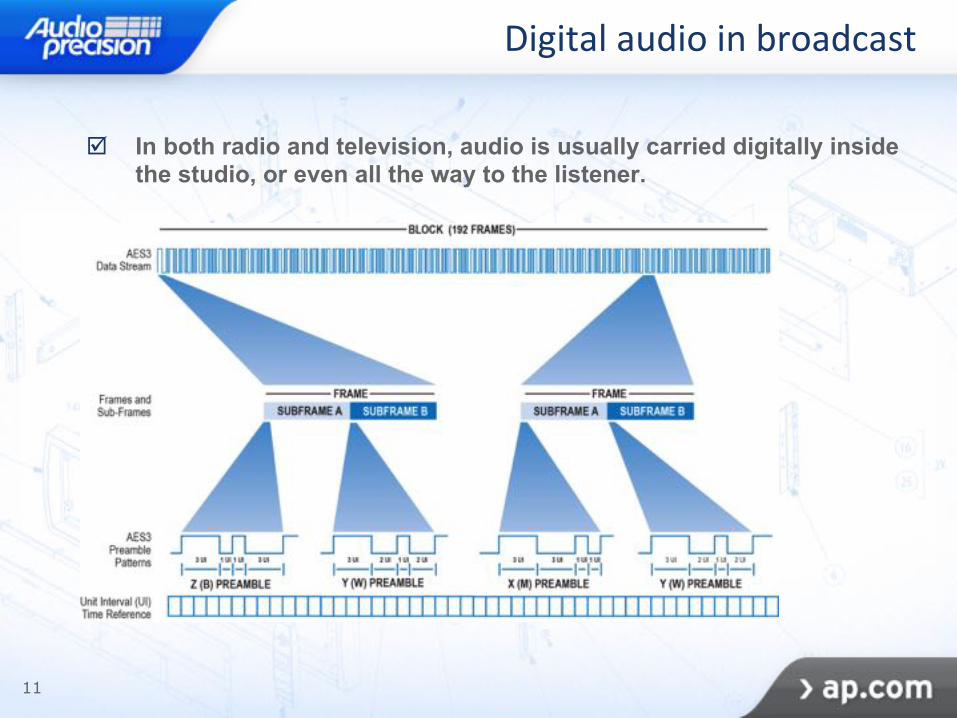
Digitalaudioinbroadcast
11
" In both radio and television, audio is usually carried digitally inside the studio, or even all the way to the listener.
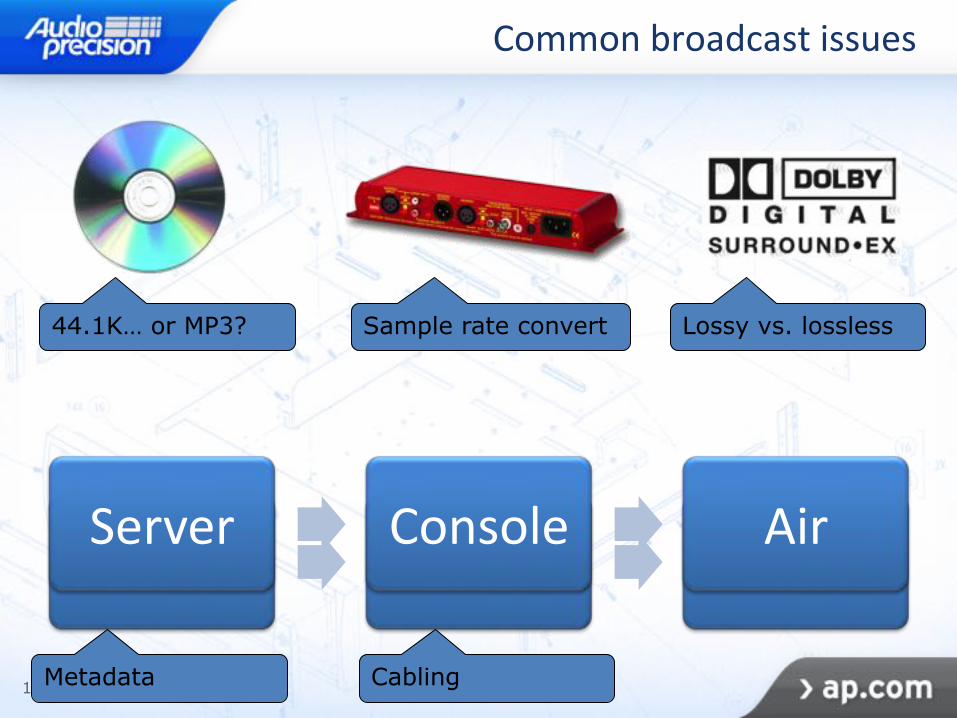
Commonbroadcastissues
12
44.1K 48K DolbyServer Console Air
44.1K… or MP3? Sample rate convert Lossy vs. lossless
Metadata Cabling
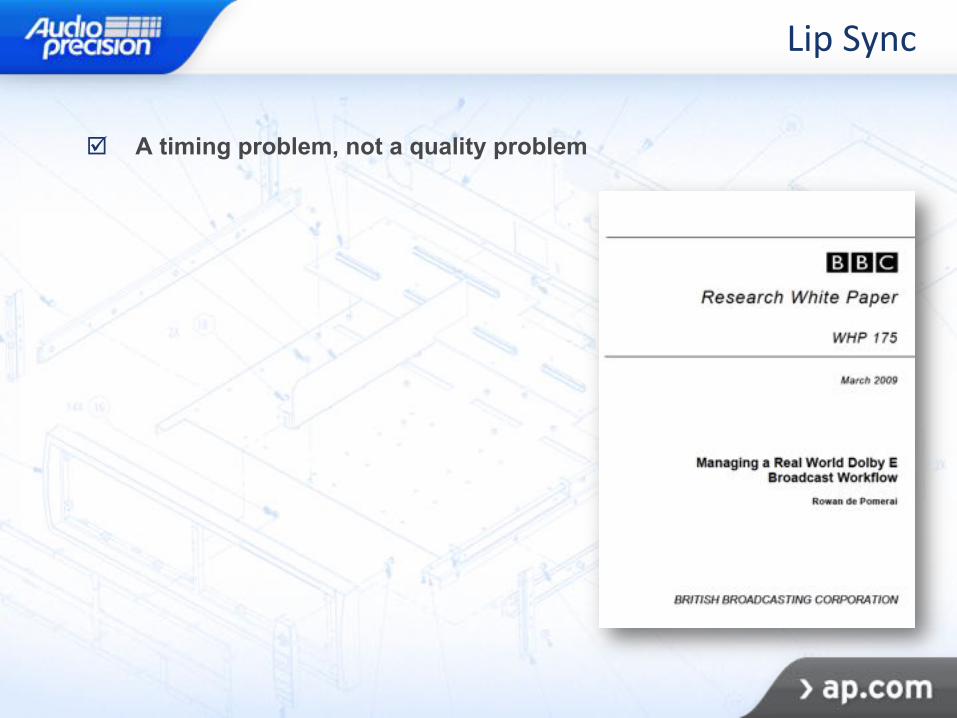
LipSync
" A timing problem, not a quality problem
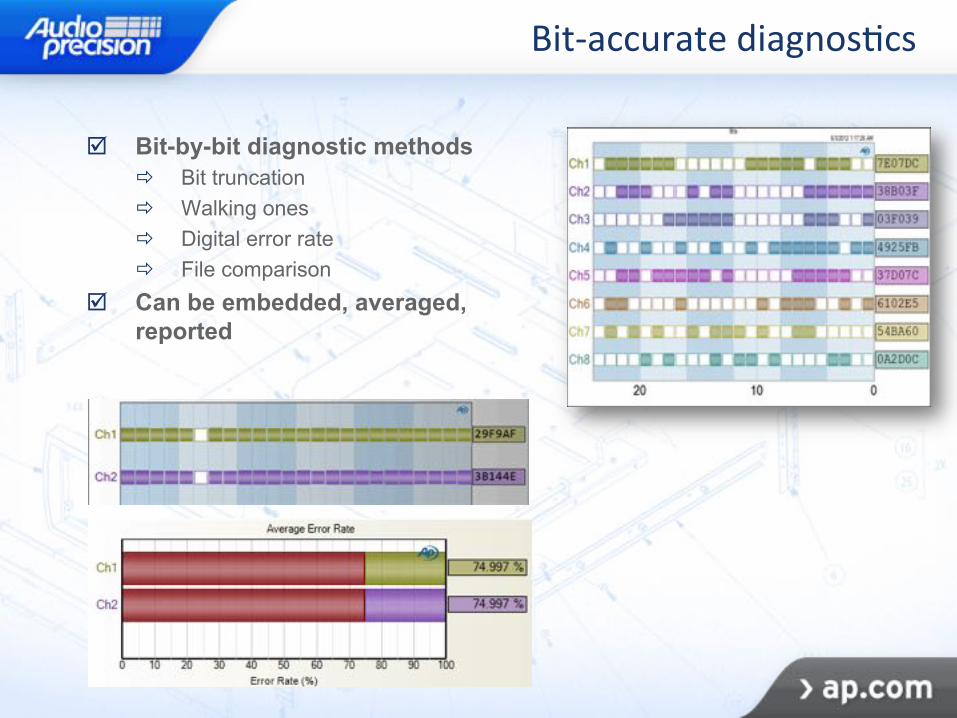
Bit-accuratediagnos=cs
" Bit-by-bit diagnostic methods ! Bit truncation ! Walking ones ! Digital error rate ! File comparison
" Can be embedded, averaged, reported
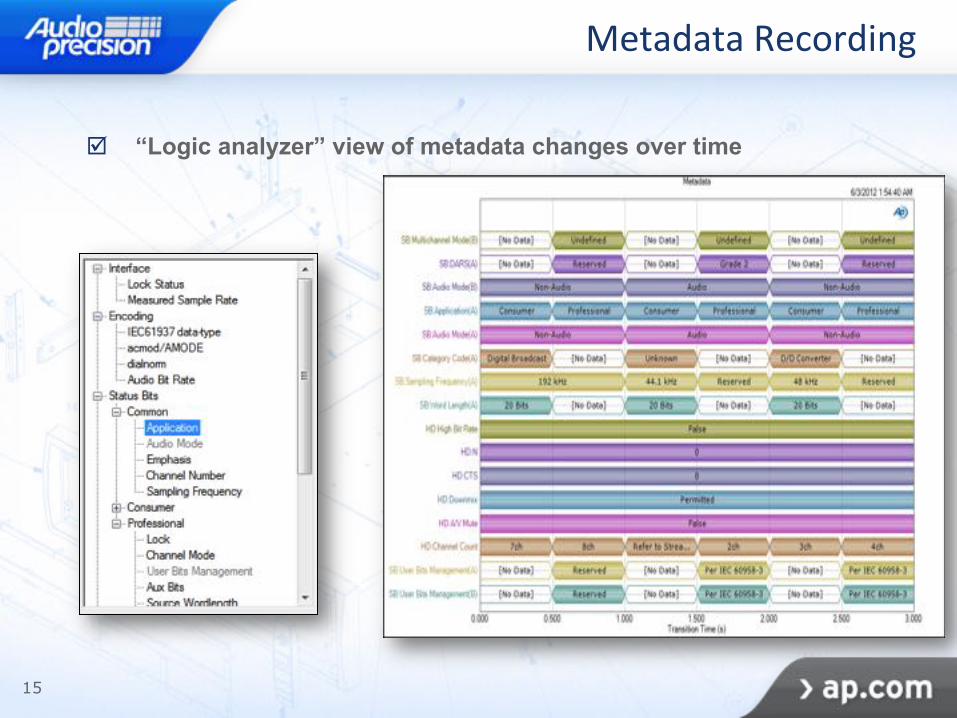
MetadataRecording
15
" “Logic analyzer” view of metadata changes over time

Codedaudio
16
" In television systems, multichannel streams may be coded in Dolby E for studio transport, and Dolby Digital for emission.
" In such cases, the APx stimulus audio signal can be encoded and passed down the chain of interest, and then can be measured after decoding. ! Bit-accurate measurements will not provide useful measurements when passed
through an encode/decode cycle, which by design is not bit-accurate. ! Sine waves in coded audio

JiNerTes=ng
" Spectrums
" Eye diagram
" Waveforms
" Histograms
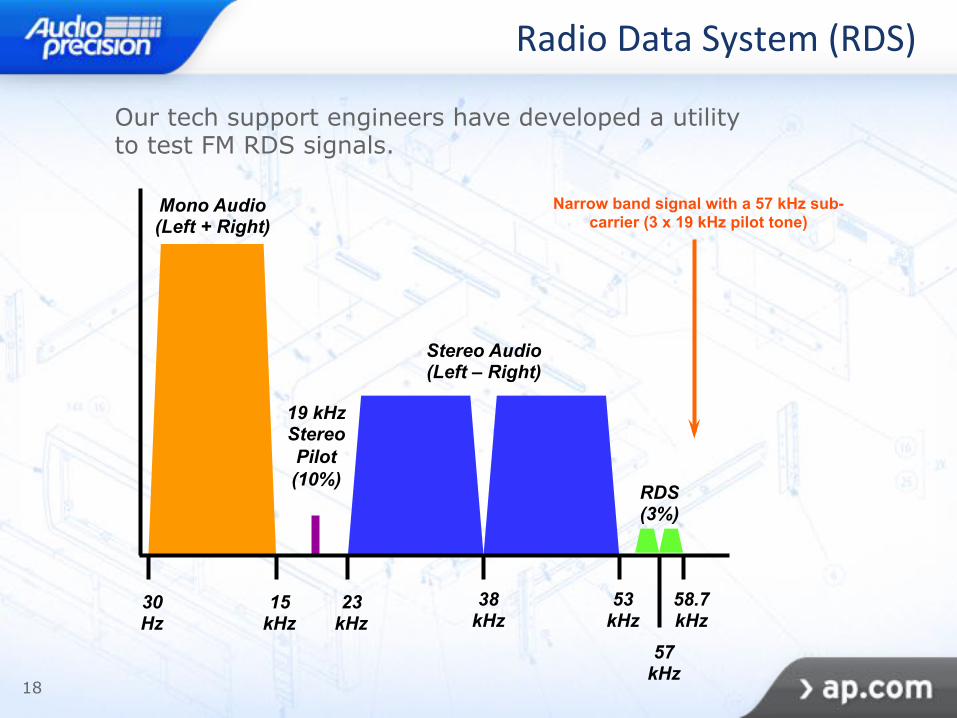
RadioDataSystem(RDS)
18
Narrow band signal with a 57 kHz sub-carrier (3 x 19 kHz pilot tone)
30 Hz
15 kHz
23 kHz
38 kHz
53 kHz
Stereo Audio (Left – Right)
19 kHz Stereo Pilot (10%)
Mono Audio (Left + Right)
58.7 kHz
RDS (3%)
57 kHz
Our tech support engineers have developed a utility to test FM RDS signals.
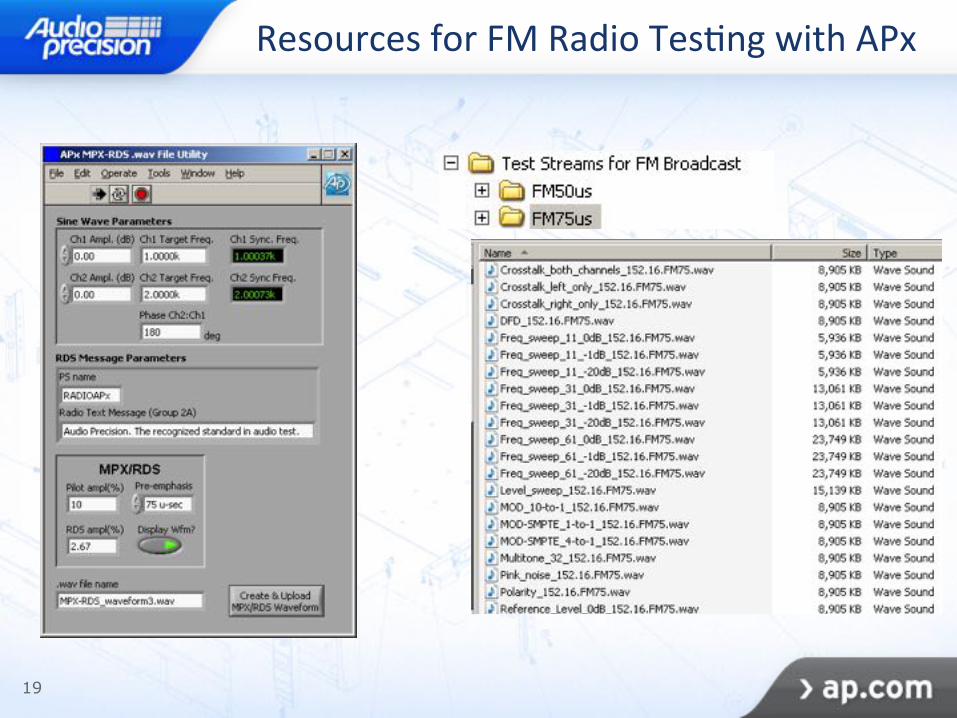
ResourcesforFMRadioTes=ngwithAPx
19
Audioqualityofon-airbroadcast
20
" Objective measurement always requires a reference signal to be broadcast over the air
" The old way: Stepped sine wave late at night ! No longer acceptable!
" Better way : Multitone.
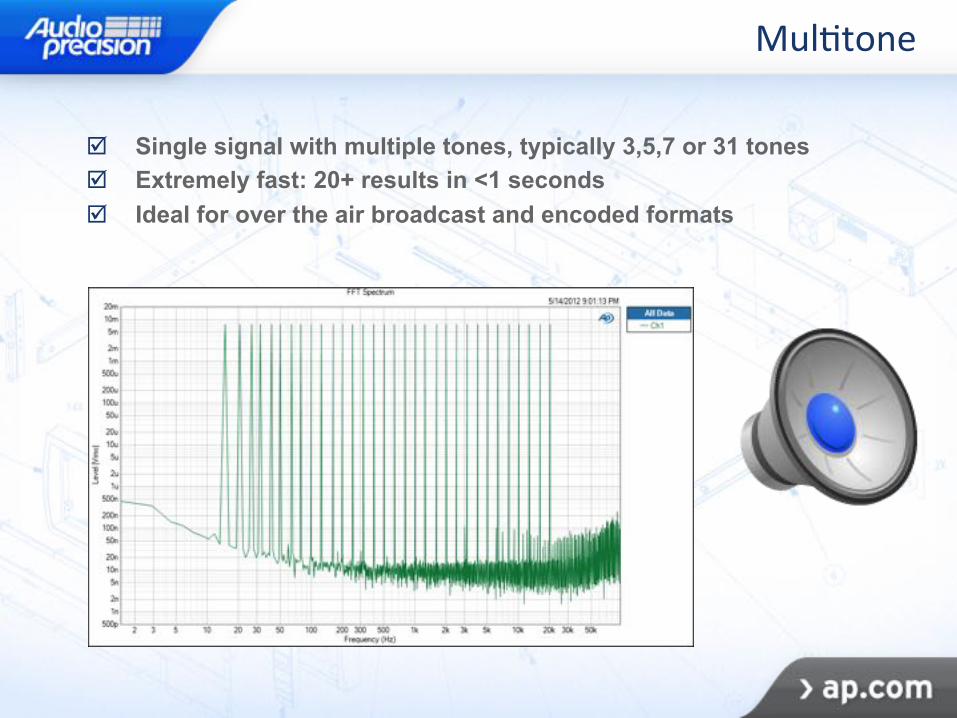
Mul=tone
" Single signal with multiple tones, typically 3,5,7 or 31 tones " Extremely fast: 20+ results in <1 seconds " Ideal for over the air broadcast and encoded formats
Mul=tone
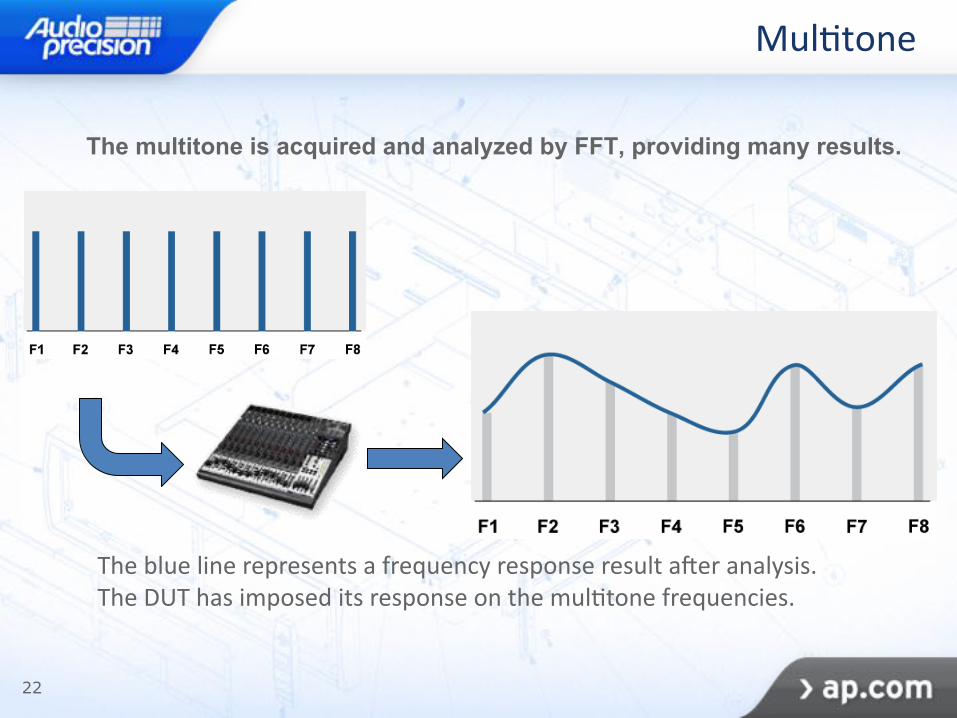
22
The multitone is acquired and analyzed by FFT, providing many results.
ThebluelinerepresentsafrequencyresponseresultaSeranalysis.TheDUThasimposeditsresponseonthemul=tonefrequencies.
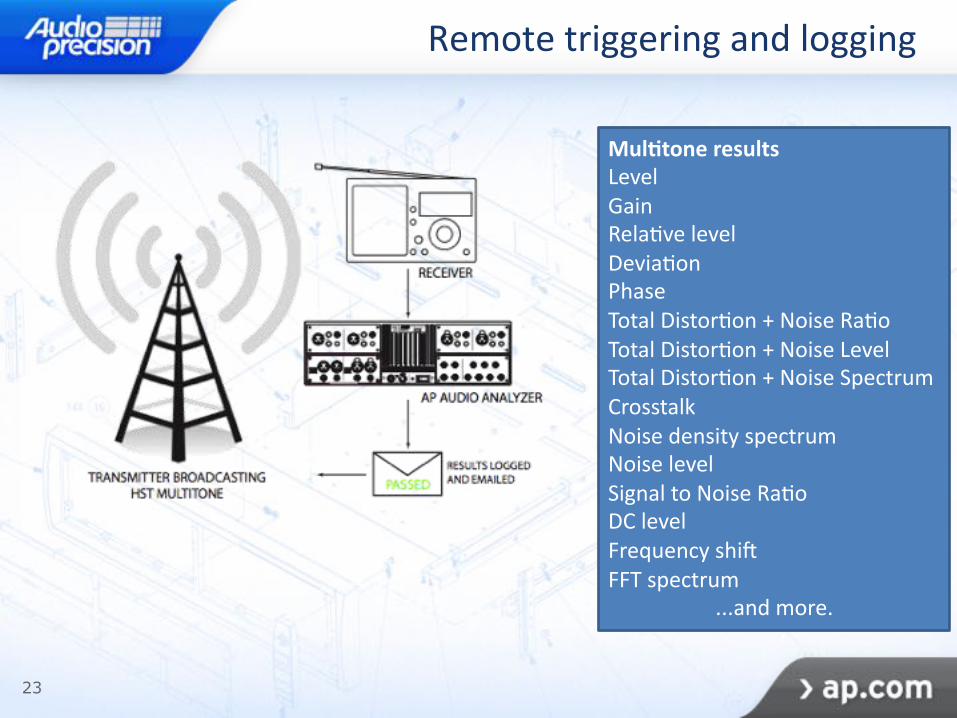
Remotetriggeringandlogging
23
Mul2toneresultsLevelGainRela=velevelDevia=onPhaseTotalDistor=on+NoiseRa=oTotalDistor=on+NoiseLevelTotalDistor=on+NoiseSpectrumCrosstalkNoisedensityspectrumNoiselevelSignaltoNoiseRa=oDClevelFrequencyshiSFFTspectrum
...andmore.
Audioteststateoftheart
" Today’s FFTs " Multichannel " Analog performance " UI, reporting and sharing data
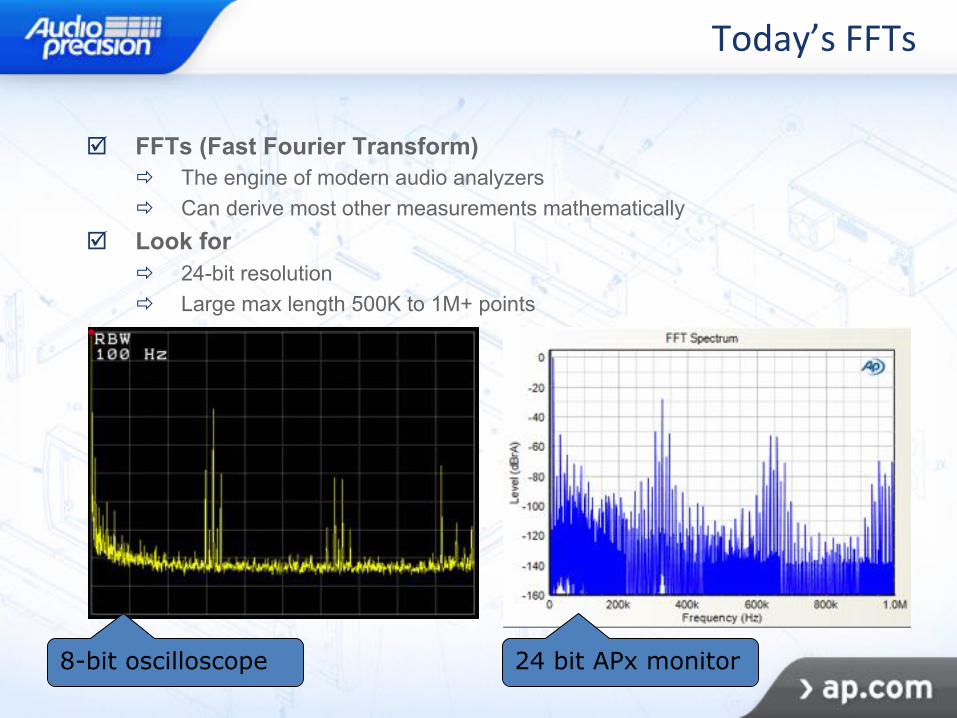
" FFTs (Fast Fourier Transform) ! The engine of modern audio analyzers ! Can derive most other measurements mathematically
" Look for ! 24-bit resolution ! Large max length 500K to 1M+ points
Today’sFFTs
24 bit APx monitor 8-bit oscilloscope
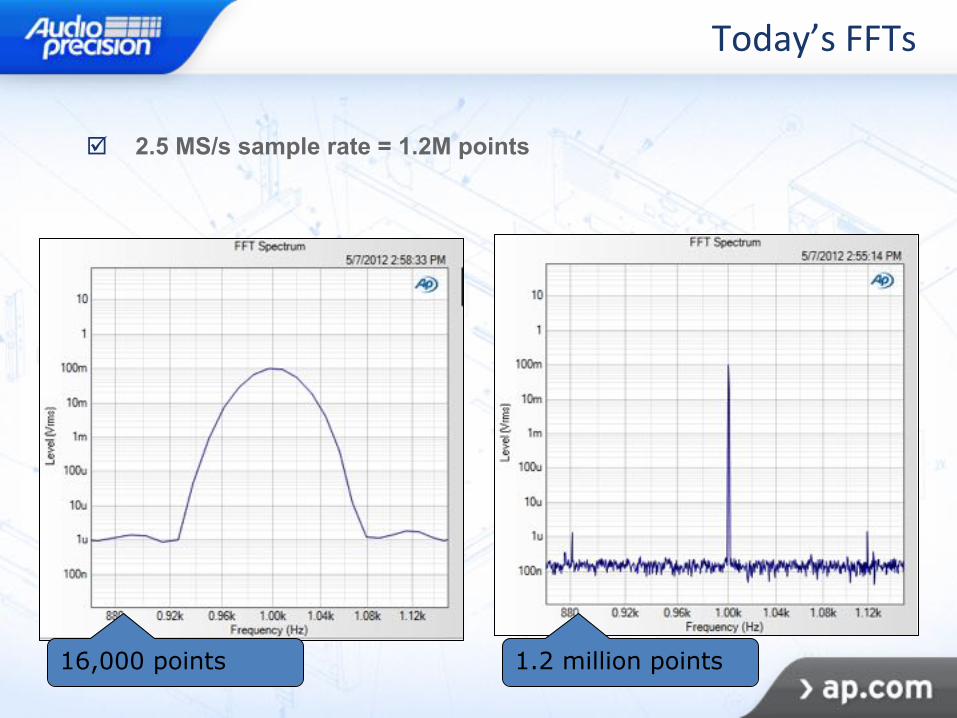
" 2.5 MS/s sample rate = 1.2M points
Today’sFFTs
1.2 million points 16,000 points
Today’sFFTs
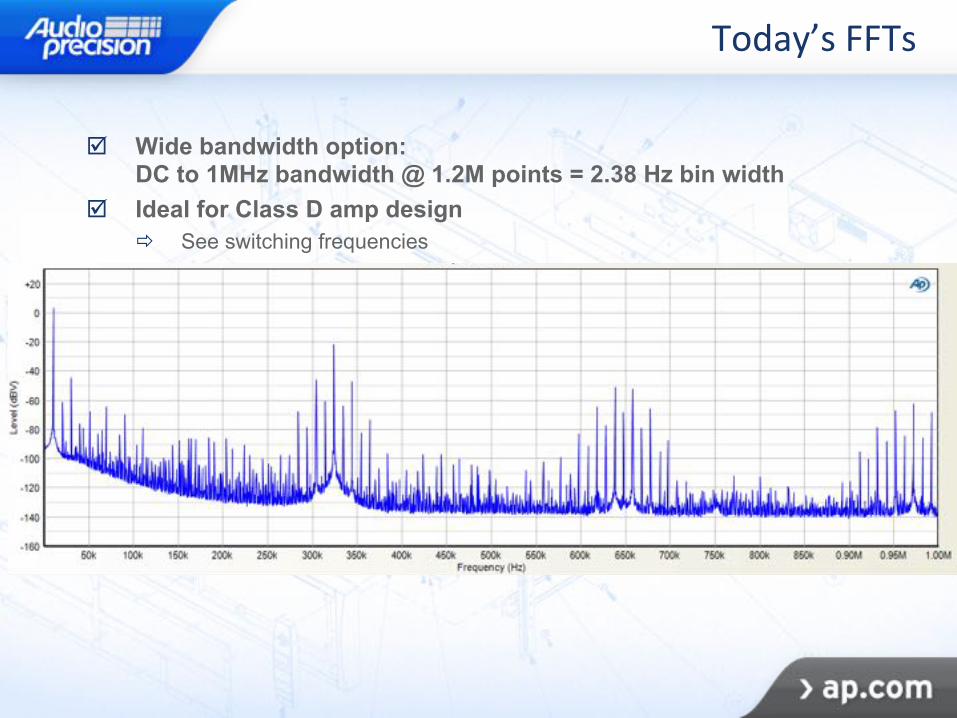
" Wide bandwidth option: DC to 1MHz bandwidth @ 1.2M points = 2.38 Hz bin width
" Ideal for Class D amp design ! See switching frequencies
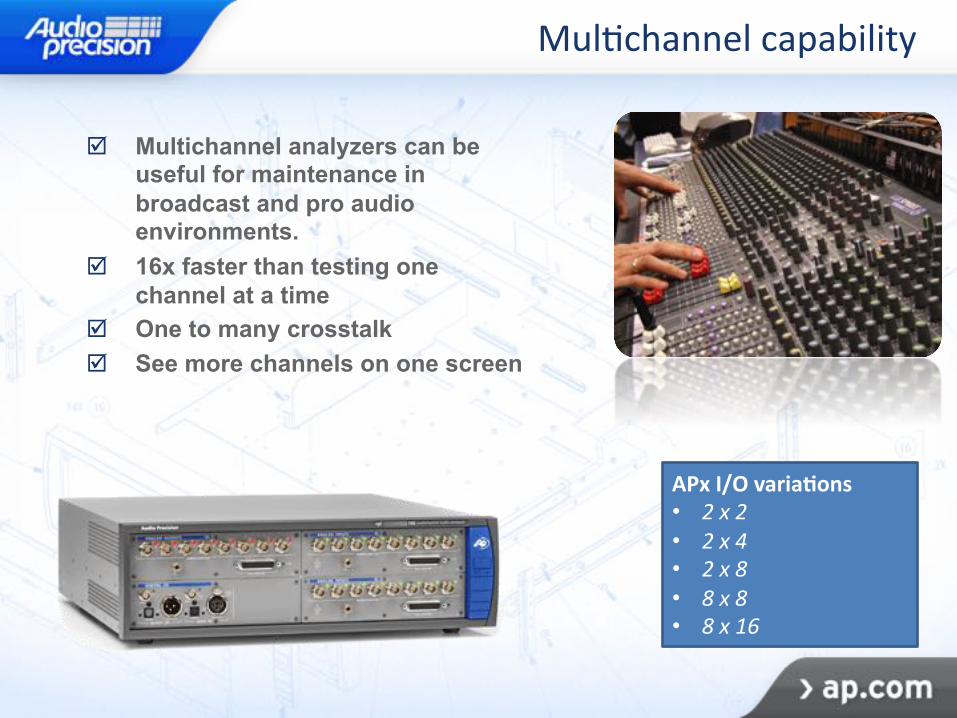
Mul=channelcapability
" Multichannel analyzers can be useful for maintenance in broadcast and pro audio environments.
" 16x faster than testing one channel at a time
" One to many crosstalk " See more channels on one screen
APxI/Ovaria2ons• 2x2• 2x4• 2x8• 8x8• 8x16
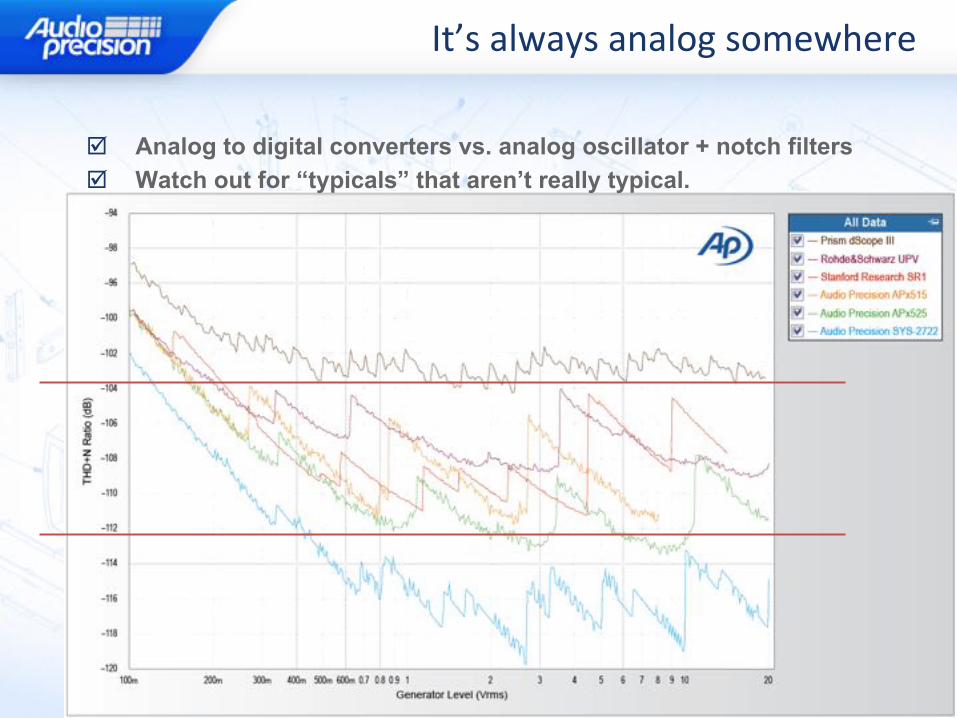
It’salwaysanalogsomewhere
" Analog to digital converters vs. analog oscillator + notch filters " Watch out for “typicals” that aren’t really typical.
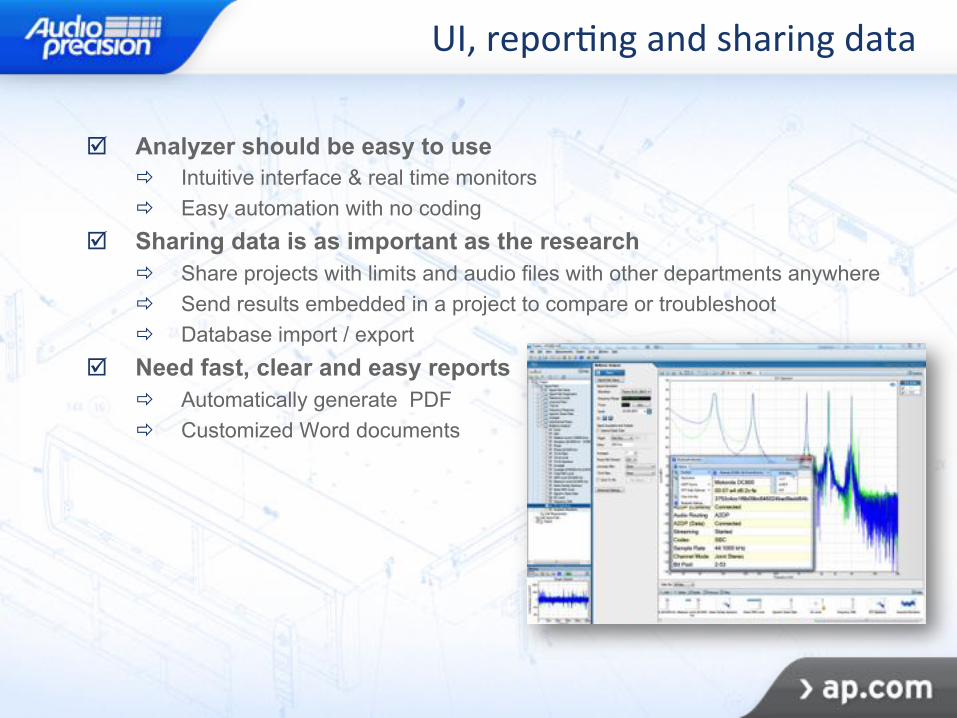
UI,repor=ngandsharingdata
" Analyzer should be easy to use ! Intuitive interface & real time monitors ! Easy automation with no coding
" Sharing data is as important as the research ! Share projects with limits and audio files with other departments anywhere ! Send results embedded in a project to compare or troubleshoot ! Database import / export
" Need fast, clear and easy reports ! Automatically generate PDF ! Customized Word documents
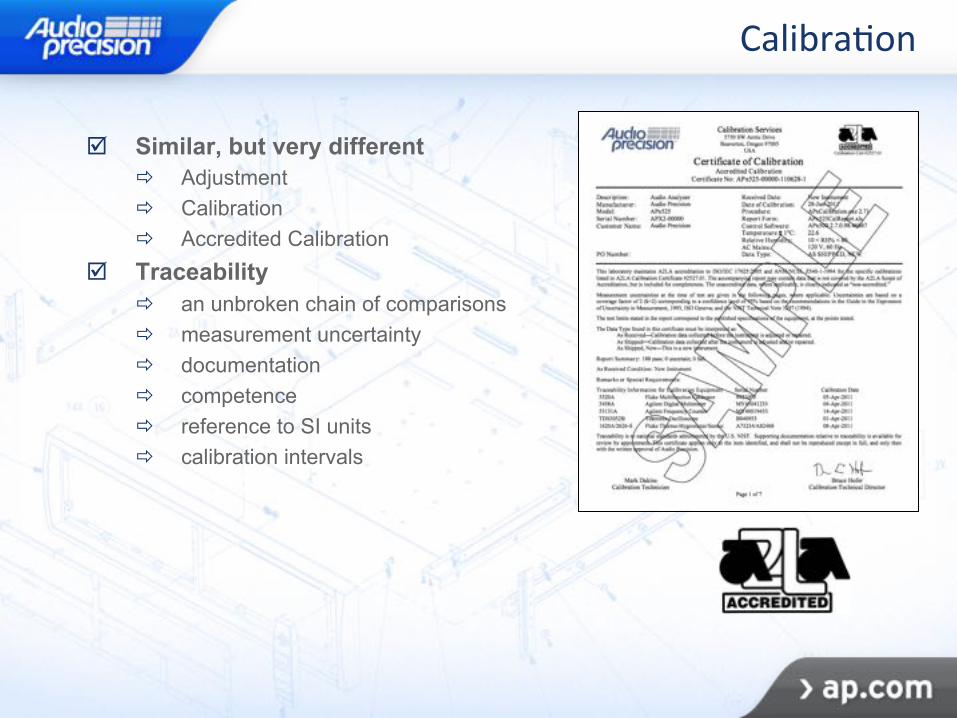
Calibra=on
" Similar, but very different ! Adjustment ! Calibration ! Accredited Calibration
" Traceability ! an unbroken chain of comparisons ! measurement uncertainty ! documentation ! competence ! reference to SI units ! calibration intervals
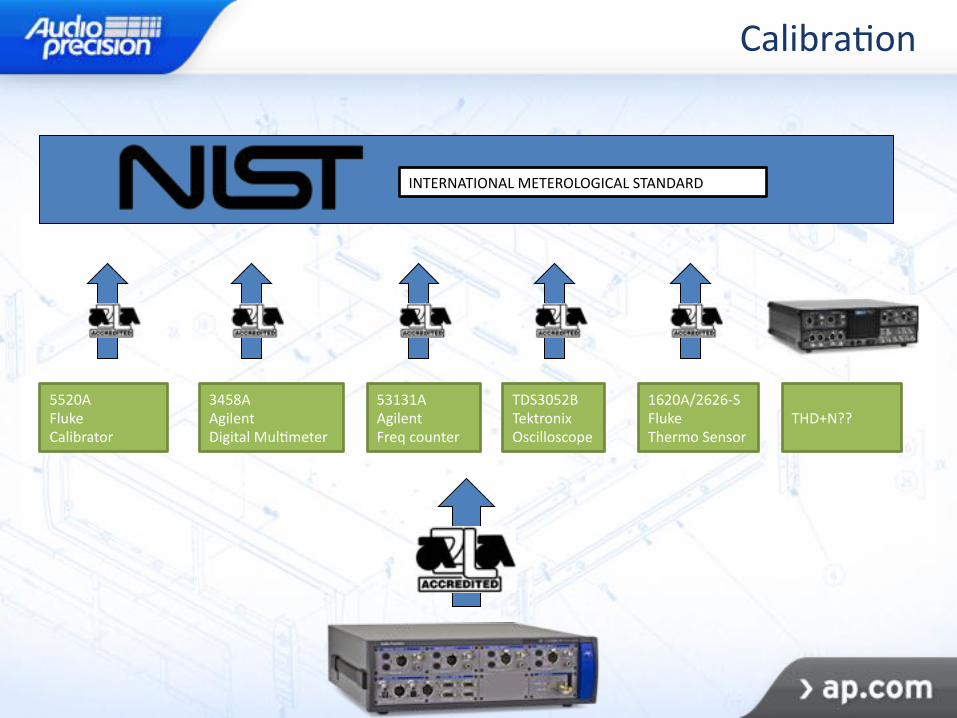
Calibra=on
5520AFlukeCalibrator
3458AAgilentDigitalMul=meter
53131AAgilentFreqcounter
TDS3052BTektronixOscilloscope
1620A/2626-SFlukeThermoSensor
INTERNATIONALMETEROLOGICALSTANDARD
THD+N??
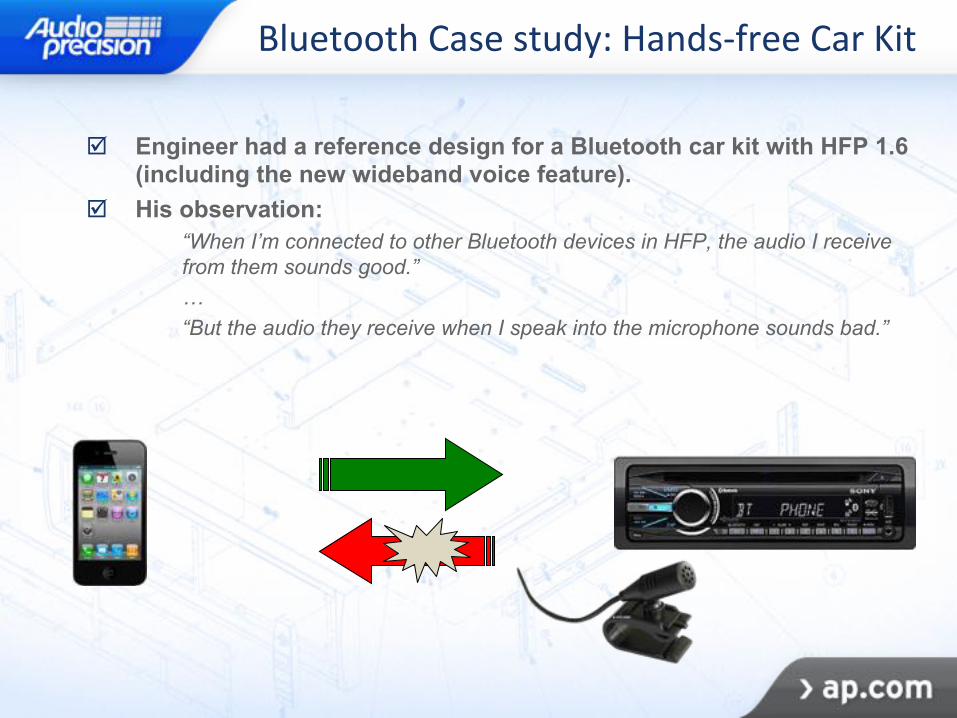
BluetoothCasestudy:Hands-freeCarKit
" Engineer had a reference design for a Bluetooth car kit with HFP 1.6 (including the new wideband voice feature).
" His observation: “When I’m connected to other Bluetooth devices in HFP, the audio I receive from them sounds good.” … “But the audio they receive when I speak into the microphone sounds bad.”
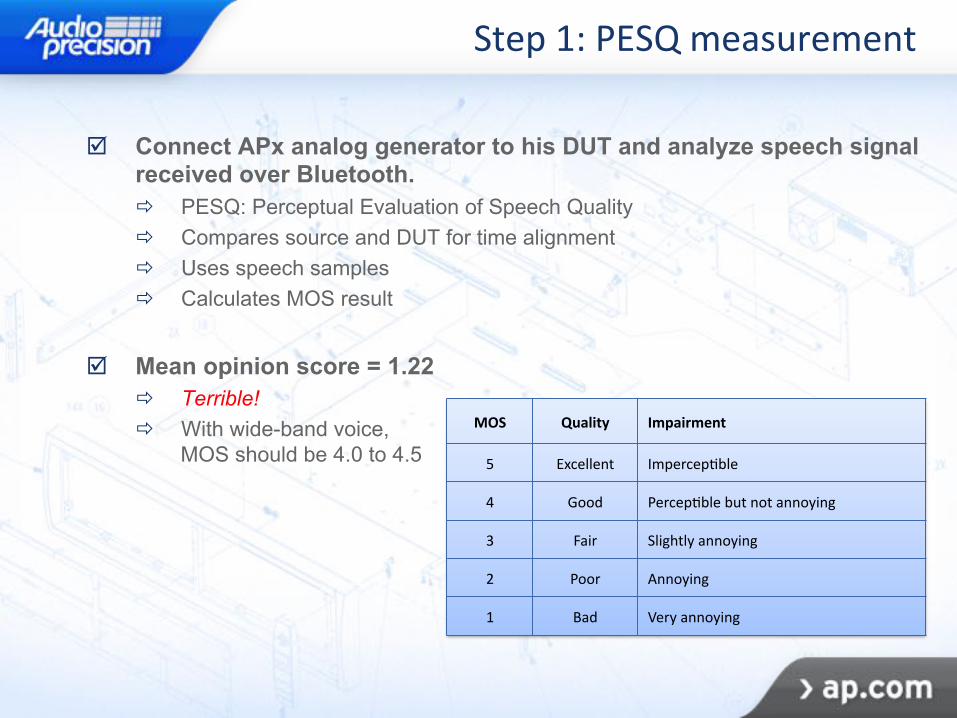
Step1:PESQmeasurement
" Connect APx analog generator to his DUT and analyze speech signal received over Bluetooth. ! PESQ: Perceptual Evaluation of Speech Quality ! Compares source and DUT for time alignment ! Uses speech samples ! Calculates MOS result
" Mean opinion score = 1.22
! Terrible! ! With wide-band voice,
MOS should be 4.0 to 4.5 MOS Quality Impairment
5 Excellent Impercep=ble
4 Good Percep=blebutnotannoying
3 Fair Slightlyannoying
2 Poor Annoying
1 Bad Veryannoying
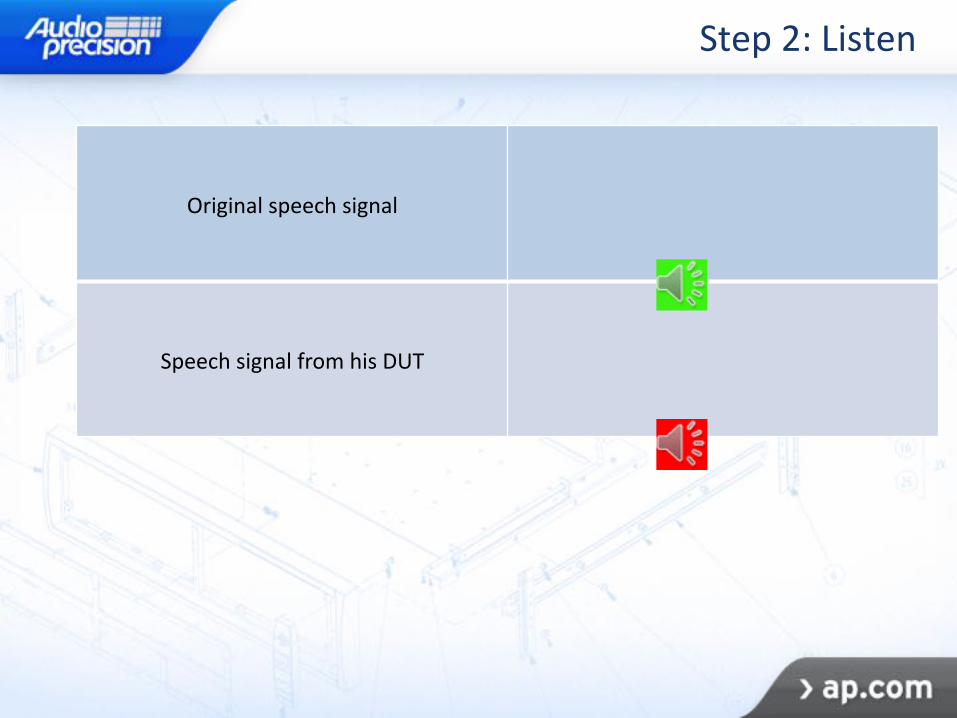
Step2:Listen
Originalspeechsignal
SpeechsignalfromhisDUT
Step3:Diagnos=cTests
" Generate some pure sine signals through the DUT and observe the results.
" In the following FFT spectrum plots, you can clearly see something wrong.
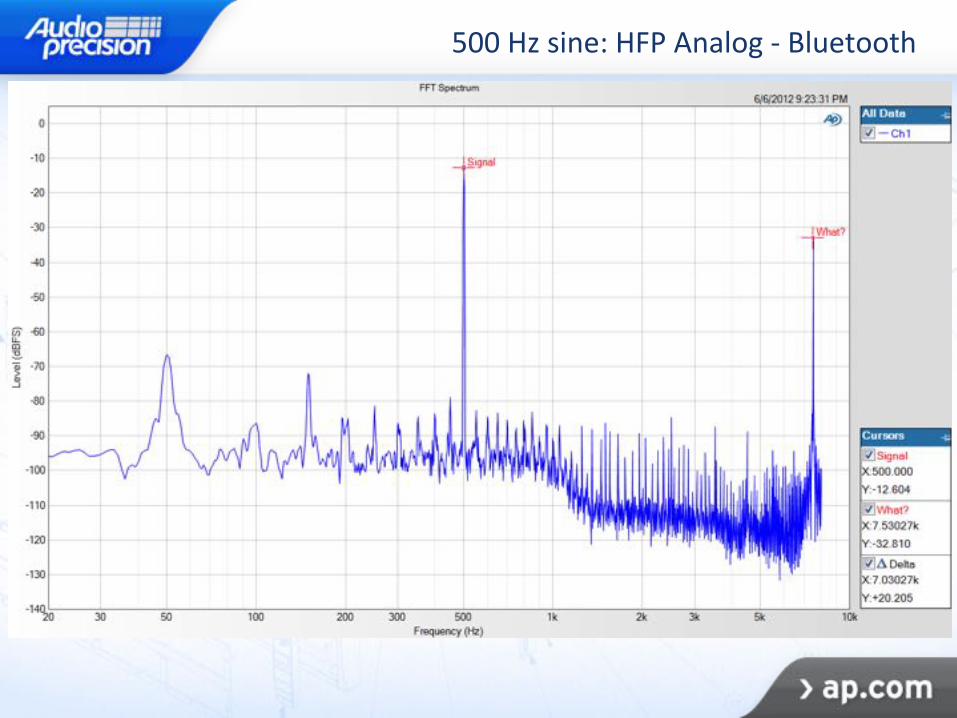
500Hzsine:HFPAnalog-Bluetooth
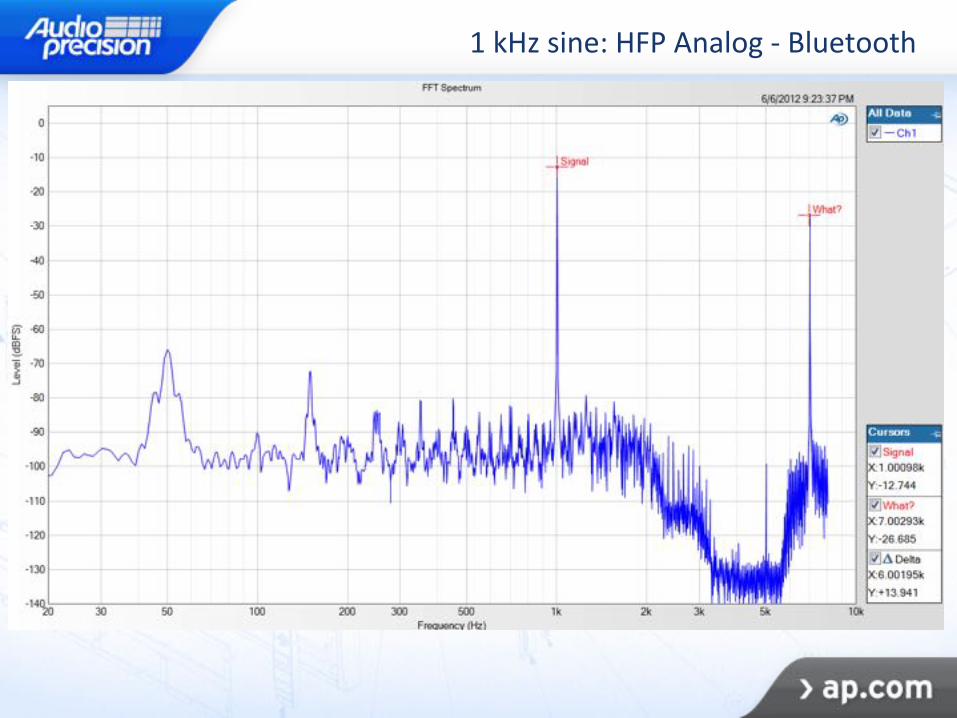
1kHzsine:HFPAnalog-Bluetooth
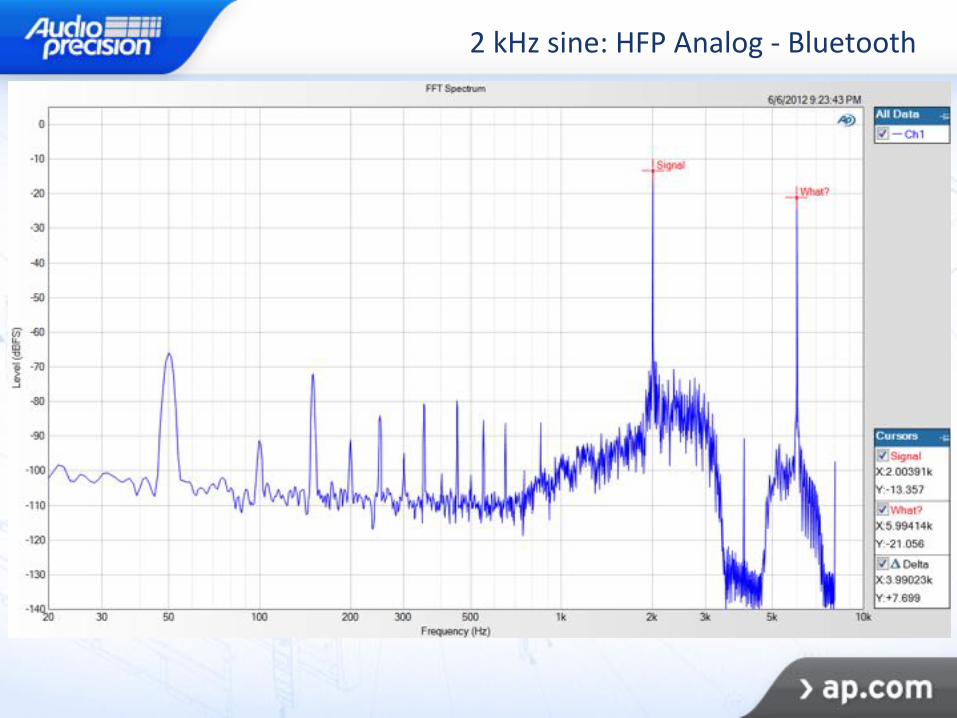
2kHzsine:HFPAnalog-Bluetooth
Observa=onsfromFFTspectra
" DUT has significant distortion due to a spurious tone at: ftone = 8 kHz – fsignal
" Level of spurious tone increases as the frequency of the signal " Note: 8 kHz = sample rate /2 Conclusion:
Clearly a DSP problem.

Bluetoothin–analogout?
" In Part 1, we looked at the signal transmitted by his DUT with analog in and Bluetooth out.
" Next, we look at the opposite direction: Bluetooth in and analog out (the signal from the phone calling the car kit).
Customer’s observation: “In this direction, the audio sounds good.”
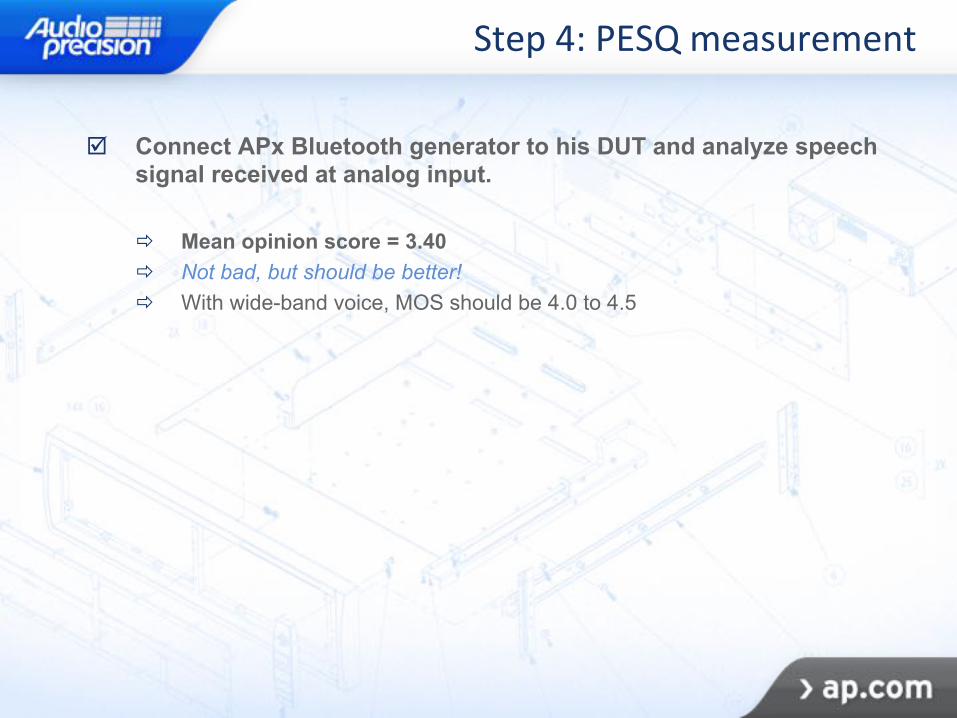
Step4:PESQmeasurement
" Connect APx Bluetooth generator to his DUT and analyze speech signal received at analog input.
! Mean opinion score = 3.40 ! Not bad, but should be better! ! With wide-band voice, MOS should be 4.0 to 4.5
Step6:Listen
Originalspeechsignal
SpeechsignalfromhisDUT(BTinanalogout)
• If you listen carefully, to the signal from the DUT, you will notice that the high frequency sounds from consonants are not as sharp as the original.
• This sounds more like narrow band speech than wide-band

FrequencyResponseofDUT
• Notethatfrequencies>4kHzareaNenuated.
• Thiswouldbeexpectedfornarrowbandvoice(Fs=8kHz).
• Forwide-bandvoice(Fs=16kHz)frequencyresponseshouldbeflatto8kHz
Observa=onfromFrequencyResponse
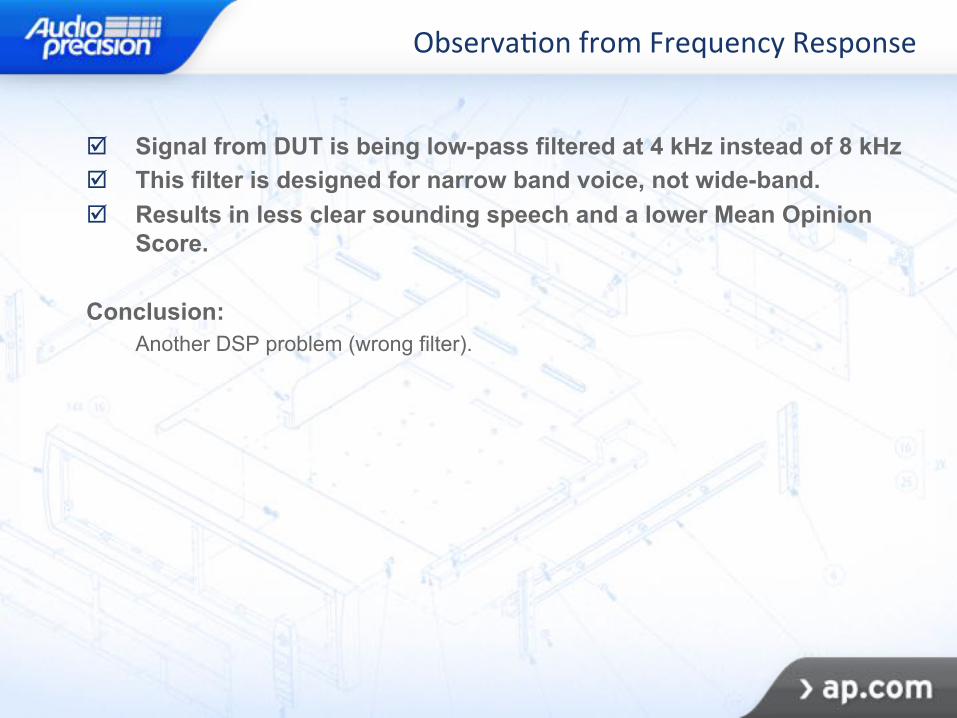
" Signal from DUT is being low-pass filtered at 4 kHz instead of 8 kHz " This filter is designed for narrow band voice, not wide-band. " Results in less clear sounding speech and a lower Mean Opinion
Score. Conclusion:
Another DSP problem (wrong filter).
Conclusions…
" In ~ 1.5 hours, we were able to find and diagnose some serious problems with this Bluetooth device.
" Using the “hello, …hello, … can you hear me now?” method, you would never be able to find the problems or offer clues to fix.
ForMoreInforma=on
47
" Free books: ! Measurement Techniques for Digital Audio
# ap.com/display/file/17 ! The Audio Measurement Handbook
# ap.com/display/file/24
" Thomas Williams: [email protected]

Whytes=ngisimportant
" How much is an hour of dead air? " Do you want to be told about an error by a concerned listener?
Audio analyzer or sound card?
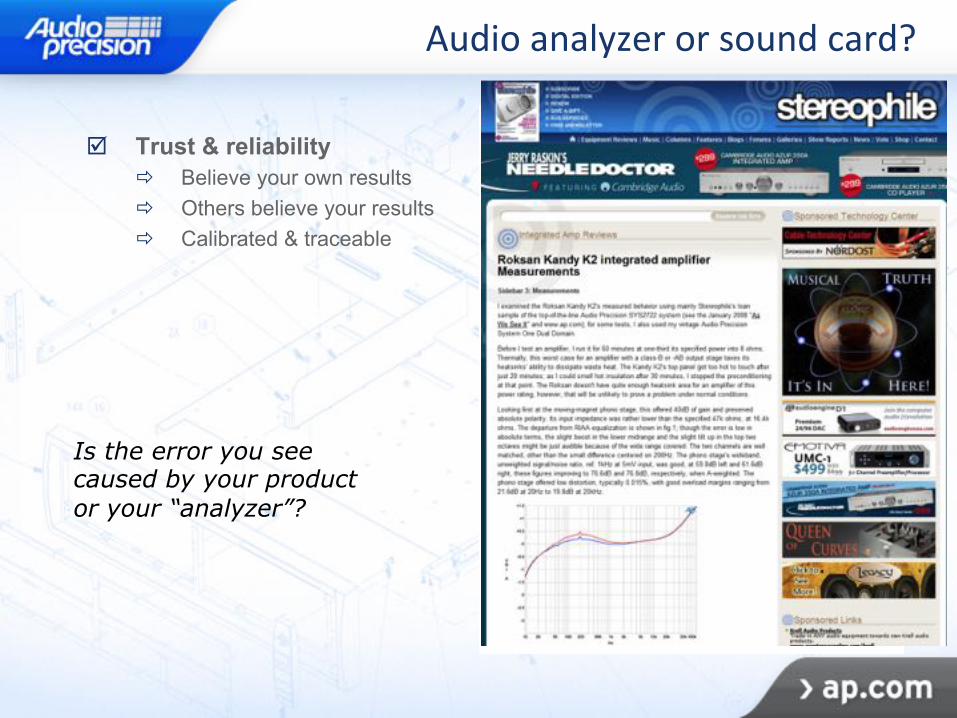
Audioanalyzerorsoundcard?
" Trust & reliability ! Believe your own results ! Others believe your results ! Calibrated & traceable
Is the error you see caused by your product or your “analyzer”?

Audioanalyzerorsoundcard?
" Productivity & sophisticated measurements ! No wasted time ! Built in measurements & proven algorithms ! Easy to share test data with others ! Professional technical support
Who do you call when there’s a problem?
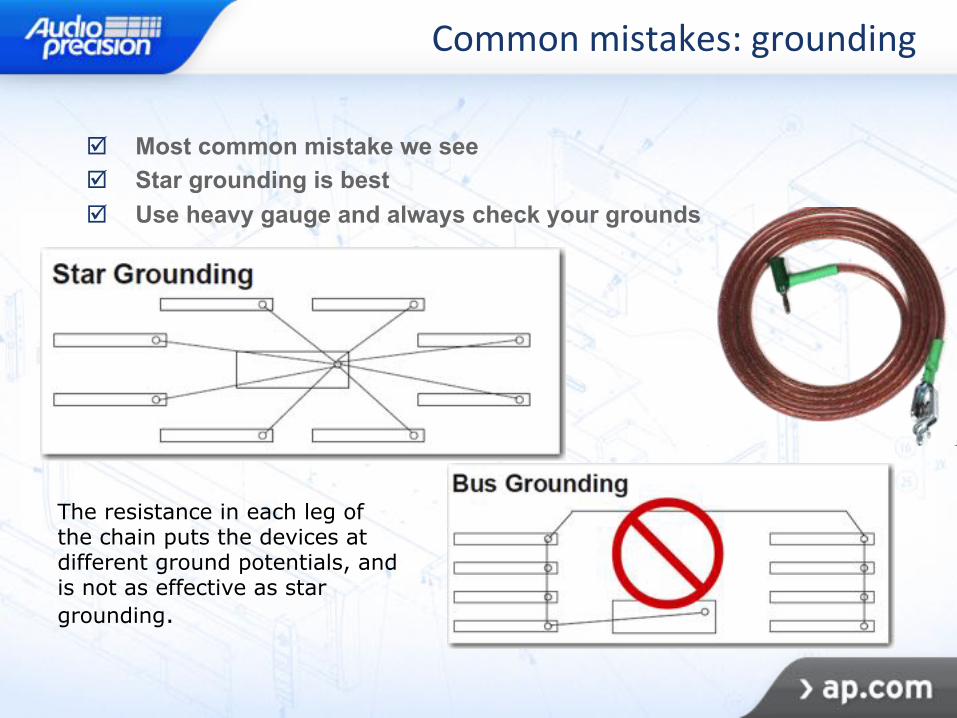
Commonmistakes:grounding
" Most common mistake we see " Star grounding is best " Use heavy gauge and always check your grounds
The resistance in each leg of the chain puts the devices at different ground potentials, and is not as effective as star grounding.
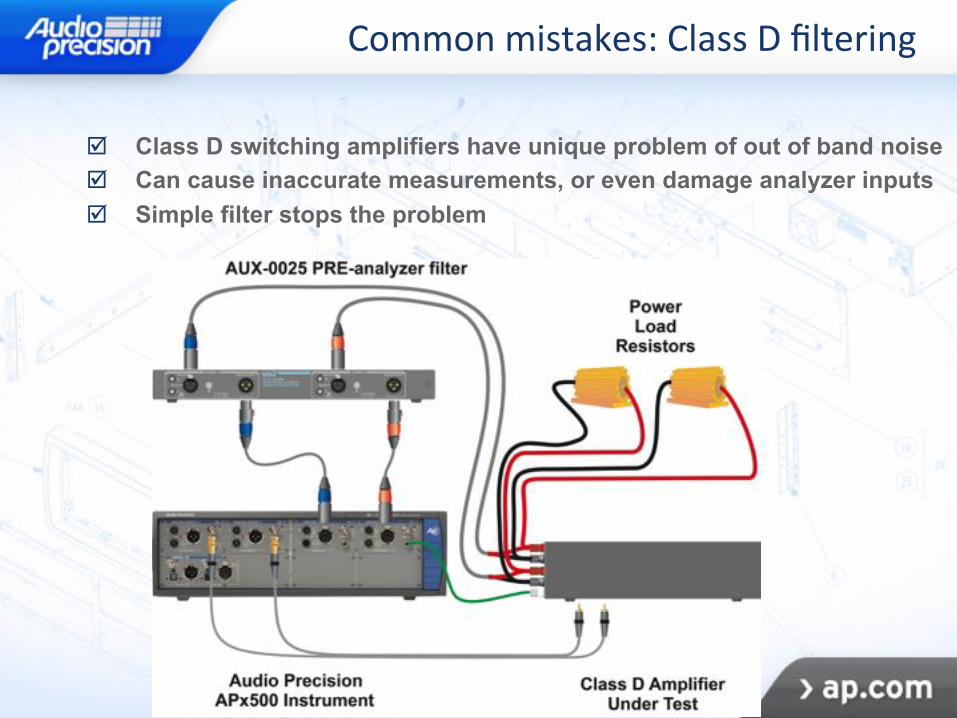
Commonmistakes:ClassDfiltering
" Class D switching amplifiers have unique problem of out of band noise " Can cause inaccurate measurements, or even damage analyzer inputs " Simple filter stops the problem
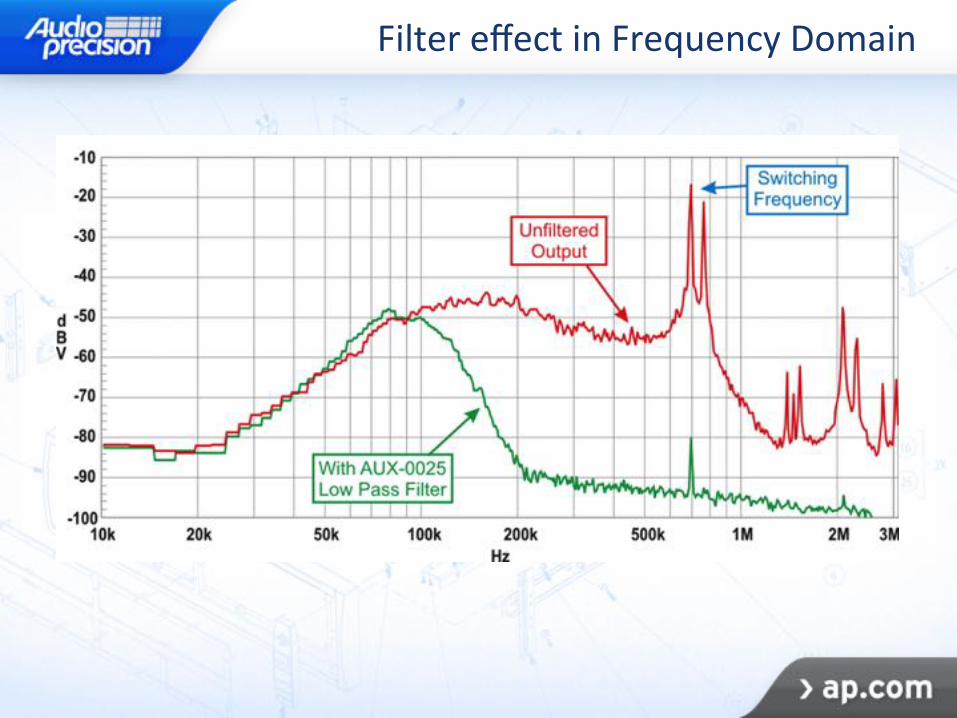
FiltereffectinFrequencyDomain

PRE-analyzerfiltereffectinTimeDomain
" Typical Class D Low-level Output Signal Audio signal is masked by switching artifacts.
" Output Signal after PRE- analyzer filtering Audio signal is now clearly visible.
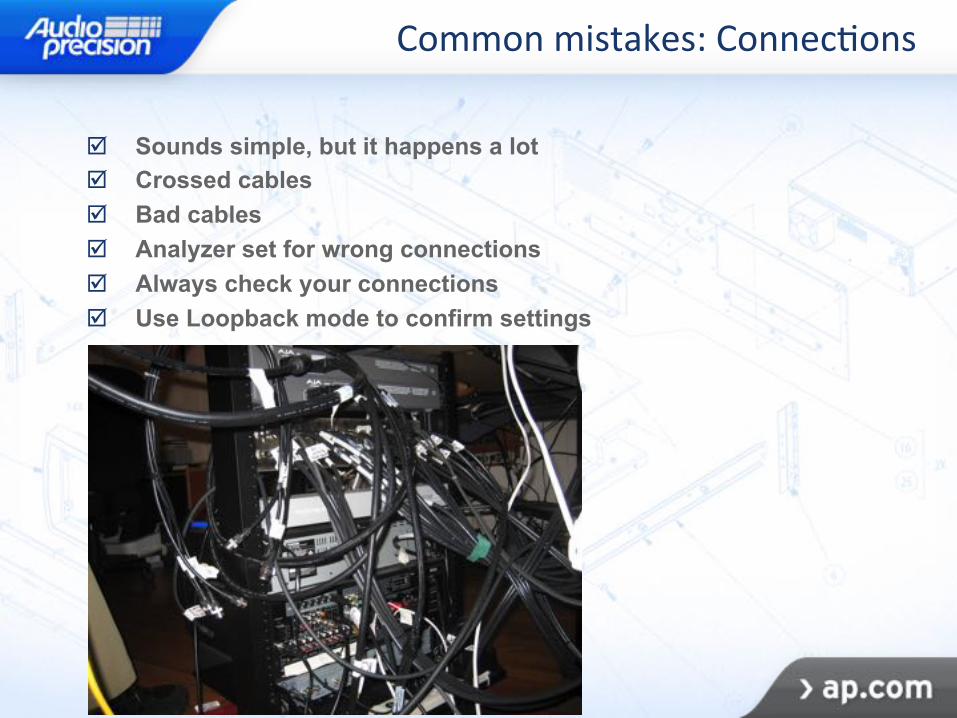
Commonmistakes:Connec=ons
" Sounds simple, but it happens a lot " Crossed cables " Bad cables " Analyzer set for wrong connections " Always check your connections " Use Loopback mode to confirm settings

2700Series
Most advanced analyzer for R&D • Vanishingly low residual noise and THD
+N: —115 dB @ 2.0 Vrms • True Dual Domain – analog and digital • Generate and analyze a wide range of
waveforms • API automation • LabVIEW integration • Chip-level connectivity with PSIA • User-defined sweeps, switcher
support up to 192 channels
The world’s highest performance audio analyzer
THD+N of AP 2700 (Black) compared with 5 other audio analyzers
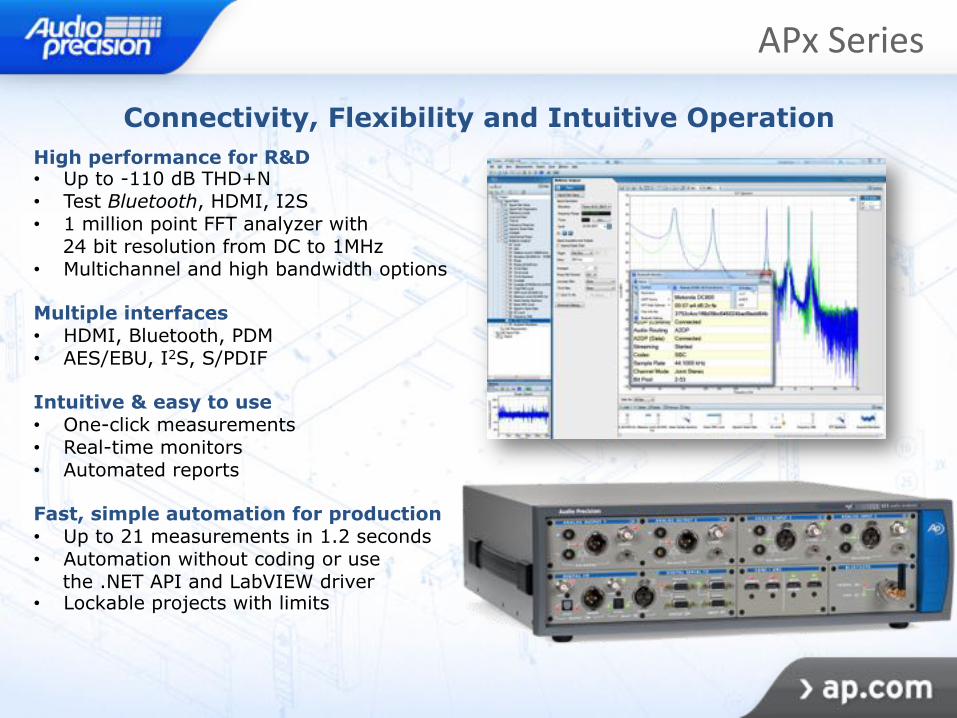
APxSeries
High performance for R&D • Up to -110 dB THD+N • Test Bluetooth, HDMI, I2S • 1 million point FFT analyzer with
24 bit resolution from DC to 1MHz • Multichannel and high bandwidth options
Multiple interfaces • HDMI, Bluetooth, PDM • AES/EBU, I2S, S/PDIF Intuitive & easy to use • One-click measurements • Real-time monitors • Automated reports Fast, simple automation for production • Up to 21 measurements in 1.2 seconds • Automation without coding or use
the .NET API and LabVIEW driver • Lockable projects with limits
Connectivity, Flexibility and Intuitive Operation