tomography author manuscript nih public access narendran
TRANSCRIPT
ASSESSMENT OF TISSUE OPTICAL CLEARING AS A FUNCTIONOF GLUCOSE CONCENTRATION USING OPTICAL COHERENCETOMOGRAPHY
NARENDRAN SUDHEENDRAN*, MOHAMED MOHAMED†, MOHAMAD G. GHOSN†,‡,VALERY V. TUCHIN§,¶, and KIRILL V. LARIN*,†,§,||
* Department of Electrical and Computer Engineering, University of Houston, N308 EngineeringBuilding 1, Houston, TX 77204, USA† Department of Biomedical Engineering, University of Houston, 2028 SERC Building, Houston,TX 77204, USA‡ Department of Medicine, Baylor College of Medicine, Houston, TX 77030, USA§ Institute of Optics and Biophotonics, Saratov State University, Saratov 410012, Russia¶ Institute of Precise Mechanics and Control of RAS, Saratov 410056, Russia
AbstractOne of the major challenges in imaging biological tissues using optical techniques, such as opticalcoherence tomography (OCT), is the lack of light penetration due to highly turbid structureswithin the tissue. Optical clearing techniques enable the biological samples to be more opticallyhomogeneous, allowing for deeper penetration of light into the tissue. This study investigates theeffect of optical clearing utilizing various concentrations of glucose solution (10%, 30%, and50%) on porcine skin. A gold-plated mirror was imaged beneath the tissue and percentage clearingwas determined by monitoring the change in reflected light intensity from the mirror over time.The ratio of percentage clearing per tissue thickness for 10%, 30% and 50% glucose wasdetermined to be 4.7 ± 1.6% mm−1 (n = 6), 10.6 ± 2.0% mm−1 (n = 7) and 21.8 ± 2.2% mm−1 (n =5), respectively. It was concluded that while higher glucose concentration has the highest opticalclearing effect, a suitable concentration should be chosen for the purpose of clearing, consideringthe osmotic stress on the tissue sample.
KeywordsGlucose; porcine skin; percent clearing; scattering coefficient; optical coherence tomography
1. IntroductionOptical coherence tomography (OCT) has become popular as a tissue imaging anddiagnostic technique during the past two decades.1–3 OCT performs axial imaging byfollowing the principles of low-coherence interferometry (LCI),4 using a broadband lasersource (typically operating in NIR spectral range), an interferometer (usually a Michelsoninterferometer), and a detection device (such as a photodetector, CCD array). Transversescanning of the laser beam across tissue surface using galvanometer mirrors allows
© World Scientific Publishing Company||Corresponding author. [email protected].
NIH Public AccessAuthor ManuscriptJ Innov Opt Health Sci. Author manuscript; available in PMC 2011 June 20.
Published in final edited form as:J Innov Opt Health Sci. 2010 ; 3(3): 169–176. doi:10.1142/S1793545810001039.
NIH
-PA Author Manuscript
NIH
-PA Author Manuscript
NIH
-PA Author Manuscript

reconstructing 2D and 3D images. With an axial resolution of ~2–20 μm,1,2 OCT isadvantageous compared to existing non-optical imaging modalities such as magneticresonance imaging (MRI) and ultrasound imaging in terms of resolution, capability of real-time imaging, and cost. OCT is capable of achieving 2–6 mm imaging depth in biologicaltissues,5,6 still superior compared to other 3D optical imaging modalities such as confocalmicroscopy or multiphoton microscopy with imaging depths that are less than 500 μm,making it ideal for sub-surface imaging. However, a major drawback of all opticaltechniques, including OCT, is the distortion and attenuation of light beam due to scatteringand absorption in turbid tissues, which limits the achievable imaging depth.7–10
The refractive index (RI) mismatch between the intracellular fluid, cell organelles,extracellular fluid and fiber structures is a major cause for the optical inhomogeneities intissues, which in turn results in highly scattering media.11,12 For example, the skin is amultilayered structure, where each layer contains different components with varying opticalproperties.8,13,14 The presence of melanin (RI = 1.7), fully hydrated collagen (RI = 1.43),adipose tissue (RI = 1.46), and cellular nuclei (RI = 1.39 – 1.41) on the background of lowrefractive index of cell cytoplasm and interstitial fluid (RI = 1.34) causes high scattering inthe epidermis and the dermis layers of the skin.8,13 High scattering in the upper layers oftissues attenuates the light before it can reach the deeper layers, hence, limiting imagingdepth of optical imaging techniques.
Recent studies have been aimed at altering turbid biological tissues in such a way that theybecome more optically transparent while keeping their internal structure intact.8,12,15–17
These optical clearing techniques can be accomplished by introducing so-called opticalclearing agent (OCA) — a chemical compound with distinct osmotic properties such asglucose and glycerol.8–10 As the OCA diffuses through the tissue, it replaces water viaosmotic forces.8–10 This process is responsible for matching the refractive index of the intra-cellular and extracellular fluids, which results in a more optically homogeneous tissue,thereby reducing the scattering coefficient.8,13 Other changes in the scattering properties ofthe tissue could be due to dehydration of the tissue18 or the dissociation of collagen fibers19
occurring due to the addition of the OCA.
Previously, the effects of optical clearing and diffusion potency of different OCA agents(such as glucose solution, glycerol, and propylene glycol) and their potential as a function oftissue composition have been studied in different biological tissues such as corneal andsclera of the eye, vasculature, and skin.12,20–30 It has been shown that high concentrations ofOCAs could potentially constrict and even block blood vessels in applied area and, thus,reduce local delivery of oxygen and nutrients.28 Therefore, it is necessary to determine anappropriate concentration of OCA which can cause a required change in contrast in allottedtime and having minimal impact on the health of tissue sample. The focus of this study wasto investigate the effect of optical clearing on thick epithelial tissue samples (~1.5 mm), suchas porcine skin, using varying concentrations of glucose in saline (10%, 30%, and 50%) forduration of up to three hours. A gold-plated mirror positioned beneath the tissue sample wasimaged in order to monitor the change in reflected light intensity from the mirror. Thepercent clearing of the tissue was then correlated to this change in reflected light intensity.Metal reflectors are commonly used to measure back reflectance intensities. They have beenemployed to assess the optical clearing of blood based on aggregation and sedimentation ofblood cells.31
SUDHEENDRAN et al. Page 2
J Innov Opt Health Sci. Author manuscript; available in PMC 2011 June 20.
NIH
-PA Author Manuscript
NIH
-PA Author Manuscript
NIH
-PA Author Manuscript
2. Materials and Methods2.1. SS-OCT system
The swept-source OCT (SS-OCT) system (Fig. 1) employed in this study utilized abroadband swept-source laser (Thorlabs, SL1325-P16) with a wavelength range of 1325 ±50 nm, which corresponds to an axial resolution of 8 μm (in air). The laser swept at afrequency of 16 kHz with an average output power of 10 mW. The imaging depth of thesystem is 3 mm (in air) and has a transverse resolution of 15 μm. A balanced photodetector(Thorlabs, PDB140C) was used to detect the inter-ferogram signal resulting frombackscattered light from the sample arm and backreflected light from reference arm of theinterferometer. This signal is calibrated into linear k-space using a Mach–Zehnderinterferometer (MZI) clock. An in-depth profile (A-scan) was reconstructed by performingfast Fourier transform (FFT) on the calibrated signal. A 2D image was acquired byperforming transverse scanning with galvanometer-mounted mirrors. A 2D image consistedof 512 × 512 pixels with a scanning range of 1 × 3 mm in the x and z direction, respectively.
2.2. TissuesPorcine ears were obtained from a local market. The sections (1.55 ± 0.14 mm) of skinsamples from the ear were cut into squares (1 × 1 cm2) and stored in saline to preventdehydration. The epidermis, dermis and a layer of subcutaneous fat were preserved in thesamples. Custom-made gold-plated mirrors (5 × 5 mm2) were used in these experiments as areference reflector due to gold’s strong back-reflectance characteristic for observing theeffect of optical clearing. Glucose solutions were prepared in physiological saline.
Tissue samples were placed in saline solution at room temperature, 30 minutes prior to theonset of the experiment, in order to reach room temperature for the specimen. The mirrorwas placed in a Petri dish under the tissue sample and the entire setup was fully submergedin saline to preserve hydration of the tissue during the experiment. The skin sample wasimaged ensuring the presence of the mirror. Images were recorded every 10 seconds, for aperiod of 10 minutes to form a baseline. Following the 10-minute period, the saline wasremoved from the Petri dish and replaced with 10%, 30%, or 50% glucose solutions(prepared from the saline). Imaging was then performed for three hours to monitor thechange in the intensity of light reflected by the mirror. Control experiments were performedby imaging skin samples under similar conditions with no addition of glucose for a period ofthree hours. Mineral oil was added on the surface of solution prior to imaging to minimizeevaporation, ensuring minimal change in the focus of the light, which in turn couldcontribute to the change in intensity. Several trials were performed for each control andconcentration of glucose (Control: n = 6; 10%: n = 6; 30%: n = 7; 50%: n = 5) to statisticallyprocess experimental data.
2.3. Data processingA MATLAB code was written to calculate the intensity of light reflected from the mirrorsurface over time. The algorithm detects the maximum intensity within a specified depthregion (corresponding to the surface of the mirror) within an A-scan. Similarly, lightintensity corresponding to the mirror’s surface was determined for all A-scans in a 2D imageand averaged together to obtain a single value. This averaged value corresponded to aparticular instant of time. The averaged intensity values were obtained for all time instancesthroughout the duration of the experiment. The obtained intensity values versus time plotwere fitted using an exponential fit curve in the form I(t) = A(1 − e−Bt), where I is theaveraged intensity, t is the time, and A and B are fit parameters. For exponential fitting,averaged intensity values obtained after the addition of glucose were considered andaccordingly re-indexed to begin at t = 0 minutes. Further, all the intensity values of the new
SUDHEENDRAN et al. Page 3
J Innov Opt Health Sci. Author manuscript; available in PMC 2011 June 20.
NIH
-PA Author Manuscript
NIH
-PA Author Manuscript
NIH
-PA Author Manuscript
data set, I(t), were subtracted by the first intensity value I(0), so that the exponential fit isperformed on relative changes in intensity over time. For control experiments, a linear fit inthe form I(t) = At + B instead of the exponential fit was used. For a particular glucoseconcentration, mean value and standard deviation of intensity at an instance in time isobtained from corresponding n exponentially fitted curves at that time instant. Thepercentage clearing of a trial is determined from the initial intensity (Iinitial at t = 0 minutes)and final intensity (Ifinal at t = 180 minutes) using Eq. (2).
(1)
Percentage clearing/thickness ratio was determined for the purpose of normalization withrespect to tissue thickness.
3. ResultsTypical changes in intensity of the light reflected from the gold-plated mirror in experimentswith 50% glucose solution are depicted in Fig. 2. Figure 2(a) presents a 2D image acquiredby the SSOCT setup immediately after the addition of 50% glucose solution (t = 0 minutes).It is observed from the figure that the mirror is barely visible as the intensity of lightreflected from it is very low. The image depicted in Fig. 2(b) was acquired 35 minutes pastthe addition of the glucose solution. It is observed from the figure that the intensity ofreflected light from the mirror has increased. The continuous rise in the intensity of reflectedlight from the mirror can be observed from Figs. 2(c)–2(f), which were acquired 70, 105,140, 165 minutes past the addition of glucose solution, respectively. The averaged intensityof mirror as a function of time is shown in Fig. 2(g). The flat region in the plot occurringprior to the addition of glucose solution (t = 0 minutes) shows that the intensity of lightreflected from the mirror had remained constant, indicating that no optical clearing hasoccurred due to the presence of saline or mineral oil. However, the reflected light has startedto increase soon after the addition of glucose, increasing at an exponential rate while thethickness of tissue sample is decreasing due to osmotic replacement of water.
The exponential fit is performed on intensity values obtained starting from the addition ofglucose solution (t = 0 minutes) after subtracting all intensity values by I(0), so that theexponential fit is performed on relative changes in intensity. Figure 3 depicts the intensitychanges of light reflection from the gold mirror as a function of time and the correspondingexponential fit of a 50% glucose trial. A R2 value of 0.995 indicates a strong correlationbetween the intensity values and their exponential fit.
The averaged curves of all the glucose concentration along with their respective tissuethickness range are plotted in Fig. 4. It is observed that the rise in intensity is maximal for50% glucose trials followed by 30% glucose solutions and 10% glucose solutions at anyinstant of time. The obtained results for the different concentrations can be compared sincethe tissues used for all glucose concentrations were within a narrow range of thicknesses.The exponential fitting of the experimental data [in the form of I(t) = A(1 − e−Bt)] yieldedfitting parameter A (indicating the maximal changes in signal intensity upon saturation) to beequal to 41 ± 9 dB, 15 ± 4 dB, and 4 ± 2 dB for 50%, 30%, and 10% glucose solution,respectively in these experiments. Correspondingly, the fitting parameter B (reciprocal ofwhich indicates the time needed to reach the saturation) is found to be 0.012 ±0.005 min−1,0.032 ±0.033 min−1, and 0.043 ± 0.018 min−1 for 50%, 30%, and 10% glucose solution,respectively. These data clearly indicate that more concentrated solutions give higher
SUDHEENDRAN et al. Page 4
J Innov Opt Health Sci. Author manuscript; available in PMC 2011 June 20.
NIH
-PA Author Manuscript
NIH
-PA Author Manuscript
NIH
-PA Author Manuscript
clearing effect whereas it requires more time to reach the saturation. The small changes inintensity during the control experiments (~1.5 dB) could be attributed to the change in thefocus of the light, which may occur due to little evaporation of solution over 180 minutes ofexperimentation time.
The percentage clearing was obtained using Eq. (2). The percentage clearing/thickness ratiowas determined to be 4.7 ± 1.6% mm−1 (n = 6), 10.6 ± 2.0% mm−1 (n = 7) and 21.8 ± 2.2%mm−1 (n = 5) for 10%, 30% and 50% glucose solutions, respectively, after a period of 180minutes, and plotted in Fig. 5. High standard deviation for a particular concentration ofglucose is mainly caused by the nonuniformity of thicknesses of studied tissue samples.
4. DiscussionThe presented results indicate the capability of OCT to monitor and quantify the effects ofoptical clearing on porcine skin continuously for a period of 180 minutes. The changes inthe intensity of light penetrating to deep tissue regions due to optical clearing of bulk tissueare inferred by monitoring the changes in the intensity of reflected light from a gold-platedmirror. Percentage clearing was monitored as a function of intensity changes of reflectedlight from the mirror over time. The results indicate that the highest optical clearing occursfor 50% glucose solution, followed by the 30% and 10% glucose solutions.
The intensity of reflected light from the mirror gradually increases, as observed in Figs.2(a)–2(f), indicating that intensity of light penetrating to deeper regions of porcine skin isincreasing as the top regions of the tissue are progressively clearing. Further, tissuethickness appears to have decreased through the course of the experiment indicating thedehydration of tissue, which is a potential cause for optical clearing due to better ordering oftissue scatterers (collagen and elastin fibers) and refractive index matching, caused by water(having the lowest refractive index) leaving interstitial space. It was determined that thetissue thickness changed by ~25%, ~6% and ~4% for 50%, 30% and 10% glucose solutionsrespectively, over the course of the experiment. Additional refractive index matching, whichoccurred due to introduction of glucose solution into tissue bulk, is another factor of opticalclearing. Percentage clearing/thickness ratio was determined to be 4.7 ± 1.6% mm−1 (n = 6),10.6 ± 2.0% mm−1 (n = 7) and 21.8 ± 2.2% mm−1 (n = 5) for 10%, 30% and 50% glucosesolutions, respectively, after a period of 180 minutes. The reasons for the high standarddeviation for the individual concentrations could be the difference in tissue samples,inhomogeneities in the tissue and other physical parameters. The flat nature of the baseline[Fig. 2(g)] and the constant intensity in the control experiments (Fig. 4) indicate that neithermineral oil nor saline, added in small amount to prevent liquid evaporation, induces anyoptical clearing properties.
The results from this study indicate that more concentrated solutions of OCAs can inducehigher clearing effect in tissues. On the other hand, previous in vivo studies havedemonstrated that some short-term and long-term effects of OCAs on blood circulatorysystem are possible, including stasis of blood flow in vessels.28 On the model system, suchas blood vessels in chick chorioallantoic membrane, it was shown that short-term (less than30 min) effects of glucose on blood vessels are smaller than those of glycerol, but long-term(two days) effects of glucose are greater.28 Therefore, it is very critical to establish theoptimal amounts that could be applied for maximal (local) clearing effects and, at the sametime, would not cause serious damage to different tissues (in particular application ofclearing agents to skin, accompanied blood stasis could be of less importance as for othertissues with a superficial blood vessel structure). That would be the subject for our nextstudies.
SUDHEENDRAN et al. Page 5
J Innov Opt Health Sci. Author manuscript; available in PMC 2011 June 20.
NIH
-PA Author Manuscript
NIH
-PA Author Manuscript
NIH
-PA Author Manuscript
5. ConclusionIn this study we have monitored intensity changes of reflected light from a gold-platedmirror placed below porcine skin. These changes were induced by the addition of variousconcentrations of glucose due to the effect of optical clearing. We conclude that OCT iscapable of continuous monitoring of changes occurring due to optical clearing. Introducingan optical clearing agent to a biological tissue could assist in widening the range ofapplications of OCT in various studies. This is yet another attempt to resolve the problem oflack of penetration depth within turbid media studied by optical imaging techniques. Ahigher concentration of an optical clearing agent, for instance, proved to have a higherclearing effect than lower ones, consistent with previous published studies. An optimalconcentration of glucose solution must be considered for optical clearing taking into accountthe time taken for that glucose solution to achieve a required clearing percentage and theosmotic stress it induces on the tissue. Further studies will be performed to quantify the mosteffective glucose concentration in biological tissues.
AcknowledgmentsThis study was supported in part by grants from the Institute of Biomedical Imaging Sciences (IBIS-97708), CRDF(RUB1-2932-SR-08), and NSF (CMMI-0900743). VVT was additionally supported by grants 224014Photonics4life-FP7-ICT-2007-2; RF Ministry of Science and Education 2.1.1/4989 and 2.2.1.1/2950, Project 1.4.09of Federal Agency of Education of RF; the RF Governmental contracts 02.740.11.0484 and 02.740.11.0770.
References1. Huang D, Swanson EA, Lin CP, Schuman JS, Stinson WG, Chang W, Hee MR, Flotte T, Gregory
K, Puliafito CA, Fujimoto JG. Optical coherence tomography. Science. 1991; 254:1178–1181.[PubMed: 1957169]
2. Tomlins PH, Wang RK. Theory, developments and applications of optical coherence tomography. JPhys D Appl Phys. 2005; 38:2519.
3. Drexler, W.; Fujimoto, JG. Optical Coherence Tomography: Technology and Applications.Springer; New York: 2008.
4. Fercher AF, Mengedoht K, Werner W. Eye-length measurement by interferometry with partiallycoherent-light. Opt Lett. 1988; 13:186–188. [PubMed: 19742022]
5. Manapuram R, Manne V, Larin KV. Development of phase-stabilized swept-source OCT for theultrasensitive quantification of microbubbles. Laser Phys. 2008; 18:1080–1086.
6. Larina IV, Sudheendran N, Ghosn MG, Jiang J, Cable A, Larin KV, Dickinson ME. Live imaging ofblood flow in mammalian embryos using Doppler swept-source optical coherence tomography. JBiomed Opt. 2008; 13:060506. [PubMed: 19123647]
7. Xu X, Wang RK, Elder JB. Optical clearing effect on gastric tissues immersed with biocompatiblechemical agents investigated by near infrared reflectance spectroscopy. J Phys D Appl Phys. 2003;36:1707.
8. Tuchin, VV. Tissue Optics: Light Scattering Methods and Instruments for Medical Diagnosis. SPIEPress; Bellingham, Washington: 2007.
9. Tuchin, VV. Optical Clearing of Tissues and Blood. SPIE Press; Bellingham, WA: 2005.10. Larina IV, Carbajal EF, Tuchin VV, Dickinson ME, Larin KV. Enhanced OCT imaging of
embryonic tissue with optical clearing. Laser Phys Lett. 2008; 5:476–479.11. Tuchin VV, Maksimova IL, Zimnyakov DA, Kon IL, Mavlyutov AH, Mishin AA. Light
propagation in tissues with controlled optical properties. J Biomed Opt. 1997; 2:401–417.12. Ghosn MG, Carbajal EF, Befrui NA, Tuchin VV, Larin KV. Differential permeability rate and
percent clearing of glucose in different regions in rabbit sclera. J Biomed Opt. 2008; 13:021110.[PubMed: 18465959]
13. Vargas G, Chan EK, Barton JK, HGR, Welch AJ. Use of an agent to reduce scattering in skin.Laser Surg Med. 1999; 24:133–141.
SUDHEENDRAN et al. Page 6
J Innov Opt Health Sci. Author manuscript; available in PMC 2011 June 20.
NIH
-PA Author Manuscript
NIH
-PA Author Manuscript
NIH
-PA Author Manuscript
14. Van Gemert MJC, Jacques SL, Sterenborg HJCM, Star WM. Skin optics. IEEE T Bio Med Eng.1989; 36:1146–1154.
15. Oldham M, Sakhalkar H, Oliver T, Johnson GA, Dewhirst M. Optical clearing of unsectionedspecimens for three-dimensional imaging via optical transmission and emission tomography. JBiomed Opt. 2008; 13:021113. [PubMed: 18465962]
16. Yoon J, Son T, Choi EH, Choi B, Nelson JS, Jung B. Enhancement of optical skin clearingefficacy using a microneedle roller. J Biomed Opt. 2008; 13:021103. [PubMed: 18465952]
17. Genina EA, Bashkatov AN, Korobko AA, Zubkova EA, Tuchin VV, Yaroslavsky I, Altshuler GB.Optical clearing of human skin: Comparative study of permeability and dehydration of intact andphotothermally perforated skin. J Biomed Opt. 2008; 13:021102. [PubMed: 18465951]
18. Vargas G, Chan KF, Thomsen SL, Welch AJ. Use of osmotically active agents to alter opticalproperties of tissue: Effects on the detected fluorescence signal measured through skin. Laser SurgMed. 2001; 29:213–220.
19. Yeh AT, Choi B, Nelson JS, Tromberg BJ. Reversible dissociation of collagen in tissues. J InvestDermatol. 2003; 121:1332–1335. [PubMed: 14675178]
20. Larin KV, Ghosn MG, Ivers SN, Tellez A, Granada JF. Quantification of glucose diffusion inarterial tissues by using optical coherence tomography. Laser Phys Lett. 2007; 4:312–317.
21. Ghosn MG, Carbajal EF, Befrui NA, Tellez A, Granada JF, Larin KV. Permeability ofhyperosmotic agent in normal and atherosclerotic vascular tissues. J Biomed Opt. 2008;13:010505. [PubMed: 18315350]
22. Larin KV, Tuchin VV. Functional imaging and assessment of the glucose diffusion rate inepithelial tissues in optical coherence tomography. Quantum Electron. 2008; 38:551–556.
23. Ghosn MG, Sudheendran N, Wendt M, Glasser A, Tuchin VV, Larin KV. Monitoring of glucosepermeability in monkey skin in vivo using optical coherence tomography. J Biophotonics. 2010;3:25–33. [PubMed: 19824024]
24. Zhu D, Wang J, Zhi Z, Wen X, Luo Q. Imaging dermal blood flow through the intact rat skin withan optical clearing method. J Biomed Opt. 2010; 15:026008. [PubMed: 20459253]
25. Liu C, Zhi Z, Tuchin VV, Luo Q, Zhu D. Enhancement of skin optical clearing efficacy usingphoto-irradiation. Lasers Surg Med. 2010; 42:132–140. [PubMed: 20166162]
26. Wen X, Mao Z, Han Z, Tuchin VV, Zhu D. In vivo skin optical clearing by glycerol solutions:Mechanism. J Biophotonics. 2010; 3:44–52. [PubMed: 19937846]
27. Wen X, Tuchin VV, Luo Q, Zhu D. Controlling the scattering of intralipid by using opticalclearing agents. Phys Med Biol. 2009; 54:6917–6930. [PubMed: 19887711]
28. Zhu D, Zhang J, Cui H, Mao Z, Li P, Luo Q. Short-term and long-term effects of optical clearingagents on blood vessels in chick chorioallantoic membrane. J Biomed Opt. 2008; 13:021106.[PubMed: 18465955]
29. Mao Z, Zhu D, Hu Y, Wen X, Han Z. Influence of alcohols on the optical clearing effect of skin invitro. J Biomed Opt. 2008; 13:021104. [PubMed: 18465953]
30. Zhi Z, Han Z, Luo Q, Zhu D. Improve optical clearing of skin in vitro with propylene glycol as apenetration enhancer. J Innovat Opt Health Sci. 2009; 2:245–251.
31. Tuchin VV, Xu X, Wang RK. Dynamic optical coherence tomography in studies of opticalclearing, sedimentation, and aggregation of immersed blood. Appl Opt. 2002; 41:258–271.[PubMed: 11900442]
SUDHEENDRAN et al. Page 7
J Innov Opt Health Sci. Author manuscript; available in PMC 2011 June 20.
NIH
-PA Author Manuscript
NIH
-PA Author Manuscript
NIH
-PA Author Manuscript
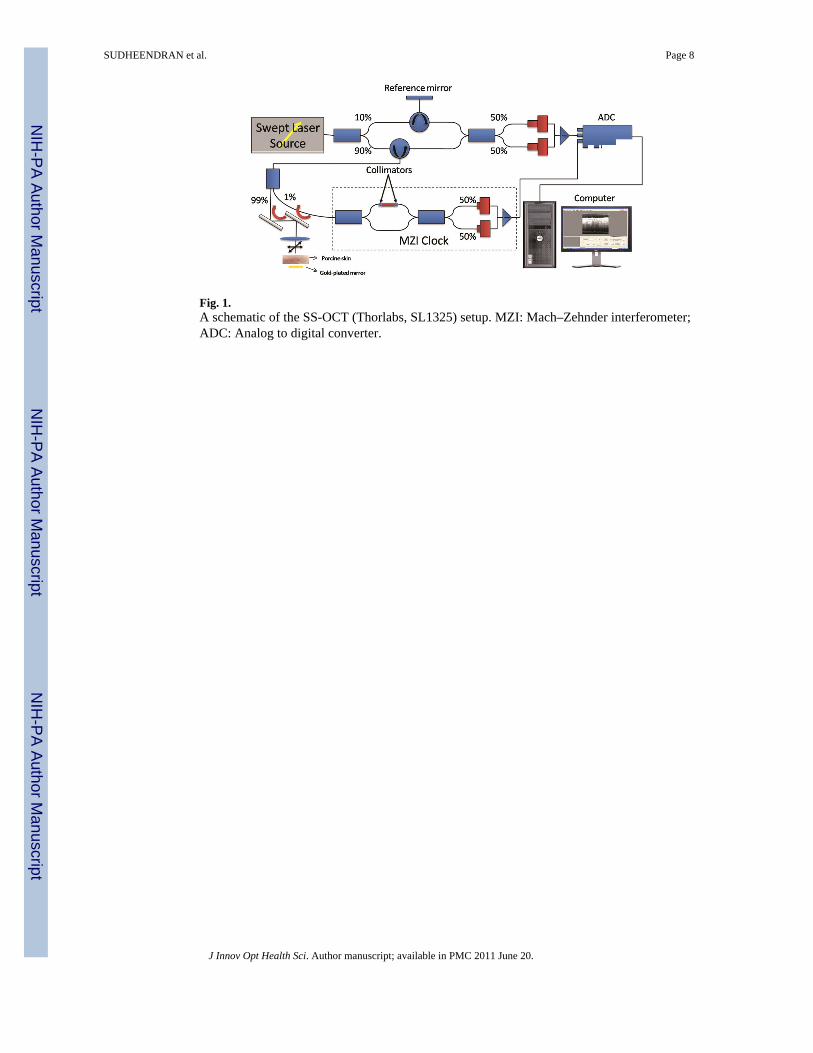
Fig. 1.A schematic of the SS-OCT (Thorlabs, SL1325) setup. MZI: Mach–Zehnder interferometer;ADC: Analog to digital converter.
SUDHEENDRAN et al. Page 8
J Innov Opt Health Sci. Author manuscript; available in PMC 2011 June 20.
NIH
-PA Author Manuscript
NIH
-PA Author Manuscript
NIH
-PA Author Manuscript
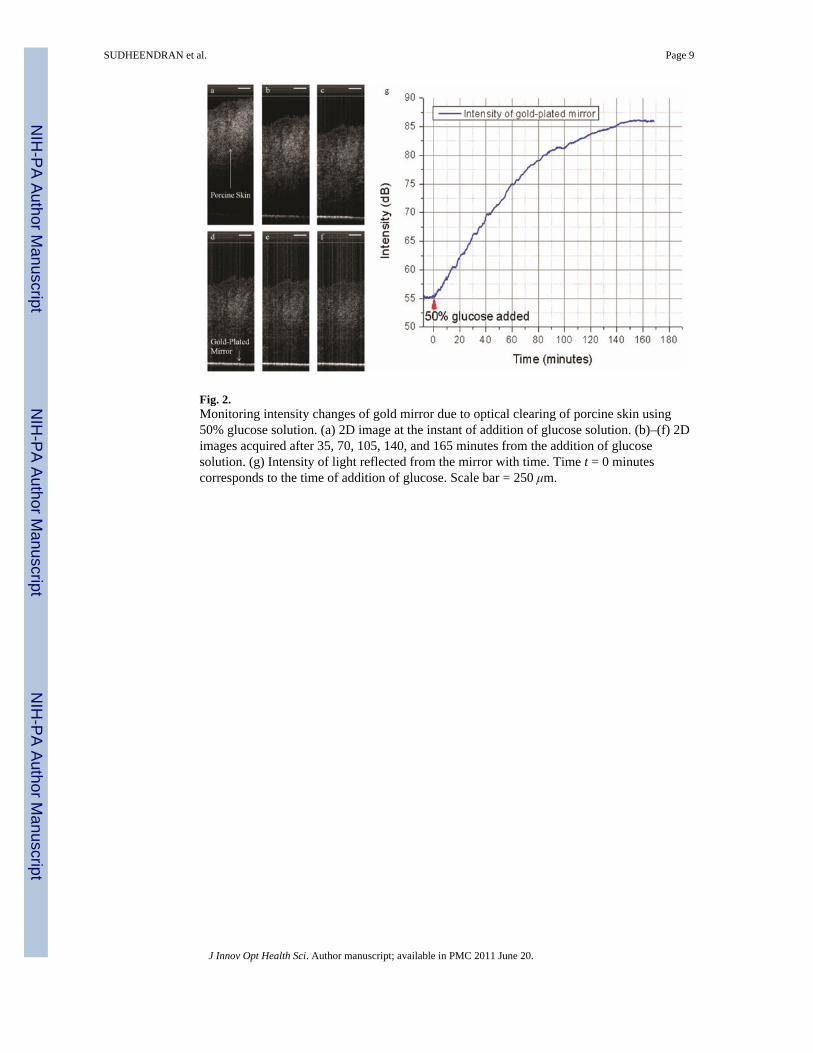
Fig. 2.Monitoring intensity changes of gold mirror due to optical clearing of porcine skin using50% glucose solution. (a) 2D image at the instant of addition of glucose solution. (b)–(f) 2Dimages acquired after 35, 70, 105, 140, and 165 minutes from the addition of glucosesolution. (g) Intensity of light reflected from the mirror with time. Time t = 0 minutescorresponds to the time of addition of glucose. Scale bar = 250 μm.
SUDHEENDRAN et al. Page 9
J Innov Opt Health Sci. Author manuscript; available in PMC 2011 June 20.
NIH
-PA Author Manuscript
NIH
-PA Author Manuscript
NIH
-PA Author Manuscript
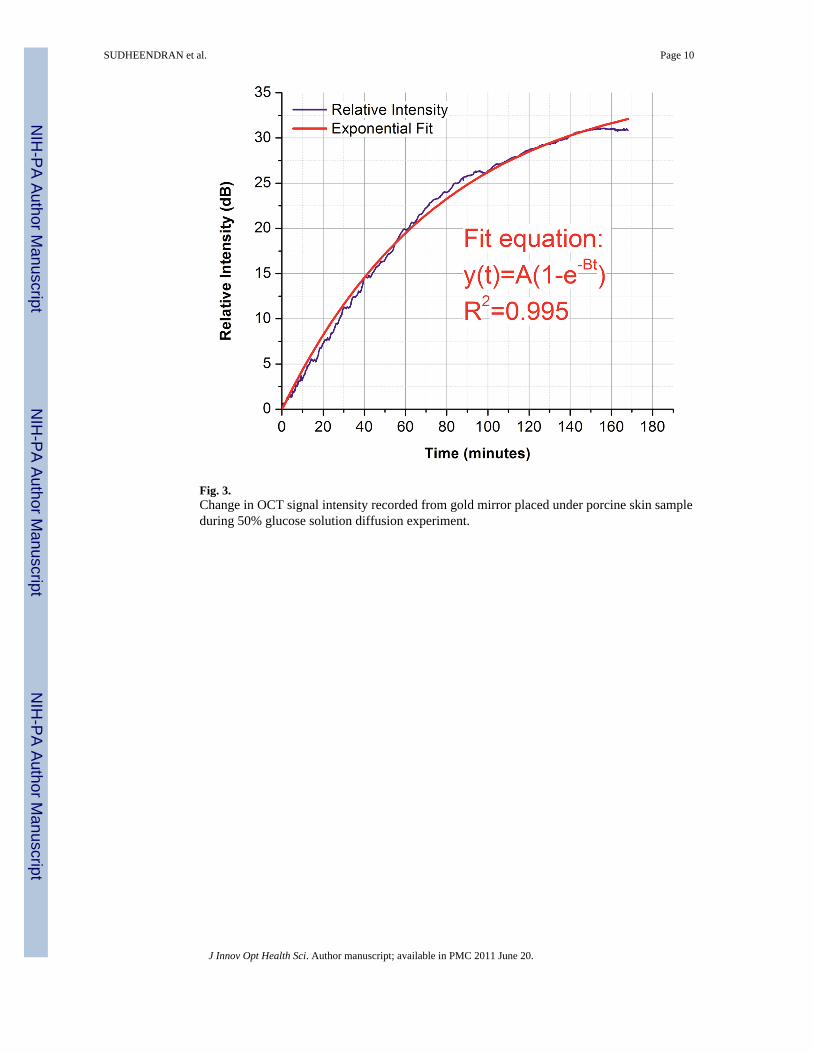
Fig. 3.Change in OCT signal intensity recorded from gold mirror placed under porcine skin sampleduring 50% glucose solution diffusion experiment.
SUDHEENDRAN et al. Page 10
J Innov Opt Health Sci. Author manuscript; available in PMC 2011 June 20.
NIH
-PA Author Manuscript
NIH
-PA Author Manuscript
NIH
-PA Author Manuscript
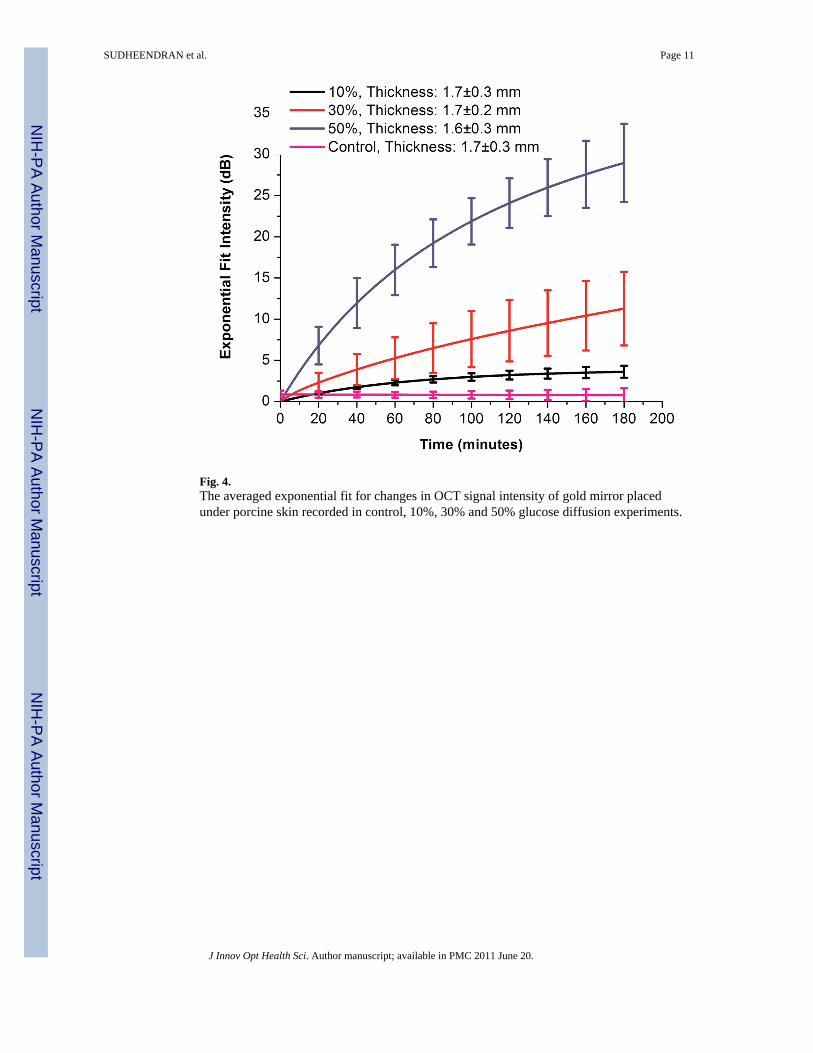
Fig. 4.The averaged exponential fit for changes in OCT signal intensity of gold mirror placedunder porcine skin recorded in control, 10%, 30% and 50% glucose diffusion experiments.
SUDHEENDRAN et al. Page 11
J Innov Opt Health Sci. Author manuscript; available in PMC 2011 June 20.
NIH
-PA Author Manuscript
NIH
-PA Author Manuscript
NIH
-PA Author Manuscript
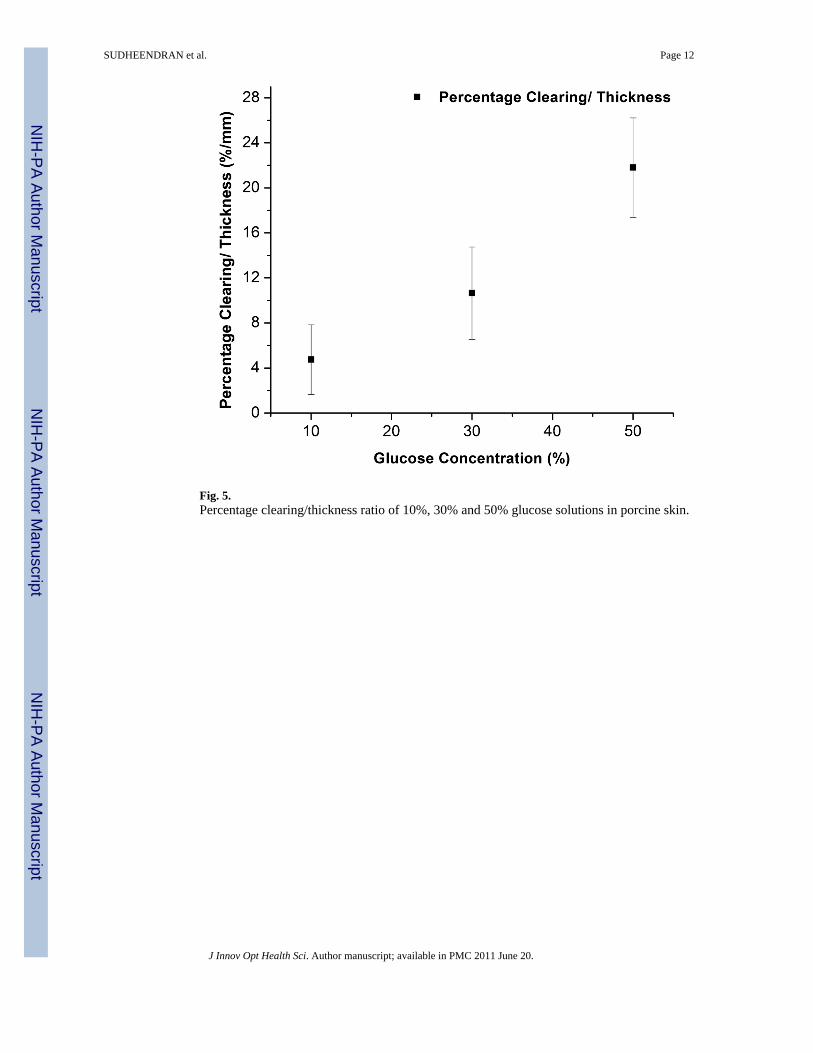
Fig. 5.Percentage clearing/thickness ratio of 10%, 30% and 50% glucose solutions in porcine skin.
SUDHEENDRAN et al. Page 12
J Innov Opt Health Sci. Author manuscript; available in PMC 2011 June 20.
NIH
-PA Author Manuscript
NIH
-PA Author Manuscript
NIH
-PA Author Manuscript