tomic pectroscopy s - a and b spectroscopy 23(4).pdf · 105 determination of chlorine, fluorine,...
TRANSCRIPT

In This Issue:
Determination of Chlorine, Fluorine, Bromine, and Iodine in Coals with ICP-MS and I.C.
M. Bettinelli, S. Spezia, C. Minoia, and A. Ronchi............................................................105
Marine Sediment Analysis Using Inductively Coupled Plasma Optical Emission Spectrometry
Dirce Pozebon and Patricia Martins...................................................................................111
Matrix Effects of Tantalum in the Determination of Cr, Fe, Nb, Ni, and Ti in TantalumPowder Using ICP-OES
G. Anil, M.R.P Reddy, Arbind Kumar, and T.L. Prakash..................................................119
Determination of REEs in Rocks and Minerals by Solvent Extraction and ICP-OES
N.K. Roy and P. Roychowdhury.......................................................................................125
Determination of Selenium in Dietary Supplements by ETTAS and HG-AAS:A Comparative Study
Lilian Valiente, Margarita Piccinna, Emiliano Romero Ale, Ariel Grillo, andPatricia Smichowski...........................................................................................................129
Evaluation of Different Permanent Modifiers for the Determination of Cadmium inEnvironmental Samples by Electrothermal AAS
Éder C. Lima, Ronílson V. Barbosa, Júlio C. P. Vaghetti, and Leandro S. Ferreira.........135
Spectroscopy
ASPND7 23(4) 105–142 (2002)ISSN 0195-5373
Issues also available
electronically.
(see inside front cover)
AtomicJuly/August 2002 Volume 23, No. 4

U.S. 800-762-4000 (+1) 203-925-4600
www.perkinelmer.com/instruments
Justtouch
and go.
There, that’s all the training you need.Walk up to the AAnalyst 200 and let the touch screen guide you through everythingfrom setup to analysis. It practically tells you what to do—and in your ownlanguage. All instrument controls are right there on the screen, available at yourfingertips. Even troubleshooting and repairs are easier, with quick-change partsyou simply snap out and snap in. No service visit, no down time. As rugged andreliable as ever, our newest AAnalyst is a better way to do AA. Experience it foryourself. Talk to a PerkinElmer inorganic analysis specialist today.
© 2002 PerkinElmer, Inc.
Atomic Absorption

105
Determination of Chlorine, Fluorine, Bromine, andIodine in Coals with ICP-MS and I.C.
*M. Bettinelli, S. Spezia, C. Minoia, and A. RonchiLaboratory of Environmental Hygiene and Industrial Toxicology
Salvatore Maugeri Foundation, via Alzaia 29, Pavia, Italy
Atomic SpectroscopyVol. 23(4), July/August 2002
INTRODUCTION
In order to generate electricity,fuels are combusted at hightemperatures in utility boilers.This process releases many organicand inorganic pollutants into theatmosphere, both in gaseous andsolid form (absorbed on suspendedparticulate).
Limiting pollutant emissions intothe environment is therefore one ofthe main goals for the management,as well as a precise requirement,of national acts. The emission ofhalogens is regulated by the Italianlegislation according to the DM1277/90 n. 51 “Linee guida per leemissioni inquinanti...” whichfixes (in the case of power plants)100 mg/Nm3 (cubic meterscalculated under normal conditionsof 0oC and 1013 mbar) as the limitvalue for Cl, and 5 mg/Nm3 for Fand Br (expressed as hydrofluoricand hydrobromic acid, respectively).No limit for iodine emissions hasbeen established.
The emission of halogens fromcoal combustion depends on anumber of factors:
1. The initial halogen content incoal and the chemical form inwhich they are present.
2. The combustion conditions(temperature and length of time inthe boiler).
3. The use of various pollutioncontrol technologies.
During coal combustion inthermal power plants, chlorine,fluorine, bromine, and iodine aremainly volatilized during thecombustion process (85–90%) and
ABSTRACT
The combustion processreleases many organic andinorganic pollutants into theatmosphere, both in gaseousand solid form. During coalcombustion in thermal powerplants without pollution controlequipment, chlorine, fluorine,bromine, and iodine present incoals are mainly volatilized asgaseous compounds. It has beenestimated (1) that 94% of thechlorine in coal is volatilized,generally being emitted asgaseous HCl. Emission valuesof 99% for chlorine, 90% forfluorine, 60% for bromine, and90% for iodine have been givenfor pulverized coal combustionbased on actual measurementsat the 600 Mwe power stationin Netherlands (2).
Limiting pollutant emissionsis a precise requirement of theItalian legislation that fixes (inthe case of power plants)100 mg/Nm3 as the limit valuefor chlorine, and 5 mg/Nm3 forfluorine and bromine (expressedas hydrofluoric and hydrobromicacid, respectively). No limit foriodine emissions has beenestablished.
From this point of view andin order to maintain control ofemissions from combustionplants, it is important to monitorthe concentration of halogens infuels. Unfortunately, in literaturethere are very few data publishedwith regard to the amount ofhalogens in fossil fuels, whichemphasizes the analyticaldifficulties with regard to thedetermination of these analytes.
In the present paper, apyrohydrolysis of the sample at1100°C, followed by the absorptionof volatilized compounds inNa2CO3/NaHCO3 solution and thefinal instrumental analysis of Cl, Br,and F with ion chromatography(IC) and Br and I with inductivelycoupled plasma mass spectrometry(ICP-MS) has been adopted.
The accuracy of the method,evaluated by analyzing somecertified reference materials,was better than 95% for all analytes and the detection limitsadequate to the analyticalrequirements (0.1 mg/kg forBr and I, 1 mg/kg for F, and 10mg/kg for C1).
remain in the fumes downstream ofthe ash abatement equipment(electrostatic precipitators) asgaseous compounds, particularlyas acids.
Experimental studies ona “pulverized dry-bottom” boiler,equipped with high-efficiencyelectro-filters and stoked withbituminous coal, showed adistribution ratio higher than90–95% in the vapor phase forchlorine and bromine, 80–85% inthe case of fluorine, and 75–80%for iodine (3).
If no desulphurization plantis present, the majority of halogensintroduced with the fuels are emittedat the stack and the concentration inthe flue gases is strictly related to theinitial concentration of theseelements in fuels.
In the case of plants equippedwith wet gas desulphurizationsystems (wet FGD), the gasscavenging in the pre-scrubber canlead to a significant reduction ofchlorine, bromine, and iodineconcentration in the gaseous phase(more than 90%), while the removalratio of fluorine seems to be lessefficient (rate of 50%).
From this point of view, and inorder to maintain control ofcombustion plant emissions, itis important to monitor theconcentration of halogens in fuels.
In the literature there are veryfew data published with regard tothe amount of halogens in fossilfuels or in environmental matrices,emphasizing the analytical difficultiesin the determination of theseanalytes.
The conversion of Cl, F, Br, and Icompounds for analysis in coal in aconvenient form is widely considereda crucial analytical step.
*Corresponding author.e-mail: [email protected]: +39 0382 592327Fax: +39 0382 592072
106
Based on work in the past, amethod for fluorine analysis(ASTM D 3761-84) was publishedby ASTM. It consists of samplecombustion in a calorimetric bomb,absorption of the produced gasesby means of a NaOH solution, andfinal fluoride analysis with ISE (4).
The US Geological Survey (5)uses a method based on sampleincineration at 525°C and meltingof the ashes with MgO andMgNO3. ISO has recently reporteda method for total fluorinedetermination by means of ISE or ICafter pyrohydrolysis of the samplein an oven (6).
There is only one official methodthat was published by ASTM (ASTM D4208-88) for chlorine determinationin fossil fuels. It is based on bombcombustion and ISE analysis, whilethere are none published for otherhalogens.
Very few studies have beenreported with regard to fuelhalogen analysis, and the majorityof these use combustion in acalorimetric bomb for the samplepreparation steps (7,8), alkalinefusion with several melting agents(NaOH, NaOH / MgO, NaOH /MgO+MgNO3, Na2CO3, etc.) (9),furnace induction heating (10),pyrohydrolysis (11–13), all of themfollowed by ISE or IC analysis.
Some papers moreover reportanalyses with specific techniquessuch as PIGE (14), NAA (15), andICP-MS (16,17).
Based on these considerations,the importance of developing amethod for the accuratedetermination of halogens incoals is evident. In the presentpaper, a pyrohydrolysis of thesample at 1100°C, followed bythe absorption of volatilizedcompounds in Na2CO3/NaHCO3
solution and the instrumentalanalysis of Cl, Br, F with ionchromatography (IC) and Br and Iwith inductively coupled plasma
mass spectrometry (ICP-MS) hasbeen adopted.
The accuracy of the method wasevaluated analyzing the followingcertified reference materials: NIST1632b Trace Elements in Coal; NIST1633a Trace Elements in Coal FlyAsh; BRC 60 Chlorine and Fluorine incoal; MURST-ISS-A1 Antarctic MarineSediment CRM for Trace Elements;and NIST 1573a Tomato Leaves. Thegood recovery obtained for all theCRMs analyzed confirmed theapplicability of this procedure,even to the characterization ofenvironmental matrices (sedimentsand biological materials) notreported in this paper.
EXPERIMENTAL
Instrumentation
ELAN® 5000 ICP-MS(PerkinElmer Sciex Instruments,Concord, Ontario, Canada),equipped with two mass-flowcontrollers, Ryton® spray chamber,GemTip™ cross-flow nebulizer, anda PerkinElmer AS-90 autosampler(PerkinElmer, Shelton, CT USA).
Dionex DX-100 ionchromatograph (DionexCorporation, Sunnyvale, CA, USA),equipped with an AS-9HC analyticalcolumn (high capacity alkyl/alkanolquaternary ammonium), guardcolumn AG-9HC, DXP-Dionexanalytical pump, and ASRS-Ultraautoregenerant conductivitysuppressor.
GAAM Combustor 02 combustionfurnace (GAAM mbH, BadDurrenberg, Germany).
Reagents and StandardSolutions
Nitric acid (65% m/v) wasSuprapur® reagent (E. Merck,Darmstadt, Germany).
Multielemental standard solutionswere prepared from 1000 mg/Lsingle-element reference standards(Merck) by dilution in water.
High-purity water produced bypassing distilled water through adeionizing system (Milli-Q™,Millipore, Bedford, MA, USA).
Sodium carbonate (Na2CO3) ofanalytical reagent grade (Carlo Erba).
Sodium bicarbonate (NaHCO3) ofanalytical reagent grade (Carlo Erba).
Certified Reference Materials
The following certified referencematerials were analyzed:
NIST 1632b Trace Elements inCoal
NIST 1633a Trace Elements inCoal Fly Ash
BCR 460 Chlorine and Fluorinein Coal
MURST-ISS-A1 Antarctic MarineSediment CRM for Trace Elements
NIST 1573a Tomato Leaves
Sample Preparation
A sample of 0.5 g, previouslydried for one hour in an oven at60°C, was introduced into a quartzcombustion tube of the GAAMtubular oven and heated at about1000°C.
The GAAM combustor allows fullcontrol of the heating process byon-line monitoring of thecombustion rate and the automaticvariation of the introduction speedof the sample.
During the heating process, ahumidified gas (first step withargon, second step with oxygen)was blown into the tube in order topromote pyrohydrolysis ofthe sample.
The combustion products werecollected in two quartz impingersfilled with 20 mL of an alkalineabsorption solution (Na2CO3 1.8mM / NaHCO3 1.7 mM), thendiluted with water to a final volumeof 50 mL, and analyzed by IC (F, Cl,and Br) or ICP-MS (Br and I).

107
Vol. 23(4), July/August 2002
The instrumental parameters arelisted in Tables I-III.
RESULTS AND DISCUSSION
F and Cl Determination
The results for the CRMpreviously cited and reported inTable IV were in good agreementwith the certified or indicative values(recoveries between 93–101%) withthe exception of fluorine in NIST1633a (reported value 94 ± 20µg/g, found value 75 ± 2 µg/g). Ourresult was, in any case, very similarto that reported by Rice (10) on thesame material (73 ± 2 µg/g), thusconfirming as “suspected” thevalue reported by NIST.
The long-term precision wasevaluated by analyzing the samecertified reference materials on15 different days (over the courseof a year) and drawing therespective control charts, asshown for chlorine in Figure 1.
The long-term precision forsamples containing about 50 mg/kgof Cl and F was in the order of19–20%, while for higherconcentrations (225 mg/kg F and1083 mg/kg Cl), a precision of 5%was found.
Br and I Determination
Since the majority of referencematerials have no certified values,only indicative values, the accuracyfor Br and I was confirmed byevaluating the recovery in coalsamples spiked with knownconcentrations of halogens (seeTable V). Four concentration levelswere tested (10, 100, 500, and1000 mg/kg) and the recoverieswere in the range 99.7 – 106.6 %for bromine and 89.5 – 101.6 %for iodine.
Moreover, a comparisonbetween the results obtained in theanalysis of coal samples by ICP-MS,ion chromatography ( I.C.), andneutron activation analysis (NAA)was performed. The results
TABLE I ICP-MS Instrumental Parameters
Parameters
RF Power 1150 WAr Plasma Flow 15.0 L/minAr Nebulizer Flow 0.90 L/minAr Auxiliary Flow 1.0 L/minSample Flow 1 mL/minNebulizer Cross-flowReading Peak hoppingResolution NormalDwell time 150 msSweeps / Replicates 5Number of Replicates 5Calibration Curve Linear through zeroCalibration Points 3 (10 – 50 – 100 µg/L)Isotopes 79Br, 81Br, 127I
TABLE III.C. Instrumental Parameters
Column AS9-HCPre-column AG9-HCEluent Na2CO3 9.0 mMEluent Flow 1.0 mL/minInjection Loop 75 µLSuppressor ASRS-ULTRACalibration Curve QuadraticCalibration Points 7 – with the following ranges:
F 0.25 – 5 mg/LCl 0.25 – 10 mg/L Br 0.50 – 20 mg/L
Retention Times F 4.08 min Cl 6.92 minBr 11.12 min
Data Processing Peak Area
TABLE IIIGAAM Oven Instrumental Parameters
Oven Temperature 1080°CStep 1 Time 180 s
Ar Flow 35 L/hOxygen Flow 40 L/h
Cooling Time 60 sStep 2 Time 300 s
Oxygen Flow 90 L/hAbsorption Solution Na2CO3 1.8 mM - NaHCO3 1.7 mM

108
reported in Figures 2 and 3 showgood agreement between thetechniques considered. (Thecorrelation curves in the case of 51bromine analyses done by IC andICP-MS gave a value of R2 = 0.9661with intercept a= 1.2151 and slopeb= 0.9689; while for 34 iodineanalyses performed by ICP-MSand NAA, the same statisticalparameters were: R2 = 0.9902,a= 0.4956, b= 0.9007 and 0.9902).
Method detection limits (MDLs),calculated as three times thestandard deviation of 10 repeatedanalyses of a blank treated as thesamples, were 0.1 mg/kg for Br andI, 1 mg/kg for F, and 10 mg/kg forCl. These MDLs appear adequatefor the determination of theseelements in many matrices ofenvironmental interest.
The procedure described in thispaper was adopted to monitor, on aroutine basis, the halogen contentin a series of coals imported to Italyfrom different countries.
The results reported in TablesVI-IX and the knowledge of theemission factors reported in theliterature for power plants,
TABLE IVComparison Between Chlorine and Fluorine Concentrations (µg/g)
Certified and Measured After Pyrohydrolysis of Sample and Analysis With Ion Chromatography
CRM Chlorine (µg/g) Fluorine (µg/g)Certified Value Found Value Certified Value Found Value
NIST 1632b 1260 1192 ± 9 50 ± 6 45.7 ± 3.3BCR 460 59 ± 8 57 ± 8 225 ± 6 232 ± 9NIST 1633a < 69 38 ±3 94 ± 20(a) 75 ± 2MURST-ISS-A1 7385 – 7800 6825 ± 70 - 125 ± 3NIST 1573 1.07 ± 0.03 (%) 1.03 ± 0.04 (%) 5.5 ± 0.4 5.2 ± 0.2(a) Value reported from Rice (12) 73 ± 2 µg/g.
TABLE VComparison Between Bromine and Iodine Concentrations (µg/g) Certified and Measured
After Pyrohydrolysis of Sample and Analysis With Ion Chromatography
CRM Bromine (µg/g) Iodine (µg/g)Certified Value Found Value Certified Value Found Value
NIST 1632b 17 15.2 ± 1.0 –- 1.80 ± 0.05NIST 1633a 2.3 2.1 ± 0.3 < 4.5 1.5 ± 0.8 MURST-ISS-A1 34.9 – 50.5 38.2 ± 0.2 34.6 – 42.3 36.0 ± 0.3NIST 1573 21 ± 2 23 ± 2 0.323 ± 0.058 0.42 ± 0.07
Fig. 1. Control chart for chlorine determination in BCR 460 certified referencematerial (certified value 59 ± 8 mg/kg; found value 57 ± 8 mg/kg; mean andstandard deviation were obtained on 15 different working days).

109
Vol. 23(4), July/August 2002
equipped with different post-combustion pollution controlequipment, can be utilized topredict the halogen emissionsand thus also establish the majorsources of these compounds in theatmosphere.
CONCLUSION
The accurate analysis of halogensin coals and environmental matricesis a difficult task as evidenced by therelative lack of data reported in theliterature.
In this paper, a method has beendescribed for the determination ofCl, F, Br, and I in coals, sediment,and botanic materials.
The method was validated byanalyzing certified referencematerials, evaluating the recoveriesof the analytes in spiked realsamples, and comparing the resultswith independent techniques suchas NAA.
The method detection limits(0.1 mg/kg for Br and I, 1 mg/kgfor F, and 10 mg/kg for Cl) wereadequate for the determination ofthese elements in many matrices ofenvironmental interest.
The procedure described in thispaper was adopted to analyze morethan 200 coals of different originand a database of halogenconcentrations is now available.
Received July 29, 2002.
Fig. 2. Bromine - Comparison between I.C. and ICP-MS results after hydropyrolytic treatment of coal samples (n= 51; a = 1.2151 ; b = 0.9689; R2 = 0.9661).
Fig. 3. Iodine - Comparison between ICP-MS (after hydropyrolytic treatment of coal samples) and NAA results (n = 34; a = 0.4956; b = 0.9007; R2 = 0.9902).

110
REFERENCES
1. T.L. Japalucci, R.J. Demski, and D.Bienstock, Chlorine in coal combustion,US Bureau of Mines, Report ofInvestigations, USBMRI7260, Pittsburg,PA, USA (1969).
2. R. Meij, Personal Communication,Arnhen, The Netherland, KEMA(March 1991).
3. R. Meij, Tracking trace elements at acoal-fired power plant equipped with awet flue-gas desulphurization facility,KEMA Scientific and TechnicalReports, Special Issue, 7, 267 (1989).
4. ASTM D 3671-84, Test method fortotal fluorine in coal by oxygen bombcombustion / ion selective electrodemethod, 1989 Annual Book of ASTMStandard, Volume 05.05 Gaseous Fuels,Coals and Coke.
5. D.W. Golightly and F.O. Simon, USGeological Survey Bulletin 1823, 72(1989).
6. ISO / DIS 11724 , Solid mineral fuels– Determination of total fluorine(1996).
7. R.A. Nadkarni, Am. Lab. 13, 22(1981).
8. R.A. Nadkarni and D.M. Pond, Anal.Chim. Acta 146, 261 (1983).
9. P. Schramel and S. Hasse, Mikrochim.Acta 116, 205 (1994).
10. T. Shinonaga, M. Edibhara, H.Nakahara, K. Tomura, and K.G.Heumann, Chemical Geol. 115, 213(1994).
11. M. Bettinelli, Analyst 108, 404(1983).
12. T.D. Rice, Talanta 35, 173 (1988).
13. M. Langenauer, U. Krahenbuhl, andA.Wyttenbach, Anal. Chim. Acta 274,253 (1993).
14. V.B. Conrad and W.B. Brownlee,Anal. Chem. 60, 365 (1988).
15. I. Roelandts, G. Robaye, J.M.Delbrouck-Harabu, and G.Weber,Talanta 43, 439 (1996).
16. Y. Muramatsu and S. Yoshida, J.Radioanal. Nucl. Chem. 197, 149(1987).
17. K.G. Heumann and H. Seewald,Fresenius’ Z. Anal. Chem. 329, 485(1987).
18. B. Schnetger and Y. Muramatsu,Analyst 121, 1627 (1996).
TABLE VI Fluorine Content of Various Coals Imported to Italy
Place of Sample Mean Standard Median RangeOrigin No. Deviation
(mg/kg) (mg/kg) (mg/kg) (mg/kg)
COLUMBIA 15 37 8 36 34–46POLAND 15 91 17 83 61–107USSR 8 122 10 119 115–139SOUTH AFRICA 22 241 57 232 175–380USA 52 63 30 55 36–241VENEZUELA 8 29 3 27 26–34TOTAL 120 111 86 66 26–380
TABLE VIIChlorine Content of Various Coals Imported to Italy
Place of Sample Mean Standard Median RangeOrigin No. Deviation
(mg/kg) (mg/kg) (mg/kg) (mg/kg)
CHINA 15 430 7 434 413–456COLUMBIA 15 255 209 149 70–579POLAND 15 1089 167 1057 851–1343USSR 8 70 35 73 29–99SOUTH AFRICA 23 66 13 61 37–86USA 113 1347 548 1228 96–2692VENEZUELA 8 231 116 292 83–295TOTAL 196 1035 676 1069 29–2692
TABLE VIIIBromine Content of Various Coals Imported to Italy
Place of Sample Mean Standard Median RangeOrigin No. Deviation
(mg/kg) (mg/kg) (mg/kg) (mg/kg)
CHINA 15 4.4 2.1 4.7 2.45–7.21COLUMBIA 15 2.5 0.7 2.2 1.64–3.92POLAND 4 11.5 0.7 12.1 10.9–13.3SOUTH AFRICA 39 1.3 1.0 1.1 0.38–5.8USA 76 19.9 7.0 17.4 5.1–43.2VENEZUELA 10 1.8 0.6 1.7 1.65–3.11TOTAL 159 11.6 9.9 11.5 0.37–42.5
TABLE IXIodine Content of Various Coals Imported to Italy
Place of Sample Mean Standard Median RangeOrigin No. Deviation
(mg/kg) (mg/kg) (mg/kg) (mg/kg)
CHINA 15 2.9 2.9 2.9 0.78–5.3COLUMBIA 15 1.1 0.4 0.8 0.85–1.63POLAND 4 4.1 2.9 2.5 2.3–7.7SOUTH AFRICA 28 1.2 0.8 1.1 0.15–2.76USA 86 3.1 1.7 2.6 0.38–12.8VENEZUELA 10 1.8 0.8 1.5 0.9–3.8TOTAL 158 2.8 1.7 2.4 0.15–12.8

111
*Corresponding author.e-mail: [email protected]: +55-51- 33167304
Atomic SpectroscopyVol. 23(4), July/August 2002
Marine Sediment Analysis Using Inductively CoupledPlasma Optical Emission Spectrometry
*Dirce Pozebon and Patrícia MartinsInstituto de Química, Universidade Federal do Rio Grande do SulAv. Bento Gonçalves, 9.500 - 91.501-970, Porto Alegre, RS, Brazil
INTRODUCTION
For geological and environmentalstudies, it is important to know thecomposition and contamination ofmarine sediments. Due to thecomplexity of the sample matrix,several methods of sampledecomposition have been studiedand proposed. In some cases,incomplete sample decompositionmay occur, lowering precision,accuracy, and analytical results(1–3).
Methods using aciddecomposition and heating in openflasks (4), polytetrafluorethylene(3,5) (PTFE) closed vessels underpressure (pumps), and microwaveoven (2,6) have largely beenemployed. For trace elementdetermination, sampledecomposition in closed vesselsis recommended in order to avoidanalyte losses and contamination.In these methods, used for marinesediment decomposition, problemssuch as analyte volatilization,precipitation, and incompletesample solubilization may occur(1). When acid digestion is used,solubilization efficiency dependson the sediment samplecharacteristics, acid type, acidmixture, and temperature (1,7).The extraction of some elementssuch as Fe, Cr, Ti, Mg, and Al fromsediments is sometimes difficultas they are present as oxides,phosphates, and silicates whichare refractory species (2,3). Dueto this fact, alkaline fusion may benecessary for complete samplesolubilization in order to obtainaccurate results.
ABSTRACT
A method is described for theICP-OES determination of Al, As,Cd, Co, Cr, Cu, Ba, Fe, Mn, Ni,Pb, V, and Zn in marinesediments. An ICP-OESinstrument equipped with adual-view plasma torch wasused. This technology allows thedetermination of trace elementsin the axial view mode alongwith major components in theradial view. The radial andaxial views and the samplepreparation procedure as aciddigestion and alkaline fusionwere investigated in order toobtain accurate results for allanalytes. External calibrationwas used to determine theanalytes in sample acid digestionor in alkaline fusion samplesolution. For Cd determinations,matrix matching with As and Vwas used. More precise andaccurate results for Ba and Alwere found when the sedimentwas fused instead of acid-digested. Sample solutionscontaining a high content ofacids (HCl, HF, and HNO3)and dissolved solids (providedby alkaline fusion) could beanalyzed. However, someanalytes could only be correctlydetermined using the radial viewmode. Parameters like LOD(limits of detection) and % RSD(relative standard deviation) arepresented. The method wasapplied to the analysis of realmarine sediment samples.
Several spectroscopictechniques have been used for thedetermination of trace and majorelements in marine sediments.Among the most usedspectroscopic techniques areinductively coupled plasma massspectrometry (ICP-MS) (8,9),inductively coupled plasma opticalemission spectrometry (ICP-OES)(9,10), flame atomic absorptionspectrometry (FAAS) (11), graphitefurnace atomic absorptionspectrometry (GFAAS) (12,13),and X-ray fluorescence (XRF) (14).ICP-MS and GFAAS have been themost selected techniques for traceelement determination inenvironmental samples. ICP-MS,due to its multielement detectionfeature, low spectral interferencesfor a great number of elements,large dynamic calibration range,and high sensitivity, is the preferredtechnique. The use of ICP-OES fortrace element determination is alsoreported (9,10). With the morerecent ICP-OES instruments usingcharge coupled device detectors(CCD) with automatic dual view, itis possible to obtain low limits ofdetection (LOD). The quantumefficiency achieved with CCDis higher than it is for thephotomultipliers (PMT), thusimproving sensitivity. When usingaxial view, the sensitivity may alsobe improved but matrix effects aremore pronounced in comparison toradial view. However, as reported(15–17) this matrix effect may beminimized by using robust plasmaconditions such as high power andlow nebulizer gas flow rates.Besides, in comparison to ICP-MS,ICP-OES is less prone to matrixinterferences. Therefore, it ispossible to introduce relativelyconcentrated acid mixtures intothe plasma (7) as well as solutions

112
containing high amounts ofdissolved solids since a feasiblesystem for sample introduction isalso available.
The main purpose of this workwas to develop a method for As, Co,Cr, Cu, Ni, Pb, V, Al, Fe, Cd, Zn, Mn,and Ba determination in marinesediments by ICP-OES. Varioussample decomposition methodswere investigated as well asinstrumental parameters.
EXPERIMENTAL
Intrumentation
All determinations wereperformed using the scanningOptima™ 2000 DV ICP-OES(PerkinElmer, Shelton, CT, USA)equipped with a three-channelperistaltic pump. The parametersused are listed in Tables I and II.These parameters were optimizedor used as recommended by theinstrument manufacturer.
Reagents and Standard Solutions
All reagents used were ofanalytical grade. The acids usedwere 65% (v/v) HNO3, 37% (v/v)HCl, 40% (v/v) HF, and 30% (v/v)H2O2 (Merck, Darmstadt, Germany).HNO3 and HCl, doubly distilled insub-boiling quartz steam (HansKürner, Rosenheim, Germany),were used for sample decompositionand calibration solutions. Milli-Q™(Bedford, MA, USA) water(resistivity of 18.2 MΩ.cm) wasused for all solutions and for samplepreparation. This water was alsoused to rinse the vessels used tostore the solutions for samples.Calibration solutions were preparedby dilution of a multielement 1000mg L-1 (ICP - IV from Merck) stocksolution or from 1000 mg L-1
single-element stock solutions(Titrisol®, Merck) mixed with5% (v/v) HNO3 solution. For alkalinesediment fusion, Na2B4O7 • 7H2O(Merck) was used.
All glassware and labwareused to store the solutions weredecontaminated with 10% (v/v)HNO3 solution for 72 h. Agatemortars, polyethylene dishes, andnylon sieves were decontaminatedby immersing them in 1% (v/v)HNO3 for 24 h. After immersion inthe acid solutions, all materialswere thoroughly washed withdistilled water and rinsed with
Milli-Q water. The polyethyleneflasks used to store the sedimentsamples and their solutions werepreviously decontaminated followingthis procedure: (a) mixing solutionwith 50% (v/v) HNO3 solution andleft standing for 1 week, (b) mixingwith 3% HNO3 (v/v) and leftstanding for 1 week, (c) washingwith distilled water and rinsing withdeionized water, and (d) drying in aClass 100 clean room at room
TABLE IInstrumental Operating Conditions
Plasma power 1300–1500 W Resolution HighPlasma gas flow 15 L min-1 Spectral profiling NoAuxiliary gas flow 0.2 L min-1 Integration time auto,
min. 1 sec, max. 5 sec Nebulizer gas flow* 0.6 L min-1and Read delay 10 sec
0.7 L min-1
Nitrogen purge normal Sample flow 2.5 mL/minHeight of observation 15–16 mm Sample flush 10 sec
Nebulizer GemCone™ Injector Alumina (aluminum oxide) 2 mm
Nebulizer chamber Scott (Ryton®) Replicates 2Processing mode Area (7 points Background
per peak) correction Two points*For Ba and Cd determinations, a flow rate of 0.80 L min-1 was used;0.6 L min-1 using axial view and 0.7 L min-1 using radial view.
TABLE IISpectral Lines, Calibration Solutions Concentration, and Background
Correction
Analyte Spectral View Range of Backgroundline concentrations* correction(nm) (µg L-1) BCG1 BCG2
As( I ) 188.979 Axial 20 - 100 -0.010 0.022Co( II ) 231.161 Radial 20 - 100 -0.009 0.010Cr( II ) 267.716 Radial 50 - 400 -0.019 0.026Cu( I ) 324.752 Radial 40 - 150 -0.020 0.021Ni( II ) 231.604 Axial/Radial 50 - 250 -0.013 0.016Pb( II ) 220.353 Axial/Radial 50 - 200 -0.016 0.016V( II ) 292.464 Radial 100 - 500 -0.029 0.026Al( I ) 396.153 Radial 2000 - 10000 -0.043 0.043Fe( II ) 239.562 Axial/Radial 2000 - 10000 -0.014 0.021Cd( II ) 228.802 Radial/Axial 1.0 – 8.0 -0.012 0.007Zn( I ) 213.857 Axial/Radial 50 - 150 -0.045 0.045Mn( II ) 257.610 Axial/Radial 50 - 250 -0.028 0.026Ba( II ) 455.403 Radial 100 - 500 -0.056 0.039*Calibration Equations: linear through 0 for all elements.

113
Vol. 23(4), July/August 2002
temperature. The Pt crucibles usedfor alkaline fusion were washedby immersion in 50% (v/v) HClsolution and heating at about 90oCfor 5 h.
Sample Preparation
Certified marine sedimentsample PACS 2 from the NationalResearch Council of Canada(NRCC) and real marine sedimentsamples from Rio de Janeiro, Brazil,were analyzed. All samples wereprepared in a Class 100 clean room.The certified sample was analyzedas received, while the real sampleswere prepared according to thefollowing procedure: (a) sample thesediment at a depth of about 900 m,(b) sub-sample the sediment usinga decontaminated polyethylenespatula, (c) place about 200 g ofthe sediment in a decontaminated250-mL polyethylene flask; (d) capthe flask and freeze the sample atabout –4oC, (e) transport thesample to the laboratory, (f)unfreeze the sample, open the flask,and let it stand in order to dry thesediment at room temperature, (g)grind the sample in an agate mortarto pass through a 2-mm nylon sieve,(f) sub-sample about 20 g of thesediment using a decontaminatedpolyethylene spatula and adecontaminated polyethylene dish,(g) grind the sub-sample in an agatemortar in order to pass through a100-mm nylon sieve, and (h) storethe sample in a decontaminated30-mL capped polyethylene flask.
Three acid mixtures wereinvestigated for the sedimentsample digestions, as shown inTable III. A 0.200-g sample wasplaced into a PTFE pump togetherwith an acid mixture using thesame addition order as describedin Table III for each mixture.Subsequently, the flask was cappedand placed on a digestion block ata temperature of 160oC for 12 h.Then, the digestion block wasturned off and the solution leftstanding to achieve room
temperature. Then, the flaskwas opened, the sample solutiontransferred to a graduatedpolyethylene flask, and filled to50-mL volume. Arsenic, Cd, Pb,Cr, Ni, Cu, Cr, Zn, and V weredetermined directly without furthersample dilution. A 20 times dilutionwith water was used for the Ba, Al,Fe, and Mn determinations as theconcentration of these elements isrelatively high in the samples. Allsamples as well as blanks wereanalyzed in triplicate.
In the alkaline fusion procedure,0.200 g of the sample was placedin a Pt crucible followed by theaddition of 1 mL HNO3. Thecrucible was placed on a hot plateand heated in order to evaporatethe acid. Then, 2 mL of HF wasadded and also evaporated.Subsequently, 2 g of Na2B4O7 .7H2O was added and the crucibleplaced in a muffle. Then, thesediment sample was fused at1000oC for a 2-hour period. Atransparent melt was producedwhich was removed by immersingthe crucible at room temperatureinto 10% (v/v) HCl solution andheating to about 90oC. Once themelt was solubilized, the cruciblewas taken out of the samplesolution. This solution wasevaporated to about 10 mL andtransferred to a graduatedpolyethylene flask containing 1 mLHNO3. The sample solution wasdiluted 20 times with water priorto introduction into the plasma.
RESULTS AND DISCUSSION
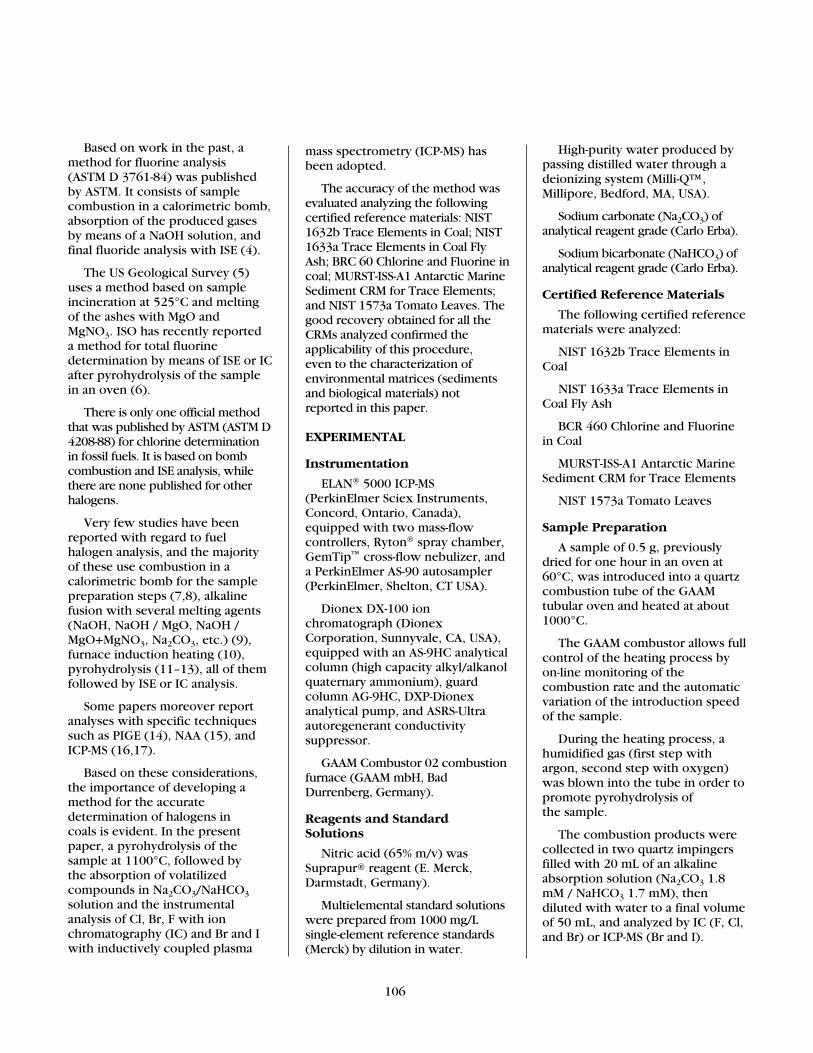
Initially, the plasma power,nebulizer gas flow rate, andobservation height were optimized.The signal intensities of theelements As, Ni, Zn, Co, Pb, andBa, present in the certified acid-digested sample, were measuredand the results are shown in Figures1 and 2. Of the elementsinvestigated, As, Ni, Zn, Co, Pb,and Ba were selected for parameteroptimization since they cover alarge range of excitation andionization energies (18). As shownin Figure 1, the best observationheight and nebulizer gas flow ratewith axial view was found to be 15mm and 0.6 mL min-1, respectively.These parameters were adopted forfurther measurements.
Because the signal intensitywas higher for Ba, a 0.8 mL min-1
nebulizer gas flow rate wasselected. It can therefore be statedthat a higher aerosol introductioninto the plasma is tolerated for Basince it is one of the most easilyionizable and excited element. Withregard to As, the observation heightinfluence on its signal intensity waslow and 15 mm was feasible as wellas verified for the other elements.
As can be seen in Figure 1, aplasma power of 1300 W wassufficient since no significant signalincrease was observed at 1500 W.However, for Cd (not shown inFigure 1) whose concentration isvery low in the sample, 1500 Wwas adopted in order to obtain thehighest signal. By comparing Figure1 (using axial view) with Figure 2(using radial view) it can be seenthat the influences of nebulizer gas
TABLE IIIAcid Mixtures for Sample Digestion
Method Acid Mixture
Digestion 1 Mixture 1 = 7 mL HNO3+ 6 mL HF + 0.5 mL H2O2
Digestion 2 Mixture 2 = 7 mL HNO3+ 6 mL HF +3 mL HCl
Digestion 3 Mixture 3 = 5 mL HNO3+ 5 mL HF +5 mL HCl
114
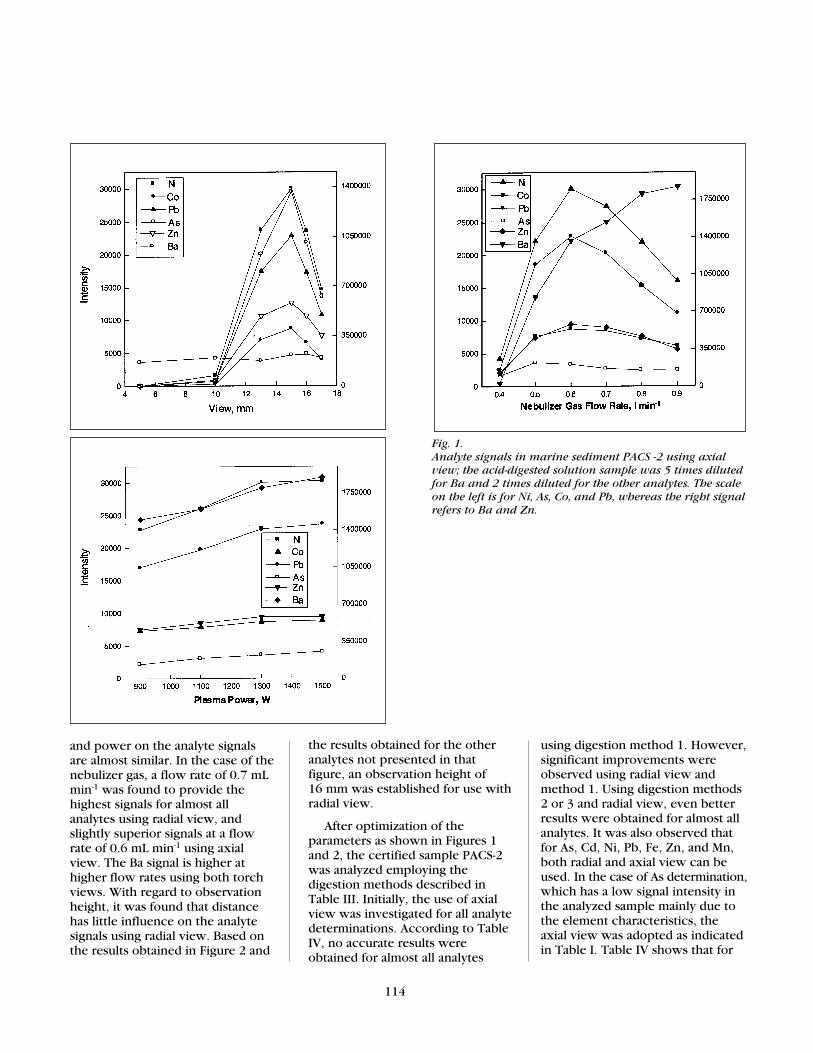
Fig. 1. Analyte signals in marine sediment PACS -2 using axialview; the acid-digested solution sample was 5 times dilutedfor Ba and 2 times diluted for the other analytes. The scaleon the left is for Ni, As, Co, and Pb, whereas the right signalrefers to Ba and Zn.
and power on the analyte signalsare almost similar. In the case of thenebulizer gas, a flow rate of 0.7 mLmin-1 was found to provide thehighest signals for almost allanalytes using radial view, andslightly superior signals at a flowrate of 0.6 mL min-1 using axialview. The Ba signal is higher athigher flow rates using both torchviews. With regard to observationheight, it was found that distancehas little influence on the analytesignals using radial view. Based onthe results obtained in Figure 2 and
the results obtained for the otheranalytes not presented in thatfigure, an observation height of16 mm was established for use withradial view.
After optimization of theparameters as shown in Figures 1and 2, the certified sample PACS-2was analyzed employing thedigestion methods described inTable III. Initially, the use of axialview was investigated for all analytedeterminations. According to TableIV, no accurate results wereobtained for almost all analytes
using digestion method 1. However,significant improvements wereobserved using radial view andmethod 1. Using digestion methods2 or 3 and radial view, even betterresults were obtained for almost allanalytes. It was also observed thatfor As, Cd, Ni, Pb, Fe, Zn, and Mn,both radial and axial view can beused. In the case of As determination,which has a low signal intensity inthe analyzed sample mainly due tothe element characteristics, theaxial view was adopted as indicatedin Table I. Table IV shows that for

115
Vol. 23(4), July/August 2002
Fig. 2. Analyte signals in marine sediment PACS -2 using radialview; the acid-digested solution sample was 5 timesdiluted* and 2 times diluted for other analytes. For scaleadjustment, the signals of As and Co were multiplied by 2.The scale on the left is for Ni, As, Co, and Pb, whereas thescale to the right refers to Ba and Zn.
*The final sample solution (50 mL in a polyethylenevolumetric flask) was diluted again prior to itsintroduction into the plasma (just for scale adjustment inthe graphic). So, when we look at the signal intensities, wemust consider that the sample was diluted (as the samplewas diluted, the real signals are higher than the onespresented in Figures 1 and Figure 2).
under 10% for all analytes with theexception of Al. It was observedthat accurate Cd results using anysample preparation method andboth observation views were onlyobtained using As and V matrixmatching due to spectralinterferences. An alternative Cdspectral line was investigated(226.502 nm) but it was alsoimpossible to measure the analytedue to Fe spectral interferences.Consequently, the more sensitiveCd spectral line (228.802 nm) waschosen and matrix correction used.
Co the measured concentrationsare always higher than the certifiedones using axial view. On the otherhand, the measured Co concentrationis slightly lower when using radialview, but the error is low. Morerobust plasma conditions and otherspectral lines were investigated forCo determination but it was notsuccessful. Internal standardcalibration was not investigated dueto the matrix characteristics, whichmay contain the element used asinternal standard. However, usingdigestion methods 2 or 3 and radialview, the error was found to be
Since no accurate results wereobtained for Al and the standarddeviations for Ba were high, maybedue to analyte precipitation orincomplete sample solubilization,alkaline sample fusion wasinvestigated. As shown in Table V,better results were obtained for Aland Ba using the fusion method,which shows that the marinesediment is not always completelysolubilized in relation to these twoelements using acid digestion. Allanalytes were measured in thesolution of the fused sample, but

116
TABLE IVAnalysis of Certified Marine Sediment Using Different Acid Digestion Mixtures (see Table III)
Results in µg g-1 and the spectral lines as listed in Table II were used.
As none 26.2 ± 1.5 30.9 ± 8.0 23.2 ± 1.2 26.0 ± 1.7 26.0 ± 1.1 28.8 ± 1.7 27.4 ± 3.5
Co none 11.5 ± 0.3 14.5 ± 0.7 8.17 ± 0.1 14.0 ± 0.8 9.8 ± 0.4 13.5 ± 0.3 9.6 ± 0.4
Cr none 90.7 ± 4.6 105 ± 2.2 91.1 ± 0.9 106 ± 5.6 95.1 ±7.1 103 ± 1 101 ± 2
Cu none 310 ± 12 391 ± 51 292 ± 1 377 ± 11 312 ± 13 340 ± 7 287 ± 5
Ni none 39.5 ± 2.3 43.8 ± 2.9 36.6 ± 1.7 40.5 ± 2.5 39.2 ± 2.3 40.3 ± 0.5 37.5 ± 0.1
Pb none 183 ± 8 203 ± 22 147 ± 6 208 ± 15 172 ± 15 193 ± 1 188 ± 9
V none 133 ± 5 155 ± 9 129 ± 1 147 ± 8 141 ± 2 143 ± 2 140 ± 1
Ala 20 times 6.62 ± 0.32 5.07 ± 0.5 4.55 ± 1.0 4.12± 0.81 5.61 ± 0.3 3.41± 0.20 3.78 ± 0.2
Fea 20 times 4.09 ± 0.06 3.56 ± 0.2 3.56 ± 0.2 4.03 ± 0.1 4.0 ±. 0.1 3.99± 0.10 3.95 ± 0.1
Cd none 2.11 ± 0.15 1.98± 0.21 2.27± 0.12 2.71± 0.31 2.11±0.13 2.17± 0.10 2.35±0.13
Zn noneb 374 ± 23 332 ± 2 328 ± 17 362 ± 28 361 ± 31 353 ± 6 347 ± 16
Mn 20 times 440 ± 19 351 ± 35 354 ± 31 372 ± 16 412 ± 2 421 ± 3 429 ± 4
Ba 20 times – 324 ± 10 412 ± 107 792 ± 166 893 ± 153 186 ± 13 219 ± 17a Results are in % (w/w); the uncertainties are the standard deviations of 3 replicate measurements. b 20 times diluted when alkaline fusion was used.
TABLE VAnalysis of Certified Marine Sediments Using Alkaline Fusion Results in µg g-1 and the spectral lines listed in Table II were used.
Analyte View Sample Certified FoundDilution
Ala Radial 20 times 6.62 ± 0.32 6.25 ± 0.15Fea Radial 20 times 4.09 ± 0.06 4.01 ± 0.09Zn Radial 20 times 374 ± 23 413 ± 26Mn Radial 20 times 440 ± 19 428 ± 5Ba Radial 20 times – 937 ± 4
a Results are in % (w/w); the uncertainties are the standard deviations of 3 replicate measurements.
good results were only found for Al,Ba, Mn, Fe, and Zn using radialview. In this case, the use of axialview was not investigated in orderto improve sensitivity due to thefact that Al, Ba, Mn, Fe, and Znconcentrations are relatively high inmarine sediments. As expected, thealkaline fusion method, using openflasks, is not feasible for traceelement determination mainly dueto the high blank signal observedand analyte losses. Therefore, theanalytes can be put into two groupsfor determination: As, Co, Cd, Cr,
Ni, Pb, Cu, and V in the solutionof the sample solubilized usingmethod digestion 2 (Table III)and Al, Fe, Zn, Mn, and Ba in thesolution of the alkaline samplefusion. The observation view aslisted in Table II should beselected. Since only radial viewwas investigated for Al, Fe, Zn, Mn,and Ba determinations in thesolution of the fused sample, thisobservation mode is recommended.However, if one decides todetermine Zn, Mn, and Fe in thesolution of the acid-digested sample
by using method 2 (Table III), thenboth the radial and axial view canbe used.
The limits of detection (LOD,3 of 10 consecutive sample blankruns) and the relative standarddeviations (% RSD) of 10 consecutivesample runs using the optimizedmethod are described in Table VI.All analytes were measured in thesolution of the solubilized sampleusing method digestion 2 (TableIII). Al, Fe, Zn, Mn, and Ba werealso measured in the solution of thefused sample. The results in Table
SampleDilution
Analyte Certified AxialView
RadialView
AxialView
RadialView
AxialView
RadialView
Mixture 1 Mixture 2 Mixture 3

117
Vol. 23(4), July/August 2002
TABLE VIFigures of Merit of the Proposed Method
Results in µg g-1.
LOD 1.68 2.76 0.62 2.06 0.84 2.21 0.78 0.86 0.057 0.01 0.03 0.002 0.004*0.18 *0.01 *0.82 *0.005 0.035
%RSD 4.62 6.12 2.79 2.56 4.34 3.21 2.29 2.01 5.80 1.93 1.04 1.18 2.12*2.08 *2.04 *1.10 *0.098 *2.15
View of observation: axial for As and radial for all other analytes. *For the fused sample.LOD= limit of detection (for all procedures).%RSD= relative standard deviation.
TABLE VIIReal Marine Sediment Sample Analysis
Results in µg g-1 and spectral lines according to Table II were used.
Sample Sample Sample Sample Sample Sample Sample SampleAnalyte 1 2 3 4 5 6 7 8
As 26.1± 0.14 30.4 ± 1,6 24.3 ± 1.8 50.2 ± 2,2 42.5 ± 3.7 36.2± 1.6 33.7 ± 1.2 34.4 ± 1.3
Co 9.80 ± 0.4 11.2± 0.08 9.72± 0.05 11.7± 0.30 10.8± 0.5 11.1±0.37 11.1±0.18 11.4± 0.40
Cr 75.9 ± 2.7 78.7 ± 1.6 68.6 ± 1.2 78.2 ± 3.0 81.0 ± 12 69.8 ± 5.4 69.6 ± 0.9 68.7 ± 1.7
Cu 16.9 ± 1.0 21.1 ±0.20 17.3 ±0.73 21.9 ± 1.5 20.6±0.30 22.2±0.85 22.8 ±0.55 21.7±0.27
Ni 33.7 ± 1.5 34.6 ±0.80 28.0 ± 1.8 36.8 ±0.87 36.1 ± 3.8 38.5 ± 1.4 38.9 ±0.73 37.2±0.86
Pb 28.6 ± 1.2 28.7 ±0.05 28.0 ±1.8 32.0 ± 1.0 28.4 ±1.3 27.1 ±1.3 30.7 ±0.83 28.1 ±1.6
V 98.4 ± 2.3 109 ± 1 96.2 ± 2.0 113 ± 4 105 ± 1 109 ± 4 116 ± 25 111 ± 2
Ala 4.86±0.32 2.25±0.09 1.74±0.01 2.46±0.01 2.31±0.07 4.85±1.36 4.05±0.14 3.36±0.26
Fea 3.04± 0.05 3.27± 0.03 2.61± 0.04 3.57±0.19 3.43±0.01 4.25±0.30 3.66±0.13 3.92±0.14
Cd 0.29±0.05 0.37± 0.01 0.25± 0.02 0.42± 0.08 0.34±0.06 0.34±0.02 0.33±0.01 0.34±0.05
Zn 66.0 ± 2.9 71.0 ±0.60 59.7 ±0.30 70.5 ± 1.5 66.7±0.61 71.8 ± 3.0 70.1 ±0.25 69.6 ± 4.4
Mn 614±19 620±11 478±3.0 1386±58 1172±16 396±27 1258±7.0 862±21
Ba 410± 17 206± 6 206± 23 239± 15 221± 12 219± 18 368± 20 241± 28
a Results are in % (w/w); the uncertainties are the standard deviations of 3 replicate measurements.
As
188.9
79
Co
231.1
61
Cr
267.7
16
Cu
324.7
52
Ni
231.6
04
Pb
220.6
04
V 2
92.4
64
Al
396.1
53
Cd
228.8
02
Ba
455.4
03
Fe
239.5
62
Mn
257.6
10
Zn
213.8
57

118
VI show that precision is goodsince the RSD is lower than 5%for all analytes. Detection limitsare also good, demonstrating themethod’s applicability for traceelement determination in marinesediments.
The proposed method was alsoapplied to the analysis of realsamples and the results are listedin Table VII. It can be seen thatthe method is feasible for thedetermination of all analytes inreal marine sediment samples.
CONCLUSION
The results obtaineddemonstrate that using axialand radial view provides goodanalytical results in the ICP-OESdetermination of trace and majorelements in marine sedimentsamples. External calibrationcan be used to determine allinvestigated analytes. Withthe GemCone™ nebulizer(PerkinElmer), alumina injector,and Ryton® Scott spray chamberintroducion of concentratedsolutions into the plasma ispossible, even when high amountsof the corrosive HF are present.The best sample decompositionmethod for Al and Ba determinationis alkaline fusion, whereas aciddigestion using a mixture of HF,HCl, and HNO3 under pressureprovides best results in thedetermination of As, Co, Cr, Cu, Ni,Pb, V, Fe, Cd, and Zn. Iron, Zn, andMn can also be determined usingalkaline fusion.
Received July 24, 2002.
REFERENCES
1. Yun-chang Sun, Po-hsiang Chi, andMei-yun Shiue, Anal. Sciences 17,1395 (2001).
2. M. Bettinelli, G.M. Beone, S. Spezia,and C. Baffi, Anal. Chim. Acta 424,289 (2000).
3. W. Diegor, H. Longerich, T. Abra-jano, and I. Horn, Anal. Chim. Acta431, 195 (2001).
4. C.R. Khorge, P. Chakrabarty, and R.Saran, At. Spectrosc. 21(6), 220(2000).
5. R. Lara, R.A. Olsina, E. Marchevsky,J.A. Gásquez and L.D. Martinez, At.Spectrosc. 21(5), 172 (2000).
6. V.L. Dressler, D. Pozebon, and A.J.Curtius, Spectrochim. Acta B, 1527(1998).
7. Khakhathi L. Mandiwana, J. Anal. At.Spectrom. 15, 1405 (2000).
8. D. Pozebon, V.L. Dressler, and A.J.Curtius, Talanta 51, 903 (2000).
9. Rong Wei and Hiroki Haraguchi,Anal. Sciences 15, 729 (1999).
10. K. Mitko and M. Bebek, At.Spectrosc. 21(3), 77 (2000).
11. R. Klockenkamper, F. Alt, and R.Brantd, J. Anal. At. Spectrom 16(6), 658 (2001)
12. G.A. Zachariads, A.N. Anthemedis,I. Caniou, and J.A. Strates,International Journal ofEnvironmental AnalyticalChemistry 80 (3), 153 (2001).
13. P. Bermejo Barrera, M.C. BarcielaAlonso, J.M. Moreda Pineiro,C. Gonzalez Sixto, andA. Bermejo Barrera, Spectrochim.Acta B, 51 (9-10), 1235 (1996).
14. R.S. Atgin, O. El-Algha, A. Zararsiz,A. Kocatas, H. Parlak, and G.Tuncel, Spectrochim. Acta B 55,1151 (2000).
15. J.C. Ivaldi and J. F. Tyson,Spectrochim. Acta B 50, 1207(1995).
16. M. Stepan, P. Musil, E. Poussel, andJ.M. Mermet, Spectrochim. Acta B56, 443 (2001).
17. M. Chausseau, E. Poussel, and J.M.Mermet, Fresenius’ J. Anal Chem.370, 341 (2001).
18. X. Romero, E. Poussel, and J. M.Mermet, Spectrochim. Acta B 52,495 (1997).

119Atomic SpectroscopyVol. 23(4), July/August 2002
*Corresponding author.e-mail: [email protected]
Matrix Effects of Tantalum in the Determination of Cr,Fe, Nb, Ni, and Ti in Tantalum Powder Using ICP-OES
G. Anil, *M.R.P. Reddy, Arbind Kumar, and T.L. Prakash Centre for Materials for Electronics Technology (C-MET)
IDA, Phase-II, HCL Post, CherlapalliHyderabad - 500 051, India
ABSTRACT
Inductively coupled plasmaoptical emission spectrometrywas applied to the determinationof trace impurities in tantalumpowder. The matrix effects oftantalum in the determination oftrace level impurities such as Cr,Fe, Nb, Ni, and Ti were studiedby measuring the intensities ofeach trace element in solution atvarious concentrations of tanta-lum. As the concentration of theinterfering element increased, thetrace sensitivity decreased similarto a linear decay, except for ironwhich showed a slight enhance-ment. The relative standard inten-sities of analytes in the tantalummatrix were calculated from1000 to 20,000 mg/L tantalumsolutions. The spectral line pro-file of the trace elements and theinterference effects of tantalum atdifferent concentrations are pre-sented and discussed.
INTRODUCTION
Inductively coupled plasmaoptical emission spectrometry(ICP-OES) is a widely usedinstrumental technique for thedetermination of a large number ofanalytes at different concentrationlevels. ICP-OES offers high samplethroughput with a wide dynamicrange and is relatively free frommatrix interferences. A limitingfactor of the technique whichaffects trace elemental analysis inthe presence of complex matricesis due to the transfer of main matrixelements to the plasma at the samerate as that of the trace. This canresult in changes in the plasma;thus adversely influencingthe analysis.
Several research groups haveconducted studies on the matrixinterference effect, but the matrixelements studied have beenrestricted to alkali metals (1–9).In terms of mechanisms, matrixeffects are due to ionizationsuppression by an excess ofelectrons from the easily ionizableelements (alkali metals) byincreasing collision excitation as aresult of the increased number ofhigh-energy electrons. In the caseof transitional elements (10,11),both atomic and ionic lines aresuppressed in intensity in thepresence of the interferent. Thisis due to ambipolar diffusion, amechanism brought about byelectrons diffusing radially out ofthe central channel. This wouldtend to drag positive ions awayfrom the center to cause areduction in the number of analyte
ions and, therefore, decreaseanalyte emission intensity in thisregion.
C-MET, Hyderabad, is activelyinvolved in the preparation of lowand high voltage capacitor-gradetantalum powder through solventextraction and sodium reductionroutes. Analysis of tantalum powderis routinely carried out usingICP-OES and many interferences areseen during the determination ofCr, Fe, Nb, Ni, and Ti. The presentanalytical work will be vital inregard to tantalum capacitorperformance and applications.
EXPERIMENTAL
Instrumentation
The instrument used for thedetermination of trace elementsin tantalum powder was a
Model JY-24R inductively coupledplasma optical emissionspectrometer (ICP-OES) (JobinYvon, France). A cross-flow typenebulizer was used for pneumaticnebulization. The instrumentalparameters are given in Table I.
Reagents and Standard Solutions
All chemicals used were ofSuprapur® grade (Merck). Thesingle elemental standard solutionswere of Merck grade. The distilleddeionized water used was preparedusing the Nanopure system(Barnstead, USA).
Experimental Procedure
Tantalum powder was dissolvedin a mixture of HF + HNO3 andappropriate concentrations(ranging from 1000 to 20,000mg/L) were prepared. Traceelement standard solutions weremixed into the tantalum solution.To overcome analytical bias due topossible contamination of traces inthe matrices, the matrix solutionwas analyzed as a blank for all traceelement studies.
RESULTS AND DISCUSSION
Matrix-free Line Selection
The spectral interferences thatcommonly accompany the selectionof analyte peaks are coincident lineoverlap, wing overlap from amuch more intense line nearby,and broad-band backgroundenhancement or background shift.These types of interferences cancause an added interference effecton the calibration function. Inabsolute terms, the bias caused bythe tantalum concentration isindependent of the analyteconcentration.

120
Complex spectra are mosttroublesome during analysis whenproduced by the major constituent(i.e., tantalum) because spectrallines from tantalum tend to overlaplines of the analytes or traces. Lineprofiling was performed for eachelement and profiles of 1 mg/L Cr,Fe, Nb, Ni, and Ti standards wereplotted and overlapped with 1000mg/L tantalum individually. Thespectral interference of tantalumon Cr, Fe, Nb, Ni, and Ti is given inTable II.
Chromium Lines
For selecting a chromium linefree of tantalum interference, 12high sensitivity lines were selected(12,13). Of the 12 lines, three lines(266.602 nm, 276.654 nm, and284.984 nm) had a direct tantalumoverlap, and two lines (284.352 nmand 286.511 nm) had a wingoverlap of tantalum.
The spectral interference-freelines were 205.552 nm, 206.149nm, 206.542 nm, 267.716 nm,283.563 nm, 286.257 nm, and286.674 nm.
Iron Lines
Fourteen high sensitivity lineswere selected (12,13). Of 14 linesselected, seven lines (234.349 nm,234.810 nm, 238.204 nm, 240.488nm, 259.940 nm, 261.187 nm, and275.574 nm) had a direct tantalumoverlap and five lines (233.280 nm,238.863 nm, 239.562 nm, 263.105nm, and 273.955 nm) had a wingoverlap of tantalum. The spectralinterference-free lines were258.588 nm and 274.932 nm.
Niobium Lines
Twelve high sensitivity lineswere selected (12,13). Of 12 linesselected, seven lines (271.622 nm,287.539 nm, 292.781 nm, 309.418nm, 313.079 nm, 319.498 nm, and322.548 nm) had a direct tantalumoverlap and three lines (210.942nm, 269.706 nm, and 272.198 nm)had a wing overlap of tantalum.
TABLE IICP-OES Instrumental Operating Conditions
Sequential Spectrometer Jobin Yvon JY-24R
0.64-m Czerny-Turner
Grating Holographic, 3600 grooves mm-1
Spectral range 160-500 nm
Slit width 20 nm for entrance and exits, adjustable
HDD Detector Dynamic range 2.5 x 10¹⁰
Image Measures complete emission spectrum in 2 min (230,000 points)
Plasma torch assembly Fused quartz with capillary injection
Nebulizer and spray chamber Cross-flow type nebulizer and Teflon dual-tube spray chamber
Argon coolant gas flow rate 1.5 L min-1
Argon plasma gas flow rate 12 L min-1
TABLE IISpectral Interference of Tantalum on
Cr, Fe, Nb, Ni, and Ti Wavelengths(1 mg/L of Cr, Fe, Nb, Ni, and Ti lines overlapped
with 1000 mg/L of tantalum)
Wavelengths Wavelengths Wavelengths Wavelengths WavelengthsCr Fe Nb Ni Ti
205.552 nm* 233.280 nm> 210.942 nm< 216.556 nm^ 308.802 nm^
206.149 nm* 234.349 nm^ 269.706 nm< 217.467 nm^ 323.452 nm^
206.542 nm* 234.810 nm^ 271.662 nm^ 221.647 nm^ 323.657 nm*
266.602 nm^ 238.204 nm^ 272.198 nm< 225.386 nm^ 323.904 nm^
267.716 nm* 238.863 nm< 287.539 nm^ 227.021 nm * 334.904 nm^
276.654 nm^ 239.562 nm<> 288.318 nm* 230.300 nm^ 334.941 nm^
283.563 nm* 240.488 nm^ 292.781 nm^ 231.604 nm^ 336.121 nm*
284.325 nm<> 258.588 nm* 295.088 nm* 232.003 nm<> 337.280 nm*
284.984 nm^ 259.940 nm^ 309.418 nm^ 234.554 nm^ 338.376 nm^
286.257 nm* 261.187 nm^ 313.079 nm^ 341.476 nm* 368.520 nm*
286.511 nm> 263.105 nm<> 319.498 nm^ 352.454 nm^ -----
286.674 nm* 273.955 nm< 322.548 nm^ ---- -----
----- 274.932 nm* ----- ------ -----
----- 275.574 nm^ ------ ------ -----
* : No tantalum line overlap present in the vicinity of ±0.05 nm.^ : Direct tantalum line overlap.<> : Right- and left-wing overlap of tantalum line.> : Right-wing overlap of tantalum line.< : Left-wing overlap of tantalum line.
121
Vol. 23(4), July/August 2002
The spectral interference-free lineswere 288.318 nm and 295.088 nm.
Nickel Lines
Eleven high sensitivity lines wereselected (12,13). Of 11 linesselected, eight lines (216.556 nm,217.467 nm, 221.647 nm, 225.386nm, 230.300 nm, 231.604 nm,234.554 nm, and 352.484 nm) hada direct tantalum overlap and232.003 nm had a wing overlap.The spectral interference-free lineswere 227.021 nm and 341.476 nm.
Titanium Lines
Ten high sensitivity lines wereselected (12,13). Of 10 linesselected, six lines (308.802 nm,323.452 nm, 323.904 nm, 334.904nm, 334.941 nm, and 338.376 nm)had a direct tantalum overlap. Thespectral interference-free lines were323.657 nm, 336.121 nm, 337.280nm, and 368.520 nm.
Tantalum-related Effects
Almost any matrix element cancause a change in the sensitivity ofa susceptible spectral line. Thiseffect is related to the ionizationbuffering of easily ionizingelements, such as sodium andpotassium, which cause smallereffects than some elements withhigher ionization potentials liketantalum. The effects are rathercomplicated and far from fullycharacterized. For any traceelement line, the matrix effectis strongly related to the lineexcitation potential and the energyrequired to excite the trace elementfrom its ground state, or a low-lyingenergy level, to the excited state.The analyte lines of Cr, Fe, Nb, Ni,and Ti have a high line excitationpotential (i.e., the energy requiredto raise the analyte atom from itsground state, or low-lying energylevel, to the excited state) and inthe presence of tantalum are muchmore susceptible to matrix effectsin comparison to elements such as
calcium or potassium which have alow excitation potential.
Nevertheless, a grasp of thebroad aspects is meaningfulbecause it bears on the conduct ofpractical analysis. The influence of1000 to 20,000 mg/L of tantalum on1 mg/L of Cr, Fe, Nb, Ni, and Tistandards was studied.
In the case of chromium, exceptfor 205.552 nm and 267.716 nm,other lines had spectralinterferences from a tantalum lineof tantalum concentrations greaterthan 2000 mg/L. The 205.552-nmline showed a decrease in intensityin the 5–25% range and the267.716-nm line showed no changein intensity. Details of these resultsare given in Table III.
In the case of iron, the258.588-nm line had a spectralinterference from a tantalum lineof tantalum concentrations greaterthan 5000 mg/L. The 274.932-nmline showed an increase in intensityin the 3–14% range. Details of theseresults are given in Table IV.
In the case of niobium, the288.021-nm line had a spectralinterference from a tantalum lineat tantalum concentrations greaterthan 10,000 mg/L. The 295.088-nmline showed no decrease in intensity.Details of these results are given inTable V.
In the case of nickel, the341.476-nm line had a spectralinterference from a tantalum line attantalum concentrations greaterthan 5000 mg/L. The 227.021-nmline showed a decrease in intensityin the 3–10% range. Details of theseresults are given in Table VI.
In the case of titanium, exceptfor 336.121 nm and 337.280 nm,other lines had spectralinterference from a tantalum line attantalum concentrations greaterthan 5000 mg/L. The 336.121-nmline showed a decrease in intensityin the 2–4% range and the
337.280-nm line showed a decreasein intensity in the 2–9% range.Details of these results are givenin Table VII.
Matrix Factor
A general matrix factor wascalculated with the help of theanalysis above. With a matrixfactor, the trace element analysisin tantalum powder can be carriedout with a pure standard ratherthan with a standard referencematerial (SRM); thus matrix-matchingis not required.
Actual result = Experimentalvalue x Matrix factor (for1000–20,000 mg/L tantalumsolutions)
Experimental value is theresults obtained by analyzing thetantalum solution by ICP-OES.
Matrix factor (M) =100 / 100 ±increase/decrease in percentage atdifferent concentrations
Standards in the range of 1 mg/L(Cr, Fe, Nb, Ni, and Ti) of theanalyte were doped into standardsolutions of tantalum in the rangeof 1000, 2000, 5000, 10,000, and20,000 mg/L, respectively, and theincrease or decrease in percentageof the analytes was calculated withrespect to a pure standard.
Comparison of Results With a Certified Powder
The method developed wasverified by analyzing 2 g each ofcertified tantalum powdersSTA-18KT (H.C. Starck GmbH &Co., K.G., Germany) and FTW-100(Capacitor-grade powder, China )dissolved in 100 mL (i.e., 20,000mg/L of tantalum ). The results arepresented in the Table VIII. Inaddition, a 2-g/100 mL of tantalumpowder, spiked with pure standardsolution of 0.25 mg/L and 0.5 mg/LCr, Fe, Nb, Ni, and Ti, and therecovery percentage was calculatedwith and without a matrix factor.

122
TABLE IIIChromium (1 mg/L) Added to Different Ta Concentrations
Sample Wavelength 1000 mg/L (S.D) 2000 mg/L (S.D) 5000 mg/L (S.D) 10,000 mg/L (S.D) 20,000 mg/L (S.D) No. Ta Ta Ta Ta Ta
1. 205.552 nm 0.95±0.010 0.92±0.015 0.88±0.020 0.81±0.020 0.75±0.018
2. 206.149 nm 0.92±0.010 0.82±0.035 0.73±0.021 CR CR
3. 206.542 nm 0.98±0.008 0.83±0.033 CR CR CR
4. 267.716 nm 1.02±0.030 1.01±0.026 0.99±0.025 1.02±0.021 0.99±0.025
5. 283.563 nm 0.98±0.020 0.95±0.022 CR CR CR
6. 286.257 nm 0.93±0.020 CR CR CR CR
7. 286.674 nm 0.91±0.030 0.99±0.031 CR CR CR
(S.D) : Standard Deviation of five readings. C.R : Cannot be resolved at this concentration of tantalum.
TABLE IVIron (1 mg/L) Added to Different Ta Concentrations
Sample Wavelength 1000 mg/L (S.D) 2000 mg/L (S.D) 5000 mg/L (S.D) 10,000 mg/L (S.D) 20,000 mg/L (S.D)No. Ta Ta Ta Ta Ta
1. 258.588 nm 0.84±0.010 0.79±0.02 CR CR CR
2. 274.932 nm 1.01±0.02 0.99±0.02 1.03±0.01 1.07±0.009 1.14±0.009
(S.D) : Standard Deviation of five readings.C.R : Cannot be resolved at this concentration of tantalum.
TABLE VNiobium (1 mg/L) Added to Different Ta Concentrations
Sample Wavelength 1000 mg/L (S.D) 2000 mg/L (S.D) 5000 mg/L (S.D) 10,000 mg/L (S.D) 20,000 mg/L (S.D) No. Ta Ta Ta Ta Ta
1. 288.021 nm 1.01±0.002 1.02±0.010 0.99±0.012 0.99±0.010 CR
2. 295.088nm 0.98±0.002 0.99±0.005 0.99±0.003 1.01±0.004 1.00±0.004
(S.D) : Standard Deviation of five readings. C.R : Cannot be resolved at this concentration of tantalum.
TABLE VINickel (1 mg/L) Added to Different Ta Concentrations
Sample Wavelength 1000 mg/L (S.D) 2000 mg/L (S.D) 5000 mg/L (S.D) 10,000 mg/L (S.D) 20,000 mg/L (S.D) No. Ta Ta Ta Ta Ta
1. 227.021 nm 0.97±0.010 0.97±0.010 0.95±0.020 0.92±0.025 0.90±0.025
2. 341.476 nm 1.04±0.010 1.08±0.010 CR CR CR
(S.D) : Standard Deviation of five readings. C.R : Cannot be resolved at this concentration of tantalum.

123
Vol. 23(4), July/August 2002
TABLE VIITitanium (1 mg/L) Added to Different Ta Concentrations
Sample Wavelength 1000 mg/L (S.D) 2000 mg/L (S.D) 5000 mg/L (S.D) 10,000 mg/L (S.D) 20,000 mg/L (S.D) No. Ta Ta Ta Ta Ta
1. 323.657 nm 0.98±0.010 0.99±0.012 0.98±0.011 CR CR
2. 336.121 nm 1.01±0.008 1.01±0.003 0.98±0.007 0.98±0.02 0.96 ±0.005
3. 337.280 nm 0.98±0.010 0.98±0.005 0.95±0.002 0.92±0.008 0.91±0.005
4. 368.520 nm 0.99±0.010 0.90±0.006 CR CR CR(S.D) : Standard Deviation of five readings.
C.R : Cannot be resolved at this concentration of tantalum.
TABLE VIIIAnalysis of Certified Powders
(Results in mg/L)
Sample Elements Wavelength Certified Values Experimental Results Certified Values Experimental ResultsNo. (STA-18KT) X Matrix Factor (FTW-100) Matrix Factor
(STA-18KT) (FTW-100)
1. Chromium 267.716 nm <2.0 1.62 X 1 =1.62 9 8.67 X 1 = 8.67
2. Iron 274.932 nm 7.0 8.05 X 0.925 = 7.43 24 26.5 X 0.925 = 24.51
3. Niobium 295.088 nm <1.0 0.66 X 1 = 0.66 N.R 0.88 X 1 = 0.88
4. Nickel 227.021 nm 6.0 5.50 X 1.11 = 6.10 10 9.41 X 1.11 = 10.44N.R: Values not reported.
TABLE IXRecovery of 0.25 mg/L and 0.50 mg/L Cr, Fe, Nb, Ni & Ti
Spiked in 2 g/100 mL Tantalum Powder
Sample Elements Wavelength 0.25 mg/L spiked 0.5 mg/L spikedNo. Cr, Fe, Nb, Ni & Ti Cr, Fe, Nb, Ni & Ti
Recovery % without Recovery % with Recovery % without Recovery % withmatrix factor matrix factor matrix factor matrix factor
calculation (SD) calculation (SD) calculation (SD) calculation (SD)
1. Chromium 267.716 nm 99.28± 0.10 100.06±0.05 99.12±0.07 100.05±0.03
2. Iron 274.932 nm 114.32±0.09 100.18±0.08 114.18±0.06 100.10±0.06
3. Niobium 295.088 nm 100.21±0.11 100.09±0.06 100.09±0.05 100.12±0.04
4. Nickel 227.021 nm 90.38±0.08 100.05±0.04 90.23±0.06 100.09±0.07
5. Titanium 336.121 nm 96.18±0.05 100.12±0.06 96.11±0.09 100.10±0.06
(S.D) : Standard Deviation of five readings.

124
The results are presented in TableIX. From these experiments it canbe inferred that the experimentalvalues, when multiplied using thematrix factor, showed very closeproximity to the certified values aswell as with the recovery results ofspiked analytes.
CONCLUSION
The ICP-OES, having a 0.64 mmonochromator, was successfullyapplied to the determination oftrace elements Cr, Fe, Nb, Ni, andTi in tantalum powder by selectinglines for each element that are freefrom tantalum interferences andcalculating the matrix effects factorof tantalum ranging from 1000mg/L to 20,000 mg/L tantalum.This factor was applied to theanalysis of certified material andfound to be very suitable. Themethod described can be applieduniversally for the determination oftrace elements in tantalum powder.
ACKNOWLEDGMENTS
The authors would like to thankthe Ministry of InformationTechnology (MIT), Governmentof India, New Delhi, India, forsponsoring the TantalumTechnology Mission Project. Theauthors are also thankful to Dr. B.K.Das, Executive Director, C-MET, Dr.S.L. Sarnot, Director General,STQC, MIT, Dr. K.S.K. Sai, SeniorDirector, Dr. V.C. Sethi, Director,MIT, and Dr. Chandrasekar,Scientist, IICT, for their helpful dis-cussions.
Received May 31, 2002.
REFERENCES
1. M.F. Zaranyika and A.T. Chirenje,Fresenius’ J. Anal. Chem. 368, 45(2000).
2. M.F. Zaranyika and A.T. Chirenje,Fresenius’ J. Anal. Chem. 364, 208(1999).
3. Jan LM de Boer, Walter vanLeeuwen, Ute Kohlmeyer, and M.Peter Breugem, Freseniusí J. Anal.Chem. 360, 213 (1998).
4. I.B. Brenner, A. Zander, M. Cole,and A. Wiseman, J. Anal. At.Spectrom. 12, 897 (1997).
5. L. Paama and P. Peramaki, At.Spectrosc. 18, 119 (1997).
6. A.D. Klerk and C. Rademeyer, J.Anal. At. Spectrom. 12, 1221(1997).
7. Wing-Tat Chan, George CY Chan,Zhenbin Gong, and Nick MN Fan,Analytical Sciences 12, 235(2000).
8. M. Villaneuva, M. Catasus, E.E. Salin,and M. Pomares, J. Anal. At.Spectrom. 15, 877 (2000).
9. A. Krejcova, T. Cernohorsky, and E.Curdova, J. Anal. At. Spectrom.16, 1002 (2001).
10. R.M. Tripkovic, D. Ivanka, andHolclajtner-Antunovic, J. Anal. At.Spectrom. 8, 349 (1993).
11. D. Ivanka, Holclajtner-Antunovic,and R.M. Tripkovic, J. Anal. At.Spectrom. 8, 359 (1993).
12. A. Montaser and D.W. Golightly,Inductively Coupled Plasmas inAnalytical Spectrometry, SecondEdition, VCH Publishers, Inc.(1992).
13. R. Payling and P. Larkins, OpticalEmission Lines of the Elements,John Wiley and Sons Ltd., NewYork (2000).
125
*Corresponding author.e-mail: [email protected]
Determination of REEs in Rocks and Mineralsby Solvent Extraction and ICP-OES
*N.K. Roya and P. Roychowdhuryb
aGeological Survey of India (E.R.), GSI Complex, North Block, 10th Floor Block-DK-6, Sector – II
Karunamoyee, Salt Lake City, Kolkata – 700 091, IndiabChemical Laboratory, Jaipur, India
Atomic SpectroscopyVol. 23(4), July/August 2002
INTRODUCTION
Rare earth elements (REEs) arepresent in geological samples atthe ppm levels. Highly sensitiveinstruments such as neutronactivation analysis (NAA) (1),inductively coupled plasma opticalemission spectrometry (ICP-OES)(2), inductively coupled plasmamass spectrometry (ICP-MS) (3), orisotope dilution mass spectrometry(4) are effective only if the REEs areseparated from the matrix elementsby chemical preconcentration. Theion exchange method (5,6) andcoprecipitation of the REEs oncalcium (7,8) have beenextensively used for the separationof REEs from geological samples.However, these separationtechniques have severe limitationsfor iron- and calcium-rich samples.
The solvent extraction methodhas been recognized as a valuableseparation technique for REEs (9).The use of several reagentsincluding trioctyl-phosphine oxide(TOPO) (10) and a mixture of bis-(2-ethylhexyl) hydrogen phosphate(HDEHP) and 2-ethylhexyldihydrogen phosphate (H2MEHP)(11,12) has been reported in theliterature as good extractionagents. However, benzoyl-phenyl-hydroxylammine (BPHA) has neverbeen attempted as the extractionagent for REEs as a group, althoughthe extraction of individual REEshas been reported.
In this paper we describe theacid digestion and extraction of allREEs using a benzoyl-phenyl-
ABSTRACT
A method has beendeveloped for the determinationof REEs in geological samplesusing solvent extraction andICP-OES. The method involvessample decomposition by HFand HClO4 followed byextraction of the REEs in 1%BPHA and MIBK mixture andmeasurement by ICP-OES. Themethod is particularly suitablefor geological samples with highiron and calcium concentrations.
EXPERIMENTAL
Instrumentation
A Jobin Yvon Model JY-38sequential ICP-OES instrument wasused for the REE determinations.The instrumental operatingconditions are given in Table I.
Reagents and Standards
Standard stock solutions of REEs(100 mg/mL) were prepared bydissolving the corresponding oxide(Specpure, Johnson Mathey) indilute nitric acid. In case of cerium,the oxide was brought intosolution after fusion withpotassium pyrosulphate in a silicacrucible. A combined REE standardof 10 µg/mL was prepared fromthe standard stock solutions and byadjusting the acid concentration to2 M HNO3. The extraction solutionwas 1% BPHA in MIBK.
All reagents used were analytical reagent grade.
hydroxylamine (BPHA) / methyliso-butyl ketone (MIBK) mixture,followed by ICP-OES determinationof the REEs. Using the methoddescribed, five internationalstandard samples, JB-2, JGB-1, JA-3,GA, and SY-4, were analyzed andthe results compared with those ofthe recommended values.
TABLE IInstrumental Operating Parameters
ICP-OES instrument Jobin Yvon JY-38, sequential, CT scanning monochromatorHolographic grating, 3600 grooves/mm,1.0 m focal length.
RF generator 56 MHZ, 2 KW working powerPlasma torch 28 mm outer diameterGas flow Plasma gas 25 L/min
Cooling gas 0.80 L/minCarrier gas 0.30 L/min
Nebulizer PneumaticSample uptake 1.5 mL/minObservation height 14 mn above load coilFlush/integration time 10 sec each

126
Procedure
One gram of sample was placedin a Teflon® beaker and digestedwith 5 mL HC1O4 and 10 mL HFfor four hours on a hot plate whilethe beaker was covered with a lid.The lid was removed and the acidswere evaporated to near dryness.The process was repeated oncewith 5 mL HC1O4 and 5 mL HF.The dried mass was dissolved in10 mL (1:1) HCl and placed in a400-mL beaker. The volume wasbrought to about 100 mL withdeionized water. Then 2.5 mL 1 Msulpho-salicylic acid and 2 gammonium acetate were added andthe pH of the solution was adjustedto 9.0–9.5 by dropwise addition ofdilute ammonia. The solution wastransferred to a 250-mL separatoryfunnel and extracted twice with 10mL 1% BPHA solution in MIBK. Theorganic phases were combined andstripped twice with 4 N HNO3
(using 20 mL for the first strippingand 10 mL for the secondstripping). The aqueous solutionwas placed into a small beaker,boiled for five minutes to removethe organic solvent, andevaporated to 10-mL volume. Thesolution was transferred to a 25-mLvolumetric flask and brought tovolume with deionized water. TheREEs were determined by ICP-OESby nebulizing the solution. Thecalibration standards and blankswere prepared similarly.
RESULTS AND DISCUSSIONS
Sample Decomposition
Generally, treatment withHF/HClO4 is sufficient fordecomposition of the samples.However, when the samplescontain appreciable amounts ofrefractory materials, a small residueis likely to form. In those cases,the solution was filtered and theresidue ignited, fused with sodiumcarbonate, and dissolved in diluteHCl. For iron-rich samples,hydrochloric acid treatment prior
to the addition of hydrofluoric andperchloric acid was performed.
Extraction Studies
Preliminary studies on theextraction conditions of the REEswith BPHA-MIBK indicated that theextraction is maximum at pH9.0–9.5 (Table II). At a lower pH,the extraction is either insufficientor irregular. The concentration ofBPHA was also found to affect theextraction of the REEs. It wasfound that 1% BPHA in MIBKprovides maximum efficiency(Table III).
Interference Studies
Interferences in the extractionof REEs were studied using 10 mLof a 10,000-ppm solution of Fe, Al,Ti, Ca, and Mg and a 2-ppm REEsolution. It was found that the REEsare quantitatively extracted(96–98%) and no interferencewas observed from commoninterferents (Table IV). Al, Fe, andTi remain complexed in solution,while Ca and Mg do not getextracted in this condition. Small
amounts of Fe and Ti, however, getextracted into BPHA-MIBK, butthese are not stripped back into theaqueous phase during stripping ofthe REEs.
Analytical Line Selection
The analytical lines wereselected on the basis of their netand background intensities as wellas their freedom from spectralinterferences. Our line selectioncorresponds to those reported bythe majority of workers (7,8,13)(Table V). However, we selectedthe 408.672 nm and 406.109 nmlines over the commonly used linesat 398.852 nm and 430.358 for Laand Nd, respectively, becausebetter results were obtained usingthe former lines.
Precision and Accuracy
Precision was studied byanalyzing United States GeologicalStandard (USGS) samples, AGV-1,five times using the methoddescribed. It was found that theRSD varied between 2–9%.
TABLE IIExtraction of REEs With Different pH Conditions
(2 ppm REE solution, 1% BP HA solution in MIBK used for extraction)
Elements pH 5 pH 7 pH 8 pH 9 pH 9.5
La 0.55 1.10 1.65 1.95 1.94Ce 0.70 0.90 1.70 1.95 1.94Pr 0.43 1.25 1.75 1.95 1.93Nd 0.85 1.10 1.65 1.93 1.97Sm 1.20 1.45 1.70 1.92 1.92Eu 0.73 0.85 1.45 1.95 1.93Gd 0.90 1.05 1.55 1.90 1.90Tb 0.75 0.95 1.80 1.92 1.96Dy 1.05 1.25 1.85 1.95 1.94Ho 0.55 0.78 1.40 1.94 1.92Er 1.10 1.25 1.75 1.93 1.98Tm 0.85 0.95 1.65 1.96 1.93Yb 0.90 1.20 1.77 1.95 1.98Lu 0.67 0.85 1.65 1.90 1.97Y 0.80 0.95 1.55 1.90 1.91

127
Vol. 23(4), July/August 2002
TABLE IIIExtraction of REEs With Different BPHA
Concentration in MIBK Solution (pH of 9–9.5, 2 ppm REE solution)
Elements 0.1% BPHA 0.5%BPHA 1% BPHAsolution solution solution
La 0.50 1.77 1.90Ce 0.70 1.82 1.92Pr 0.82 1.6.5 1.95Nd 0.55 1.71 1.93Sm 1.05 1.80 1.95Eu 1.10 1.74 1.95Gd 0.74 1.85 1.96Tb 0.80 1.63 1.85Dy 0.66 1.82 1.86Ho 0.95 1.84 1.89Er 0.86 1.74 1.95Tm 0.95 1.82 1.93Yb 0.73 1.64 1.92Lu 0.85 1.82 1.90Y 0.85 1.77 1.88
TABLE IVRecovery of REEs in Presence of Fe, Al, Ti, Ca, and Mg
10 ppm of 5-mL REE solution was taken and after extraction, brought to 25-mL volume. Extraction of REEs was performed in 1% BPHA in MIBK solution.
Elements REE solution REE solution REE solution REE solution+ 10 mL of 10,000 ppm +10 mL of 10,000 ppm +10 mL of 10,000 ppm
Fe solution Ca solution Fe, Al, Ti, Ca, and Mg solution
La 1.95 1.93 1.92 1.90Ce 1.96 1.93 1.92 1.93Pr 1.93 1.92 1.92 1.90Nd 1.92 1.92 1.91 1.90Sm 1.95 1.94 1.93 1.94Eu 1.92 1.92 1.91 1.90Gd 1.93 1.93 1.92 1.91Tb 1.94 1.93 1.92 1.91Dy 1.95 1.94 1.94 1.93Ho 1.90 1.90 1.89 1.88Er 1.92 1.91 1.90 1.89Tm 1.93 1.90 1.90 1.90Yb 1.95 1.93 1.92 1.93Lu 1.92 1.92 1.90 1.90Y 1.95 1.94 1.93 1.90
TABLE VAnalytical Line, Detection Limit, and Precision Study
Elements Wavelength Detection limita RSDb
(nm) (µg/g) (%)
La 408.672 0.10 3.5
Ce 418.660 0.20 2.5
Pr 422.535 0.20 6.5
Nd 406.109 0.10 5.1
Sm 359.260 0.10 3.4
Eu 381.967 0.02 1.5
Gd 342.247 0.10 5.6
Tb 350.917 0.10 8.8
Dy 353.170 0.05 6.2
Ho 345.600 0.05 7.5
Er 369.265 0.10 5.6
Tm 313.126 0.06 4.2
Yb 328.937 0.02 5.6
Lu 261.542 0.04 6.9
Y 371.030 0.05 3.5aDetection limit based on 1 g of sample in a final volume of 25 mL.
bRSD calculated by analyzing AGV-1 (Andesite, USGS) five times.
The accuracy was checkedby analyzing five internationalstandard reference samples, JB-2(Basalt), JGB-1 (Gabbro), and JA-3(Andesite) (Japanese standards),GA (Granite) (CRPG, France), andSY-4 (Diorite Gneiss) (CanadianStandard). The data presented inTable VI (A and B) show goodagreement for all samples withthose of the recommended values.
The detection limits (based on3 times the standard deviation) aregiven in Table V and the results ofthe method described arecomparable or better than thoseusing other methods.
CONCLUSION
The proposed method usingsolvent extraction and ICP-OES isapplicable to all types of samplesfor the determination of REEs.The results obtained show goodagreement with the recommendedvalues. The method is particularly

128
applicable for geological samplescontaining high levels of iron andcalcium where current ionexchange / Ca-oxalatecoprecipitation methods are notsuitable.
Received April 4, 2002.
REFERENCES
1. H. De Baar, M. Becon, P.Brewer, and K. Bruland,. Geochim.Cosmochim. Acta 49, 1943 (1985).
2. J.G. Crock, F.E. Lichte, andT.R. Wildman, Chem. Geol. 45, 149(1984).
3. A.R. Date and A.L. Gray(Editor), Application of InductivelyCoupled Plasma Mass Spectrometry,Blackie, Glasgow and London, UK,254 pp. (1989).
4. A. Masuda, N. Nakamura, andT.Tanaka. Geochim. Cosmochim.Acta, 37, 239 (1973).
5. K.E. Jarvis and I. Jarvis,Geostand. Newsl. 12,1 (1988).
6. J.G. Crock, F.E. Lichte, G.O.Riddle, and C.L. Beech, Talanta 33,601 (1986).
7. K. Iwasaki and H.Haraguchi,Anal. Chim. Acta 208, 163 (1988).
8. P. Roychowdhury, N.K. Roy,D.K. Das, and A. K. Das, Talanta 12,1183 (1989).
9. A.K. De, S.M. Khopkar, andR.A. Chalmers, Solvent Extractionof Metals, Van Nostrand-Reinhold,London, UK, 109 pp (1970).
10. Dalibor Weiss, TomasPaukast, and Ivan Rubeska, J. Anal.At.. Spectrom. 5, 371 (1990).
11. M.B. Shabani and A. Masuda,Anal. Chem. 63, 2099 (1991).
12. P.K. Srivastava and A.Premadas, J.Anal. At. Spectrom. 14,1087 (1999).
13. R. Lara, R.A. Osina, E.Marchevsky, J.A. Gasquez, and L.D.Martinez, At. Spectrosc. 21, 172(2000).
TABLE VI (A)Determination of REEs in Standard Reference Materials
(all values in µg/g)
Elements JB-2 JGB-1 JA-3Present Recommended Present Recommended Present Recommendedworka valuesb worka valuedb worka valuesb
La 2.30 2.35 3.48 3.60 9.25 9.33Ce 6.80 6.76 8.30 8.17 22.62 22.80Pr 0.95 1.01 1.05 1.13 2.52 2.40Nd 6.42 6.63 5.30 5.47 12.18 12.30Sm 2.40 2.31 1.60 1.49 3.21 3.05Eu 0.78 0.86 0.50 0.62 0.71 0.82Gd 3.12 3.28 1.68 1.61 3.15 2.96Tb 0.55 0.60 0.35 0.29 0.62 0.52Dy 3.80 3.73 1.68 1.56 3.10 3.01Ho 0.70 0.75 0.39 0.33 0.46 0.51Er 2.48 2.60 1.10 1.04 1.67 1.57Tm 0.48 0.41 0.21 0.16 0.35 0.28Yb 2.72 2.62 1.18 1.06 2.28 2.16Lu 0.35 0.40 0.20 0.15 0.35 0.32Y 24.40 24.90 10.60 10.40 20.85 21.20
TABLE VI (B)
Elements GA Sy-4Present Recommended Present Certified worka valuesb worka valuesc
La 41.15 41.60 59.20 58 ± 1Ce 79.80 80.90 124.20 122 ± 2Pr 8.25 8.16 14.70 15.0 ± 0.3Nd 29.90 29.60 58.20 57 ± 1Sm 5.69 5.86 11.95 12.7 ± 0.4Eu 1.18 1.09 2.12 2.00 ± 0.04Gd 4.38 4.50 13.80 14.0 ± 0.50Tb 0.80 0.73 2.75 2.6 ± 0.1Dy 3.45 3.53 18.65 18.2 ± 0.6Ho 0.76 0.70 4.15 4.3 ± 0.10Er 2.52 2.41 14.83 14.2 ± 0.50Tm 0.52 <0.40 2.18 2.3 ± 0.10Yb 2.42 2.30 14.93 14.80 ± 0.80Lu 0.35 0.31 2.18 2.10 ± 0.10Y 19.30 19.80 122.0 119 ± 2.0a Average of three determinations.b K. Govindaraju, Geortand. Newsl. Special Issue, 13 (1989).c CCRMP, Issue 1, CANMET (1995).
129Atomic SpectroscopyVol. 23(4), July/August 2002
Determination of Selenium in Dietary Supplements by ETAAS and HG-AAS: A Comparative Study
Liliana Valientea, Margarita Piccinnaa, Emiliano Romero Alea, Ariel Grilloa, and *Patricia Smichowskib
a Instituto Nacional de Tecnología Industrial, CEQUIPELaboratorio de Análisis de Trazas
Casilla de Correo 157, B1650KNA-San Martín, Pcia. Buenos Aires, Argentinab Comisión Nacional de Energía Atómica, Centro Atómico Constituyentes, Unidad de Actividad Química
Av. Gral. Paz 1499, B1650KNA-San Martín, Pcia. Buenos Aires, Argentina
ABSTRACT
A study was carried out toestablish a reliable procedurefor determining Se in dietarysupplements. Three differentbrands of Se food supplementswere evaluated. Thesesupplements were digestedwith HNO3 and H2O2 using atwo-cycle microwave procedure.Electrothermal atomic absorptionspectrometry (ETAAS) andhydride generation-atomicabsorption spectrometry(HG-AAS) techniques wereselected for total Se determination.The adverse effects of potentiallyinterfering metals that arenormally present in theseproducts were taken intoaccount. In particular, the effectof Cu, Mn, and Zn on the Sesignal was investigated. Copperreduces the Se signalsignificantly when HG-AAS wasused for quantification. On theother hand, no interferenceeffects were detected whenETAAS was used and for thisreason it was selected as thebest alternative to analyze thesamples.
The overall approach wastested in tablets of vitamins-minerals-amino acids, nutritionalsupplements and Se-enrichedyeast. The selenium contentranged from 15.9±0.7 to81.1±3.3 µg of Se per tablet. Thedata obtained demonstrate thatthe Se content reported on thelabels of dietary supplements areoften inaccurate. The detectionlimits were found to be 0.18 µgg-1 Se and 0.06 µg g-1 Se forETAAS and HG-AAS, respectively.Precision was always better than6%, while the recovery dataranged between 93 and 105%.
INTRODUCTION
Selenium has long been knownas a necessary component in thehuman diet and its occurrence andfunction in biological systems hasbeen well-documented (1).
Selenium is an essential nutrientfor humans. Food is the mainsource for incorporation into thehuman body, and drinking water isresponsible for a significant fractionof the total intake (2). Amounts of55–70 µg of Se have beenrecommended as the daily intake (3).Daily consumption of less than 0.1mg kg-1 per body weight will resultin Se deficiency while levels above1 mg kg-1 are considered toxic(4,5). Deficiency of Se has beenassociated with an endemic formof cardiomyopathy. A variety ofother diseases, including cancer,have also been linked to a low Sestatus (6). The maximum allowedconcentration of Se in drinkingwaters recommended by the WHO(World Health Organization) is10 µg L-1. Selenium concentrationshigher than 130 µg L-1 are toxic.
Atomic absorption spectrometry(AAS) [in conjunction with hydridegeneration (HG-AAS)], electrothermalatomic absorption spectrometry(ETAAS), and inductively coupledplasma mass spectrometry (ICP-MS)have gradually assumed primeimportance in the ability to verifywhether foodstuffs andpharmaceutical products complywith health requirements and thenational or internationalregulations. Specifically for Se, it isimportant to assess whether it is
*Corresponding author.e-mail: [email protected]
within a pre-establishedconcentration range.
Dietary supplements of Se havebecome very popular due to itsdocumented anti-carcinogenicactivity and beneficial effects oncerebrovascular diseases (7).Selenium also plays an antioxidantrole because it protects the cellmembrane from the perniciousaction of peroxides. For thesereasons, it is of particularimportance to evaluate the Secontent in dietary products.B’Hymer and Caruso (8) analyzedyeast-based Se supplements usinghigh performance liquidchromatography (HPLC) andICP-MS. The authors reported thatthe total Se levels were between91 and 111% of label value, whilethe content of selenomethioninewas often found to be inaccurate.
Various clients of our analyticalservice group (CEQUIPE, INTI)asked for total Se determinationin different types of dietarysupplements. According toArgentinian regulations, the Secontent in imported products mustbe controlled. For this reason, areliable and robust methodologyfor total Se determination isrequired.
In this study, the two analyticaltechniques ETAAS and HG-AAS arecompared in order to establish areliable methodology for thedetermination of total Se in dietarysupplements.

130
EXPERIMENTAL
Instrumentation
A PerkinElmer Model 5100 ZLatomic absorption spectrometer(PerkinElmer, Shelton, CT, USA),equipped with a PerkinElmerModel THGA graphite furnace,PerkinElmer Model AS-71autosampler, and longitudinalZeeman-effect backgroundcorrector, was used for the atomicabsorption measurements.Electrodeless discharge lamps (EDL,PerkinElmer) were the sources ofradiation used for Se determination.Pyrolytically coated graphite tubeswith pyrolytic graphite L´vovplatforms were employed.High-purity Ar (flow rate: 250 mLmin-1) was used to purge air fromthe graphite tubes, except duringthe atomization step wherestopped flow conditions were used.The analytical measurements werebased on peak area. Autosamplervolumes of 20 µL of sample,followed by 5 µL of chemicalmodifier were employed for allstudies. Each analysis was repeatedat least three times to obtain theaverage value and its relativestandard deviation (%RSD). TheETAAS operating conditions andmatrix modifier used aresummarized in Table I.
An automated HG-AAS systembased on a PerkinElmer 4000atomic absorption spectrometer,equipped with a PerkinElmerMHS-20 mercury/hydride system,was used for the hydridegeneration studies. Electrodelessdischarge lamps (EDL, PerkinElmer)were the sources of radiation usedfor Se determinations. Theinstrumental parameters of theHG-AAS system and the hydridegeneration conditions for Sedetermination are listed in Table II.
A CEM MSD-2000 microwavedigestion system (CEM, Matthews,NC, USA) with a maximummicrowave power of 630 W,
operating temperatures of 200ºCand operating pressure of1.38 MPa, were used fordissolution of the samples.
Reagents and Standard Solutions
All chemicals were of analyticalreagent grade unless otherwisestated. Deionized water(Barnstead, Dubuque, IA, USA)was used throughout. All solutionswere stored in high-densitypolypropylene bottles. Plasticbottles, autosampler cups, andglassware were cleaned bysoaking in 20% (v/v) HNO3 for 24h, then rinsed three times withdeionized water. Commerciallyavailable 1000 mg L-1 Se standardsolutions (Merck, Darmstadt,Germany) were prepared dailyby serial dilution of the stocksolutions. Analytical reagent nitricacid (Merck) was used after
additional purification by sub-boilingdistillation in a quartz still.
The mixed Pd and Mg(NO3)2
matrix modifier solution wasprepared by adding 5 mL of 0.3%Mg(NO3)2 solution and 2.5 mL of10 g L-1 Pd solution (Merck) into a25-mL volumetric flask, thenbringing to volume with deionizedwater. The final concentration ofthe matrix modifier solution was0.06% Mg(NO3)2 and 0.1% Pd.High-purity Ar was used to purgeair from the graphite tubes.
Samples and Sample Handling
Three brands (A, B, and C) ofdietary supplements were analyzedfor total Se content. Contentuniformity testing was performedby randomly selecting five tabletsfrom each bottle. The tablets ofeach batch were ground and mixedthoroughly using a mortar and
TABLE IOperating Conditions for Se Determination
in Dietary Supplements by ETAAS
Analytical wavelength Se: 196.0 nmSlit width 2.0 nmElectrodeless discharge lamp 210 mA Injection volume (sample) 20 µLInjection volume (modifier) 5 µLMatrix modifier Pd 0.10 % + Mg(NO3)2 0.06 % (m/v) Measurement mode Peak area Purge gas (flow rate) 250 mL min-1 (Ar)
TABLE IIInstrumental Parameters and Hydride Generation Conditions
for Se Determination by HG-AAS
Instrument PerkinElmer 4000 AASAnalytical wavelength 196.0 nmSlit width 2.0 nmElectrodeless discharge lamp 280 mAMeasurement mode Peak height
Hydride generation conditionsInstrument PerkinElmer MHS-20Sample acidity 5 mol L-1 HClNaBH4 concentration 3% (in 1% NaOH)Cell temperature 900°C

131
Vol. 23(4), July/August 2002
pestle. Three sub-samples of eachmixture were accurately weighedand used for the digestion step.
Sample Treatment
Selenium quantification byHG-AAS and ETAAS requirespreliminary digestion of thesamples into liquid solutions. Twosample treatment procedureswere followed depending on thetechnique used for subsequent Sequantification.
All experiments were performedin triplicate. In all cases, a set ofdigestion blanks was prepared. Inorder to decrease digestion blanks,purified nitric acid was used.
Procedure 1 (Se Determination by ETAAS)
A 0.5-g sample was transferredinto Teflon® vessels and 10 mL ofpurified concentrated HNO3
(Merck, 70%) and 2.0 mL of H2O2
(Merck, 30%) were added. Theaverage microwave (MW)pressure applied during thedigestion steps varied from 40to 170 psi and the completemineralization cycle was less than45 min. The operating conditionsfor MW digestion of the dietarysupplements are listed in Table III.Optimization of power and time inthe MW digestion is importantin order to achieve completedissolution of the samples. Thedigestion solutions were allowedto cool, transferred into 100-mLgraduated flasks, and diluted to themark with deionized water.
For assessing the accuracy ofthe method, aliquots of theCRM TORT-1, Lobster hepatopan-creas (NRCC, Ottawa, Québec,Canada) were treated in the samemanner as the samples.
Procedure 2 (Se Determination by HG-AAS)
After microwave treatment (asdescribed above), the vessels wereallowed to cool, then opened,placed on a hot plate, andevaporated to dryness. The residuewas dissolved by dropwise additionof 5 mL (1+1) HCl solution. Theresulting solution was placed in aboiling water bath (loosely coveredwith a watch glass) and heated at950C for about 15 min to convertall Se to Se(IV). The digest wasallowed to cool and was thentransferred into a 100-mLvolumetric flask. Eight mL ofconcentrated HCl was added andthe solution diluted to volumewith deionized water.
For assessing the accuracy of themethod, aliquots of CRM TORT-1,Lobster hepatopancreas (NRCC,Ottawa, Québec, Canada) weretreated in the same manner asthe samples.
Calibration
The calibration curves wereobtained with calibration standardsprepared in the same acid mediumas the samples. In spite of thecomplexity of the matrix analyzed,
no standard addition calibrationwas necessary. The calibration waschecked every 20 measurementswith analyte solutions varying from10 to 100 ng mL-1.
Analytical Determinations
The hydride generation inconjunction with AAS wasperformed which enables thedetection level for Se to be reducedby at least two orders of magnitude.
Selenium concentrations werealso determined by ETAAS byinjecting 20-µL aliquots of digestedsample and 5 µL of chemical matrixmodifier at each firing into thepyrolytically coated tubes andapplying the operating conditionsand the temperature program givenin Tables I and IV, respectively.The signals were registered aspeak area.
Unfortunately, and to the bestof our knowledge, no CRMs forSe determination in dietarysupplements are currently available.For this reason, TORT-1 waschosen as a possible alternative tocheck the accuracy of the method.In addition, a recovery testwas performed.
TABLE IIIMicrowave Digestion Program
Sample weight 0.50 gReagents 10 mL HNO3 (70%)
2 mL H2O2 (30%) added in the second cycleFinal volume 100 mLMicrowave program:First cycle StepsPower (%) 100 100 100 100Pressure (psi) 40 85 135 170Time (min) 10 10 6 6
Second cyclePower 100%Pressure 80 psiTime 10 min

132
RESULTS AND DISCUSSION
Selection of Digestion Reagents
The selection of the type andamount of acid concentration andMW operating parameters isimportant for the successfuldissolution of the samples. Nitricacid was used due to its excellentdissolving capabilities. Preliminarystudies demonstrated that amaximum power last-stage wasbeneficial for better digestion(9,10). This is attributed to thefact that the rate of the digestionreaction of acid decomposition andoxidation power of the acids
increases with higher power. Theaddition of peroxide to the nitricacid was necessary to increase theoxidation efficiency.
HG-AAS vs. ETAAS to DetermineSe in Dietary Supplements
Owing to the high oxidationpotential of acid mixtures, mostparts of the selenium species areprobably converted into selenate.A pre-reduction step for convertingthe selenium species into Se(IV) isnecessary in all HG proceduresbecause only Se(IV) is capable ofgenerating the Se hydride. Thisreduction step should be
performed at high temperatures(90–100ºC) since the redoxequilibrium is temperature-dependent (11). To convert Se(VI)to Se(IV) for maximum efficiency inthe generation of SeH2, the digestedsamples were heated at 95ºC for 15min in (1+1) HCl solution.
The effect of tetrahydroborate(III) concentration on the Seresponse was also examined.Optimal Se signals were achievedwith 3% (w/v) NaBH4. Forconcentrations higher than 3.5%,the sensitivity decreased slightly.The optimized chemical andphysical hydride generationparameters are listed in Table II.
The generation of SeH2 is veryfast and is estimated to take placein less than 10 ms (12). The generation conditions wereoptimized taking specialconsideration of the kinetics ofthe reaction since Se is normallyreduced faster than the interferingtransition metals. A rapid separationof the gaseous products was alsotaken into account.
Three typical transition metalspresent in dietary supplementswere tested in order to evaluate ifthe Se signal is affected in theirpresence when optimizedconditions are used to generate theSe hydride. The concentrations ofCu, Mn, and Zn listed on the labelsof brands A and C were 1 mg, 5 mg,and 20 mg, respectively. The labelsof brand B listed 2 mg Cu, 2.5 mgMn, and 15 mg Zn.
All solutions analyzed contained60 µg L-1 of Se and the results arethe average of three measurements.The amounts of Cu, Mn, and Znadded represent 30, 70, and 100% ofthe content of each metal in thedietary supplements according tolabel claims. The maximumconcentration of the metals in thefinal solution were 6 µg mL-1 Cu;30 µg mL-1 Mn, and 120 µg mL-1 Zn.Figure 1 shows that the interference
TABLE IVGraphite Furnace Temperature Program
Parameter Drying Pyrolysis Atomi-- Con-Step 1 Step 2 zation ditioning
Temperature (°C) 110 130 1100 2150 2400
Ramp time (s) 1 15 10 0 1
Hold time (s) 30 30 20 5 2
Ar flow rate (mL min-1) 250 250 250 0 (read) 250
Fig. 1. Interference study.

133
Vol. 23(4), July/August 2002
effect caused by Cu is serious to theextent that the Sesignal was significantly reducedwhen 1.8 µg mL-1 of Cu was added.Reductions between 25 and 40%were also observed when Mn andZn were tested at concentrations of9.0 and 36 µg mL-1, respectively
In an effort to overcome theeffect observed, the reductantconcentration was decreased andthe concentration of HCl increased.Studies on the mechanism oftransition metal interferences in HG-AAS have demonstrated thatsmaller amounts of reductant cansubstantially improve the toleranceto transition metal interferences(13). Some authors prefer to usehigher HCl concentrations in orderto increase the efficiency of SeH2
production (14,15). However, wefound that under the experimentalconditions of this study, nosignificant improvement in Serecovery was observed.
The situation was different whenETAAS was used to analyze thesamples and no matrix effects wereobserved. Figure 1 shows that Cu,Mn, and Zn do not affect theSe signal. Based on these results,ETAAS was chosen as the bestalternative to analyze dietarysupplement samples.
Quality Parameters
The detection andquantification limits werecalculated following the IUPACregulations based on the 3 and10 criterion, respectively, for 10replicate measurements of theblank signal. The relative standarddeviation (%RSD) was calculatedfor 10 successive measurementsof a solution containing a finalconcentration of 50 ng mL-1 Se.The results are summarized inTable V together with the results ofthe accuracy test using ETAAS andHG-AAS.
Unfortunately, no CRMs forSe in the studied matrix arecommercially available and for thisreason, a recovery test wasperformed on several dietarysupplements. Samples 1-A, 6-A, 1-B,5-B, 1-C, and 2-C were spiked with20 µg of Se and the over-allanalytical procedure followed. Therecovery data ranged from 93 to105%. Although this cannot replacean accuracy test, the informationgained verifies the goodperformance of the method.
Determination of Se in SelectedDietary Supplements
The Se content was determinedby ETAAS in three differentcommercial dietary supplements.Table VI lists the Se concentrationsfound vs. the content per tablet
reported by the manufacturer.Total Se levels found were between10.0±0.5 and 81.1±3.3 µg pertablet based on a five-tabletcomposite assay. The label listed20 µg Se per tablet for brandsA and C and 25 µg Se per tabletfor brand B. It is important to notethat significant differences werefound between bottles of the sametrademark. Brand A exhibited avariation among bottles rangingfrom 15.9±0.6 to 27.2±1.1 µg of Seper tablet. The variation in brand Bwas between 25.2±1.2 and81.1±3.3 µg of Se per tablet,and in brand C from 10.0±0.5 to29.5±1.3. Brand B exhibited adifference of over 300%.
CONCLUSION
The data obtained in this studyshow that the major shortcomingof the HG-AAS approach is that thepresence of transition metals suchas Cu, Mn and Zn affects theformation and release of SeH2,with Cu causing the most seriousinterference.
On the other hand, ETAASprovides an excellent means forthe determination of total Se indietary supplements.
This study also shows that theSe content reported on labels ofdietary supplements is ofteninaccurate.
Received July 16, 2002.
TABLE VPerformance Levels for the Se Determination
in Dietary Supplements Using ETAAS and HG-AAS
Parameter ETAAS HG-AASDetection limita 0.18 µg g-1 0.06 µg g-1
Quantification limita 0.6 µg g-1 0.2 µg g-1
Precisiona 3.7% 5.6%Accuracy testb
- Certified value 6.88±0.47 µg g-1 6.88±0.47 µg g-1
- Found 6.6 ± 0.3 µg g-1 6.1±0.4 µg g-1
a n=10.b CRM TORT-1, Lobster hepatopancreas (NRCC, Ottawa, Québec, Canada).
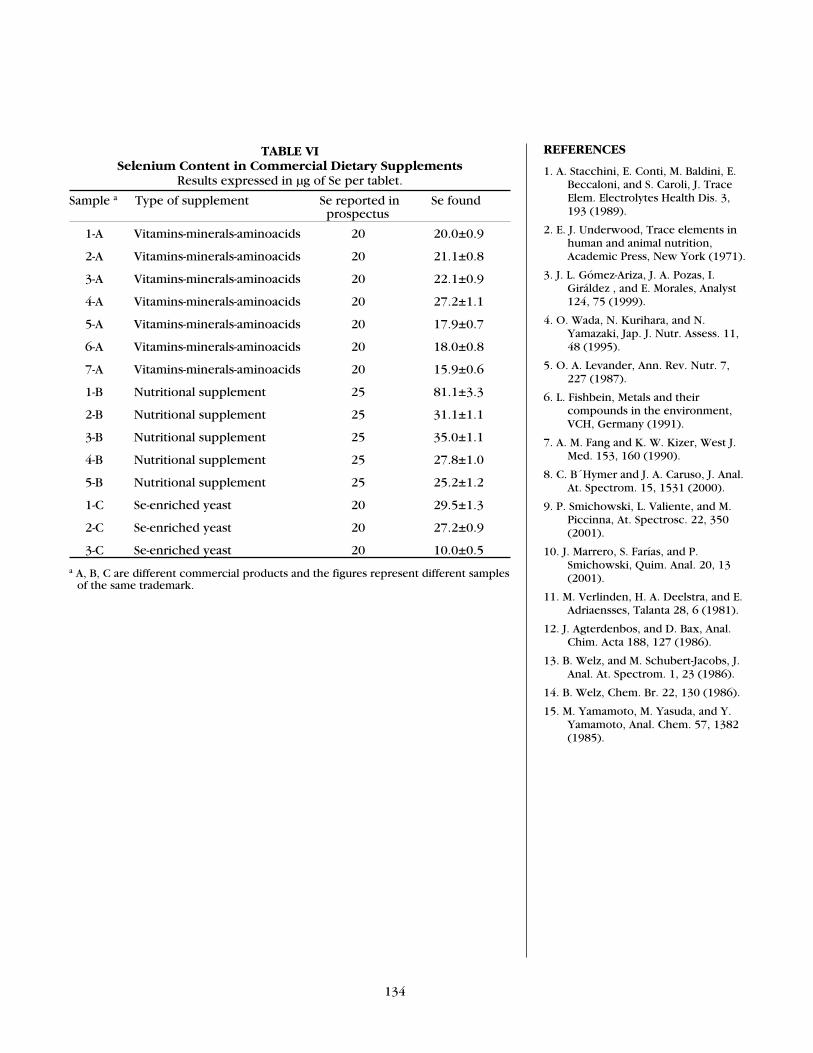
134
TABLE VISelenium Content in Commercial Dietary Supplements
Results expressed in µg of Se per tablet.
Sample a Type of supplement Se reported in Se found prospectus
1-A Vitamins-minerals-aminoacids 20 20.0±0.9
2-A Vitamins-minerals-aminoacids 20 21.1±0.8
3-A Vitamins-minerals-aminoacids 20 22.1±0.9
4-A Vitamins-minerals-aminoacids 20 27.2±1.1
5-A Vitamins-minerals-aminoacids 20 17.9±0.7
6-A Vitamins-minerals-aminoacids 20 18.0±0.8
7-A Vitamins-minerals-aminoacids 20 15.9±0.6
1-B Nutritional supplement 25 81.1±3.3
2-B Nutritional supplement 25 31.1±1.1
3-B Nutritional supplement 25 35.0±1.1
4-B Nutritional supplement 25 27.8±1.0
5-B Nutritional supplement 25 25.2±1.2
1-C Se-enriched yeast 20 29.5±1.3
2-C Se-enriched yeast 20 27.2±0.9
3-C Se-enriched yeast 20 10.0±0.5
a A, B, C are different commercial products and the figures represent different samplesof the same trademark.
REFERENCES
1. A. Stacchini, E. Conti, M. Baldini, E.Beccaloni, and S. Caroli, J. TraceElem. Electrolytes Health Dis. 3,193 (1989).
2. E. J. Underwood, Trace elements inhuman and animal nutrition,Academic Press, New York (1971).
3. J. L. Gómez-Ariza, J. A. Pozas, I.Giráldez , and E. Morales, Analyst124, 75 (1999).
4. O. Wada, N. Kurihara, and N.Yamazaki, Jap. J. Nutr. Assess. 11,48 (1995).
5. O. A. Levander, Ann. Rev. Nutr. 7,227 (1987).
6. L. Fishbein, Metals and theircompounds in the environment,VCH, Germany (1991).
7. A. M. Fang and K. W. Kizer, West J.Med. 153, 160 (1990).
8. C. B´Hymer and J. A. Caruso, J. Anal.At. Spectrom. 15, 1531 (2000).
9. P. Smichowski, L. Valiente, and M.Piccinna, At. Spectrosc. 22, 350(2001).
10. J. Marrero, S. Farías, and P.Smichowski, Quim. Anal. 20, 13(2001).
11. M. Verlinden, H. A. Deelstra, and E.Adriaensses, Talanta 28, 6 (1981).
12. J. Agterdenbos, and D. Bax, Anal.Chim. Acta 188, 127 (1986).
13. B. Welz, and M. Schubert-Jacobs, J.Anal. At. Spectrom. 1, 23 (1986).
14. B. Welz, Chem. Br. 22, 130 (1986).
15. M. Yamamoto, M. Yasuda, and Y.Yamamoto, Anal. Chem. 57, 1382(1985).
135Atomic SpectroscopyVol. 23(4), July/August 2002
*Corresponding author.e-mail: [email protected]: +55 51 3316 7304
Evaluation of Different Permanent Modifiers for theDetermination of Cadmium in Environmental Samples
by Electrothermal AAS*Éder C. Lima, Ronílson V. Barbosa, Júlio C. P. Vaghetti, and Leandro S. Ferreira
Instituto de Química, Universidade Federal do Rio Grande do SulAv. Bento Gonçalves 9500, Caixa Postal 15003
CEP 91501-970, Porto Alegre-RS, Brazil
ABSTRACT
Different permanent modifiers(Rh, Ir, Ru, W-Rh, W-Ru, and W-Ir),thermally deposited on theintegrated platform of atransversely heated graphiteatomizer (TGA), were employedfor the determination of cadmiumin soil, coal, coal fly ash, andsediments by electrothermalatomic absorption spectrometry(ETAAS).
Microwave digests of solidsamples were employed for obtainingthe analytical characteristics of themethods with different permanentmodifiers. The performance of themodifiers for the determination ofcadmium in the real samplesdepended strongly on the type ofpermanent modifier chosen.The Rh, Ir and Ru permanentmodifiers were not suitable forcadmium determination, whererecoveries were always lowerthan 90%. On the other hand,using W-Rh, W-Ru, and W-Ir asthe permanent modifiers, therecoveries obtained were within95–104% for all samples.
Long-term stability curvesobtained for the determinationof cadmium in environmentalsamples with the differentpermanent modifiers (Rh, Ir, Ru,W-Rh, W-Ir, and W-Ru) showedthat the improvement in tubelifetime depends on the tungstendeposit on the platform. The tubelifetime, using the tungsten-noblemetal permanent modifier, was20% longer when compared tothe single noble metal permanentmodifier.
The results in thedetermination of cadmium in thesamples, employing differentpermanent modifiers, were inagreement with the CRMs. Nostatistical differences were foundafter applying the paired t-test atthe 95% confidence level.
vegetables, and root vegetables alsocontain relatively high levels. Organmeats (liver and kidney) andshellfish can also contribute to highlevels of cadmium intake (2).
Electrothermal atomic absorptionspectrometry (ETAAS) is one of themost employed techniques usedin the determination of lowconcentrations of cadmium inenvironmental samples (1,2) due toits high selectivity and sensitivity forthis analyte determination.
In recent years, permanentmodifiers have been successfullyused for ETAAS analysis (3–20).The main advantages of permanentmodifiers reported (3–14) includereduction in the time required forsample dispensing, leading tosimpler and faster heating programsfor ETAAS analysis; loweringmodifier blanks due to theelimination of volatile impuritiesduring graphite treatment, resultingin better detection limits; longersignal term stability, which reducesthe number of recalibrationsrequired during routine analysis;remarkable improvement in tubelifetime, thus lowering analyticalcost (3–14). However, only theW-Rh permanent modifier hasbeen extensively applied for thedetermination of Cd, Pb, As, and Cuin digested as well as slurry samplesof biological and environmentalorigin (3–14).
This paper shows the differencein performance of single noblemetal permanent modifiers (Rh, Ir,and Ru) and mixed permanentmodifiers (W-Rh, W-Ir, and W-Ru)for the successful ETAASdetermination of Cd inenvironmental samples. The
INTRODUCTION
Cadmium is a toxic elementfound in the environment (i.e.,soils, sewage sludges, coal, fly ash,coals, surface and undergroundwater) and can be hazardous tohuman health (1,2).
Small amounts of cadmiumenter the environment from naturalweathering of minerals due toforest fires and volcanic emissions,but most is released in mining andsmelting operations, fuelcombustion, disposal of metal-containing products, andapplication of phosphate fertilizersor sewage sludge to field crops (2).Human exposure to cadmium canresult from food, drinking water, orincidental ingestion of soil or dustcontaminated with cadmium; frominhalation of cadmium-containingparticles from ambient air; frominhalation of cigarette smoke,which contains cadmium taken upby tobacco; or from working in anoccupation involving exposure tocadmium fumes and dust (2). Fornon-smokers, ingestion of food isthe largest source of cadmiumexposure (2). Levels of cadmium insoil may be increasing in the futureas a result of the application ofmunicipal sludge or phosphatefertilizers, which then accumulatesin plants and animals that humansconsume. Dietary exposuremay increase further as acidprecipitation lowers the soil pH.Grain and cereal products usuallycontribute the greatest percentageof dietary cadmium; potatoes, leafy

136
advantages of permanent modifiersin ETAAS (3-14) (longer tubelifetime, better detection limits,higher sample throughput, simplerheating programs, and loweranalytical cost) were taken intoaccount when optimizing theconditions for the determination ofcadmium in environmental samples.
EXPERIMENTAL
Instrumentation
A Model AAS5EA (Zeiss, Jena,Germany) atomic absorptionspectrometer, equipped with adeuterium lamp backgroundcorrection system, a transverselyheated graphite tube atomizer(TGA), and an MPE 5 autosamplerfrom the same manufacturer,were used.
The TGA tubes (IC graphitetubes, Part No. 07-8102525) withpin platforms were used with andwithout thermal treatment forpermanent modifier deposition,using the procedure reportedpreviously by Lima et al. (3).Permanent modifiers were usedthroughout.
Cadmium measurements weremade at the analytical wavelengthof 228.8 nm (slit 0.7 nm). Cadmiumhollow cathode lamps (Imaging &Sensing Technology, Horseheads,N.Y., USA) were utilized followingthe manufacturer’s instrumentrecommendations.
The heating program employedfor the cadmium determination inthe environmental samples, usingpermanent modifiers, is given inTable I. All measurements weremade with at least three replicatesand are based on integratedabsorbance. Argon (White Martins,Esteio-RS, Brazil) was used as theprotective gas throughout.
Materials, Reagents, and Solutions
High-purity deionized water(resistivity 18.2 MΩ cm), obtained
with a Milli-Q™ water purificationsystem (Millipore, Bedford, MA,USA), was used throughout.Analytical reagent-grade HNO3 andHCl (Merck, Rio de Janeiro, Brazil)were distilled in quartz sub-boilingstills (Kürner, Rosenheim,Germany). Hydrofluoric acid(Merck, Rio de Janeiro, Brazil) wasdistilled in Teflon® sub-boiling stills(Kürner, Rosenheim, Germany).
All solutions were stored inhigh-density polypropylene bottles.Plastic bottles, autosampler cups,and glassware were cleaned bysoaking in 20% (v/v) HNO3 for 24 h,rinsing five times with Milli-Qwater, then drying and storing in aflow hood.
The following 1.00 g L-1
solutions, utilized to makepermanent modifiers, wereprepared from Na2WO4. 2H2O(Merck, Darmstadt, Germany),(NH4)3RhCl6 • 1-1/2H2O, RuCl3 •3H2O, and H2IrCl6 • 6H2O (FlukaChemie GmbH, Sigma-Aldrich, SãoPaulo, Brazil).
Stock solution of Cd (1.00 g L-1)was obtained from spectrographicallypure CdO (Johnson & Matthey,Royston, U.K). Analytical calibrationstandards were prepared over therange of 0.20 to 1.25 µg L-1 and 0.75to 5.0 µg L-1 Cd by suitable serialdilution of the stock solution in1.0% (v/v) HNO3.
Reference Materials
The following referencematerials were used for testing theaccuracy of the proposed method:
Fly Ash (BCR-CRM 038), GasCoal (BCR-CRM 180), Coking Coal(BCR- CRM 181), and CalcareousLoam Soil (BCR-CRM 141R) fromthe Institute for Reference Materialsand Measurements (Geel, Belgium).
Bituminous Coal (NIST-SRM1632b), Coal Fly Ash (NIST-SRM1633b), Trace Elements in Coal(NIST-SRM 1632c), EstuarineSediment (NIST-SRM-1646a), and
Montana I Soil (NIST-SRM 2710),from the National Institute ofStandards and Technology(Gaithersburg, MD, USA).
Coal Fly Ash (GBW 08401), RiverSediment (GBW 08301), and StreamSediment (GBW 07311) from theNational Research Centre forCertified Reference Materials(Beijing, China).
Sewage Sludge Amended Soil(RTC-CRM 005-050), Dry Soil No.2(RTC-CRM 020-050), and Dry SoilNo. 5 plus Cyanide (RTC-CRM 022-030) from the Resource TechnologyCorporation (Laramie, WY, USA).
Great Lakes Sediment(NWRI-TH-2) from the NationalWater Research Institute(Burlington, Canada).
Microwave-assisted Acid Digestion
Microwave-assisted wetdecomposition of coal, fly ash, soil,and sediments was performed infive replicates using a MilestoneETHOS PLUS microwave ovenfollowing the procedures outlinedbelow:
(a) Coal and fly ash: 0.2-g samplewas accurately weighed into a TFMdigestion vessel and 2 mL HNO3, 6mL HCl, and 8 mL HF were added tothe vessel, gently stirring the acidmixture. The bomb was closed andintroduced into the rotor segment(MPR-300/12S), then tightenedusing a torque wrench. The rotorwas then placed inside the microwavecavity and subsequently connected tothe temperature sensor.
A three-step microwave programwas carried out:
1st step: Ramp heating fromroom temperature to 180°C for 5minutes (up to 1000 W).
2nd step: Holding at 180°C for 20minutes (up to 1000 W).
3rd step: Turning off themicrowave and waiting for 5 minutes.
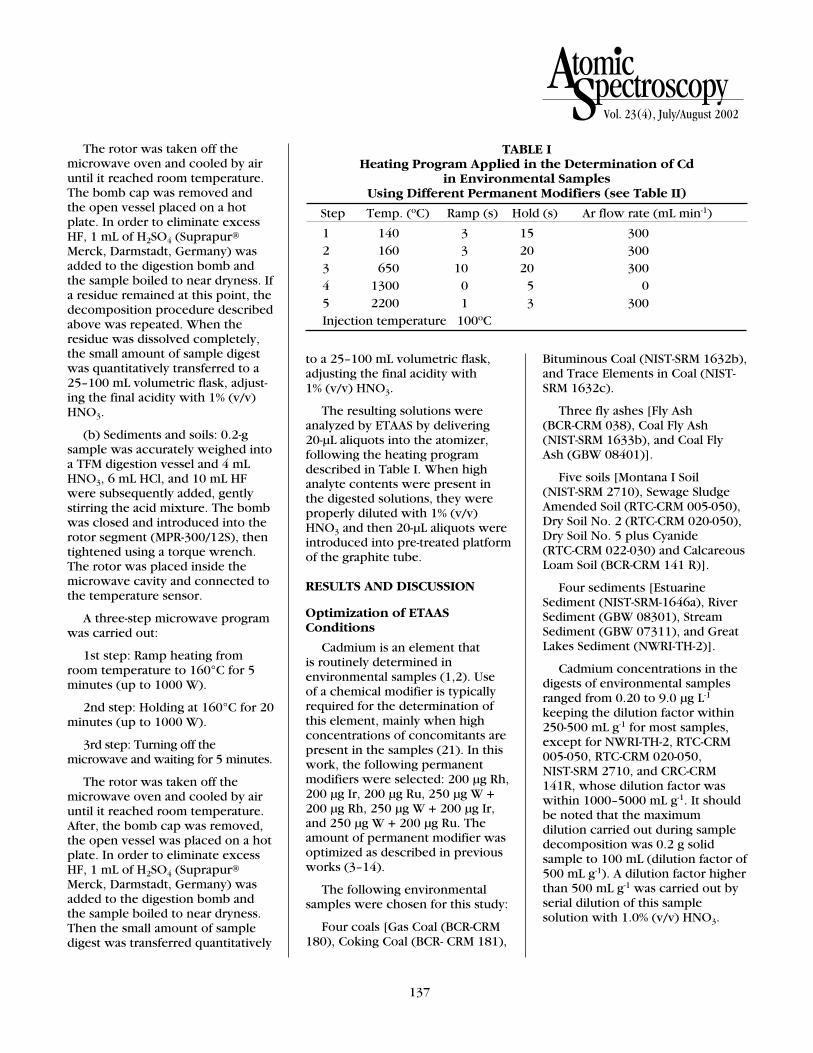
137
Vol. 23(4), July/August 2002
The rotor was taken off themicrowave oven and cooled by airuntil it reached room temperature.The bomb cap was removed andthe open vessel placed on a hotplate. In order to eliminate excessHF, 1 mL of H2SO4 (Suprapur®
Merck, Darmstadt, Germany) wasadded to the digestion bomb andthe sample boiled to near dryness. Ifa residue remained at this point, thedecomposition procedure describedabove was repeated. When theresidue was dissolved completely,the small amount of sample digestwas quantitatively transferred to a25–100 mL volumetric flask, adjust-ing the final acidity with 1% (v/v)HNO3.
(b) Sediments and soils: 0.2-gsample was accurately weighed intoa TFM digestion vessel and 4 mLHNO3, 6 mL HCl, and 10 mL HFwere subsequently added, gentlystirring the acid mixture. The bombwas closed and introduced into therotor segment (MPR-300/12S), thentightened using a torque wrench.The rotor was placed inside themicrowave cavity and connected tothe temperature sensor.
A three-step microwave programwas carried out:
1st step: Ramp heating fromroom temperature to 160°C for 5minutes (up to 1000 W).
2nd step: Holding at 160°C for 20minutes (up to 1000 W).
3rd step: Turning off themicrowave and waiting for 5 minutes.
The rotor was taken off themicrowave oven and cooled by airuntil it reached room temperature.After, the bomb cap was removed,the open vessel was placed on a hotplate. In order to eliminate excessHF, 1 mL of H2SO4 (Suprapur®
Merck, Darmstadt, Germany) wasadded to the digestion bomb andthe sample boiled to near dryness.Then the small amount of sampledigest was transferred quantitatively
to a 25–100 mL volumetric flask,adjusting the final acidity with1% (v/v) HNO3.
The resulting solutions wereanalyzed by ETAAS by delivering20-µL aliquots into the atomizer,following the heating programdescribed in Table I. When highanalyte contents were present inthe digested solutions, they wereproperly diluted with 1% (v/v)HNO3 and then 20-µL aliquots wereintroduced into pre-treated platformof the graphite tube.
RESULTS AND DISCUSSION
Optimization of ETAAS Conditions
Cadmium is an element thatis routinely determined inenvironmental samples (1,2). Useof a chemical modifier is typicallyrequired for the determination ofthis element, mainly when highconcentrations of concomitants arepresent in the samples (21). In thiswork, the following permanentmodifiers were selected: 200 µg Rh,200 µg Ir, 200 µg Ru, 250 µg W +200 µg Rh, 250 µg W + 200 µg Ir,and 250 µg W + 200 µg Ru. Theamount of permanent modifier wasoptimized as described in previousworks (3–14).
The following environmentalsamples were chosen for this study:
Four coals [Gas Coal (BCR-CRM180), Coking Coal (BCR- CRM 181),
Bituminous Coal (NIST-SRM 1632b),and Trace Elements in Coal (NIST-SRM 1632c).
Three fly ashes [Fly Ash(BCR-CRM 038), Coal Fly Ash(NIST-SRM 1633b), and Coal FlyAsh (GBW 08401)].
Five soils [Montana I Soil(NIST-SRM 2710), Sewage SludgeAmended Soil (RTC-CRM 005-050),Dry Soil No. 2 (RTC-CRM 020-050),Dry Soil No. 5 plus Cyanide(RTC-CRM 022-030) and CalcareousLoam Soil (BCR-CRM 141 R)].
Four sediments [EstuarineSediment (NIST-SRM-1646a), RiverSediment (GBW 08301), StreamSediment (GBW 07311), and GreatLakes Sediment (NWRI-TH-2)].
Cadmium concentrations in thedigests of environmental samplesranged from 0.20 to 9.0 µg L-1
keeping the dilution factor within250-500 mL g-1 for most samples,except for NWRI-TH-2, RTC-CRM005-050, RTC-CRM 020-050,NIST-SRM 2710, and CRC-CRM141R, whose dilution factor waswithin 1000–5000 mL g-1. It shouldbe noted that the maximumdilution carried out during sampledecomposition was 0.2 g solidsample to 100 mL (dilution factor of500 mL g-1). A dilution factor higherthan 500 mL g-1 was carried out byserial dilution of this samplesolution with 1.0% (v/v) HNO3.
TABLE I Heating Program Applied in the Determination of Cd
in Environmental Samples Using Different Permanent Modifiers (see Table II)
Step Temp. (oC) Ramp (s) Hold (s) Ar flow rate (mL min-1)
1 140 3 15 3002 160 3 20 3003 650 10 20 3004 1300 0 5 05 2200 1 3 300Injection temperature 100oC

138
The electrothermal behavior ofCd in digests of Coal Fly Ash(NIST-SRM 1633b, dilution factor500 mL g-1, 31.36 ± 3 pg Cd perinjection) with different permanentmodifiers, such as 200 µg Rh, 200µg Ir, 200 µg Ru, 250 µg W + 200µg Rh, 250 µg W + 200 µg Ir, and250 µg W + 200 µg Ru, arecompared in Figure 1. As can beseen, the cadmium maximumpyrolysis temperature obtainedwith all permanent modifiers wasthe same. However, the sensitivityattained with mixed tungsten plusnoble metal modifier was alwayshigher than with a single modifier.Based on these results it is expectedthat tungsten plus a noble metalmodifier would be more efficientfor analyte stabilization in digests ofreal samples in comparison to usingsingle noble metal modifiers.
Analytical Characteristics
The cadmium characteristicmass, obtained employing differentpermanent modifiers and based onintegrated absorbance, was 1.0 pgfor Rh, Ir, and Ru permanentmodifiers; and 0.9 pg for W-Rh,W-Ir, and W-Ru permanentmodifiers. The cadmium detectionlimits, calculated from 20consecutive measurements of theblank solutions according to IUPAC(22), were 9 ng g-1 for Rh, 8 ng g-1
for Ir, 9 ng g-1 for Ru, 8 ng g-1 forRh, 9 ng g-1 for Ir, and 8 ng g-1 forRu. Better characteristic masseswere obtained for the mixedtungsten plus noble metal modifiervs. using a single modifier. Based onthese results, it can be inferred thattungsten present in the mixedpermanent modifiers helps tostabilize the analyte on thepretreated platform, allowinghigher sensitivity associated withhigher pyrolysis temperature.
The use of permanent modifiersin ETAAS prolongs tube lifetimefor digests as well as slurries ofbiological and environmentalsamples (3–14). Tube lifetime and
%RSD (n=tube lifetime) for Cdobtained in digests of Coal Fly Ash(NIST- SRM 1633b, dilution factor500 mL g-1, 31.36 ± 3 pg Cd perinjection) with different modifiersare shown in Figure 2. Thepermanent modifier treatmentswere repeated after each 350firings using the recommendationsof a previous report (3). As can beseen, about 20% longer tubelifetimes were obtained whentungsten plus noble metal modifierwas used as compared to a singlenoble metal permanent modifier.In addition, the %RSD for the tubelifetime with tungsten plus noblemetal was always lower than with asingle noble metal modifier. Thisshows that tungsten plays a definiterole in increasing tube lifetime andreproducibility, but a soundinvestigation should be carried outto prove this effect.
Analysis of Samples
An extensive study was carriedout using different permanentmodifiers for the determinationof cadmium in digests ofenvironmental reference materials(Table II). The results are presentedas an average ± confidence interval(at 95% confidence level, “t”student = 2.776). The analyterecoveries in the different samplesemploying different permanentmodifiers are listed in Table II. Ascan be seen, best analyte recoveries(95–105%) for the environmentalreference materials were obtainedusing W-Rh, W-Ir, and W-Rupermanent modifiers (Table II).The Rh, Ir, and Ru single modifiersdid not provide good recoveries(<90%) for the digests ofenvironmental reference materials.The solid reference materials,whose cadmium contents arewithin the confidence intervalwhen single modifiers areemployed, are samples that resultin a very large confidence interval(higher than 20%). For all othercases, the analyte contents are out
of the limit of reference materials.It can be inferred that tungstenplus a noble metal modifier canbe successfully utilized for thedetermination of cadmium indigests of environmental referencematerials. The single permanentmodifiers (Rh, Ir, and Ru) couldprobably be employed for simplermatrices such as natural waters.
CONCLUSION
Better analytical characteristicssuch as higher maximum pyrolysistemperature, lower characteristicmasses, lower detection limits,longer tube lifetime, better signalreproducibility, and better analyterecoveries in environmentalreference materials were obtainedwhen W-Rh, W-Ir, and W-Rupermanent modifiers were used incomparison to the single Rh, Ru,and Ir permanent modifiers.
Received July 5, 2002.
ACKNOWLEDGMENTS
The authors are grateful to Fun-dação de Amparo à Pesquisa doEstado do Rio Grande do Sul(FAPERGS), Fundo Nacional deDesenvolvimento Científico e Tec-nológico referred to the PlanoNacional de Ciência e Tecnologiado Setor de Petróleo e Gás Natural(FNDCT/CTPETRO), and ConselhoNacional de Desenvolvimento Cien-tífico e Tecnológico (CNPq) forfinancial support and fellowships.

139
Vol. 23(4), July/August 2002
Fig. 1. Cd pyrolysis curves in digests of Coal Fly Ash (NIST-SRM 1632c) with different permanent modifiers.
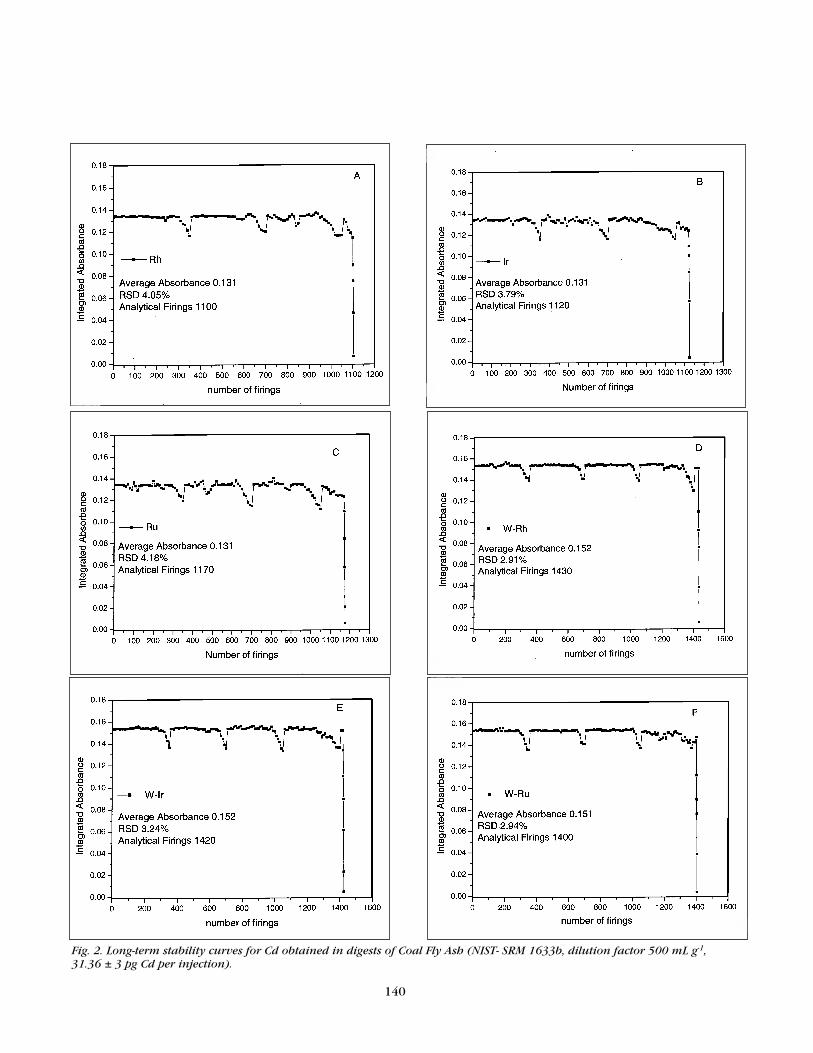
140
Fig. 2. Long-term stability curves for Cd obtained in digests of Coal Fly Ash (NIST- SRM 1633b, dilution factor 500 mL g-1, 31.36 ± 3 pg Cd per injection).

141
Vol. 23(4), July/August 2002
TABLE II Concentrations (µg g-1) and Recoveries of Cd (n=5) in Environmental Reference Materials
Using Different Permanent ModifiersHeating programs of Table I were employed throughout.
Confidence interval at 95% confidence level (“t”student = 2.776).BCR CRM 180
Certified Rh Ir Ru W-Rh W-Ir W-Ru
Cd 0.212 ± 0.011 0.170 ± 0.008 0.189 ± 0.009 0.176 ± 0.008 0.213 ± 0.005 0.210 ± 0.006 0.209 ± 0.007
Recovery/% 80.2 89.2 83.0 100.5 99.5 99.1
BCR CRM 181
Certified Rh Ir Ru W-Rh W-Ir W-Ru
Cd 0.051 ± 0.003 0.042 ± 0.002 0.043 ± 0.001 0.045 ± 0.002 0.052 ±0.001 0.050 ± 0.001 0.052 ±0.002
Recovery/% 82.4 84.3 88.2 102.0 98.0 102.0
NIST SRM 1632b
Certified Rh Ir Ru W-Rh W-Ir W-Ru
Cd 0.0573± 0.003 0.0453 ± 0.001 0.0504 ± 0.001 0.0496 ±0.002 0.0572 ±0.001 0.0570 ±0.001 0.0574 ±0.002
Recovery/% 79.1 88.0 86.6 99.8 99.5 100.2
NIST SRM 1632 c
Certified Rh Ir Ru W-Rh W-Ir W-Ru
Cd 0.072 ± 0.007 0.064 ± 0.001 0.063 ± 0.002 0.062 ± 0.001 0.070 ±0.002 0.073 ±0.001 0.074 ± 0.002
Recovery/% 88.9 87.5 86.1 97.2 101.4 102.8
BCR CRM 038
Certified Rh Ir Ru W-Rh W-Ir W-Ru
Cd 4.60 ± 0.28 4.05 ± 0.08 3.74 ± 0.12 3.79 ± 0.14 4.62 ± 0.10 4.65 ± 0.10 4.61 ± 0.09
Recovery/% 88.0 81.3 82.4 100.4 101.1 100.2
GBW 08401
Certified Rh Ir Ru W-Rh W-Ir W-Ru
Cd 0.16 ± 0.04 0.13 ± 0.01 0.14 ± 0.01 0.13 ± 0.01 0.15 ± 0.01 0.16 ± 0.01 0.15 ± 0.01
Recovery/% 81.3 87.5 81.3 93.8 100.0 93.8
NIST SRM 1633b
Certified Rh Ir Ru W-Rh W-Ir W-Ru
Cd 0.784 ± 0.008 0.668 ± 0.004 0.685 ± 0.002 0.690 ± 0.004 0.790 ± 0.005 0.780 ± 0.004 0.781 ± 0.004
Recovery/% 85.2 87.4 88.0 100.8 99.5 99.6
NWRI-TH-2
Certified Rh Ir Ru W-Rh W-Ir W-Ru
Cd 5.22 ± 0.47 4.16 ± 0.10 4.20 ± 0.12 4.19 ± 0.13 5.23 ± 0.11 5.19 ± 0.10 5.31 ± 0.14
Recovery/% 79.7 80.5 80.3 100.2 99.4 101.7
GBW 07311
Certified Rh Ir Ru W-Rh W-Ir W-Ru
Cd 2.30 ± 0.41 1.98 ± 0.28 2.03 ± 0.22 2.01 ± 0.25 2.32 ± 0.18 2.28 ± 0.21 2.29 ± 0.20
Recovery/% 86.1 88.3 87.4 100.9 99.1 99.6
GBW 08301
Certified Rh Ir Ru W-Rh W-Ir W-Ru
Cd 2.45 ± 0.32 2.15 ± 0.17 2.15 ± 0.16 2.05 ± 0.21 2.36 ± 0.20 2.41 ± 0.18 2.49 ± 0.21
Recovery/% 87.8 87.8 83.7 96.3 98.4 101.6
(continued on next page)

142
TABLE II (continued)Concentrations (µg g-1) and Recoveries of Cd (n=5) in Environmental Reference Materials
Using Different Permanent ModifiersHeating programs of Table I were employed throughout.
Confidence interval at 95% confidence level (“t”student = 2.776).NIST SRM 1646a
Certified Rh Ir Ru W-Rh W-Ir W-Ru
Cd 0.148 ± 0.007 0.128 ± 0.001 0.129 ± 0.001 0.130 ± 0.002 0.152 ± 0.001 0.148 ± 0.001 0.144 ± 0.001
Recovery/% 86.5 87.2 87.8 102.7 100.0 97.3
RTC CRM 005-50
Certified Rh Ir Ru W-Rh W-Ir W-Ru
Cd 13.7 ± 0.7 12.0 ± 0.3 12.1 ± 0.4 12.2 ± 0.4 13.6 ± 0.3 13.8 ± 0.3 14.1 ± 0.4
Recovery/% 87.6 88.3 89.1 99.3 100.7 102.9
RTC CRM 022-030
Certified Rh Ir Ru W-Rh W-Ir W-Ru
Cd 3.1 ± 0.2 2.64 ± 0.06 2.62 ± 0.05 2.66 ± 0.04 3.14 ± 0.05 3.05 ± 0.06 3.10 ± 0.06
Recovery/% 85.2 84.5 85.8 101.3 98.4 100.0
NIST SRM 2710
Certified Rh Ir Ru W-Rh W-Ir W-Ru
Cd 21.8 ± 0.2 18.1 ± 0.1 18.6 ± 0.1 19.0 ± 0.1 21.7 ± 0.1 21.6 ± 0.1 21.9 ± 0.1
Recovery/% 83.0 85.3 87.2 99.5 99.1 100.5
BCR CRM 141 R
Certified Rh Ir Ru W-Rh W-Ir W-Ru
Cd 14.6 ± 0.4 12.55 ± 0.10 12.60 ± 0.11 12.48 ± 0.12 14.52 ± 0.09 14.53 ± 0.08 14.43 ± 0.09
Recovery/% 86.0 86.3 85.5 99.5 99.5 98.8
RTC CRM 020-050
Certified Rh Ir Ru W-Rh W-Ir W-Ru
Cd 15.4 ± 0.5 13.1 ± 0.1 12.9 ± 0.1 13.0 ± 0.1 15.6 ± 0.1 15.7 ± 0.1 15.3 ± 0.1
Recovery/% 85.1 83.8 84.4 101.3 101.9 99.4
REFERENCES
1. Public Health Statement for Cadmium,http://www.atsdr.cdc.gov/toxprofiles/phs5.html, website visited on May, 5, 2002.
2. Toxicological profile for cadmium, U.S.Department of Health and Human Services,Public Health Service, Agency for ToxicSubstances and Disease Registry, Atlanta(1999).
3. E.C. Lima, F.J. Krug, and K.W. Jackson,Spectrochim. Acta Part B 53, 1791 (1998).
4. E.C. Lima, F.J. Krug, A.T. Ferreira, and F.Barbosa, Jr., J. Anal. At. Spectrom. 14, 269(1999).
5. E.C. Lima, F. Barbosa, Jr., F.J. Krug, and U.Guaita, J. Anal. At. Spectrom. 14, 1601(1999).
6. E.C. Lima, F. Barbosa Jr., and F.J. Krug, J.Anal. At. Spectrom. 14, 1913 (1999).
7. E.C. Lima, F. Barbosa, Jr., and F.J. Krug,Anal. Chim. Acta 409, 267 (2000).
8. E.C. Lima, F.J. Krug, F. Barbosa, Jr., andC.E.C. Magalhães, Mikrochim. Acta 134,113 (2000).
9. E.C. Lima, F. Barbosa, Jr., F.J. Krug, M.M.Silva, and M.G.R Vale, J. Anal. At. Spectrom.15, 995 (2000).
10. F. Barbosa Jr., E.C. Lima, and F.J. Krug,Analyst 125, 2079 (2000).
11. E.C. Lima, F. Barbosa, Jr., and F. J. Krug,Fresenius’ J. Anal. Chem. 369, 496 (2001).
12. F. Barbosa Jr., E.C. Lima, R.A. Zanão, andF.J. Krug, J. Anal. At. Spectrom, 16, 842(2001).
13. E.C. Lima, F. Barbosa, Jr., F. J. Krug, andM.B. Vieira, At. Spectrosc. 22, 414 (2001).
14. E.C. Lima, F. Barbosa, Jr., F. J. Krug, andA. Tavares, Talanta 57, 177 (2002).
15. J.B.B da Silva, M.B. O. Giacomelli, I.G. deSouza, and A. J. Curtius, Microchem. J. 60,249 (1998).
16. J.B.B. da Silva, M.A. M. da Silva, A.J. Cur-tius, and B. Welz, J. Anal. At. Spectrom. 14,1737 (1999).
17. R. Q. Aucelio, A.J. Curtius, and B. Welz,J. Anal. At. Spectrom. 15, 1389 (2000).
18. N. N. Meeravali and S.J. Kumar, J. Anal.At. Spectrom. 16, 527 (2001).
19. P.Grinberg and R.C. Campos,Spectrochim. Acta Part B 56, 1831 (2001).
20. R.Q. Aucelio and A.J. Curtius, J. Anal. At.Spectrom. 17, 242 (2002).
21. Database of Natural Matrix ReferenceMaterials,http://www.iaea.org/programmes/nahunet/e4/nmrm/browse.htm, website visited onJune, 26, 2002.
22. Commission on Spectrochemical andOther Optical Procedures for Analysis.Nomenclature, Symbols, Units and TheirUsage in Spectrochemical Analysis - II. DataInterpretation, Spectrochim. Acta Part B,33, 241 (1978).

U.S. 800-762-4000 (+1) 203-925-4600
www.perkinelmer.com/instruments
Justtouch
and go.
There, that’s all the training you need.Walk up to the AAnalyst 200 and let the touch screen guide you through everythingfrom setup to analysis. It practically tells you what to do—and in your ownlanguage. All instrument controls are right there on the screen, available at yourfingertips. Even troubleshooting and repairs are easier, with quick-change partsyou simply snap out and snap in. No service visit, no down time. As rugged andreliable as ever, our newest AAnalyst is a better way to do AA. Experience it foryourself. Talk to a PerkinElmer inorganic analysis specialist today.
© 2002 PerkinElmer, Inc.
Atomic Absorption

Printed in the United States and published six times a year by:
PerkinElmer Instruments710 Bridgeport AvenueShelton, CT 06484-4794 USAwww.perkinelmer.com
Editor
Anneliese LustE-mail: [email protected]
Technical Editors
Glen R. Carnrick, AASusan A. McIntosh, ICPKenneth R. Neubauer, ICP-MS
SUBSCRIPTION INFORMATIONAtomic SpectroscopyP.O. Box 3674Barrington, IL 60011 USAFax: +1 (847) 304-6865
2002 Subscription Rates• U.S. $60.00 includes third-class
mail delivery worldwide; $20.00 extra for electronic file.
• U.S. $80.00 includes airmail delivery; $20 extra for electronic file.
• U.S. $60.00 for electronic file only.• Payment by check (drawn on U.S.
bank in U.S. funds) made out to: “Atomic Spectroscopy”
On-line Access• For electronic file, send request
via e-mail to:[email protected]
Back Issues/Claims• Single back issues are available
at $15.00 each.• Subscriber claims for missing
back issues will be honoredat no charge within 90 daysof issue mailing date.
Address Changes to:Atomic SpectroscopyP.O. Box 3674Barrington, IL 60011 USA
Copyright © 2002PerkinElmer, Inc.All rights reserved.www.perkinelmer.com
MicrofilmAtomic Spectroscopy issues are available from:University Microfilms International300 N. Zeeb RoadAnn Arbor, MI 48106 USATel: (800) 521-0600 (within the U.S.)+1 (313) 761-4700 (internationally)
Guidelines for Authors
PerkinElmer is a trademark of PerkinElmer, Inc.Optima and GemTip are trademarks of PerkinElmer Instruments LLC.Milli-Q is a trademark of Millipore Corporation.Ryton is a registered trademark of Phillips Petroleum Company.Suprapur is a registered trademark of Merck & Co.Minipuls is a trademark of Gilson.Teflon is a registered trademark of E.I. duPont deNemours & Co., Inc.Registered names and trademarks, etc. used in this publication even without specific indication thereof are not to be considered unprotected by law.
AtomicSpectroscopy
Atomic Spectroscopy serves as a medium for the disseminationof general information togetherwith new applications and analytical data in atomicabsorption spectrometry.
The pages of Atomic Spectroscopy are open to allworkers in the field of atomicspectroscopy. There is no chargefor publication of a manuscript.
The journal has around 3000subscribers on a worldwidebasis, and its success can beattributed to the excellentcontributions of its authors aswell as the technical guidanceof its reviewers and theTechnical Editors.
The original of the manuscriptshould be submitted to theeditor by mail plus electronic fileon disk or e-mail in the followingmanner:1. Mail original of text, double-
spaced, plus graphics inblack/white.
2. Provide text and tables in .docfile and figures in .doc or .tiffiles.
3. Number the references in theorder they are cited in the text.
4. Include bibliography.5. Submit original drawings
or glossy photographs and figure captions.
6. Consult a current copy ofAtomic Spectroscopy for format.
7. E-mail text and tables in.doc file and graphics in .docor .tif files to the editor:[email protected] [email protected] manuscripts are sent to two
reviewers. If there is disagreement,a third reviewer is consulted.
Minor changes in style are madein-house and submitted to theauthor for approval.
A copyright transfer form issent to the author for signature.
If a revision of the manuscriptis required before publication canbe considered, the paper isreturned to the author(s) withthe reviewers’ comments.
In the interest of speed ofpublication, a typeset copy isfaxed to the correspondingauthor for final approval.
Before publication, a pdf file ofthe typeset copy will be e-mailedto the corresponding author forfinal approval.
Additional reprints can bepurchased, but the requestmust be made at the time themanuscript is approved forpublication.
Anneliese LustEditor, Atomic SpectroscopyPerkinElmer Instruments710 Bridgeport AvenueShelton, CT 06484-4794 USA
Vol. 23(4), July/August 2002

For subscription information or back issues, write or fax:
Atomic SpectroscopyP.O. Box 3674
Barrington, IL 60011 USAFax: (+1) 847-304-6865
To submit articles for publication, write or fax:
Editor, Atomic SpectroscopyPerkinElmer Instruments, MS 219
710 Bridgeport AvenueShelton, CT 06484-4794 USA
D-6692