toll bridge seismic retrofit and regional measure 1 ... · the contractor has reported that...
TRANSCRIPT

First Quarter 2009 Project Progress and Financial Update
3
Toll Bridge Seismic Retrofit and Toll Bridge Seismic Retrofit and Toll Bridge Seismic Retrofit and Regional Measure 1 ProgramsRegional Measure 1 ProgramsRegional Measure 1 Programs First Quarter 2009 First Quarter 2009 First Quarter 2009 Project Progress and Financial UpdateProject Progress and Financial UpdateProject Progress and Financial Update
Released: May 2009


TOLL BRIDGE SEISMIC RETROFIT AND REGIONAL MEASURE 1 PROGRAMS
First Quarter 2009 Project Progress
and Financial Update


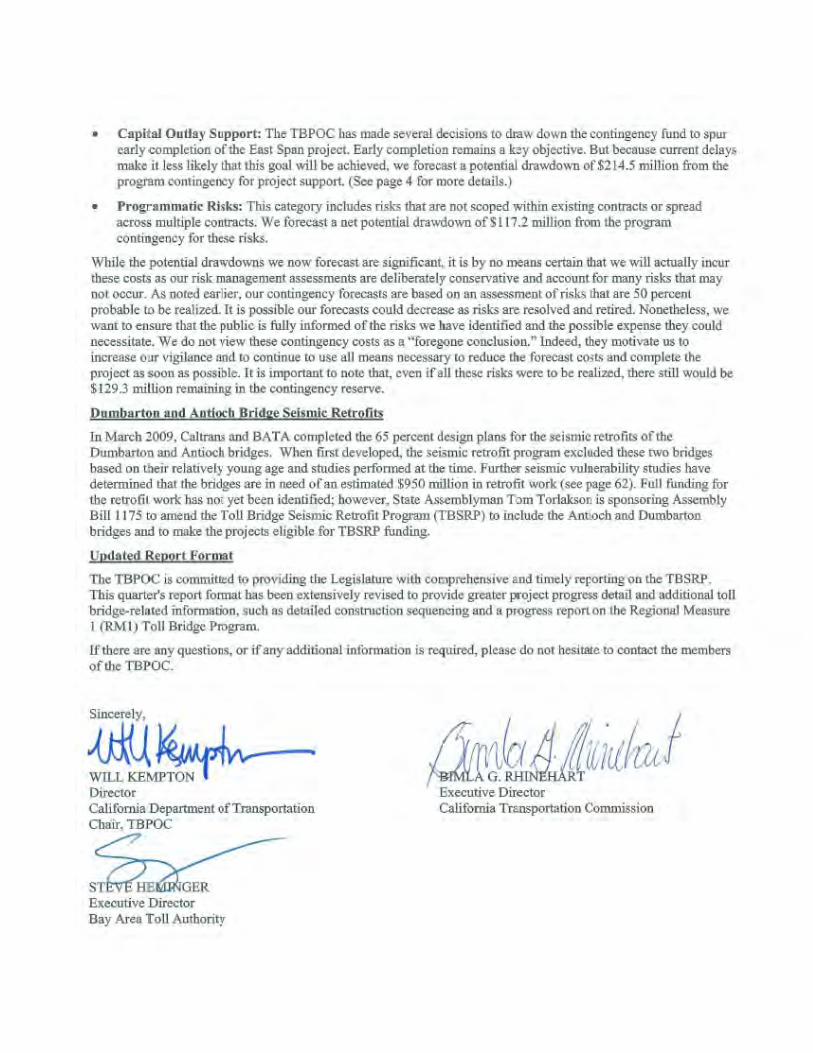


Table of Contents
Introduction…………………………………………………………………….................................... ............................ 1
Summary of Major Project Highlights, Issues, and Actions .................................................................................. 2
Toll Bridge Seismic Retrofit Program Cost Summary………………………………………………………… ............. 6
Toll Bridge Seismic Retrofit Program Schedule Summary…………………………………………………… ............ 7
Regional Measure 1 Program Cost Summary…………………………………………………. .................................. 8
Regional Measure 1 Program Schedule Summary…………………………………………………… ........................ 9
Toll Bridge Seismic Retrofit Program .................................................................................................................. 12
San Francisco-Oakland Bay Bridge Seismic Retrofit Strategy ............................................................................. 12
San Francisco-Oakland Bay Bridge East Span Replacement Project Summary ................................................. 15
Yerba Buena Island Detour (YBID) ................................................................................................................... 16
YBID East Tie-in Opening Activities ..................................................................................................... 18
Yerba Buena Island Transition Structures (YBITS) ........................................................................................... 20
Self-Anchored Suspension (SAS) Bridge ....................................................................................................... 22
SAS Construction Sequence ............................................................................................................... 24
SAS Superstructure Fabrication Activities ........................................................................................... 26
SAS Superstructure Field Activities ..................................................................................................... 29
Skyway……………………………………………………………………… ............................................................. 32
Oakland Touchdown (OTD) ............................................................................................................................... 34
Other Contracts .................................................................................................................................................. 36
Quarterly Environmental Compliance Highlights ............................................................................................... 38
San Francisco-Oakland Bay Bridge West Approach Replacement Project ......................................................... 39
Other Completed Projects ..................................................................................................................................... 40
Risk Management ................................................................................................................................................. 42
TBSRP Program Funding Status .......................................................................................................................... 48
Financing Program ................................................................................................................................................ 47
Program Funding Status ....................................................................................................................................... 49
CTC TBSRP Contributions .................................................................................................................................... 49
Summary of TBPOC Expenses ............................................................................................................................ 49
Seismic Retrofit of Dumbarton and Antioch Bridges ......................................................................................... 52
Dumbarton Bridge Seismic Retrofit Project ......................................................................................................... 52
Antioch Bridge Seismic Retrofit Project ............................................................................................................... 54
Project Cost and Schedule Summaries ................................................................................................................ 56
Regional Measure 1 Toll Bridge Program ............................................................................................................ 60
New Benicia-Martinez Bridge Project ................................................................................................................... 60
Interstate 880/State Route 92 Interchange Reconstruction Project ..................................................................... 62
Other Completed Projects .................................................................................................................................... 64
Appendices ............................................................................................................................................................. 67

Toll Bridge Program Oversight Committee
Map of Bay Area Toll Bridges
*
* The Golden Gate Bridge is owned and operated by the Golden Gate Bridge, Highway, and Transportation District.

This report focuses on identifying critical project issues and monitoring project cost and schedule performance for the projects
as measured against approved budgets and schedule milestones. This report is intended to fulfill Caltrans' requirement to
provide monthly project progress reporting to the TBPOC under Section 30952.05 of the Streets and Highway Code.
In July 2005, Assembly Bill (AB) 144 (Hancock) created the Toll Bridge Program Oversight Committee (TBPOC) to implement a
project oversight and project control process for the Benicia-Martinez Bridge project and the State Toll Bridge Seismic Retrofit
Program projects. The TBPOC consists of the Caltrans Director, the Bay Area Toll Authority (BATA) Executive Director and the
Executive Director of the California Transportation Commission (CTC). The TBPOC’s project oversight and control processes
include, but are not limited to, reviewing bid specifications and documents, providing field staff to review ongoing costs,
reviewing and approving significant change orders and claims in excess of $1 million (as defined by the committee) and
preparing project reports.
AB 144 identified the Toll Bridge Seismic Retrofit Program and the new Benicia-Martinez Bridge Project as being under the
direct oversight of the TBPOC. The Toll Bridge Seismic Retrofit Program includes:
Regional Measure 1 Projects Open to Traffic Status
Interstate 880/State Route 92 Interchange Reconstruction Construction
1962 Benicia-Martinez Bridge Reconstruction Construction
New Benicia-Martinez Bridge Open
Richmond-San Rafael Bridge Deck Overlay Rehabilitation Open
Richmond-San Rafael Bridge Trestle, Fender & Deck Joint Rehabilitation Open
Westbound Carquinez Bridge Replacement Open
San Mateo-Hayward Bridge Widening Open
State Route 84 Bayfront Expressway Widening Open
Richmond Parkway Open
Toll Bridge Seismic Retrofit Projects Seismic Safety Status
San Francisco-Oakland Bay Bridge East Span Replacement Construction
San Francisco-Oakland Bay Bridge West Approach Replacement Complete
San Francisco-Oakland Bay Bridge West Span Seismic Retrofit Complete
San Mateo-Hayward Bridge Seismic Retrofit Complete
Richmond-San Rafael Bridge Seismic Retrofit Complete
1958 Carquinez Bridge Seismic Retrofit Complete
1962 Benicia-Martinez Bridge Seismic Retrofit Complete
San Diego-Coronado Bridge Seismic Retrofit Complete
Vincent Thomas Bridge Seismic Retrofit Complete
The new Benicia-Martinez Bridge is part of a larger program of toll-funded projects called the Regional Measure 1 (RM1) Toll
Bridge Program under the responsibility of BATA and Caltrans. While the rest of the projects in the RM1 program are not
directly under the responsibility of the TBPOC, BATA and Caltrans will continue to report on their progress as an informational
item. The RM1 program includes:
Introduction
1

Toll Bridge Program Oversight Committee
2
Toll Bridge Seismic Retrofit Program Risk Management A major element of Assembly Bill 144 of 2005, the law creating the TBPOC, was legislative direction to implement a more aggressive risk management program.
Such a program has been implemented in stages over time to ensure development of a robust and comprehensive approach to risk management. We have
reached a milestone with our risk management program with all elements now fully incorporated, resulting in one of the most detailed and comprehensive risk
management programs in the country today. From this point forward, we will adopt a “50 percent probability” standard when assessing and reporting risks, which
results in major cost forecast revisions for the Self-Anchored Suspension Span (SAS) Superstructure and Yerba Buena Island Detour (YBID) contracts and for
programmatic risks. Our forecasts are based on an assessment of risks that are 50 percent probable to be realized. It is possible our forecasts could decrease as
risks are resolved and retired. Nonetheless, we want to ensure that the public is fully informed of the risks we have identified and the possible expense they could
necessitate. It is important to note that, even if all these risks were to be realized, there still would be $129.3 million remaining in the contingency reserve.
The risk management program is described in more detail on pages 42 through 46 of this report. San Francisco-Oakland Bay Bridge (SFOBB) East Span Seismic Replacement Project SAS Superstructure Contract
The contractor for the Self-Anchored Suspension (SAS) Bridge, American Bridge/Fluor, continues work on both
the fabrication of major bridge components around the world and on the temporary support structures in the bay.
The contractor has reported that fabrication of the steel tower and roadway boxes has fallen behind schedule due to the shop preparation process and the complexity of the
fabrication. This delay is putting pressure on the westbound opening of the bridge in 2012, but has not yet affected the expected full opening date of the bridge in
2013. The TBPOC and the contractor continue to
SAS Roadway Boxes in Fabrication
Shear-Leg Crane Barge Arrived in San Francisco Bay on March 12, 2009
SUMMARY OF MAJOR PROJECT HIGHLIGHTS, ISSUES, AND ACTIONS

First Quarter 2009 Project Progress and Financial Update
3
negotiate a mitigation proposal. The cost for this agreement is included in the revised forecast for the
project. The TBPOC and contactor continue to evaluate all options to accelerate the project. Caltrans is also continuing their quality assurance process so that no part
of the new bridge will be shipped unless it is fit to be installed.
Out on the bay, the contractor continues to erect the temporary support structures that span from Yerba Buena
Island to the Skyway. These structures will support the SAS bridge before the cable system is installed. With the arrival of the shear-leg crane barge from China on March
12, 2009, the longer and heavier segments of the temporary support structures can be lifted into place.
To further mitigate future project risks, Caltrans has established risk management teams to evaluate future potential risks to completing the project on time and on
budget. In particular, teams are reviewing cable erection plans and mitigation schedules. Based on the last risk management assessment, there is a potential for a $227.4
million increase on the contract.
Yerba Buena Island Detour Contract
The Yerba Buena Island Detour contractor, CC Myers, continues to erect the detour structure that will divert traffic off the existing bridge to the detour structure that will tie
the existing bridge to the Yerba Buena Island tunnel. The traffic switch has been scheduled for Labor Day Weekend 2009 and will require a full closure of the Bay Bridge over
an extended holiday weekend. In addition to work on the detour structure, the contractor is making progress on a number of accelerated foundations for the future transition
structure from the SAS to the tunnel. Based on the last risk management assessment, there is
potential for a $84.5 million increase for the contract. Risks include the cost to potentially postpone Labor Day weekend 2009 operations due to unexpected high winds
and unexpected construction challenges during the demolition of the old structure. These risks are being addressed via collaborative on-site meetings between
Caltrans and the contractor to actively identify and resolve issues early and at the least cost.
Yerba Buena Island Detour Structure Under Construction
Temporary Support Structures for the SAS Bridge Erection

Toll Bridge Program Oversight Committee
4
SUMMARY OF MAJOR PROJECT HIGHLIGHTS, ISSUES, AND ACTIONS
TBSRP Capital Outlay Support Based on initial discussions with our contractors, early
completion of the East Span Project was believed to be highly possible and sufficient to mitigate potential identified support cost increases. The support cost increases are due
primarily to the need to re-advertise the SAS contract and by decisions made to increase our opportunities for early completion of the East Span project and potential for support
cost savings. These decisions include a 12-month schedule extension provided during bid time to attract the maximum number of bidders for the SAS contract and extension of the
YBI Detour contract to advance future foundation and column work of the transition structure and west end deck reconstruction. Since we now judge early completion and the
attendant cost savings to be less likely, we forecast a potential drawdown of $214.5 million from the program contingency for project support. Further increases in project
support costs would be expected if the project is delayed beyond the 2013 bridge opening date. TBSRP Programmatic Risks This category includes risks that are not yet scoped within
existing contracts and/or spread across multiple contracts. The interdependencies between all the contracts in the program result in the potential for delays on one contract to
impact the other contracts in the overall program of contracts. We forecast a net potential drawdown of $117.2 million from the program contingency for these risks. SFOBB West Approach Seismic Replacement Project Caltrans certified seismic safety on the San Francisco-Oakland Bay Bridge West Approach Seismic Replacement
Project in December 2008 - eight months ahead of schedule. On February 9, 2009, Caltrans reopened the Harrison Street westbound off-ramp from the Bay Bridge, which was closed
for over three years for construction. The contract was substantially completed in February 2009 with only final closeout and punchlist work remaining.
Recently Reopened Harrison Street Off-Ramp

First Quarter 2009 Project Progress and Financial Update
5
New Bicycle/Pedestrian Pathway on Benicia Martinez Bridge
New East Route 92 to North Interstate 880 Direct Connector Under Construction
Seismic Retrofit of the Dumbarton and Antioch Bridges When first conceived, the Toll Bridge Seismic Retrofit Program only identified seven of the nine state-owned toll bridges to be in need of seismic retrofit, excluding the
Dumbarton and Antioch bridges. Further seismic vulnerability studies were completed by Caltrans and BATA on those structures, which determined that both structures
were in need of retrofit based on current seismic standards. While final designs for the retrofit of the bridges are still being prepared, the total cost to retrofit both
structures is estimated to be $950 million. State Assemblyman Tom Torlakson is sponsoring Bill AB1175 to amend the Toll Bridge Seismic Retrofit Program to include
the Antioch and Dumbarton bridges and to make the projects eligible for TBSRP funding.
New Benicia-Martinez Bridge Project On the 1962 Benicia-Martinez Bridge Modification Contract,
work to modify the southbound I-680 bridge to add an additional traffic lane and bicycle/pedestrian lane is proceeding. Caltrans is forecasting the work to be
completed at least two months ahead of schedule in October 2009.
Interstate 880/State Route 92 Interchange Reconstruction Project On the Interchange Reconstruction Contract, the new east
Route 92 to North Interstate 880 direct connector structure (ENCONN) is nearing completion and is scheduled to open to detour traffic in mid-May.
Antioch Bridge

Toll Bridge Program Oversight Committee
6
Toll Bridge Seismic Retrofit Program Cost Summary
Within approved schedule and budget Identified potential project risks that could significantly impact approved schedules and budgets if not mitigated Known project impacts with forthcoming changes to approved schedules and budgets
Contract Status
AB 144/SB 66 Budget
(Jul 2005)
TBPOC Approved Changes
Current TBPOC
Approved Budget
(Mar 2009)
Cost to Date (Mar 2009)
Current Cost Forecast
(Mar 2009)
Cost Variance Cost Status
a b c = a + b d e f = e - c
SFOBB East Span Seismic Replacement
Capital Outlay Construction
Skyway Completed 1,293.0 (38.9) 1,254.1 1,236.8 1,254.1 -
SAS Marine Foundations Completed 313.5 (32.6) 280.9 275.0 280.9 -
SAS Superstructure Construction 1,753.7 - 1,753.7 677.6 1,981.1 227.4
YBI Detour Construction 132.0 310.2 442.2 300.7 526.7 84.5
YBI Transition Structures (YBITS) 299.3 (23.2) 276.1 - 278.0 1.9
YBITS 1 Advertised - 215.3
YBITS 2 Design - 59.4
YBITS Landscaping Design - 3.3
Oakland Touchdown 283.8 - 283.8 161.2 290.6 6.8
OTD 1 Construction 153.3 214.6
OTD 2 Design - 62.0
OTD Electrical Systems Design - 4.4
Submerged Electric Cable Completed 7.9 9.6
Existing Bridge Demolition Design 239.2 - 239.2 - 222.0 (17.2)
Stormwater Treatment Measures Completed 15.0 3.3 18.3 16.7 18.3 -
Other Completed Contracts Completed 90.3 - 90.3 89.2 90.3 -
Capital Outlay Support 959.3 - 959.3 703.9 1,173.8 214.5
Right-of-Way and Environmental Mitigation 72.4 - 72.4 51.1 72.4 -
Other Budgeted Capital 35.1 (3.3) 31.8 0.7 7.7 (24.1)
Total SFOBB East Span Replacement 5486.6 215.5 5,702.1 3,512.9 6,195.9 493.8
SFOBB West Approach Replacement
Capital Outlay Construction Completed 309.0 41.7 350.7 318.6 350.7 -
Capital Outlay Support 120.0 - 120.0 114.8 120.0 -
Total SFOBB West Approach Replacement 429.0 41.7 470.7 433.4 470.7 -
Completed Program Projects Completed 1,839.4 (97.5) 1,741.9 1,713.2 1,741.9 -
Miscellaneous Program Costs 30.0 - 30.0 24.7 30.0 -
Net Programmatic Risks - - - - 117.2 117.2
Program Contingency 900.0 (159.7) 740.3 - 129.3 (611.0)
Total Toll Bridge Seismic Retrofit Program 8,685.0 - 8,685.0 5,684.2 8,685.0 -

First Quarter 2009 Project Progress and Financial Update
7
Toll Bridge Seismic Retrofit Program Schedule Summary
Notes: 1) Figures may not sum up to totals due to rounding effects. 2) TBSRP Forecasts for the Monthly Reports are generally updated on a quarterly basis in conjunction with quarterly risk analysis assessments for the TBSRP Projects.
AB144/SB 66 Project
Completion Schedule Baseline (Jul 2005)
TBPOC Approved Changes (Months)
Current TBPOC Approved
Completion Schedule (Mar 2009)
Current Completion
Forecast (Mar 2009)
Schedule Variance (Months)
Schedule Status Remarks/Notes
g h i = g + h j k = j - i l
SFOBB East Span Seismic Replacement
Contract Completion
Skyway Apr 2007 8 Dec 2007 Dec 2007 - See Page 32
SAS Marine Foundations Jun 2008 (5) Jan 2008 Jan 2008 - See Page 22
SAS Superstructure Mar 2012 12 Mar 2013 Mar 2013 - See Page 23
YBI Detour Jul 2007 35 Jun 2010 Nov 2010 5 See Page 16
YBI Transition Structures (YBITS) Nov 2013 12 Nov 2014 Nov 2014 - See Page 20
YBITS 1 Sep 2013 Sep 2013 -
YBITS 2 Nov 2014 Nov 2014 -
YBITS Landscaping TBD TBD -
Oakland Touchdown Nov 2013 12 Nov 2014 Nov 2014 - See Page 34
OTD 1 May 2010 May 2010 -
OTD 2 Nov 2014 Nov 2014 -
OTD Electrical Systems TBD TBD -
Submerged Electric Cable Jan 2008 Jan 2008 -
Existing Bridge Demolition Sep 2014 12 Sep 2015 Sep 2015 -
Stormwater Treatment Measures Mar 2008 - Mar 2008 Mar 2008 -
OTD West bound Access Jan 2010 Jan 2010 -
YBI Detour Open Sep 2009 Sep 2009 - See page 18
West bound Open Sep 2011 12 Sep 2012 Dec 2012 3 See page 2
East bound Open Sep 2012 12 Sep 2013 Sep 2013 -
SFOBB West Approach Replacement
Contract Completion Aug 2009 (7) Jan 2009 Jan 2009 - See page 39
SFOBB East Span Bridge Opening and Other Milestones

Toll Bridge Program Oversight Committee
8
Regional Measure 1 Program Cost Summary
Contract Status
BATA Baseline Budget
(Jul 2005)
BATA Approved Changes
Current BATA Approved
Budget (Mar 2009)
Cost to Date (Mar 2009)
Current Cost Forecast
(Mar 2009)
Cost Variance Cost Status
a b c = a + b d e f = e - c
New Benicia-Martinez Bridge
Capital Outlay Construction Construction 861.6 173.5 1,035.1 983.6 1,035.1 -
Capital Outlay Support 157.1 35.2 192.3 186.8 192.3 -
Capital Outlay Right-of-Way 20.4 (0.1) 20.3 17.0 20.3 -
Project Reserve 20.8 4.0 24.8 - 24.8
Total New Benicia-Martinez Bridge 1,059.9 212.6 1,272.5 1,187.4 1,272.5
Interstate 880/Route 92 Interchange Reconstruction
Capital Outlay Construction Construction 94.8 60.2 155.0
58.0 155.0
-
Capital Outlay Support 28.8 26.2 55.0 46.1 55.0 -
Capital Outlay Right-of-Way 9.9 7.0 16.9 11.6 16.9 -
Project Reserve 0.3 17.8 18.1 - 18.1
Total I-880/SR-92 Interchange Reconstruction 133.8 111.2 245.0 115.7 245.0
Completed Program Projects 918.9 - 918.9 878.5 898.9 (20.0)
Total Regional Measure 1 Toll Bridge Program 2,112.6 323.8 2,436.4 2,181.6 2,416.4 (20.0)
Within approved schedule and budget Identified potential project risks that could significantly impact approved schedules and budgets if not mitigated Known project impacts with forthcoming changes to approved schedules and budgets

First Quarter 2009 Project Progress and Financial Update
9
Regional Measure 1 Program Schedule Summary
BATA Baseline Completion Schedule (Jul 2005)
BATA Approved Changes (Months)
Current BATA Approved
Completion Schedule (Mar 2009)
Current Completion
Forecast (Mar 2009)
Schedule Variance (Months)
Schedule Status Remarks/Notes
g h i = g + h j k = j - i l
New Benicia-Martinez Bridge
Contract Completion
1962 BM Bridge Reconstruction Dec 2009 - Dec 2009 Oct 2009 (2) See Page 58
New Benicia-Martinez Bridge Opening Date
New Bridge Dec 2007 (4) Aug 2007 Aug 2007 -
Contract Completion
Interchange Reconstruction Dec 2010 6 Jun 2011 Jun 2011 - See Page 60
Interstate 880/Route 92 Interchange Reconstruction
Notes: 1) Figures may not sum to totals due to rounding effects.


TO
LL
BR
IDG
E S
EIS
MIC
RE
TR
OF
IT P
RO
GR
AM

Toll Bridge Program Oversight Committee
West Approach West Span 12
TOLL BRIDGE SEISMIC RETROFIT PROGRAM
San Francisco-Oakland Bay Bridge Seismic Retrofit Strategy
West Approach Seismic Replacement Project Project Status: Completed 2008
Seismic safety retrofit work on the West Approach in San Francisco - bounded on the west by 5th Street and
on the east by the anchorage of the west span at Beale Street - involved completely removing and replacing this one-mile stretch of Interstate 80, as well as six on
and off-ramps within the confines of the West Approach’s original footprint.
When a 250-ton section of the upper deck of the East Span collapsed during the 7.1- magnitude Loma Prieta
earthquake in 1989, it was a wake-up call for the entire Bay Area. While the East Span quickly reopened within a month, critical questions lingered; how could the Bay
Bridge - a vital regional lifeline structure - be strengthened to withstand the next major earthquake? Seismic experts from around the world determined that to make each of the
separate elements seismically safe on a bridge of this size, the work must be divided into numerous projects. Each project presents unique challenges. Yet there is one
common challenge - the need to accommodate the more than 280,000 vehicles that cross the bridge each day.
West Span of the Bay Bridge While Undergoing Seismic Retrofit
West Span Seismic Retrofit Project Project Status: Completed 2004
The West Span lies between Yerba Buena Island and San Francisco and is made up of two complete
suspension spans connected at a center anchorage. Retrofit work included adding massive amounts of steel and concrete to strengthen the entire West Span, along
with new seismic shock absorbers and bracing.
Completed West Approach Replacement Structure

First Quarter 2009 Project Progress and Financial Update
Yerba Buena Island Transition SAS Skyway Oakland Touchdown 13
East Span Seismic Replacement Project
Rather than a seismic retrofit, the two-mile-long East Span is being completely rebuilt. When completed, the new East
Span will consist of several different sections, but will appear as a single streamlined span. The eastbound and westbound lanes of the East Span will no longer include upper and lower
decks. The lanes will instead be parallel, providing motorists with expansive views of the bay. These views also will be enjoyed by bicyclists and pedestrians thanks to a new path
on the south side of the bridge that will extend all the way to Yerba Buena Island. The new span will be aligned north of the existing bridge to allow traffic to continue flowing on the
existing bridge as crews build the new span.
The new span will feature the world’s longest Self-Anchored Suspension (SAS) bridge that will be
connected to an elegant roadway supported by piers (Skyway), which will gradually slope down towards the Oakland shoreline (Oakland Touchdown). A new
Transition Structure on Yerba Buena Island (YBI) will connect the SAS to the YBI tunnel and will transition the East Span’s side-by-side traffic to the upper and
lower decks of the tunnel and west span. When construction of the new East Span is complete
and vehicles have been safely rerouted to it, the original East Span will be demolished.
Simulation of New East Span in Relation to West Span and the Golden Gate Bridge

Toll Bridge Program Oversight Committee
14

First Quarter 2009 Project Progress and Financial Update
Yerba Buena Island Transition SAS Skyway Oakland Touchdown 15
TOLL BRIDGE SEISMIC RETROFIT PROGRAM
San Francisco-Oakland Bay Bridge East Span Replacement Project Summary
The new East Span bridge can be split into four major components - the Skyway and the Self-Anchored
Suspension Bridge in the middle and the Yerba Island Transition Structures and Oakland Touchdown approaches at either end. Each component is being
constructed by one to three separate contracts that all have been sequenced together.
Highlighted below are the major East Span contracts including their schedules. The letter designation before each contract corresponds to contract descriptions in the
rest of the report.
Eastbound
Westbound

Toll Bridge Program Oversight Committee
West Approach West Span
16
As with all of the Bay Bridge’s seismic retrofit projects, crews must build the Yerba Buena Island Transition
Structures (YBITS) close to moving vehicles and without disrupting traffic. To accomplish this daunting task, eastbound and westbound traffic will be shifted off
the existing roadway and onto a temporary detour supported by 200-foot-tall steel towers. Drivers will use this detour, just south of the original roadway, until
traffic is moved onto the new East Span.
TOLL BRIDGE SEISMIC RETROFIT PROGRAM
San Francisco-Oakland Bay Bridge East Span Replacement Project Yerba Buena Island Detour (YBID)
YBID Contract Contractor: C.C. Myers Inc. Approved Capital Outlay Budget: $442.2 M Status: 64% Complete
Current Progress on Detour Structure This contract originally was awarded in early 2004 to construct the detour structure for the planned 2006
opening of the new East Span. Due to the re-advertisement of the SAS superstructure contract in 2005 because of a lack of funding at the time, the bridge
opening was rescheduled to 2013. To better integrate the contract into the current east span schedule and to improve seismic safety and mitigate future construction
risks, the TBPOC has approved a number of changes to the contract, including adding the deck replacement work near the tunnel that was rolled into place over Labor Day
Weekend 2007, advancing future transition structure foundation work and making design enhancement to the temporary detour structure.
These changes have increased the budget and forecast for the contract to cover the revised project scope and
potential project risks.
A
Tunnel Approach Roadway Replacement
The first in a series of activities to open the detour viaduct was completed in 2007 with the replacement of a 350-foot long stretch of upper deck roadway just east of the
Yerba Buena Island tunnel. During this historic milestone, the entire Bay Bridge was closed over the 2007 Labor Day weekend so crews could demolish and replace the
old section of the deck with a seismically upgraded 6,500-ton precast section of viaduct that was literally pushed into place (see photo above).
Status: Completed.

First Quarter 2009 Project Progress and Financial Update
Yerba Buena Island Detour SAS Skyway Oakland Touchdown
17
Detour Viaduct Fabrication and Construction
The detour viaduct will run generally parallel to the existing lanes on the island and will tie back into the existing bridge and tunnel. While speed limits will be
reduced due to the turns needed to get on and off the detour, the viaduct will look quite similar to the existing bridge with steel cross beams and girders and a
concrete roadway deck. To insure a good fit, the steel viaduct truss members were pre-fitted during fabrication in South Korea and Oregon. Opening of the
detour to traffic is discussed on the following page. Status: Most of the center portion of the detour viaduct
has already been erected, including the concrete decks. At the west end of the detour, a cast-in-place concrete transition span is being poured to connect the
detour into the completed tunnel approach roadway replacement span. At the east end, support structures are being erected to facilitate the roll-out/roll-in of the
last truss section, which will tie the detour into the existing bridge.
Demolition of Existing Viaduct
After shifting traffic onto the detour structure, crews will
focus on the demolition of the existing transition structure into the tunnel. The old transition structure will need to be removed before construction of the new
transition structures from the SAS bridge to the YBI tunnel can be completed.
Status: The start of the demolition is pending the opening of the detour.
Overview of Yerba Buena Island Detour Contract Scope of Work and Current Status

Toll Bridge Program Oversight Committee
West Approach West Span
18
Shifting traffic to the Yerba Buena Island detour will be the most significant realignment of the bridge to date. To
accomplish this, crews will cut away a 288-foot portion of the existing truss bridge and replace it with a connection to the detour. This dramatic maneuver will involve aerial construction
that occurs more than 100 feet above the ground. When the Bay Bridge reopens to traffic, vehicles will travel on the detour until the completion of the new East Span.
A detailed step-by-step construction sequence for the roll-out of existing span and roll-in of the new truss at the east tie-in to
the detour viaduct structure is provided on the facing page. Status: The YBID contractor is currently at stage one and is
erecting the support structure and skid beam for the roll-out and roll-in operations (see photos on right). The new truss is in fabrication in Arizona.
Yerba Buena Island Detour Viaduct under Construction (foreground) with East Tie-In Support Structures Being Erected (right)
TOLL BRIDGE SEISMIC RETROFIT PROGRAM
Yerba Buena Island Detour (YBID) East Tie-in Opening Activities
Skid Beams for Roll-Out and Roll-In of East Tie-in Structure under Construction
First Quarter 2009 Project Progress and Financial Update
Yerba Buena Island Detour SAS Skyway Oakland Touchdown
19
East Tie-in Activities Over Labor Day Weekend 2009
East Tie-in Activities From Now through August 2009
Stage 1 – As the detour viaduct is being constructed (left), a support structure of falsework will be erected to support the new and existing trusses and the skid bent girders on which the trusses will move.
Stage 2 – The new roll-in truss will be constructed atop the skid bent just south of the existing truss.
Stage 3 – When the roll-in truss and detour viaduct are ready to be installed and opened to traffic, the Bay Bridge will be closed to all traffic.
Stage 4 – After the bridge is closed, the existing truss will be cut loose at both ends and will be rolled out hydraulically using jacks similar to those used for the Labor Day 2007 move to push the truss aside.
Stage 5 – After the existing truss has been rolled out of the way, the new truss will be similarly rolled into place using the same hydraulic jacking system.
Stage 6 – After being rolled into place, the new truss will be secured to the detour viaduct and existing bridge and the Bay Bridge will be re-opened to traffic. Removal of the rolled out span will commence soon after the new truss is secured.

Toll Bridge Program Oversight Committee
West Approach West Span 20
The new Yerba Buena Island Transition Structures (YBITS) will connect the new SAS bridge to the existing
Yerba Buena Island tunnel, transitioning the new side-by-side roadway decks to the upper and lower decks of the tunnel. The new structures will be cast-in-place reinforced
concrete structures that will look very similar to the already constructed Skyway structures. While some YBITS foundations and columns have been advanced by
the YBID contract, the remaining work will be completed under three separate YBITS contracts.
Simulation of Future Yerba Buena Island Transition Structures (top) with Detour Viaduct (bottom)
TOLL BRIDGE SEISMIC RETROFIT PROGRAM
San Francisco-Oakland Bay Bridge East Span Replacement Project Yerba Buena Island Transition Structures (YBITS)
The YBITS #1 contract will construct the mainline roadway structures from the SAS bridge to the YBI tunnel. Work on the structures is scheduled to start once the existing structures have been demolished and removed from the site.
YBITS #1 Contract Contractor: TBD Approved Capital Outlay Budget: $214.3M Status: Advertised
B YBITS Advanced Foundation and Column Work
First Quarter 2009 Project Progress and Financial Update
21 Yerba Buena Island Transition SAS Skyway Oakland Touchdown
21
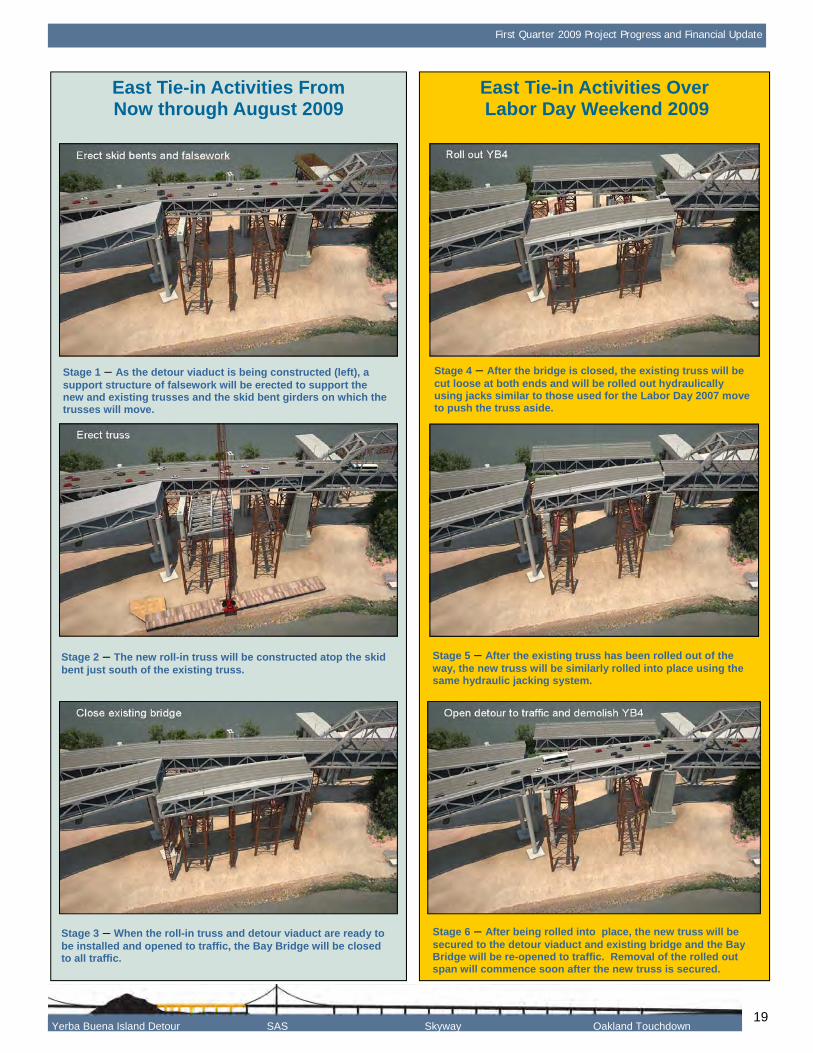
The YBITS #2 contract will demolish the detour viaduct after all traffic is shifted to the new bridge and will
construct a new eastbound on-ramp to the bridge in its place. The new ramp will also provide the final link for bicycle/pedestrian access off the SAS bridge onto
Yerba Buena Island.
YBITS #2 Contract Contractor: TBD Approved Capital Outlay Budget: $58.5 M Status: In Design
YBITS Advanced Foundation and Column Work Just North Of Existing Viaduct (foreground)
Upon completion of the YBITS work, a follow-on landscaping contract will be executed to re-plant and
landscape the area.
YBITS Landscaping Contract Contractor: TBD Approved Capital Outlay Budget: $3.3 M Status: In Design
Yerba Buena Island Transition Structures Advanced Work
Due to the re-advertisement of the SAS superstructure contract in 2005, it became necessary to temporarily suspend the
detour contract and make design changes to the viaduct. To make more effective use of the extended contract duration and to reduce overall project schedule and construction risks, the TBPOC approved the advancement of foundation and column work from the Yerba Buena Island Transition Structures contract.
Status: Advanced foundations and columns for the left piers of W3, W4, and W6 are under construction. Work at pier W5 is pending removal of the existing transition structure. See page 17 for a diagram of pier locations.

Toll Bridge Program Oversight Committee
West Approach West Span 22
If one single element bestows the status of world class on the new Bay Bridge East Span, it is the Self-Anchored
Suspension (SAS) bridge. This engineering marvel will be the world's largest SAS span at 2,047 feet in length, as well as the first bridge of its kind built with a single tower.
The SAS was separated into three separate contracts – construction of the land-based foundations and columns at
Pier W2, construction of the marine-based foundations and columns at Piers T1 and E2, and the construction of the SAS steel superstructure, including the tower, roadway,
and cabling. Construction of the foundations at Pier W2 and at Piers T1 and E2 was completed in 2004 and 2007, respectively.
The single main suspension cable is anchored at Pier E2 and goes up and over the tower at Pier T1 before
wrapping around column W2 on Yerba Buena Island before returning to Pier E2 (see rendering on facing page). Construction of the piers at E2 and T1 required
significant on-water resources to drive the foundation support piles down not only to bedrock, but also through the bay water and mud.
The T1 foundation piles extend 196 feet below the waterline and are anchored into bedrock with heavily
reinforced concrete rock sockets that are drilled into the rock. Driven nearly 340 feet deep, the steel and concrete E2 foundation piles were driven 100 feet deeper than the
deepest timber piles of the existing east span in order to get through the bay mud and reach solid bedrock.
SAS Marine Foundations Contract Contractor: Kiewit/FCI/Manson, Joint Venture Approved Capital Outlay Budget: $280.9 M Status: Completed
SAS W2 Cap Beam
TOLL BRIDGE SEISMIC RETROFIT PROGRAM
San Francisco-Oakland Bay Bridge East Span Replacement Project Self-Anchored Suspension (SAS) Bridge
The twin W2 columns on Yerba Buena Island provide
essential support for the western end of the SAS bridge where the single main cable for the suspension span will extend down from the tower and wrap around and under
the western end of the roadway deck. Each of these huge columns required massive amounts of concrete and steel and are anchored 80 feet into the island’s solid bedrock.
SAS Land Foundation Contract Contractor: West Bay Builders, Inc. Approved Capital Outlay Budget: $26.4 M Status: Completed
Construction of the Pier Table at E2
C

First Quarter 2009 Project Progress and Financial Update
Yerba Buena Island Transition SAS Skyway Oakland Touchdown 23
Rising 525 feet above mean sea level and embedded in rock, the single-tower SAS span is designed to withstand
a massive earthquake. The SAS bridge is not just another suspension bridge. Traditional main cable suspension bridges have twin cables with smaller
suspender cables connected to them. These cables hold up the roadbed and are anchored to separate structures in the ground. While there will appear to be two main
cables on the SAS, there will actually only be one. This single cable will be anchored within the eastern end of the roadway, carried over the tower and wrapped around
the two side-by-side decks at the western end.
SAS Superstructure Contract Contractor: American Bridge/Fluor Enterprises, Joint Venture Approved Capital Outlay Budget: $1,753.7 M Status: 38% Complete
Architectural Rendering of new Self-Anchored Suspension Span
The single steel tower will be made up of four separate legs connected by shear link beams, which function in the
same way as a fuse in an electrical circuit. These beams will absorb most of the impact from an earthquake, preventing damage to the tower legs. In addition, if one of
the legs is damaged, the other legs will keep the bridge standing.
The next several pages highlight the construction sequence of the SAS and are followed by detailed updates on specific construction activities.
Pier E2
Pier T1
Pier W2
D

Toll Bridge Program Oversight Committee
West Approach West Span 24
TOLL BRIDGE SEISMIC RETROFIT PROGRAM
Self-Anchored Suspension (SAS) Construction Sequence
STEP 1 - CONSTRUCT TEMPORARY SUPPORTS
Temporary support trusses will need to be erected from the Skyway to Yerba Buena Island to support the new SAS bridge during construction.
Status: Foundations for the temporary supports are under construction. Support columns and trusses are now being installed from west to east.
STEP 2 - INSTALL ROADWAYS
The roadway boxes will be lifted into place by using the shear-leg crane barge. The boxes will be bolted and welded together atop the temporary support trusses to form two continuous parallel steel roadway boxes.
Status: The first shipment of roadway boxes is scheduled for summer 2009.
STEP 3 - INSTALL TOWER
Each of the four legs of the tower will be erected in five separate lifts. The first lift will use the shear-leg crane barge while the remaining higher lifts will use a temporary support tower and lifting jacks.
Status: The first shipment of tower boxes is scheduled for late 2009. Tower installation cannot begin until the initial eastbound roadway boxes are installed between the existing east span and new tower.

First Quarter 2009 Project Progress and Financial Update
Yerba Buena Island Transition SAS Skyway Oakland Touchdown 25
STEP 4 - MAIN CABLE AND SUSPENDER INSTALLATION
The main cable will be pulled from the east end of the SAS bridge, over the tower, and wrapped around the west end before returning back. Suspender cables will be added to lift the roadway decks off the temporary support structure.
Status: Cable installation is pending the erection of the tower and roadway sections.
STEP 5 - WESTBOUND OPENING
The new bridge will first open in the westbound direction pending completion of the Yerba Buena Island Transition Structures. Westbound access to the Skyway from Oakland will be completed by the Oakland Touchdown #1 Contract in 2009.
Status: Westbound opening is scheduled for 2012.
STEP 6 - EASTBOUND OPENING
Opening of the bridge in the eastbound direction is pending completion of Oakland Touchdown 2, which needs westbound traffic off the existing bridge before the eastbound approach structure can be completed.
Status: Eastbound opening is scheduled for 2013.

Toll Bridge Program Oversight Committee
West Approach West Span 26
TOLL BRIDGE SEISMIC RETROFIT PROGRAM
Nearly every component of the SAS above the waterline - from the temporary support structures to the roadway and
tower box sections to the main cable and suspender ropes - will be fabricated off-site and erected, bolted and welded into place upon arrival in the Bay Area. This project is truly
global in nature, with fabrication of the bridge components occurring not only in the United States, but around the world in China, the United Kingdom, Japan, South Korea
and other locations.
Roadway and Tower Segments
Like giant three-dimensional jigsaw puzzles, the roadway
and tower segments of the SAS bridge are hollow steel shells that are internally strengthened and stiffened by a highly engineered network of welded steel ribs and
diaphragms. The use of steel in this manner allows for a flexible yet relatively light and strong structure able to withstand the massive loads placed on the bridge during
seismic events. Status: Segments are in various stages of fabrication.
Roadway sections 3, 4 and 5 east and west have been assembled for paint and fit up, while roadway sections 1, 2, 6, and 7 have started assembly. Individual components
for roadway sections 8, 9, and 10 are being fabricated. On the tower sections, assembly of the first of five tower lifts is well underway. The second tower lifts have also started to
allow for trial fit-up prior to shipping of the first lift as per specification (see additional progress photos on pages 82 and 83).
Painted Roadway Box Section Ready For Fit-up
West Shaft, Lift 2 Assembly
Self-Anchored Suspension (SAS) Superstructure Fabrication Activities

First Quarter 2009 Project Progress and Financial Update
Yerba Buena Island Transition SAS Skyway Oakland Touchdown 27
Tower Production
Fabrication Progress Diagram
Sub-Assemblies Fabrication Segment Assembly Blast, Paint & Fit Up Ready To Ship
Shop Drawings Underway
Bike Path Bracket Assembly in Bay 5

Toll Bridge Program Oversight Committee
West Approach West Span 28
TOLL BRIDGE SEISMIC RETROFIT PROGRAM
Self-Anchored Suspension (SAS) Superstructure Fabrication Activities
Saddles, Bearings, Hinges, and Other Bridge Components
The mounts on which the main cable and suspender ropes will sit are made from solid steel castings. Castings for the main cable saddles are being made by
Japan Steel Works, while the cable bands and brackets are being made by Goodwin Steel in the United Kingdom.
The bridge bearings and hinges that support, connect, and transfer service loads from the SAS bridge to the
adjoining sections of the new east span are being fabricated in a number of locations. Work on the bearings is being performed in Pennsylvania and South
Korea, while hinge pipe beams are being fabricated in Oregon.
Status: Under Fabrication.
Bronze Spherical Bushing for E2 Bearings
Cables and Suspenders
One continuous main cable will be used to support the roadway deck of the SAS bridge. Anchored into the
eastern end of the bridge, the main cable will start on one side of Pier E2, go over the main tower at T1, loop around the western end of the roadway decks at Pier
W2, and then back over main tower to the other end of Pier E2. The main cable will be made up of bundles of individual wire strands. Lifting up the roadway decks to
the main cable will be a number of smaller suspender cables. The main cable will be fabricated in China and the suspender cables in Missouri.
Status: Initial trial testing of the main cable strands is in progress.
Trial Cable Band Assembly

First Quarter 2009 Project Progress and Financial Update
Yerba Buena Island Transition SAS Skyway Oakland Touchdown 29
Shear-leg Crane Barge
The massive shear-leg crane barge that will help build the SAS superstructure arrived in the San Francisco Bay
on March 12, 2009 after a trans-pacific voyage. The crane and barge are separate units operating as a
single entity dubbed the “Left Coast Lifter.” The 400 by 100-foot barge is a U.S. flagged vessel that was custom built in Portland, Oregon by U.S. Barge, LLC and outfitted
with the crane by Shanghai Zhenhua Port Machinery Co. Ltd. (ZPMC) at a facility near Shanghai, China. The crane’s boom weighs 992 tons and is 328 feet long. The
crane can lift up to 1,873 tons, including the deck and tower sections for the SAS, which will begin arriving this summer.
The crane will offload and erect the remaining steel for the temporary support structures, as well as all of the
deck and tower segments. Work on the eastbound side of the SAS must occur first, as the crane cannot reach over permanent westbound decks to work on the eastbound
roadway. Status: On location.
Cap Beams
Construction of the massive steel-reinforced concrete
cap beams that link the columns at piers W2 and E2 was left to the SAS superstructure contractor and represents the only concrete portions of work on that contract. The
east and west ends of the SAS roadway will rest on the cap beams and the main cable will wrap around and tie down upon them.
Status: Completed.
Ship Carrying the Shear-leg Crane Barge Crossing beneath the West Span of the Bay Bridge
Nearly Completed Cross Beam at Pier E2
TOLL BRIDGE SEISMIC RETROFIT PROGRAM
Self-Anchored Suspension (SAS) Superstructure Field Activities

Toll Bridge Program Oversight Committee
West Approach West Span 30
TOLL BRIDGE SEISMIC RETROFIT PROGRAM
Self-Anchored Suspension (SAS) Superstructure Field Activities
Temporary Support Structures
To erect the roadway and tower of the bridge, temporary support structures will first be put in place. Almost a bridge in
itself, the temporary support structures will stretch from the end of the completed skyway back to Yerba Buena Island. For the tower, a strand jack system is being built into the tower’s
temporary frame to elevate the upper sections of the tower into place. These temporary supports are being fabricated in the Bay Area, as well as in Oregon and in China at ZPMC.
Status: The secondary channel between Yerba Buena Island and Oakland has been closed to shipping traffic. The temporary
support foundations are under construction and erection of completed trusses is ongoing from west to east. Later remaining trusses are still being fabricated.
SAS Fieldwork to be completed
SAS Fieldwork in progress
Completed fieldwork under prior W2 and E2/T1 contracts
SAS permanent facilities field work progress
SAS Superstructure Fieldwork Construction Progress Diagram
First Quarter 2009 Project Progress and Financial Update
Yerba Buena Island Transition SAS Skyway Oakland Touchdown 31
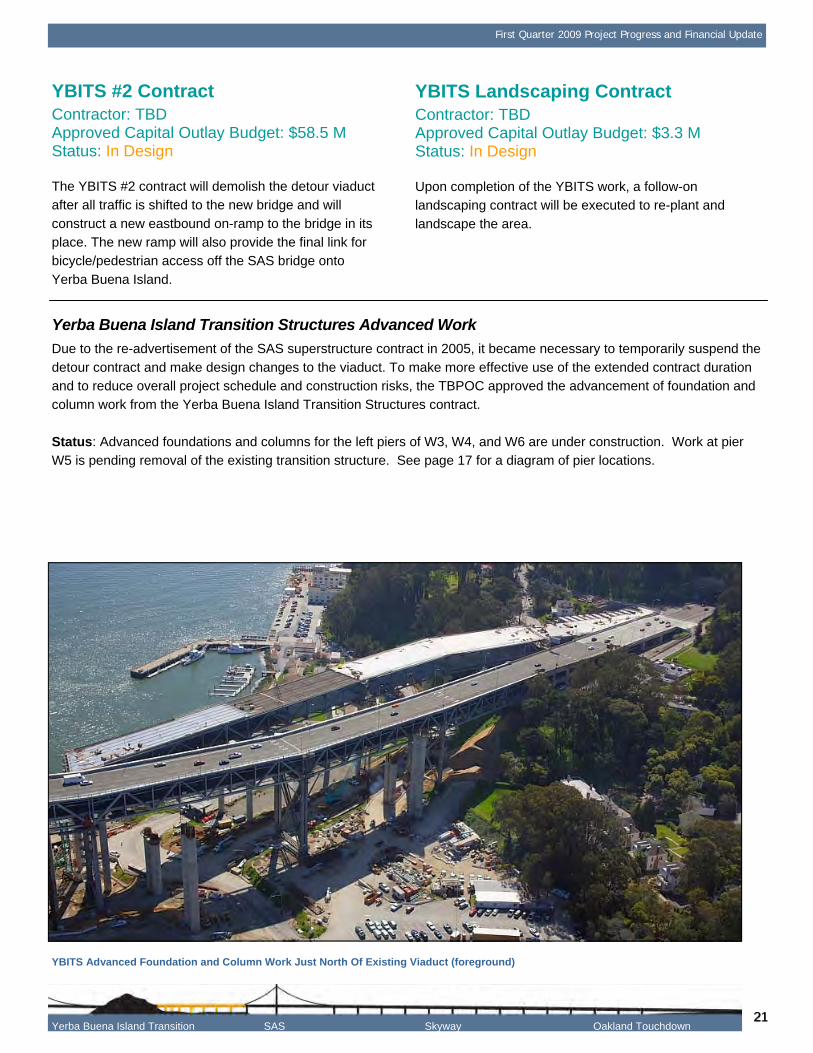
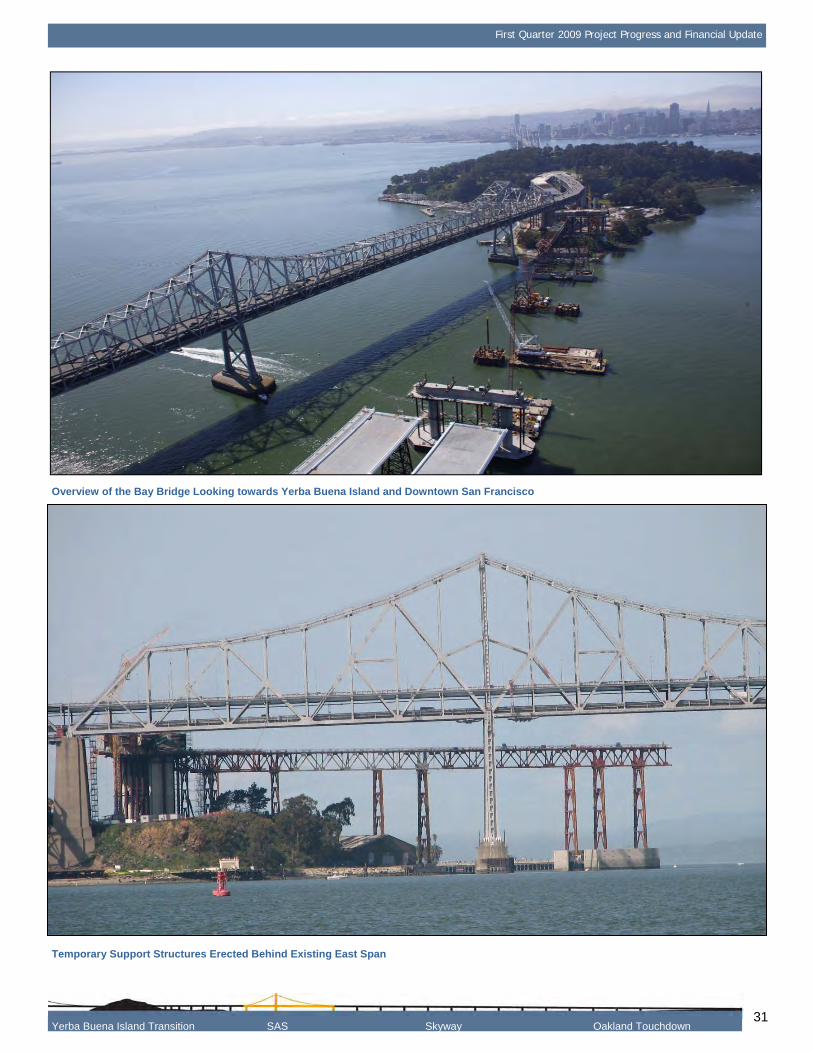
Temporary Support Structures Erected Behind Existing East Span
Overview of the Bay Bridge Looking towards Yerba Buena Island and Downtown San Francisco

Toll Bridge Program Oversight Committee
West Approach West Span 32
The Skyway, which comprises much of the new East Span, will drastically change the appearance of the Bay Bridge.
Replacing the grey steel that currently cages drivers, a graceful, elevated roadway supported by piers will provide sweeping views of the bay.
Skyway Contract Contractor: Kiewit/FCI/Manson Joint Venture Approved Capital Outlay Budget: $1,254.1 M Status: Completed
Extending for more than a mile across Oakland mudflats, the Skyway is the longest section of the East Span. It sits between the new Self-Anchored Suspension (SAS) span
and the Oakland Touchdown. In addition to incorporating the latest seismic-safety technology, the side-by-side roadway decks of the Skyway feature shoulders and lane
widths built to modern standards. The Skyway's decks are composed of 452 pre-cast
concrete segments (standing three stories high), and contain approximately 200 million pounds of structural steel, 120 million pounds of reinforcing steel, 200 thousand
linear feet of piling and about 450 thousand cubic yards of concrete. These are the largest segments of their kind ever cast and were lifted into place by winches that were custom
made for this project. The Skyway marine foundation consists of 160 hollow steel
pipe piles measuring eight feet in diameter and dispersed among 14 sets of piers. The 365-ton piles were driven more than 300 feet into the deep bay mud. The new East Span
piles were battered or driven in at an angle, rather than vertically, to obtain maximum strength and resistance.
Designed specifically to move during a major earthquake, the Skyway features several state-of-the art seismic safety innovations, including 60-foot-long hinge pipe beams.
These beams will allow deck segments on the Skyway to move, enabling the deck to withstand greater motion and to absorb more earthquake energy.
Western End of Completed Skyway
Completed Skyway Left of Existing East Span
TOLL BRIDGE SEISMIC RETROFIT PROGRAM
San Francisco-Oakland Bay Bridge East Span Replacement Project Skyway
E

First Quarter 2009 Project Progress and Financial Update
Yerba Buena Island Transition SAS Skyway Oakland Touchdown 33
Rendering of the Western End of Completed Skyway and the Self-Anchored Suspension Bridge

Toll Bridge Program Oversight Committee
West Approach West Span 34
When completed, the Oakland Touchdown (OTD) structures will connect Interstate 80 in Oakland to the
new side-by-side decks of the new East Span. For westbound drivers, the OTD will be their introduction to the graceful new East Span. For eastbound drivers
from San Francisco, this section of the bridge will carry them from the Skyway to the East Bay offering unobstructed views of the Oakland hills.
The OTD will be constructed through two contracts. The first contract will build the new westbound lanes,
as well as part of the eastbound lanes. The second contract to complete the eastbound lanes cannot fully begin until westbound traffic is shifted onto the new
bridge so that a portion of the upper deck of the existing bridge can be demolished to allow for a smooth transition for the new eastbound lanes in
Oakland.
The OTD #1 contract constructs the entire 1,000-foot-long westbound approach from the toll plaza to the
Skyway. When completed, the westbound approach structure will provide direct access to the westbound Skyway. In the eastbound direction, the contract will
construct a portion of the eastbound structure and all of the eastbound foundations that are not in conflict with the existing bridge.
On the westbound structure, the contractor has completed all foundation work and is now proceeding
with superstructure work. Work continues on the eastbound structure’s foundations and columns. The approach is going full steam ahead and is visible to the
drivers.
Oakland Touchdown #1 Contract Contractor: MCM Construction, Inc. Approved Capital Outlay Budget: $226.5 M Status: 67% Complete
TOLL BRIDGE SEISMIC RETROFIT PROGRAM
San Francisco-Oakland Bay Bridge East Span Replacement Project Oakland Touchdown
The OTD #2 contract will complete the eastbound
approach structure from the end of the Skyway to Oakland. This work is critical to the eastbound opening of the new bridge, but cannot be completed until
westbound traffic has been shifted off the existing upper deck to the new SAS bridge.
Oakland Touchdown #2 Contract Contractor: TBD Approved Capital Outlay Budget: $62.0 M Status: In design
Oakland Touchdown #1 Pier Construction
G F

First Quarter 2009 Project Progress and Financial Update
Yerba Buena Island Transition SAS Skyway Oakland Touchdown 35
Oakland Touchdown under Construction with New Westbound Structure on Left

Toll Bridge Program Oversight Committee
West Approach West Span 36
A number of contracts needed to relocate utilities, clear areas of archeological artifacts, and prepare areas for
future work have already been completed. The last major contract will be the eventual demolition and removal of the existing bridge, which by that time will have served the Bay
Area for nearly 80 years. Following is a status of some the other East Span contracts.
After the 1989 Loma Prieta earthquake, and before the final retrofit strategy was determined for the East Span, Caltrans
completed an interim retrofit of the existing bridge to prevent a catastrophic collapse of the bridge should a similar earthquake occur before the East Span is
completely replaced. The interim retrofit was performed under two separate contracts that lengthened pier seats, added some structural members, and strengthened areas
of the bridge so that they would be more resilient during an earthquake.
East Span Interim Seismic Retrofit Contractors: 1) California Engineering Contractors 2) Balfour Beatty Approved Capital Outlay Budget: $30.8 M Status: Completed
Existing East Span of Bay Bridge
TOLL BRIDGE SEISMIC RETROFIT PROGRAM
San Francisco-Oakland Bay Bridge East Span Replacement Project Other Contracts
The Stormwater Treatment Measures contract implemented a number of best practices for the
management and treatment of storm water runoff. Focused on the areas around and approaching the toll plaza, the contract added new drainage and built new
bio-retention swales and other related constructs.
Stormwater Treatment Measures Contractor: Diablo Construction, Inc. Approved Capital Outlay Budget: $18.3 M Status: Completed
Storm Water Retention Basin
Archeological Investigations

First Quarter 2009 Project Progress and Financial Update
Yerba Buena Island Transition SAS Skyway Oakland Touchdown 37
This contract relocated an electrical substation just east of the Yerba Buena Island tunnel in preparation for the new
East Span.
Yerba Buena Island Substation Contractor: West Bay Builders Approved Capital Outlay Budget: $11.6 M Status: Completed
New YBI Electrical Substation
A submerged cable from Oakland that is close to where the new bridge will touch down supplies electrical
power to Treasure Island. To avoid any possible damage to the cable during construction, two new cables were run from Oakland to Treasure Island to
replace the existing cable. The extra cable was funded by the Treasure Island Development Authority and its future development plans.
Electrical Cable Relocation Contractor: Manson Construction Approved Capital Outlay Budget: $9.6 M Status: Completed
While common in offshore drilling, the new East Span is one of the first bridges to use large diameter battered piles
in its foundations. To minimize project risks and build industry knowledge, a pile installation demonstration project was initiated to prove the efficacy of the proposed
technology and methodology. The demonstration was highly successful and helped result in zero contract change orders or claims for pile driving on the project.
Pile Installation Demonstration Contractor: Manson and Dutra, Joint Venture Approved Capital Outlay Budget: $9.2 M Status: Completed
Design work on the contract will start in earnest as opening of the new bridge to traffic approaches.
Existing Bridge Demolition Contractor: TBD Approved Capital Outlay Budget: $239.2 M Status: In Design
I
H

Toll Bridge Program Oversight Committee
West Approach West Span 38
Overall environmental compliance for the SFOBB East Span project has been a success. All weekly, monthly and
annual compliance reports to resource agencies have been delivered on time. There are no comments from receiving agencies. The tasks for the current quarters are
focused on mitigation monitoring. Key successes in this quarter are as follows:
Bird monitoring was conducted weekly in the active construction area. Monitors did not observe any
indication that birds were disturbed due to East Span construction activities.
Peregrine falcon monitoring was conducted weekly throughout January and February 2009. During monitoring in February a pair of peregrine falcons was
observed in copulation. The observations suggest that the East Span Bay Bridge peregrine falcon territory is occupied and a breeding attempt is underway. In
response to these observations peregrine falcon monitoring was conducted twice to three times a week throughout March 2009.
Marine mammal, hydro-acoustic and bird predation
monitoring was conducted during the driving of marine
based piles at SAS Temporary Towers F and G. Caltrans met with the San Francisco Bay
Conservation and Development Commission (BCDC) and National Oceanic and Atmospheric Administration, National Marine Fisheries Service
(NOAA-Fisheries) to discuss the Central Bay Eelgrass and Sand Flat Mitigation Program.
BCDC Permit No. 8-01, Amendment No. 24, for the construction of a temporary wildlife exclusion fence, to minimize the potential entrance of Canadian geese on
to I-80 roadway adjacent to the Emeryville Crescent Marsh was issued on January 14, 2009.
Caltrans performed herring monitoring during marine-based East Span construction activities. In addition, Caltrans received weekly herring spawning updates
from the California Department of Fish and Game
(CDFG). Herring spawning season ended March 31st, and a 2008-2009 SFOBB East Span herring
monitoring report is being prepared for submittal to CDFG.
TOLL BRIDGE SEISMIC RETROFIT PROGRAM
Herring Monitoring
Canadian Geese
Quarterly Environmental Compliance Highlights

First Quarter 2009 Project Progress and Financial Update
39
Seismic safety retrofit work on the West Approach, bordered by 5th Street and the Anchorage at Beale
Street, involved completely removing and replacing this one-mile stretch of Interstate 80 and six on and off-ramps in its original footprint. At least 280,000 vehicles
passed by daily in the midst of this essential construction.
The West Approach originally had one foundation system supporting both an upper and lower deck configuration from 3rd Street to Beale Street. Each
deck now has its own independent column and foundation support system, a crucial aspect of making the West Approach seismically sound. The roadways
between 3rd and 5th Streets are parallel concrete decks that transition into the double-deck configuration as drivers approach the West Span of the Bay Bridge.
To minimize disruptions to the neighborhood and to
keep the bridge’s traffic moving, the project was performed in a series of six elaborate stages, including a series of lane shifts, regular lane and ramp closures,
and one partial bridge closure. Each of the six stages of retrofit work follows a carefully staged formula to meet seismic safety standards. A temporary structure is
built and vehicles are rerouted to it. The old structure is then demolished and work begins on the new structure in the original footprint. Drivers are then rerouted back
onto the completed replacement structure and the temporary structure is demolished.
Work on the 72-year-old structure began in 2003 and seismic safety was certified in 2008. Final punchlist work was completed in early 2009.
Recently Reopened Harrison Street Off-ramp
West Approach Seismic Replacement Contract Contractor: Tutor-Saliba, Joint Venture Approved Capital Outlay Budget: $350.7 M Status: 98% Complete
Workers Constructing Infill Wall beneath West Approach
San Francisco-Oakland Bay Bridge West Approach Replacement Project Project Status: Completed 2009

Toll Bridge Program Oversight Committee
40
TOLL BRIDGE SEISMIC RETROFIT PROGRAM
Other Completed Projects
San Mateo-Hayward Bridge Seismic Retrofit Project Project Status: Completed 2000
The San Mateo-Hayward Bridge seismic retrofit project focused on the strengthening of the high-rise portion of
the span. The foundations of the bridge were significantly upgraded with additional piles.
The State Legislature in the 1990s identified seven of the nine state-owned toll bridges for seismic retrofit. In
addition to the San Francisco-Oakland Bay Bridge, these included the Benicia-Martinez, Carquinez, Richmond-San Rafael and San Mateo-Hayward
bridges in the Bay Area, and the Vincent Thomas and Coronado bridges in Southern California. Other than the East Span of the Bay Bridge, the retrofits of all the
bridges have been completed as planned.
1962 Benicia-Martinez Bridge Seismic Retrofit Project Project Status: Completed 2003
The southbound 1962 Benicia-Martinez Bridge was retrofitted to “Lifeline” status with the strengthening of the
foundations and columns and the addition of seismic bearings that allow the bridge to move during a major seismic event. The Lifeline status means the bridge is
designed to sustain minor to moderate damage after an event and to reopen quickly to emergency response traffic.
1962 Benicia Martinez Bridge (right)
High-Rise Section of San Mateo-Hayward Bridge
1958 Carquinez Bridge Seismic Retrofit Project Project Status: Completed 2002
The eastbound 1958 Carquinez Bridge was retrofitted in 2002 with additional reinforcement of the cantilever
thru-truss structure.
1958 Carquinez Bridge (foreground) with the 1927 Span (middle) under Demolition and the New Alfred Zampa Memorial Bridge (background)

First Quarter 2009 Project Progress and Financial Update
41
Richmond-San Rafael Bridge Seismic Retrofit Project Project Status: Completed 2005
The Richmond-San Rafael Bridge was retrofitted to a “No Collapse” classification to avoid catastrophic failure during
a major seismic event. The foundations, columns, and truss of the bridge were strengthened, and the entire low-rise approach viaduct from Marin County was replaced.
Richmond-San Rafael Bridge
Los Angeles-Vincent Thomas Bridge Seismic Retrofit Project Project Status: Completed 2000
.
Vincent Thomas Bridge
San Diego-Coronado Bridge Seismic Retrofit Project Project Status: Completed 2002
San Diego-Coronado Bridge

Toll Bridge Program Oversight Committee
42
Assembly Bill (AB) 144 states that Caltrans must “regularly reassess its reserves for potential claims and
unknown risks, incorporating information related to risks identified and quantified through its risk assessment processes.” AB 144 set a $900 million
Program Reserve (also referred to as the Program Contingency). The Program Contingency is currently at $740.3 million according to the TBPOC Approved
Budget, unchanged from the previous quarter.
The Risk Management Process Caltrans’ approved risk management plan provides for a systemic and continuous process of identifying, analyzing, and responding to project and program
risks. Risk management plan implementation provides for maximizing the probability and consequences of positive events and minimizing the probability and
consequences of adverse events to project objectives (e.g., cost, schedule and quality). Each element of the risk management process is shown in the Figure 1,
above, and explained below. The risk management cyclic process is performed on a quarterly basis and encompasses all identified risks related to the
contracts, program, corridor, capital outlay, capital outlay support, and schedule.
1. Risk Management Planning – deciding how to approach, plan and execute the risk management activities for the project.
2. Risk Identification – determining which risks might affect the project and documenting their characteristics.
3. Qualitative Risk Analysis – prioritizing risks for subsequent further analysis or action by assessing and combining their probability and impacts.
4. Quantitative Risk Analysis – analyzing numerically the effect of identified risks on overall project objectives.
5. Risk Response Planning – developing options and actions to enhance opportunities and to reduce impact to project objectives.
6. Risk Monitoring and Control – tracking identified risks, monitoring residual risks, identifying new risks, executing risk response plans, and
evaluating their effectiveness throughout the project life cycle.
Although the risk management processes above are
presented as discreet elements with well-defined interfaces, in practice they often overlap and interact with each other.
What Risk Management Does and Does Not Include Risk management addresses risks that may affect its defined project objectives such as cost, time, scope and quality. Given a project plan, risk management
generally looks at ways in which the project may not go according to plan. Risk management focuses on the defined project scope and objectives, and therefore
does not include 1) risks or possible decisions that may “kill” the project -- if the project ceases to exist, there are no risks to manage. For example, risk management
does not include risks such as the loss of funding, natural disaster that destroys all or part of the construction or acts of governments, and 2) risks or
possible decisions that may materially change the project -- if the project objectives are changed substantially, risk management will start afresh on the
“new” project. For example, the YBI Detour contract
TOLL BRIDGE SEISMIC RETROFIT PROGRAM
Risk Management Program Update
Figure 1 – The Risk Management Process

First Quarter 2009 Project Progress and Financial Update
43
was materially changed by the addition several YBITS1 project foundations by contract change order as well as certain design enhancements that were made to the
east and west “tie-ins” of the YBI Detour structure. The risks of such decisions were not in the risk register of the original contract. In a nutshell, risk management is
confined to quantifying risks that are intended to be covered by project and program contingency.
About “Risk” and “Opportunity” The concept of risk can include both upside as well as downside impacts. This means that the word “risk” can be used to describe uncertainties, which if they
occurred, would have a negative or harmful effect, and the same word can also describe uncertainties, which if they occurred, would be helpful. In short, there are two
sides to risk -- threats and opportunities. A risk that has no threat is a “pure opportunity.” It is simply an unplanned good thing which might happen. For
example, a new design method might be released, which we can apply to benefit our project. Opportunity is the inverse of threat if a risk has both threat and
opportunity. Where a risk variable exists on a continuous scale and there is uncertainty over the eventual outcome, instead of just defining the risk as
the downside it might also be possible to consider upside potential. For example, if we have included escalation at 5 percent in our budget for future
contracts and this rate could range from say 3 to 7 percent depending on economic conditions at the time of advertisement, we have an opportunity in the 3 to 5
percent range and a threat in the 5 to 7 percent range.
Opportunity and threat exist in the one risk. If the budget were based on 7 percent escalation we would
have only opportunity. If based on 3 percent we would have only threat. Threat and opportunity can also depend on how we define the risk. For example, if the
risk is that an external agency may relax its requirements and this saves us money relative to what we have budgeted currently in our plan, this is an
opportunity. If the risk is defined as the agency may tighten its requirements and this adds to our costs, this is a threat. We can only separate the opportunity and
threat if we are certain that the agency may act only one way and not the other. If the risk is that the agency may change its requirements, we could have
impacts that range from positive to negative. We would have both opportunity and threat in the same risk, and the degree of each would depend on what we
have budgeted in our plan. Uncertainty in the cost of major contract change orders is another example of opportunity. If we enter an estimate into the change
order log and the final outcome could range from less than the estimate to more than the estimate, we have both an opportunity and a threat. The degree of
opportunity and threat depends on where the estimate lies within the range.
Risk Management for Projects in Design and Construction Projects in design have the greatest potential for opportunities, because the project is still open to changes. Risk reduction and avoidance are
opportunities, as are value analysis, constructability reviews and innovations in design, construction methods and materials. Once a project enters
construction, the project objectives (scope, time and cost) are fixed contractually. Any changes are made using a contract change order. The only opportunity to
save money or time is from a negative change order such as resulting from a cost reduction incentive proposal by the Contractor. Otherwise, change orders
add cost and/or time to the project. So, the prime opportunity during construction is to reduce or eliminate risks.
Temporary Support Structures for the SAS

Toll Bridge Program Oversight Committee
44
RISK MANAGEMENT DEVELOPMENTS IN THE 4THQUARTER OF 2008
The approved risk management plan provides for reporting quantitative cost risk results and other risk
management information from the previous quarter. Described below are the main risk management developments and updated quantitative cost risk
results for the 4th Quarter of 2008.
SAS Contract Some of the main risk management developments on
the SAS contract during the 4th Quarter of 2008 are: a. “Green Tag” Process: This enhanced quality
control and quality assurance process continues to
prove successful in documenting quality welds and mitigating schedule and cost risks. The green tag process has resulted in enhanced coordination of
quality control and assurance earlier in the fabrication process.
b. Welding Acceptance Criteria: A contract change
order providing revised acceptance criteria for welding was submitted to the Contractor. This change order mitigates schedule and cost risk by
clearly providing a baseline for welding quality control, quality assurance, and acceptance criteria, while taking into account the Contractor’s means
and methods.
c. Orthotropic Box Girder (OBG) Tack Weld Issue: The proposed technical resolution of this issue was
presented to the Seismic Peer Review Team (SPRT). The SPRT concurred with the proposed technical resolution and it is currently being
implemented. This solution provides an exhaustive fit for purpose design assessment and greatly mitigates cost and schedule risk.
d. Administrative Resolution of Prior Fabrication Issues: Preliminary discussions have been held with the Contractor in an attempt to address the
administrative resolution of fabrication issues to date. Discussions will continue in the 1st Quarter of 2009. Talks will focus on the administrative
resolution of several contract change orders related to fabrication. Resolution of such administrative issues at the earliest possible time
will mitigate cost risk. e. Cable Issues: The Cable Engineering Risk
Management (CERM) team continues to engage
international experts to help resolve the complex cable engineering and geometry issues. The SAS main cable geometry depends on the weight of the
OBG and the suspender loads. The CERM team has recommended that additional cables bands and cable brackets be procured to cover all
potential geometry variations that may occur where the cable interacts with the deck. Team China will be measuring as-fabricated thicknesses of
structural steel to validate theoretical models. The CERM team is also looking at and resolving potential spatial conflicts and issues related to
cable rotation during installation of the cable bands and suspenders.
Corridor Schedule During the 4th Quarter of 2008, the SAS Contractor
estimated that various OBG and tower fabrication operations were potentially 13 months behind the Contractor’s original schedule and indicated that about
six months could conceivably be recovered. Caltrans and the SAS Contractor initiated a joint effort to review the schedule and develop mitigating actions. The
parties addressed in principle approximately six months of the potential 13 month period. The
TOLL BRIDGE SEISMIC RETROFIT PROGRAM
Risk Management Program Update (cont.)
Soil Nail Wall
First Quarter 2009 Project Progress and Financial Update
45
Contractor will engage its fabricator and provide incentives and disincentives for new delivery dates. It
is anticipated that the fabricator will utilize additional shop space at their facility to advance this work. Caltrans and the Contractor (and its fabricator) will
continue to negotiate with the anticipation of a contract change order being issued prior to the end of the 1st Quarter of 2009. This is a preliminary step in an
attempt to recover schedule and maintain previous commitments to bridge opening dates. The TBPOC and the SAS Contractor’s management team
requested that an effort be made to jointly develop a proposed accelerated schedule (Opportunity Schedule). The Opportunity Schedule will be a joint
effort that will include teams comprised of members of the Department, the Contractor, designer, and other stakeholders. The kick-off meeting is anticipated in
early January. Joint Caltrans and Contractor teams are being established to investigate potential mitigating actions for fabrication, steel erection, cable installation
and mechanical/electrical/piping phases of the project. YBI Detour Contract Some of the main risk management developments in
the 4th Quarter of 2008 on the YBI Detour contract are: a. East Tie-In: Collaborative on-site meetings at the
different fabrication facilities between the Caltrans construction team, design team, and the
Contractor have resolved many issues that might have caused significant delay in the traffic switch schedule.
b. West Tie-In: The design team's concrete specialist continues developing high performance concrete to accelerate the closure pour which will help ensure
that the Bay Bridge can be returned to service as soon as possible during the traffic switch weekend.
c. Demolition: The project team continues to assess
a new strategy to allow demolition work to proceed on all spans after the traffic switch instead of demolishing the bridge one span at a time. The
new approach helps protect the access road to the Coast Guard Station while the demolition work is in progress. The project team is also reassessing the
cost/benefits to determine if added value could be realized by bidding this work on the YBITS1
project.
Oakland Touchdown Westbound (OTD1) Contract Some of the main risk management developments on the OTD1 contract during the 4th Quarter of 2008 are: a. In order to mitigate corridor schedule and cost
risks, the decision was made to implement OTD1 mechanical-electrical-plumbing work on the SAS contract by contract change order.
b. Notice of Potential Claim No. 8 for Integrated Shop Drawings (ISDs) impacts has been resolved to the satisfaction of all parties.
c. The Department and the Contractor are working closely to resolve any remaining structural and mechanical/electrical conflicts at highly congested
areas to complete the ISDs. YBI Transition Structure (YBITS1) Contract Some of the main risk management developments on the YBITS1 contract during the 4th Quarter of 2008 are:
a. The contract bid opening date has been changed to July 14, 2008 to more closely match the adjacent contracts’ schedules. This will optimize
the YBITS1 work schedule and minimize schedule and cost risk both to the YBITS1 contract and the corridor.
b. Based on the Skyway and OTD1 risk identification and response, options to begin ISDs during design are being evaluated.
c. The contract specifications team is working on the location and specifications of the “Working Drawing Campus,” to be issued by addendum. This
specification provides for the collocation of Contractor and designer forces in the resolution of working drawing issues and will mitigate cost and
schedule risk.

Toll Bridge Program Oversight Committee
46
West Approach Contract Some of the main risk management developments on the West Approach project during the 4th quarter 2008 are: a. Caltrans and the Contractor have resolved all time
related costs through contract completion.
Continued resolution efforts are underway related to contractor controlled insurance program costs for the added change order work. Resolution is
expected the 1st Quarter of 2009. b. Community liaisons are working proactively with
neighbors to help prevent damage claims from
being brought against the project. c. Weekly meetings of project, City of San Francisco,
and the Contractor staff have been ongoing to
insure that all stakeholders can be satisfied with the project when it is accepted in the Spring of 2009.
ADEQUACY OF PROGRAM CONTINGENCY
Potential Draw on Program Contingency Each contract in design has an assigned contingency
allowance. A contract in construction has a remaining contingency, which is the difference between its budget
and the sum of bid items, state furnished materials, contract change orders and remaining supplemental
work. Capital outlay support has no identified contingency allowance. The total of the contingencies is the amount that is available to cover the risks of all
contracts, program risks, and capital outlay support risks. The amount by which the sum of all risks exceeds the total of all contingencies represents a
potential draw on the Program Contingency (Reserve). As of the end of the fourth quarter of 2008, the 50
percent probable draw on Program Contingency is $611 million, an increase of $27 million over the previous quarter, as shown in Figure 2 below. This
increase was primarily driven by accelerated YBI Detour work to achieve traffic switch on Labor Day weekend of 2009 and project completion in April of
2010. The potential draw ranges from about $450 million to $750 million. The Program Contingency is sufficient to cover identified risks but there is a small
probability that the potential draw could exceed the Program Contingency balance. Ongoing risk mitigation actions are being continuously developed and
implemented to reduce the potential draw on the Program Contingency.
FIGURE 2 – POTENTIAL DRAW ON PROGRAM CONTINGENCY
The curve in Figure 2 can be used to directly read off the probability of exceeding any value of cost. For example, there is about an 80 percent chance that the potential draw on Program Contingency (Reserve) will exceed $560 million while there is only about a 20 percent chance that it will exceed $660 million. Note that although the curve appears to reach a zero probability of overrun at about $750M, there is still less than a 1% chance of some cost greater than $750M. Note that the curve does not include risks or possible decisions that may materially change or “kill” the project. The $740.3 million TBPOC 4th Quarter of 2008 Approved Budget Program Contingency is sufficient to cover identified risks. Ongoing risk mitigation actions will continue to be developed and implemented to reduce the potential draw on Program Contingency.

First Quarter 2009 Project Progress and Financial Update
47
TOLL BRIDGE SEISMIC RETROFIT PROGRAM Financing Program
AB 144 consolidated the administration of all toll revenues collected on the state-owned Bay Area toll
bridges and financing of the TBSRP under the jurisdiction of BATA. BATA has direct programmatic responsibilities for the administration of all toll
revenues collected on the state-owned bridges in the Bay Area and responsibilities for financial management of the TBSRP program, including:
administrative responsibility for collection and accounting of all toll revenues
authorization to increase tolls on the state-owned
bridges by $1.00, effective January 1, 2007 project level toll-setting authority as necessary to
cover additional cost increases beyond the funded
program contingency in order to complete the TBSRP
assumption of funding all of the roadway and
bridge structure maintenance from Caltrans once bridge seismic retrofit projects are completed
In accordance with its responsibilities provided under the law, in September 2005 BATA adopted a finance plan for the TBSRP. The major components of the
finance plan include: issuing $6.2 billion in debt, including defeasance
of $1.5 billion in outstanding State Infrastructure
Bank (I-Bank) bonds and commercial paper increasing tolls on the state-owned bridges by
$1.00 (from $3.00 to $4.00 for two-axle vehicles),
effective January 1, 2007 securing the maximum amount of state funding
early in the construction schedule to most
efficiently use toll funds (see the following discussion concerning the California Transportation Commission (CTC) funding
schedule) locking in current interest rates to the extent
possible in order to improve the likelihood that the
entire toll program construction and the operations and maintenance can be delivered within the $4.00 auto toll level
In March 2006, BATA approved the issuance of $1.2 billion in bonds to defease the I-Bank bonds approved
in October 2005. Additionally, pursuant to the law, BATA held two public hearings - one in October and
one in November 2005 - to receive public testimony regarding the proposed $1.00 seismic surcharge toll
increase that began on January 1, 2007 on the state-owned toll bridges in the Bay Area. BATA approved the toll increase on January 25, 2006.
Pursuant to AB 144, on September 29, 2005, the CTC adopted a schedule, revised in December 2005, for
the transfer of state funds to BATA to fund the TBSRP. The schedule contains the timing and sources of the state contributions, which began in
Fiscal Year (FY) 2005-06, and distributes the contributions over the years of project construction to ensure a timely balance between state sources and
the contributions from toll funds. In December 2005, the CTC re-adopted the schedule to reflect opportunities maximizing the use of available PTA
funds and correct prior transfer transactions. The CTC’s December 2005 revised schedule for the transfer of funds allows BATA to pledge the state fund
contribution to the financing of the TBSRP per BATA’s adopted finance plan.
In June 2008, BATA refunded $500 million of the Series 2006 XL Capital auction rate bonds and variable rate demand notes. In July 2008, BATA was
requested to approve the refunding of $715 million in Ambac-insured bonds. The bonds were reissued as uninsured fixed rate bonds. The BATA total debt
portfolio is approximately $5.2 billion.
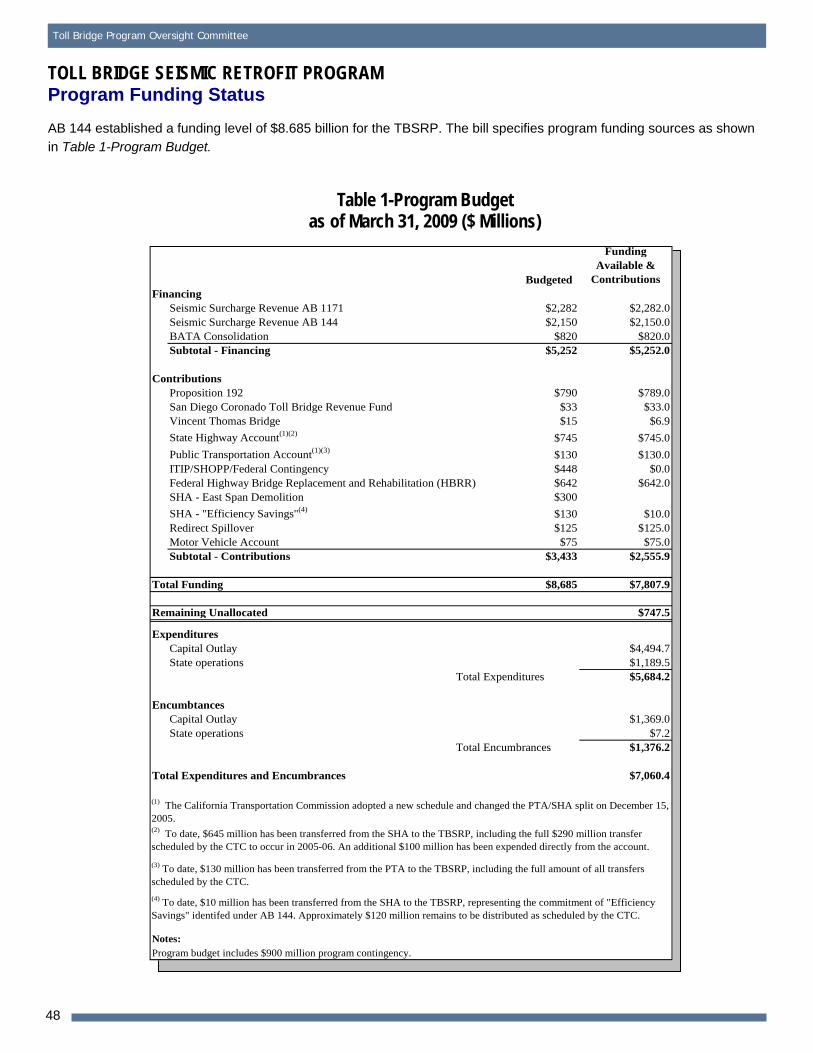
Toll Bridge Program Oversight Committee
48
TOLL BRIDGE SEISMIC RETROFIT PROGRAM
Program Funding Status
AB 144 established a funding level of $8.685 billion for the TBSRP. The bill specifies program funding sources as shown in Table 1-Program Budget.
Table 1-Program Budget as of March 31, 2009 ($ Millions)
Budgeted
Funding Available &
ContributionsFinancing
Seismic Surcharge Revenue AB 1171 $2,282 $2,282.0 Seismic Surcharge Revenue AB 144 $2,150 $2,150.0 BATA Consolidation $820 $820.0
Subtotal - Financing $5,252 $5,252.0
ContributionsProposition 192 $790 $789.0San Diego Coronado Toll Bridge Revenue Fund $33 $33.0Vincent Thomas Bridge $15 $6.9
State Highway Account(1)(2) $745 $745.0
Public Transportation Account(1)(3) $130 $130.0ITIP/SHOPP/Federal Contingency $448 $0.0Federal Highway Bridge Replacement and Rehabilitation (HBRR) $642 $642.0
SHA - East Span Demolition $300
SHA - "Efficiency Savings"(4) $130 $10.0 Redirect Spillover $125 $125.0 Motor Vehicle Account $75 $75.0
Subtotal - Contributions $3,433 $2,555.9
Total Funding $8,685 $7,807.9
Remaining Unallocated $747.5
ExpendituresCapital Outlay $4,494.7State operations $1,189.5
Total Expenditures $5,684.2
EncumbtancesCapital Outlay $1,369.0State operations $7.2
Total Encumbrances $1,376.2
Total Expenditures and Encumbrances $7,060.4
Notes: Program budget includes $900 million program contingency.
(1) The California Transportation Commission adopted a new schedule and changed the PTA/SHA split on December 15, 2005.
(4) To date, $10 million has been transferred from the SHA to the TBSRP, representing the commitment of "Efficiency Savings" identifed under AB 144. Approximately $120 million remains to be distributed as scheduled by the CTC.
(3) To date, $130 million has been transferred from the PTA to the TBSRP, including the full amount of all transfers scheduled by the CTC.
(2) To date, $645 million has been transferred from the SHA to the TBSRP, including the full $290 million transfer scheduled by the CTC to occur in 2005-06. An additional $100 million has been expended directly from the account.

First Quarter 2009 Project Progress and Financial Update
49
Source Description 2005-06 (Actual)
2006-07 (Actual)
2007-08 (Actual)
2008-09 2009-10 2010-11 2011-12 2012-13 2013-14 Total
AB 1171
SHA 290 290
PTA 80 40 120
Highway Bridge Replacement and Rehabilitation (HBRR )
100 100 100 42 342
Contingency 1 99 100 100 148 448
AB 144
SHA* 2 8 53 50 17 130
Motor Vehicle Account (MVA)
75 75
Spillover 125 125
SHA** 300 300
Total 547 273 100 43 99 153 150 165 300 1830
Summary of the Toll Bridge Oversight Committee (TBPOC) Expenses
Pursuant to Streets and Highways Code Section 30952.1 (d), expenses incurred by Caltrans, BATA, and the
California Transportation Commission (CTC) for costs directly related to the duties associated with the TBPOC are to be reimbursed by toll revenues. Table 3-Toll Bridge Program Oversight Committee Estimated Expenses: July 1, 2005 through March 31, 2009 shows expenses through March 31, 2009 for TBPOC functioning,
support, and monthly and quarterly reporting.
Table 3—Toll Bridge Program Oversight Committee Estimated Expenses: July 1, 2005 through March 31, 2009
($ Millions)
Agency/Program Activity Expenses
BATA 0.8
Caltrans 1.5
CTC 0.7
Reporting 2.7
Total Program 5.7
Table 2 - CTC Toll Bridge Seismic Retrofit Program Contributions Adopted December 2005
Schedule of Contributions to the Toll Bridge Seismic Retrofit Program ($ Millions)
* *Caltrans Efficiency Savings


Sei
smic
Ret
rofi
t o
f th
e D
um
bar
ton
an
d A
nti
och
Bri
dg
es

Toll Bridge Program Oversight Committee
52
The Dumbarton Bridge was opened to traffic in 1982 linking the cities of Newark in Alameda County and East Palo Alto
in San Mateo County. The 1.6-mile long bridge carries average daily traffic of nearly 60,000 vehicles over its six lanes and has an eight-foot bicycle/pedestrian lane to the
south. Though located between the San Andreas and Hayward
faults, the Dumbarton Bridge was not included in the Toll Bridge Seismic Retrofit Program based on evaluations made in the 1990s that concluded the bridge did not
warrant retrofitting. The bridge has since been reevaluated for seismic vulnerability based on more recent seismic engineering, which has shown the bridge to be susceptible
to damage from a major earthquake.
SEISMIC RETROFIT OF DUMBARTON AND ANTIOCH BRIDGES
Existing Dumbarton Bridge Looking East towards the Alameda County Foothills
Dumbarton Bridge Seismic Retrofit Project Project Status: In Design
Mock-up of Dumbarton Pier Columns Undergoing Seismic Testing

First Quarter 2009 Project Progress and Financial Update
53
Seismic Retrofit Strategy Summary for Dumbarton Bridge
Based on the vulnerability studies and a follow-up sensitivity analysis of seismic risk, Caltrans and BATA
decided to take steps towards retrofitting the Dumbarton bridge, even though full funding for the project has not yet been identified. Using BATA toll
bridge rehabilitation funding, a comprehensive seismic analysis of the bridge has commenced. This includes detailed geotechnical and geophysical investigations at
the bridge and the development of a seismic retrofit strategy and design plans.
The current retrofit strategy for the Dumbarton Bridge includes superstructure and deck modifications, plus strengthening of the over-land approach slab
structures. Additional activities are identified in the
attached diagram. The results of the seismic analysis and proposed retrofit strategy have been presented to
the Toll Bridge Seismic Safety Peer Review Panel. Status: The project team delivered 65 percent design
plans for review in March 2009. Complete plans and specifications are expected by the end of the year, with contract advertisement in 2010. The estimated cost of
the Dumbarton Bridge seismic retrofit is $637 million. Full funding for the retrofit work has not yet been identified; however, State Assemblyman Tom
Torlakson is sponsoring Bill AB1175 to amend the Toll Bridge Seismic Retrofit Program (TBSRP) to incorporate the Antioch and Dumbarton bridges and to
raise tolls to fund the project.

Toll Bridge Program Oversight Committee
54
Serving the Delta region of the Bay Area, the Antioch Bridge takes State Route 160 traffic over the San
Joaquin River linking eastern Contra Costa County with Sacramento County. The current bridge was opened in 1978 with one lane in each direction and carries an
average of over 10,000 vehicles a day. Approximately 1.8 miles long, the bridge is a steel girder support roadway on reinforced concrete columns and
foundations. Like the Dumbarton Bridge, the Antioch bridge was not
included in the Toll Bridge Seismic Retrofit Program based on evaluations made in the 1990s that concluded that the bridge did not warrant retrofitting.
The Antioch bridge has since been reevaluated for seismic vulnerability based on more recent seismic engineering, which has shown the bridge to be
susceptible to damage from a major earthquake.
SEISMIC RETROFIT OF DUMBARTON AND ANTIOCH BRIDGES
Antioch Bridge
Antioch Bridge Seismic Retrofit Project Project Status: In Design
Based on the vulnerability studies and a follow-up sensitivity analysis of seismic risk, Caltrans and BATA
decided to take steps towards the retrofitting the Antioch Bridge, even though full funding for the project has not yet be identified. Using BATA toll bridge
rehabilitation funding, a comprehensive seismic analysis of the bridge has commenced. This analysis includes detailed geotechnical and geophysical
investigation at the bridge and the development of a seismic retrofit strategy and design plans.
The current retrofit strategy for the Antioch Bridge includes relatively minor modifications to the approach structure on Sherman Island, addition of isolation
bearings, strengthening of the columns, and hinge retrofits. The results of the seismic analysis and proposed retrofit strategy have been presented to the
Toll Bridge Seismic Safety Peer Review Panel.
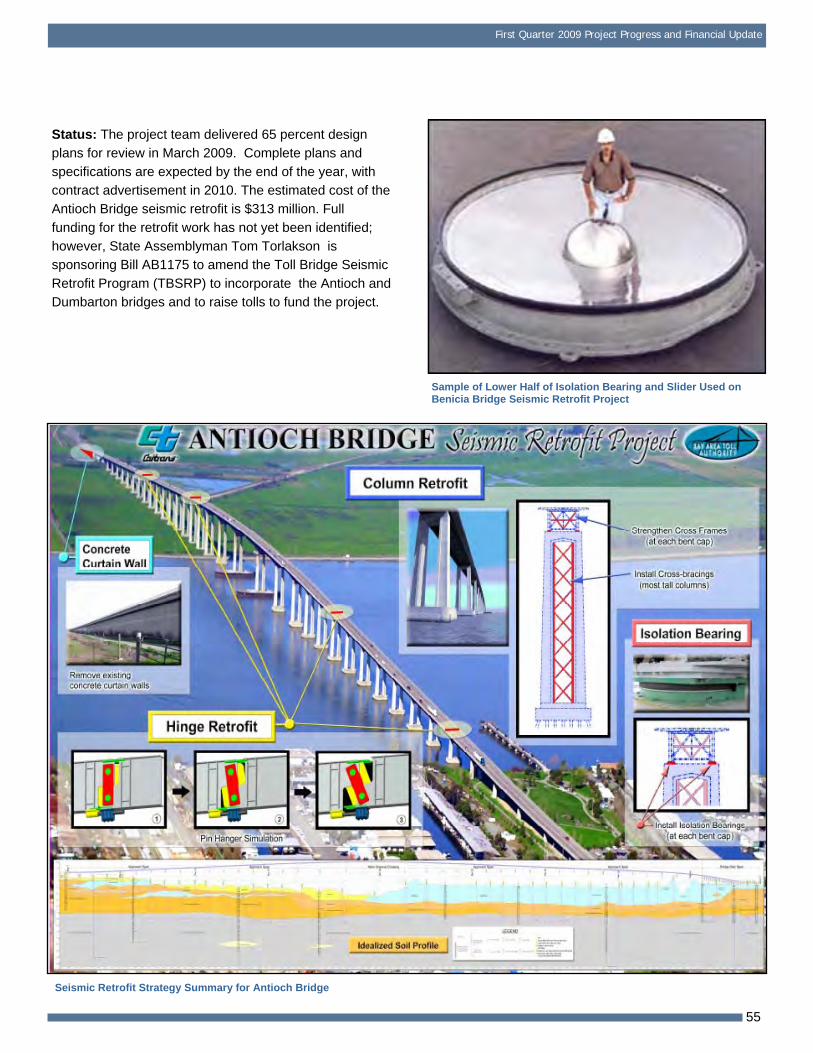
First Quarter 2009 Project Progress and Financial Update
55
Seismic Retrofit Strategy Summary for Antioch Bridge
Status: The project team delivered 65 percent design plans for review in March 2009. Complete plans and
specifications are expected by the end of the year, with contract advertisement in 2010. The estimated cost of the Antioch Bridge seismic retrofit is $313 million. Full
funding for the retrofit work has not yet been identified; however, State Assemblyman Tom Torlakson is sponsoring Bill AB1175 to amend the Toll Bridge Seismic
Retrofit Program (TBSRP) to incorporate the Antioch and Dumbarton bridges and to raise tolls to fund the project.
Sample of Lower Half of Isolation Bearing and Slider Used on Benicia Bridge Seismic Retrofit Project

Toll Bridge Program Oversight Committee
56
he Dumbarton Bridge
Seismic Retrofits of Dumbarton and Antioch Bridges
Project Cost and Schedule Summaries
2008 2009 20101 2 3 4 1 2 3 4 1 2 3 4
Milestone
PSR Phase
Begin Retrofit Strategy Study
Geotechnical Investigations
Geotechnical Investigations
Modeling and Analysis - As - Built
Draft As-Built Analysis Report Incl. Testing
Final As-Built Analysis Report
Environmental
Project Reports
Permits - Environmental
Agencies Permits
Right of Way
Office Engineering
Strategy Meeting
Submit Plan/Footprint for Permit
Retrofit Strategy Estimate
Final Strategy Report
65% Unchecked Detail
P & Q
Draft Structural PS&E
Structural PS&E
District PS&E
Ready to List
Advertise
Award
Testing
(Apr 06) cpt
(Jan08)
(Jan07-Jan08)
(Dec07-Feb08)
(Feb08-Apr08)
(Feb08-Sep08)
(Feb08-Jun09)
(Jan08-Sep09)
(August 22, 2008)
(September 1, 2008)
(Aug08-Oct08)
(Nov08-Dec08)
(March 11, 2009)
(May09)
(Jun09)
(Jul09)
(Aug09)
(Sep09-Nov09)
(Dec09-Mar10)
(April10)
(Apr08-Jun09)

First Quarter 2009 Project Progress and Financial Update
57
This Page Intentionally Left Blank


RE
GIO
NA
L M
EA
SU
RE
1 T
OL
L B
RID
GE
PR
OG
RA
M

Toll Bridge Program Oversight Committee
60
The new Congressman George Miller Bridge opened to traffic in August 2007 taking its place alongside the
existing 1962 Benicia-Martinez Bridge, which is named for Congressman Miller’s father, the late George Miller, Jr. The new bridge carries five lanes of
northbound Interstate 680 traffic, while the existing bridge is being upgraded to carry four lanes of southbound traffic and a new bicycle/pedestrian
pathway. Decades in the planning and construction, the new
bridge is designed to a “Lifeline” seismic design standard, expected to be available for emergency response vehicles soon after a major seismic event.
Constructed of lightweight concrete, the structure is one of the longest post-tensioned reinforced cast-in-place concrete bridges in the world. The new toll
plaza, relocated from Benicia to Martinez, features the Bay Area’s first FasTrak® express lanes, which vastly increase the throughput of vehicles using electronic
toll collection.
REGIONAL MEASURE 1 PROGRAM
A two-year project to rehabilitate and reconfigure the original Benicia-Martinez Bridge began shortly after
the opening of the new Congressman George Miller Bridge. The existing 1.2-mile roadway surface on the steel deck truss bridge is being modified to carry
four lanes of southbound traffic (one more than before) - with shoulders on both sides - plus a bicycle/pedestrian path on the west side of the span
that will connect to Park Road in Benicia and to Marina Vista Boulevard in Martinez. Stage 1 – Reconstruction of East Side of Bridge and Approaches
Completed in August 2008, this stage involved
removal of the old toll plaza on the Benicia side of the bridge, deck repairs on the east side of span, and repair of the roadway undulations on the
southern approach just south of the Marina Vista interchange.
New Benicia-Martinez Bridge Opened to Traffic in August 2007
New Benicia-Martinez Bridge Project Project Status: New Bridge Completed 2007
1962 Benicia-Martinez Bridge Reconstruction Contract Contractor: ACC/Top Grade, Joint Venture Approved Capital Outlay Budget: $59.5 M Status: 63% Complete
Bike Path to Vista Point on the North Side

First Quarter 2009 Project Progress and Financial Update
61
New Pedestrian/Bicycle Pathway Is under Construction on the West Side of the Existing Bridge
Stage 2 – Reconstruction of West Side of Bridge and Approaches and Construction of Bicycle/Pedestrian Pathway
This stage began after southbound traffic was shifted from the west side of the bridge to the newly refurbished east side. It involves repairing the west side bridge deck,
repairing undulations on the west side of the roadway in Martinez, demolishing obsolete I-680/I-780 interchange structures, realigning southbound Interstate 680 for four
lanes, and construction of the barrier separating traffic lanes from the bicycle/pedestrian path.
Status: Remaining tasks include raising the western portions of the Marina Vista interchange to bring the lanes into the proper alignment, completion of deck rehabilitation
work, repair of roadway undulations, and the addition of a new concrete barrier to separate pedestrians and bicyclists from vehicular traffic. The work is currently two months
ahead of schedule.
Bike Path North

Toll Bridge Program Oversight Committee
62
The Interstate 880/State Route 92 Interchange Reconstruction Project is the final project under the
Regional Measure 1 Toll Bridge Program. Project completion fulfills a promise made to Bay Area voters in 1988 to deliver a slate of projects that help expand
bridge capacity and improve safety on the bridges. This corridor is consistently one of the Bay Area’s most
congested during the evening commute. This is due in part to the lane merging and weaving that is required by the existing cloverleaf interchange. The new
interchange will feature direct freeway-to-freeway connector ramps that will increase traffic capacity and improve overall safety and traffic operations in the area.
With the new direct connector ramps, drivers coming off the San Mateo-Hayward Bridge can access Interstate 880 without having to compete with traffic
headed onto east Route 92 from south Interstate 880 (see progress photos on pages 86 and 87).
REGIONAL MEASURE 1 PROGRAM
Future Interstate 880/State Route 92 Interchange (as simulated) Looking West towards San Mateo.
Interstate 880/State Route 92 Interchange Reconstruction Project Project Status: Under Construction
Interstate 880/State Route 92 Interchange Reconstruction Contract Contractor: Flatiron/Granite Approved Capital Outlay Budget: $155.0 M Status: 45% Complete
New East Route 92 to North Interstate 880 Connector under Construction.

First Quarter 2009 Project Progress and Financial Update
63
Stage 1 – Construct East Route 92 to North Interstate 880 Connector
The new east Route 92 to north Interstate 880 connector (ENCONN) is the most critical flyover structure for relieving congestion in the corridor. The ENCONN will be first used
as a detour to allow for future stages of work, while keeping traffic flowing.
Status: The structure is nearly complete and is scheduled
to open to detour traffic in May 2009.
Stage 2 – Replace South Side of Route 92 Separation Structure
By detouring eastbound Route 92 traffic onto ENCONN, the existing separation structure that carries SR-92 over I-880
can be replaced. The separation structure needs to be elevated to accommodate east Route 92 to north Interstate 880 traffic under it without a loop alignment. The existing
structure will be cut lengthwise, and then demolished and replaced separately. In this stage, the south side of the structure will be replaced, while west Route 92 and south
Interstate 880 to east Route 92 traffic will stay on the remaining structure.
Status: Pending Stage 1.
Stage 3 – Replace North Side Route 92 Separation Structure
Upon completion of Stage 2, the existing north side of the separation structure will be demolished and replaced. Its traffic will then be shifted onto the newly reconstructed
south side.
Status: Pending Stage 2.
Stage 4 – Final Realignment and Other Work
Upon completion of the Route 92 separation structure, east Route 92 traffic can be shifted onto its permanent
alignment from the new ENCONN and directly under the new separation structure. Along with the ENCONN and Route 92 separation structures, several soundwalls, a
pedestrian overcrossing on I-880 at Eldridge Avenue and other ramps and structures will also be reconstructed as part of this project.
Status: The soundwalls in the northwest and southwest quadrants of the interchange are complete. Work continues on walls in the southeast and northeast quadrants, as well
as on the pedestrian overcrossing. Final realignment is pending Stage 3.
Stage 2 - Demolish and Replace South Side of Route 92 Separation Structure
Stage 1 - Construct East Route 92 to North Interstate 880 Direct Connector
Stage 4 - Final Realignment and Other Work
Stage 3 - Demolish and Replace North Side of Route 92 Separation Structure

Toll Bridge Program Oversight Committee
64
REGIONAL MEASURE 1 PROGRAM
Other Completed Projects
Richmond Parkway Construction Project Project Status: Completed 2001
San Mateo-Hayward Bridge Widening Project Project Status: Completed 2003
Richmond-San Rafael Bridge Rehabilitation Projects Project Status: Completed 2006
The final connections to the Richmond Parkway from Interstate 580 near the Richmond-San Rafael Bridge were
completed in May 2001.
This project expanded the low-rise concrete trestle section of the San Mateo-Hayward Bridge to allow for
three lanes in each direction to match the existing configuration of the high-rise steel section of bridge.
Two major rehabilitation projects for the Richmond-San Rafael Bridge were funded and completed:
(1) replacement of the western concrete approach trestle and ship-collision protection fender system; and (2) rehabilitation of deck joints and resurfacing of the
bridge deck. In 2005, along with the seismic retrofit of the bridge, the
trestle and fender replacement work was completed as part of the same project. Under a separate contract in 2006, the bridge was resurfaced with a polyester
concrete overlay along with the repair of numerous deck joints.
Widening of the San Mateo-Hayward Bridge Trestle on Left
New Richmond-San Rafael Bridge West Approach Trestle under Construction

First Quarter 2009 Project Progress and Financial Update
65
New Alfred Zampa Memorial (Carquinez) Bridge Project Project Status: Completed 2003
Bayfront Expressway (State Route 84) Widening Project Project Status: Completed 2004
The new western span of the Carquinez Bridge, which replaced the original 1927 span, is a twin-towered
suspension bridge with three mixed-flow lanes, a new carpool lane, shoulders and a bicycle and pedestrian pathway.
This project expanded and improved the roadway from the Dumbarton Bridge touchdown to the U.S. 101/Marsh Road
interchange by adding additional lanes and turn pockets and improving bicycle and pedestrian access in the area.
New Alfred Zampa Memorial (Carquinez) Bridge Soon after Opening to Traffic with Crockett Interchange Still under Construction.

Toll Bridge Program Oversight Committee
66
East Tie-In Truss structure under Construction atop Skid Beams

First Quarter 2009 Project Progress and Financial Update
67
A. TBSRP AB144/SB 66 Baseline Budget, Forecasts and Expenditures through March 31, 2009 (A-1 and A-2)…………………….………………………………………………….68
B. TBSRP (SFOBB East Span Only) AB 144/SB 66 Baseline Budget, Forecasts and Expenditures Through March 31, 2009 ……………………………………….……………….70
C. Regional Measure 1 Program Cost Detail…………………………………………………………...72
D. Yerba Buena Island Transition Structures (YBITS) Advanced Work Project Progress Diagram…………………………………………………………………………….……..75
E. Oakland Touchdown (OTD) #1 Program Diagram………………………………………………….76
F. Project Photos…………………………………………………………………………………………..77
G. Glossary of Terms ……………………………………………………………………………………..88
APPENDICES

Toll Bridge Program Oversight Committee
68
Appendix A-1: TBSRP AB 144/SB 66 Baseline Budget, Forecasts and Expenditures Through March 31, 2009
Note: Details may not sum to totals due to rounding effects.
Notes: * Budget for Richmond-San Rafael Bridge includes $16.9 million of deck joint rehabilitation work that is considered to be eligible for seismic retrofit program funding.
AB 144/SB 66 TBPOC Current Fourth Quarter First Quarter Cost Variance Forecast Variance ExpendituresBridge Baseline Approved 2008 2009 ( 1st Q09 - 4th Q08) Through
Budget Forecast Forecast Mar 2009a b c d e f = e - c g = e - d h
Benicia-MartinezCapital Outlay Support 38.1 38.1 38.1 38.1 - - 38.1 Capital Outlay 139.7 139.7 139.7 139.7 - - 139.7 Total 177.8 177.8 177.8 177.8 - - 177.8
CarquinezCapital Outlay Support 28.7 28.7 28.7 28.7 - - 28.8 Capital Outlay 85.5 85.5 85.5 85.5 - - 85.4 Total 114.2 114.2 114.2 114.2 - - 114.2
San Mateo-HaywardCapital Outlay Support 28.1 28.1 28.1 28.1 - - 28.1 Capital Outlay 135.4 135.4 135.4 135.4 - - 135.3 Total 163.5 163.5 163.5 163.5 - - 163.4
Vincent ThomasCapital Outlay Support 16.4 16.4 16.4 16.4 - - 16.4 Capital Outlay 42.1 42.1 42.1 42.1 - - 42.0 Total 58.5 58.5 58.5 58.5 - - 58.4
San Diego-CoronadoCapital Outlay Support 33.5 33.5 33.5 33.5 - - 33.2 Capital Outlay 70.0 70.0 70.0 70.0 - - 69.4 Total 103.5 103.5 103.5 103.5 - - 102.6
Richmond-San Rafael Capital Outlay Support 134.0 127.0 127.0 127.0 - - 126.7 Capital Outlay 780.0 689.5 689.5 689.5 - - 668.1 *Total 914.0 816.5 816.5 816.5 - - 794.8
West Span RetrofitCapital Outlay Support 75.0 75.0 75.0 75.0 - - 74.8 Capital Outlay 232.9 232.9 232.9 232.9 - - 227.2 Total 307.9 307.9 307.9 307.9 - - 302.0
West ApproachCapital Outlay Support 120.0 120.0 120.0 120.0 - - 114.8 Capital Outlay 309.0 350.7 350.7 350.7 - - 318.6 Total 429.0 470.7 470.7 470.7 - - 433.4
SFOBB East SpanCapital Outlay Support 959.3 959.3 977.1 1,173.8 214.5 196.7 703.9 Capital Outlay 4,492.2 4,711.0 4,745.2 5,014.4 303.4 269.2 2,808.3 Other Budgeted Capital 35.1 31.8 7.7 7.7 (24.1) - 0.7 Total 5,486.6 5,702.1 5,730.0 6,195.9 493.8 465.9 3,512.9
Miscellaneous Program Costs 30.0 30.0 30.0 30.0 - - 24.7 Subtotal Capital Outlay Support 1,463.1 1,456.1 1,473.9 1,670.6 214.5 196.7 1,189.5 Subtotal Capital Outlay 6,321.9 6,488.6 6,498.7 6,767.9 279.3 269.2 4,494.7 Subtotal Toll Seismic Retrofit 7,785.0 7,944.7 7,972.6 8,438.5 493.8 465.9 5,684.2 Net Programmatic Risks - - - 117.2 117.2 117.2 - Program Contingency 900.0 740.3 712.4 129.3 (611.0) (583.1) -
Total Toll Seismic Retrofit Program 8,685.0 8,685.0 8,685.0 8,685.0 - - 5,684.2
($ in millions)

First Quarter 2009 Project Progress and Financial Update
69
Appendix A-2: TBSRP AB 144/SB 66 Baseline Budget, Forecasts and Expenditures Through March 31, 2009
AB 144 Baseline TBPOC Current Expenditures to date and Estimated Costs not yet Total Forecast Bridge Budget Approved Budget Encumbrances Spent or Encumbered as of Mar 2009
as of Mar 2009 as of Mar 2009See Note (1)
a b c d e f = d + eOther Completed Projects
Capital Outlay Support 144.9 144.9 144.6 0.3 144.9 Capital Outlay 472.6 472.6 472.6 0.1 472.7 Total 617.5 617.5 617.2 0.4 617.6
Richmond-San RafaelCapital Outlay Support 134.0 127.0 126.7 0.3 127.0 Capital Outlay 698.0 689.5 674.8 14.7 689.5 Project Reserves 82.0 - - - - Total 914.0 816.5 801.5 15.0 816.5
West Span RetrofitCapital Outlay Support 75.0 75.0 74.8 0.2 75.0 Capital Outlay 232.9 232.9 232.7 0.2 232.9 Total 307.9 307.9 307.5 0.4 307.9
West ApproachCapital Outlay Support 120.0 120.0 115.9 4.1 120.0 Capital Outlay 309.0 350.7 342.5 8.2 350.7 Total 429.0 470.7 458.4 12.3 470.7
SFOBB East Span -SkywayCapital Outlay Support 197.0 181.0 181.7 (0.6) 181.1 Capital Outlay 1,293.0 1,254.1 1,412.1 (158.0) 1,254.1 Total 1,490.0 1,435.1 1,593.8 (158.6) 1,435.2
SFOBB East Span -SAS- SuperstructureCapital Outlay Support 214.6 214.6 141.5 239.2 380.7 Capital Outlay 1,753.7 1,753.7 1,649.6 331.5 1,981.1 Total 1,968.3 1,968.3 1,791.1 570.7 2,361.8
SFOBB East Span -SAS- FoundationsCapital Outlay Support 62.5 41.0 37.6 1.0 38.6 Capital Outlay 339.9 307.3 308.7 (1.4) 307.3 Total 402.4 348.3 346.3 (0.4) 345.9
Small YBI ProjectsCapital Outlay Support 10.6 10.6 10.2 0.4 10.6 Capital Outlay 15.6 15.6 16.2 (0.5) 15.7 Total 26.2 26.2 26.4 (0.1) 26.3
YBI DetourCapital Outlay Support 29.5 66.0 61.2 24.3 85.5 Capital Outlay 131.9 442.2 442.4 84.3 526.7 Total 161.4 508.2 503.6 108.6 612.2
YBI - Transition StructuresCapital Outlay Support 78.7 78.7 16.4 88.7 105.1 Capital Outlay 299.4 276.1 0.1 277.9 278.0 Total 378.1 354.8 16.5 366.6 383.1
Oakland TouchdownCapital Outlay Support 74.4 74.4 55.3 43.3 98.6 Capital Outlay 283.8 283.8 218.0 72.6 290.6 Total 358.2 358.2 273.3 115.9 389.2
East Span Other Small ProjectCapital Outlay Support 212.3 213.3 205.1 8.4 213.5 Capital Outlay 170.8 170.8 94.0 52.6 146.6 Total 383.1 384.1 299.1 61.0 360.1
Existing Bridge DemolitionCapital Outlay Support 79.7 79.7 0.4 59.6 60.0 Capital Outlay 239.2 239.2 - 222.0 222.0 Total 318.9 318.9 0.4 281.6 282.0
Miscellaneous Program Costs 30.0 30.0 25.3 4.7 30.0 Total Capital Outlay Support (2) 1,463.2 1,456.2 1,196.7 473.9 1,670.6 Total Capital Outlay 6,321.8 6,488.5 5,863.7 904.2 6,767.9 Program Total 7,785.0 7,944.7 7,060.4 1,378.1 8,438.5
(1). Funds allocated to project or contract for Capital Outlay and Support needs includes Capital Outlay Support total allocation for FY 06/07.
(2). BSA provided a distribution of program contingency in December 2004 based on Bechtel Infrastructure Corporation input.
This column is subject to revision upon completion of Department's risk assessment update.
(3). Total Capital Outlay Support includes program indirect costs.
($ in millions)
Note: Details may not sum to totals due to rounding effects.

Toll Bridge Program Oversight Committee
70
Appendix B: TBSRP (SFOBB East Span Only) AB 144/SB 66 Baseline Budget, Forecasts and Expenditures Through March 31, 2009
AB 144/SB 66 TBPOC Current Fourth Quarter 2008 First Quarter 2009 Cost Variance Forecast Variance Expenditures East Span Contract Baseline Approved Budget Forecast Forecast (1st Q09 - 4th Q08) Through
See Note (1) Mar 2009a b c d e f = e - c g = e - d h
SFOBB East Span -SkywayCapital Outlay Support 197.0 181.0 181.0 181.1 0.1 0.1 181.1 Capital Outlay 1,293.0 1,254.1 1,254.1 1,254.1 - - 1,236.8 Total 1,490.0 1,435.1 1,435.1 1,435.2 0.1 0.1 1,417.9
SFOBB East Span -SAS- E2/T1 FoundationsCapital Outlay Support 52.5 31.0 31.0 28.6 (2.4) (2.4) 28.4 Capital Outlay 313.5 280.9 280.9 280.9 - - 275.0 Total 366.0 311.9 311.9 309.5 (2.4) (2.4) 303.4
SFOBB East Span -SAS- SuperstructureCapital Outlay Support 214.6 214.6 214.6 380.7 166.1 166.1 138.8 Capital Outlay 1,753.7 1,753.7 1,767.4 1,981.1 227.4 213.7 677.6 Total 1,968.3 1,968.3 1,982.0 2,361.8 393.5 379.8 816.4
SFOBB East Span -SAS- W2 FoundationsCapital Outlay Support 10.0 10.0 10.0 10.0 - - 9.2 Capital Outlay 26.4 26.4 26.4 26.4 - - 25.8 Total 36.4 36.4 36.4 36.4 - - 35.0
YBI DetourCapital Outlay Support 29.4 66.0 66.0 85.5 19.5 19.5 60.0 Capital Outlay 132.0 442.2 461.2 526.7 84.5 65.5 300.7 Total 161.4 508.2 527.2 612.2 104.0 85.0 360.7
YBI - Transition Structures (Total, including the following split contracts and prior-to-split expenses)Capital Outlay Support 78.7 78.7 78.7 105.1 26.4 26.4 23.7 Capital Outlay 299.3 276.1 276.1 278.0 1.9 1.9 - Total 378.0 354.8 354.8 383.1 28.3 28.3 23.7
YBI- Transition Structures Contract No. 1Capital Outlay Support 45.0 64.7 - 19.7 4.7 Capital Outlay 214.3 215.3 - 1.0 - Total 259.3 280.0 - 20.7 4.7
YBI- Transition Structures Contract No. 2Capital Outlay Support 16.0 23.4 - 7.4 2.7 Capital Outlay 58.5 59.4 - 0.9 - Total 74.5 82.8 - 8.3 2.7
YBI- Transition Structures Contract No. 3 - LandscapeCapital Outlay Support 1.0 1.0 - - - Capital Outlay 3.3 3.3 - - - Total 4.3 4.3 - - -
Oakland Touchdown (Total, including the following split contracts and prior-to-split expenses)Capital Outlay Support 74.4 74.4 92.1 98.6 24.2 6.5 54.4 Capital Outlay 283.8 283.8 302.5 290.6 6.8 (11.9) 161.2 Total 358.2 358.2 394.6 389.2 31.0 (5.4) 215.6
Oakland Touchdown Contract - Submarine CableCapital Outlay Support - - 3.0 0.9 - (2.1) 0.9 Capital Outlay - - 9.6 9.6 - - 7.9 Total - - 12.6 10.5 - (2.1) 8.8
Oakland Touchdown Contract No. 1 (Westbound)Capital Outlay Support - - 49.9 53.3 - 3.4 30.3 Capital Outlay - - 226.5 214.6 - (11.9) 153.3 Total - - 276.4 267.9 - (8.5) 183.6
Oakland Touchdown Contract No. 2 (Eastbound)Capital Outlay Support - - 15.8 20.8 - 5.0 2.5 Capital Outlay - - 62.0 62.0 - - - Total - - 77.8 82.8 - 5.0 2.5
Oakland Touchdown Contract - Electrical SystemsCapital Outlay Support - - 1.4 1.5 - 0.1 0.8 Capital Outlay - - 4.4 4.4 - - - Total - - 5.8 5.9 - 0.1 0.8
($ millions)
Note: Details may not sum to totals due to rounding effects.

First Quarter 2009 Project Progress and Financial Update
71
Appendix B: TBSRP (SFOBB East Span Only) AB 144/SB 66 Baseline Budget, Forecasts and Expenditures Through March 31, 2009 (cont.)
Note: Details may not sum to totals due to rounding effects.
AB 144/SB 66 TBPOC Current Fourth Quarter 2008 First Quarter 2009 Cost Variance Forecast Variance Expenditures East Span Contract Baseline Approved Budget Forecast Forecast (1st Q09 - 4th Q08) Through
See Note (1) Mar 2009a b c d e f = e - c g = e - d h
YBI/SAS (Archeology)Capital Outlay Support 1.1 1.1 1.1 1.1 - - 1.1 Capital Outlay 1.1 1.1 1.1 1.1 - - 1.1 Total 2.2 2.2 2.2 2.2 - - 2.2
YBI - USCG Rd RelocationCapital Outlay Support 3.0 3.0 3.0 3.0 - - 2.7 Capital Outlay 3.0 3.0 3.0 3.0 - - 2.8 Total 6.0 6.0 6.0 6.0 - - 5.5
YBI - Substation and ViaductCapital Outlay Support 6.5 6.5 6.5 6.5 - - 6.4 Capital Outlay 11.6 11.6 11.6 11.6 - - 11.3 Total 18.1 18.1 18.1 18.1 - - 17.7
Oakland GeofillCapital Outlay Support 2.5 2.5 2.5 2.5 - - 2.5 Capital Outlay 8.2 8.2 8.2 8.2 - - 8.2 Total 10.7 10.7 10.7 10.7 - - 10.7
Pile Installation Demonstration ProjectCapital Outlay Support 1.8 1.8 1.8 1.8 - - 1.8 Capital Outlay 9.2 9.2 9.2 9.2 - - 9.2 Total 11.0 11.0 11.0 11.0 - - 11.0
Existing Bridge DemolitionCapital Outlay Support 79.7 79.7 79.7 60.0 (19.7) (19.7) 0.4 Capital Outlay 239.2 239.2 222.0 222.0 (17.2) - - Total 318.9 318.9 301.7 282.0 (36.9) (19.7) 0.4
Stormwater Treatment MeasuresCapital Outlay Support 6.0 8.0 8.0 8.2 0.2 0.2 8.1 Capital Outlay 15.0 18.3 18.3 18.3 - - 16.7 Total 21.0 26.3 26.3 26.5 0.2 0.2 24.8
Right-of-way and Environmental MitigationCapital Outlay Support - - - - - - - Capital Outlay 72.4 72.4 72.4 72.4 - - 51.1 Total 72.4 72.4 72.4 72.4 - - 51.1
Sunk Cost - Existing East Span RetrofitCapital Outlay Support 39.5 39.5 39.5 39.5 - - 39.5 Capital Outlay 30.8 30.8 30.8 30.8 - - 30.8 Total 70.3 70.3 70.3 70.3 - - 70.3
Environmental Phase (Expended)Capital Outlay Support 97.7 97.7 97.7 97.7 - - 97.7
Project Expenditures, Pre-splits - Capital Outlay Support 44.9 44.9 44.9 44.9 - - 44.9
Non-project Specific CostsCapital Outlay Support 20.0 19.0 19.0 19.0 - - 3.2
Subtotal East Span Capital Outlay Support 959.3 959.3 977.1 1,173.8 214.5 196.7 703.9 Subtotal East Span Capital Outlay and Sunk Costs 4,492.2 4,711.0 4,745.2 5,014.4 303.4 269.2 2,808.3 Other Budgeted Capital 35.1 31.8 7.7 7.7 (24.1) - 0.7
Total SFOBB East Span 5,486.6 5,702.1 5,730.0 6,195.9 493.8 465.9 3,512.9
(1) Current contract allotment to install two submarine electrical cables is $11.5 million. Additional non-program funding to support this allocation beyond the $9.6 million of available programs funds has been made available by the Treasure Island Development Authority.
($ millions)

Toll Bridge Program Oversight Committee
72
Appendix C: Regional Measure 1 Program Cost Detail ($ Millions)
ProjectEA
Number
BATA Budget
(07/2005) Approved Changes
Current Approved
Budget (03/2009)
Cost To Date
(03/2009)
Cost Forecast (03/2009)
At-Completion
Variance a b c d e = c + d f g h = g - e
New Benicia-Martinez Bridge ProjectNew Bridge 00603_
84.9 6.7 91.6 91.7 91.6 - - -
661.9 94.6 756.5 753.8 756.5 - 10.1 - 10.1 10.1 10.1 -
Subtotal 672.0 94.6 766.6 763.9 766.6 - 756.9 101.3 858.2 855.6 858.2 -
I-680/I-780 Interchange Reconstruction 00606_
24.9 5.2 30.1 30.1 30.1 - 1.4 5.2 6.6 6.3 6.6 -
26.3 10.4 36.7 36.4 36.7 -
54.7 26.9 81.6 77.1 81.6 - 21.6 - 21.6 21.7 21.6 - 76.3 26.9 103.2 98.8 103.2 -
102.6 37.3 139.9 135.2 139.9 -
I-680/Marina Vista Interchange Reconstruction 00605_18.3 1.8 20.1 20.0 20.1 - 51.5 4.9 56.4 56.1 56.4 - 69.8 6.7 76.5 76.1 76.5 -
New Toll Plaza and Administration Building 00604_11.9 3.8 15.7 15.7 15.7 - 24.3 2.0 26.3 25.1 26.3 - 36.2 5.8 42.0 40.8 42.0 -
Existing Bridge & Interchange Modifications 0060A_Capital Outlay Support 4.3 14.3 18.6 15.1 18.6 -
17.2 32.8 50.0 23.1 50.0 - - 9.5 9.5 - 9.5 -
17.2 42.3 59.5 23.1 59.5 - 21.5 56.6 78.1 38.2 78.1 -
Other Contracts See note below11.4 (1.8) 9.6 7.9 9.6 - 20.3 2.8 23.1 16.6 23.1 - 20.4 (0.1) 20.3 17.0 20.3 - 52.1 0.9 53.0 41.5 53.0 -
Subtotal BATA Capital Outlay Support 155.7 30.0 185.7 180.5 185.7 - Subtotal BATA Capital Outlay Construction 829.9 164.0 993.9 951.8 993.9 - Subtotal Capital Outlay Right-of-Way 20.4 (0.1) 20.3 17.0 20.3 - Subtotal Non-BATA Capital Outlay Support 1.4 5.2 6.6 6.3 6.6 - Subtotal Non-BATA Capital Outlay Construction 31.7 9.5 41.2 31.8 41.2 - Project Reserves 20.8 4.0 24.8 - 24.8 -
Total New Benicia-Martinez Bridge Project 1,059.9 212.6 1,272.5 1,187.4 1,272.5 -
Notes: Includes EA's 00601_,00603_,00605_,00606_, 00608_, 00609_, 0060A_, 0060C_, 0060E_, 0060F_, 0060G_, and 0060H_ and all Project Right-of-Way
Capital Outlay ConstructionTotal
Capital Outlay Support
Capital Outlay ConstructionBATA FundingNon-BATA Funding
SubtotalTotal
Capital Outlay ConstructionCapital Outlay Right-of-Way
Total
Non-BATA Funding
Capital Outlay SupportCapital Outlay Construction
BATA FundingNon-BATA Funding
Total
Capital Outlay Support
TotalCapital Outlay Construction
Subtotal
Total
Capital Outlay Support
Capital Outlay Support
BATA FundingNon-BATA Funding
SubtotalCapital Outlay Construction
BATA Funding
Note: Details may not sum to totals due to rounding effects.

First Quarter 2009 Project Progress and Financial Update
73
Appendix C: Regional Measure 1 Program Cost Detail ($ Millions) (Continued)
Note: Details may not sum to totals due to rounding effects.
ProjectEA
Number
BATA Budget
(07/2005) Approved Changes
Current Approved
Budget (03/2009)
Cost To Date
(03/2009)
Cost Forecast (03/2009)
At-Completion
Variance a b c d e = c + d f g h = g - e
Carquinez Bridge Replacement ProjectNew Bridge 01301_
Capital Outlay Support 60.5 (0.3) 60.2 60.2 60.2 - Capital Outlay Construction 253.3 4.0 257.3 255.9 257.3 -
Total 313.8 3.7 317.5 316.1 317.5 -
Crockett Interchange Reconstruction 01305_Capital Outlay Support 32.0 (0.1) 31.9 31.9 31.9 - Capital Outlay Construction 73.9 - 73.9 71.9 73.9 -
Total 105.9 (0.1) 105.8 103.8 105.8 -
Existing 1927 Bridge Demolition 01309_Capital Outlay Support 16.1 - 16.1 15.5 15.5 (0.6) Capital Outlay Construction 35.2 - 35.2 34.8 35.2 -
Total 51.3 - 51.3 50.3 50.7 (0.6)
Other Contracts See note belowCapital Outlay Support 15.8 0.2 16.0 16.3 16.3 0.3 Capital Outlay Construction 18.8 (0.8) 18.0 16.1 18.1 0.1 Capital Outlay Right-of-Way 10.5 - 10.5 9.9 10.5 -
Total 45.1 (0.6) 44.5 42.3 44.9 0.4
Subtotal BATA Capital Outlay Support 124.4 (0.2) 124.2 123.9 123.9 (0.3) Subtotal BATA Capital Outlay Construction 381.2 3.2 384.4 378.7 384.5 0.1 Subtotal Capital Outlay Right-of-Way 10.5 - 10.5 9.9 10.5 - Project Reserves 12.1 (3.0) 9.1 - 0.3 (8.8)
Total Carquinez Bridge Replacement Project 528.2 - 528.2 512.5 519.2 (9.0)
Notes: Other Contracts includes EA's 01301_,01302_, 01303_, 01304_,01305_, 01306_, 01307_, 01308_, 01309_,0130A_, 0130C_, 0130D_ , 0130F_, 0130G_, 0130H_, 0130J_, 00453_, 00493_, 04700_, 00607_, 2A270_, and 29920_ and all Project Right-of-Way

Toll Bridge Program Oversight Committee
74
Appendix C: Regional Measure 1 Program Cost Detail ($ Millions) (Continued)
Note: Details may not sum to totals due to rounding effects.
Project EA Number
BATA Budget
(07/2005) Approved Changes
Current Approved
Budget (03/2009)
Cost To Date
(03/2009)
Cost Forecast (03/2009)
At-Completion
Variance a b c d e = c + d f g h = g - e
Richmond-San Rafael Bridge Trestle, Fender, and Deck Joint Rehabilitation See note 1 belowCapital Outlay Support
BATA Funding 2.2 - 2.2 1.4 2.2 - Non-BATA Funding 8.6 - 8.6 10.4 10.4 1.8
Subtotal 10.8 - 10.8 11.8 12.6 1.8 Capital Outlay Construction
BATA Funding 40.2 - 40.2 33.4 33.4 (6.8) Non-BATA Funding 51.1 - 51.1 51.1 51.1 -
Subtotal 91.3 - 91.3 84.5 84.5 (6.8) Project Reserves - - - - - -
Total 102.1 - 102.1 96.3 97.1 (5.0)
Richmond-San Rafael Bridge Deck Overlay Rehabilitation 04152_Capital Outlay Support
BATA Funding 4.0 (0.4) 3.6 3.3 3.6 - Non-BATA Funding 4.0 (4.0) - - - -
Subtotal 8.0 (4.4) 3.6 3.3 3.6 - Capital Outlay Construction 16.9 3.6 20.5 16.3 16.2 (4.3) Project Reserves 0.1 0.8 0.9 - 5.2 4.3
Total 25.0 - 25.0 19.6 25.0 - Richmond Parkway Project (RM 1 Share Only) Non-Caltrans
Capital Outlay Support - - - - - - Capital Outlay Construction 5.9 - 5.9 4.3 5.9 -
Total 5.9 - 5.9 4.3 5.9 - San Mateo-Hayward Bridge Widening See note 2 below
Capital Outlay Support 34.6 (0.3) 34.3 34.1 34.3 - Capital Outlay Construction 180.2 - 180.2 174.1 176.2 (4.0) Capital Outlay Right-of-Way 1.5 - 1.5 0.5 0.6 (0.9) Project Reserves 1.5 0.3 1.8 - 0.8 (1.0)
Total 217.8 - 217.8 208.7 211.9 (5.9) I-880/SR-92 Interchange Reconstruction
Capital Outlay Support 28.8 26.2 55.0 46.1 55.0 - Capital Outlay Construction
BATA Funding 85.2 60.2 145.4 58.0 145.4 - Non-BATA Funding 9.6 - 9.6 - 9.6 -
Subtotal 94.8 60.2 155.0 58.0 155.0 - Capital Outlay Right-of-Way 9.9 7.0 16.9 11.6 16.9 - Project Reserves 0.3 17.8 18.1 - 18.1 -
Total 133.8 111.2 245.0 115.7 245.0 - Bayfront Expressway Widening
Capital Outlay Support 8.6 (0.3) 8.3 8.3 8.2 (0.1) Capital Outlay Construction 26.5 - 26.5 24.9 26.5 - Capital Outlay Right-of-Way 0.2 - 0.2 0.2 0.2 - Project Reserves 0.8 0.3 1.1 - 1.1 -
Total 36.1 - 36.1 33.4 36.0 (0.1) US 101/University Avenue Interchange Modification
Capital Outlay Support - - - - - - Capital Outlay Construction 3.8 - 3.8 3.7 3.8 - Total 3.8 - 3.8 3.7 3.8 -
Subtotal BATA Capital Outlay Support 358.3 55.0 413.3 397.6 412.9 (0.4) Subtotal BATA Capital Outlay Construction 1,569.8 231.0 1,800.8 1,645.2 1,785.8 (15.0) Subtotal Capital Outlay Right-of-Way 42.5 6.9 49.4 39.2 48.5 (0.9) Subtotal Non-BATA Capital Outlay Support 14.0 1.2 15.2 16.7 17.0 1.8 Subtotal Non-BATA Capital Outlay Construction 92.4 9.5 101.9 82.9 101.9 - Project Reserves 35.6 20.2 55.8 - 50.3 (5.5)
2,112.6 323.8 2,436.4 2,181.6 2,416.4 (20.0)
Notes:
2 San Mateo-Hayward Bridge Widening Includes EA's 00305_, 04501_, 04502_, 04503_, 04504_, 04505_, 04506_, 04507_, 04508_, 04509_, 27740_, 27790_, 04860_
EA's 23317_, 01601_, and 01602_
Non-Caltrans
EA's 00487_, 01511_, and 01512_
1 Richmond-San Rafael Bridge Trestle, Fender, and Deck Joint Rehabilitation Includes Non-TBSRA Expenses for EA 0438U_ and 04157_
Total RM1 Program

First Quarter 2009 Project Progress and Financial Update
75
Appendix D: YBITS Advanced Work Project Progress Diagram

Toll Bridge Program Oversight Committee
76
Appendix E: OTD #1 Program Diagram
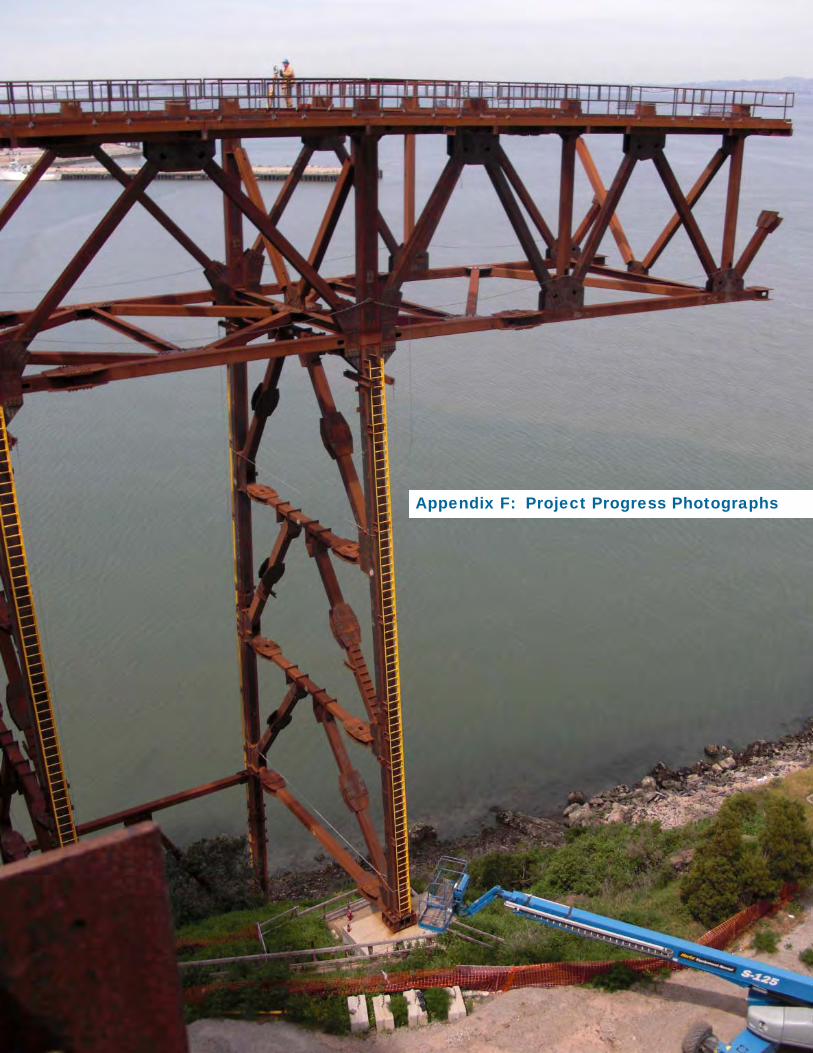
First Quarter 2009 Project Progress and Financial Update
77
Appendix F: Project Progress Photographs

Toll Bridge Program Oversight Committee
78
Yerba Buena Island Detour
Temporary Towers Looking from W2 to the East
East Tie-In Truss Structure Support
Appendix F: Project Progress Photographs
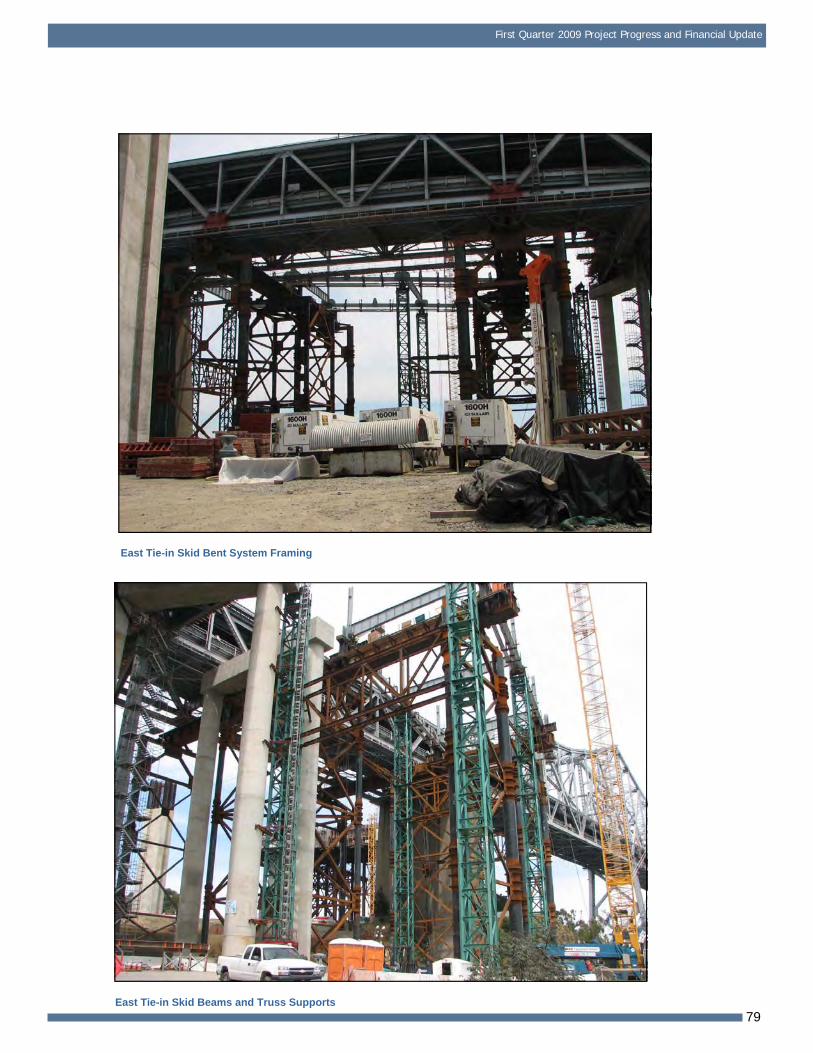
First Quarter 2009 Project Progress and Financial Update
79
East Tie-in Skid Bent System Framing
East Tie-in Skid Beams and Truss Supports

Toll Bridge Program Oversight Committee
80
CB1 Assembly in Bay 1
Bike Path Bracket Assembly in Bay 5
Self-Anchored Suspension Bridge Fabrication
Appendix F: Project Progress Photographs

First Quarter 2009 Project Progress and Financial Update
81
Overview of 1 BW Assembly in Bay 13
Overview of East Jig in Bay 14

Toll Bridge Program Oversight Committee
82
East, Lift 1, repairs and prep to go outside
West, Lift 1 welding
East, Lift 2 welding
Strut welding
West, Lift 2 welding
Self-Anchored Suspension Bridge Fabrication
Appendix F: Project Progress Photographs

First Quarter 2009 Project Progress and Financial Update
83
South, Lift 1, repairs and prep to go outside
North, Lift 1 welding
North, Lift 2, ready for rotisserie
Strut welding
Base Plate Fit-up welding not started yet
Rotisserie Set-up future home of north Lift 2

Toll Bridge Program Oversight Committee
84
Westbound Precast Panels Installed
Completed Frame Two Pre-Stressing
Oakland Touchdown
Appendix F: Project Progress Photographs

First Quarter 2009 Project Progress and Financial Update
85
OTD #1 Westbound Barrier Lighting Conduit and Poles Installation

Toll Bridge Program Oversight Committee
86
Work at Eldridge Avenue
Work at Eldridge Avenue
92/880 Interchange
Appendix F: Project Progress Photographs

First Quarter 2009 Project Progress and Financial Update
87
Overview of 92/880 Interchange

Toll Bridge Program Oversight Committee
88
Appendix G: Glossary of Terms
AB144/SB 66 BUDGET: The planned allocation of resources for the Toll Bridge Seismic Retrofit Program, or subordinate projects or contracts, as provided in Assembly Bill 144 and Senate Bill 66, signed into law
by Governor Schwarzenegger on July 18, 2005 and September 29, 2005, respectively.
BATA BUDGET: The planned allocation of resources for the Regional Measure 1 Program, or subordinate
projects or contracts as authorized by the Bay Area Toll Authority as of June 2005.
APPROVED CHANGES: For cost, changes to the AB144/SB 66 Budget or BATA Budget as approved by the
Bay Area Toll Authority Commission. For schedule, changes to the AB 144/SB 66 Project Complete Baseline approved by the Toll Bridge Program Oversight Committee, or changes to the BATA Project Complete Baseline approved by the Bay Area Toll Authority Commission.
CURRENT APPROVED BUDGET: The sum of the AB144/SB66 Budget or BATA Budget and Approved Changes.
COST TO DATE: The actual expenditures incurred by the program, project or contract as of the month and year shown.
COST FORECAST: The current forecast of all of the costs that are projected to be expended so as to complete the given scope of the program, project, or contract.
AT COMPLETION VARIANCE or VARIANCE (cost): The mathematical difference between the Cost Forecast and the Current Approved Budget.
AB 144/SB 66 PROJECT COMPLETE BASELINE: The planned completion date for the Toll Bridge Seismic Retrofit Program or subordinate projects or contracts.
BATA PROJECT COMPLETE BASELINE: The planned completion date for the Regional Measure 1 Program or subordinate projects or contracts.
PROJECT COMPLETE CURRENT APPROVED SCHEDULE: The sum of the AB144/SB66 Project Complete Baseline or BATA Project Complete Baseline and Approved Changes.
PROJECT COMPLETE SCHEDULE FORECAST: The current projected date for the completion of the program, project, or contract.
SCHEDULE VARIANCE or VARIANCE (schedule): The mathematical difference expressed in months between the Project Complete Schedule Forecast and the Project Complete Current Approved Schedule.
% COMPLETE: % Complete is based on an evaluation of progress on the project, expenditures to date, and schedule.