tolga state school queensland state school reporting 2013 ... · tolga state school queensland...
TRANSCRIPT

T
DEPARTMENT OF EDUCATION, TRAINING AND EMPLOYMENT
Tolga State School
Queensland State School Reporting
2013 School Annual Report
YPEOVER TO INSERT SCHOOL NAME
Postal address PO Box 100 Tolga 4882
Phone (07) 4089 5111
Fax (07) 4095 4518
Email [email protected]
Webpages Additional reporting information pertaining to Queensland state schools is located on the My School website and the Queensland Government data website.
Contact Person Kayleen Wright
Principal’s foreword
Tolga State Primary School, situated 6 kms from Atherton, Far North Queensland, was established in 1895. It is part of the Atherton Cluster of Educators and is actively involved in developing curriculum and teaching practices, and student and staff development activities which assist our students' education. Queensland State School essential learnings direct the development of curriculum with a central focus on high attainment of literacy and numeracy for all students. All Key Learning Areas are valued and taught. Extra-curricular activities such as choir, musicals, choric speaking, eisteddfod, school and district sport, Instrumental Music, and community activities ( ANZAC, show, environmental activities) enhance student development. Student learning outcomes are steadily improving through our staff's focus on the needs of each individual, flexibility to maximise student support and close working relationships with families. Student development is enriched by the philosophies and support of our values program, gifted and talented programs, early intervention strategies and learning and special needs support.P and C and parent / volunteer assistance strengthen the school learning environment and help maximise school / communities partnerships.
Introduction
Effective school reporting provides parents, staff, students and the community w ith meaningful information about schools. All Queensland schools are required to publish a minimum set of information for parents and the community. The Annual Reporting Policy for all Queensland Schools w ill ensure that all schools report similar information that complies w ith Government requirements in a clear and comprehensive manner.
The school annual report outlines the progress of the school in a variety of areas from academic to environmental. The report outlines the goals and progress made throughout the 2013 school year.

DEPARTMENT OF EDUCATION, TRAINING AND EMPLOYMENT
Queensland State School Reporting
2013 School Annual Report
School progress towards its goals in 2013
1. Improving teaching:
The improving teaching agenda is being embedded into classrooms with the assistance of Lead coaches and supervising teachers. The teachers have undertaken professional development in delivering the Australian curriculum and foundational learning programs that enable students to continue their learning with their counter-parts across Australia. The teaching of reading, writing and numeracy are fundamental to the curriculum being taught at Tolga State School in 2013.
2. Refining and embedding data based decision making:
The use of data to inform our teachers of the direction required for each student to continue improvement is an important aspect of all planning and decision making at Tolga State School. The data used also informs the differentiation required to ensure that each child, where necessary, is achieving at a good standard across the school.
3. Refining and embedding Planning & Accountability Systems at all leadership levels.
Systems and Tools used complement the management of the school to enable an open process and understanding for all.
4. Connecting parents and caregivers with their children’s learning.
Tolga State School continues to encourage parents and caregivers to be involved in all levels of their children’s education. Parents and Caregivers are encouraged to assist teachers in classrooms as well as part of the Parents and Citizens association.
5. Future outlook
Tolga State School have defined, in the Quadrennial review, that the key areas for focus will be Supporting students academically and behaviourally, E-Learning, Indigenous Education, Curriculum and Resource Centre as outlined in the School Implementation plan.

Our school at a glance
School Profile
Coeducational or single sex: Coeducational
Year levels offered in 2013: Prep Year - Year 7
Total student enrolments for this school:
Total Girls Boys
Enrolment Continuity
(Feb – Nov)
2011 320 141 179 97%
2012 336 146 190 93%
2013 377 174 203 94%
Student counts are based on the Census (August) enrolment collection.
Characteristics of the student body:
The students at Tolga State School tend to enrol for all of their primary education ie from Prep to Year 7. The cultural backgrounds vary from European, Asian and Aboriginal. A number of our students come from other towns to access the offerings of Tolga State School as well as rural backgrounds.
Average Class sizes
Phase
Average Class Size
2011 2012 2013
Prep – Year 3 24 23 23
Year 4 – Year 7 Primary 24 26 27
Year 7 Secondary – Year 10
Year 11 – Year 12
School Disciplinary Absences
Disciplinary Absences
Count of Incidents
2011 2012 2013
Short Suspensions - 1 to 5 days 2 4 15
Long Suspensions - 6 to 20 days 2 1 2
Exclusions 0 0 0
Cancellations of Enrolment 0 0 0

Our school at a glance
Curriculum offerings
Our distinctive curriculum offerings
Student camps for years5/6/7
Choric Speaking
Choral singing
Instrumental music
Inter school sports program throughout the year
Student involvement in the Peninsula sporting events
Extra curricula activities
Writers camp at Daradagee Environmental centre
Readers Cup competition
Anzac March through Atherton
Choric Speaking
Choral singing
Students participate in outside activities under the flag of Tolga eg Horse sports
Stage performance in Brisbane – Creative Generation
How Information and Communication Technologies are used to assist learning
The students use a computer lab regularly to enhance their learning in the classroom. Classrooms have some computers in their classrooms.Some classrooms are outfitted with electronic whiteboards – all classrooms in 2014 will be fitted with electronic whiteboards.
Social climate
Tolga State School has a school environment which is positive and supportive and in which
effective learning occurs.
Our school supportive practices encourage children to develop our three basic rules:
• Be safe • Be responsible • Be respectful
Tolga State School staff, parents and students work hard to ensure the social climate of the school continues to progress. With a rapidly growing school in a short space of time, procedures and protocols need to be adjusted for everybody’s well-being as the school begins to cater for children from many places and backgrounds. The values and the school rules are discussed regularly both in the classroom and on parade. The school rules are followed through within the playground with the adults on supervision. Tolga State School generally enjoys strong relationships with the parents and understanding of the expectations of the school are discussed through different avenues eg Newsletter, conversations with school staff, information given to parents at different points of time.

Our school at a glance
Parent, student and staff satisfaction with the school
Parent/student/staff satisfaction is generally on a very high percentage. With a growing enrolment at the school a change has occurred amongst the understandings of the school community and has required some adjustments. Improvements are occurring all of the time to improve the satisfaction at the school amongst all of the participants.
Performance measure (Nationally agreed items shown*)
Percentage of parents/caregivers who agree that: 2012
2013
their child is getting a good education at school (S2016) 98% 95%
this is a good school (S2035) 100% 100%
their child likes being at this school* (S2001) 100% 92%
their child feels safe at this school* (S2002) 98% 100%
their child's learning needs are being met at this school* (S2003) 98% 95%
their child is making good progress at this school* (S2004) 98% 95%
teachers at this school expect their child to do his or her best* (S2005) 97% 97%
teachers at this school provide their child with useful feedback about his or her school work* (S2006) 98% 95%
teachers at this school motivate their child to learn* (S2007) 98% 95%
teachers at this school treat students fairly* (S2008) 97% 97%
they can talk to their child's teachers about their concerns* (S2009) 100% 100%
this school works with them to support their child's learning* (S2010) 97% 97%
this school takes parents' opinions seriously* (S2011) 97% 97%
student behaviour is well managed at this school* (S2012) 95% 89%
this school looks for ways to improve* (S2013) 97% 94%
this school is well maintained* (S2014) 97% 97%
Performance measure (Nationally agreed items shown*)
Percentage of students who agree that: 2012 2013
they are getting a good education at school (S2048) 98% 97%
they like being at their school* (S2036) 88% 88%
they feel safe at their school* (S2037) 97% 97%
their teachers motivate them to learn* (S2038) 98% 95%
their teachers expect them to do their best* (S2039) 98% 98%
their teachers provide them with useful feedback about their school work* (S2040) 98% 92%
teachers treat students fairly at their school* (S2041) 97% 86%
they can talk to their teachers about their concerns* (S2042) 98% 84%
their school takes students' opinions seriously* (S2043) 95% 71%
student behaviour is well managed at their school* (S2044) 86% 74%
their school looks for ways to improve* (S2045) 95% 94%

Our school at a glance
their school is well maintained* (S2046) 98% 92%
their school gives them opportunities to do interesting things* (S2047) 92% 90%
Performance measure
Percentage of school staff who agree that: 2013
they enjoy working at their school (S2069) 97%
they feel that their school is a safe place in which to work (S2070) 97%
they receive useful feedback about their work at their school (S2071) 76%
students are encouraged to do their best at their school (S2072) 100%
students are treated fairly at their school (S2073) 94%
student behaviour is well managed at their school (S2074) 70%
staff are well supported at their school (S2075) 73%
their school takes staff opinions seriously (S2076) 71%
their school looks for ways to improve (S2077) 97%
their school is well maintained (S2078) 94%
their school gives them opportunities to do interesting things (S2079) 87%
* Nationally agreed student and parent/caregiver items were incorporated in the School Opinion Survey in 2012.
# Percentage of respondents who Somewhat Agree, Agree or Strongly Agree with the statement. Due to a major redevelopment of the
surveys (parent/caregiver and student in 2012; staff in 2013), comparisons with results from previous years are not recommended.
DW = Data withheld to ensure confidentiality.

Our school at a glance
Involving parents in their child’s education
Tolga State School teachers welcome parents to assist in classrooms as a method of understanding the changes that occurs with school work and how school operates generally. Parents are requested to participate in a variety of activities with their children throughout the year. Parents are invited regularly to have both formal and informal conversations about the progress of their child. Parents are informed of any changes to the everyday aspects of schooling, as timely as possible, through liason officers for each classroom, newsletters and school flyers. Parents & Citizens Group is a pro-active group of people always looking for interesting ways to improve the environment and the facilities of the school. The P&C support the teachers with extra funding for Arts and Crafts projects.
Reducing the school’s environmental footprint
Tolga State School has endured a number of incidences over the years where water has been needed to rectify the grounds for the use of the students eg sporting grounds etc. Refurbishment of the toilet system has been responsible for lowering of the water usage. As there has not been extra water required the usage has declined for 2012/13. The electricity usage is on the increase due to improved technological resources being allocated and used by the teachers and students which has increased the electricity consumption.
Environmental footprint indicators
Electricity kWh
Water kL
2010-2011 71,842 3,624
2011-2012 84,642 3,495
2012-2013 99,025 2,742
The consumption data is sourced from the validated utilities expenditure return which the school submits at the end of each financial year. The data provides an indication of the consumption trend in each of the utility categories which impact on the schools environmental footprint.

Our staff profile
Staff composition, including Indigenous staff
2013 Workforce Composition
Teaching Staff *
Non-teaching Staff
Indigenous Staff
Headcounts 24 14 0
Full-time equivalents 21 9 0
Qualifications of all teachers
Highest level of
attainment
Number of
Teaching Staff *
Certificate 0
Diploma 1
Advanced Diploma 0
Bachelor Degree 20
Graduate Diploma etc. 1
Masters 2
Doctorate 0
Total 24
01
0
20
12
00
5
10
15
20
25
* Teaching Staff includes School Leaders
** Graduate Diploma etc. includes Graduate Diploma, Bachelor Honours Degree, and Graduate Certificate
Our staff profile
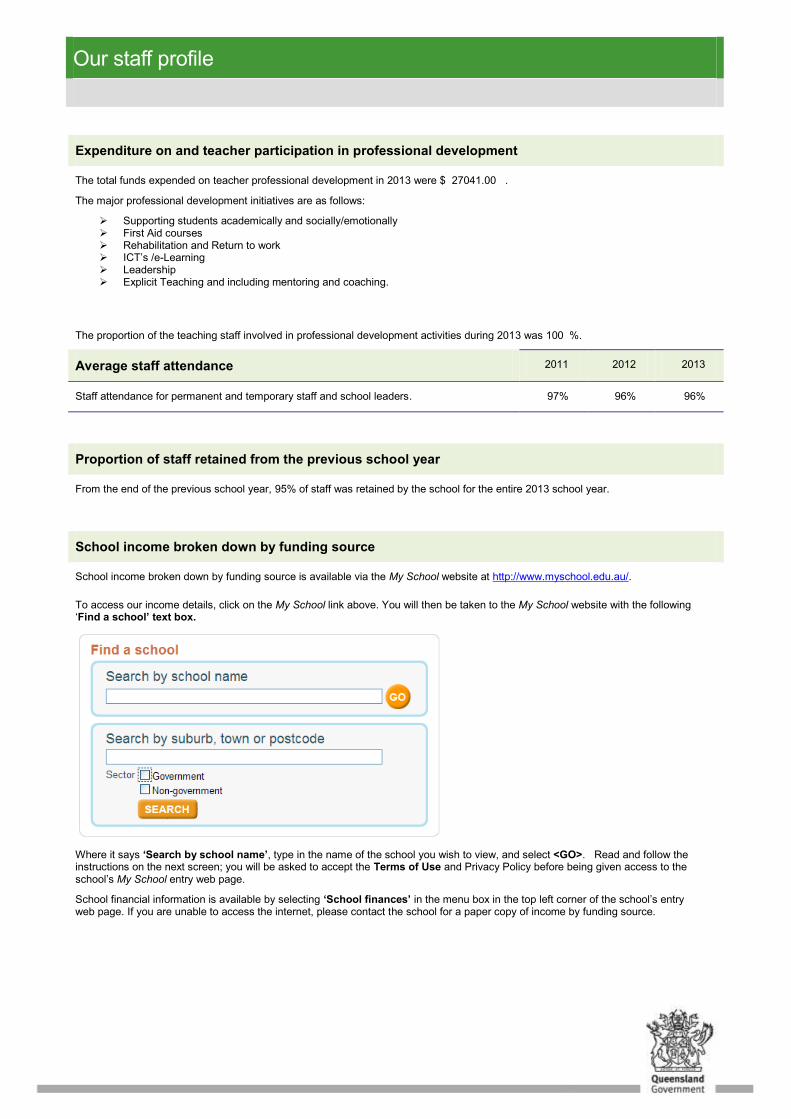
Expenditure on and teacher participation in professional development
The total funds expended on teacher professional development in 2013 were $ 27041.00 .
The major professional development initiatives are as follows:
Supporting students academically and socially/emotionally First Aid courses Rehabilitation and Return to work ICT’s /e-Learning Leadership Explicit Teaching and including mentoring and coaching.
The proportion of the teaching staff involved in professional development activities during 2013 was 100 %.
Average staff attendance 2011 2012 2013
Staff attendance for permanent and temporary staff and school leaders. 97% 96% 96%
Proportion of staff retained from the previous school year
From the end of the previous school year, 95% of staff was retained by the school for the entire 2013 school year.
School income broken down by funding source
School income broken down by funding source is available via the My School website at http://www.myschool.edu.au/.
To access our income details, click on the My School link above. You will then be taken to the My School website with the following ‘Find a school’ text box.
Where it says ‘Search by school name’, type in the name of the school you wish to view, and select <GO>. Read and follow the instructions on the next screen; you will be asked to accept the Terms of Use and Privacy Policy before being given access to the school’s My School entry web page.
School financial information is available by selecting ‘School finances’ in the menu box in the top left corner of the school’s entry web page. If you are unable to access the internet, please contact the school for a paper copy of income by funding source.

Performance of our students
Key student outcomes
e
Student attendance 2011 2012 2013
The overall attendance rate for the students at this school (shown as a percentage). 94% 94% 94%
The overall attendance rate in 2013 for all Queensland state Primary schools was 92%.
Student attendance rate for each year level (shown as a percentage)
Year 1
Year 2
Year 3
Year 4
Year 5
Year 6
Year 7
Year 8
Year 9
Year 10
Year 11
Year 12
2011 94% 94% 96% 95% 95% 95% 93%
2012 94% 95% 94% 94% 93% 95% 93%
2013 94% 94% 94% 94% 95% 93% 94%
DW = Data withheld to ensure confidentiality.
Student Attendance Distribution
The proportions of students by attendance range.
* The method for calculating attendance changed in 2013 – care should be taken when comparing data from 2013 to that of previous years.
8
6
8
7
10
9
30
31
28
55
52
55
0% 20% 40% 60% 80% 100%
2011
2012
* 2013
Proportion of Students
Attendance Rate: 0% to <85% 85% to <90% 90% to <95% 95% to 100%

Performance of our students
Description of how non-attendance is managed by the school
Non-attendance is managed in state schools in line with the DET policies, SMS-PR-029: Managing Student Absences and SMS-PR-036: Roll Marking in State Schools, which outline processes for managing and recording student attendance and absenteeism.
Rolls are marked twice a day and collected once a week for the data to be placed onto the collection tool. Parents are able to send a message to school through their child’s sibling, telephone in to leave a message, telephone the office and/or classroom teacher to inform of any absences. Parents who do not follow this procedure will receive, at the end of the month, a written request to explain the absence unless they have rectified this before the letter is sent. Parents who do not inform the school of absence of 3 days and greater are telephoned by the teacher, then the administration in the office and then the Principal before any other action takes place. The administration takes all necessary steps to achieve knowledge about any absences for attendance.
Tolga State School enjoys a high attendance rate and are always working on ways to remind students about their responsibility in attending school. Each year level, twice a term, are officially awarded a certificate with the percentage of attendance during that term. This is then displayed in the classroom.
National Assessment Program – Literacy and Numeracy (NAPLAN) results – our reading, writing, spelling, grammar and punctuation, and numeracy results for the Years 3, 5, 7 and 9.
Our reading, writing, spelling, grammar and punctuation, and numeracy results for the Years 3, 5, 7 and 9 are available via the My School website at http://www.myschool.edu.au/.
To access our NAPLAN results, click on the My School link above. You will then be taken to the My School website with the following ‘Find a school’ text box.
Where it says ‘Search by school name’, type in the name of the school whose NAPLAN results you wish to view, and select <GO>.
Read and follow the instructions on the next screen; you will be asked to accept the Terms of Use and Privacy Policy before being able to access NAPLAN data.
If you are unable to access the internet, please contact the school for a paper copy of our school’s NAPLAN results.

Performance of our students
Achievement – Closing the Gap
Attendance for Indigenous students for 2013 is 90.9% with non-indigenous students attendance being 94%.
Attainment
In 2013 Year 7 gap in Reading and Writing was closed with the indigenous mean meeting National Minimum standards as were their non –indigenous classmates at Tolga State School. The gap had slightly opened with Numeracy but most students were above the Qld State Schools mean.
Year 5 gap has opened in Reading, Writing and Numeracy for Indigenous students
Year 3 gap has widened since 2012 in Reading. Writing gap has slightly opened but students are meeting the 2013 Qld State Schools mean . Although the gap for Numeracy has widened the bottom of the mean has improved significantly from 2012.