today’s goals understand how nwea ties to ccss and sbac understand how to read & use the new...
TRANSCRIPT

NWEA Data to inform instruction aligned with CCSS & SBAC & enVision Math
September 21, 2015Grades 3 - 5

Today’s Goals
•Understand how NWEA ties to CCSS and SBAC•Understand how to read & use the new Achievement
Status Growth report•Understand how to read & use the Learning
Continuums to1. Provide entry points for each student2. Meet the students where they are ready3. Align to the textbook & its resources

Why Assess ?
Why MAP?• Shows growth/progress over time
…within the year & throughout years• Gives information on where the students are at
…individual/class• Aligns to Common Core State Standards• Aligns to Smarter Balanced Assessments
• The goal of assessment has to be, above all, to support the improvement of learning and teaching
(Frederiksen and Collins, 1989)

Assessment: Formative vs. Summative
•Assessment of Learning – Summative
•Assessment for Learning - Formative

CCSS by Domain
http://www.corestandards.org/Math/
NWEA Math 2-5 Learning Continuum
View Reports > MAP Reports > Learning Continuum > Math 2-5


MAP Cut-Points Chart through the years.
Question: What do you notice about the changes from STAR’s projected proficiency to SBAC’s projected proficiency?

For today’s conversations… Level 3 “At Standard” falls between the
61st & 67th percentile in MAP…so we will use 65%
today.
Level 2: Between
27th & 35th
Level 4: Between
85th & 88th

LosingLow Achievement/
Low Growth
LearningLow Achievement/
High Growth
LeadingHigh
Achievement/ High Growth
LuckyHigh
Achievement/ Low Growth

•www.sanjuan.edu/nwea•View Reports•MAP Reports•Summary with Quadrant Chart
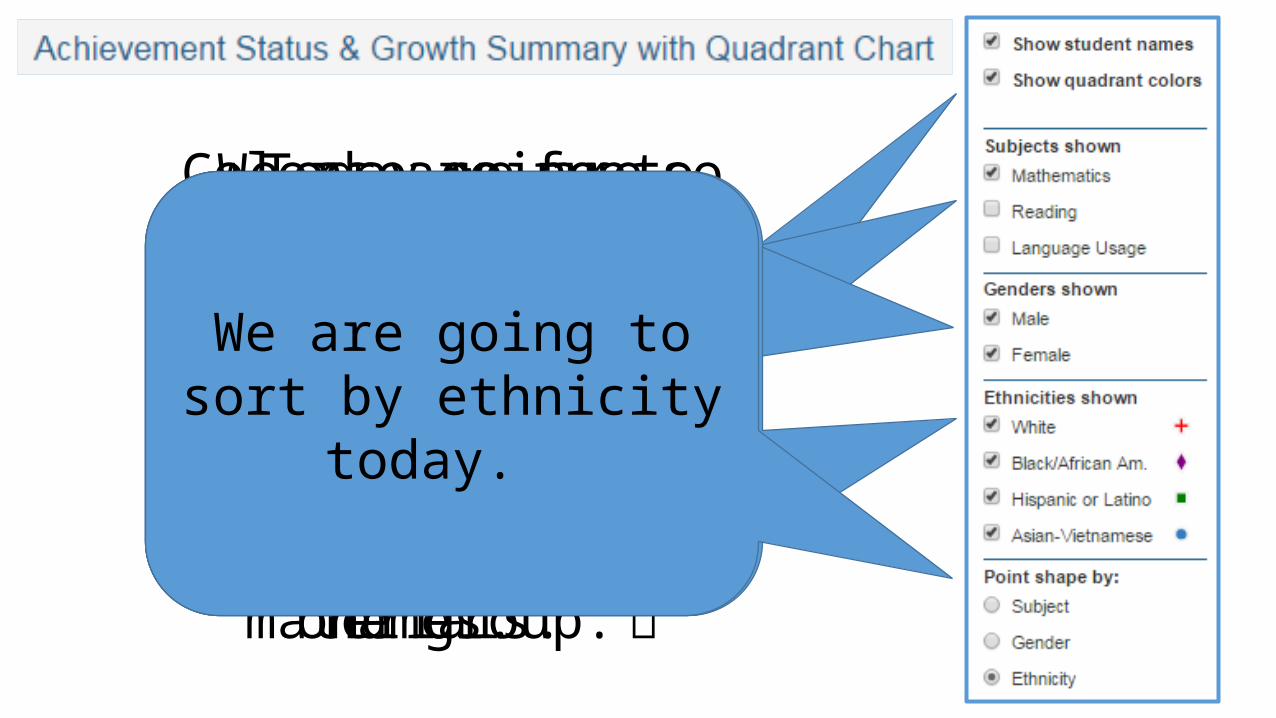
Colors are fun so you want them.
Students are fun too so you want them, but for
my slides, I will not show student names.
Today we are focusing on MATHEMATICS, because
math is awesome & we just adopted new
math materials.
Yes, because if we unclick these we will not have
anything to look at.
We are going to look at all ethnicities today, but
this filter is pretty amazing if you want to
focus on one group.
We are going to sort by ethnicity today.

Approximately 65% is the mark between Level 2
“Nearly AT Standard” & Level 3 “AT Standard” 65
Above 50%: meeting targeted growthBelow 50%: not meeting targeted growthAbove 65%: achieving accelerated growth
50
Questions•Who falls below the 65th percentile?
(Below Level 3 “AT Standard”)•Who falls in Level 1? (0% - 35%)
•Who is making growth? Accelerated growth?
•Are any students currently receiving supports?
•Any surprises? Ah-Has?


Class Breakdown Report Example: GRADE 4
Level 3 for Grade 4 is 208 - 217, so “AT
Standard” Students fall about here
Students fall in Levels 1 & 2: Possible supports
needed
Students fall in Levels 3 & 4:
Possible enrichment
needed

•Take a few minutes to explore this report•Click on the student’s names•Click on the RIT Ranges
•Explore the Learning Continuum•Explore “edit options” at the top
•Do any concepts repeat over multiple RIT ranges?
Explore…

Questions: •What are your upcoming Topics/Standards in the enVision Curriculum?
•Which goal area most closely addresses these topics & standards?
enVision, CCSS, and MAP’s Learning Continuum

Find the Learning Continuum that is most applicable to your upcoming Topic/Standards

•Use the cut-points chart to identify the Level 3 RIT range for your grade level.
enVision, CCSS, and MAP’s Learning Continuum
•Use the class breakdown report to identify where your students are (RIT scores) for the standards in the next math topic.
•Choose & use the one consolidated-printed Learning Continuum that correlates to those standards.

Questions:Use the learning continuum to determine…
1. Common standards for all students2. Supporting standards for low students3. Enriching standards for high students
What is the common entry point for all students?
Think: •What resources does enVision have that can be used
as intervention/enrichment? •What outside resources do I have? •What do I need?

Kahn Academy…linked to MAP
• Location on the NWEA website:•Click: View Reports•Click: MAP Reports•Click: Learning Continuum (then scroll down)•Under “Open Educational Resources Searchable by RIT”
click Khan Academy Resources by RIT•Download the appropriate Khan PDF