tobolsk-polymer russia’s first successful implementation ... · pdf filetobolsk-polymer...
TRANSCRIPT
TOBOLSK-POLYMER – RUSSIA’S FIRST SUCCESSFUL
IMPLEMENTATION OF ON PURPOSE PROPYLENE
PRODUCTION
March 2014
Sergey Komyshan
Managing Director, Basic Polymers Business Unit
Shanghai

0.128.128
153.204.0
128.128.128
208. 208.208
245.138.31
192.0.0
242. 242. 242
255.192.0
229.242.242
178.210.216
DISCLAIMER
2
The information contained herein pertaining to SIBUR (the "Company") has been provided by the Company solely for use at this presentation. By attending this
presentation, or by reading these presentation slides, you agree to be bound by the limitations set out below. This presentation does not constitute or form part of,
and should not be construed as, an offer, solicitation or invitation to sell or issue, or any solicitation of any offer to purchase or subscribe for, any securities of the
Company, nor shall any part of it nor the fact of its distribution form part of, or be relied on in connection with, any contract or investment decision relating thereto.
No representation or warranty, either express or implied, is made as to, and no reliance should be placed on, the fairness, accuracy, completeness, correctness or
reliability of the information contained herein. It should not be regarded by recipients as a substitute for the exercise of their own judgment. The Company accepts
no responsibility for any losses howsoever arising, directly or indirectly, from this presentation or its contents. The material contained in this presentation is
presented solely for information purposes and is not to be construed as providing investment advice. As such, it has no regard to the specific investment objectives,
financial situation or particular needs of any recipient. There may be material variances between estimated data set forth in this presentation and actual results, and
between the data set forth in this presentation and corresponding data previously published by or on behalf of the Company.
This presentation contains forward-looking statements, including (without limitation) statements containing the words "anticipates," "expects," "intends," "may,"
"plans," “forecasts,” "projects," "will," "would", "targets,“ “believes” and similar words. These statements are based on the current expectations and projections of the
Company about future events and are subject to change without notice. All statements, other than statements of historical fact, contained herein are forward-looking
statements. Forward-looking statements are subject to inherent risks and uncertainties, such that future events and actual results may differ materially from those
set forth in, contemplated by or underlying such forward-looking statements. The Company may not actually achieve or realize its plans, intentions or expectations.
There can be no assurance that the Company's actual results will not differ materially from the expectations set forth in such forward-looking statements. Factors
that could cause actual results to differ from such expectations include, but are not limited to, the state of the global economy, the ability of the petrochemical sector
to maintain levels of growth and development, risks related to petrochemical prices and regional political and security concerns. The above is not an exhaustive list
of the factors that could cause actual results to differ materially from the expectations set forth in such forward-looking statements. The Company and its Affiliates
are under no obligation to update the information, opinions or forward-looking statements in this presentation.
0.128.128
153.204.0
128.128.128
208. 208.208
245.138.31
192.0.0
242. 242. 242
255.192.0
229.242.242
178.210.216
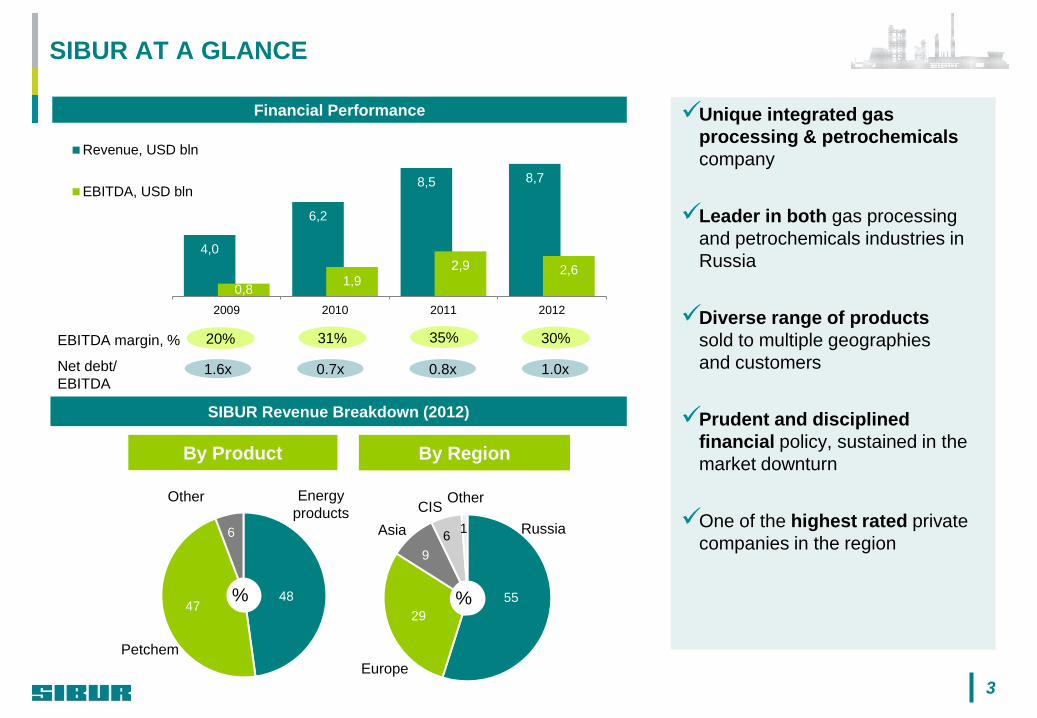
Unique integrated gas
processing & petrochemicals
company
Leader in both gas processing
and petrochemicals industries in
Russia
Diverse range of products
sold to multiple geographies
and customers
Prudent and disciplined
financial policy, sustained in the
market downturn
One of the highest rated private
companies in the region
SIBUR AT A GLANCE
Financial Performance
SIBUR Revenue Breakdown (2012)
48 47
6
By Region
Energy
products Other
Petchem
By Product
% 55
29
9
6 1
%
Other
Asia
CIS
Europe
Russia
4,0
6,2
8,5 8,7
0,8 1,9
2,9 2,6
2009 2010 2011 2012
Revenue, USD bln
EBITDA, USD bln
1.6x
EBITDA margin, % 20% 31% 35% 30%
0.7x 0.8x Net debt/
EBITDA 1.0x
3
0.128.128
153.204.0
128.128.128
208. 208.208
245.138.31
192.0.0
242. 242. 242
255.192.0
229.242.242
178.210.216
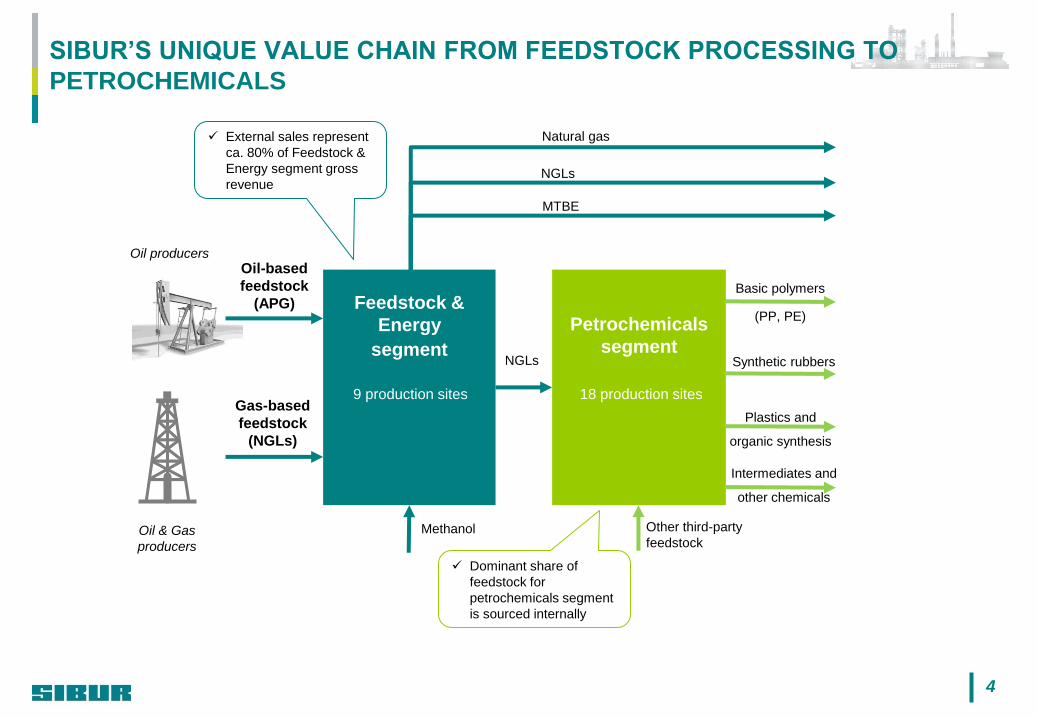
Plastics and
organic synthesis
Basic polymers
(PP, PE)
Synthetic rubbers
4
Feedstock &
Energy
segment
Petrochemicals
segment
Methanol
NGLs
Other third-party
feedstock
MTBE
NGLs
Natural gas
Oil & Gas
producers
9 production sites
18 production sites Gas-based
feedstock
(NGLs)
Intermediates and
other chemicals
Oil producers
External sales represent
ca. 80% of Feedstock &
Energy segment gross
revenue
Dominant share of
feedstock for
petrochemicals segment
is sourced internally
Oil-based
feedstock
(APG)
SIBUR’S UNIQUE VALUE CHAIN FROM FEEDSTOCK PROCESSING TO
PETROCHEMICALS
0.128.128
153.204.0
128.128.128
208. 208.208
245.138.31
192.0.0
242. 242. 242
255.192.0
229.242.242
178.210.216
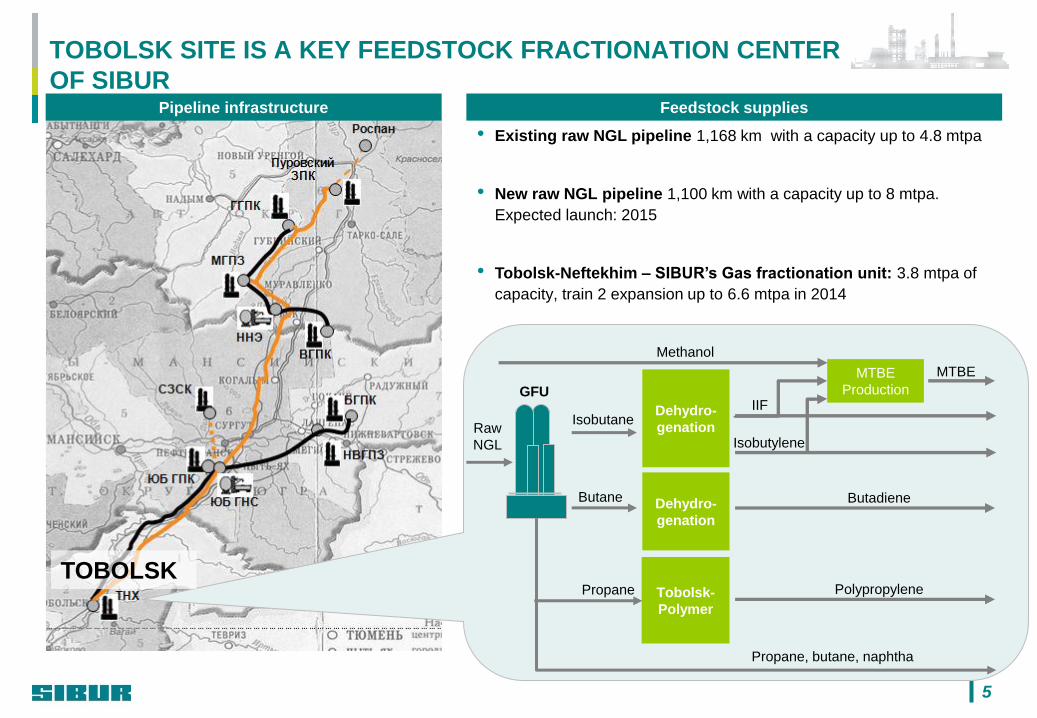
TOBOLSK SITE IS A KEY FEEDSTOCK FRACTIONATION CENTER
OF SIBUR Pipeline infrastructure
5
Feedstock supplies
Isobutane Raw
NGL
Butane
MTBE
Butadiene
Isobutylene
IIF Dehydro-
genation
Dehydro-
genation
MTBE
Production GFU
Propane, butane, naphtha
Methanol
• Existing raw NGL pipeline 1,168 km with a capacity up to 4.8 mtpa
• New raw NGL pipeline 1,100 km with a capacity up to 8 mtpa.
Expected launch: 2015
• Tobolsk-Neftekhim – SIBUR’s Gas fractionation unit: 3.8 mtpa of
capacity, train 2 expansion up to 6.6 mtpa in 2014
TOBOLSK Tobolsk-
Polymer
Propane Polypropylene
0.128.128
153.204.0
128.128.128
208. 208.208
245.138.31
192.0.0
242. 242. 242
255.192.0
229.242.242
178.210.216
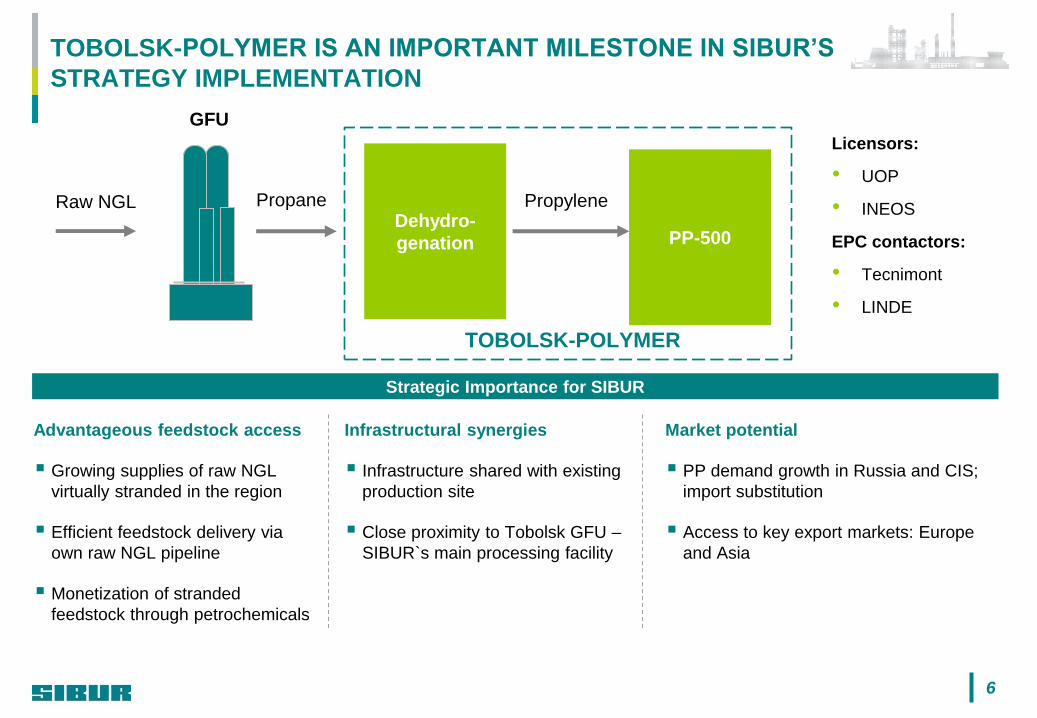
TOBOLSK-POLYMER IS AN IMPORTANT MILESTONE IN SIBUR’S
STRATEGY IMPLEMENTATION
Licensors:
• UOP
• INEOS
EPC contactors:
• Tecnimont
• LINDE
Strategic Importance for SIBUR
Advantageous feedstock access
Growing supplies of raw NGL
virtually stranded in the region
Efficient feedstock delivery via
own raw NGL pipeline
Monetization of stranded
feedstock through petrochemicals
6
Propane Raw NGL Propylene Dehydro-
genation PP-500
TOBOLSK-POLYMER
GFU
Infrastructural synergies
Infrastructure shared with existing
production site
Close proximity to Tobolsk GFU –
SIBUR`s main processing facility
Market potential
PP demand growth in Russia and CIS;
import substitution
Access to key export markets: Europe
and Asia
0.128.128
153.204.0
128.128.128
208. 208.208
245.138.31
192.0.0
242. 242. 242
255.192.0
229.242.242
178.210.216
7
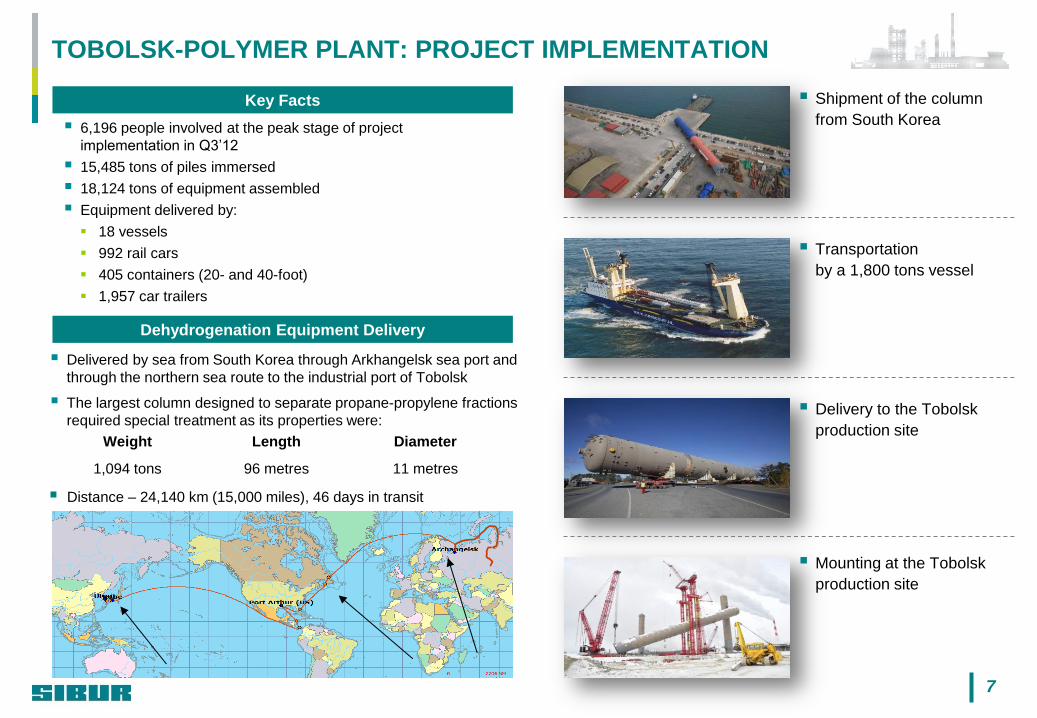
TOBOLSK-POLYMER PLANT: PROJECT IMPLEMENTATION
6,196 people involved at the peak stage of project
implementation in Q3’12
15,485 tons of piles immersed
18,124 tons of equipment assembled
Equipment delivered by:
18 vessels
992 rail cars
405 containers (20- and 40-foot)
1,957 car trailers
Key Facts
Dehydrogenation Equipment Delivery
Delivered by sea from South Korea through Arkhangelsk sea port and
through the northern sea route to the industrial port of Tobolsk
The largest column designed to separate propane-propylene fractions
required special treatment as its properties were:
Distance – 24,140 km (15,000 miles), 46 days in transit
Shipment of the column
from South Korea
Transportation
by a 1,800 tons vessel
Delivery to the Tobolsk
production site
Mounting at the Tobolsk
production site
Weight Length Diameter
1,094 tons 96 metres 11 metres
0.128.128
153.204.0
128.128.128
208. 208.208
245.138.31
192.0.0
242. 242. 242
255.192.0
229.242.242
178.210.216
8
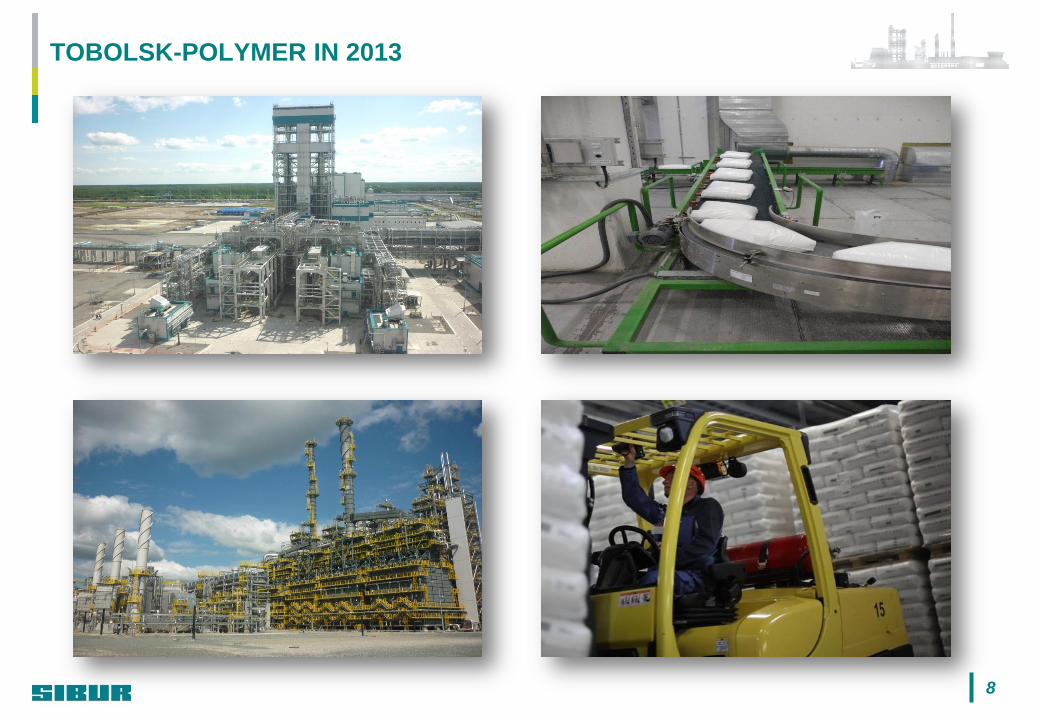
TOBOLSK-POLYMER IN 2013
0.128.128
153.204.0
128.128.128
208. 208.208
245.138.31
192.0.0
242. 242. 242
255.192.0
229.242.242
178.210.216
Source: IHS Chemical
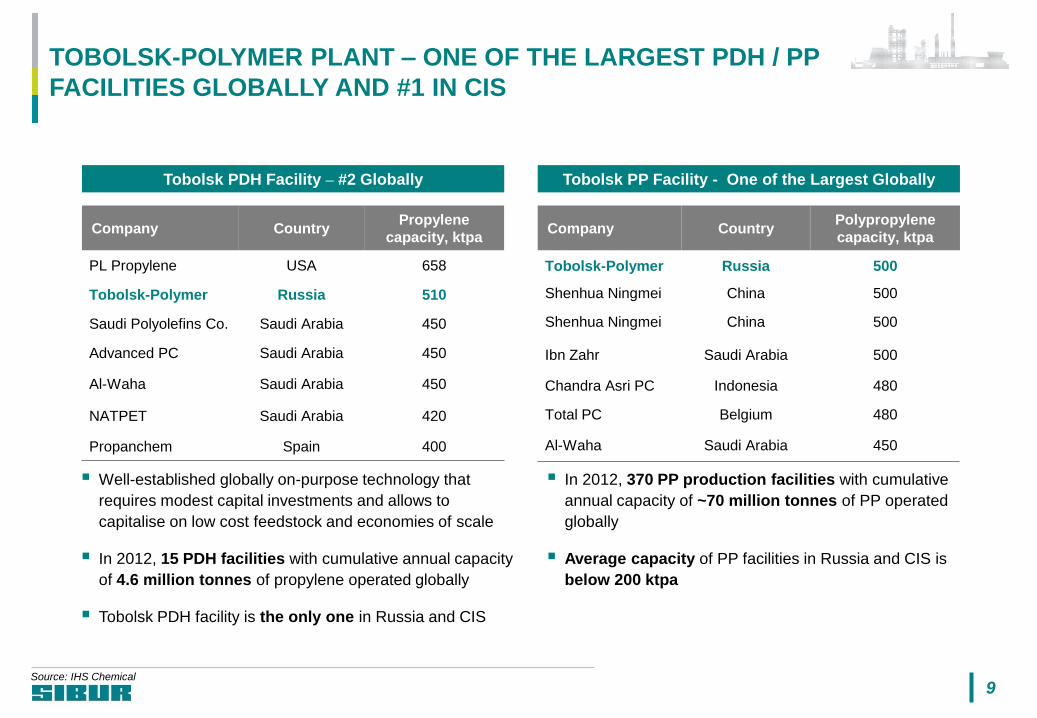
TOBOLSK-POLYMER PLANT – ONE OF THE LARGEST PDH / PP
FACILITIES GLOBALLY AND #1 IN CIS
Company Country Propylene
capacity, ktpa
PL Propylene USA 658
Tobolsk-Polymer Russia 510
Saudi Polyolefins Co. Saudi Arabia 450
Advanced PC Saudi Arabia 450
Al-Waha Saudi Arabia 450
NATPET Saudi Arabia 420
Propanchem Spain 400
Company Country Polypropylene
capacity, ktpa
Tobolsk-Polymer Russia 500
Shenhua Ningmei China 500
Shenhua Ningmei China 500
Ibn Zahr Saudi Arabia 500
Chandra Asri PC Indonesia 480
Total PC Belgium 480
Al-Waha Saudi Arabia 450
Well-established globally on-purpose technology that
requires modest capital investments and allows to
capitalise on low cost feedstock and economies of scale
In 2012, 15 PDH facilities with cumulative annual capacity
of 4.6 million tonnes of propylene operated globally
Tobolsk PDH facility is the only one in Russia and CIS
Tobolsk PDH Facility – #2 Globally Tobolsk PP Facility - One of the Largest Globally
In 2012, 370 PP production facilities with cumulative
annual capacity of ~70 million tonnes of PP operated
globally
Average capacity of PP facilities in Russia and CIS is
below 200 ktpa
9
0.128.128
153.204.0
128.128.128
208. 208.208
245.138.31
192.0.0
242. 242. 242
255.192.0
229.242.242
178.210.216
10
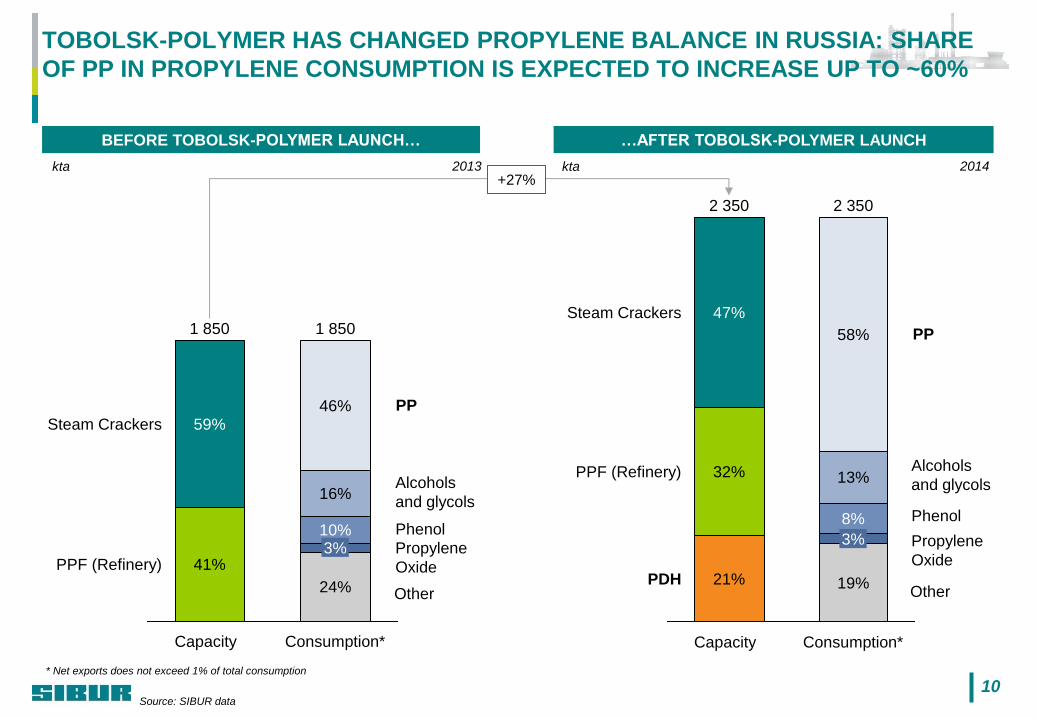
TOBOLSK-POLYMER HAS CHANGED PROPYLENE BALANCE IN RUSSIA: SHARE
OF PP IN PROPYLENE CONSUMPTION IS EXPECTED TO INCREASE UP TO ~60%
PPF (Refinery)
Steam Crackers
Consumption*
1 850
24%
3% 10%
16%
46%
Capacity
1 850
41%
59%
BEFORE TOBOLSK-POLYMER LAUNCH… …AFTER TOBOLSK-POLYMER LAUNCH
PDH
PPF (Refinery)
Steam Crackers
Consumption*
2 350
19%
3%
8%
13%
58%
Capacity
2 350
21%
32%
47%
PP
Alcohols
and glycols
Propylene
Oxide
Other
PP
+27% kta kta
Phenol
Alcohols
and glycols
Propylene
Oxide
Other
Phenol
2013 2014
* Net exports does not exceed 1% of total consumption
Source: SIBUR data

0.128.128
153.204.0
128.128.128
208. 208.208
245.138.31
192.0.0
242. 242. 242
255.192.0
229.242.242
178.210.216
76
16
7
TOBOLSK-POLYMER LAUNCH WILL TURN CIS PP MARKET INTO SURPLUS
CIS PP Consumption Split
38
33
15
6 5 3 Injection
molding
Fibers
Films
Pipes
Sheets Other
HPP in CIS
2014F
%
2014F ktpa
CIS PP Consumption Split
73
11
7 5
3 1
Ukraine
Uzbekistan Russia
Key Highlights
2014F
%
By application By grade By country
Belarus Kazakhstan Turkmenistan
Total consumption of 1,350,000 tonnes Total consumption of 1,350,000 tonnes
PP demand in Russia is forecasted to grow at 4.2% CAGR
through 2020
Key applications are represented by production of injection
moldings and fibers
HPP accounts for 76% of total PP consumption in CIS
In 2014 market will be in surplus due to Tobolsk-Polymer
Tobolsk-polymer launch have increased PP production
capacities in Russia by 34%.
11
RCP
ICP
HPP(1)
%
Source: IHS Chemical, Market Report, SIBUR estimates
* Potential volume if all plants are on stream
1 029
1 455
Consumption
Import
115
Potential Exports*
541
Capacity
Tobolsk-Polymer 500 ktpa
0.128.128
153.204.0
128.128.128
208. 208.208
245.138.31
192.0.0
242. 242. 242
255.192.0
229.242.242
178.210.216
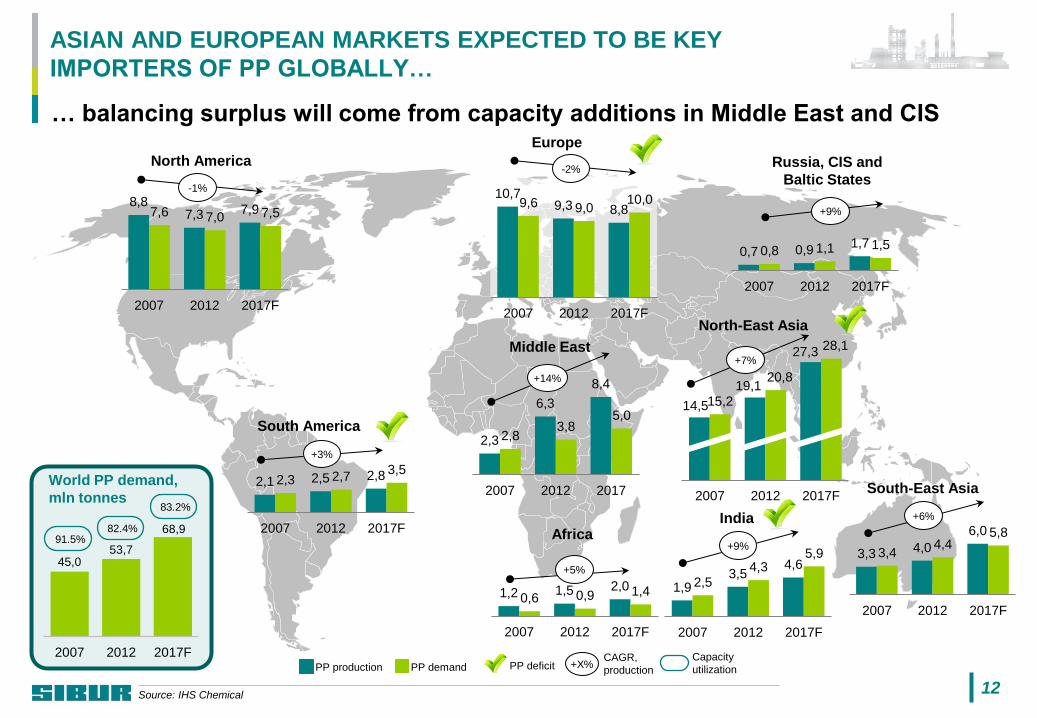
ASIAN AND EUROPEAN MARKETS EXPECTED TO BE KEY
IMPORTERS OF PP GLOBALLY…
… balancing surplus will come from capacity additions in Middle East and CIS
8,8 7,3 7,9 7,6 7,0 7,5
2007 2012 2017F
2,1 2,5 2,8 2,3 2,7 3,5
2007 2012 2017F
10,7 9,3 8,8
9,6 9,0 10,0
2007 2012 2017F
2,3
6,3
8,4
2,8 3,8
5,0
2007 2012 2017
1,2 1,5 2,0 0,6 0,9 1,4
2007 2012 2017F
0,7 0,9 1,7
0,8 1,1 1,5
2007 2012 2017F
14,5
19,1
27,3
15,2
20,8
28,1
2007 2012 2017F
1,9 3,5
4,6
2,5 4,3
5,9
2007 2012 2017F
3,3 4,0
6,0
3,4 4,4
5,8
2007 2012 2017F
North America
-1%
South America
+3%
Europe
-2%
+9%
India +6%
South-East Asia
+9%
Russia, CIS and
Baltic States
+7%
North-East Asia
+14%
Middle East
+5%
Africa
Source: IHS Chemical
12
45,0 53,7
68,9
2007 2012 2017F
91.5% 82.4%
World PP demand,
mln tonnes
PP deficit CAGR,
production +X%
Capacity
utilization PP demand PP production
83.2%
0.128.128
153.204.0
128.128.128
208. 208.208
245.138.31
192.0.0
242. 242. 242
255.192.0
229.242.242
178.210.216
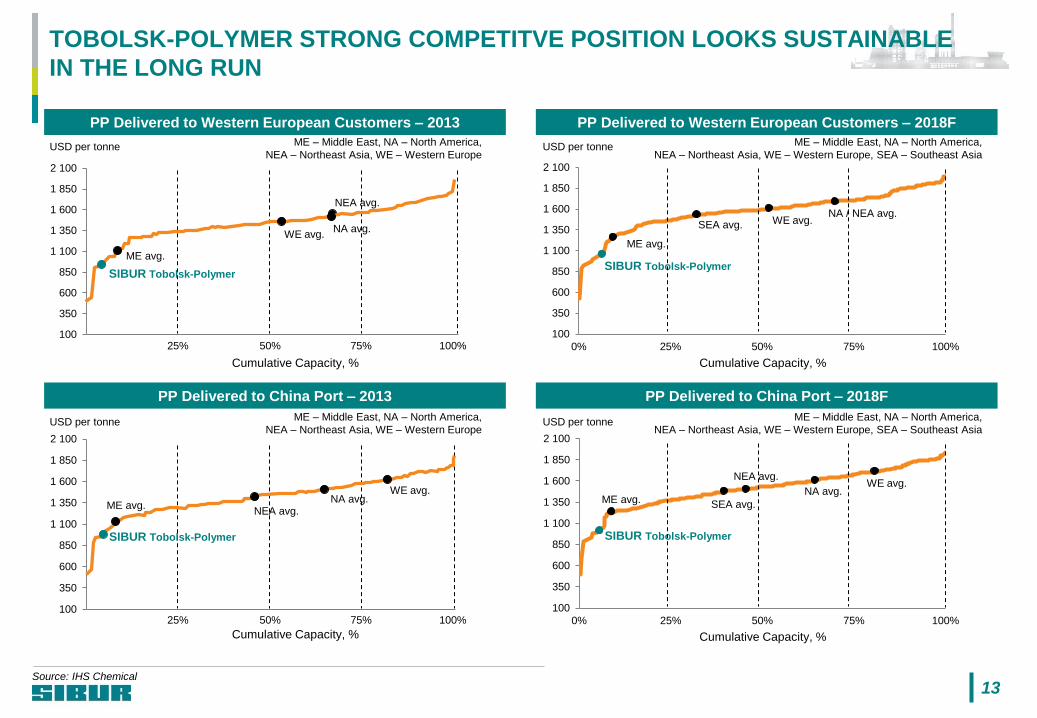
100
350
600
850
1 100
1 350
1 600
1 850
2 100
0% 25% 50% 75% 100%
NA avg.
SEA avg.
ME avg.
SIBUR Tobolsk-Polymer
SIBUR Tobolsk-Polymer
100
350
600
850
1 100
1 350
1 600
1 850
2 100
0% 25% 50% 75% 100%
Source: IHS Chemical
TOBOLSK-POLYMER STRONG COMPETITVE POSITION LOOKS SUSTAINABLE
IN THE LONG RUN
PP Delivered to Western European Customers – 2013
PP Delivered to China Port – 2013
100
350
600
850
1 100
1 350
1 600
1 850
2 100
NEA avg.
WE avg.
ME avg.
SIBUR Tobolsk-Polymer
25%
NA avg.
100
350
600
850
1 100
1 350
1 600
1 850
2 100
NEA avg.
WE avg.
ME avg.
SIBUR Tobolsk-Polymer
USD per tonne
NA avg.
ME – Middle East, NA – North America,
NEA – Northeast Asia, WE – Western Europe
ME – Middle East, NA – North America,
NEA – Northeast Asia, WE – Western Europe
PP Delivered to China Port – 2018F
USD per tonne ME – Middle East, NA – North America,
NEA – Northeast Asia, WE – Western Europe, SEA – Southeast Asia
ME avg.
WE avg. NEA avg.
Cumulative Capacity, %
PP Delivered to Western European Customers – 2018F
SEA avg. WE avg. NA / NEA avg.
USD per tonne ME – Middle East, NA – North America,
NEA – Northeast Asia, WE – Western Europe, SEA – Southeast Asia
Cumulative Capacity, %
50% 75% 100%
Cumulative Capacity, %
25% 50% 75% 100%
Cumulative Capacity, %
USD per tonne
13
0.128.128
153.204.0
128.128.128
208. 208.208
245.138.31
192.0.0
242. 242. 242
255.192.0
229.242.242
178.210.216
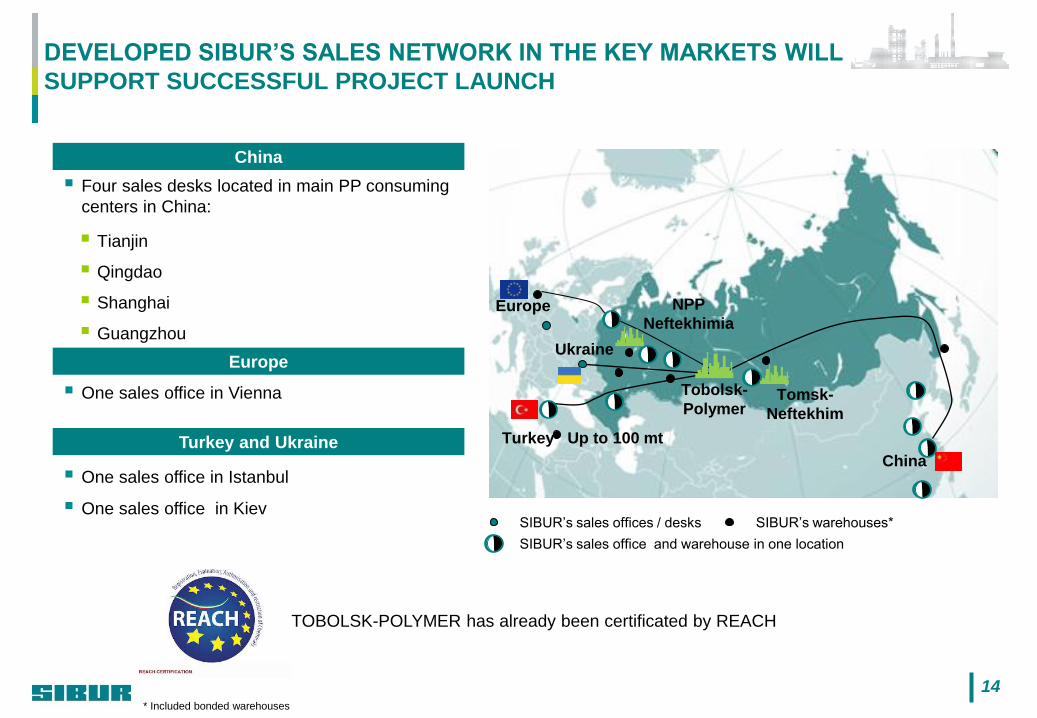
DEVELOPED SIBUR’S SALES NETWORK IN THE KEY MARKETS WILL
SUPPORT SUCCESSFUL PROJECT LAUNCH
China
Europe
Turkey and Ukraine
Four sales desks located in main PP consuming
centers in China:
Tianjin
Qingdao
Shanghai
Guangzhou
One sales office in Vienna
One sales office in Istanbul
One sales office in Kiev
14
SIBUR’s sales offices / desks
Tobolsk-
Polymer
Europe
Turkey
Ukraine
China
NPP
Neftekhimia
Tomsk-
Neftekhim
confirmed demand for 1.2 million tonnes per annum TOBOLSK-POLYMER has already been certificated by REACH
Up to 100 mt
SIBUR’s warehouses*
* Included bonded warehouses
SIBUR’s sales office and warehouse in one location

0.128.128
153.204.0
128.128.128
208. 208.208
245.138.31
192.0.0
242. 242. 242
255.192.0
229.242.242
178.210.216
Segment Application Share in Tobolsk-Polymer
production
FIBERS
Raffia
Fibers, bags 30%
Non-woven materials
Non-woven materials used in road
building, construction, furniture and
fibres for agriculture
20%
FILMS BOPP-films
Metallisation of films 30%
INJECTION MOLDING Piece goods production for industrial
and household purposes 15%
THERMOFORMING
Cups
Containers for food
Thin wall packaging
5%
15
TOBOLSK-POLYMER GRADE RANGE IS GEARED TOWARDS BULK
MARKET SEGMENTS
0.128.128
153.204.0
128.128.128
208. 208.208
245.138.31
192.0.0
242. 242. 242
255.192.0
229.242.242
178.210.216
TOBOLSK-POLYMER – SUCCESSFUL LAUNCH OF A WORLD SCALE PDH-
PP CAPACITY IN RUSSIA
Tobolsk-Polymer PDH-PP plant has been successfully launched in Russia
The plant is well integrated into the feedstock business of Sibur and employs competitive
feedstock from Western Siberia and modern technologies
Project launch is expected to result in increased share of PP in total propylene
consumption in the Russian market
Tobolsk-Polymer launch will turn CIS PP market into surplus: up to 500 ktpa of the CIS
supply will have to be exported to the deficit regions of Asia and Europe given that the
plant enjoys strong position on the global cost curve
To support its increasing exports SIBUR has developed its sales network in both Asia and
Europe to offer its product to the customers
16