toba company presentation€¦ · company presentation april 2017 pt toba bara sejahtra tbk ......
TRANSCRIPT
1
PT Toba Bara Sejahtra Tbk (“Toba”)
Company PresentationApril 2017
PT Toba Bara Sejahtra Tbk (“Toba”)
Company PresentationApril 2017
Disclaimer
These materials have been prepared by PT Toba Bara Sejahtra Tbk (the “Company”).
These materials may contain statements that constitute forward-looking statements. These statements include
descriptions regarding the intent, belief or current expectations of the Company or its officers with respect to the
consolidated results of operations and financial condition of the Company. These statements can be recognized by
the use of words such as “expects,” “plan,” “will,” “estimates,” “projects,” “intends,” or words of similar meaning.
Such forward-looking statements are not guarantees of future performance and involve risks and uncertainties, and
actual results may differ from those in the forward-looking statements as a result of various factors and
assumptions. The Company has no obligation and does not undertake to revise forward-looking statements to
reflect future events or circumstances.
These materials are for information purposes only and do not constitute or form part of an offer, solicitation or
invitation of any offer to buy or subscribe for any securities of the Company, in any jurisdiction, nor should it or any
part of it form the basis of, or be relied upon in any connection with, any contract, commitment or investment
decision whatsoever. Any decision to purchase or subscribe for any securities of the Company should be made after
seeking appropriate professional advice.
2
Table of Contents
2
Company Profile
Performance Highlights
3
1
Strategy to Venture into Power
3
4
Performance HighlightsPerformance Highlights2 Company Profile1
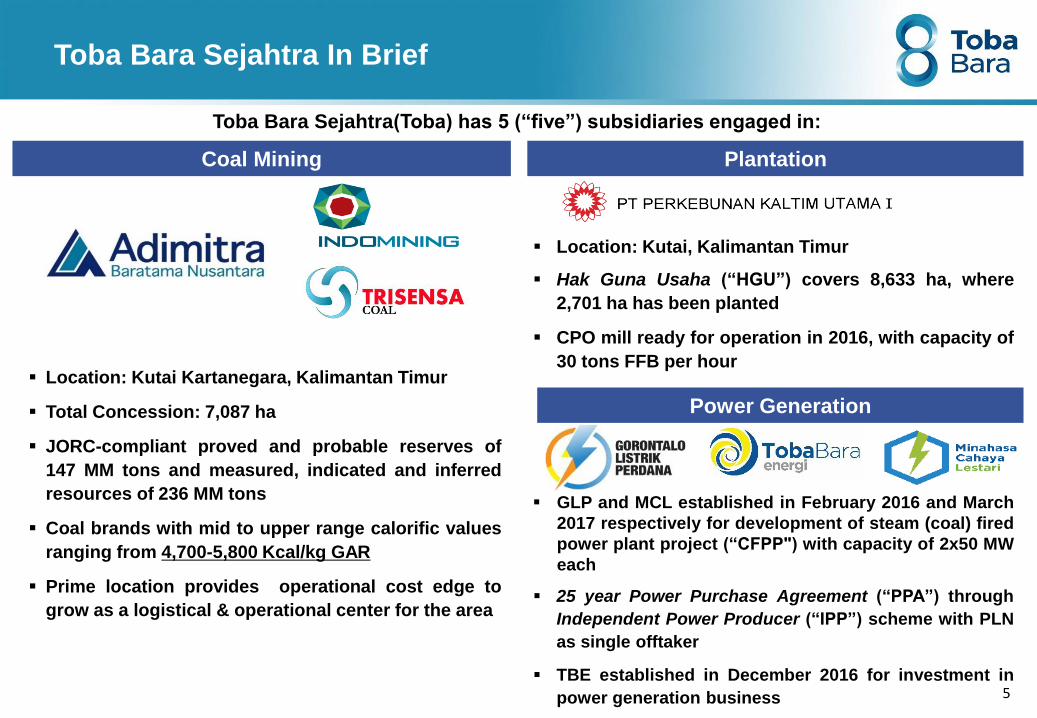
Location: Kutai, Kalimantan Timur
Hak Guna Usaha (“HGU”) covers 8,633 ha, where
2,701 ha has been planted
CPO mill ready for operation in 2016, with capacity of
30 tons FFB per hour
GLP and MCL established in February 2016 and March
2017 respectively for development of steam (coal) fired
power plant project (“CFPP") with capacity of 2x50 MW
each
25 year Power Purchase Agreement (“PPA”) through
Independent Power Producer (“IPP”) scheme with PLN
as single offtaker
TBE established in December 2016 for investment in
power generation business 5
Toba Bara Sejahtra In Brief
Location: Kutai Kartanegara, Kalimantan Timur
Total Concession: 7,087 ha
JORC-compliant proved and probable reserves of
147 MM tons and measured, indicated and inferred
resources of 236 MM tons
Coal brands with mid to upper range calorific values
ranging from 4,700-5,800 Kcal/kg GAR
Prime location provides operational cost edge to
grow as a logistical & operational center for the area
Coal Mining Plantation
Toba Bara Sejahtra(Toba) has 5 (“five”) subsidiaries engaged in:
Power Generation
Note:
1. PLN: PT Perusahaan Listrik Negara (Persero)
Ownership Structure
License
Area
Davit Togar
Pandjaitan
PT Bara Makmur
AbadiPT Toba Sejahtra Roby Budi Prakoso
PT Sinergi Sukses
Utama
61.79% 10.00% 6.25% 5.10%
PT Toba Bumi Energi
(“TBE”)
99.99%
99.99%
3.64%
51.00% 99.99%
Public *)
12.47%
90.00% 80.00%
Highland Strategic
Holdings Pte. Ltd.
0.75%
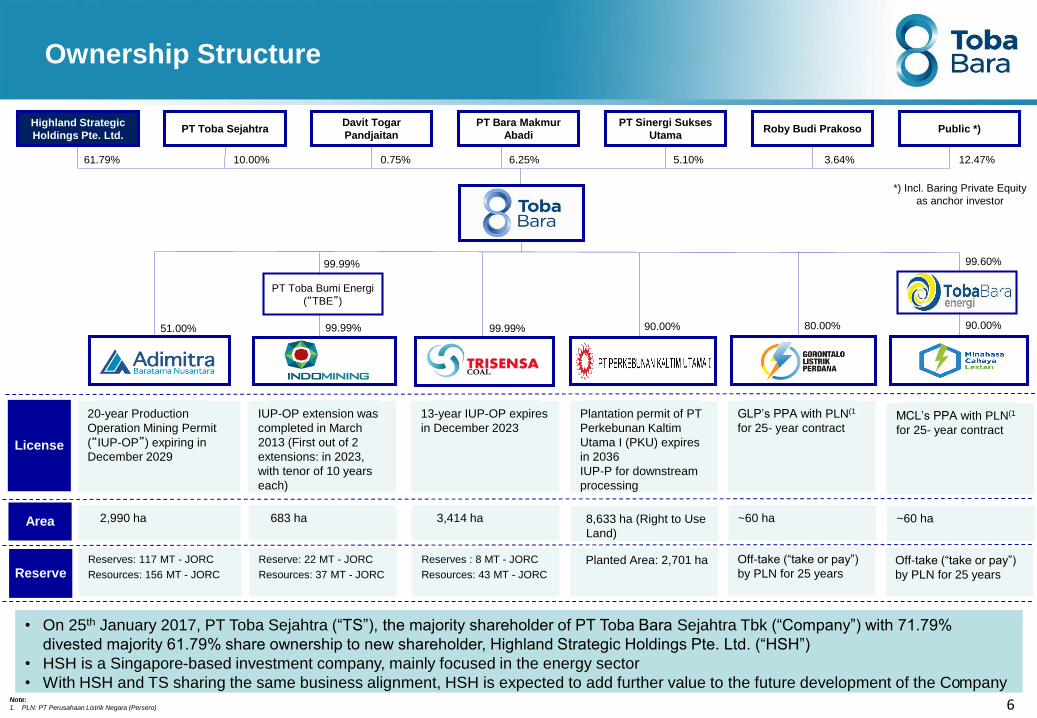
• On 25th January 2017, PT Toba Sejahtra (“TS”), the majority shareholder of PT Toba Bara Sejahtra Tbk (“Company”) with 71.79%
divested majority 61.79% share ownership to new shareholder, Highland Strategic Holdings Pte. Ltd. (“HSH”)
• HSH is a Singapore-based investment company, mainly focused in the energy sector
• With HSH and TS sharing the same business alignment, HSH is expected to add further value to the future development of the Company
6
*) Incl. Baring Private Equity
as anchor investor
90.00%
20-year Production
Operation Mining Permit
(“IUP-OP”) expiring in
December 2029
2,990 ha
IUP-OP extension was
completed in March
2013 (First out of 2
extensions: in 2023,
with tenor of 10 years
each)
683 ha
13-year IUP-OP expires
in December 2023
3,414 ha
Plantation permit of PT
Perkebunan Kaltim
Utama I (PKU) expires
in 2036
IUP-P for downstream
processing
8,633 ha (Right to Use
Land)
GLP’s PPA with PLN(1)
for 25- year contract
~60 ha
MCL’s PPA with PLN(1
for 25- year contract
~60 ha
Off-take (“take or pay”)
by PLN for 25 years
Planted Area: 2,701 ha Off-take (“take or pay”)
by PLN for 25 yearsReserveReserves: 117 MT - JORC
Resources: 156 MT - JORC
Reserve: 22 MT - JORC
Resources: 37 MT - JORC
Reserves : 8 MT - JORC
Resources: 43 MT - JORC
99.60%
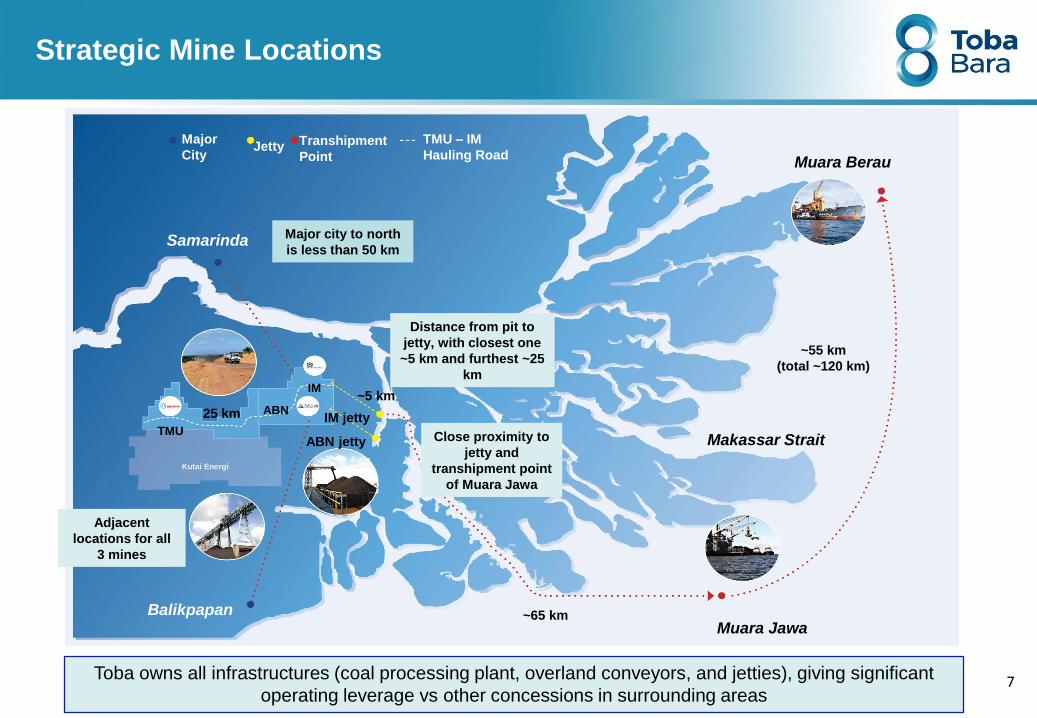
Strategic Mine Locations
Muara Berau
Muara Jawa
Makassar Strait
~55 km
(total ~120 km)
Balikpapan
Samarinda
~65 km
Major
CityJetty Transhipment
Point
TMU – IM
Hauling Road
Kutai Energi
TMU
ABN
IM
Major city to north
is less than 50 km
Adjacent
locations for all
3 mines
Close proximity to
jetty and
transhipment point
of Muara Jawa
Distance from pit to
jetty, with closest one
~5 km and furthest ~25
km
~5 km
IM jetty
ABN jetty
Toba owns all infrastructures (coal processing plant, overland conveyors, and jetties), giving significant
operating leverage vs other concessions in surrounding areas
25 km
7
TMU IM
ABN
TMU
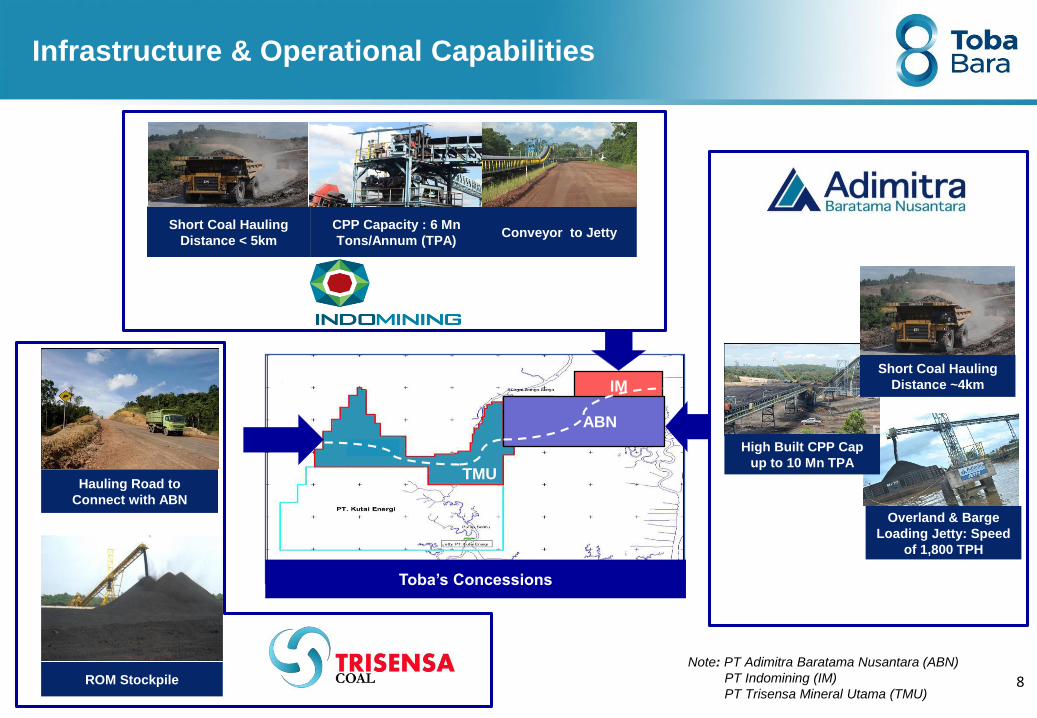
Overland & Barge
Loading Jetty: Speed
of 1,800 TPH
High Built CPP Cap
up to 10 Mn TPA
Short Coal Hauling
Distance < 5km
Hauling Road to
Connect with ABN
CPP Capacity : 6 Mn
Tons/Annum (TPA)Conveyor to Jetty
Short Coal Hauling
Distance ~4km
Infrastructure & Operational Capabilities
Toba’s Concessions
ROM Stockpile 8
Note: PT Adimitra Baratama Nusantara (ABN)
PT Indomining (IM)
PT Trisensa Mineral Utama (TMU)
9
Performance Highlights2
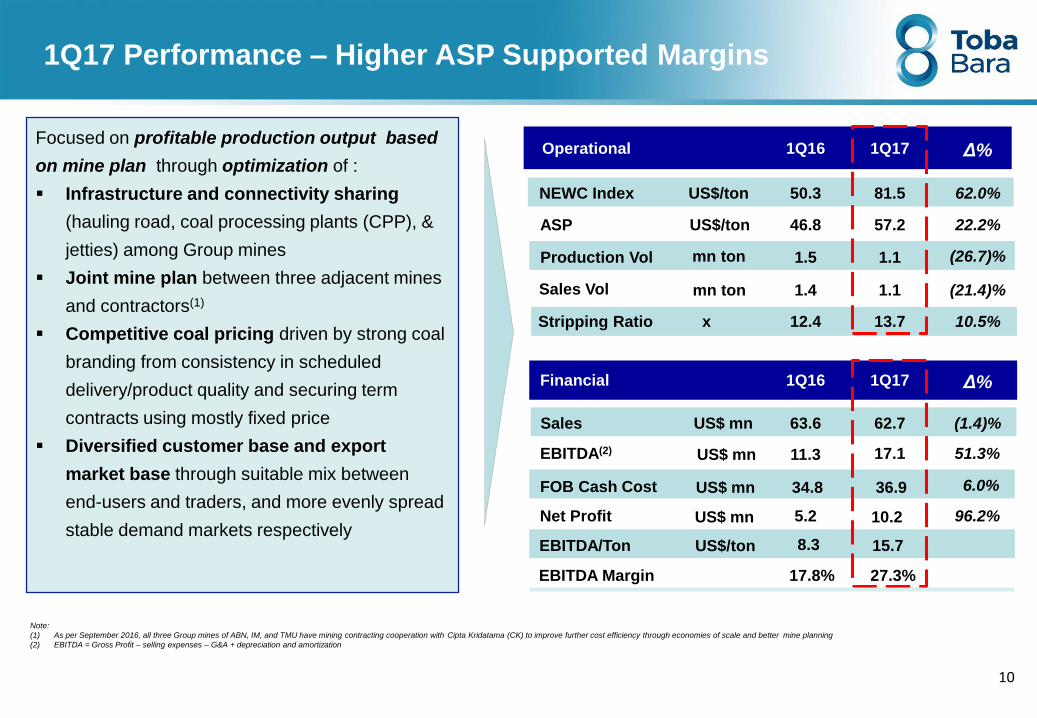
1Q17 Performance – Higher ASP Supported Margins
Operational 1Q16 1Q17 Δ%
Production Vol 1.5 1.1 (26.7)%
Sales Vol 1.4 1.1 (21.4)%
Stripping Ratio x 12.4 13.7 10.5%
Sales 63.6 62.7 (1.4)%
EBITDA(2) 11.3 17.1 51.3%
Net Profit 5.2 10.2 96.2%
Financial 1Q16 1Q17
46.8
NEWC Index 81.5 62.0%50.3
ASP 57.2 22.2%
mn ton
mn ton
US$/ton
US$/ton
US$ mn
US$ mn
US$ mn
Δ%
EBITDA/Ton 8.3 15.7
Focused on profitable production output based
on mine plan through optimization of :
Infrastructure and connectivity sharing
(hauling road, coal processing plants (CPP), &
jetties) among Group mines
Joint mine plan between three adjacent mines
and contractors(1)
Competitive coal pricing driven by strong coal
branding from consistency in scheduled
delivery/product quality and securing term
contracts using mostly fixed price
Diversified customer base and export
market base through suitable mix between
end-users and traders, and more evenly spread
stable demand markets respectively
Note:
(1) As per September 2016, all three Group mines of ABN, IM, and TMU have mining contracting cooperation with Cipta Kridatama (CK) to improve further cost efficiency through economies of scale and better mine planning
(2) EBITDA = Gross Profit – selling expenses – G&A + depreciation and amortization
EBITDA Margin 17.8% 27.3%
US$/ton
FOB Cash Cost US$ mn 34.8 36.9 6.0%
10
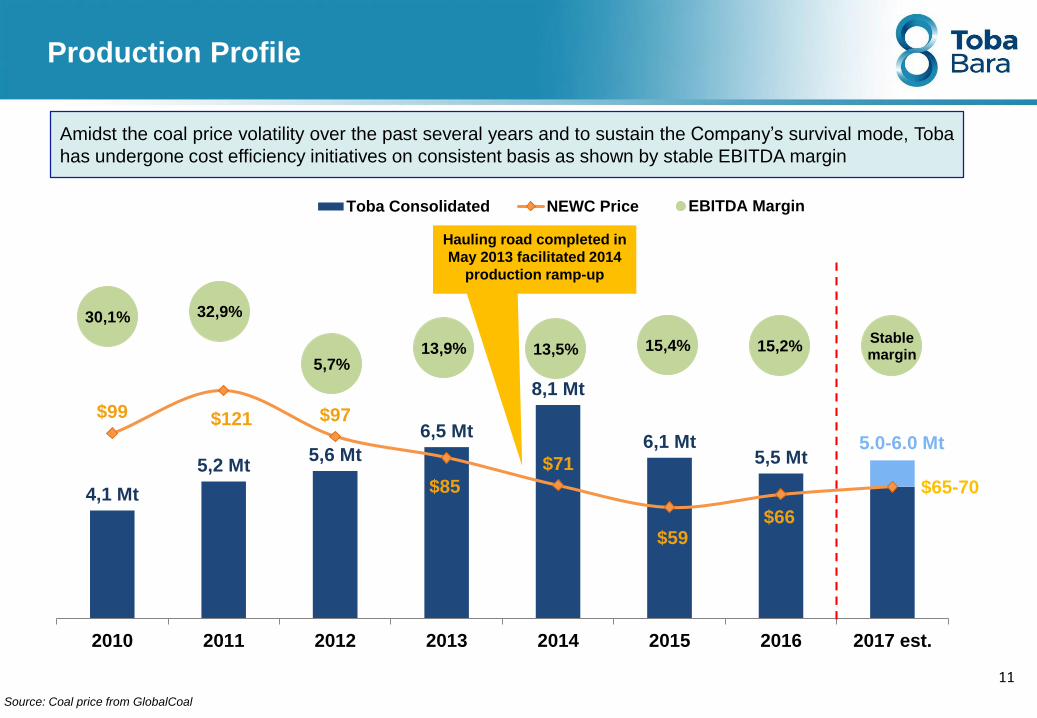
4,1 Mt
5,2 Mt5,6 Mt
6,5 Mt
8,1 Mt
6,1 Mt5,5 Mt
5.0-6.0 Mt
$99 $121 $97
$85
$71
$59$66
$65-70
0
20
40
60
80
100
120
140
0
1
2
3
4
5
6
7
8
9
10
2010 2011 2012 2013 2014 2015 2016 2017 est.
Toba Consolidated NEWC Price
30,1% 32,9%
5,7%13,9% 13,5% 15,4% 15,2%
Stablemargin
EBITDA Margin
Production Profile
11
Hauling road completed in
May 2013 facilitated 2014
production ramp-up
Source: Coal price from GlobalCoal
Amidst the coal price volatility over the past several years and to sustain the Company’s survival mode, Toba
has undergone cost efficiency initiatives on consistent basis as shown by stable EBITDA margin
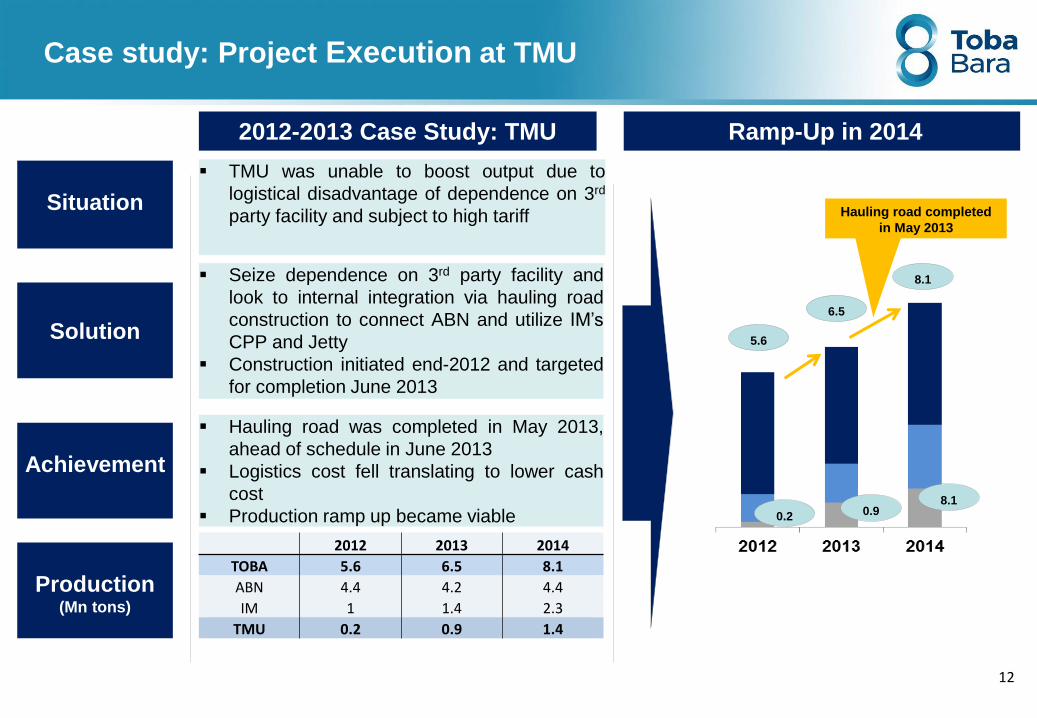
Case study: Project Execution at TMU
Situation
Solution
Seize dependence on 3rd party facility and
look to internal integration via hauling road
construction to connect ABN and utilize IM’s
CPP and Jetty
Construction initiated end-2012 and targeted
for completion June 2013
Achievement
Hauling road was completed in May 2013,
ahead of schedule in June 2013
Logistics cost fell translating to lower cash
cost
Production ramp up became viable
2012-2013 Case Study: TMU Ramp-Up in 2014
TMU was unable to boost output due to
logistical disadvantage of dependence on 3rd
party facility and subject to high tariff
Production(Mn tons)
8.1
6.5
5.6
0.2 0.98.1
Hauling road completed
in May 2013
2012 2013 2014
TOBA 5.6 6.5 8.1
ABN 4.4 4.2 4.4
IM 1 1.4 2.3
TMU 0.2 0.9 1.4
12
Quarterly Operational Performance
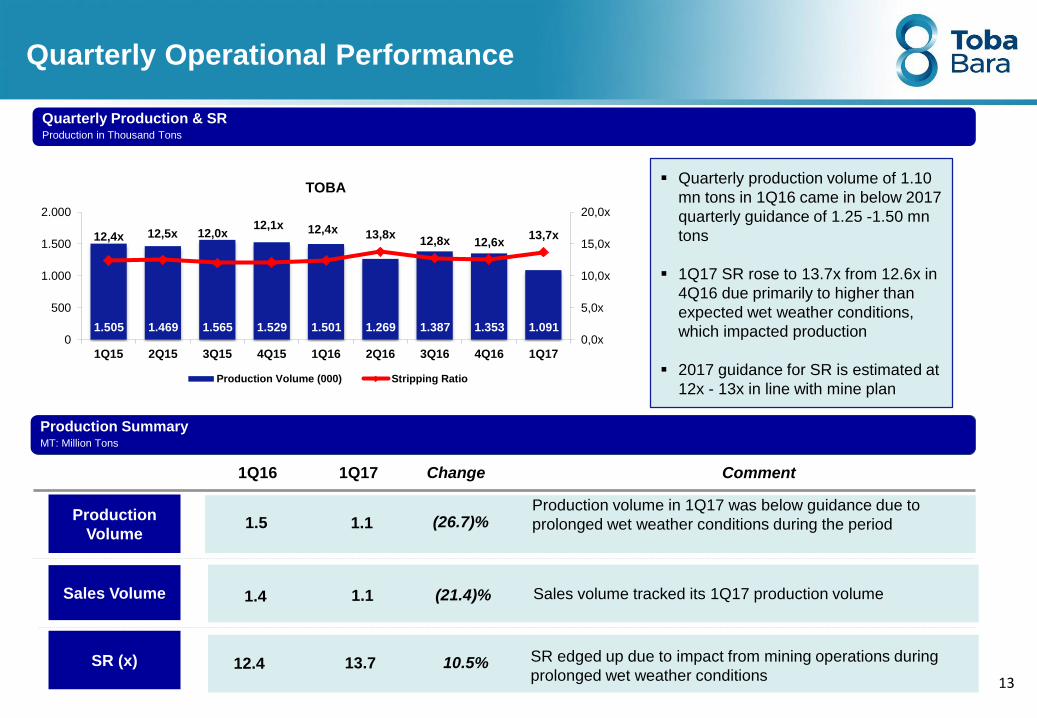
Quarterly Production & SRProduction in Thousand Tons
Production SummaryMT: Million Ton
1Q16 1Q17 Change Comment
Sales Volume
SR (x)
1.4 1.1
12.4 13.7
(21.4)%
10.5%
Sales volume tracked its 1Q17 production volume
SR edged up due to impact from mining operations during
prolonged wet weather conditions
1.5 1.1Production volume in 1Q17 was below guidance due to
prolonged wet weather conditions during the period(26.7)%Production
Volume
Production SummaryMT: Million Tons
Quarterly production volume of 1.10
mn tons in 1Q16 came in below 2017
quarterly guidance of 1.25 -1.50 mn
tons
1Q17 SR rose to 13.7x from 12.6x in
4Q16 due primarily to higher than
expected wet weather conditions,
which impacted production
2017 guidance for SR is estimated at
12x - 13x in line with mine plan
13
1.505 1.469 1.565 1.529 1.501 1.269 1.387 1.353 1.091
12,4x 12,5x 12,0x12,1x 12,4x 13,8x
12,8x 12,6x13,7x
0,0x
5,0x
10,0x
15,0x
20,0x
0
500
1.000
1.500
2.000
1Q15 2Q15 3Q15 4Q15 1Q16 2Q16 3Q16 4Q16 1Q17
TOBA
Production Volume (000) Stripping Ratio
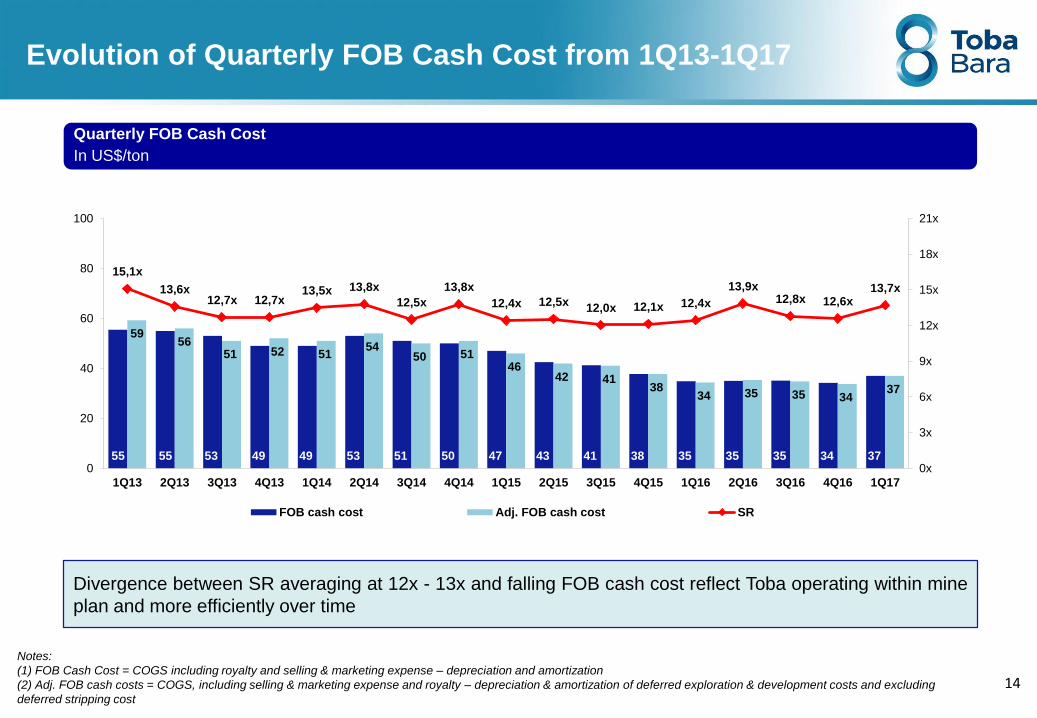
Evolution of Quarterly FOB Cash Cost from 1Q13-1Q17
Quarterly FOB Cash Cost
In US$/ton
Notes:
(1) FOB Cash Cost = COGS including royalty and selling & marketing expense – depreciation and amortization
(2) Adj. FOB cash costs = COGS, including selling & marketing expense and royalty – depreciation & amortization of deferred exploration & development costs and excluding
deferred stripping cost
Divergence between SR averaging at 12x - 13x and falling FOB cash cost reflect Toba operating within mine
plan and more efficiently over time
14
55 55 53 49 49 53 51 50 47 43 41 38 35 35 35 34 37
5956
51 52 51 54
50 51 46
42 41 38
34 35 35 34 37
15,1x
13,6x12,7x 12,7x
13,5x 13,8x
12,5x
13,8x
12,4x 12,5x12,0x 12,1x 12,4x
13,9x12,8x 12,6x
13,7x
0x
3x
6x
9x
12x
15x
18x
21x
0
20
40
60
80
100
1Q13 2Q13 3Q13 4Q13 1Q14 2Q14 3Q14 4Q14 1Q15 2Q15 3Q15 4Q15 1Q16 2Q16 3Q16 4Q16 1Q17
FOB cash cost Adj. FOB cash cost SR
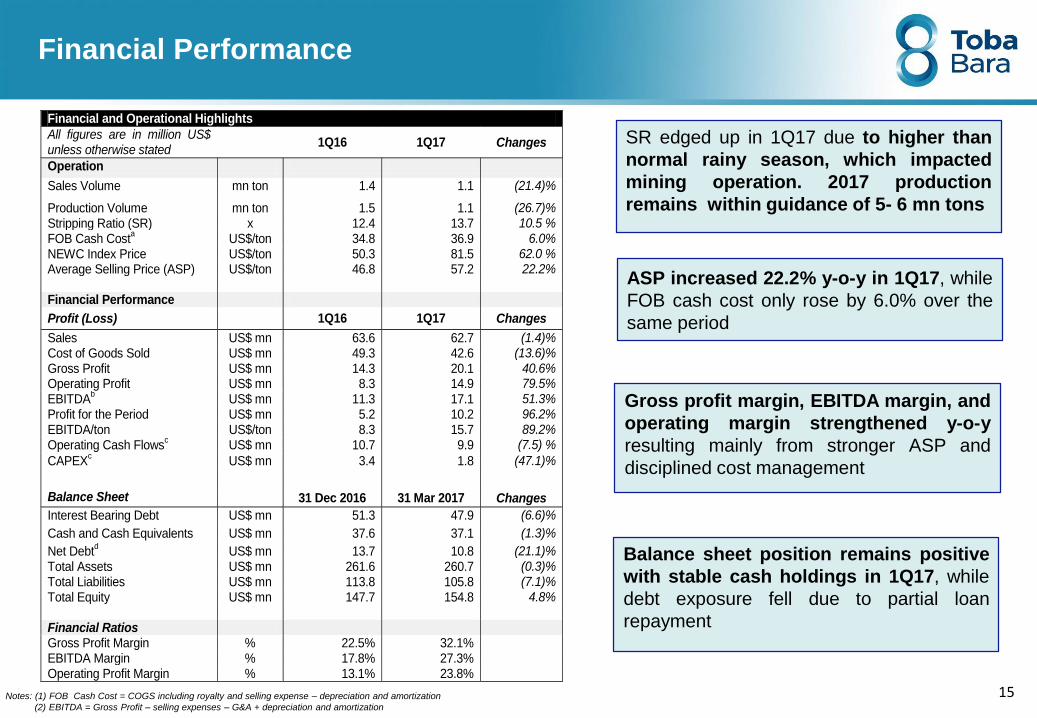
Financial Performance
Notes: (1) FOB Cash Cost = COGS including royalty and selling expense – depreciation and amortization
(2) EBITDA = Gross Profit – selling expenses – G&A + depreciation and amortization
ASP increased 22.2% y-o-y in 1Q17, while
FOB cash cost only rose by 6.0% over the
same period
Balance sheet position remains positive
with stable cash holdings in 1Q17, while
debt exposure fell due to partial loan
repayment
SR edged up in 1Q17 due to higher than
normal rainy season, which impacted
mining operation. 2017 production
remains within guidance of 5- 6 mn tons
15
Gross profit margin, EBITDA margin, and
operating margin strengthened y-o-y
resulting mainly from stronger ASP and
disciplined cost management
Financial and Operational Highlights
All figures are in million US$ unless otherwise stated
1Q16 1Q17 Changes
Operation
Sales Volume mn ton 1.4 1.1 (21.4)%
Production Volume mn ton 1.5 1.1 (26.7)%
Stripping Ratio (SR) x 12.4 13.7 10.5 % FOB Cash Cost
a US$/ton 34.8 36.9 6.0%
NEWC Index Price US$/ton 50.3 81.5 62.0 % Average Selling Price (ASP) US$/ton 46.8 57.2 22.2% Financial Performance
Profit (Loss) 1Q16 1Q17 Changes
Sales US$ mn 63.6 62.7 (1.4)% Cost of Goods Sold US$ mn 49.3 42.6 (13.6)% Gross Profit US$ mn 14.3 20.1 40.6% Operating Profit US$ mn 8.3 14.9 79.5% EBITDA
b US$ mn 11.3 17.1 51.3%
Profit for the Period US$ mn 5.2 10.2 96.2%
EBITDA/ton US$/ton 8.3 15.7 89.2% Operating Cash Flows
c US$ mn 10.7 9.9 (7.5) %
CAPEXc US$ mn 3.4 1.8 (47.1)%
Balance Sheet 31 Dec 2016 31 Mar 2017 Changes
Interest Bearing Debt US$ mn 51.3 47.9 (6.6)%
Cash and Cash Equivalents US$ mn 37.6 37.1 (1.3)%
Net Debtd US$ mn 13.7 10.8 (21.1)%
Total Assets US$ mn 261.6 260.7 (0.3)% Total Liabilities US$ mn 113.8 105.8 (7.1)% Total Equity US$ mn 147.7 154.8 4.8% Financial Ratios Gross Profit Margin % 22.5% 32.1%
EBITDA Margin % 17.8% 27.3% Operating Profit Margin % 13.1% 23.8%
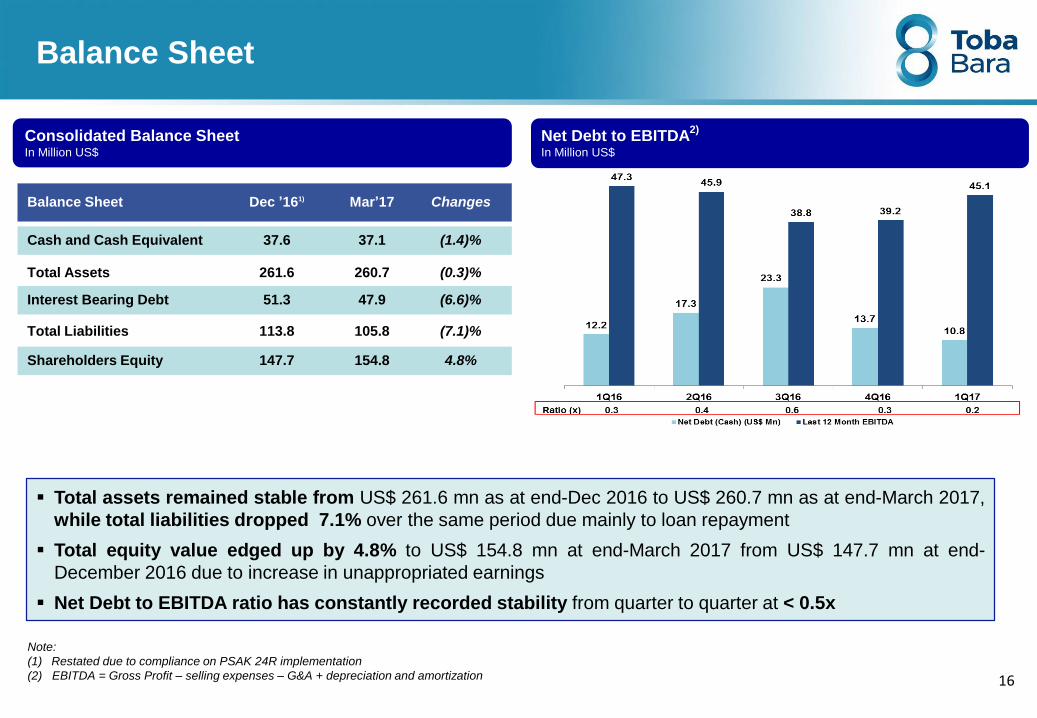
Balance Sheet
Consolidated Balance SheetIn Million US$
Net Debt to EBITDA2)
In Million US$
Total assets remained stable from US$ 261.6 mn as at end-Dec 2016 to US$ 260.7 mn as at end-March 2017,
while total liabilities dropped 7.1% over the same period due mainly to loan repayment
Total equity value edged up by 4.8% to US$ 154.8 mn at end-March 2017 from US$ 147.7 mn at end-
December 2016 due to increase in unappropriated earnings
Net Debt to EBITDA ratio has constantly recorded stability from quarter to quarter at < 0.5x
Note:
(1) Restated due to compliance on PSAK 24R implementation
(2) EBITDA = Gross Profit – selling expenses – G&A + depreciation and amortization 16
260.7Total Assets 261.6 (0.3)%
Interest Bearing Debt 47.951.3 (6.6)%
Total Liabilities 105.8113.8 (7.1)%
Shareholders Equity 154.8147.7 4.8%
Balance Sheet Dec ’161) ChangesMar’17
Cash and Cash Equivalent 37.6 (1.4)%37.1
Optimizing Selling Price & Product Quality
30
40
50
60
70
80
90
100
110
120
2012 2013 2014 2015 2016
NEWC ASP HBA
99% 97% 96%
63%71%
1% 3% 4%
37% 29%
Traders End-users
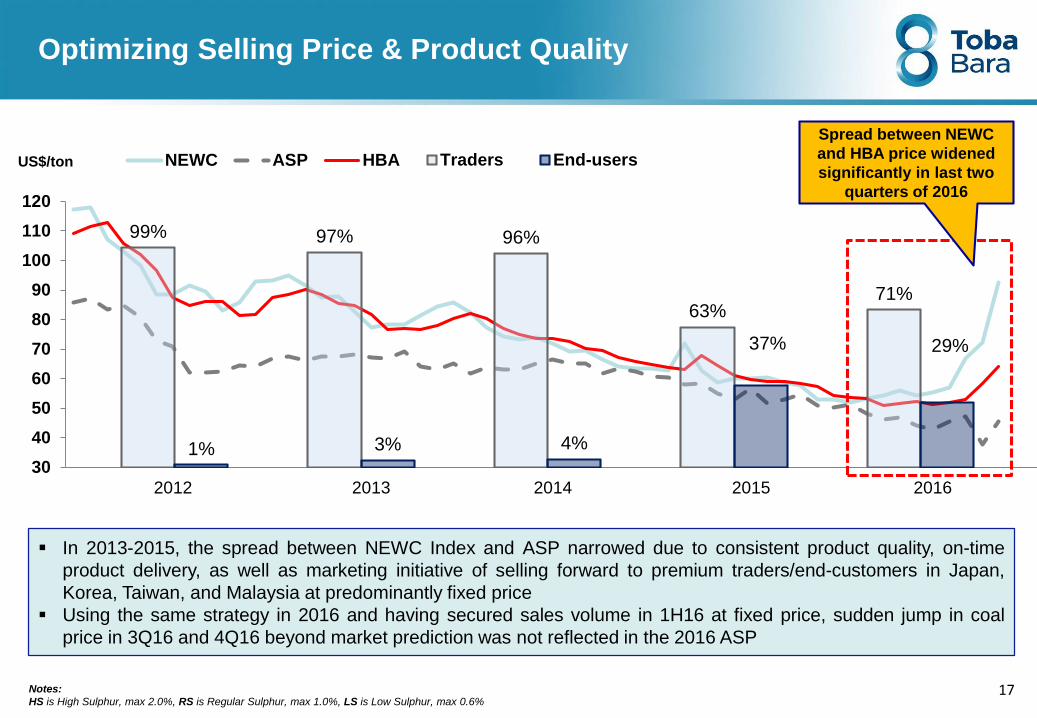
In 2013-2015, the spread between NEWC Index and ASP narrowed due to consistent product quality, on-time
product delivery, as well as marketing initiative of selling forward to premium traders/end-customers in Japan,
Korea, Taiwan, and Malaysia at predominantly fixed price
Using the same strategy in 2016 and having secured sales volume in 1H16 at fixed price, sudden jump in coal
price in 3Q16 and 4Q16 beyond market prediction was not reflected in the 2016 ASP
17Notes:
HS is High Sulphur, max 2.0%, RS is Regular Sulphur, max 1.0%, LS is Low Sulphur, max 0.6%
US$/ton
Spread between NEWC
and HBA price widened
significantly in last two
quarters of 2016
Diversified Export Market Base
Initiatives Undertaken:
Export Market Focus 2014-2016
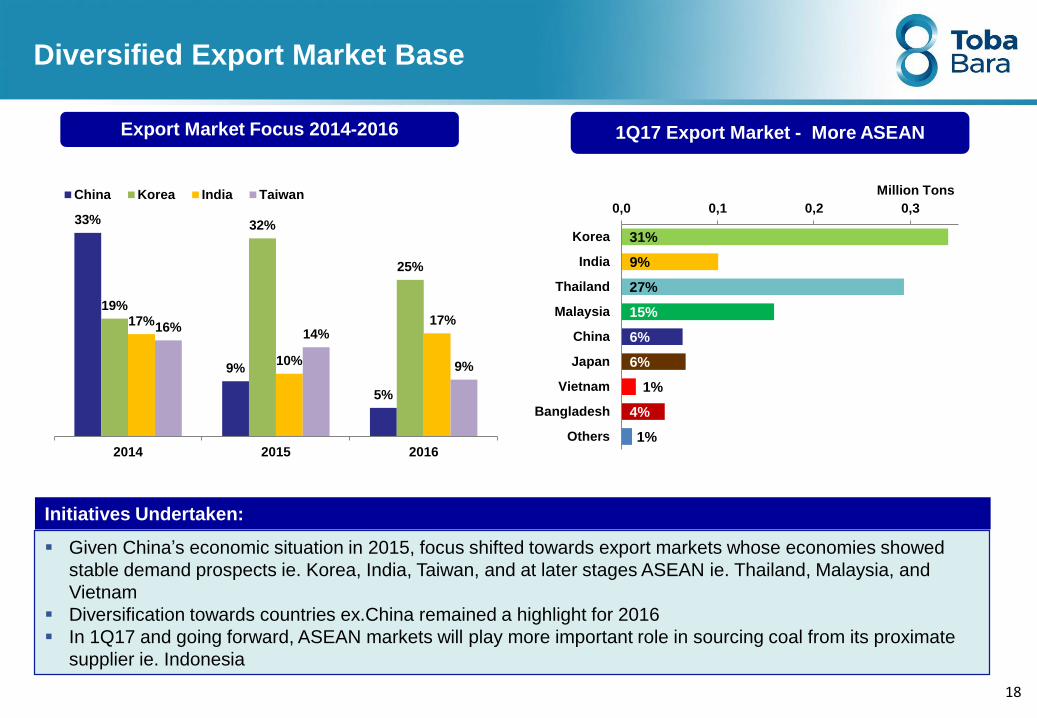
Given China’s economic situation in 2015, focus shifted towards export markets whose economies showed
stable demand prospects ie. Korea, India, Taiwan, and at later stages ASEAN ie. Thailand, Malaysia, and
Vietnam
Diversification towards countries ex.China remained a highlight for 2016
In 1Q17 and going forward, ASEAN markets will play more important role in sourcing coal from its proximate
supplier ie. Indonesia
18
1Q17 Export Market - More ASEAN
33%
9%
5%
19%
32%
25%
17%
10%
17%16%
14%
9%
2014 2015 2016
China Korea India Taiwan
31%
9%
27%
15%
6%
6%
1%
4%
1%
0,0 0,1 0,2 0,3
Korea
India
Thailand
Malaysia
China
Japan
Vietnam
Bangladesh
Others
Million Tons
Mid to Upper Quality Product Composition
Initiatives Undertaken:
Product Composition (GAR) 1Q17
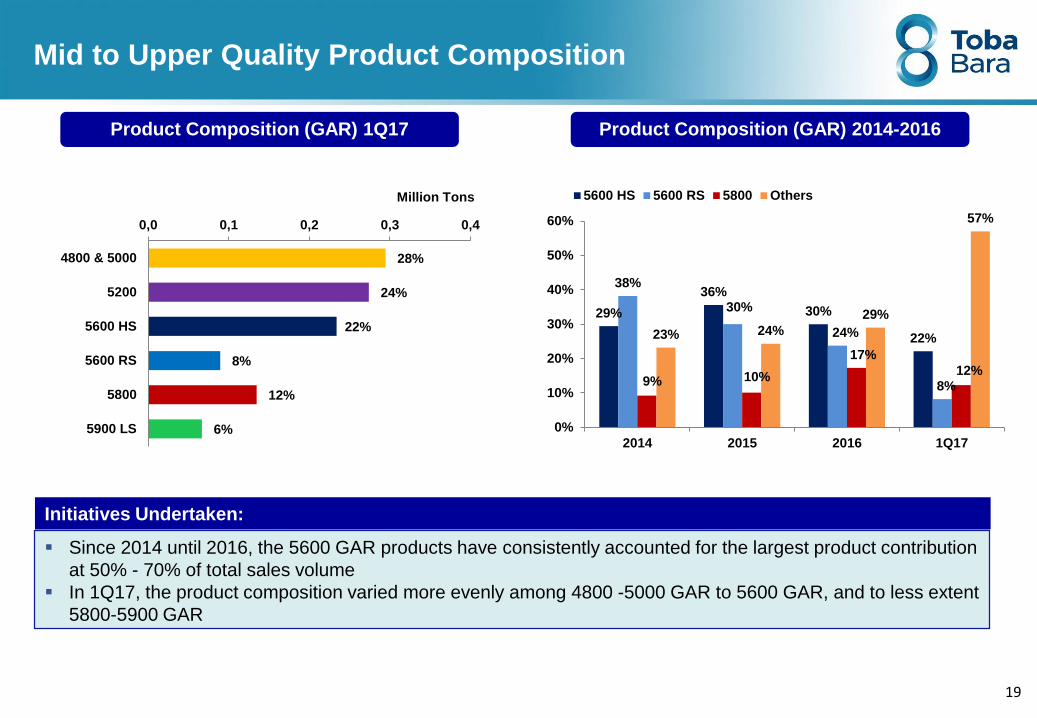
Since 2014 until 2016, the 5600 GAR products have consistently accounted for the largest product contribution
at 50% - 70% of total sales volume
In 1Q17, the product composition varied more evenly among 4800 -5000 GAR to 5600 GAR, and to less extent
5800-5900 GAR
19
Product Composition (GAR) 2014-2016
29%
36%
30%
22%
38%
30%
24%
8%9% 10%
17%
12%
23% 24%
29%
57%
0%
10%
20%
30%
40%
50%
60%
2014 2015 2016 1Q17
5600 HS 5600 RS 5800 Others
28%
24%
22%
8%
12%
6%
0,0 0,1 0,2 0,3 0,4
4800 & 5000
5200
5600 HS
5600 RS
5800
5900 LS
Million Tons
Snapshot of 2017F
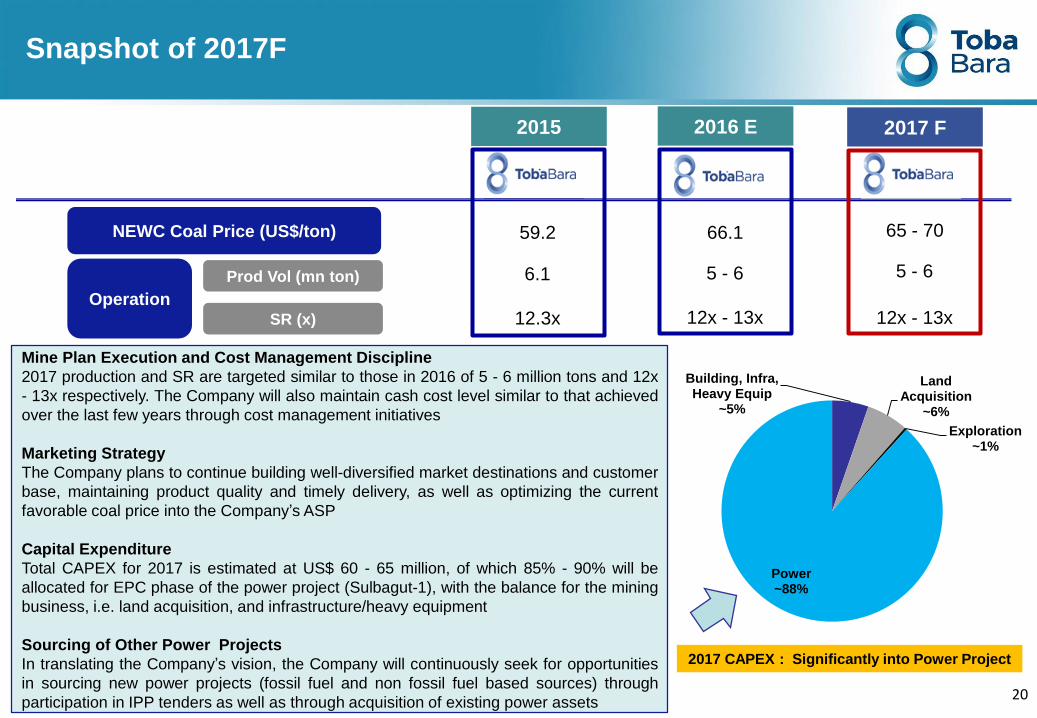
Operation
Prod Vol (mn ton)
SR (x) 12x - 13x
5 - 6
2015
12.3x
6.1
NEWC Coal Price (US$/ton) 66.159.2
Mine Plan Execution and Cost Management Discipline
2017 production and SR are targeted similar to those in 2016 of 5 - 6 million tons and 12x
- 13x respectively. The Company will also maintain cash cost level similar to that achieved
over the last few years through cost management initiatives
Marketing Strategy
The Company plans to continue building well-diversified market destinations and customer
base, maintaining product quality and timely delivery, as well as optimizing the current
favorable coal price into the Company’s ASP
Capital Expenditure
Total CAPEX for 2017 is estimated at US$ 60 - 65 million, of which 85% - 90% will be
allocated for EPC phase of the power project (Sulbagut-1), with the balance for the mining
business, i.e. land acquisition, and infrastructure/heavy equipment
Sourcing of Other Power Projects
In translating the Company’s vision, the Company will continuously seek for opportunities
in sourcing new power projects (fossil fuel and non fossil fuel based sources) through
participation in IPP tenders as well as through acquisition of existing power assets20
12x - 13x
5 - 6
2017 F
65 - 70
2016 E
Building, Infra, Heavy Equip
~5%
Land Acquisition
~6%
Exploration~1%
Power~88%
2017 CAPEX : Significantly into Power Project
21
Performance HighlightsPerformance Highlights2Strategy to Venture into Power3
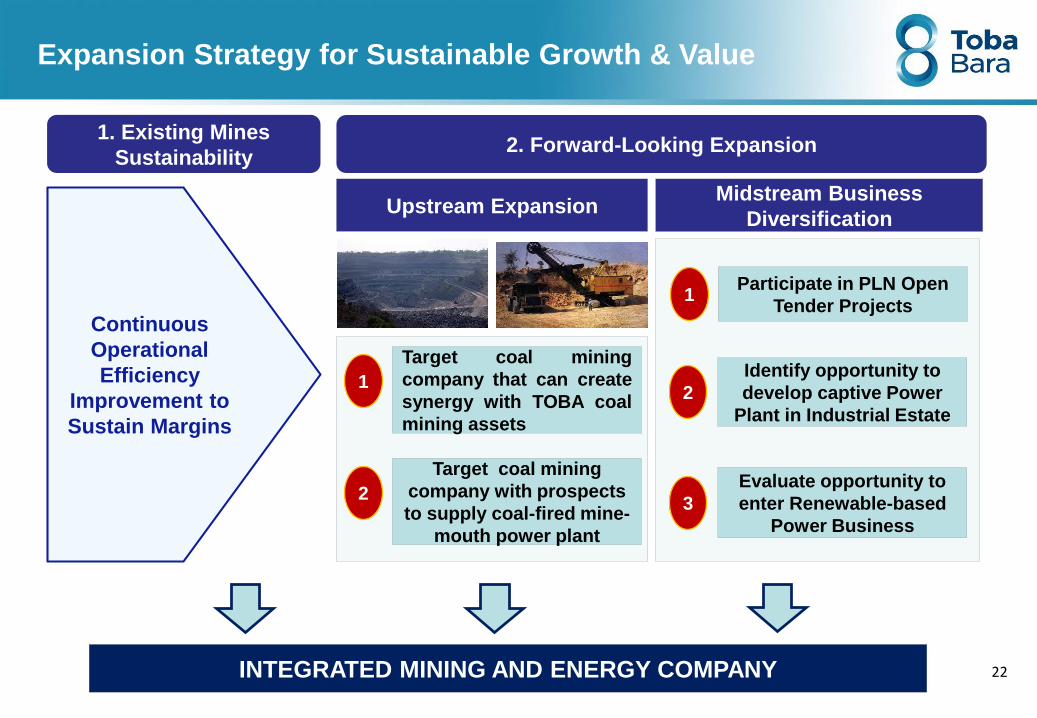
Expansion Strategy for Sustainable Growth & Value
22
2. Forward-Looking Expansion
Upstream Expansion
INTEGRATED MINING AND ENERGY COMPANY
Participate in PLN Open
Tender Projects 1
Identify opportunity to
develop captive Power
Plant in Industrial Estate
2
Evaluate opportunity to
enter Renewable-based
Power Business
3
Continuous
Operational
Efficiency
Improvement to
Sustain Margins
1. Existing Mines
Sustainability
Midstream Business
Diversification
Target coal mining
company that can create
synergy with TOBA coal
mining assets
1
Target coal mining
company with prospects
to supply coal-fired mine-
mouth power plant
2
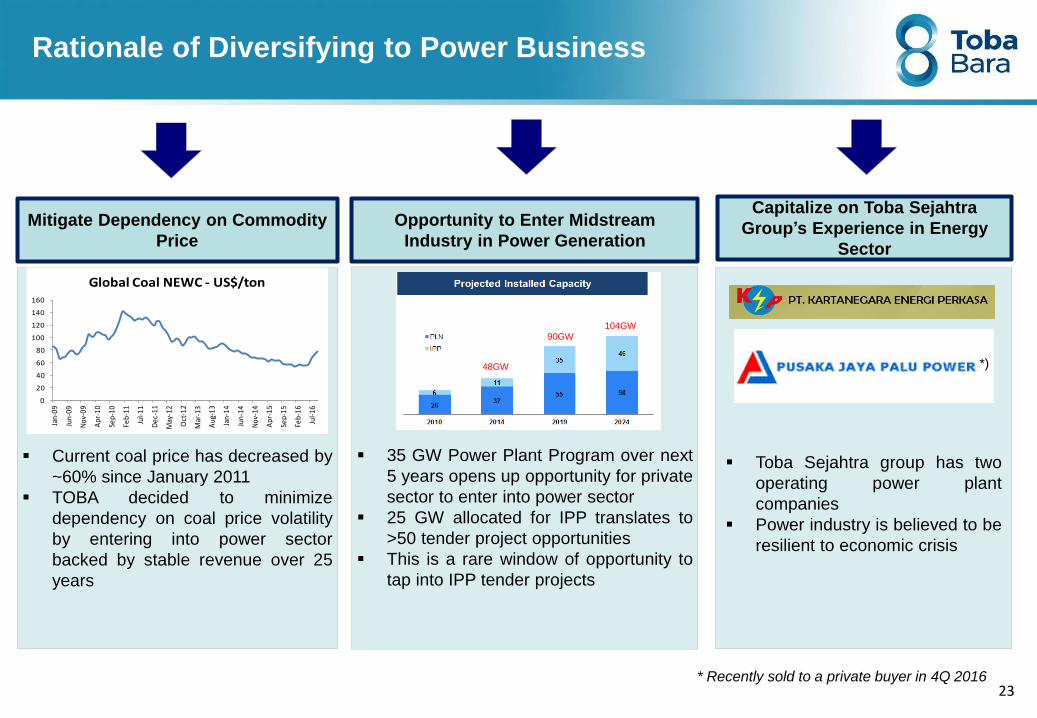
Rationale of Diversifying to Power Business
Mitigate Dependency on Commodity
Price
Opportunity to Enter Midstream
Industry in Power Generation
Capitalize on Toba Sejahtra
Group’s Experience in Energy
Sector
Current coal price has decreased by
~60% since January 2011
TOBA decided to minimize
dependency on coal price volatility
by entering into power sector
backed by stable revenue over 25
years
35 GW Power Plant Program over next
5 years opens up opportunity for private
sector to enter into power sector
25 GW allocated for IPP translates to
>50 tender project opportunities
This is a rare window of opportunity to
tap into IPP tender projects
Toba Sejahtra group has two
operating power plant
companies
Power industry is believed to be
resilient to economic crisis
48GW
90GW104GW
23
0
20
40
60
80
100
120
140
160
Jan-
09
Jun
-09
Nov
-09
Apr
-10
Sep-
10
Feb-
11
Jul-1
1
Dec
-11
May
-12
Oct
-12
Mar
-13
Aug
-13
Jan-
14
Jun
-14
Nov
-14
Apr
-15
Sep-
15
Feb-
16
Jul-1
6
Global Coal NEWC - US$/ton
* Recently sold to a private buyer in 4Q 2016
*)
24
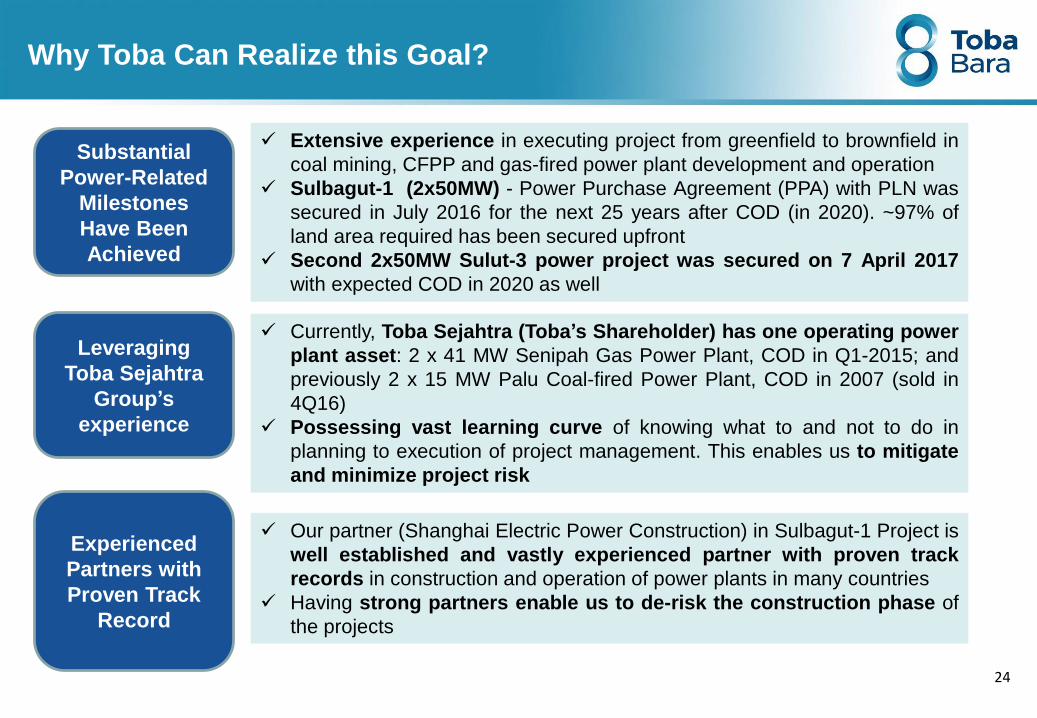
Why Toba Can Realize this Goal?
Extensive experience in executing project from greenfield to brownfield in
coal mining, CFPP and gas-fired power plant development and operation
Sulbagut-1 (2x50MW) - Power Purchase Agreement (PPA) with PLN was
secured in July 2016 for the next 25 years after COD (in 2020). ~97% of
land area required has been secured upfront
Second 2x50MW Sulut-3 power project was secured on 7 April 2017
with expected COD in 2020 as well
Our partner (Shanghai Electric Power Construction) in Sulbagut-1 Project is
well established and vastly experienced partner with proven track
records in construction and operation of power plants in many countries
Having strong partners enable us to de-risk the construction phase of
the projects
Substantial
Power-Related
Milestones
Have Been
Achieved
Experienced
Partners with
Proven Track
Record
Currently, Toba Sejahtra (Toba’s Shareholder) has one operating power
plant asset: 2 x 41 MW Senipah Gas Power Plant, COD in Q1-2015; and
previously 2 x 15 MW Palu Coal-fired Power Plant, COD in 2007 (sold in
4Q16)
Possessing vast learning curve of knowing what to and not to do in
planning to execution of project management. This enables us to mitigate
and minimize project risk
Leveraging
Toba Sejahtra
Group’s
experience
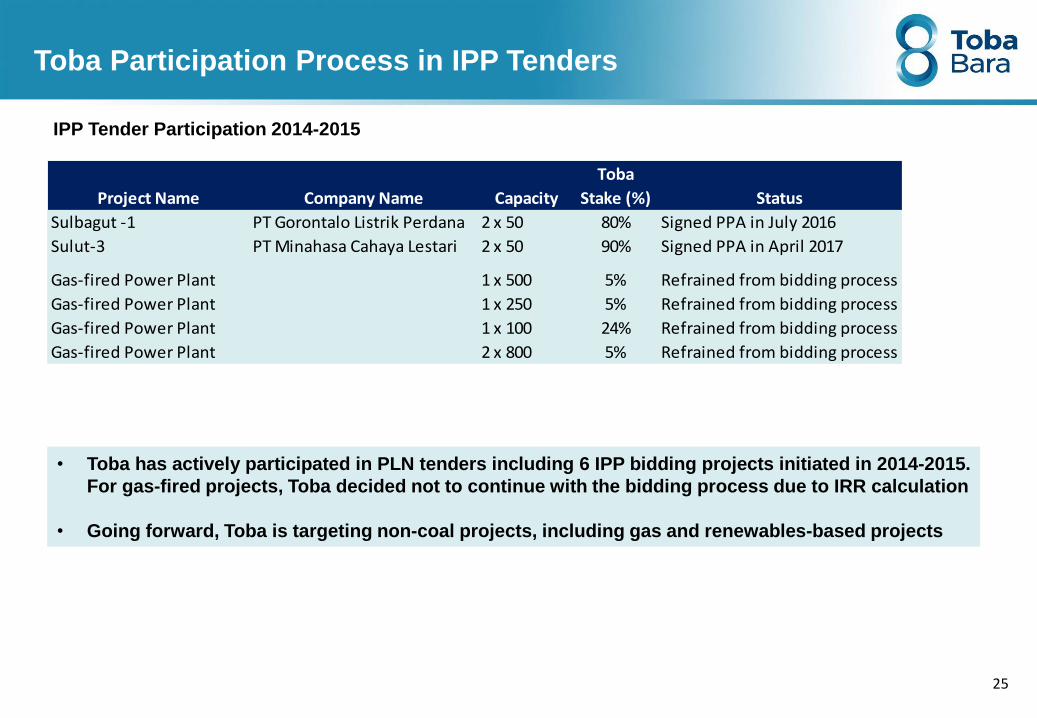
Toba Participation Process in IPP Tenders
IPP Tender Participation 2014-2015
• Toba has actively participated in PLN tenders including 6 IPP bidding projects initiated in 2014-2015.
For gas-fired projects, Toba decided not to continue with the bidding process due to IRR calculation
• Going forward, Toba is targeting non-coal projects, including gas and renewables-based projects
25
Project Name Company Name Capacity
Toba
Stake (%) Status
Sulbagut -1 PT Gorontalo Listrik Perdana 2 x 50 80% Signed PPA in July 2016
Sulut-3 PT Minahasa Cahaya Lestari 2 x 50 90% Signed PPA in April 2017
Gas-fired Power Plant 1 x 500 5% Refrained from bidding process
Gas-fired Power Plant 1 x 250 5% Refrained from bidding process
Gas-fired Power Plant 1 x 100 24% Refrained from bidding process
Gas-fired Power Plant 2 x 800 5% Refrained from bidding process
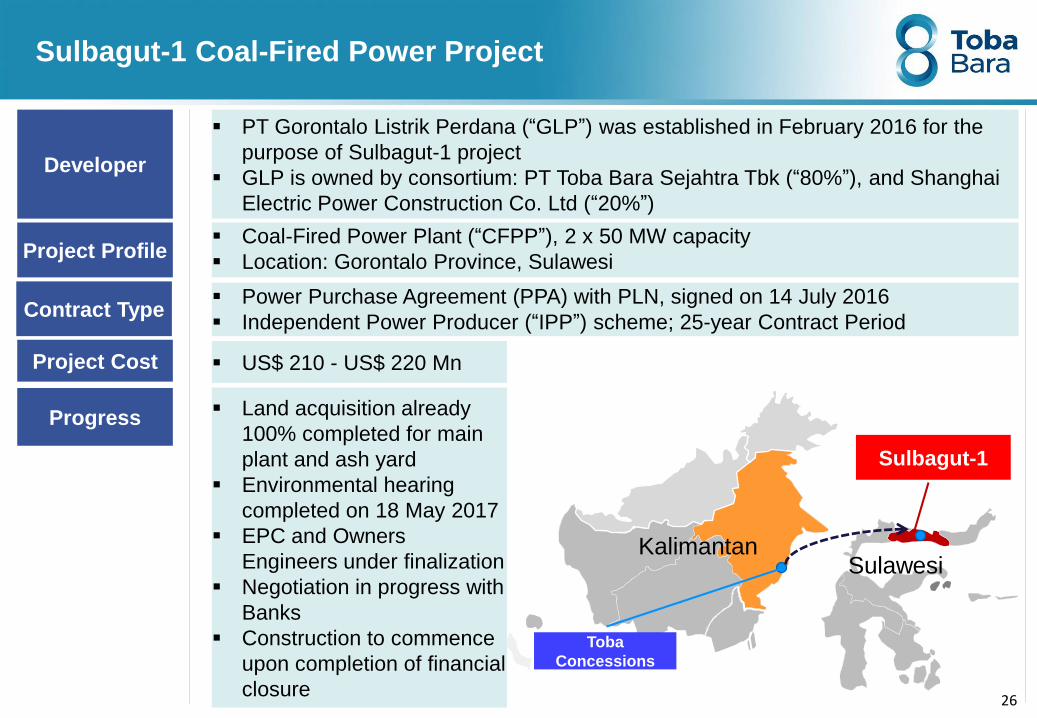
PT Gorontalo Listrik Perdana (“GLP”) was established in February 2016 for the
purpose of Sulbagut-1 project
GLP is owned by consortium: PT Toba Bara Sejahtra Tbk (“80%”), and Shanghai
Electric Power Construction Co. Ltd (“20%”)
Sulbagut-1 Coal-Fired Power Project
Developer
Contract Type Power Purchase Agreement (PPA) with PLN, signed on 14 July 2016
Independent Power Producer (“IPP”) scheme; 25-year Contract Period
Project Cost US$ 210 - US$ 220 Mn
Progress
Project Profile Coal-Fired Power Plant (“CFPP”), 2 x 50 MW capacity
Location: Gorontalo Province, Sulawesi
KalimantanSulawesi
Sulbagut-1
Toba
Concessions
26
Land acquisition already
100% completed for main
plant and ash yard
Environmental hearing
completed on 18 May 2017
EPC and Owners
Engineers under finalization
Negotiation in progress with
Banks
Construction to commence
upon completion of financial
closure
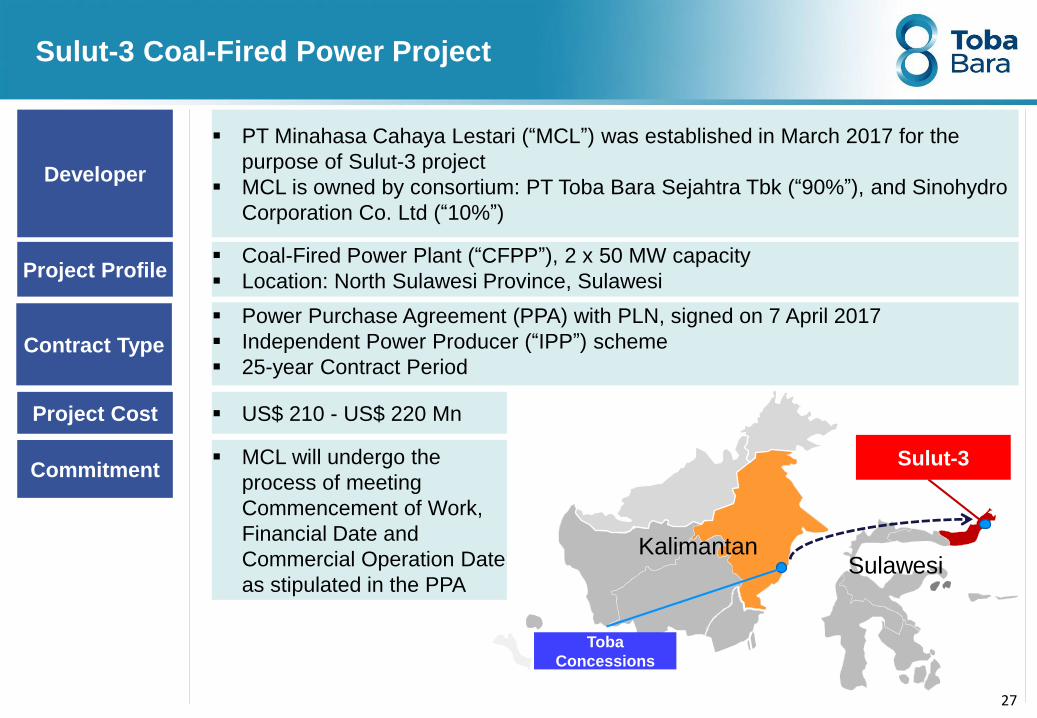
PT Minahasa Cahaya Lestari (“MCL”) was established in March 2017 for the
purpose of Sulut-3 project
MCL is owned by consortium: PT Toba Bara Sejahtra Tbk (“90%”), and Sinohydro
Corporation Co. Ltd (“10%”)
Sulut-3 Coal-Fired Power Project
Developer
Contract Type
Power Purchase Agreement (PPA) with PLN, signed on 7 April 2017
Independent Power Producer (“IPP”) scheme
25-year Contract Period
Project Cost US$ 210 - US$ 220 Mn
Commitment MCL will undergo the
process of meeting
Commencement of Work,
Financial Date and
Commercial Operation Date
as stipulated in the PPA
Project Profile Coal-Fired Power Plant (“CFPP”), 2 x 50 MW capacity
Location: North Sulawesi Province, Sulawesi
KalimantanSulawesi
Sulut-3
Toba
Concessions
27
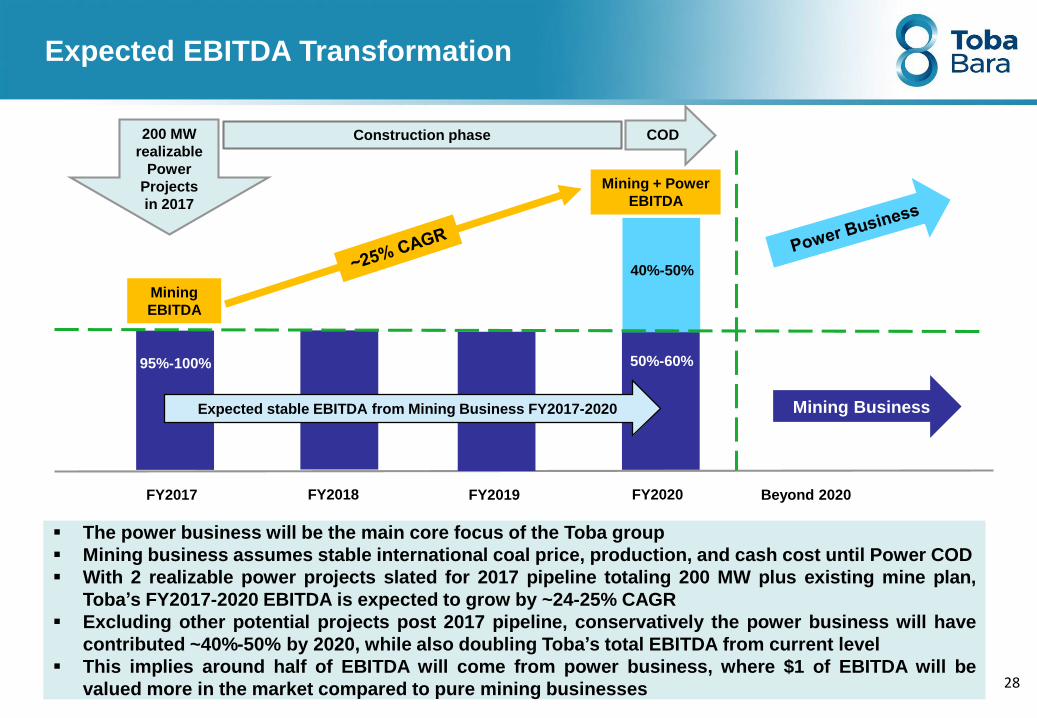
28
Mining
EBITDA
Expected stable EBITDA from Mining Business FY2017-2020
40%-50%
50%-60%
FY2017 FY2020 FY2019 FY2018
The power business will be the main core focus of the Toba group
Mining business assumes stable international coal price, production, and cash cost until Power COD
With 2 realizable power projects slated for 2017 pipeline totaling 200 MW plus existing mine plan,
Toba’s FY2017-2020 EBITDA is expected to grow by ~24-25% CAGR
Excluding other potential projects post 2017 pipeline, conservatively the power business will have
contributed ~40%-50% by 2020, while also doubling Toba’s total EBITDA from current level
This implies around half of EBITDA will come from power business, where $1 of EBITDA will be
valued more in the market compared to pure mining businesses
Expected EBITDA Transformation
Mining + Power
EBITDA
95%-100%
200 MW
realizable
Power
Projects
in 2017
Construction phase
Mining Business
Beyond 2020
COD
29
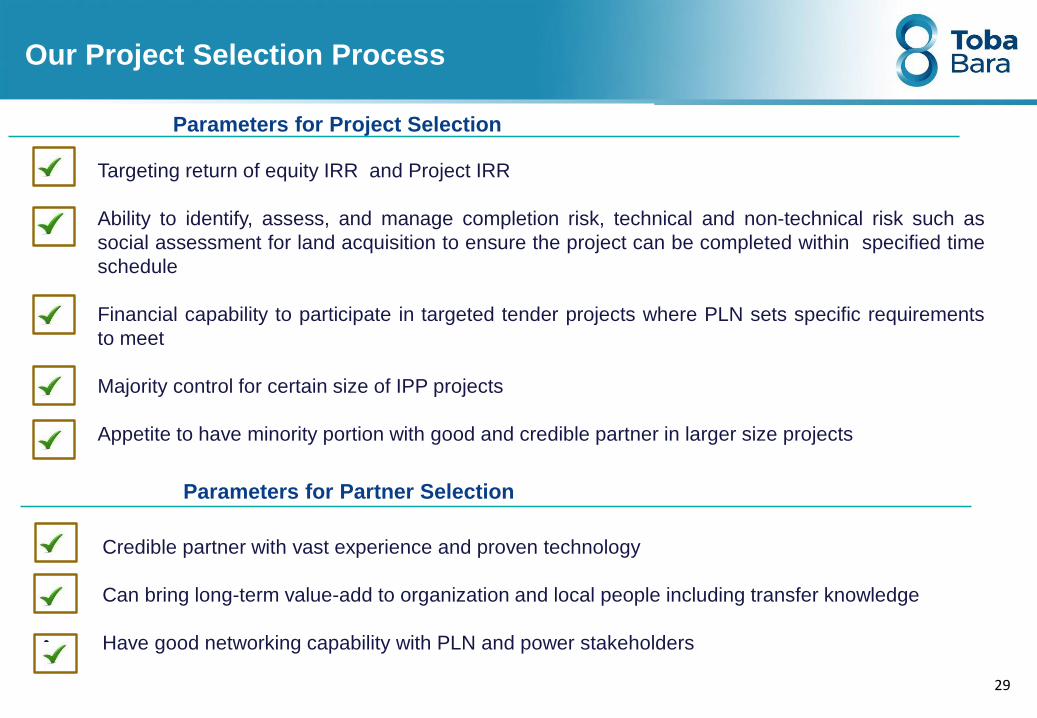
Our Project Selection Process
Targeting return of equity IRR and Project IRR
Ability to identify, assess, and manage completion risk, technical and non-technical risk such as
social assessment for land acquisition to ensure the project can be completed within specified time
schedule
Financial capability to participate in targeted tender projects where PLN sets specific requirements
to meet
Majority control for certain size of IPP projects
Appetite to have minority portion with good and credible partner in larger size projects
• Credible partner with vast experience and proven technology
• Can bring long-term value-add to organization and local people including transfer knowledge
• Have good networking capability with PLN and power stakeholders
Parameters for Project Selection
Parameters for Partner Selection
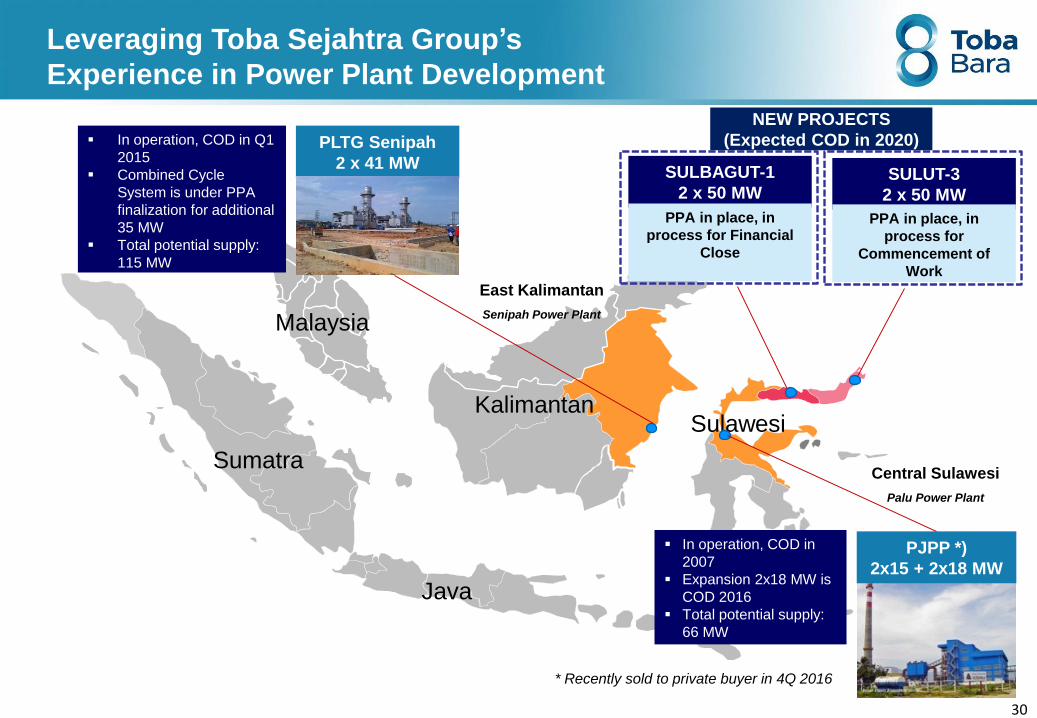
Leveraging Toba Sejahtra Group’s
Experience in Power Plant Development
Sumatra
Kalimantan
Java
Sulawesi
Malaysia
East Kalimantan
Senipah Power Plant
Central Sulawesi
Palu Power Plant
PLTG Senipah
2 x 41 MW
PJPP *)
2x15 + 2x18 MW
In operation, COD in Q1
2015
Combined Cycle
System is under PPA
finalization for additional
35 MW
Total potential supply:
115 MW
In operation, COD in
2007
Expansion 2x18 MW is
COD 2016
Total potential supply:
66 MW
30
SULBAGUT-1
2 x 50 MW
PPA in place, in
process for Financial
Close
NEW PROJECTS
(Expected COD in 2020)
* Recently sold to private buyer in 4Q 2016
SULUT-3
2 x 50 MW
PPA in place, in
process for
Commencement of
Work
THANK YOU
5.5%7.1% 7.5% 8.0%
6.4% 6.4% 6.4% 6.4% 6.4% 6.4%
217244
268292
315340
366394
425
457
0
50
100
150
200
250
300
350
400
450
500
0
0.05
0.1
0.15
0.2
0.25
0.3
2016 2017 2018 2019 2020 2021 2022 2023 2024 2025
839932
1,0111,089
1,1621,241
1,3221,409
1,5061,604
6.2% 6.0% 5.6% 5.0% 4.8%
156172
186 196 200
0
50
100
150
200
250
300
350
400
450
500
0
0.05
0.1
0.15
0.2
0.25
0.3
2011 2012 2013 2014 2015
646
702746
779 784
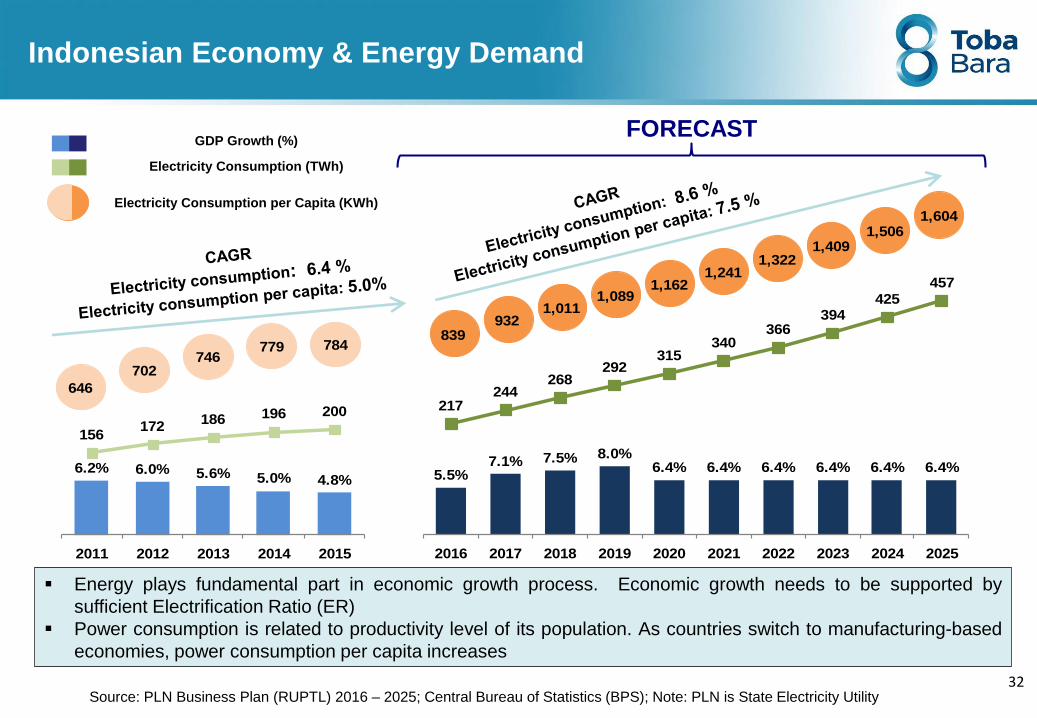
Indonesian Economy & Energy Demand
Source: PLN Business Plan (RUPTL) 2016 – 2025; Central Bureau of Statistics (BPS); Note: PLN is State Electricity Utility
Energy plays fundamental part in economic growth process. Economic growth needs to be supported by
sufficient Electrification Ratio (ER)
Power consumption is related to productivity level of its population. As countries switch to manufacturing-based
economies, power consumption per capita increases
GDP Growth (%)
Electricity Consumption (TWh)
Electricity Consumption per Capita (KWh)
FORECAST
32
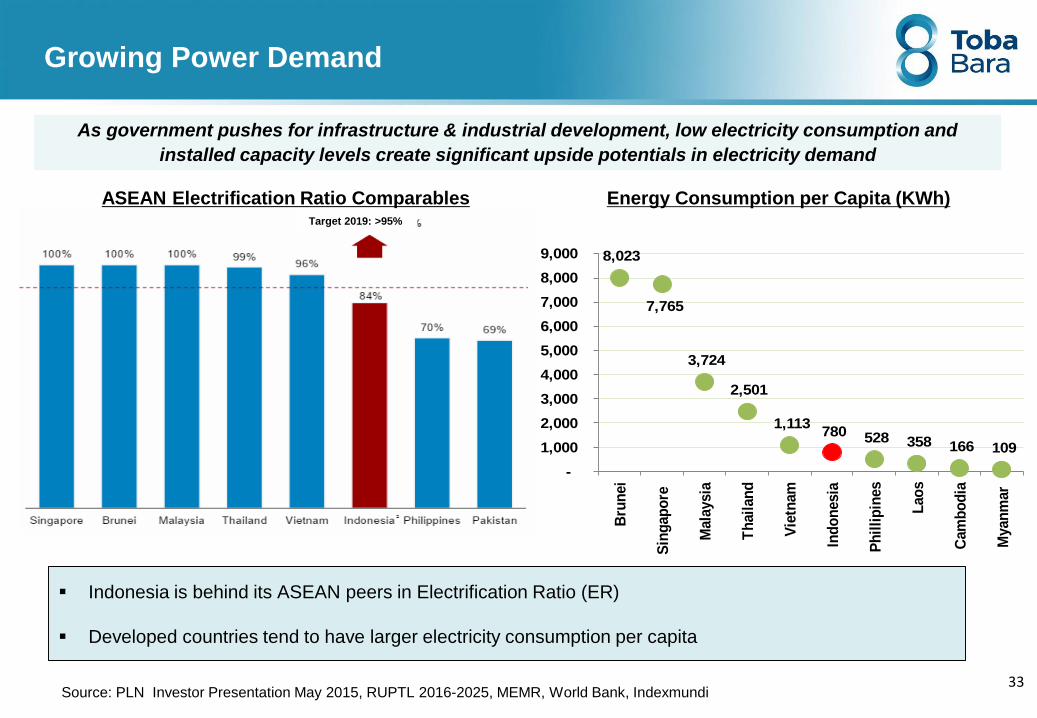
Growing Power Demand
As government pushes for infrastructure & industrial development, low electricity consumption and
installed capacity levels create significant upside potentials in electricity demand
Indonesia is behind its ASEAN peers in Electrification Ratio (ER)
Developed countries tend to have larger electricity consumption per capita
ASEAN Electrification Ratio ComparablesTarget 2019: >95%
Energy Consumption per Capita (KWh)
Source: PLN Investor Presentation May 2015, RUPTL 2016-2025, MEMR, World Bank, Indexmundi
8,023
7,765
3,724
2,501
1,113 780 528 358 166 109
-
1,000
2,000
3,000
4,000
5,000
6,000
7,000
8,000
9,000
Bru
nei
Sin
gap
ore
Mala
ysia
Th
ail
an
d
Vie
tnam
Ind
on
esia
Ph
illi
pin
es
Lao
s
Cam
bo
dia
Myan
mar
33
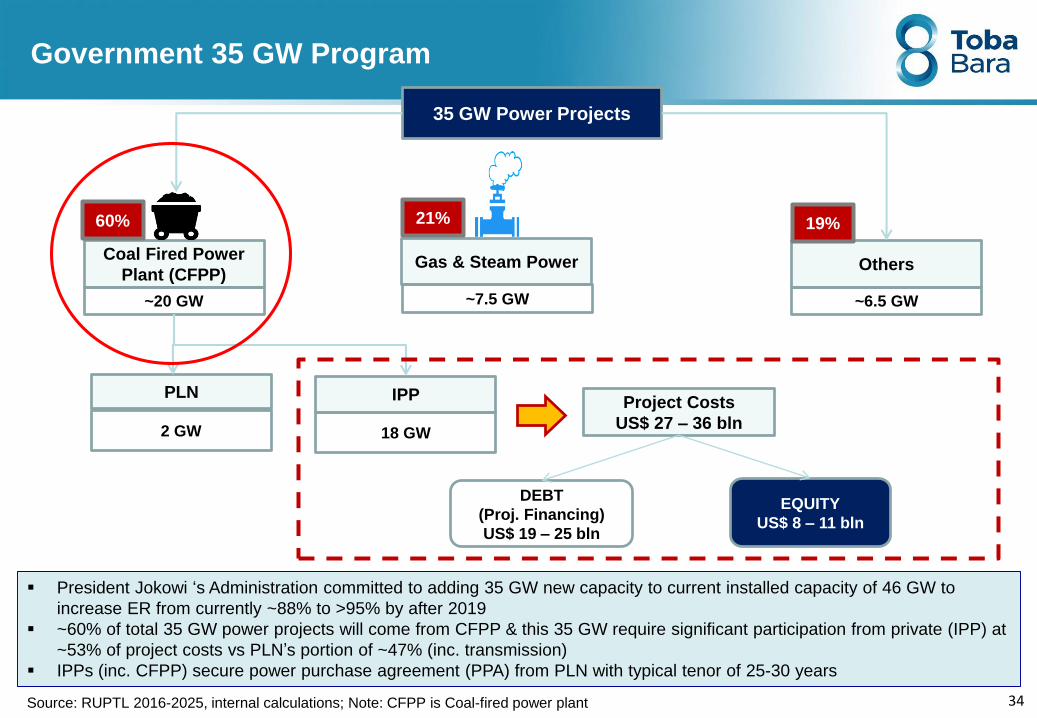
Government 35 GW Program
35 GW Power Projects
Coal Fired Power
Plant (CFPP)Gas & Steam Power Others
~20 GW ~7.5 GW ~6.5 GW
PLN
2 GW
IPP
18 GW
Project Costs
US$ 27 – 36 bln
60% 21% 19%
DEBT
(Proj. Financing)
US$ 19 – 25 bln
EQUITY
US$ 8 – 11 bln
President Jokowi ‘s Administration committed to adding 35 GW new capacity to current installed capacity of 46 GW to
increase ER from currently ~88% to >95% by after 2019
~60% of total 35 GW power projects will come from CFPP & this 35 GW require significant participation from private (IPP) at
~53% of project costs vs PLN’s portion of ~47% (inc. transmission)
IPPs (inc. CFPP) secure power purchase agreement (PPA) from PLN with typical tenor of 25-30 years
Source: RUPTL 2016-2025, internal calculations; Note: CFPP is Coal-fired power plant 34
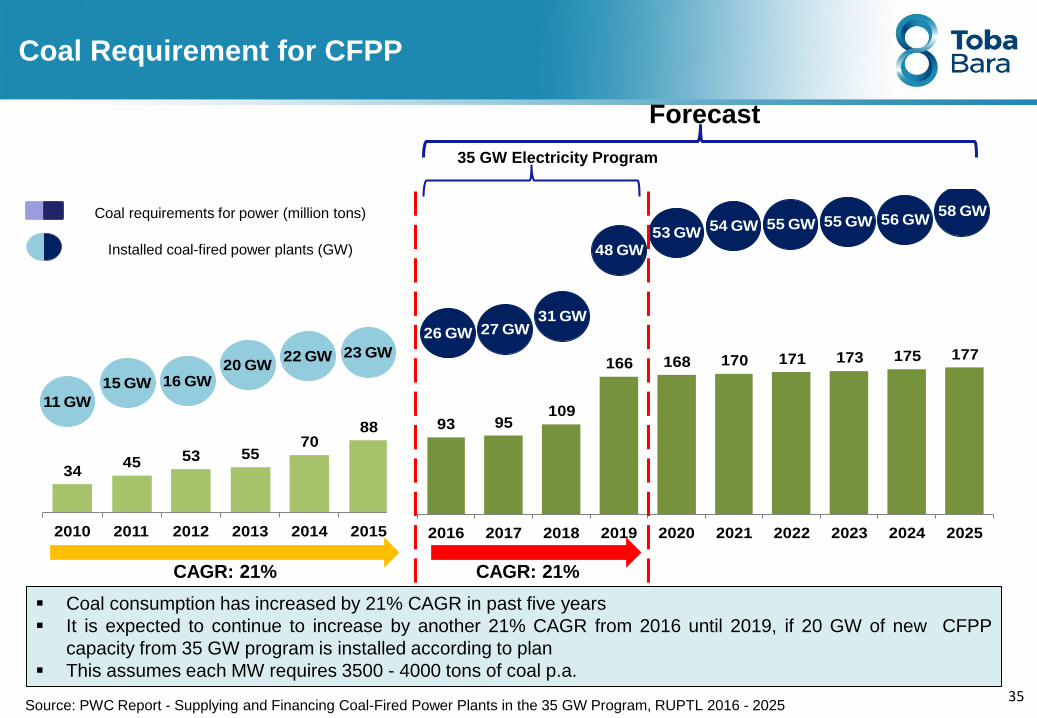
3445 53 55
7088
2010 2011 2012 2013 2014 2015
93 95109
166 168 170 171 173 175 177
2016 2017 2018 2019 2020 2021 2022 2023 2024 2025
11 GW
15 GW 16 GW20 GW
22 GW 23 GW
26 GW 27 GW31 GW
48 GW53 GW 54 GW 55 GW 55 GW 56 GW
58 GW
Coal Requirement for CFPP
Coal requirements for power (million tons)
Installed coal-fired power plants (GW)
CAGR: 21%CAGR: 21%
Coal consumption has increased by 21% CAGR in past five years
It is expected to continue to increase by another 21% CAGR from 2016 until 2019, if 20 GW of new CFPP
capacity from 35 GW program is installed according to plan
This assumes each MW requires 3500 - 4000 tons of coal p.a.
35 GW Electricity Program
Source: PWC Report - Supplying and Financing Coal-Fired Power Plants in the 35 GW Program, RUPTL 2016 - 2025
Forecast
35