to ulf, marcus, and sophie - uu.diva-portal.org433520/fulltext02.pdf · ii grunnesjö, m.i., ......
TRANSCRIPT


To Ulf, Marcus, and Sophie
T


List of Papers
This thesis is based on the following papers, which are referred to in the text by their Roman numerals.
I Grunnesjö, M., Bogefeldt, J, Blomberg, S., Delaney, H., Svärd-
sudd, K. (2006) The course of pain drawings during a 10-week treatment period in patients with acute and sub-acute low back pain. BMC Musculoskeletal disorders, 7:65
II Grunnesjö, M.I., Bogefeldt, J.P., Svärdsudd, K.F., Blomberg, S.I.E. (2004) A randomized controlled clinical trial of stay-active care versus manual therapy in addition to stay-active care: Functional variables and pain. Journal of manipulative and physiological therapeutics, 27:431–441
III Grunnesjö, M.I., Bogefeldt, J.P., Blomberg, S.I.E., Strender, L-E., Svärdsudd, K.F. A randomized controlled trial of the effects of muscle stretching, manual therapy and steroid injections in addition to ‘stay-active’ care on health-related quality of life in acute and sub-acute low back pain. Clinical rehabilitation in press
IV Grunnesjö, M.I., Bogefeldt, J.P., Blomberg, S.I.E., Strender, L-E., Svärdsudd, K.F. The contribution of pain drawings in the prediction of return to work in patients with acute or sub-acute low back pain. Manuscript.
Reprints were made with permission from the respective publishers.


Contents
Prologue ........................................................................................................ 10
Introduction ................................................................................................... 11 The nature of pain ..................................................................................... 11 Pain definitions ......................................................................................... 11 Low back pain .......................................................................................... 13 The pain drawing sketch ........................................................................... 14 Outcome measures in low back pain studies ............................................ 14 Low back pain treatment .......................................................................... 16
Stay-active care .................................................................................... 17 Muscle stretching ................................................................................. 17 Spinal manual treatment ...................................................................... 18 Steroid injections ................................................................................. 18
Problems in the study of low back pain treatment .................................... 19 The Gotland Low Back Pain study ........................................................... 20
Aims .............................................................................................................. 21
Study population and methods ...................................................................... 22 Study design ............................................................................................. 22 Study sampling ......................................................................................... 22 Treatments ................................................................................................ 25
Reference therapy ................................................................................ 25 Experimental therapy ........................................................................... 25 Treatment intensity .............................................................................. 27
Data collection .......................................................................................... 27 Masking and parallel treatment ............................................................ 31
Statistical considerations .......................................................................... 31 Considerations particular to Paper I ..................................................... 31 Considerations particular to Paper II ................................................... 32 Considerations particular to Paper III .................................................. 32 Considerations particular to Paper IV .................................................. 33
Results ........................................................................................................... 34 The pain drawing course (Paper I) ........................................................... 34 Pain drawings, pain intensity and functional variables (Paper I) ............. 36 Pain and disability variables (Paper II) ..................................................... 39

Health related quality of life (Paper III) ................................................... 42 Clinical indication score (Paper IV) ......................................................... 46 Effect on return to work (Paper IV) .......................................................... 46
Discussion ..................................................................................................... 50 Methodological issues .............................................................................. 50 The course of pain drawing sketch variables (Paper I) ............................ 52 Pain and disability variables (Paper II) ..................................................... 54 Health related quality of life (Paper III) ................................................... 56 Pain drawing prediction (Paper IV) .......................................................... 58
Conclusions ................................................................................................... 59
Acknowledgements ....................................................................................... 60
References ..................................................................................................... 62
Appendix ....................................................................................................... 76

Abbreviations
95% CI 95% confidence intervals DRI Disability Rating Index HR Hazards Ratio IASP International Association for the Study of Pain i.e. id est (that is) LBP Low Back Pain NSAID Non-Steroid Anti-Inflammatory Drugs PD Pain Drawing PDS Pain Drawing Score SBU The Swedish Council on Technology Assessment in Health Care SD Standard deviation VAS Visual analogue scale

10
Prologue
My fascination for musculoskeletal function started at an early age, when I was active in athletics. When choosing a career, that fascination led me into the field of manual therapy and a doctor of naprapthy degree [1]. As a doctor of naprapathy, focus of operandi lies in dysfunctions of the musculoskeletal system. Its fundament, i.e. that the system is malfunctioning due to muscle or joint impairment, appealed to me. Problem solving includes assessing the bodily assets with different manual therapies and matching home exercises to maintain the effect over time.
In practice, about half of the patients I met suffered from low back pain, of whom some could be helped, others not. That challenge started a search for answers in the literature, a far more daunting task than I had imagined. In the early 1990s there was no evidence for the effect of manual therapy on low back pain, or any other musculoskeletal pain. The Swedish Council of Technology Assessment (SBU) report from 1991 concluded that there was no evidence for effect of spinal manipulation on low back pain [2]. Still I saw in my everyday practice that patients with low back pain were benefit-ted from manual therapy, including spinal manipulation!
The lack of answers turned me some years later into research and Uppsala University, the latter because of their interest in scientific studies of manual therapy [3]. As a research student I had the opportunity to join a research group that was about to launch a new project, the ‘Gotland Low Back Pain study’, a randomised clinical trial in manual therapy on low back pain in a primary health care setting and on which material this thesis is based. My task was to aid in the finalisation of the data collection phase, participate in the intellectual work up of the data and publish the results. Thus, the ‘Got-land Low Back Pain study’ has for the last 12 years played a significant part of my life.
At the time of writing this thesis only moderate evidence for manual ther-apy on low back pain were at hand [4-6]. The bio-psychosocial explanation model [7, 8] had gained recognition and the challenge was rather to identify relevant subgroups to improve clinical outcome of low back pain in the indi-vidual [9-12]. The mechanisms behind the transition from acute to intermit-tent or chronic low back pain were not well established [13-15] and neither was the natural course of pain development in non-specific low back pain [16]. This thesis may provide some contributions in the search of knowledge in this field.

11
Introduction
The nature of pain In the survival of humans the pain experience has been helpful throughout the history. The acute pain makes the individual conscious that tissue dam-age or possible tissue damage is in the doing. The warning system helps to prevent further damage and acute pain is often referred to as adaptive [14, 17]. The cause of pain can at times be elusive and even when the probable cause of pain has been identified there is no guarantee that the treatment will be successful. The factors pain, physical impairment and the level of disabil-ity have been described as related to each other, but the relationship has been reported as modest and varies according to the duration of symptoms and clinical subgroups [18]. In chronic pain the relationship between demonstra-ble physical impairment and the accompanying degree of functional incapac-ity or psychological distress have been reported as weak [19].
The complexity of pain comprises of the unpleasant sensation in a part or parts of the body, and that the unpleasantness turns pain into an emotional experience [17] that includes our previous memories of pain, how it was tackled and the result of it. It also includes our ability to adapt to the situa-tion, the possibilities to adjust and to understand the changes of behaviour [20]. These gradual changes of behaviour have been suggested to be induced by several alterations in the brain function ending with a rearranged architec-ture of the brain and its functioning [14, 21].
To comprehend and successfully reduce pain most of the affected dimen-sions pain, attitudes and beliefs, psychological distress, illness behaviour and social environment, have to be targeted at the same time, Figure 1 [8]. Thus, the challenge of pain comprises of the subjective experience, which makes it unquestionable and thereby limits the ability to assess it with objective methods.
Pain definitions According to the International Association for the Study of Pain (IASP), pain is defined as ‘An unpleasant sensory and emotional experience associ-ated with actual or potential tissue damage, or described in terms of such damage’ [22]. Acute pain is usually defined as pain since 6 weeks or less,

12
Figure 1. Factors affecting pain and pain reduction. Modified from Waddell et al. [8].
sub-acute pain as pain since more than 6 but less than 12 weeks, and chronic pain as pain lasting for 12 weeks or more [23].
Musculoskeletal pain is defined as pain originating from the musculo-skeletal system. When the pain originates from the lower back to the gluteal fold it is usually defined as low back pain (LBP) [5]. Several other frequent-ly used synonymous terms are lower back pain, low back disorders, back pain trouble, backache, low back syndrome and low back injury. To reflect the often unknown origin of low back pain in a specific patient, the term non-specific low back pain is often used and is used in this thesis.
Pain radiation to one or both legs is usually included in the low back pain concept. The anatomical border for pain radiation is commonly defined as pain radiating below the gluteal fold into one or both legs [24]. Sciatica is defined as pain radiating below the knee in the distribution area of the sciatic nerve [5]. Herniated disc is often defined as a herniation of the nucleus pul-posus of an intervertebral disc through its fibrous outer covering, which may result in compression of adjacent nerve roots or other structures [5].
Neuropathic pain is commonly defined as pain arising as a direct conse-quence of a lesion or disease affecting the somatosensory system [25]. Neu-

13
rogenic pain and neuronal pain are usually used as synonyms to neuropathic pain.
Low back pain Low back pain is normally of medically harmless character and most epi-sodes (about 80%) ends within the first month [26-28]. The start of a low back pain episode could be the result of a trauma or have a spontaneous onset. The start could be gradual or acute, and relief is often received by treatment [29].
However, for some low back pain patients the episode has a longer dura-tion and the mechanisms behind this transition are still largely unknown. The putative prognostic factors include social factors (not working, low job satisfaction and no current sports activity), psychological factors (distress) and biological factors (high age, obesity, female sex) or a previous history of low back pain [28, 30, 31]. Also for patients with a protracted low back pain course, including sciatic pain, the prognosis might be less favourable [32].
Low back pain tends to have an intermittent course [16, 28]. Prevalence levels range from less than 10% to more than 75%; the wide range might be attributable to the differences in methodological approaches such as duration and anatomic site [26, 33]. The Swedish point prevalence, which is in line with the European levels, has been reported as 18.2% for 17 to 67 year olds [34].
The natural course of acute low back pain implies a fairly sudden onset and then a gradual decline of the intensity of symptoms and its extension [16, 35]. One attempt to describe low back pain reduction is by the centrali-sation phenomenon [36]. McKenzie narrated a pain reduction over time from distal painful areas to a gradual centralisation of pain to its origin in the low-er back. The centralisation phenomenon has been evaluated as reliable to examination and as a predictor of favourable treatment result [37-39].
The gradual decrease of symptoms has also been described in terms of the pain quality, i.e. pain modalities. This includes the perception that some pain modalities are more painful than others. The reported change of the pain quality over time has been described as a ‘pain modality shift’, a change from painful modalities to less painful ones [36]. The pain modalities have been sparsely studied. Four studies have reported pain modalities in low back pain patients, two as single measurements [40, 41] and two in chronic low back pain patients selected for surgery [42, 43]. In the latter studies a pain modality pattern could be distinguished, but the two reported patterns did not match each other. In one of the studies burning pain and frequent use of aching pain symbols indicated disc related pain [42]. In the other study, numbness was reported as the most painful one [43].

14
The pain drawing sketch In 1949, Harold Palmer suggested that pain drawing sketches could be used to distinguish functional pain from organic pain [44]. The pain drawing sketch is a visual tool, a body contour of a human frontal and dorsal projec-tion, in which the patient can express his or her pain using symbols to de-scribe the pain experience both to quality and extent of area [45]. It allows the patient to describe the pain experience in an uncomplicated way, fairly independent from language, and its evaluation is easy learned. Thus, the method has gained interest and has become widely used in clinical practice as an assessment tool of patients' subjective pain.
Ransford et al. [46] found strong association between some of the psy-chological functioning profiles and certain pain drawing patterns. The im-pact of this study was global and the pain drawing assessment method was widely adopted and still is. During the following ten years there were several attempts to reproduce these findings, however less successful than in the original report [47-49]. The non-successful reproduction efforts and the dif-ficulties to use the suggested assessment method triggered a development of different pain drawing assessment methods, both quantitative and qualitative ones.
Outcome measures in low back pain studies Outcomes in low back pain studies have been measured in multiple ways, both overall and more detailed. Examples of overall outcomes are the fre-quency and number of episodes, the number and types of medical consulta-tions, and return to work. Examples of more detailed outcome measures are pain intensity, disability and quality of life [50]. These outcomes appear to measure different aspects of low back pain recovery. In a study using overall as well as detailed outcomes, 99% returned to work, 75% still had impair-ment of activities of daily living, and more than 80% had symptoms or im-paired functional performance [51].
In medically oriented trials, primary outcomes tend to be return to work, pain and disability-oriented outcomes, and more seldom quality of life ori-ented. Health related quality of life and background factors are rather used to describe the studied group and possibly to facilitate subgroups analysis [13, 52-54]. The outcome return to work has two main grades, at work or still on workers’ compensation, but the worker’s compensation situation might be a scale with gradual return to work. The gradual onset of return to work and different sick leave systems have led to difficulties comparing various study results [55, 56].
The pain measurement focuses on pain intensity by visual analogue scales (usually 100 millimetre VAS) or the Borg scale [57]. The patients are in-

15
structed to mark the experienced pain intensity during the last 24 hours or during last week on the scale. Thus, the pain intensity score reflects a global mean over the actual period. However, pain extension measures, i.e. measures of the size of the area where the pain is coming from, have not been used as outcome in any study. In a Medline search no randomised con-trolled studies on acute low back pain with the pain drawing sketch as pri-mary outcome was found. The pain drawing sketch has been used on low back pain patients but rather to describe the patient group, classify the pa-tients, correlate pain patterns with other outcome instruments or to predict outcomes, for example treatment or radiological examination.
There are several instruments available to evaluate self-reported physical functioning. Two frequently used scales are the Oswestry scale [58] and the Roland-Morris scale [59, 60]. The Disability Rating Index [61] used in this study has not been frequently used in low back pain studies but was chosen to facilitate the comparison of results with those from a previous study, per-formed in Säter, Sweden [62]. However, the three instruments are quite similar, and contain 12 to 16 visual analogue scales for the patient to grade various aspects of everyday functioning.
Global quality of life includes health but also marital status, financial in-come and housing situation [63]. Health related quality of life is usually defined as a broad range of human experiences related to the individual’s overall wellbeing. It is idiosyncratic to the individual but intuitively mean-ingful and understandable to most people [64].
Health related quality of life may be measured with instruments, such as the Linton Score [65], the Euro Quality of life with five dimensions [66] and the Gothenburg Quality of Life (GQL) instrument [67]. The GQL instrument has been used in various settings, it is validated, found to be stable over time, found to be independent of diagnosis and treatment, and is simple to use and to interpret [67, 68].
Variables derived from the pain drawing sketch offer a number of addi-tional potential outcome measures. However, the use of pain drawing varia-bles as outcome measures in low back pain studies poses a number of prob-lems. Although most suggested evaluations are easily learned, there is no standard for the number of pain areas, for how to assess the information on the pain drawing sketch and there is no generally accepted evaluation model. This lack of standard has contributed to a variety of number of areas being used, ranging from two (one frontal and one dorsal area) to 61,102 areas. Pain drawings with a large number of areas rely on computer assisted evalu-ation methods [69]. The number of areas poses problems of underestimation or overestimation of painful areas and thereby sensitivity problems regarding the clinical course. Thus, the number of areas is either chosen for the specif-ic evaluation model or the specific study population [70].
The pain drawing sketch includes a variety of pain modalities for the pa-tient to choose from when describing the pain experience. The Scandinavian

16
model as described by Uden [71] is frequently used with its six pain modali-ties (‘cramps’, ‘pins and needles’, ‘numbness’, ‘burning’, ‘dull aching’ and ‘stabbing’). The pain drawing used in this study had seven pain modalities to describe the pain (the Scandinavian six plus ‘stiffness’).
The assessment methods may be ‘qualitative’, with processing of addi-tional information that some patients add on the pain drawing outside the body contour, or ‘quantitative’ with no such processing of additional infor-mation [72, 73]. Both methods have been tested for validity [46, 72, 74-76] and reproducibility [45]. However, the quantitative method has also been found to be stable over time and it has low inter-rater variation [45, 69].
The variety of outcome measures leaves the result of a study difficult to compare with those of other studies. To address this dilemma consensus statements on what outcome measures to be used in studying low back pain have been proposed [13].
Low back pain treatment The non-specific low back pain origin and the unidentified transition of pain development leave the process of understanding low back pain far from fully elucidated. This uncertainty is reflected in the vast number of available non-specific low back pain treatment methods.
There are numerous reviews on treatment methods. In the Cochrane Back Review Group database, 36 reviews on lumbar back pain studies were per-formed during 2002-2011 [77]. The use of non-steroidal drugs, the methods bed rest, exercises, acupuncture, multimodal rehabilitation and more recently spinal manipulation therapy were assessed [52, 78-82]. Non-steroidal drugs, acupuncture, spinal manipulation and active therapies such as multimodal rehabilitation and exercises were generally considered effective or moderate-ly effective for acute and sub-acute low back pain, while passive mono-therapies, such as bed rest, massage, ultrasound, electrotherapy, laser treat-ment and traction were not recommended since these therapies might in-crease illness behaviour and chronicity [83].
Thus, the treatment of low back pain poses a challenge. The abundant number of methods creates a scope for the therapist to use after his or her experience. The recommended management includes medical history and examination to rule out other conditions, information on the importance of staying active, judicious use of drugs, consideration of psychosocial situa-tion and for selected patients laboratory tests and imaging tests [83, 84]. At the time of planning this study, the evidence for the effectiveness of the stay-active care was incomplete and its role in appropriate handling of low back pain was not established [2, 85].
Manual therapy includes several treatment tools, such as various soft tis-sue treatments, specific spinal mobilisation and spinal manipulation, often

17
supported with traction therapy [4, 86]. Soft tissue treatments include vari-ous types of massage, muscle stretching and soft tissue pressure, i.e. liga-ment-, muscle- or trigger point pressure [1, 87]. Manual therapies have in common that various diagnostic or treatment manoeuvres are used. Manual therapy is often combined with exercises, such as specific muscle stabilisa-tion training in combination with specific muscle stretching.
The treatment manoeuvres are performed with a large variety of methods individual to the practitioner. The practitioners include doctors of chiroprac-tic, doctors of naprapathy, doctors of osteopathy, and physicians and physio-therapists trained in manual therapy. Acceptance of the various professions as health care providers varies between countries. The treatment methods are classified as complementary or alternative medicine, even though some practitioners performing these methods belong to the ordinary healthcare system. In the following text sections the content and effect evidence of the treatments used in this thesis are presented.
Stay-active care The basic management of low back pain, stay-active care, has strong to moderate evidence in non-specific acute low back pain [6, 27, 88]. It is noteworthy that patients with severe pain, or functional deficits, for instance patients with suspicion of fracture, tumour, neurological or an other severe disease, may be handled differently to this concept [89]. Stay-active care has three main components; to explain the generally favourable prognosis, to stress the importance of staying active and to provide effective self-care options [5, 8]. Patients with non-specific acute low back pain generally ex-perience substantial improvement in the first weeks after onset [27, 28]. Stating the medically harmless nature of the condition and the adverse ef-fects of inactivity and sick leave increase the chances of a positive outcome [88, 90]. Finally, the stay-active care includes self-care with evidence-based activities to reduce pain. The self-care advice are often included in handout booklets [91] or more recently, available on Internet web sites, for instance the Swedish website www.1177.se.
Muscle stretching The support for a positive effect of muscle stretching as a single treatment was weak at the time of the design of this study. A recent Medline search for muscle stretching studies resulted in only two studies published during the last two decades, one in chronic low back pain and one in acute neck pain [92, 93]. Still another study under progress has been announced where the effect of muscle stretching will be compared with that of yoga [94].
However, numerous studies of the effect of muscle stretching in combina-tion with exercise for low back pain have been published. In a recent
18
Cochrane review on the effect of exercise [95], the support of exercise, in-cluding muscle stretching, remains moderate as far as reducing recurrences of low back pain is concerned [96].
Thus, the distinction of the effect of exercise from that of muscle stretch-ing is difficult, but studies on exercise therapy without muscle stretching or studies with muscle stretching as an add-on to exercises may be indicative. For instance, exercise was found to affect pain more effectively when mus-cle stretching was added in chronic low back pain treatment [97]. Also, home exercises including muscle stretching were more effective than non-steroid anti-inflammatory drugs (NSAID) in chronic low back pain treatment [98].
Spinal manual treatment In 2004, a Cochrane review concluded that there was no evidence that spinal manipulation was superior to any other standard treatment for acute or chronic low back pain [99]. However, since then an American and a Europe-an clinical guideline have been published [5, 83], both concluding that there is good evidence for spinal manipulation treatment of acute low back pain in adults. As regards sub-acute low back pain, spinal manipulation or mobilisa-tion therapy was considered effective based on moderately strong evidence [4].
Manual treatment has also been reported effective in adults 65 years and older [100]. However, the scientific support for spinal manual treatment of chronic low back pain is weaker. In the European clinical guideline short periods of spinal manual treatment might be considered for these patients [101]. The management of chronic low back pain emphasises that no single intervention component is likely to be effective, but rather a combination of several components.
Steroid injections A Medline search for the effects of steroid injections in low back pain re-sulted in 220 articles, of which the majority were dealing with epidural or disc injections in patients with radicular symptoms or prolapsed discs. Ster-oid injections in addition to manual therapy were not used as experimental treatment in any study of acute or sub-acute low back pain before the present and the Säter study [102]. However, the effect of steroid injections as mono-therapy was probably limited to a short period of time, one to two weeks. After three months there was no difference to placebo [103].
The Cochrane review from 2008 on the effect of injections, based on 18 diverse studies of epidural-, facets- or local injection sites and with a variety of injected drugs (including steroids), found that pooling of studies was not possible [104]. They concluded that the effect of injections as mono-therapy

19
was insufficient for sub-acute or chronic low back pain, but opted for the possibility that specific injection types might be effective for subgroups of patients.
However, more recently published results in chronic low back pain pa-tients indicate some positive effect of local injections. Due to pain relief only for a short period of time, i.e. three weeks, the suggested method was con-cluded suitable as second line treatment [105]. Moreover, nerve blockades with or without steroids, in the lumbar facet joints have been reported as effective pain reducers for 6 weeks or more [106, 107].
Problems in the study of low back pain treatment Despite a great deal of scientific effort in the past decades, most of the treatment for low back pain is based on the therapists experience and not on evidence [108]. The quality of several guidelines from 1992 to 2002 has been criticised and considered not sufficient, due to methodological flaws like incomplete description of targeted population or not explicitly consider-ing all main outcomes when formulating the therapeutic recommendations [109, 110]. The overall argument was that there were far too many unan-swered questions not to conclude that most studied low back pain treatments were ineffective or at the best marginally effective.
Since then the number of clinical guidelines has increased both on nation-al and international consensus levels. The quality of these recent guidelines has been considered much improved in terms of validity but external peer review was still missing [111]. Two recent clinical guidelines found moder-ate evidence that manual therapies reduce pain and disability in acute and sub-acute low back pain [4, 83].
The difficulty of applying a study design fit for the heterogeneous patient group remains; the bio-psychosocial treatment model may describe the com-plexity of this group [8]. The problem may be addressed in several ways, all with their strengths and shortcomings. A possible solution might be to apply standardised brief pain-management regime or manual treatment to all pa-tients regardless of low back pain presentation. This strategy might obscure the potential effectiveness of targeted treatments to patients that are more likely to benefit from a specific treatment.
A second possible solution might be to use large studies in order to allow sub-grouping of patients with homogenous characteristics in order to show effects of various specific treatment tools [108, 112]. However, beside the needed study size, sub-grouping is still not well supported by data, so far they rely on untested theories, are poorly validated and are not replicated in other studies [9, 113].
A third possible solution might be to use a study model close to the clini-cal situation with a ‘toolbox’ to be used after the therapist’s knowledge, i.e.

20
a pragmatic method combined with a factorial design [114]. According to this method a list of specific potential treatments (toolbox) are created for each study group from which the therapist might chose the most relevant ones for an individual patient. By adding available treatments from one group toolbox to the next, the effects of added treatments might be tested. This strategy reduces the flexibility to pinpoint the most effective treatment item per see but will provide scientific evidence for the effect of the various added treatment components.
The Gotland Low Back Pain study The Gotland Low Back Pain study was initially launched to evaluate the results of the Säter study [115]. Like the Säter study it was designed with a pragmatic treatment approach, but in addition it had a factorial design in order to test the effects of muscle stretching, manual therapy and specific steroid injections. Thus, except for the overall task to evaluate previous re-sults, the Gotland Low Back Pain study was designed to provide evidence for effective treatment modalities of sub-acute non-specific low back pain.

21
Aims
The aims of this thesis were to evaluate the effect of manual treatment and to investigate the pain drawing sketch as an outcome measure and predictive aid in low back pain patients. The specific aims were:
• To investigate if perceived pain and disability are associated with the pain modalities used in the pain drawing sketch.
• To evaluate the effects on pain intensity score and disability index of manual therapy including steroid injections added to stay-active care and muscle stretching.
• To evaluate the effects on health related quality of life of the addi-tions of muscle stretching, manual therapy and steroid injections to stay-active care.
• To test the hypothesis that pain drawing information contributes to the prediction of return to work.

22
Study population and methods
The study was performed from January 1994 to December 1998; the effec-tive recruitment period was 32 months. The study was conducted in the province of Gotland, Sweden, an island in the Baltic Sea with 58,000 resi-dents at the time. The recruitment population segment consisted of the 19,000 persons who were 20-55 years of age. Only patients with symptoms severe enough to motivate seeing a doctor were potential recruitment pa-tients.
Study design The study was a prospective randomised controlled trial with pragmatic approach. A factorial design was used, which enables the evaluation of two or more experimental interventions not only separately but also in combina-tion and against a control group [114]. There were four treatment groups, two reference treatments (Groups 1 and 2) and two experimental treatments (Groups 3 and 4), Figure 2. In Papers I and IV all patients were assessed as a cohort. In Paper II the two experimental treatment groups were compared with the two reference treatment groups, and in Paper III a four-group com-parison was done, analysing effects of added treatments.
Study sampling All patients with acute or sub-acute low back pain that provisionally fulfilled the inclusion criteria were referred by Gotland general practitioners (GP) at primary health care centres and by physicians at Visby Hospital. In addition, to secure an unselected study population, the local National Insurance Office referred all patients filing sick-leave applications for low back pain. In Swe-den, the National Social Insurance Offices (a government agent) handle all sick leaves with duration of two weeks or more. The recruiting physician met all patients, performed a physical examination, and made the final as-sessment whether or not they fulfilled the inclusion criteria. These were:
• Acute or sub-acute perceived low back pain with or without pain ra-diating to one or both legs, not requiring acute surgical or rheuma-

23
Figure 2. Flow chart of the study population.
tologic care. Patients with demonstrated or suspected herniated discs were included if surgery was not indicated as assessed by the recruit-ing physician. Low back pain was required to be the dominating
Referred patients (n=316)
Non-included patients (n=156) Dclined participation 45 Chronic back pain 33 Already manually treated 28 Fully recovered 12 Other pain location 12 Unemployed 10 Other problems 9 In need of surgery 3 Already included 2 Pregnant 1 Wrong age 1
Randomised patients (n=160)
Experimental patients (n=89)
Group 3 Stay active, stretching and manual therapy (n=42)
Group 4 Stay active, stretching, manual therapy and injections (n=47)
Reference patients (n=71)
Group 1 Stay active therapy (n=35)
Group 2 Stay active and stretching therapy (n=36)
Received full intervention
n=35
Received full intervention
n=36
Received full intervention
n=42
Received full intervention
n=45
Completed 10-week follow up
n=35
Completed 10-week follow up
n=36
Completed 10-week follow up
n=42
Completed 10-week follow up
n=47
24
symptom but patients with other musculoskeletal symptoms, not re-quiring treatment, were allowed.
• Symptom duration of 3 months or less proceeded by at least 2 months of relative freedom from symptoms.
• Consent to treatment and follow-up for 10 weeks.
• Agreement not to consult therapists other than those participating in the study during the treatment period.
• Employed and with no threat of job loss.
• Born in Sweden and articulate enough not to jeopardise the verbal contact with the physicians and/or the physiotherapists.
• Absence of other conditions or circumstances that might jeopardise completion of treatment and follow-up, such as pregnancy, malig-nant tumours, etcetera.
• No previous treatment of current complaints with specific mobilisa-tion or manipulation.
• No previous participation in the present study. Of the 316 patients who were referred to the study, 111 did not fulfil the inclusion criteria and 45 declined participation. The remaining 160 patients were entered in the study. The most common reasons for failing to fulfil the inclusion criteria were too long symptom duration (33 patients), previous manual treatment for the current acute low back pain episode (28 patients) and spontaneous recovery before the study start (12 patients), Figure 2.
Patients who fulfilled the inclusion criteria received standardised infor-mation concerning the study and those who gave informed consent to partic-ipation were included. When the patients had responded to questionnaires and undergone a physical examination, he or she was randomly allocated to one of the treatment groups by the study monitor. A weighted randomisation procedure was used, aiming at random allocation of 45% of the patients to the reference therapy groups and 55% to the experimental therapy groups. Sealed pre-prepared envelopes with group assignment derived from a ran-dom number table were used. The envelopes were inaccessible to anyone but the monitor. The Research Ethics Committee of the Faculty of Medicine at Uppsala University approved the study.
25
Treatments The treatment was provided individually, in groups, or both. The treatment protocol was not standardised, but in conformity with the pragmatic ap-proach a list of allowed treatment modalities, specific for each group, was used. The physicians and physiotherapists chose after clinical assessment, according to need of the individual patient, the treatment modalities to use from the group specific treatment list. The available treatment modalities and treatment contents in the groups are presented in Table 1. Moreover, the physicians were instructed to certify as short periods of sick leave as possi-ble at each consultation and prescribe drugs when indicated.
Reference therapy Two orthopaedic surgeons at Visby Hospital and 8 physiotherapists treated the two reference group patients. The basic management strategy in all treatment groups was stay-active care, as described by Waddell [8] and evaluated by Indahl [85], Torstensen [116, 117] and Malmivaara [118]. It includes information of the generally favourable prognosis of the condition, the adverse effect of inactivity and sick leave, and encourages patients to take part in physical and other activities to stay fit [88, 90]. The used oper-ant-conditioning behavioural approach [86] was consistent with official rec-ommendations for low back pain treatment in Sweden [6]. The reference therapy was similar to the pragmatic approach to low back pain as evaluated by Lindström et al. [119, 120].
Group 1 was treated with stay-active care only. However, since patients with demonstrated or suspected herniated discs were admitted to the study, non-specific traction was allowed in Group 1. In Group 2 muscle stretching or matching home exercises or both were added to the stay-active care [121, 122]. Forty-one per cent of the patients did actually receive muscle stretch-ing at the clinic or as home exercise.
Experimental therapy Two GPs based at primary health care centres in Visby and 9 physiothera-pists treated the experimental group. During two months before the study, the GPs and the physiotherapists in the experimental treatment team re-ceived basic training for 12 days, corresponding to the basic course in manu-al therapy ‘step 1’. In addition, the two GPs completed their examinations for the ‘step 2’ level thirteen months after the study had started. Two of the physiotherapists began their ‘step 2’ course one year after the study started and graduated six months before the end of the study period.

26
Table 1. Treatment content in the two groups.
Reference therapy Experimental therapy
Physiotherapist Physician Physiotherapist % 95% CI % 95% CI % 95% CI
Mobilisation/manipulation Sacroiliac mobilisation — 72.7 63.2-82.2 50.6 39.7-61.4 Lumbar mobilisation — 75.0 65.8-84.2 45.9 35.1-56.7
Lumbar manipulation (thrust techniques) — 19.3 10.9-27.7 4.7 0.1-9.3
Thoracic mobilisation/ manipulation — 8.0 2.2-13.7 10.6 3.9-17.3
Cervical mobilisation — 2.3 –0.9-5.4 4.7 0.1-9.3 Muscle stretching/treatment Muscle stretching 80.6* 67.0-94.1 52.3 41.6-62.9 88.2 81.2-95.2 Home exercises for muscle stretching 78.4* 64.5-92.3 29.5 19.8-39.3 69.4 59.4-79.4 specific mobilisation — 6.8 1.4-12.2 30.6 20.6-40.6 Massage/Soft tissue treatments 7.5 1.0-13.9 14.8 7.2-22.3 15.3 7.5-23.1 Deep frictions — 3.4 –0.5-7.3 8.2 2.3-14.2 Steroid injections/ligament stretching Sacroparacoccygeal structures stretching — 9.1 3.0-15.2 1.2 –1.2-3.5 steroid injections — 4.3† 1.7-10.2 — Piriformis/gl. med./min. steroid injections — 21.3† 9.1-33.4 — Other steroid injections — 17.0† 5.9-28.2 — Traction Autotraction — 2.3 –0.9-5.4 30.6 20.6-40.6 Nonspecific traction 46.3 34.0-58.5 — — Physical training Low back pain school training 1.5 –1.5-4.5 0 0 Medical training therapy 9.0 1.9-16.0 1.1 –1.1-3.4 16.5 8.4-24.5 Other back exercises — 3.4 –0.5-7.3 12.9 5.7-20.2 Sequential training 19.4 9.7-29.1 0 0 Plunge-bath training 6.0 1.5-11.8 1.1 –1.1-3.4 4.7 0.1-9.3 Active movement therapy 34.3 22.7-46.0 0 0 Active back exercises 58.2 46.1-70.3 0 0 Relaxation training 13.4 5.1-21.8 0 0 Body awareness training 9.1 2.0-16.2 0 0 Postural exercises 25.4 14.7-36.1 0 0 Ergonomic advice 74.6 63.9-85.3 0 0 Heat and different electric treatment Ultrasonic waves 19.4 9.7-29.1 0 0 TNS 49.3 37.0-61.5 0 0 Heat (steam-pack) 11.9 4.0-19.9 0 0 Electric stimulation 1.5 –1.5-4.5 0 0 Corsets Pelvic corset (CAMP) — 3.4 –0.5-7.3 8.2 2.3-14.2 Corset 3.0 –1.2-7.2 1.1 –1.1-3.4 1.2 –1.2-3.5 TNS, Transcutaneous nerve stimulation *Data for the reference subgroup in which muscle stretching was allowed (51%). The frequency of stretching in
the entire reference group was 41%. †Data for the experimental group in which steroid injections were allowed (52%).

27
In the first experimental group (Group 3) manual therapy was added to the stay-active care and the muscle stretching and matching home exercises or both given to Group 2. The origin of Swedish manual therapy is the clas-sical osteopathic techniques [123] and the continental tradition [124, 125].
These techniques as well as specific ‘locking techniques’ have been fur-ther developed in Scandinavia [121, 122, 126] and they formed an important part of the experimental treatment. Diagnostic items according to the Muscu-lar Energy Technique (MET) [127] are incorporated in the physical exami-nation. An essential therapeutic manoeuvre is mobilisation for pelvic dys-functions according to Kubis [128], with the addition of an Evjent and Ham-berg locking technique and a strictly applied MET procedure in the treat-ment situation. Thus, the manoeuvre has become gentle.
All patients in Group 3 were treated with specific mobilisation or lumbar thrust techniques (manipulation) or both by the two physicians. In addition, the physiotherapists treated 67% of the experimental patients with specific mobilisation or manipulation. Manual traction in the lumbar region and auto traction [129, 130] was also added to the group specific treatment list.
In the second experimental therapy group (Group 4) steroid injections, in case of specific findings, were added to the group specific treatment list of Group 3. Steroids were often given in combination with ‘needling’ [124] and local anaesthetics. After parasacrococcygeal injections, the soft tissues were also stretched per rectum ad modum Midttun [131, 132]. A total of 19 injec-tions were given to 17 patients, two patients receiving two injections each.
Treatment intensity The waiting-time for physiotherapy was significantly shorter in the experi-mental groups (p<0.0001), the patients in Group 1 had to wait for 8.6 days (95% C.I. 6.8-10.4), Group 2 for 10.6 days (95% CI 8.9-12.3), Group 3 for 5.0 days (95% CI 3.4-6.6) and those in Group 4 for 7.0 days (95% CI 5.5-8.6). Treatment intensity data are given in Table 2. Physiotherapy was of-fered to all patients in this study. However, mainly due to complete recovery after randomisation 11 patients did not see a physiotherapist; four patients in Group 1, one patient in Group 2, two patients in Group 3 and four patients in Group 4.
Data collection Data on patient characteristics, i.e. demographic and socioeconomic data, previous low back pain infirmity, treatment before study start and symptom duration at the beginning of the study were obtained by questionnaires on location. Initial outcome measures were also recorded at baseline using
28
Table 2. Treatment intensity during the study period.
Group 1
(Stay-active)
Group 2 (Stay-active and muscle stretching)
Group 3 (Stay-active,
stretching and manual
therapy)
Group 4 (Stay-active, stretching,
manual therapy and
steroid injections)
M SD M SD M SD M SD p Physicians Appointments 2.2 0.8 2.1 0.8 2.8 1.0 2.6 1.1 <0.05
Active treatment sessions 0 - 0 - 2.5 1.1 2.5 1.1
Telephone contacts 0.4 0.7 0.7 0.9 0.6 0.8 0.5 0.6 n.s. Physiotherapist Appointments 5.8 4.1 6.3 5.7 6.3 3.7 5.3 4.3 n.s. Individual sessions 5.0 3.5 6.0 5.7 5.8 3.4 5.1 4.1 Group sessions 0.8 2.2 0.3 1.5 0.5 1.5 0.2 1.0 M=mean, SD=standard deviation. questionnaires on location. Follow-up outcome measurement data were ob-tained using postal questionnaires after 5 and 10 weeks of treatment. Infor-mation on number of treatments, treatment content, diagnoses, the prescrip-tion of diagnostic imaging, and medication was obtained by questionnaire from the treating staff in all groups at 5 and 10-week follow-up.
The recruiting physician performed an initial physical examination in all patients at baseline, including a general physical examination and a stand-ardised neurological examination, out of which items reflecting pain affec-tion behaviour, pain radiation and reflex disturbances were used for Paper IV. A spreadsheet showing the 66 combinations of the various physical ex-amination items was produced (Appendix). Based on this information, a doctor of naprapathy (MG) and a general practitioner, specialised in ortho-paedic medicine (JB), created a clinical indication score for nerve root in-volvement, classified as score 0-4. However, score 3 and 4 were infrequent and were therefore amalgamated into score 2, and the final classification was “weak indication” (=0), “intermediately strong indication” (=1) or “strong indication” (=2). Differences in opinion were few and were discussed until consensus was reached.
Pain intensity scores and 15 disability rating variables were measured with visual analogue scales, 100 millimetres (mm) long and ranging from no pain or disability (=0 mm) to maximum pain or disability (=100 mm). Twelve of the 15 disability rating variables form the Disability Rating Index instrument, validity as well as reliability tested [61]. The remaining three items, ‘lying still’, ‘car-driving or car-riding’, and ‘getting up from sitting’, have been used previously [62] and they provide additional daily activities to
29
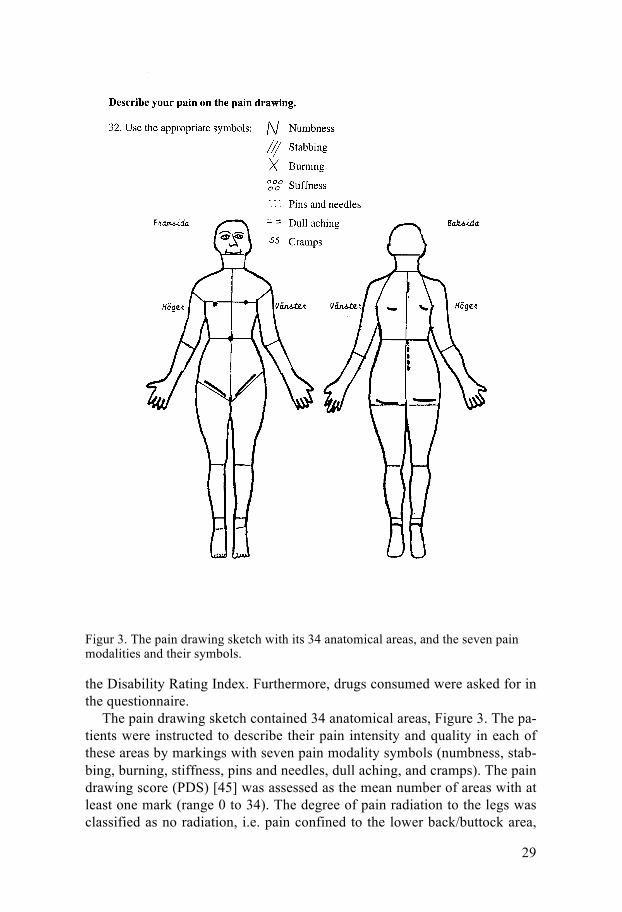
Figur 3. The pain drawing sketch with its 34 anatomical areas, and the seven pain modalities and their symbols.
the Disability Rating Index. Furthermore, drugs consumed were asked for in the questionnaire.
The pain drawing sketch contained 34 anatomical areas, Figure 3. The pa-tients were instructed to describe their pain intensity and quality in each of these areas by markings with seven pain modality symbols (numbness, stab-bing, burning, stiffness, pins and needles, dull aching, and cramps). The pain drawing score (PDS) [45] was assessed as the mean number of areas with at least one mark (range 0 to 34). The degree of pain radiation to the legs was classified as no radiation, i.e. pain confined to the lower back/buttock area,

30
or radiation to the leg, which was defined as pain in the lower back/buttock and in at least one area in the leg, frontal or dorsal side. The number of pain modalities used in each area, the ‘area score’, was also assessed [71, 133]. Only patients with no marks above waistline were assessed for the dominat-ing pain modality in all 16 areas below waistline. All marks were recorded by modality and ranked for dominance by the same observer.
Health related quality of life was assessed with the Gothenburg Quality of Life Instrument [67, 68]. For this report the Complaint score and the Well-being subscales were used. The instrument is validated and found independ-ent of diagnosis or treatment [134-136]. In the Complaint score the respond-ents were asked: ‘Have you been troubled by any of the following symptoms during the last 3 months?’, followed by a list of 30 general symptoms with response alternatives ‘yes’ or ‘no’ for each symptom. The Complaint score is the sum of yes-answers. In the Well-being subscales, twelve items (work situation, family situation, hearing, eyesight, memory, physical fitness, appe-tite, energy, mood, patience, self confidence, sleep, and perceived health) were listed and the responses were given on 100 millimetre visual analogue scales ranging from ‘very bad’ (=0) to ‘excellent, could not be better’ (=100). The items used in paper III were patience, energy, mood, family situation, perceived health, and sleep.
At the time of the study sick leave was reported to the Social Insurance Agency that paid the compensation, except for the first two weeks, which were reported to and paid by the employers without always being reported to the Social Insurance Agency. Sick leave periods of up to seven days could be self-certified by the patient. Beginning with the second week, a sick-listing certificate issued by a physician was required. Sick leave information from two months before inclusion until two years after start of treatment was obtained from the Social Insurance Agency, from medical records, from the questionnaires filled out by the physicians and from patient diaries. Baseline for the sick leave analyses was set to the day of the first appointment with the treating physician in the study. The information included first and last day of each sick leave period, diagnosis and extent (25, 50, 75 or 100% sick leave).
Information on return to work, available for all 160 patients, was based on the sick leave information. The day of return to work was defined as the first day after conclusion of the initial sick leave period. The initial sick leave period was regarded as concluded if followed by a sick leave free peri-od of at least one week followed by no more sick leave until end of follow-up, or followed by a sick leave period shorter than the preceding sick leave free one. If these criteria were not fulfilled the new sick leave period was regarded part of the initial one, and the criteria check was repeated at the end of each period until they were fulfilled or until end of follow-up, whatever came first.

31
Masking and parallel treatment All information on outcome was kept inaccessible to anyone but the study monitor and was thus masked, or blinded, to the treatment staff. Information on contamination by parallel treatment provided by external therapists was obtained at the 10-week follow-up by questionnaire and was also asked for and reported by the participating physicians and physiotherapists.
Statistical considerations Data was analysed with the JMP version 4 [137] and the Statistical Analysis System (SAS) version 9.2 [138] software. Summary statistics, such as means and measures of dispersion, were computed using standard parametric meth-ods. Crude differences regarding continuous data were tested using Stu-dent’s t-test or analysis of variance, and regarding nominal or ordinal data were tested with chi-square test. Only two-tailed tests were used. P-values less than 5% were considered to indicate statistical significance. The inten-tion-to-treat concept was followed in all calculations of group effects. Two patients did not return the 10-week questionnaire and partial non-responses were minimal, the total data loss was less than 1%.
Considerations particular to Paper I The study population was analysed as a cohort. Pain modality distribution was calculated across the study period, i.e. using all three time points (base-line, 5 and 10 weeks) as one. The pain modality considered dominant in the low back pain area was defined as the most frequently used pain modality in the left and right lower back/buttock areas together. The ‘pain drawing score’ and the ‘area score’ were computed with regression-based analysis of variance. The analyses of association were done with standard least square analyses and one-way analysis of variance with pain intensity score or disa-bility rating index, respectively, as dependent variables and pain drawing score as the independent variable at 0, 5 and 10 weeks and for the whole period. In the latter analysis the data from the various time points were stacked. The results from the separate time points and the overall period were consistent.
The regression surface in Figure 5 was constructed using multivariate linear regression technique with pain intensity score or disability rating in-dex as dependent variable and the seven pain modalities and pain radiation as independent variables. The analysis was performed on the 436 pain draw-ings with marks only below waistline, among the 480 possible ones across the study period, to eliminate the possibility of influence on pain intensity score and disability index from painful sites above the waistline. The analy-

32
sis was done twice, first on the 287 pain drawings with no pain radiation and then a second time on the 149 pain drawings with pain radiation.
Considerations particular to Paper II Pain intensity score and disability rating index were used as outcome in the two-group comparison, reference therapy (Group 1 and 2) versus experi-mental therapy (Group 3 and 4). The analyses of outcomes, change of the outcome variables (pain intensity score and disability rating scores) from baseline to the end of the treatment period was analysed in the two treatment groups by regression-based analysis of variance.
Considerations particular to Paper III The Well-being variables and Complaint Score were used as outcome in the four-group comparison. The effects on outcome of the treatment given were computed in two ways. First crude effects were computed as the outcome difference between baseline and 10-week levels in linear regression with difference as the dependent variable and group number as the independent. Then effects adjusted for the potential influence of variables other than the treatment variables were computed. These other potential outcome affecting variables (covariates) were age, sex, body mass index, smoking habits, and low back pain history during the two years preceding baseline. Moreover, there were initial differences between the groups in the outcome variables, in some instances favouring one group, in other instances other groups. To adjust for this potential bias, the initial measurement of the outcome under study was included as an additional covariate in the analyses.
To keep the statistical power as high as possible, the adjusted analyses were based not only on the baseline and the 10-week measurements, but also on all available measurements (baseline, 5-week, and 10-week). Use of all three measurements considerably reduces the probability of positive (or neg-ative) effects by chance alone. For this purpose multiple linear regression was used with time dependent updated outcome across the follow-up period as the dependent variable, and the group variable and all covariates as the independent variables, with backward elimination of non-significant covari-ates. In addition, least square means (and confidence intervals) of the updat-ed outcome variables across follow-up time by treatment group and adjusted for remaining significant covariates were computed (a standard option in the SAS software).
The Complaint score may be regarded as a continuous scale, while the Well-being variables basically are ordinal, even though the scale range 0-100 may be regarded as a continuous scale. Moreover, the variables were reasonably symmetrically distributed. Therefore the results from multiple ordinal logistic (with the 100-step scale converted to a 10-step scale) was

33
compared, with those of multiple linear regression technique (with the 100-step scale). The results were very similar. Therefore the results from the multiple linear regressions were used, since this procedure may be expected to be generally better known.
Considerations particular to Paper IV The analyses were performed in two steps. First, screening bivariate propor-tional hazards regression analyses (Cox’s analyses) of variables possibly associated with return to work (candidate variables) were performed, with return to work and time of return to work as the dependent variables, and the potential predictors as independent variable. In the second step, multivariate proportional hazards regression analyses were performed accordingly to find independent predictors of return to work.
Potential predictors were pain intensity score, pain drawing score, pain radiation according to pain drawing and clinical indication score of nerve root involvement. The analyses were performed as time dependent analyses regarding pain intensity, pain drawing score and pain radiation according to pain drawing, but not for the clinical indication score that was measured only at baseline. The analyses were performed either as updated predictor levels at 5 or 10-week follow-up until the time of return to work, or as mean values of the predictors until return to work. The two procedures gave essen-tially similar results. For the sake of simplicity the latter was used. Variables potentially affecting outcome other than the potential predictors were age, sex, cigarette smoking, educational level, similar complaints last two years, sick spell duration, body mass index and treatment group (covariates).
P-values less than 0.10 were used for the preliminary candidate screening analyses and p<0.05 were used for the final model analyses.

34
Results
Baseline characteristics are presented in Table 3. The patients were on aver-age 41 years old (SD 8.5), 70 (44%) patients were women, and 71 (44%) patients were cigarette smokers. The average duration of the current episode was 27.3 days (SD 26.0) with a median duration of 16 days. At baseline 110 (68.8%) patients and at start of treatment 99 (62%) patients were on sick leave and 134 (84%) patients had experienced similar low back pain in the past two years. None of the group differences was statistically significant. More than one third had previously undergone x-ray examinations due to low back pain infirmity; ten patients had been admitted to hospital due to low back pain, four of who had undergone back surgery. Herniated disc was suspected during the study in 17 (19.1%) patients and verified during the study in 10 (11.2%) patients in the two experimental groups; in the two ref-erence groups the corresponding numbers were 16 (22.5%) and 4 (5.6%) patients.
The pain drawing course (Paper I) At baseline, the proportion of patients with marked areas below waistline ranged from 85.6% in the left lower back/buttock area to 3.1% in the right dorsal foot area, Table 4. The left side generally had a higher proportion of marked areas than the right side. In all areas but the frontal side of the lower leg and foot there was a large drop in the proportion of patients with marked areas during the first five weeks, on average 34.5 per cent units, and then a more moderate decrease during the next five weeks, on average 6.0 per cent units. The pattern was similar in all treatment groups. At baseline the pain drawing score was 3.7 for all areas (range 1-14) and 3.6 for the 16 areas below waistline (range 0-12). During the first five weeks this score dropped by approximately 33% and then remained stable (range 0-10). At baseline 70.9% of the patients had pain radiating to the knee and 38.6% to the lower leg. At the 10-week follow-up the corresponding frequencies were 24.1% and 22.2%.
The mean number of pain modalities, the ‘area score’, is shown in Table 5. At baseline the ‘area score’ ranged from 1.79 in the lower left back/buttock to 0.03 in the dorsal side of the right foot. The mean number of used pain modalities decreased over the 10-week period, but most of the

Tab
le 3
. Pat
ient
cha
ract
eris
tics a
t bas
elin
e.
G
roup
1
(Sta
y-ac
tive)
Gro
up 2
(S
tay-
activ
e an
d m
uscl
e st
retc
hing
)
Gro
up 3
(S
tay-
activ
e, st
retc
hing
an
d m
anua
l the
rapy
)
Gro
up 4
(S
tay-
activ
e, st
retc
h-in
g, m
anua
l the
rapy
an
d st
eroi
d in
ject
ions
)
n
mea
n or
%
SD
n m
ean
or %
SD
n
mea
n or
%
SD
n m
ean
or %
SD
Num
bers
35
36
42
47
A
ge, y
ears
41.8
8.
3
40.3
8.
2
42.1
8.
9
41.1
8.
7 W
omen
, %
13
37.1
12
33.3
20
47.6
25
53.2
Bod
y m
ass i
ndex
, kg/
m2
24
.6
3.4
25
.8
4.8
25
.9
4.2
24
.5
2.8
Cig
aret
te sm
oker
s, %
16
45
.7
15
41
.7
18
42
.9
22
46
.8
C
ompu
lsor
y sc
hool
onl
y, %
10
28
.6
11
30
.6
13
31
.0
13
27
.7
M
ild c
hron
ic c
ompl
aint
s las
t tw
o ye
ars,
%
27
77.1
32
88.9
37
88.1
38
80.8
Cur
rent
epi
sode
of l
ow b
ack
pain
Dur
atio
n, d
ays
25
.5
26.9
35.1
26
.8
24
.6
21.5
25.1
27
.9
O
n si
ck le
ave
at b
asel
ine,
%
27
77.1
20
55.6
29
69.0
34
72.3
R
etur
n to
wor
k po
ssib
le, %
17
48
.6
26
72
.2
28
66
.7
29
61
.7
Low
bel
ief i
n ac
tivity
, %
15
42.9
23
63.9
19
45.2
25
53.2
Pa
in S
core
51.4
22
.1
57
.6
21.0
59.6
20
.9
48
.1
21.8
Diff
icul
ties f
allin
g as
leep
, %
18
51.4
15
41.7
16
38.1
31
67.4
Pa
in d
istu
rbed
slee
p, %
27
77
.1
24
66
.7
27
64
.3
33
70
.2
n=
num
bers
, SD
=sta
ndar
d de
viat
ion

36
Table 4. Pain drawing characteristics at baseline, 5 and 10 weeks of follow-up. Baseline At 5 weeks At 10 weeks
Mean or % 95% CI Mean
or % 95% CI Mean or % 95% CI
N 160 160 158 Proportion of areas marked, % Dorsal side Lower back/buttock left 85.6 78.7-89.7 64.4 56.7-71.4 58.8 51.0-66.1 Lower back/buttock right 78.1 71.1-83.8 68.1 60.6-74.8 59.4 51.6-66.7 Thigh back, left side 38.1 31.0-45.8 16.2 11.3-22.7 15.6 10.8-22.0 Thigh back, right side 33.1 26.3-40.7 12.5 8.2-18.5 10.6 6.7-16.4 Lower leg back, left side 19.4 14.0-26.2 9.4 5.8-14.9 11.2 7.2-17.1 Lower leg back, right side 15.0 10.3-21.3 7.5 4.3-12.6 8.1 4.8-13.4 Plantar area left side 10.6 6.7-16.4 6.2 3.4-11.1 8.1 4.8-13.4 Plantar area right side 6.2 3.4-11.1 3.1 1.3-7.1 4.4 2.1-8.7 Frontal side Lower abdomen, left side 8.1 4.8-13.4 5.6 3.0-10.3 4.4 2.1-8.7 Lower abdomen, right side 8.1 4.8-13.4 3.7 1.7-7.9 3.7 1.7-7.9 Thigh front, left side 16.2 11.3-22.7 8.1 4.8-13.4 7.5 4.3-12.7 Thigh front, right side 15.6 10.8-22.0 6.2 3.4-11.1 5.6 3.0-10.3 Lower leg front, left side 6.9 3.9-11.9 6.2 3.4-11.1 6.9 3.9-11.9 Lower leg front, right side 4.4 2.1-8.7 3.1 1.3-7.1 4.4 2.1-8.7 Dorsal foot, left side 8.7 5.3-14.2 5.6 3.0-10.3 5.0 2.6-9.6 Dorsal foot, right side 3.1 1.3-7,1 2.5 1.0-6.3 1.9 0.6-5.4 All other areas 5.6 3.0-10.3 12.5 8.2-18.5 9.4 5.8-14.9 Mean number of areas marked Areas above waistline 0.1 0.03-0.17 0.3 0.15-0.45 0.26 0.11-0.42 Areas below waistline 3.6 3.3-3.8 2.3 2.0-2.6 2.2 1.8-2.5 All areas 3.7 3.4-4.0 2.6 2.3-2.9 2.4 2.0-2.8 Radiation, any degree, % Pain in lower back/buttock 100.0 97.6-100.0 83.5 77.0-88.5 72.8 65.4-79.1 Pain radiating to the thigh 70.9 63.4-77.4 32.9 26.1-40.6 24.1 18.1-31.3 Pain radiating to lower leg 38.6 31.4-46.4 22.2 16.4-29.2 22.2 16.4-29.2
95% CI=95% confidence intervals. reduction, on average 46.2%, occurred during the first half of the period. There was also a shift of dominating pain modality prevalence in the lower back/buttock areas during the follow-up, Figure 4. Stabbing pain decreased from 66.9% at baseline to 27.2% at 10 weeks follow-up and ‘no marks’ in-creased from 1% to 27%.
Pain drawings, pain intensity and functional variables (Paper I) There was an association between, on the one hand, mean number of areas marked, i.e. the pain drawing score, and pain intensity score during the pre-vious week (r= 0.39, p<0.0001) and the disability rating index (r=0.40, p<0.0001) on the other across the study period. Pain radiation was present in 149 (34.2%) of the 436 pain drawings with no marks above the waistline.

37
Table 5. Number of modalities, the ‘area score’, reported in the sixteen lower areas, at baseline, 5 and 10 weeks of follow-up.
95% CI=95% confidence intervals
Figure 4. Distribution of pain modalities in the lower back/buttocks area at baseline and after 5 and 10 weeks of follow-up.
0%
10%
20%
30%
40%
50%
60%
70%
80%
90%
100%
Baseline 5 weeks 10 weeks
No marks Stiffness Pins and needles Cramps Numbness Burning Dull aching Stabbing
Number of modalities used Baseline At 5 weeks At 10 weeks
Mean 95% CI Mean 95% CI Mean 95% CI N 160 160 158 Dorsal side Lower back/buttock left 1.79 1.63-1.95 1.02 0.87-1.17 0.91 0.76-1.06 Lower back/buttock right 1.61 1.43-1.78 1.01 0.88-1.15 0.92 0.78-1.07 Thigh back, left side 0.57 0.43-0.70 0.27 0.16-0.38 0.25 0.14-0.36 Thigh back, right side 0.48 0.36-0.61 0.17 0.09-0.24 0.14 0.07-0.21 Lower leg back, left side 0.27 0.18-0.37 0.14 0.06-0.21 0.17 0.08-0.27 Lower leg back, right side 0.22 0.14-0.31 0.09 0.04-0.14 0.11 0.05-0.17 Plantar area left side 0.14 0.07-0.20 0.10 0.04-0.16 0.10 0.04-0.16 Plantar area right side 0.08 0.03-0.13 0.05 0.01-0.10 0.06 0.01-0.10 Frontal side Lower abdomen, left side 0.11 0.05-0.18 0.08 0.02-0.14 0.07 0.01-0.13 Lower abdomen, right side 0.12 0.05-0.20 0.06 0.01-0.11 0.06 0.01-0.11 Thigh front, left side 0.24 0.15-0.34 0.12 0.05-0.19 0.14 0.05-0.24 Thigh front, right side 0.21 0.13-0.28 0.09 0.03-0.16 0.09 0.02-0.15 Lower leg front, left side 0.12 0.05-0.20 0.07 0.03-0.12 0.10 0.03-0.17 Lower leg front, right side 0.05 0.02-0.08 0.04 0.01-0.07 0.04 0.01-0.08 Dorsal foot, left side 0.13 0.05-0.21 0.07 0.02-0.13 0.07 0.02-0.13 Dorsal foot, right side 0.03 0.01-0.06 0.04 0.00-0.08 0.02 0.00-0.04 All other areas 0.13 0.03-0.23 0.38 0.17-0.58 0.39 0.13-0.65

38
Figure 5. Mean pain intensity score (a) and mean disability rating index (b) in groups according to dominating pain modality and pain radiation, among patients with marks only below the waistline across the 10 week period.
Among the latter, ‘stabbing pain’ was the most frequently used dominating pain modality (45.6%) followed by ‘dull aching’ (30.2%), ‘stiffness’
0
10
20
30
40
50
60
Pain score a
0
10
20
30
40
50
60
Disability rating index b

39
(12.1%), ‘burning’ (6.0%), ‘numbness’ (2.7%), ‘pins and needles’ (2.0%) and finally ‘cramps’ (1.4%).
Among the pain drawing sketches with no pain radiation, there were no significant differences in pain intensity score or disability rating index be-tween the various pain modalities at baseline (p=0.25 for the whole model). Over the study period strong associations between the pain modalities and the pain intensity score or the disability rating index emerged (p<0.0001 for the whole model at 5 and at 10 weeks). In Figure 5 the average pain intensity score and disability rating index per modality across the 10-week period is displayed. The pain modality ‘numbness’ was associated with both the high-est pain intensity score and highest disability rating index, followed by ‘pins and needles’ and ‘stabbing’. The pain modalities ‘stiffness’ and ‘cramps’ were associated with the least pain and least disability. For the pain drawing sketches with pain radiation the differences were smaller and more incon-sistent than in the non-radiation group.
Pain and disability variables (Paper II) Pain variables are shown in Table 6. The scores for pain intensity during the last 24 hours and pain intensity during the last week were fairly similar in the two groups at baseline. They decreased significantly over time in all groups but there were no significant differences between the groups. The variables measuring pain intensity or the effect of pain in various situations all improved significantly during the treatment period in both groups, but there were no significant differences in rate of decrease between the groups.
However, since the experimental groups tended to be somewhat more af-fected than the reference groups by low back pain at baseline but less so at 5 and 10 weeks, an adjustment for the initial differences in outcome variables, verified herniated disc and differences in age and sex distribution was made. After this adjustment the experimental groups had a faster rate of decrease for pain intensity last week than the reference groups (p<0.05) and a faster decrease of pain intensity during the last 24 hours after 5 weeks of follow-up (p<0.05) but not at 10 weeks of follow-up. For all other pain variables the rate of decrease tended to be non-significantly faster in the experimental groups than in the reference groups, except for waking up with back pain, where the non-significant rates tended to be reversed.
The use of painkillers or non-steroid anti-inflammatory drugs decreased as well in the groups but there were no significant differences in decrease rate between the groups. The most frequently used painkillers at baseline were light analgesics and antipyretics (53.8%), light opoids (41.9%), non-

Tab
le 6
. Pai
n va
riabl
es in
the
two
grou
ps a
t bas
elin
e, a
t 5 w
eeks
and
at 1
0 w
eeks
resp
ectiv
ely.
The
se v
aria
bles
wer
e m
easu
red
on a
vis
ual
anal
ogue
scal
e 10
0 m
m lo
ng, w
here
0 m
m m
eans
no
pain
and
100
mm
the
wor
st p
ossi
ble
pain
or b
y an
swer
ing
a ye
s or n
o qu
estio
n. p
val
ue
refe
rs to
test
of d
iffer
ence
in p
ain
redu
ctio
n ov
er 1
0 w
eeks
bet
wee
n re
fere
nce
and
expe
rimen
tal t
hera
py g
roup
s
Bas
elin
e A
t 5 w
eeks
A
t 10
wee
ks
p af
ter
adju
st-
men
ts
R
efer
ence
ther
apy
Expe
rimen
tal t
hera
py R
efer
ence
ther
apy
Expe
rimen
tal t
hera
py R
efer
ence
ther
apy
Expe
rimen
tal t
hera
py
M
ean
95%
CI
Mea
n 95
% C
I M
ean
95%
CI
Mea
n 95
% C
I M
ean
95%
CI
Mea
n 95
% C
I
Pain
inte
nsity
last
24
hour
s, m
m
52.2
46
.7-5
7.8
54.7
49
.8-5
9.6
29.7
23
.3-3
5.2
20.8
16
.0-2
5.7
21.1
16
.2-2
6.0
16.2
11
.8-2
0.6
n.s.*
Pain
inte
nsity
last
wee
k,
mm
54
.5
49.4
-59.
7 53
.5
49.0
-58.
1 36
.1
30.6
-42.
7 29
.0
24.1
-33.
9 27
.5
22.3
-32.
8 19
.5
14.8
-24.
2 <0
.05
Pain
at r
est,
%
69.0
58
.0-8
0.0
69.7
59
.9-7
9.4
28.2
17
.4-3
8.9
23.6
14
.6-3
2.6
25.7
15
.2-3
6.2
19.5
11
.0-2
8.0
n.s.
Pain
influ
enci
ng le
isur
e tim
e ne
gativ
ely,
%
60.6
48
.9-7
2.2
70.8
61
.1-8
0.4
32.4
21
.2-4
3.6
28.1
18
.6-3
7.6
25.4
15
.0-3
5.7
16.1
8.
0-23
.4
n.s.
Diff
icul
ties f
allin
g as
leep
du
e to
bac
k pa
in, %
46
.5
34.6
-58.
4 53
.4
42.8
-64.
0 22
.5
12.6
-32.
5 14
.6
7.1-
22.1
11
.3
3.7-
18.8
5.
8 0.
8-10
.7
n.s.
Wak
ing
up w
ith b
ack
pain
, %
71.8
61
.1-8
2.6
67.4
57
.5-7
7.3
34.3
22
.9-4
5.7
27.0
17
.6-3
6.4
22.9
12
.8-3
2.9
23.3
14
.1-3
2.4
n.s.
Mor
ning
stiff
ness
, %
81.7
72
.5-9
0.9
74.2
64
.9-8
3.4
67.6
56
.4-7
8.8
62.9
52
.7-7
3.1
64.8
53
.4-7
6.2
52.9
42
.2-6
3.6
n.s.
Tim
e to
relie
f of m
orni
ng
stiff
ness
, min
utes
91
.3
53.0
-129
.6
71.0
35
.1-1
07.0
58
.9
46.2
-71.
5 50
.6
38.9
-62.
3 58
.1
38.7
-77.
4 52
.3
38.1
-66.
5 n.
s.
Taki
ng p
aink
iller
s or
NSA
IDs,
%
60
.6
48.9
-72.
2 67
.4
57.5
-77.
3 32
.4
21.2
-43.
6 32
.6
22.7
-42.
5 25
.4
15.0
-35.
7 18
.4
10.1
-26.
7 n.
s.
*= p
<0.0
5 at
5 w
eeks
follo
w-u
p

Tab
le 7
. Mea
n di
sabi
lity
mea
sure
s in
the
two
grou
ps a
t bas
elin
e, a
t 5 w
eeks
and
at 1
0 w
eeks
resp
ectiv
ely.
Bas
elin
e A
t 5 w
eeks
A
t 10
wee
ks
Ref
eren
ce th
erap
y Ex
perim
enta
l the
rapy
Ref
eren
ce th
erap
y Ex
perim
enta
l the
rapy
R
efer
ence
ther
apy
Expe
rimen
tal t
hera
py
p
Mea
n 95
% C
I M
ean
95%
CI
Mea
n 95
% C
I M
ean
95%
CI
Mea
n 95
% C
I M
ean
95%
CI
‘Hea
vy’ d
isab
ility
ratin
g in
dex
70.0
65
.3-7
4.8
78.3
74
.0-8
2.5
45.0
37
.9-5
2.1
39.3
32
.9-4
5.7
37.8
31
.1-4
4.6
29.9
23
.9-3
5.9
<0.0
1
H
eavy
phy
sica
l wor
k 75
.6
70.5
-80.
7 81
.8
77.2
-86.
3 49
.0
41.3
-56.
8 43
.2
36.2
-50.
2 43
.0
35.6
-50.
5 31
.9
25.2
-38.
5
Li
fting
hea
vy o
bjec
ts
80.0
75
.5-8
4.4
84.9
81
.0-8
8.9
55.7
47
.6-6
3.8
47.4
40
.1-5
4.7
51.1
43
.1-5
9.2
39.1
32
.0-4
6.2
Pa
rtici
patin
g in
exe
r-ci
se/s
ports
62
.1
55.8
-68.
3 75
.1
69.5
-80.
7 38
.7
31.3
-46.
1 34
.0
27.5
-40.
5 30
.7
23.8
-37.
6 26
.3
20.2
-32.
5
R
unni
ng
62.6
55
.7-6
9.4
71.2
65
.1-7
7.3
37.2
29
.7-4
4.6
31.4
24
.6-3
8.1
27.1
20
.6-3
3.7
23.7
17
.8-2
9.6
‘L
ess h
eavy
’ dis
abili
ty
ratin
g in
dex
45.4
40
.6-5
0.2
50.3
46
.0-5
4.6
27.2
22
.5-3
1.9
21.2
17
.0-2
5.4
20.7
16
.4-2
5.0
16.6
12
.8-2
0.5
<0.0
5
D
ress
ing
(with
out h
elp)
41
.0
34.1
-48.
0 46
.0
39.8
-52.
2 24
.0
18.7
-29.
3 15
.4
10.7
-20.
1 18
.8
14.1
-23.
6 12
.3
8.0-
16.6
O
utdo
or w
alks
36
.4
29.8
-43.
0 44
.3
38.4
-50.
2 22
.5
17.0
-27.
9 16
.7
11.9
-21.
6 18
.1
13.3
-22.
8 13
.9
9.6-
18.2
C
limbi
ng st
airs
41
.4
35.2
-47.
6 43
.2
37.7
-48.
7 23
.3
18.3
-28.
2 16
.0
11.6
-20.
4 18
.2
13.8
-22.
6 13
.8
9.8-
17.8
Si
tting
for a
long
er ti
me
56.3
49
.7-6
2.8
57.4
51
.6-6
3.3
40.2
33
.7-4
6.8
30.0
24
.0-3
5.9
31.8
25
.5-3
8.2
23.5
17
.7-2
9.2
Stan
ding
ben
t ove
r a si
nk
57.2
50
.3-6
4.1
58.9
52
.7-6
5.0
33.8
27
.2-4
0.5
28.4
22
.4-3
4.3
25.5
19
.5-3
1.4
22.3
16
.9-2
7.6
Car
ryin
g a
bag
41.7
34
.9-4
8.5
49.2
43
.1-5
5.3
25.1
19
.4-3
0.8
24.7
19
.6-2
9.9
20.8
15
.8-2
5.9
16.8
12
.2-2
1.4
Mak
ing
a be
d 56
.1
49.0
-63.
1 62
.5
56.2
-68.
8 31
.7
25.4
-38.
1 26
.4
20.7
-32.
0 23
.9
18.0
-29.
8 21
.5
16.2
-26.
7
Li
ght p
hysi
cal w
ork
40.8
34
.1-4
7.5
50.1
44
.2-5
6.1
23.0
17
.8-2
8.2
17.6
12
.9-2
2.2
19.4
14
.9-2
4.0
12.9
8.
7-17
.0
Lyin
g st
ill
32.0
25
.1-3
9.0
38.4
32
.1-4
4.6
20.6
15
.3-2
5.9
16.9
12
.2-2
1.6
15.4
10
.6-2
0.1
12.7
8.
4-17
.0
Car
driv
ing/
car r
idin
g 44
.4
37.1
-51.
6 50
.2
43.7
-56.
7 26
.6
20.7
-32.
5 18
.4
13.1
-23.
7 17
.2
12.3
-22.
1 15
.7
11.3
-20.
2
G
ettin
g up
from
sitti
ng
52.3
46
.0-5
8.6
53.1
47
.4-5
8.7
31.6
26
.0-3
7.1
22.3
17
.3-2
7.2
23.3
18
.6-2
8.1
16.0
11
.7-2
0.3
M
ean
all d
isab
ility
ratin
g va
riabl
es
52
.0
47.4
-56.
6 57
.8
53.7
-61.
8 31
.9
26.8
-37.
0 25
.8
21.2
-30.
4 25
.0
20.2
-29.
7 20
.1
15.9
-24.
3 <0
.05
p va
lue
refe
rs to
test
of d
iffer
ence
in d
isab
ility
ratin
g ov
er 1
0 w
eeks
bet
wee
n re
fere
nce
and
expe
rimen
tal t
hera
py g
roup
s.

42
steroid anti-inflammatory drugs (21.4%) and muscle relaxants (12.5%). At 10 weeks follow-up the most frequently used painkillers were light analge-sics and antipyretics (15.2%), light opoids (12.7%), non-steroid anti-inflammatory drugs (12.0%) and muscle relaxants (3.8%).
The fifteen disability rating variables are shown in Table 7. At baseline the experimental groups tended to have higher scores than the reference groups in all fifteen variables. However, at 5 and 10 weeks the experimental groups tended to have lower scores than the reference groups in all variables. The rate of improvement was significantly faster in the experimental groups than in the reference groups for disability rating index, including 12 varia-bles, (p<0.05) and all 15 variables (p<0.05). The same was true for the 'heavy' variables (p<0.01) as well as for 'less heavy' (p<0.05).
Levels for all fifteen disability rating score variables at baseline, 5 and 10 weeks adjusted for the initial differences in outcome variables, for differ-ences in verified herniated disc, and for age and sex distribution are shown in Figure 6. At baseline, all levels were set to 100%. The levels, expressed as percentages of the initial value, decreased in all groups, but the experimental groups had consistently lower levels than the reference groups for all varia-bles at 5 as well as at 10 weeks of follow-up.
Health related quality of life (Paper III) Crude outcome data at baseline, 5 and 10-week follow-up are displayed in Table 8. The Well-being score increased across time in all groups, and so did all the sub-scales except for a few in Group 1. Complaint score decreased systematically across time in all groups. The change from baseline to 10-week follow-up was significant across all groups (p<0.0001 to 0.02) except for mood and family situation. However, the differences in change between groups were all insignificant except for patience (p=0.02).
Since the starting levels for the scales differed between the groups, a mul-tivariate analysis was performed adjusted for differences in starting levels. Outcome adjusted for the covariates (age, sex, body mass index, smoking habits, low back pain history during the last two years, and initial outcome differences) are shown in Table 9 as treatment group specific mean levels of the outcome variables across the study period. The total Well-being score increased consistently across the treatment groups (p=0.02), and so did the items patience score (p=0.005), energy (p=0.02), mood (p=0.03), and family situation (p=0.04). For the items perceived health, and sleep and for Com-plaint score there were similar but non-significant trends.

43
Figure 6. Adjusted levels of 15 disability measures in the experimental and refer-ence groups at baseline (a), 5 weeks (b) and 10 weeks (c) expressed as percentages of the group means at baseline. The baseline values were set to 100% and 0% indi-cates complete improvement.
0
20
40
60
80
100 Heavy physical work
Lifting heavy objects
Participating in exercise/sports
Running
Getting up from sitting
Dressing (without help)
Light physical work
Sitting for a longer time Standing bent over a sink
Car driving/car riding
Carrying a bag
Climbing stairs
Making a bed
Outdoor walks
Lying still
a
Reference therapy group Experimental therapy group
0
20
40
60
80
100 Heavy physical work
Lifting heavy objects
Participating in exercise/sports
Running
Getting up from sitting
Dressing (without help)
Light physical work
Sitting for a longer time Standing bent over a sink
Car driving/car riding
Carrying a bag
Climbing stairs
Making a bed
Outdoor walks
Lying still
b
Reference therapy group Experimantal therapy group
0
20
40
60
80
100 Heavy physical work
Lifting heavy objects
Participating in exercise/sports
Running
Getting up from sitting
Dressing (without help)
Light physical work
Sitting for a longer time Standing bent over a sink
Car driving/car riding
Carrying a bag
Climbing stairs
Making a bed
Outdoor walks
Lying still
c Reference therapy group Experimental therapy group

Tab
le 8
. Cru
de o
utco
me
data
at b
asel
ine
and
at 1
0-w
eek
follo
w u
p of
qua
lity
of li
fe v
aria
bles
in th
e fo
ur tr
eatm
ent g
roup
s.
G
roup
1
(Sta
y-ac
tive)
Gro
up 2
(S
tay-
activ
e an
d m
uscl
e st
retc
hing
)
Gro
up 3
(S
tay-
activ
e, st
retc
hing
and
m
anua
l the
rapy
)
Gro
up 4
(S
tay-
activ
e, st
retc
hing
, m
anua
l the
rapy
and
ster
oid
inje
ctio
ns)
B
ase-
line
5 w
eeks
10
w
eeks
B
ase-
line
5 w
eeks
10
w
eeks
B
ase-
line
5 w
eeks
10
w
eeks
B
ase-
line
5 w
eeks
10
w
eeks
M
ean
(SD
) M
ean
(SD
) M
ean
(SD
) M
ean
(SD
) M
ean
(SD
) M
ean
(SD
) M
ean
(SD
) M
ean
(SD
) M
ean
(SD
) M
ean
(SD
) M
ean
(SD
) M
ean
(SD
) p
Wel
l-bei
ng
scor
e (m
m
VA
S)
65.8
(1
7.7)
68
.9
(15.
8)
68.0
(1
8.2)
67
.4
(14.
4)
72.4
(1
4.8)
76
.7
(15.
9)
69.1
(1
4.1)
73
.9
(13.
9)
77.3
(1
5.5)
66
.6
(15.
8)
73.9
(1
5.8)
76
.4
(16.
2)
0.03
Pa
tienc
e 65
.1
(21.
0)
64.7
(2
1.0)
61
.9
(24.
3)
64.3
(2
0.0)
68
.4
(21.
7)
74.1
(2
1.8)
66
.0
(23.
0)
70.6
(2
3.4)
74
.3
(23.
7)
63.8
(2
2.8)
71
.0
(20.
8)
74.5
(2
0.8)
0.
02
En
ergy
66
.9
(23.
3)
62.8
(2
1.0)
65
.2
(22.
7)
67.1
(2
0.8)
69
.3
(18.
0)
75.0
(1
7.6)
70
.7
(21.
6)
71.3
(1
9.5)
74
.5
(20.
7)
67.1
(2
0.8)
70
.9
(20.
4)
73.4
(2
0.6)
0.
26
M
ood
69.4
(2
0.8)
71
.2
(21.
4)
66.0
(2
5.4)
71
.1
(20.
1)
72.2
(1
8.9)
77
.3
(18.
5)
74.8
(1
8.5)
75
.2
(17.
1)
78.2
(1
9.6)
69
.0
(20.
4)
76.1
(1
9.2)
75
.3
(19.
9)
0.14
Fa
mily
si
tuat
ion
79.3
(2
3.1)
78
.4
(18.
8)
76.1
(2
2.0)
85
.2
(14.
7)
84.5
(1
4.1)
81
.8
(19.
3)
84.0
(1
7.7)
83
.6
(16.
9)
85.4
(1
5.3)
83
.5
(19.
1)
84.4
(1
7.9)
83
.9
(19.
0)
0.21
Pe
rcei
ved
heal
th
52.3
(2
7.4)
64
.1
(21.
3)
66.9
(2
2.1)
50
.6
(20.
3 66
.8
(19.
7)
71.9
(2
3.6)
51
.3
(26.
7)
66.9
(2
2.7)
71
.2
(23.
8)
51.7
(2
5.4)
67
.4
(23.
0)
74.2
(2
1.6)
0.
30
Sl
eep
61.9
(2
7.0)
72
.4
(20.
8)
71.6
(2
0.7)
66
.4
(26.
6)
73.1
(2
3.2)
80
.0
(19.
2)
67.9
(2
9.7)
75
.8
(23.
6)
80.0
(2
1.7)
64
.2
(28.
0)
73.8
(2
2.5)
77
.1
(21.
2)
0.66
Com
plai
nt
scor
e 9.
9 (4
.7)
8.3
(6.0
) 7.
3 (5
.6)
9.6
(4.4
) 7.
5 (4
.9)
7.4
(5.6
) 9.
5 (5
.2)
7.1
(4.9
) 6.
8 (5
.0)
8.9
(3.9
) 6.
7 (4
.6)
5.8
(4.2
) 0.
58
p va
lue
refe
rs to
diff
eren
ces b
etw
een
grou
ps a
t 10-
wee
k fo
llow
up.

Tab
le 9
. Mul
tivar
iate
ana
lysi
s of w
ell-b
eing
in th
e fo
ur g
roup
s whe
n th
e ba
selin
e di
ffer
ence
s wer
e co
nsid
ered
.
G
roup
1
(Sta
y-ac
tive)
Gro
up 2
(S
tay-
activ
e an
d m
uscl
e st
retc
hing
)
Gro
up 3
(S
tay-
activ
e,
stre
tchi
ng a
nd
man
ual t
hera
py)
Gro
up 4
(S
tay-
activ
e,
stre
tchi
ng, m
anua
l th
erap
y an
d st
eroi
d in
ject
ions
)
p
M
ean
SD
Mea
n SD
M
ean
SD
Mea
n SD
Wel
l-bei
ng sc
ore
(mm
VA
S)
68.4
12
.5
72.1
12
.4
72.3
12
.4
72.7
12
.5
0.02
Patie
nce
63.7
16
.7
69.2
16
.7
69.5
16
.7
70.3
16
.8
0.00
5
Ener
gy
65.7
15
.1
71.1
15
.1
70.4
15
.1
71.0
15
.2
0.02
Moo
d 70
.0
15.6
73
.6
15.6
73
.8
15.6
74
.6
15.6
0.
03
Fa
mily
situ
atio
n 80
.4
13.5
82
.4
13.5
83
.7
13.4
83
.7
13.5
0.
04
Pe
rcei
ved
heal
th
60.7
21
.8
63.5
21
.8
63.2
21
.7
64.2
21
.9
0.26
Slee
p 70
.5
18.5
72
.4
18.5
73
.0
18.4
72
.2
18.6
0.
48
Com
plai
nt sc
ore
8.1
3.5
8.0
3.5
7.7
3.4
7.6
3.5
0.19
Th
e po
ssib
le o
utco
me
affe
ctin
g va
riabl
es a
ge, s
ex, b
ody
mas
s in
dex,
sm
okin
g ha
bits
, low
bac
k pa
in h
isto
ry d
urin
g th
e tw
o ye
ars
prec
edin
g ba
selin
e, d
urat
ion
of c
urre
nt e
piso
de, l
ow b
elie
f in
act
ivity
, bel
ief
in r
etur
n to
wor
k, a
nd a
ctua
l ret
urn
to w
ork
wer
e in
clud
ed a
s cov
aria
tes i
n th
e an
alys
is.

46
Table 10. Physical examination findings at baseline.
N %
Severe observed pain influence 4 2.5
Pain radiation according to physical examination
To uni/bilateral leg from flexion 129 80.6 To uni/bilateral leg from extension 109 68.1
Positive straight leg raising test (SLR) 43 26.9
Pathological reflex or other test
Patellar, uni- or bilateral 17 10.6
Achilles, uni- or bilateral 21 13.1
Greater toe extension test, uni- or bilateral 27 16.9
Clinical indication score for nerve root involvement
Weak indication (score 0) 99 61.9
Intermediately strong indication (score 1) 40 25.0
Strong indication (score 2) 21 13.1
Clinical indication score (Paper IV) The physical examination findings used to construct the clinical indication score for nerve root involvement are summarised in Table 10. Few patients had observable severe pain, pain radiation was common, and pathological reflexes appeared in 11-17% of the cases. More than half were classified as having a weak indication for nerve root involvement, a quarter an intermedi-ately strong indication and 13% had a strong indication of nerve root in-volvement.
Effect on return to work (Paper IV) Bivariate analyses of pain intensity score, pain drawing score, pain radiation according to the pain drawing, clinical indication score, and the covariates were performed to identify variables affecting return to work, Table 11. When the analyses were restricted to baseline measures, clinical indication score was the only significant determinant for return to work. When updated measurements were used also pain radiation according to pain drawing sketches was a significant determinant.

47
Table 11. Effects on return to work over time, 105 days.
HR 95% CI Wald p
Baseline measurements
Age 0.998 0.98-1.02 0.07 0.80
Women 0.90 0.65-1.25 0.40 0.53
Education 1.07 0.94-1.22 1.07 0.30
Body mass index 1.00 0.999-1.00 0.91 0.34
Smoking 0.89 0.64-1.23 0.50 0.48
Treatment group 1.08 0.93-1.25 1.00 0.32
Sick spell duration at baseline 1.00 0.99-1.00 1.01 0.31 Similar complaints last two years 0.88 0.57-1.34 0.38 0.54
Clinical indication score for nerve root involvement 0.78 0.62-0.99 4.17 0.04
Pain radiation according to pain drawing 0.86 0.73-1.02 2.95 0.09
Pain Drawing Score below waistline 0.92 0.83-1.02 2.49 0.11
Pain score 0.99 0.99-1.01 0.08 0.77
Updated measurements
Pain radiation according to pain drawing 0.82 0.68-0.98 4.55 0.03
Pain Drawing Score below waistline 0.95 0.86-1.04 1.23 0.27
Pain intensity score 1.00 1.00-1.01 1.02 0.31 HR=Hazard Ratio, 95% CI=95% confidence intervals, Wald=Wald Chi Square test.
The effects across time of the two significant variables are shown in Fig-ure 7. For pain radiation according to pain drawing, return to work was on average 15 per cent units higher for those with no radiation as compared to those with radiation below the knee. For clinical indication score, those with a weak indication score had 20% higher return to work than those with a strong indication score.
Clinical indication score and updated pain radiation according to the pain drawing sketch were then tested against each other in a multivariate analysis with backward elimination of the non-significant variable. Pain radiation according to the pain drawing was somewhat stronger than clinical indica-tion score (p<0.04 versus p<0.20). The effects of the two variables together are shown in Table 12. Among patients with a radiation below the knee and a strong indication score, 84% returned to work within 105 days versus 97% among those with no radiation and a weak indication score.

48
Figure 7. Return to work over time according to clinical indication score (a) and pain radiation according to pain drawing (b).
a
0
10
20
30
40
50
60
70
80
90
100
0 15 30 45 60 75 90 105
Follow-up time, days
Ret
urn
to w
ork
, %
Weak
Intermediate
Strong
b
0
10
20
30
40
50
60
70
80
90
100
0 15 30 45 60 75 90 105
Follow-up time, days
Ret
urn
to w
ork
, %
No radiation
Radiation to knee
Radiation below knee

49
Table 12. Effect of pain radiation according to pain drawing and clinical indication score for nerve root involvement on return to work (%).
Clinical indication score Weak Intermediate Strong
Pain radiation None, % 96.7 94.5 91.4 To thigh, % 94.9 91.9 88.1 Below knee,% 92.5 88.8 84.3

50
Discussion
Pain as described on a pain drawing sketch was improved over time, an im-provement that mainly occurred during the first half of the study period. Pain intensity and disability were associated with the pain modalities used in the pain drawing. In pain drawing sketches with no pain radiation some pain modalities were associated with higher pain intensity score and disability rating index than others, a finding that became more evident over time. For the pain drawing sketches with pain radiation, the differences were smaller and less consistent than for those with no radiation.
Manual therapy including steroid injections in addition to stay-active care and muscle stretching reduced pain as measured by pain intensity score and pain killer usage better than the reference treatment, stay-active care includ-ing muscle stretching. Also the disability rating index was improved to a larger extent by the experimental treatment as compared with the reference treatment.
Health related quality of life measures were improved across time in the treatment groups. The greatest improvement tended to occur from Group 1 to Group 2, i.e. when ‘muscle stretching’ was added to the stay-active care. Further but more modest improvements occurred in Group 3 and Group 4, i.e. when ‘manual therapy’ or ‘manual therapy and steroid injection’ were added.
Pain drawing sketch information added valuable significant precision to the prediction of return to work better than that of clinical assessment only.
Methodological issues The strengths of the study include that the study population was population based. All patients with low back pain seeking medical attention or receiving sick leave compensation in the area were assessed regarding inclusion in the study. The study population is therefore most certainly representative for this type of low back patients.
The methods used were all well established and evaluated. The visual an-alogue scale has been used for decades, as has the Disability Rating Index instrument [61]. The three variables added to the Disability Rating Index instrument did not affect the results. Pain drawings have been used as a de-

51
scriptive tool and evaluated in numerous trials [45, 72, 76, 139]. The same, blinded observer assessed all pain drawings. The Well-being and Complaint score subscales of the Gothenburg Quality of Life Instrument [67, 68] have also been evaluated and been concluded as an valid and reliable outcome measure [68].
The analyses were based on the intention-to-treat approach, although the data loss attributable to dropout was minimal and there was minimal partial non-response (minimal missing data in returned questionnaires and pain drawings). State of the art data analysis techniques were used. Sick leave at baseline was based on patient questionnaire data, while return to work in Paper IV was based on official data including diagnosis, and date of onset and end of sick-leave periods. The official data were more suitable for the analysis of return to work. In Paper IV three of the four prediction variables were updated with the findings at 5 and 10 weeks until return to work, the exception being the physical examination done at baseline by the same re-cruiting physician. The 105 days long follow-up period was chosen to allow for equally long follow-up periods after baseline, the 5 and 10-week exami-nation.
All study groups received about the same amount of active treatment. It was given according to need from a toolbox of treatment modalities specific for that particular treatment group. Normally, the effects of individual treat-ment modalities cannot be evaluated, but in this study a factorial design was used, with successively added treatment modalities, allowing for evaluation of the effects of added modalities. However, a four-group study design re-duces the statistical power of any study, even when a factorial design is used. To compensate, the outcome variables were based on all measure-ments from baseline to the end of the study period. As a result, the power to detect differences between the study groups in the Well-being variables was satisfactory. Moreover, all initial differences between the groups were taken into account.
The study was designed with no placebo treatment to keep adherence to the study protocol as high as possible and to allow testing of the effects of the various treatment additions. Instead, an active treatment, the stay-active care, was used as the basic, standard treatment, as suggested by others [8, 85, 86, 117]. In this way placebo effects were avoided.
The study weaknesses include that the study was done on a fairly small geographical area, which limited the number of eligible patients and the study sample. However the setting included one Social Insurance Agency office handling all the sick leave compensations, one hospital, and a strict protocol for referral for health care on the mainland. The setting probably reduced the chances for data loss and contaminating treatment.
A potential confounder in this study could be the shorter waiting-time for appointments with the physiotherapists, favouring the experimental groups.

52
However, the four days longer waiting-time for physiotherapy is an unlikely explanation for the differences in outcome at 5 and 10 weeks. To address the potential confounding of uneven waiting time for treatment, the baseline for sick leave analyses in Paper IV was set to the day of first appointment with the treating physician in the study.
Another study limitation was the fact that steroid injections were given sparsely (only 17 patients out of 47 received at least one injection) and at an early stage of the treatment period. Furthermore, owing to the short follow-up period, the effects on the health related quality of life measures in Paper III might have been underestimated, since the health related life quality changes may be expected to occur after the low back pain symptoms dimin-ished substantially [140].
The clinical examination score, used in Paper IV, was done after the study ended by two clinically well-trained persons. The procedure has the drawback of being done not by the treating physician after the study was concluded. On the other hand the scoring was done for another report, by two observers blinded for patient identification, which the treating physician would not have been, and the number of observers and the consensus proce-dure used minimised observer bias. All things considered, there is no reason to believe that the data would be biased to such an extent that the results are affected.
The course of pain drawing sketch variables (Paper I) To assess the pain drawing sketches the pain drawing score was used, a fre-quently used method first described in 1986 by Margolis [45], and later used in numerous studies as an instrument to measure low back pain. Originally, the pain drawing score was based on anatomical regions within the body contour and on weights to compensate for the difference in area size. How-ever, Margolis and others have suggested that the weights are unnecessary, since the raw scores correlate closely with the weighted ones (r=0.97-0.99) [41, 72].
Several studies on the validity and reproducibility of pain drawing sketches have been published. The instrument is validity and reproducibility tested [75, 141], stable over time [72], and has low inter-rater variability [45, 69]. Validity regarding pain, function and some psychological instruments is high [74, 141]. Some authors questioned the reliability of the pain drawing sketch [69, 72, 141], while others found the scoring system to have an ac-ceptable reliability even with untrained observers [45].
Among pain drawing sketch variants available that proposed by Margolis was chosen, containing 43 areas all within the body contour. However, the anatomical areas size and numbers were moderated for this study to a total

53
of 34 areas since the lower half of the body had a higher impact and the area regions were more relevant for the purposes of our study. This method al-lows the pain to be scored using clinically reported pain patterns [70] and it is easy to use. Since the patients in the present study were all suffering from low back pain, the 16 areas of the lower half of the body were of particular interest. Therefore, both the overall score and the 16 areas score below the waistline were reported.
The pain drawing sketches were completed in the same way at all three measurement occasions. Two pain drawing patterns were prominent: the left side dominated the drawings, and there was a more substantial rate of im-provement during the first period than the second. The left side domination has not previously been reported, and therefore remains to be replicated in other studies. The improvement manifested itself as fewer marked areas, fewer marks in the areas, fewer used modalities and more proximal marking, i.e. fewer marks in the leg areas. The early improvement may be attributable to the fact that the majority of treatments were given in the first half of the 10-week treatment period. The effects are seen in association with the treat-ment. The faster change in the first 5 weeks was also evident in the ‘pain modality shift’.
The ‘pain modality shift’ as described by McKenzie [36], was seen in the low back/buttock area. The initially frequent modalities ‘numbness’ and ‘stabbing’ shifted to ‘stiffness’ and ‘no marks’ over time. There are some reports on the distribution of pain modalities in different regions [40, 41]. However, they are based on a single measurement, making it difficult to deduce a ‘pain modality shift’ or the average speed at which the shift occurs.
In the present report there was a strong association (p<0.0001) between pain intensity score, functional score and pain drawing score. These results are in line with the literature both for the disability rating [74, 75, 142] and the pain intensity score [74, 133, 142]. No other studies on the possible as-sociation between various pain modalities and the grade of pain radiation on the pain drawing and pain intensity score or disability rating were found. Furthermore, to compensate for the fact that pain intensity score and disabil-ity rating index are global estimates; the association with the dominating leg pain modalities was analysed only in patients with all marks below waist-line. The present study population had quite a homogenous pain drawing pattern, with the majority of marks below the waistline. Also, both the pain intensity score and the disability rating index were low for patients with no marks in the lower back/buttock areas.
Among patients who had no pain radiation there was a clear change to-wards fewer pain modalities and an emerging difference between modalities in pain intensity score and disability index during the course of the study. This was not found among those who had pain radiation, a finding not de-scribed elsewhere to our knowledge. A possible explanation might be that

54
since various pain modalities communicate with the brain through different type of nerve fibres [143, 144], patients who use a number of modalities to describe their pain might have difficulties in grading the sensations, and the addition of pain radiation makes the distinction between pain modalities too complex [6]. The difficulty to rate complex pain in a small area and to rate radiating pain with different pain modalities in different areas might be even more difficult, because other factors such as psychological coping strategies are likely to contribute to the rating [145]. Also, there could be a minor change in choice of pain modality, a change that is too small to distinguish in this relatively small sample. However, if that is the case, one might ask whether such a minor change is clinically relevant.
The results from this paper emphasise that the pain drawing sketch should be part of the clinical practice when assessing sub-acute low back pain, as recommended in the pain analysis of chronic pain [19]. Pain drawing infor-mation of the different pain modalities adds vital information, i.e. the pa-tients describing pain modalities that are more painful should be subjected to a thorough medical investigation. The recognition that sub-acute low back pain patients with radiating pain are less likely to be able to rank the pain modalities needs further investigation, since radiating leg pain is described as a significant predictor to develop chronic back pain [15]. Also, the possi-bility to differentiate patient categories that benefit from early treatment or extended examination by pain drawing patterns and choice of pain modality requires further investigation.
Pain and disability variables (Paper II) During the period 1987 to 2003 some twelve randomised clinical trials on manual therapy versus various reference treatments in low back pain patients were published. A variety of study designs and treatment methods were used which makes the comparison of results between trials difficult. In five stud-ies the treatment was given as a single tool treatment [146-150] and in seven trials a pragmatic approach was used [62, 151-156]. The manual therapy was more effective than the reference treatment in all the single tool trials and in five of the pragmatic approach trials [62, 151, 153-155]. Thus, the results of the present study are in line with these earlier studies, and the present guide-lines for acute and sub-acute non-specific low back pain [4, 5, 83, 84]. How-ever, despite these mainly positive results, several guidelines were, in the early 2000s, criticised and considered not sufficient due to methodological flaws [109]. Due to these shortcomings there were considered to be far too many unanswered questions to not conclude that most studied low back pain treatments were ineffective or at the best marginally effective and that the choice of treatment had to be based on the therapist’s experience [108].

55
Today, the quality of recent guidelines has been considered much im-proved methodologically [111]. Among the overshadowing problems re-mains the heterogenic patient group creating a methodological study chal-lenge [83, 108]. Most clinical trials in other fields are performed as single tool trials where one specific treatment is compared with another one. It is claimed to be the most unbiased method to evaluate specific treatment ef-fects [157]. However, during the 1990s the pragmatic approach became more common, not least in drug trials where the study drugs may be com-bined with other specified drugs if the treatment goal is not achieved. [158]
The pragmatic treatment approach provides an opportunity to use the most suitable treatment option from a specified list in each of the treatment groups to address the heterogeneous non-specific aetiology. The treatment situation is from this point of view closer to a clinical situation than the sin-gle tool trial. The criticism against the pragmatic approach is mainly based on the potentially confounding effect caused by the number of treatment modalities. The possibility to evaluate the effect of separate treatment mo-dalities is diminished by the pragmatic design unless a factorial design is used [114], as in the present study. This dilemma could also be addressed by creating subgroups within large studies in order to find matching problem characteristics. The study model has been described as the ‘Holy Grail’ of low back pain research [9]. These studies aim at creating large enough ho-mogenous characteristics subgroups to enable the success of different treat-ment tools [108, 112].
However, the model has several weaknesses. One compelling weakness is that primary care practitioners believe in subgroups and that they can identi-fy what type of patients are in the various subgroups. But when this belief was assessed among primary care practitioners there was no consensus on what to include defining a subgroup [159]. Another study weakness includes that the poorly validated study model so far remains unreplicated in other studies [9, 113].
Moreover, the strive for causal homogeneous patient groups, i.e. having the same pathoanatomical cause of pain, may not imply treatment respon-siveness. Different subgroups based on causal mechanisms may not guaran-tee that the patients within each subgroup will develop a similar symptom course over time and respond to given treatment in a similar way [9]. For instance several psychological factors have been shown to predict patient outcome, but these factors cannot be assumed to select patients for specific treatments [113, 160].
Thus, the classification systems that form the base of subgroup methodol-ogy has to be further developed before general alterations of non-specific low back pain study methods could be done. This task has been considered a high priority consensus goal [29]. Until that is done the continued search for valid screening tools of low back pain diagnostics and treatments will be

56
needed [10]. Moreover, the research has also been developed for the last two decades with evidence-based medicine, using structured abstracts, summa-rising of high relevance and methodology in secondary papers and the Cochrane Collaboration [161].
Health related quality of life (Paper III) The muscle stretching addition had the largest observed additional impact on the outcome, i.e. the health related quality of life measurements improved the most between Group 1 and Group 2. The continued addition of treatment modalities, i.e. manual therapy and manual therapy with steroid injections, did affect the outcome further positively but the additional improvement (between Groups 2 and 3 and between Groups 3 and 4) was much smaller than between Groups 1 and 2. However, the size of the additional effects may be assumed to depend on the order in which additional treatment mo-dalities are introduced. This phenomenon is seen in multivariate analyses, where the additional effects of independent variables depend on the order of introduction.
This assumption is further supported by results from other clinical trials. Brennan et al. used subgroups to compare treatment effects in three groups, one of which corresponded to our treatment Group 2 and one of the other to our Group 3 [162]. They found an additional effect between the subgroups in the two groups that got the optimum treatment of approximately the same magnitude as between our Groups 1 and 2. However, there is a major differ-ence between the studies. While Brennan used subgroups to test which treatment approach that was optimal in their groups the present study had a pragmatic approach, where the physicians or physiotherapists were free to choose the optimal treatment from a group specific treatment list for each patient, creating an individual subgrouping. However, we abstained from subgroup analyses since they are questionable in randomised trials if not defined at the time of randomisation.
The Well-being subscale includes a number of potential outcomes some of which, considering the study hypothesis, were regarded as irrelevant, for instance work situation (only 50 were at work at baseline), eyesight, hearing, etcetera. Others were regarded as relevant or highly relevant. It was expected that patience, energy, and mood would be affected. However, it was a sur-prise that perceived health and sleep would not be significantly influenced by the treatment, although there was an inconclusive tendency towards an effect in each of these variables.
The absence of difference between the groups in terms of Complaint score was another surprise. The treatment may have affected the musculo-skeletal symptoms, but the effect on the total Complaint score appears to be

57
approximately the same in all groups. One possible reason might be that it was affected primarily by the stay-active approach, another that the Com-plaint score improvement reflects the natural course of the condition. How-ever, there is limited evidence that behavioural approaches as a compliment to ongoing physiotherapy is more effective in patients who have elevated fear-avoidance, i.e. avoidance of certain physical activities for fear that they will cause back pain, than if the approach is only physiotherapeutic [163].
A few other studies of low back pain have used health related quality of life as outcome measure. In the study reported by Underwood et al., 1,334 primary care patients with sub-acute or chronic low back pain were random-ised to an exercise programme only, spinal manipulation package, combined treatment, or ‘best care’ in general practice (control group), receiving fairly intensive treatment for 12 weeks [160]. The combination group had the best quality of life outcome after three months, followed by the group receiving the spinal manipulation package, the exercise programme group, and the control group. After one year the results were approximately the same. Goldby et al. compared manual therapy with stay-active care and found a large positive effect on health related quality of life in the manual therapy group [164].
Niemistö et al. randomised 204 chronic low back pain patients into two groups, best primary health care, or spinal manipulation and exercises with low intensity (a total of four times during four weeks). They found an effect on pain and disability but not on health related quality of life [165]. Nor did Hay et al., who randomised 402 primary health care patients to a pain man-agement programme (stay-active care and exercise) or manual therapy [166]. There are two additional studies with health related quality of life outcome, one showing an effect [167], the other no effect [168]. However, in both studies compliance with the treatment was only moderate, which makes the results difficult to interpret.
The characteristics of successful manual therapy trials with health related quality of life outcome include study populations with sub-acute low back pain. Patients with chronic low back pain may require a different treatment approach. Furthermore, the treatment intensity was high enough in the suc-cessful studies, while it was modest or low in the non-successful ones. The treatment intensity in the present study was high enough to make a differ-ence, eight to nine appointments over the 10-week study period. The third characteristic was the choice of outcome measures. The successful studies all used fairly simple health related quality of life instruments, such as the Gothenburg Quality of Life Instrument used in this study, Euro Quality of life with five dimensions (EQ-5D), and the physical subscale of Fear Avoid-ance Beliefs Questionnaire (FABQ).

58
Pain drawing prediction (Paper IV) To standardize the results of a physical examination including a neurological status into a clinical examination score is difficult. Despite the vast number of suggested low back pain classification systems the results have been dis-appointing, none of the suggested systems has gained international recogni-tion [145, 169]. The classification efforts have been one-dimensional with either bio-medical or psychosocial focus. The bio-medical classification systems mix different types of variables such as age and gender with the result from various questionnaires (for example the Oswestry low back pain questionnaire) and different physical examination manoeuvres and their results [170]. This circumstance combined with a tendency that cultural set-tings (attitudes, beliefs and interactions in society) might have impact on the natural history of low back pain, offer one explanation to why the clinical examination standardisation still is missing [145]. The results of the present paper suggest a possibility to use the pain drawing as a bridge in this dilem-ma. The studied pain drawing assessment model with pain radiation update was promising and may add precision to the effort of identifying determi-nants of clinical examination.
Measuring return to work poses another challenge with no gold standard [171, 172], for various reasons specific from country to country and the complexity of the benefit system [173-175]. However, a Swedish review found limited scientific evidence of the effect of sick listing in relation to low back pain, no matter whether register data or self-reported data were used [55]. The way of calculating return to work used in this report has been used previously [176].
59
Conclusions
Perceived pain intensity and disability were associated with the pain modali-ties used in the pain drawing sketch. The pain drawing sketches with no pain radiation changed over time with fewer pain modalities, and a strong associ-ation between the pain modalities and the pain intensity score or the disabil-ity rating index emerged. This was not found among those with pain radia-tion.
The manual therapy concept was more effective than the standardised but optimised stay-active care in acute and sub-acute low back pain patients, regarding pain reduction and improvement of everyday function. In spite of the fact that the mechanism by which the effect is mediated is still unknown, the results are sufficiently convincing for the method to be used as one of several treatment options in patients with acute and sub-acute low back pain.
The effects on health related quality of life were greater the larger the number of treatment modalities available. The stay-active treatment group, with the most restricted number of modalities, had the most modest health related quality of life improvement, while Group 4 with the most generous choice of treatment modalities, had the greatest improvement in health relat-ed quality of life.
When determining return to work with baseline data the score based on clinical examination data appear to be the best. But, when using updated measures pain radiation according to the pain drawing sketch contributed significantly to the prediction of return to work. However, more research and standardisation is needed to assess the value of the determinants.

60
Acknowledgements
This thesis was carried out at the section of Family Medicine and Clinical Epidemiology in the Department of Public Health and Caring Sciences, Fac-ulty of Medicine at Uppsala University. It was made possible by the support of many persons, to whom I wish to say: Thank you! Without your unselfish help, encouraging words and inspirations over the years this process had been so much harder, if possible at all. I would especially like to express my sincere gratitude to:
• My main supervisor, Professor Kurt Svärdsudd, for getting me hooked on research and always believing in my ability, even when I doubted myself. For never ending patience and enthusiasm in out-standing tutoring of science. The sharing of your abundant scientific knowledge has been generous and unselfish. I am grateful for your courage to challenge my ideas, discuss them, delivering constructive criticism and making our weekly sessions joyful.
• My additional supervisor, Professor Lars-Erik Strender, for always listening to me and never failing a discussion. For inspiring me to never give up, patiently helping me find ways I didn’t see to solve various problems. For scrutiny in the research process, in never leaving unfinished work, and your generous sharing of experience.
• My additional supervisor, Stefan Blomberg, for seeing the aspiring research student. For inspiring me to continue the search for answers and for the opportunity to join the Uppsala university research group in low back pain, in which I have stayed ever since. For the initia-tion of and carrying out the Gotland Low Back Pain study.
• Johan Bogefeldt, co-author and co-worker. Fellow research student for friendship and much inspiring discussions. For together strug-gling to understand different scientific methods. Your ability to cheer me up when energy has been low is valuable to me.
• Late Professor Gösta Tibblin, who took part in the design of the Gotland Low Back Pain study.

61
• The Gotland Low Back Pain study group who made great contribu-tions to the study. The study secretary Cajsen Bergengren, the re-cruiting physician Martin Helldén, health care director Bo Bergen-gren, the study physicians, physiotherapists and other staff of the participating centres.
• Heads of departments where I have worked at Proxima, Nacka Närsjukhus for flexibility of time to meet the research schedule.
• My parents, Romans and Ulla Januss, for believing in me and teach-ing me to believe in my own ability. For life long love and support.
• My beloved husband, Ulf, for being my life companion and partner. Our precious children, Marcus and Sophie, for helping me see the true values in life. I love you!
• My friends and family for your support, patience and encourage-ment over these years. You make the difference to me.
This project was supported by grants from the Research Department of the Swedish Social Insurance Agency, Stockholm Clinic — Stay Active, Stock-holm, the Province of Gotland, the Stockholm County Council and Uppsala University.

62
References
1. Skillgate E, Arvidsson J, Ekström C, Hilborn A, Mattsson-Coll A: Naprapatins grunder, first edition. Lund: Studentlitteratur AB; 2009.
2. Nachemson A, Jonsson E, Werkö L, et al. editors. Ont i ryggen - or-saker, diagnostik och behandling. Stockholm: The Swedish Council on Technology Assessment in Health Care, 1991.
3. Blomberg S. A pragmatic approach to low-back pain including manu-al therapy and steroid injections. A multicentre study in primary health care. Acta universitatis Upsaliensis. Comprensive summaries of dissertations from the faculty of medicine 394. Stockholm: Almqvist & Wiksell International. Uppsala University; 1993.
4. Bronfort G, Haas M, Evans R, Leininger B, Triano J. Effectiveness of manual therapies: the UK evidence report. Chiropr Osteopat 2010, 18:3.
5. Chou R, Qaseem A, Snow V, Casey D, Cross TJ, Shekelle PG, Owens DK. Diagnosis and Treatment of Low Back Pain: A Joint Clinical Practice Guideline from the American College of Physicians and the American Pain Society. Annals of Internal Medicine 2007, 147(7):478-491.
6. Nachemson AL, Jonsson E, editors. Neck and back pain: The scien-tific evidence of causes, diagnosis, and treatment. Philadelphia: Lip-pincott Williams & Wilkins; 2000.
7. Waddell G. Biopsychosocial analysis of low back pain. Clin Rheu-matol 1992, 6:523-557.
8. Waddell G. The Back Pain Revolution. Edinburgh: Churchill Living-stone; 1998.
9. Foster NE, Hill JC, Hay EM. Subgrouping patients with low back pain in primary care. Manual Therapy 2011, 16(1):3-8.
10. Shekelle PG, Delitto AM. Treating low back pain. Lancet 2005, 365(9476):1987-1989.
11. Håland Haldorsen EM, Grasdal AL, Skouen JS, Risa AE, Kronholm K, Ursin H. Is there a right treatment for a particular patient group? Comparison of ordinary treatment, light multidisciplinary treatment, and extensive multidisciplinary treatment for long-term sick.listed employees with musculoskeletal pain. Pain 2002, 95:49-63.
63
12. Fritz JM, George SZ. The use of classification approach to identify subgroups of patients with acute low back pain. Interrater reliability and short-term treatment outcomes. Spine 2000, 25(1):106-114.
13. Pincus T, Santos R, Breen A, Burton KA, Underwood MR. A review and proposal for a core set of prognostic factors for prospective co-horts in low back pain: a consensus statement. Arthritis & Rheuma-tism 2008, 59(1):14-24.
14. Banks WA, Watkins LR: Mediation of chronic pain. Not by neurons alone. Pain 2006, 124:1-2.
15. Fransen M, Woodward M, Norton R, Coggan C, Dawe M, Sheridan N. Risk factors associated with the transition from acute to chronic occupational back pain. Spine 2002, 27(1):92-98.
16. Tubach F, Beauté J, Leclerc A. Natural history and prognostic indica-tors of sciatica. J Clinical Epidemiology 2004, 57(2):174-179.
17. Wall PD, Melzack R, editors. Textbook of Pain, Fourth edition. Lon-don: Churchill Livingstone; 2002.
18. Turk DC, Okifuji A, Sinclair ID, Starz TW. Pain, disability and physi-cal functioning in subgroups of patients with fibromyalgia. Journal of Rheumatology 1996, 23(7):1255-1262.
19. Main CJ, Spanswick CC. Pain management - an interdiciplinary ap-proach. Edinburgh: Churchill Livingstone; 2000.
20. Main CJ, Watson PJ. Psychological aspects of musculoskeletal pain. In: Textbook of musculoskeletal medicine. Edited by Hutson M, Ellis R. Oxford: Oxford University Press; 2006: 97-107.
21. Gordh T, Chu H, Sharma H. Spinal nerve lesion alters blod-spinal cord barrier function and activates astrocytes in the rat. Pain 2006, 124:211-221.
22. Merskey H. Logic, truth and language in concepts of pain. Quality of Life Res 1994, 3(Suppl 1):S69-S76.
23. van Tulder MW, Furlan A, Bombardier C, Bouter L. Updated method guidelines for systematic reviews in the Cochrane collaboration back review group. Spine 2003, 28(12):1290-1299.
24. Waddell G. Clinical Assessment of Lumbar Impairment. Clinical orthopaedics and related research 1987(Number 221):110-120.
25. Treede R, Jensen TS, Campbell J, Cruccu G, Dostrovsky J, Griffin J, Hansson P, Hughes R, Nurmikko T, Serra J. Neuropathic pain: re-definition and a grading system for clinical and research purposes. Neurology 2008, 70(18):1630-1635.
26. Henschke N, Maher CG, Refshauge KM, Herbert RD, Cumming RG, Bleasel J, York J, Das A, McAuley JH. Prevalence of and Screening for Serious Spinal Pathology in Patients Presenting to Primary Care Settings With Acute Low Back Pain. Arthritis & Rheumatism 2009, 60(10):3072-3080.

64
27. Hestbaek L, Leboeuf-Yde C, Manniche C. Low back pain: what is the long-term course? A review of studies of general patient populations. European Spine J 2003, 12:149-165.
28. Pengel LH, Herbert RD, Maher CG, Refshauge KM. Acute low back pain: systematic review of its prognosis. BMJ 2003, 327:323.
29. Foster NE, Dziedzic KS, van der Windt DA, Fritz JM, Hay EM. Re-search priorities for non-pharmacological therapies for common mus-culoskeletal problems: nationally and internationally agreed recom-mendations. BMC Musculosceletal Disorders 2009, 10:3.
30. Perrot S, Allaert FA, Concas V, Laroche F. ‘‘When will I recover?’’ A national survey on patients’ and physicians’ expectations concern-ing the recovery time for acute back pain. European Spine J 2009, 18:419-429.
31. Miranda H, Viikari-Juntura E, Martikainen R, Takala E-P, Riihimäki H. Individual Factors, Occupational Loading, and Physical Exercise as Predictors of Sciatic Pain. Spine 2002, 27(10):1102-1109.
32. Picavet HS, Schouten JS, Smit HA. Prevalence and consequences of low back problems in The Netherlands, working vs non-working pop-ulation, the MORGEN-Study. Monitoring Project on Risk Factors for Chronic Disease. Public Health 1999, 113(2):73-77.
33. Leboeuf-Yde C, Lauritsen JM. The prevalence of low back pain in the literature. A structured review of 26 Nordic studies from 1954 to 1993. Spine 1995, 20(19):2112-2118.
34. Ihlebæk C, Hansson TH, Lærum E, Brage S, Eriksen HR, Holm SH, Svendsrød R, Indahl A. Prevalence of low back pain and sickness ab-sences a "borderline" study in Norway and Sweden. Scand J Public health 2006, 34(5):555-558.
35. Weber H, Holme L, Amlie E. The natural course of acute sciatica with nerve root symptoms in a double-blind placebo-controlled trial evalu-ating the effect of piroxicam. Spine 1993, 18(11):1433-1438.
36. McKenzie R. The Lumbar Spine. Mechanical Diagnosis and Therapy. Waikanae, New Zealand: Spinal Publications Ltd; 1981.
37. Fritz JM, Delitto A, Vignovic M, Busse RG. Interrater reliability of judgments of the centralization phenomenon and status change during movement testing in patients with low back pain. Arch Phys Med Re-habil 2000, 81(1):57-61.
38. Werneke M, Hart DL, Cook D. A descriptive study of the centraliza-tion phenomenon. A prospective analysis. Spine 1999, 24(7):676-683.
39. Delitto A, Erhard RE, Bowling RW. A treatment-based classification approach to low back syndrome: identifying and staging patients for conservative treatment. Phys Ther 1995, 75(6):470-485.
40. Uden A, Landin LA. Pain drawing and myelography in sciatic pain. Clin Orthop 1987(216):124-130.

65
41. Almay BGL. Clinical characteristics of patients with idiopathic pain syndromes. Depressive symptomatology and patient pain drawings. Pain 1987, 29:335-346.
42. Ohnmeiss DD, Vaharanta H, Ekholm J. Relationship of pain drawings to invasive tests assessing intervertebral disc pathology. European Spine J 1999, 8:126-131.
43. Rankine JJ, Fortune DG, Hutchinson CE, Hughes DG, Main CJ. Pain drawings in assessment of nerve root compression: A comparative study with lumbar spine magnetic resonance imaging. Spine 1998, 23(15):1668-1676.
44. Palmer H. Pain charts: a description of a thecnique whereby function-al pain may be diagnosed from organic pain. N Z Med J 1949, (48):187-213.
45. Margolis RB, Tait RC, Krause SJ. A rating system for use with patient pain drawings. Pain 1986(24):57-65.
46. Ransford AO, Cairns D, Mooney V. The pain drawing as an aid to the psychologic evaluation of patients with low-back pain. Spine 1976, 1(2):127-134.
47. Hildebrandt J, Franz CE, Choroba-Mehnen B, Témme M. The Use of Pain Drawings in Screening for Psychological Involvement in Com-plaints of Low-Back Pain. Spine 1988, 13(6):681-685.
48. Schwartz DP, DeGood DE. Global Appropriateness of Pain Drawings: Blind Ratings Predict Patterns of Psychological Distress and Litiga-tion Status. Pain 1984(19):383-388.
49. von Baeyer CL, Bergstrom KJ, Brodwin MG, Brodwin SK. Invalid use of pain drawings i psychological screening of back pain patients. Pain 1983, 16:103-107.
50. Deyo RA, Battie M, Beurskens AJHM, Bombardier C, Croft P, Koes B, Malmivaara A, Roland M, von Korff M, Waddell G. Outcome measures for low back pain research. A proposal for standardized use. Spine 1998, 23(18):2003-2013.
51. Ferguson SA, Marras WS, Burr DL. Differences among outcome measures in occupational low back pain. J Occupational Rehabilita-tion 2005, 15(3):329-341.
52. Karjalainen K, Malmivaara A, van Tulder M, Roine R, Jauhiainen M, Hurri H, Koes B. Multidisciplinary biopsychosocial rehabilitation for subacute low-back pain among wotking age adults (Review). Cochrane Database of Systematic Reviews 2003(2):Art. No.: CD002193.
53. Bombardier C. Spine focus issue introduction. Outcome assessments in the evaluation of treatment of spinal disorders. Spine 2000, 25(24):3097-3099.

66
54. Guyatt GH, Naylor DC, Juniper E, Heyland DK, Jaeschke R, Cook DJ. Users' Guides to the Medical Literature: XII. How to Use Articles About Health-Related Quality of Life. JAMA 1997, 277(15):1232-1237.
55. Alexanderson K, Allebeck P, Hansson T et al. Sjukskrivning - orsak-er, konsekvenser och praxis. En systematisk litteratur översikt. Stock-holm: The Swedish Council on Technology Assessment in Health Care 2003.
56. Hoogendoorn WE, Bongers PM, de Vet HCW, Ariens GA, van Mechelen W, Bouter LM. High physical work load and low job satis-faction increase the risk of sickness absence due to low back pain: re-sults of a prospective cohort study. Occup Environ Med 2002, 59(5):323-328.
57. Borg G. The Borg CR10 Scale. A method for measuring intensity of experience, e.g., percieved exertion and pain. Rimbo: Sweden 1998.
58. Fairbank JCT, Davies JB, Couper J, O'Brien JP. The Oswestry Low Back Pain Disability Questionnaire. Physiotherapy 1980, 66(8):271-273.
59. Roland M, Morris R. (1982 Volvo Award in Clinical Science) A study of the natural history of Back pain. Part I: Development of a reliable and sensitive measure of disability in low-back pain. Spine 1983, 8(2):141-144.
60. Johansson E, Lindberg P. Subacute and chronic low back pain. Relia-bility and validity of a Swedish version of the Roland and Morris Dis-ability Questionnaire. Scand J Rehabil Med 1998, 30(3):139-143.
61. Salén BA, Spangfort EV, Nygren ÅL, Nordemar R. The disability rating index: an instrument for the assessment of disability in clinical settings. J Clin Epidemiol 1994, 47(12):1423-1434.
62. Blomberg S, Svärdsudd K, Tibblin G. A controlled, multicentre trial of manual therapy with steroid injections in low-back pain; functional variables, side-effects and complications during four months' follow-up. Clin Rehabil 1993, 7:49-62.
63. Guyatt G, Feeny DH, Patrick DL. Measuring health-related quality of life: basic sciences review. Annals of Internal Medicine 1993, 70:225-230.
64. Revicki DA, Osoba D, Fairclough D, Barofsky I, Berzon R, Leidy NK, Rothman M. Recommendations on health-related quality of life research to support labeling and promotional claims in the United States. Quality of Life Res 2000, 9:887-900.
65. Linton SJ, Halldén K. Can we screen for problematic back pain? A screening questionnaire for predicting outcome in acute and subacute back pain. The clinical journal of pain 1998, 14:209-215.

67
66. Rabin R, de Charro F. EQ-5D: a measure of health status from the EuroQol Group. Annals of Medicine 2001, 33(5):337-343.
67. Tibblin G, Tibblin B, Peciva S, Kullman S, Svärdsudd K. The Göte-borg quality-of life instrument - an assessment of well-being and symptoms among men born 1913 and 1923. Scand J Prim Health Care 1990, 1990 Supplement:35-40.
68. Sullivan M, Karlsson J, Bengtsson C, Furunes B, Lapidus L, Lissner L. The Göteborg Quality of Life Instrument- A psychometric evalua-tion of assessments of symptoms and well-being among women in a general population. Scand J Prim Health care 1993, 11:267-275.
69. Bryner P. Extent measurement in localised low-back pain: a compari-son of four methods. Pain 1994, 59(2):281-285.
70. Vucetic N, Maattanen H, Svensson O. Pain and pathology in lumbar disc hernia. Clin Orthop 1995(320):65-72.
71. Udén A, Åström M, Bergenudd H. Pain drawings in chronic back pain. Spine 1988, 13(4):389-392.
72. Margolis RB, Chibnall JT, Tait RC. Test-retest reliability of the pain drawing instrument. Pain 1988(33):49-51.
73. Gatchel RJ, Mayer TG, Capra P, Diamond P, Barnett J. Quantification of Lumbar Function. Part 6: The Use of Psychological Measures in Guiding Physical Functional Restoration. Spine 1986, 11(1):36-42.
74. Toomey TC, Mann JD, Abashian S, Thompson-Pope S. Relationship of pain drawing scores to ratings of pain description and function. Clin J Pain 1991, 7(4):269-274.
75. Öhlund C, Eek C, Palmblad S, Areskoug B, Nachemson A. Quantified pain drawing in subacute low back pain. Validation in a nonselected outpatient industrial sample. Spine 1996, 21(9):1021-1030.
76. Beattie PF, Meyers SP, Stratford P, Millard RW, Hollenberg GM. Associations between patient report of symptoms and anatomic im-pairment visible on lumbar magnetic resonance imaging. Spine 2000, 25(7):819-828.
77. www.cochrane.iwh.on.ca. access on july 15:th 2011. 78. Hagen KB, Hilde G, Jamtvedt G, Winnem MF. The Cochrane Review
of Bed Rest for Acute Low Back Pain and Sciatica. Spine 2000, 25(22):2932-2939.
79. van Tulder M, Malmivaara A, Esmail R, Koes B. Exercise therapy for low back pain: A systematic review within the framework of the cochrane collaboration back review group. Spine 2000, 25(21):2784-2796.
80. van Tulder MW, Scholten RJ, Koes BW, Deyo RA. Nonsteroidal anti-inflammatory drugs for low back pain: A systematic review within the framework of the cochrane collaboration back review group. Spine 2000, 25(19):2501-2513.

68
81. van Tulder MW, Cherkin DC, Berman B, Lao L, Koes BW: The ef-fectiveness of acupuncture in the management of acute and chronic low back pain. A systematic review within the framework of the Cochrane Collaboration Back Review Group. Spine 1999, 24(11):1113-1123.
82. Dagenasis S, Gay RE, Tricco AC, Freeman MD, Mayer JM: NASS Contemporary concetpts in spine care: spinal manipulation therapy for acute low back pain. Spine J 2010, 10(10):918-940.
83. van Tulder M, Becker A, Bekkering T, Breen A, del Real MT, Hutchinson A: Chapter 3. European guidelines for the management of acute nonspecific low back pain in primary care. European Spine J 2006, 15(suppl 2):S 169-191.
84. Savigny P, Watson P, Underwood MR: Early management of persis-tent non-specific low back pain: summary of NICE guidance. BMJ 2009, 338(Jun 4):b1805.
85. Indahl A, Velund L, Reikeraas O: Good prognosis for low back pain when left untampered: a randomized clinical trial. Spine 1995, 20:473-477.
86. Blomberg S: A pragmatic management strategy for low-back pain - an integrated multimodal programme. In: Textbook of Musculoskeletal Medicine. Edited by Hutson M, Ellis R: Oxford university press; 2005: Part 4.4.
87. Travell JG, Simons DG: Myofascial Pain and Dysfunction: The trig-ger point manual - The upper extremeties, vol. 1, 1:st edition. Balti-more: Williams & Wilkins; 1983.
88. Dahm KT, Brurberg KG, Jamtvedt G, Hagen EM: Advice to rest in bed versus advice to stay active for acute low-back pain and sciatica (Review). Cochrane Database of Systematic Reviews 2010(6):Art.No.: CD007612.
89. Haswell K, Gilmour J, Moore B: Clinincal decision ruels for identifi-cation of low back pain patients with neurologic involvement in pri-mary care. Spine 2008, 33(1):68-73.
90. Brower RG: Conseqences of bed rest. Critical Care Medicine 2009, 37(10 Supplement):S422-428.
91. Burton AK, Waddell G, Tillotson KM, Summerton N: Information and advice to patients with back pain can have a positive effect: a ran-domized controlled trial of a novel educational booklet in primary care. Spine 1999, 24:2484-2491.
92. Khalil TM, Asfour SS, Martinez LM, Waly SM, Rosomoff RS, Ro-somoff HL: Stretching in the rehabilitation of low-back pain patients. Spine 1992, 17(3):311-317.
93. Häkkinen A, Krutiainen H, Hannonen P, Ylinen J: Strength training and stretching versus stretching only in the treatment of patients with

69
chronic neck pain: a randomized one-year follow-up study. Clinical Rehabilitation 2008, 22:592-600.
94. Sherman KJ, Cherkin DC, Cook AJ, Hawkes RJ, Deyo RA, Wellman R, Khalsa PS: Comparison of yoga versus stretching for chronic low back pain: protocol for the Yoga Exercise Self-care (YES) trial. Trials 2010, 11:36.
95. Choi B, Verbeek J, Tam W, Jiang J: Exercises for prevention of recur-rences of low-back pain. (Review). The Cochrane Database of Sys-tematic Review 2010(1).
96. Moffett JK, Torgerson D, Bell-Syer S, Jackson D, Llewlyn-Phillips H, Farrin A, Barber J: Randomised controlled trial of exercise for low back pain: clinical outcomes, costs, and preferences. Bmj 1999, 319(7205):279-283.
97. Rasmussen-Barr E, Äng B, Arvidsson I, Nilsson-Wikmar L: Graded Exercise for Recurrent Low-Back Pain. A Randomized, Controlled Trial With 6-, 12-, and 36-Month Follow-ups. Spine 2009, 34(3):221-228.
98. Shirado O, Doi T, Akai M, Hoshino Y, Fujino K, Hayashi K, Marui E, Iwaya T: Multicenter Randomized Controlled Trial to Evaluate the Effect of Home-Based Exercise on Patients With Chronic Low Back Pain. The Japan Low Back Pain Exercise Therapy Study. Spine 2010, 35(17):E811-819.
99. Assendelft WJJ, Morton SC, Yu Emily I, Suttorp MJ, Shekelle PG: Spinal manipulative therapy for low-back pain (Review). Cochrane Database of Systematic Reviews 2004(1):Art. No.: CD000447.
100. Maiers MJ, Hartvigsen J, Schulz C, Schulz K, Evans RL, Bronfort G: Chirporactic and exercise for seniors with low back pain: the design two randomized clinical trials. BMC Musculosceletal Disorders 2007, 8:94.
101. Airaksinen O, Brox JI, Cedraschi C, Hildebrandt J, Klaber-Moffett J, Kovacs F, Mannion AF, Reis S, Staal B, Ursin H et al: Chapter 4: Eu-ropean guidelines for the management of chronic nonspecific low back pain European Spine J 2006, 15(Suppl 2):S192-300.
102. Blomberg S, Hallin G, Grann K, Berg E, Sennerby U: Manual therapy with steroid injections--a new approach to treatment of low back pain. A controlled multicenter trial with an evaluation by orthopedic sur-geons. Spine 1994, 19(5):569-577.
103. Hebedoe J, Buhl M, Ramsing P: Effects of using dexamethasone and placebo in the treatment of prolapsed lumbar disc. Acta Neurol Scand 1982, 65:6-10.
104. Staal BJ, de Bie R, de Vet HCW, Hildebrandt J, Nelemans P: Injec-tion therapy for subacute and chronic low-back pain. Cochrane Data-base of Systematic Reviews 2008(3):Art. No.: CD001824.

70
105. Valat J-P, Rozenberg S: Local corticosteroid injections for low back pain and sciatica. Joint Bone Spine 2008, 75(4):403-407.
106. Manchikanti L, Singh V, Falco FJE, Cash KA, Pampati V: Evaluation of lumbar facet joint nerve blocks in managing chronic low back pain: a randomized, double-blind, controlled trial with a 2-year follow-up. Int J Med Sci 2010, 7(3):124-135.
107. Boswell MV, Colson JD, Sehgal N, Dunbar EE, Epter R: A systemat-ic review of thearpeutic facet joint interventions in chronic spinal pain. Pain Physician 2007, 10(1):229-253.
108. Deyo RA: Treatments for back pain: can we get past trivial effects? Annals of Internal Medicine 2004, 141(12):957-958.
109. van Tulder MW, Tuut M, Pennick V, Bombardier C, Assendelft WJJ: Quality of primary care guidelines for acute low back pian. Spine 2004, 29:E357-362.
110. Arnau JM, Vallano A, Lopez A, Pellisé F, Delgado MJ, Prat N: A critical review of guidelines for low back pain treatment. European Spine J 2006, 15:543-553.
111. Arnau JM, Pellisé F, Vallano A, Prat N: COST B13: Editorial com-ment: European guidelines for low back pain - A necessary step for-ward and a opportunity not to be missed European Spine J 2006, 15(Suppl 2):S131-133.
112. Hancock MJ, Herbert RD, Maher CG: A guide to interpretation of studies investigating subgroups of responders to physical therapy in-terventions. Physical Therapy 2009, 89(7):698-704.
113. Smeets RJEM, Maher CG, Nicholas MK, Refshauge KM, Herbert RD: Do psychological characteristics predict response to exercise and advice for subacute low back pain? Arthritis & Rheumatism 2009, 61(9):1202-1209.
114. Jadad A: Randomised Controlled Trials, a user's guide. London: BMJ Books; 1998.
115. Blomberg S, Svärdsudd K, Tibblin G: A controlled, multicentre trial of manual therapy in low-back pain; Initial status, sick-leave and pain score during follow-up. Scand J Prim Health Care 1992(10):170-178.
116. Torstensen TA: The physical therapy approach. In: The adult spine: Principles and practice. Edited by Frymoyer JW, Ducker TB, Hadler NM, Kostuik JP, Weinstein JN, Whitecloud 111 T, 2nd edition. Phila-delphia: Lippincott-Raven; 1997: 1797-1805.
117. Torstensen TA, Ljunggren AE, Meen HD, Odland E, Mowinkel P, af Geijerstam S: Efficiency and costs of medical exercise therapy, con-ventional physiotherapy, and self-exercise in patients with chronic low back pain. A pragmatic, randomized, single-blinded, controlled trial with 1-year follow-up. Spine 1998, 23(23):2616-2624.

71
118. Malmivaara A, Hakkinen U, Aro T, Heinrichs ML, Koskenniemi L, Kuosma E, Lappi S, Paloheimo R, Servo C, Vaaranen V et al: The treatment of acute low back pain — bed rest, exercises, or ordinary activity? N Engl J Med 1995, 332(6):351-355.
119. Lindström I, Öhlund C, Eek C, Wallin L, Peterson L-E, Fordyce WE, Nachemson AL: The effect of graded activity on patients with sub-acute low back pain: a randomized prospective clinical study with an operant-conditioning behavioral approach. Phys Ther 1992, 72(4):279-290.
120. Lindström I, Öhlund C, Eek C, Wallin L, Peterson L-E, Nachemson A: Mobility, strength, and fitness after a graded activity program for patients with subacute low back pain. A randomized prospective clini-cal study with a behavioral therapy approach. Spine 1992, 17(6):641-652.
121. Evjent O, Hamberg J: Muscle stretching in manual therapy, a clinical manual, the extremities, vol. 1. Alfta: Alfta Rehab Förlag; 1985.
122. Evjent O, Hamberg J: Muscle stretching in manual therapy, a clinical manual, the spinal column and the TM-joint, vol. 2. Alfta: Alfta Re-hab Förlag; 1985.
123. Stoddard A: Manual of osteopathic technique, third edition. London: Hutchinson; 1980.
124. Lewit K: Manipulative therapy in rehabilitation of the locomotor system, second edition. London: Butterworth Heinemann; 1991.
125. Janda V: Muskelfunktionsdiagnostik. Dresden: Steinkopff; 1976. 126. Kaltenborn FM, Evjent O: The spine; basic evaluation and mobiliza-
tion techniques. Oslo: Olaf Norlis Bokhandel; 1993. 127. Mitchel F, Moran P, Prutzzo N: An evalution and treatment manual
for osteopathic muscle energy procedures, vol. 1, First edition. Valley Park: Mitchel, Moran and Prutzzo; 1979.
128. Kubis: Iliosacralverschiebung und Muskelfunktion im Beckenbereich als diagnostikum. Manuelle Med 1969, 6:52.
129. Lind GAM: Auto-traction. Treatment of low back pain and sciatica. An electromyeographic, Radiographic and Clinical study. PhD thesis. Linköping: Sweden; 1974.
130. Natchew E: A manual on auto-traction treatment for low back pain. In.: Folksam Scientific Council, Stockholm; 1984.
131. Midttun A, Bojsen Traeden J, Bojsen-Möller F: Syndroma ligamenti sacrotuberalis - a case for manual therapy. In: Scandinavian associa-tion for the study of pain Annual meeting 5, 1983: 45-46.
132. Midttun A, Bojsen-Møller F: The sacrotuberous ligament pain syn-drome. In: Modern manual therapy. Edited by Grieve GP. Eding-burgh: Churchill, Livingstone; 1986: 815-818.

72
133. Sivik TM, Gustafsson E, Klingberg Olsson K: Differential diagnosis of low-back pain patients. A simple quantification of the pain draw-ing. Nord J Psychiatry 1992, 46(1):55-62.
134. Blomberg S, Svärdsudd K, Tibblin G: Manual therapy with steroid injections in low-back pain. Improvement of quality of life in a con-trolled trial with four months' follow-up. Scand J Prim Health Care 1993, 11(2):83-90.
135. Haywood KL, Garratt A, Fitzpatrick R: Quality of life in older people: a structured review of generic self-assessed health instruments. Quali-ty of Life Res 2005, 14(7):1651-1668.
136. Cederlund R, Iwarsson S, Lundborg G: Quality of life in Swedish workers exposed to hand-arm vibration. Occupational Therapeutic In-ternals 2007, 14(3):156-169.
137. JMP version 4. Statistics and graphics guide. In., 4 edn. Cary, NC: SAS Institute Inc.; 2000.
138. SAS language and procedures. In. Cary, NC: SAS Institute Inc.; 2000. 139. Ohnmeiss DD: Pain drawings in the evaluation of lumbar disc-related
pain. PhD thesis. Stockholm: Karolinska Institute; 2000. 140. Kind P: Measuring quality of life in evaluating clinical interventions:
an overview. Annals of Medicine 2001, 33:323-327. 141. Parker H, Wood PLR, Main CJ: The use of pain drawing as a screen-
ing measure to predict psychological distress in chronic low back pain. Spine 1995, 20(2):236-243.
142. Ohnmeiss DD, Vanharanta H, Estlander AM, Jamsen A: The relation-ship of disability (Oswestry) and pain drawings to functional testing. Eur Spine J 2000, 9(3):208-212.
143. Melzack R: Gate control theory: on the evolution of pain concepts. Pain Forum 1996, 5:128-138.
144. Melzack R, Wall PD: Pain mechanisms: a new theory. Science 1965, 150:971-979.
145. Billis EV, McCarthy CJ, Oldham JA: Subclassification of low back pain: a cross-country comparison. European Spine J 2007, 16:865-879.
146. Cherkin DC, Deyo RA, Battié M, Street J, Barlow W: A comparison of physical therapy, chiropractic manipulation, and provision of an educational booklet for the treatment of patients with low back pain. NEJM 1998, 339(15):1021-1029.
147. Pope MH, Phillips RB, Haugh LD, Hsieh CY, MacDonald L, Halde-man S: A prospective randomized three-week trial of spinal manipula-tion, transcutaneous muscle stimulation, massage and corset in the treatment of subacute low back pain. Spine 1994, 19(22):2571-2577.

73
148. Mathews W, Morkel M, Mathews J: Manipulation and traction for lumbago and sciatica: physiotherapeutic techniques used in two con-trolled trials. Physiother Practice 1988, 4:201-206.
149. Postacchini F, Facchini M, Palieri P: Efficacy of Various Forms of Conservative Treatment in Low Back Pain. A Comparative Study. Neuro-Orthopedics 1988, 6:28-35.
150. Hadler NM, Curtis P, Gillings DB, Stinnett S: A Benefit of spinal manipulation as adjunctive therapy for acute low-back pain: a strati-fied controlled trial. Spine 1987, 12(7):703-706.
151. Hsieh C-YJ, Adams A, Tobis J, Hong C-Z, Danielson C, Platt K, Hoehler F, Reinch S, Rubel A: Effectiveness of four conservative treatments for subacute low back pain. A randomized clinical trial. Spine 2002, 27(11):1142-1148.
152. Seferlis T, Németh G, Carlsson A-M, Gillström P: Conservative treatment in patients sick-listed for acute low-back pain: a prospective randomised study with 12 months' follow-up. European Spine Journal 1998, 7:461-470.
153. Delitto A, Cibulka MT, Erhard RE, Bowling RW, Tenhula J: Evi-dence for Use of an Extension-Mobilization Category in Acute Low Back Syndrome: A Prescriptive Validation Pilot Study. Physical Therapy 1993, 73(4):216-228.
154. Wreje U, Nordgren B, Åberg H: Treatment of Pelvic Joint dysfunction in primary Care - a controlled study. Scand J Prim Health Care 1992, 10:310-315.
155. MacDonald RS, Bell CMJ: An Open Controlled Assessment of Oste-opathic Manipulation in Nonspecific Low-back Pain. Spine 1990, 15(5):364-370.
156. Helliwell PS, Cunliffe G: Manipulation in low-back pain. The Physi-cian 1987(April):187-188.
157. Susser M, Susser E: Choosing a future for epidemiology: I. Eras and paradigms. American J of public health 1996, 86(5):668-673.
158. Susser M, Susser E: Choosing a future for epidemiology: II. From black box to Chinese boxes and eco-epidemiology. American J of public health 1996, 86(5):674-677.
159. Kent P, Keating JL: Classification in nonspecific low back pain: What methods do primary care clinicians currently use? Spine 2005, 30(12):1433-1440.
160. Underwood MR, Morton V, Farrin A, Team UBT: Do baseline char-acteristics predict respons to treatment for low back pain? Secondary analysis of the UK BEAM dataset. Rheumatology 2007, 46(8):1297-1302.
161. Guyatt G, Cook D, Haynes B: Evidence based medicine has come a long way. BMJ 2004, 329(7473):990-991.
74
162. Brennan GP, Fritz JM, Hunter SJ, Thackeray A, Delitto A, Erhard RE: Identifying Subgroups of Patients With Acute/Subacute “Nonspecific” Low Back Pain: Results of a Randomized Clinical Trial. Spine 2006, 31(6):623-631.
163. George SZ, Fritz JM, Bialosky JE, Donald DA: The effect of a fear-avoidance-based physical thearpy intervention for patients with acute low back pain: results of a randomized clinical trial. Spine 2003, 28(23):2551-2560.
164. Goldby LJ, Moore AP, Doust J, Trew ME: A Randomized Controlled Trial Investigating the Efficiency of Musculoskeletal Physiotherapy on Chronic Low Back Disorder. Spine 2006, 31(10):1083-1093.
165. Niemistö L, Lahtinen-Suopanki T, Rissanen P, Lindgren K-A, Sarna S, Hurri H: A Randomized Trial of Combined Manipulation, Stabiliz-ing Exercises, and Physician Consultation Compared to Physician Consultation Alone for Chronic Low Back Pain. Spine 2003, 28(19):2185-2191.
166. Hay E, Mullis R, Lewis M, Vohora K, Main CJ, Watson P, Dziedzic K, Sim J, Minns Lowe C, Croft P: Comparison of physical treatments versus a brief pain-management programme for back pain in primary care: a randomised clinical trial in physiotherapy practice. Lancet 2005, 365(9476):2024-2030.
167. Wand BM, Bird C, McAuley JH, MacDowell M, De Souza LH: Early intervention for the management of acute low back pain: a single-blind randomized controlled trial of biopsychosocial education, manu-al therapy, and exercise. Spine 2004, 29(21):2350-2356.
168. Hurley DA, McDonough SM, Dempster M, Moore AP, Baxter GD: A Randomized Clinical Trial of Manipulative Therapy and Interferential Therapy for Acute Low Back Pain. Spine 2004, 29(20):2207-2216.
169. Apeldoorn AT, Ostelo RW, van Helvoirt H, Fritz JM, de Vet HC, van Tulder MW: The cost-effectiveness of a treatment-based classification system for low back pain: design of a randomised controlled trial and economic evaluation. BMC Musculosceletal Disorders 2010, 11:58.
170. Hicks GE, Fritz JM, Delitto A, McGill SM: Preliminary development of a clinical prediction rule for determining which patients with low back pain will respond to a stabilization exercise program. Archives of Physical Medicine and Rehabilitation 2005, 86(9):1753–1762.
171. Muchinsky P: Employee Absenteeism: A Review of the Literature. J Vocational Behavior 1977, 10:316-340.
172. Hensing G, Alexanderson K, Allebeck P, Bjurulf P: How to measure sickness absence? Literature review and suggestion of five basic measures. Scan J Soc Med 1998, 26(2):133-144.

75
173. Dasinger LK, Krause N, Deegan LJ, Brand RJ, Rudolph L: Duration of work disability after low back injury: a comparison of administra-tive and self-reported outcomes. Am J Ind Med 1999, 35(6):619-631.
174. Krause N, Dasinger LK, Deegan LJ, Brand RJ, Rudolph L: Alterna-tive approaches for measuring duration of work disability after low back injury based on administrative workers' compensation data. Am J Ind Med 1999, 35(6):604-618.
175. Svensson HO, Andersson GBJ: Low back pain in forty to forty-seven year old men. 1. Frequency of occurrence and impact on medical ser-vices. Scand J Rehabil Med 1982, 14:47-53.
176. Bogefeldt JP, Grunnesjö MIJ, Svärdsudd KF, Blomberg SEI: Sick leave reductions from a comprehensive manual therapy program for low back pain. The Gotland low back pain study. Clin Rehab 2008; 22:529-541

76
Appendix

Clin
ical
exa
min
atio
n fin
ding
s and
Clin
ical
indi
catio
n sc
ore.
Tes
t res
ult:
empt
y bo
xes=
nega
tive,
1=p
ossi
bly
posi
tive,
2=d
efin
itely
pos
itive
.
Rad
iatio
n rig
ht le
g R
adia
tion
left
leg
Pate
llar r
efle
x A
chill
es re
flex
Gre
ater
toe
refle
x St
raig
ht le
g ra
isin
g te
st
Clin
ical
in
dica
tion
scor
e
exte
n-si
on
flexi
on
exte
n-si
on
flexi
on
right
le
ft rig
ht
left
right
le
ft rig
ht
left
0
0
1
0
1
0
1 1
0
1
0
1 1
0
1
1 1
1
0
2 2
0
1 1
1 0
1
0 1
0
1
1 1
0
1
0
1
1
0
1
1
0
1 1
1
0
1
1 1
1 1
1
0
1 1
1 1
0 1
1
1
0
1
1 1
1
0
1
0
1
1
0
1
1
0
1
1

R
adia
tion
right
leg
Rad
iatio
n le
ft le
g Pa
tella
r ref
lex
Ach
illes
refle
x G
reat
er to
e re
flex
Stra
ight
leg
rais
ing
test
C
linic
al
indi
catio
n sc
ore
exte
n-si
on
flexi
on
exte
n-si
on
flexi
on
right
le
ft rig
ht
left
right
le
ft rig
ht
left
0
1 1
0
1 1
1
0
1
1
0
1
1
1
0 1
1 1
1
0
1 1
1 1
1
0 1
1 1
1 1
1
1
1
1 1
1
1
1 1
1
1
1 1
1
1
1 1
1
1
1
1
2
1
1
1
1
1
1 1
1
1 1
1
1
1 1
1
1 1
1
1
1 1
1
1
1 1
1 1
1
2
1
1 1
1
2
2
1
1 1
1 1
1
1
1
1 1
1 1
1
1 1
1 1
1 1
1 1
1
1 1
2
2
2 2
2
2
1 1
1
1
2
1
1
2
1
1

R
adia
tion
right
leg
Rad
iatio
n le
ft le
g Pa
tella
r ref
lex
Ach
illes
refle
x G
reat
er to
e re
flex
Stra
ight
leg
rais
ing
test
C
linic
al
indi
catio
n sc
ore
exte
n-si
on
flexi
on
exte
n-si
on
flexi
on
right
le
ft rig
ht
left
right
le
ft rig
ht
left
2 1
1
1
1 2
1
2 2
2 1
1
1
1
2
1 1
1
2 2
1
1
3
2
1 3
2 2
2
1
3
1
2
1
1 3
1
2
1
1 1
3
1
1
2
1 3
1 1
1 1
2 2
2 2
4
1
2
1 4
1
2
1
1
4
1
1
2
1
1 4
1
2
1
4 1
1
2
1
4
1 1
2
1
1
