to three special people: my nephew, commander mark a....
TRANSCRIPT


To three special people: my nephew, Commander Mark A. Escoe, Supply Corps, United States Navy; my niece, Barbie Davis; and to the memory of their Dad and my brother, Creighton L. Escoe, who died tragically in a f re on March 7, 2008.
DED-H8766.indd vDED-H8766.indd v 6/18/2008 7:20:03 PM6/18/2008 7:20:03 PM

ix
About the Author
A. K eith Escoe , P.E., has w orked in the chemical process, oil ref ning, and pipeline industries for thirty-f ve years all o ver the w orld. His e xperience includes South America, North America, and the Middle East. He is retired from Saudi Aramco in the Kingdom of Saudi Arabia where he w as an engi-neering specialist and returned to the United States as an international consult-ant. He is currently a Senior Principal Vessel Engineer with the Foster Wheeler USA Corporation in Houston, Texas. The author of many technical papers and books, Mr. Escoe has a B.S. in Mechanical engineering from the Uni versity of Texas at Arlington, an MBA from the University of Arkansas, and is a licensed professional engineer in T exas and a member of ASME. He participated with the Pressure Research Council for many years.
BIO.indd ixBIO.indd ix 6/18/2008 7:20:25 PM6/18/2008 7:20:25 PM

xi
Preface
This book is meant to be a companion for those w orking in the f eld and facing various tasks involving pressure v essels and stacks. A typical e xample of these tasks is during a plant expansion project when equipment is modif ed for various reasons. One solution might be to increase the height of a particular process column to accommodate additional trays and /or packing to enhance process productivity. Another e xample is to retrof t existing pressure v essels or stacks to either enhance process capability or replace damaged equipment. Once these items are modif ed or constructed, it is up to the f eld personnel or hired contractors to de vise mechanisms to lift them into place. These lifting de vices (e.g., lifting and tailing lugs) become necessary to design and f abricate in order to install the desired pressure v essel or stack. Other cases may in volve lifting devices which may ha ve been remo ved and the equipment that must be mo ved for v arious reasons. There is no end to using lifting de vices in an operations facility. This book does not get in volved in the details of rigging, b ut does expand on the subject of various lift devices and useful rigging techniques.
Other issues face f eld personnel. Some may call these issues problems , but after reading this book it is hoped that these problems will be called opportu-nities . It has happened on man y unfortunate occasions where process columns and stacks have been erected in the f eld and the structures vibrate. This involves a dynamic response induced from wind v ortex shedding that results in disrup-tion of the contained f uids and can be signif cant enough to be of concern for the safety of all present at the f acility. Most people that observ e such a dynamic response fear that the anchor bolts attaching the stack or column will f ail due to static or fatigue loading on the anchor bolts. In this book, we discuss methods to screen and prevent such a reaction and practical methods to predict and correct the unstable motion should it occur.
Often defect mechanisms de velop in portions of the process columns. T o assess the stress, wind loads must be considered in the stress state at the loca-tion of the defect. W ind loads also become important when performing local-ized stress relieving and when a section of the process column is heated to stress relieving temperatures. When a section of a process column is to be stress relieved and heated up, wind striking the to wer results in forces and moments across the heated section. This condition must be considered before repairs begin.
There is also a discussion about the application of guy cable supports for stacks in regards to dynamic response and wind loads. Of particular interest is a discussion about f are header stacks and ho w to design guy cables for these tall and slender structures.
PRE-H8766.indd xiPRE-H8766.indd xi 6/18/2008 7:19:38 PM6/18/2008 7:19:38 PM

Prefacexii
Defect mechanisms also affect the internals of process columns. This book is a handy guide to the assessment of v essel internals and practical solutions. Tray support rings and catalyst bed support beams are some examples of vessel internals discussed.
Rather than present tables for con version between U.S. Customary units and metric SI units, we be gin with a section about unit systems. Before these topics are discussed, Chapter 1 discusses tw o unit systems: AES (American Engineering Units), or what the ASME calls the U.S. Customary Units, and the metric SI system of units. Because the United States is some what alone in the world using the AES, more foreign work and more foreign engineers are entering our country to practice engineering. Man y foreign clients insist that the w ork be done using the metric SI system of units. All the calculations and the results are, by contract, to be in the metric SI system. Therefore, it is w orthwhile spending some time on the tw o systems, because man y of the e xamples are in one or the other system of units. This chapter will allo w discussions and e xamples to be entirely in either system of units without con verting from one to the other . Why not just pick up a basic te xt book on physics and read about metric SI? This is an option, but here the perspective is different. Our focus is on the units that one faces in f eld operations and ho w to clear up confusion dealing with fundamen-tals of mass and weight and also the v arious units of measurement encountered in the f eld. There is a detailed discussion about the two systems of units and how the various units are derived and used. This discussion is most important to read when it is necessary to w ork in a system of units one is not f amiliar with. It will also be a useful guide to refresh those who need to review the systems of units.
The examples in this book are from actual f eld applications. The y come from various parts of the w orld and are written to enhance f eld operations. In many parts of the world, often in remote locations, these methods were applied to repair pressure vessels and stacks. These problems will still continue to hap-pen, so there is a need to kno w how to address them. This book is to present assessments and techniques and methods for the repair of pressure v essels and stacks for f eld applications. Also the book is to be a repair manual for easy use for mechanical engineers, civil-structural engineers, plant operators, main-tenance engineers, plant engineers and inspectors, materials specialists, con-sultants, and academicians.
There are also handy pressure v essel formulas—calculation of head for -mulas with partial loaded volumes and head weights—included, making this a handy f eld guide.
The contents of this book do not necessarily ref ect the practices of my cur -rent emplo yer, F oster Wheeler USA Corporation. I wish to thank J. W esley Mueller, P.E., for his helpful comments pertaining to Chapters 6 and 7. I also wish to thank my wife, Emma, for her unrelenting patience throughout the project.
A. Keith Escoe Houston, Texas
April 4, 2008
PRE-H8766.indd xiiPRE-H8766.indd xii 6/18/2008 7:19:38 PM6/18/2008 7:19:38 PM

1
Chapter 1
Systems of Units
This chapter presents two systems of units so that you can follow the examples ahead. These two systems of units are the metric SI and what is termed by the American Society of Mechanical Engineers (ASME) as the U.S. Customary system of units , namely in the ASME Section II Part D [1] . This system is also termed the American Engineering System (AES) by the U.S. government. I men-tioned the latter term in my book Piping and Pipelines Assessment Guide [2] , in how to use the two systems of units. In this book, we will discuss brief y the other variants of the metric SI system, b ut it is the prevailing metric system of units. Likewise, we will concentrate on the U.S. Customary system v ersus the British Imperial system. Even though the latter two are similar, there are some differences.
This book is about engineering and discusses ho w to engineer with each system. It is not of interest to get into a historical discussion about ho w the system of units e volved, as there are man y sources a vailable if you ha ve this interest. There are strong emotions associated with using each system, b ut this book is not interested in the polemics of using one system v ersus the other . The other reason for this discussion is that I ha ve worked extensively in each system and ha ve noticed the le vel of apprehension and intimidation among those using U.S. Customary units toward the metric SI system. This apprehen-sion is totally unnecessary and is without w arrant, as the metric SI is used in almost every country of the world except the United States, where it has made headway in medicine and the pure sciences. After reading this chapter , you will not need to con vert from one system to the other in the discussions that follow; this text is for users of each system of units.
If you have used only the U.S. Customary system of units, the younger you are, the more likely you will be in the future to encounter the metric SI in prac-tice. If you w ork outside the United States, then chances are certain that you will have to w ork in this system of units in one form or another . With more and more foreign projects and foreign engineers coming to the United States, the more lik ely the e vent of your using metric SI. Instead of resisting metric SI, consider it as a new friend, which it has been to me. In the metric SI, there are no fractions to w orry about, like adding 3/32 to 11/64! The thought of not having to work with fractions is addictive in itself.
The metric SI is an absolute system of units, meaning that it does not depend on where the measure is made. The measurements can be made at an y
CH001-H8766.indd 1CH001-H8766.indd 1 6/12/2008 6:49:51 PM6/12/2008 6:49:51 PM

Pressure Vessel and Stacks Field Repair Manual2
location. For example, the meter has the same (or absolute) length re gardless of where the measurement is tak en—here on earth or else where. The unit of force is a deri ved unit. The metric SI system has been called the meter, kilo-gram, and second system, or MKS . These three units are primary units. In this system the Newton is the amount of force needed to gi ve 1 Kg mass an accel-eration of 1 m/sec 2 . Thus, Newton’s second law is the crux of the system.
To derive force from mass , you have to use Newton’s second law:
F M*A, Newtons� (1.1)
The unit of mass is kilogram (Kg) and acceleration is m/sec 2 . To perform
the conversion, you use
F M(Kg)�
ggc
⎛
⎝⎜⎜⎜⎜
⎞
⎠⎟⎟⎟⎟⎟ (1.2)
In the metric SI system, you use
g gc� �9 807 1 0
2 2.
sec.
secm and Kg m
N−
−
Thus, the force required giving 1 Kg of mass an acceleration of 1 m/sec 2 is
F Kg)
m
Kg mN
=−
−
⎛
⎝
⎜⎜⎜⎜⎜⎜⎜⎜⎜
⎞
⎠
⎟⎟⎟⎟⎟⎟⎟⎟⎟⎟
=( ..
sec
sec
.1 09 807
19 80
2
2
77 N (1.3)
Yes, that’s right: It takes 9.807 N (Newtons) to accelerate 1 Kg (kilogram) of mass 1 m/sec 2 —almost 10 times. This is a number to remember . See the note later in this section.
Regarding the U.S. Customary system, the same discussion is presented in my book Piping and Pipelines Assessment Guide , pp. 498–500 [2] , as follows:
g gc� �32 174
32 1742 2
.sec
.sec
ft and ft lb
lbm
f
−−
From Newton’s second law, we have the following:
ForceMass (lb ) Acceleration ft
m�
�
�
* .sec
g
gc
32 174
3
2
⎛⎝⎜⎜⎜
⎞⎠⎟⎟⎟⎟
22 1742
.sec
lb ftlb
lbm
f
f�
�
�⎛
⎝⎜⎜⎜⎜
⎞
⎠⎟⎟⎟⎟
(1.4)
CH001-H8766.indd 2CH001-H8766.indd 2 6/12/2008 6:49:51 PM6/12/2008 6:49:51 PM

Systems of Units 3
Hence,
MassForce (lb ) lb ft
lb
Accele
fm
f�
��* .
secgc
32 1742−
⎛
⎝⎜⎜⎜⎜
⎞
⎠⎟⎟⎟⎟
rration ftlbm
g �
�32 174
2.sec
⎛⎝⎜⎜⎜
⎞⎠⎟⎟⎟⎟
(1.5)
As you can see, in the U.S. Customary system, mass is a deri ved unit, with the primary units being force , pound , and second . Some authors refer to it as the FPS system. This is a gra vitational system, where force is a primary unit. Since most experiments involve a direct measurement of force, engineers pre-fer a gravitational system of units as opposed to an absolute system. Often the units g and gc are rounded to 32.2 ft /sec 2 .
As you can see in equations 1.4 and 1.5, the terms lb f and lb m are used inter-changeably. In the U.S. Customary system of units, lb f and lb m have the same magnitude (value). Pound (mass), lb m , and pound (force), lb f , have identical numerical values. Thus, 1 pound mass is equal to 1 pound force; hence, it is not uncommon to use the term pound , or lb , interchangeably. This usage has unfortunately caused confusion. F orce is not mass, and this is hard to under -stand using the U.S. Customary system of units, where the same term is used for both mass and force. In locations without gra vity, such as outer space, weight is meaningless. The off cial unit of mass in the U.S. Customary system of units is the slug. A pound is the force required to accelerate 1 slug of mass at 1 ft/sec 2 . Since the acceleration of gra vity in the U.S. Customary system is 32.2 ft/sec 2 , it follo ws that the weight of one slug is 32.2 pounds, commonly referred to as 32.3 lb m . The comparison of the slug and the pound mak es it clear why the size of the pound is more practical for commerce. W ith the cur-rent scientif c work, it is undesirable to ha ve the weight of an object as a stan-dard because the value of g does vary at different locations on Earth. It is much better to have a standard in terms of mass. The standard kilogram is the mass reference for scientif c work. This book is for industrial practice by practic-ing engineers, inspectors, maintenance engineers, plant and pipeline person-nel, rigging engineers, and others that w ork in industry. It is not intended for scientif c work. The v alue of the gra vitational constant does not v ary enough to affect most engineering applications. The slug is rarely used outside of te xt-books, which has contrib uted to the confusion between the pound mass and the pound force. When expressing mass in pounds, it is necessary to recognize that we are actually e xpressing “ weight ,” which is a measure of the gra vita-tional force on a body. When used in this manner , the weight is that of a mass when it is subjected to an acceleration of 1 g. In academia, where the study of dynamics involves forces, masses, and accelerations, it is important that mass be e xpressed in slugs, that is, m � W/g, where g is approximately equal to 32.174 ft/sec 2 . These points are ar guments for the use of the metric SI system
CH001-H8766.indd 3CH001-H8766.indd 3 6/12/2008 6:49:52 PM6/12/2008 6:49:52 PM

Pressure Vessel and Stacks Field Repair Manual4
of units. P articularly in the study of dynamics, the SI system is much easier . The slug is def ned as
1 32 174
2Slug lb
lbftm
f� ��
.sec (1.6)
Hence,
gc � �
�
�1
32 1742
.sec
lb ftlb
m
f
(1.7)
Like text books in academia, the slug is rarely used in industrial circles, b ut where it is used remember that 1 slug � 32.2 lb m . This will come up brief y in Chapter 3 where the ASME STS-1 uses the slug as mass. Ho wever, ASME is in the process of making the SI system the preferred system of units. In loca-tions without gravity, such as outer space, weight is meaningless. If two bodies were to collide in outer space, the results w ould be due to their dif ferences in mass and velocity. The body with the greater mass would win out.
Note: Because lb f and lb m have the same unit and both are often referred to as pounds , it is a common mistak e for users of the U.S. Customary system to for get to con vert kilogram mass to Ne wton’s force, or vice v ersa. When using the metric SI, don’ t forget the conversion factor of 9.807 derived earlier. Repeating again, kilograms are not Newtons. With the metric SI, this phenom-enon does not exist, as 1 kilogram is 9.807 Ne wtons, so mass and weight can-not be confused.
GETTING FAMILIAR WITH METRIC SI UNITS
Civil-structural engineers prefer to w ork in units of force in designing foun-dations. W ith the U.S. Customary system, this is ob vious: A pound is a pound. In the metric SI system, you must mak e a conversion. In the metric SI, KiloNewtons (KN) are used for foundations. Often I ha ve heard the question “ How do I convert kilograms to KiloNewtons? ” The answer is simple. Suppose you have a pressure vessel that is a large reactor that is to go into a new ref nery. This reactor weighs 1,000,000 kilograms. This is converted to force as follows:
F 1,000,000 Kg
m
Kg mN
9,807,000 N��
�
�*.
sec
sec
9 807 2
2
⎛⎝⎜⎜⎜
⎞⎠⎟⎟⎟⎟
(1.8)
This means 1 million kilograms almost equals 10 million Ne wtons. So the civil-structural engineers would design for 9807 KiloNewtons (KN).
CH001-H8766.indd 4CH001-H8766.indd 4 6/12/2008 6:49:52 PM6/12/2008 6:49:52 PM

Systems of Units 5
In Europe it is quite common to see lifting de vices, such as small cranes in automobile shops, rated in KN. I sa w a lifting crane in an automobile shop in Germany marked as 20 KN. This marking means that the crane could safely lift
20 20 000KN N� ,
Using Eq. 1.3, we have
Mass (Kg) F N
Kg mN sec
m� �
�
�* , *.
sec
ggc⎛
⎝⎜⎜⎜⎜
⎞
⎠⎟⎟⎟⎟
⎛
⎝
20 0001
9 807
2
2
⎜⎜⎜⎜⎜⎜⎜⎜⎜⎜
⎞
⎠
⎟⎟⎟⎟⎟⎟⎟⎟⎟⎟
� 2039 4. Kg
So the crane is rated at roughly 2039 Kg. It would not be wise to ask ho w many pounds this is, as often man y in the European Union are as emotional about the metric SI as some Americans are about the U.S. Customary system. In secret, you can calculate
2039.4 Kg � 4496.1 lb m
Most people using the U.S. Customary system would then say the measure-ment is “ 4496.1 pounds. ”
If you are be ginning to use the metric SI for the f rst time, it is quick er to learn the system by carrying all calculations solely in metric. This will enable you to become f amiliar with the system more quickly and obtain a “ feel ” for the answer.
OTHER IMPORTANT METRIC SI UNITS USED IN MECHANICS
The basic units—area, section modulus, and moment of inertia—are mm 2 , mm 3 , and mm 4 , respectively.
Density
The density of steel is 0.283 lbm/in 3 . In the SI metric system, this measurement converts to approximately
ρ � �0 283 7840
3 3.
lbin
Kgm
m
Bending Moments and Torque
Because moment of force (bending moment) and torque are equal to a force times a distance (moment arm or le ver arm), their SI unit is N*m. The Joule (J � N * m), which is a special name for the SI unit of ener gy and work, should
CH001-H8766.indd 5CH001-H8766.indd 5 6/12/2008 6:49:52 PM6/12/2008 6:49:52 PM

Pressure Vessel and Stacks Field Repair Manual6
not be used as a name for the unit of moment of force or of torque. T ypically, the moment of torque is written as N m, with a space between the N and m or as N*m.
The Joule is equal to a 1 N*m, but is reserved for a unit of ener gy and can have more than one application, as discussed later . When we get into thermal stresses and heat transfer , it is confusing to use Joule as a bending moment of torque and as a thermal unit. W e will spend more time later on the proper use of metric units.
UNITS FOR STRESS AND PRESSURE
The term for pressure and stress is 1 Newton per square meter , which is named in honor of the f amous mathematician, physicist, and philosopher Blaise Pascal. Since the area of a meter is rather lar ge, 1,000 pascals is a kilopascal (KPa), and 1 million pascals is 1 megapascal (MPa). Simply written, we have
1 0 1 0 1
10001 0
2
. . .Megapascal 1,000,000m
mmm2
� �( )( )⎛
⎝⎜⎜⎜⎜
⎞
⎠⎟⎟⎟⎟
N NNmm2
A megapascal, or MP a, is most commonly used for stress. It can also be used for pressure, but the numbers may remain small for small v alues of pres-sure. Typically, the kilopascal is used for pressure. The bar has been used for pressure often in the past, b ut the bar is not an SI unit. Although it may be accepted in the SI, it is discouraged. Now
1 0 01 0 001kilopascal bar megapascal� �. .
In U.S. Customary units, these metric units are
1 megapascal � 145 psi � 10 bars 1 bar � 14.5 psi 1 kilopascal � 0.145 psi
A WARNING ABOUT COMBINING METRIC SI UNITS
When you are using the metric SI system of units, it is wise to remember that many units are named in terms of a magnitude of 10, e.g., kilo or mega as a pref x. When you are performing computations, it is advised to reduce these terms to their most basic set of units. F or example, if you have a cylinder that is 609.6 mm (24 � ) ID that contains 1000 KPa of pressure that is 24 mm thick, the hoop stress is
σ �
PDt2
CH001-H8766.indd 6CH001-H8766.indd 6 6/12/2008 6:49:52 PM6/12/2008 6:49:52 PM

Systems of Units 7
Entering the equation as
σ �
( KPa ( mm mm
1575 609 42 24
) . )( )
can lead to mistakes, since the stress term is in MPa and the pressure is in KPa. The best way to avoid mistakes is to write the equation as follows:
1575 0 001 1 575 1 575KPa ( MPa
mm2. ) . .� �
N
If the pressure (written in KP a) is not con verted correctly to me gapascals (MPa), then big errors can occur . I have seen this problem occur with v eteran users of the metric SI system. The error is e ven more lik ely with those not accustomed to using the metric SI system.
UNITS FOR ENERGY
The unit of heat is the Joule, mentioned pre viously. The Joule w as named for James Prescott Joule, the famous English physicist. His development of Joule’s Law, which related the amount of heat produced in a wire as proportional to the resistance of the wire and the square of the current, led to the thermal unit being named for him. The Joule is also used in Charp y impact tests, where an impact hammer is dropped from a specif ed height to impact a sample. The force is in Ne wtons, which is at a specif ed height in meters (or millimeters), and the ener gy that impacts the metal specimen is N*m or Joules. Refer to Figure 1.1 , which shows a Charpy impact test machine.
L1
L2
G
M
S
FIGURE 1.1 Schematic diagram sho wing impact hammer of M dropping from height L 1 , impacting sample S, and rising to a height L 2 . The energy absorbed by the sample, related to the difference of heights L 1 � L 2 , is recorded on gauge G.
CH001-H8766.indd 7CH001-H8766.indd 7 6/12/2008 6:49:52 PM6/12/2008 6:49:52 PM

Pressure Vessel and Stacks Field Repair Manual8
If the metal specimen does not break after impact, then it absorbed the energy of impact, which def nes its toughness. W e will discuss toughness later . The comparable impact ener gy used in the U.S. Customary system is the ft-lb f . The unit ft-lb f can be used as an energy unit or as a bending moment of torque. The thermal unit in the U.S. Customary system is the British Thermal Unit, or BTU. For reference, 1 BTU approximately equals 1055 Joules, or 1.055 kJ (kilojoules).
The amount of thermal energy transferred per unit of time, power, is BTU/hr. In the SI metric, the comparable unit is Watt (W). Thus,
1 3 4128 1 0 293Watt BTU
hr or BTU
hrW� �. .
The heat transfer con vection coeff cient in the U.S. system is BTU/
(hr � ft 2 � ° F). In the SI metric, the coeff cient is Watts/(m 2 � ° C), or
1 0 17612Watt
m CBTU
hr ft F2 2��
� �° °.
or,
1 5 68
2BTU
hr ft FWatt
m C2� ��
�° °.
Thermal Conductivity Units
The unit for thermal conducti vity in the U.S. Customary system is BTU/(hr � ft � ° F). Thus, in the SI metric,
1 0 57782Watt
m CBTU
hr ft F��
� �° °.
or,
1 1 731BTU
hr ft FWatt
m C� ��
�° °.
Coeffi cient of Thermal Expansion
The U.S. Customary system unit for the coeff cient of thermal e xpansion is microinch per inch per de gree Fahrenheit. To convert to metric SI, you mul-tiply the U.S. Customary system unit by 1.8. As an e xample, if the thermal coeff cient of expansion is
6 25 10 1 125 106 6. .� � ��( )
−( )
−−in
in Fm
m C° ° A handy website for conversions is www.efunda.com .
CH001-H8766.indd 8CH001-H8766.indd 8 6/12/2008 6:49:53 PM6/12/2008 6:49:53 PM

Systems of Units 9
THE UNIT OF TOUGHNESS
The unit of toughness is a v ery important parameter used in fracture mechanics. Toughness, K, is the property of a material to absorb energy. In the U.S. Customary system, this unit is expressed as ksi in . When using the metric SI system, many people use MPa m , mainly because it is closer in value to the U.S. Customary unit. The m denotes meters. The critical v alue of the mode stress intensity , K I , at which fracture occurs is a function of the maximum uniform membrane stress. In the SI system, stress is usually denoted as MPa (N/mm 2 ). Since the stress unit MPa is 1.0 N/mm 2 , the unit for toughness becomes
lbin
inlbin
N inmm
f f2
f2
24 448
1 25 4�
..lb
⎛
⎝⎜⎜⎜⎜
⎞
⎠⎟⎟⎟⎟⎛
⎝⎜⎜⎜⎜
⎞
⎠⎟⎟⎟⎟
iin mmin
25 41
0 5.
.⎛
⎝⎜⎜⎜⎜
⎞
⎠⎟⎟⎟⎟
⎡
⎣⎢⎢⎢
⎤
⎦⎥⎥⎥
Thus,
1 0 0 0347
2. .
lbin
in N mmmm
f2
�
Since
1 1MPa N
mm then
2� ,
1 0 28 78. .MPa mm psi in�
or,
1 0 0 02878. .MPa mm ksi in�
If you use meters instead of millimeters, the preceding becomes
1 0 0 03162. .MPa
mm m1000 mm
MPa m( )
( )�
Thus,
1 0 91MPa m ksi in� .
Since these units are fairly close, many people prefer to use MPa m . The same ar gument can be used for using centimeters v ersus millimeters—the
CH001-H8766.indd 9CH001-H8766.indd 9 6/12/2008 6:49:53 PM6/12/2008 6:49:53 PM

Pressure Vessel and Stacks Field Repair Manual10
centimeter is closer to 1 inch than the millimeter; ho wever, all dimensions are given in millimeters in countries that use the metric SI. Thus, you can use the unit MPa mm or MPa m , although the former is more consistent with the dimensions, which are in millimeters. Either unit is acceptable, as long as you keep the units consistent.
REFERENCES
1. ASME Section II Part D, Properties Materials, American Society of Mechanical Engineers, New York, NY, 2007.
2. Escoe, A. Keith, Piping and Pipelines Assessment Guide, Gulf Professional Publishing (Elsevier) , March 2006.
CH001-H8766.indd 10CH001-H8766.indd 10 6/12/2008 6:49:54 PM6/12/2008 6:49:54 PM

11
Chapter 2
Handy Pressure Vessel Formulas
This chapter contains handy formulas for pressure v essels. Some of the for -mulas are from ASME, Section VIII, Di vision 1 [1] , and others are associated formulations to calculate weights and partial f uid volumes.
In f eld applications, it is assumed that the equipment has already been fab-ricated and been shop-tested for the maximum allo wable pressure (MAP). The MAP is def ned as the maximum allo wable pressure of the v essel in the ne w and cold condition. It is more often determined in the shop before deli very. After the v essel is deli vered, any test performed after operation be gins is the maximum allowable working pressure (MAWP). The MAWP can also be used for new construction. The maximum allo wable working pressure is def ned as the maximum gauge pressure permissible at the top of the completed v essel in its operating condition for a designated temperature. Thus, in the f eld, you are likely to hear the term MAWP much more than MAP .
The minimum required wall thickness for a component can be tak en as the thickness in the ne w condition minus the original specif ed corrosion allo w-ance. The minimum required w all thickness for pressure v essel components can be computed if the component geometry, design pressure (including liquid head) and temperature, specif cations for the material of construction, allo w-able stress, and thicknesses required for supplemental loads are kno wn. The values for thickness calculations must include future corrosion allowance—the amount of corrosion e xpected after se veral f eld inspections are performed. Refer to the API 579, “ Fitness-for-Service ” [2] , for additional discussion.
CYLINDRICAL SHELLS
Three formulas that are always helpful in mechanics problems are the properties of area, section modulus, and moment of inertia for the cross-section of a circular cylinder (see Figure 2.1). These formulas are as follows, with the approximate formulations on the left and the exact expressions on the right side:
I R t Exact I D D� � �ππ3 4 464
; ( )o i (2.1)
CH002-H8766.indd 11CH002-H8766.indd 11 6/12/2008 7:53:18 PM6/12/2008 7:53:18 PM

Pressure Vessel and Stacks Field Repair Manual12
Z R t Exact ZD D
D DI� � �
��π
π24 4
322; o i
o o
⎛
⎝⎜⎜⎜⎜
⎞
⎠⎟⎟⎟⎟⎟
⎛
⎝⎜⎜⎜⎜
⎞
⎠⎟⎟⎟⎟⎟
(2.2)
A Rt Exact A D D� � � �ππ;4
2 2o i( ) (2.3)
where
A � cross-sectional area of cylindrical shell, mm 2 (in 2 ) D o � outside diameter of cylindrical shell, mm (in) D i � inside diameter of cylindrical shell, mm (in) I � moment of inertial of cylindrical shell cross-section, mm 4 (in 4 ) R � mean radius of cylindrical shell in approximate formulation, mm (in) t � thickness of cylindrical shell in approximate formulation, mm (in) Z � section modulus of cylindrical shell cross-section, mm3 (in3)
In the era of high-speed computers, there is no reason for the e xact expres-sions not to be used.
Circumferential Stress in a Cylindrical Shell (Longitudinal Joints)
The equations for a right circular c ylinder for the circumferential stress acting along the longitudinal joints follow (see Figure 2.2).
L
C Rc
FIGURE 2.2 Right circular cylinder showing circumferential and longitudinal axes.
Ri
Di
t
FIGURE 2.1 Right circular cylinder.
CH002-H8766.indd 12CH002-H8766.indd 12 6/12/2008 7:53:18 PM6/12/2008 7:53:18 PM

Handy Pressure Vessel Formulas 13
tPR
S E PrC C
a�
�0 6. (2.4)
MAWPS Et
R tC a c
C C�
� 0 6. (2.5)
σmC C
C
PE
Rt
� � 0 6.⎛
⎝⎜⎜⎜⎜
⎞
⎠⎟⎟⎟⎟⎟
(2.6)
where
E � weld joint eff ciency from original construction code; if unknown, use 0.7 MAWP � maximum allowable working pressure, MPa (psi) P � internal design pressure, MPa (psi) R C � R � LOSS � FCA R � Inside radius, mm (in) LOSS � wall loss in the shell prior to the assessment equal to the nominal (or furnished thickness if available) minus the measured minimum thickness at the time of the inspection, mm (in) FCA � Future corrosion allowance—the amount of wall loss expected over the specif ed time of the assessment predicting the remaining life based on inspec-tion data or estimates, mm (in) S a � allowable tensile stress of the shell material e valuated at the design tem-perature per the applicable construction code, MPa (psi) t C � t – LOSS – FCA , mm (in) t � nominal or furnished thickness of the shell, or cylinder thickness at a coni-cal transition for a junction reinforcement calculation, mm (in) t r � required minimum wall thickness σm � nominal membrane stress
Longitudinal Stress (Circumferential Joints)
The equations for a right circular c ylinder for the longitudinal stress acting on the circumferential joints follow.
tPR
S E Ptr
L C
asl�
��
2 0 4. (2.7)
MAWPS E t t
R t tL a sl
C C sl�
�
� �
20 4
( )( ).
(2.8)
σmL C
C sl
PE
Rt t
��
�2
0 4.⎛
⎝⎜⎜⎜⎜
⎞
⎠⎟⎟⎟⎟⎟
(2.9)
CH002-H8766.indd 13CH002-H8766.indd 13 6/12/2008 7:53:19 PM6/12/2008 7:53:19 PM

Pressure Vessel and Stacks Field Repair Manual14
where t sl � thickness required by supplemental loads, e.g., wind or seismic loads, mm (in).
Final or Resulting Values
t t tr rC
rL� max ,( ) (2.10)
MAWP MAMP MAWPC L� min ( , ) (2.11)
σ σ σmax max ( )� mC
mL, (2.12)
SPHERICAL SHELL OR HEMISPHERICAL HEAD
The equations for a spherical shell or hemispherical head follow (see Figure 2.3). The minimum thickness, MA WP, and equations for the membrane stress
are given in the ASME, Section VIII, Di vision 1, Boiler and Pressure V essel Code, paragraph UG-27 [1] , as follows:
tPR
S E PC
amin �
�2 0 2. (2.13)
MAWPS Et
R ta C
C C�
�
20 2.
(2.14)
σmC
C
PE
Rt
� �2
0 2.⎛
⎝⎜⎜⎜⎜
⎞
⎠⎟⎟⎟⎟⎟
(2.15)
Ri
t
FIGURE 2.3 Hemispherical head or sphere .
ELLIPTICAL HEAD
The equations for an elliptical head follow (see Figure 2.4). The minimum thickness, MA WP, and membrane stress equations are as
follows per the ASME, Section VIII, Division 1, Appendix 1 [1] code:
tPD K
S E PC
amin �
�2 0 2. (2.16)
CH002-H8766.indd 14CH002-H8766.indd 14 6/12/2008 7:53:19 PM6/12/2008 7:53:19 PM

Handy Pressure Vessel Formulas 15
MAWPS Et
KD ta C
C C�
�
20 2.
(2.17)
σmC
P D Kt
� �2E
C 0 2.⎛
⎝⎜⎜⎜⎜
⎞
⎠⎟⎟⎟⎟⎟
(2.18)
where
D RC c� 2 (2.19)
K R�16
2 0 2. +( )ell (2.20)
Di
t
FIGURE 2.4 Ellipsoidal head .
Di
L
r
t
FIGURE 2.5 Torispherical head ( Note: Cr � L below) .
R ell � Ratio of the major -to-minor axis of an elliptical head (most common is R ell � 2 for a 2:1 ellipsoidal head)
Note: To compute the minimum thickness, MA WP, and membrane stress for the spherical portion of an ellipsoidal head, def ned as a section within 0.8D centered on the head centerline, use K c instead of K in the preceding equations. K c is def ned as follows:
K R R Rc � � � �0 25346 0 13995 0 12238 0 0152972 3. . . .ell ell ell (2.21)
TORISPHERICAL HEAD
The equations for a torispherical head follow (see Figure 2.5).
Crc � Cr � Loss � FCA (mm, in)
Rc � R � Loss � FCA (mm, in)
CH002-H8766.indd 15CH002-H8766.indd 15 6/12/2008 7:53:19 PM6/12/2008 7:53:19 PM

Pressure Vessel and Stacks Field Repair Manual16
The minimum thickness, MA WP, and membrane stress equations are as follows:
tPC M
SE Prrc�
�2 0 2. (2.22)
MAWPS Et
C M ta c
rc c�
�
20 2.
(2.23)
σmrc
c
PE
C Mt
� �2
0 2.⎛
⎝⎜⎜⎜⎜
⎞
⎠⎟⎟⎟⎟⎟
(2.24)
where
MCrrc� �
14
3 0.⎛
⎝
⎜⎜⎜⎜⎜
⎞
⎠
⎟⎟⎟⎟⎟ (2.25)
Geometrical Equations for a Torispherical Head
Referring to Figure 2.6 , we have the following:
α � arcsinRC
c
rc
⎛
⎝⎜⎜⎜⎜
⎞
⎠⎟⎟⎟⎟⎟
(2.26)
In most cases, 49° � ϕ � 65°, depending on the thickness and diameter of the head. For many cases ϕ � 55°.
α
φ
Ri
rk
IDD
Spherical dish
FIGURE 2.6 Torispherical head geometry (where Ri � Cr � L).
CH002-H8766.indd 16CH002-H8766.indd 16 6/12/2008 7:53:20 PM6/12/2008 7:53:20 PM

Handy Pressure Vessel Formulas 17
The equation for the knuckle angle is as follows:
ϕα
π�
� �arccos
IDD Cr
r
k
( cos( ))1 180⎡
⎣⎢⎢
⎤
⎦⎥⎥⎛
⎝⎜⎜⎜
⎞
⎠⎟⎟⎟⎟
(2.27)
CONICAL SECTIONS
The equations for conical sections follow, referring to Figures 2.7, 2.8, and 2.9.
Circumferential Stress (Longitudinal Joints)
tPDS E Pr
C c
a�
�2 0 6cos .α ( ) (2.28)
where D c � D � 2( LOSS ) � FCA
α
Di
t
FIGURE 2.7 Conical section.
α
D
L
Stiffening ring
CL
FIGURE 2.8 Conical transition section (Courtesy of the American Petroleum Institute) .
CH002-H8766.indd 17CH002-H8766.indd 17 6/12/2008 7:53:20 PM6/12/2008 7:53:20 PM

Pressure Vessel and Stacks Field Repair Manual18
MAWPS Et
D tC a c
c c�
�
21 2
cos. cos
αα
(2.29)
where t c � t � LOSS � FCA
σαm
c c
c
PE
Dt
� �2
1 2cos
.⎛
⎝⎜⎜⎜⎜
⎞
⎠⎟⎟⎟⎟⎟
(2.30)
where R c � R � LOSS � FCA
Longitudinal Stress (Circumferential Joints)
tPDS E P
trL c
asl�
��
2 2 0 4cos .α ( ) (2.31)
where t sl � thickness required for any supplemental load based on the longitu-dinal stress, such as weight, wind, or seismic loads.
MAWPS E t t
D t tL a c sl
c c sl�
�
� �
40 8
( )( )
cos. cos
α
α (2.32)
σαm
L c
c sl
PE
Rt t
��
�2 2
0 4( )
⎛
⎝
⎜⎜⎜⎜⎜
⎞
⎠
⎟⎟⎟⎟⎟cos. (2.33)
CL
α
α
r krk
D
Knuckle
L
Stiffening ring
FIGURE 2.9 Toriconical head geometry (Courtesy of the American Petroleum Institute) .
CH002-H8766.indd 18CH002-H8766.indd 18 6/12/2008 7:53:21 PM6/12/2008 7:53:21 PM

Handy Pressure Vessel Formulas 19
Final Values
t t tr rC
rL� max ,( ) (2.34)
MAWP MAWP MAWPC L� min ,( ) (2.35)
σ σ σmax max� mC
mL,( ) (2.36)
Knuckle Section
tPL M
S E Prk kc
a�
�2 0 2. (2.37)
where
LR r
kcc kc
�� �1 cos
cosα
α( )
(2.38)
MLr
kc
kc� �
14
3 0.⎛
⎝
⎜⎜⎜⎜⎜
⎞
⎠
⎟⎟⎟⎟⎟ (2.39)
Final Values
t t tr rc
rk� max ,( ) (2.40)
MAWP MAWP MAWPC L� min ,( ) (2.41)
σ σ σmax max ,� mc
mk( ) (2.42)
Conical Transitions
The minimum thickness, MA WP, and membrane stress equations are com-puted on a component basis. Y ou can use the preceding equations to compute the minimum required thickness, MA WP, and membrane stress of the cone section. These v alues are designated as t MAWPr
c Cmc, , , and respectively.σ
These parameters are shown in Figure 2.10 .
Conical Transition Knuckle Section
You can use the follo wing equations to compute the required thickness, MAWP, and membrane stress for the knuckle region, if used:
tPL M
S E Prk kc
a�
�2 0 2. (2.43)
CH002-H8766.indd 19CH002-H8766.indd 19 6/12/2008 7:53:22 PM6/12/2008 7:53:22 PM

Pressure Vessel and Stacks Field Repair Manual20
RL
RS CL
CL CL
CL
rk
Lc Lct α
α
α
α1
α2
RL
RS
tα
α
(a) (b)
(c)
(e)
(d)
Rs
RL
LG
rk
rk
t Flare
Knuckle
RL
Rs
LG
rk
ri
Note: rk ⇒ max[0.12(RL � t), 3tc]: RS has no dimensional requirements.
α1 � α2: Therefore use α1 in design equations.
FIGURE 2.10 Conical transition geometry (courtesy of the American Petroleum Institute).
CH002-H8766.indd 20CH002-H8766.indd 20 6/12/2008 7:53:22 PM6/12/2008 7:53:22 PM

Handy Pressure Vessel Formulas 21
MAWPS Et
L M tk a kc
kc kc�
�
20 2.
(2.44)
σmk kc
kc
PE
L Mt
� �2
0 2.⎛
⎝⎜⎜⎜⎜
⎞
⎠⎟⎟⎟⎟⎟
(2.45)
where
LR r
kcLC kc�
� �( )1 coscos
αα
(2.46)
MLr
kc
kc� �
14
3 0.⎛
⎝
⎜⎜⎜⎜⎜
⎞
⎠
⎟⎟⎟⎟⎟ (2.47)
Conical Transition Flare Section
tPL M
S E Prf fc
a�
�2 0 2. (2.48)
MAWPS Et
L M tf a fc
fc fc�
�
20 2.
(2.49)
σmf fc
fc
PE
L Mt
� �2
0 2.⎛
⎝
⎜⎜⎜⎜⎜
⎞
⎠
⎟⎟⎟⎟⎟ (2.50)
where
r r LOSS FCAfc k� � � (2.51)
LR r
fcSc fc
�� �( )1 cos
cosα
α (2.52)
MLr
fc
fc� �
14
3 0.⎛
⎝
⎜⎜⎜⎜⎜
⎞
⎠
⎟⎟⎟⎟⎟⎟ (2.53)
Equations Based on a Pressure-Area Force Balance Procedure
tr
P K K KS E
K Krf
fc a�
� �� �
11 5
1 2 34 5
⎛
⎝
⎜⎜⎜⎜⎜
⎞
⎠
⎟⎟⎟⎟⎟
⎛
⎝⎜⎜⎜⎜
⎞
⎠⎟⎟⎟⎟⎟
[ ].
(2.54)
CH002-H8766.indd 21CH002-H8766.indd 21 6/12/2008 7:53:22 PM6/12/2008 7:53:22 PM

Pressure Vessel and Stacks Field Repair Manual22
MAWP S Et r K K
K K Kf
afc r fc
�� �
� �1 5 4 5
1 2 3.
α⎛
⎝⎜⎜⎜⎜
⎞
⎠⎟⎟⎟⎟⎟
(2.55)
σαm
f
fc r fc
P K K KE t r K K
�� �
� �
( ).
1 2 3
4 51 5 ( ) (2.56)
where
K r Dr
fcr fc
1 12
2
0 125 22
� � �. tan( ) αα
(2.57)
K D D tcs
2 1 10 28� . (2.58)
K K K tcc
3 6 60 78� . (2.59)
K t K tcc
cc
4 60 78� . (2.60)
K t D tcs
cs
5 10 55� . (2.61)
KD rfc
61 2 1
2�
� �( )coscos
α
α (2.62)
α απ
r �180
⎛
⎝⎜⎜⎜
⎞
⎠⎟⎟⎟⎟ (2.63)
D Rs1 2� (2.64)
where t c � nominal or furnished small-end cone thickness in a conical transition t t LOSS FCAc
c c� � � t s � nominal or furnished small-end cylinder thickness in a conical transition t t LOSS FCAc
s s� � �
Final Values
Case 1: The conical transition contains only a cone; see Figure 2.11(a) .
t tr rc� (2.65)
MAWP MAWPc� (2.66)
σ σmax � mc (2.67)
CH002-H8766.indd 22CH002-H8766.indd 22 6/12/2008 7:53:23 PM6/12/2008 7:53:23 PM

Handy Pressure Vessel Formulas 23
DL
DS
DLS
DL
DL
DS
DSS
LC
DS
rk
rf
DLS
DL
DS
DSS
rk
Lc
Lc
Lct
Lct
LCt
rf
(a) (b)
(c)
(e)
(d)
Lc � Lct
α
α
α
α
α
α
α
α
Lc � Lct
DL
Portion of a cone
DS
�
FIGURE 2.11 Conical transition geometry—Unsupported length for conical transitions (courtesy of the American Petroleum Institute).
Case 2: The conical transition contains a cone and knuckle; see Figure 2.11(b) .
t t trc k� max ( )min min, (2.68)
MAWP MAWP MAWPc k� min ( ), (2.69)
σ σ σmax max ( , )� mc
mk (2.70)
CH002-H8766.indd 23CH002-H8766.indd 23 6/12/2008 7:53:23 PM6/12/2008 7:53:23 PM

Pressure Vessel and Stacks Field Repair Manual24
Case 3: The conical transition contains a cone, knuckle, and f are; see Figure 2.11(c) .
t t t tr rc
rk
rf� max ( ), , (2.71)
MAWP MAWP MAWP MAWPc k f� min ( , ), (2.72)
σ σ σ σmax max ( )� mc
mk
mf, , (2.73)
Case 4: The conical transition contains a knuckle and f are; see Figure 2.11(d) .
t t tr rk
rf� max ( , ) (2.74)
MAWP MAWP MAWPk f� min ( , ) (2.75)
σ σ σmax max ( )� mk
mf, (2.76)
Case 5: The conical transition contains a cone and f are; see Figure 2.11(e) .
t t tr rc
rf� max ( ), (2.77)
MAWP MAWP MAWPc f� min ( ), (2.78)
σ σ σmax max ( )� mc
mf, (2.79)
Computation of the Half-Apex Angle of a Conical Transition
The following equations were de veloped with the assumption that the conical transition contains a cone section, knuckle, and f are. If the transition does not contain a knuckle or f are, you should set the radii of these components to 0 when computing the half-apex angle.
If ( ) > ( ):R r R rL k S f� �
α β φ� � (2.80)
β �� � �
arctan( )( )R r R r
LL k S f
c
⎡
⎣⎢⎢⎢
⎤
⎦⎥⎥⎥ (2.81)
If ( ) ( ):R r R rL k S f� � �
α β φ� � (2.82)
β �� � �
arctan( ) ( )R r R r
LS f L k
c
⎡
⎣⎢⎢⎢
⎤
⎦⎥⎥⎥ (2.83)
with
φβ
��
arcsin( )r r
Lf k
c
cos⎡
⎣⎢⎢⎢
⎤
⎦⎥⎥⎥ (2.84)
CH002-H8766.indd 24CH002-H8766.indd 24 6/12/2008 7:53:24 PM6/12/2008 7:53:24 PM

Handy Pressure Vessel Formulas 25
HANDY FORMULAS FOR COMPUTING HEAD WEIGHTS
Ellipsoidal, f anged and dished (F & D), and hemispherical heads are made simply with a blank that has a diameter lar ger than the f nished part and is formed by spinning or using an alternate forming process. During forming, the w all thickness is carefully controlled. The resulting product is formed through the use of forming rollers with specif c prof les that are set at precise distances from each other and the mandrel. In one process, a comple x shape is formed by a f at blank that is “ sheared ” by one or more rollers o ver a rotating mandrel. There is no material lost in the process. Such a process is sho wn in Figure 2.12 .
2:1 ellipsoidal head weights
The weight of a head can be quickly and accurately found by computing the volume of a circular blank. For a 2:1 ellipsoidal head, the blank equation is
BD ID S F T� � �1 22 2. . .( ) ( ) (2.85)
where
BD � Blank diameter, in (mm)
ID � Inside diameter of head, in (mm) S.F. � Straight f ange of head, in (mm) T � Head (or blank) thickness, in (mm)
FIGURE 2.12 Forming a formed head in the mill .
CH002-H8766.indd 25CH002-H8766.indd 25 6/12/2008 7:53:24 PM6/12/2008 7:53:24 PM

Pressure Vessel and Stacks Field Repair Manual26
ASME F & D HEAD WEIGHTS
The blank equation for an ASME F & D head is
BD OD (ICR)= � �2 T (2.86)
where
ICR � Inside crown radius � r k in Figure 2.6 . Many people use the term IKR for inside knuckle radius. OD � Outside diameter of head, in (mm) T � Thickness of blank, in (mm) OD � Outside diameter of blank, in (mm)
EXAMPLE 2.1
Find the weight of a 2:1 ellipsoidal head that has an inside diameter of 78 inches, is 3/8 inch thick, and has a straight fl ange of 2 inches.
Solution:
BD � � � �1 22 78 2 2 03
899 535. . .( ) in ( ) in in in
Now you can compute the weight by multiplying the volume of the blank by the density of steel, as follows:
ρ � � � �0 283 489 02 7834 7 833. . . ,lb
in
lb
ft
Kg
m
g
cmm3
m3 3 3
⎛
⎝⎜⎜⎜⎜
⎞
⎠⎟⎟⎟⎟
WWgt ( )lb
in( ) in ( ) inm
32� �0 283
499 535 0 375 8252. . . .
π⎛
⎝⎜⎜⎜⎜
⎞
⎠⎟⎟⎟⎟ 88 lbm
Thus, the head weighs 825.8 lbm, which agrees with the steel mill’s catalog.
EXAMPLE 2.2
Compute the weight of an ASME F&D head that has an ID of 78 inches, a thickness of 3/8 inch, and a knuckle radius of 4¾ inches.
Solution:
OD � � �78 23
878 75in in in
⎛
⎝⎜⎜⎜⎜
⎞
⎠⎟⎟⎟⎟ .
CH002-H8766.indd 26CH002-H8766.indd 26 6/12/2008 7:53:24 PM6/12/2008 7:53:24 PM

Handy Pressure Vessel Formulas 27
HEMISPHERICAL HEAD WEIGHTS
You might think that hemispherical head weights can be computed easily from the following formulation:
Wgt ( ) in ( )lbino i
m3
� �23
0 2833 3 3π R R . (2.87)
The truth is that the blanks used normally produce a head approximately 11% higher in weight than that computed with Eq. 2.87 . If the heads are forged, which the y are for v ery thick w all heads, then Eq. 2.87 is more accu-rate. Blanks can be used up to about 6 inches. F orging is used for thick er wall heads. Six inches is thick, so for gings can start at an y thickness, particularly over 2 inches of wall thickness. To correct for this error for heads formed from blanks, you can use the following formulas:
BD (ID) in� �1 506 2. T for T ≤ (2.88)
BD (ID)2 in
in� �1 506 20 03
..
T T for T⎛
⎝⎜⎜⎜
⎞
⎠⎟⎟⎟⎟ > (2.89)
where
BD � Blank diameter, in ID � Inside diameter of head, in T � Thickness of head wall, in
Note: These equations are empirical and de veloped using U.S. Customary units. If you are using the metric SI system, it is recommended that you use the equations with U.S. Customary units and then con vert them to the metric SI system.
BD � � � �78 75 2 4 753
488 625. . .in ( ) in in in
Wgt ( )lb
in( ) in im
32� 0 283
488 625
3
82. .
π⎛
⎝⎜⎜⎜⎜
⎞
⎠⎟⎟⎟⎟
⎛
⎝⎜⎜⎜⎜
⎞
⎠⎟⎟⎟⎟ nn lbm� 654 67.
The manufacturer’s catalog lists the head weight as being 654 lbm.To compute the values of α and ρ, you may use Eq. 2.26 and Eq. 2.27,
respectively.
CH002-H8766.indd 27CH002-H8766.indd 27 6/12/2008 7:53:25 PM6/12/2008 7:53:25 PM

Pressure Vessel and Stacks Field Repair Manual28
EXAMPLE 2.3
Consider a 78-inch ID hemispherical head with a nominal 1-inch wall. Compute the weight of the head.
From Eq. 2.88, you can compute the diameter of the blank as follows:
BD � 1.506(78) � 1 � 118.5 in
The computed weight is as follows:
Wgt ( ) in ( ) in( )lb
inlbm
3 m� �π4
78 1 0 283 3119 462 2⎛
⎝⎜⎜⎜⎜
⎞
⎠⎟⎟⎟⎟ . .
Using the actual blank that is used in the mill gives the following:
BD � 118.5 in
The error between the actual mill weight and that computed from Eq. 2.88 is 0.054%. The error between the actual mill weight and that computed from Eq. 2.87 is 11.11 %.
EXAMPLE 2.4
Compute the weight of a hemispherical head with an ID of 132 inches and a minimum head thickness of 6 inches.
Applying Eq. 2.89, you can determine the blank diameter as follows:
BD � � �1 506 132 66
2204 993
0 03
. ..
( ) in⎛
⎝⎜⎜⎜⎜
⎞
⎠⎟⎟⎟⎟
Wgt ( ) in ( ) in(0 )lb
in2 m
3� �
π4
204 993 6 283 56041 122⎛
⎝⎜⎜⎜⎜
⎞
⎠⎟⎟⎟⎟ . . . 44 lbm
The actual blank diameter used at the mill is 207.5 inches in diameter. Therefore, you can calculate the weight as follows:
Wgt ( ) in ( )inin
inact2�
π4
207 5 66
22
0 0⎛
⎝⎜⎜⎜⎜
⎞
⎠⎟⎟⎟⎟
⎛
⎝⎜⎜⎜⎜
⎞
⎠⎟⎟⎟⎟.
. 33
0 283 57420 211( )lb
inlbm
3 m. .�
The error between the results of Eq. 2.8 and the actual weight is 2.40%. The error between the actual weight and the result of Eq. 2.87 is 11.48%.
PARTIAL VOLUMES AND PRESSURE VESSEL CALCULATIONS
Listed in the follo wing are formulations for the v olumes of liquids occup ying partial volumes.
CH002-H8766.indd 28CH002-H8766.indd 28 6/12/2008 7:53:25 PM6/12/2008 7:53:25 PM
Handy Pressure Vessel Formulas 29
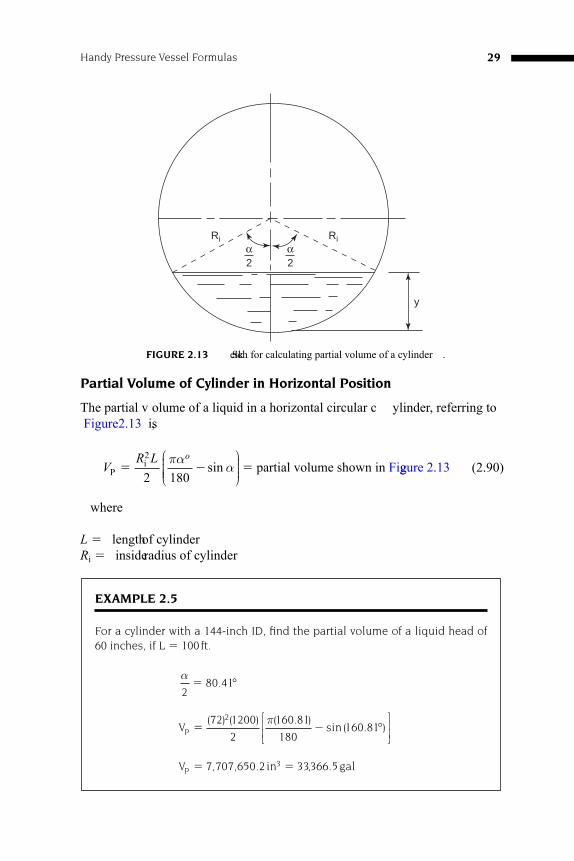
Partial Volume of Cylinder in Horizontal Position
The partial v olume of a liquid in a horizontal circular c ylinder, referring to Figure 2.13 , is
VR L o
Pi partial volume shown in Fi� � �2
2 180πα
αsin⎛
⎝⎜⎜⎜⎜
⎞
⎠⎟⎟⎟⎟
ggure 2.13 (2.90)
where
L � length of cylinder R i � inside radius of cylinder
Ri Ri
y
α2
α2
FIGURE 2.13 Sketch for calculating partial volume of a cylinder .
EXAMPLE 2.5
For a cylinder with a 144-inch ID, fi nd the partial volume of a liquid head of 60 inches, if L � 100 ft.
α2
80 41� . °
VP � �( ) ( ) ( )
( )72 1200
2
160 81
180160 81
2 π .sin . °
⎡
⎣⎢⎢
⎤
⎦⎥⎥
VP � �7,707,650.2 in , gal3 33366 5.
CH002-H8766.indd 29CH002-H8766.indd 29 6/12/2008 7:53:25 PM6/12/2008 7:53:25 PM

Pressure Vessel and Stacks Field Repair Manual30
Partial Volume of a Hemispherical Head
Vy R D
Pi��π 2 3
3( ) (2.91)
where
V P � partial volume shown in shaded region For vertical volume in Figure 2.14(a) , f nd the partial v olume jfor a head
with Ri � 50 inches and y � 35 inches:
VP
3( ) ( )
, in gal��
� �π 35 3 50 100
364 140 85 277 7
2 ⎡⎣ ⎤⎦ . .
y
Ri
(b)
(a)
y
FIGURE 2.14 (a) Partial volume of a hemispherical head in the v ertical position. (b) Partial volume of a hemispherical head in the horizontal position .
CH002-H8766.indd 30CH002-H8766.indd 30 6/12/2008 7:53:25 PM6/12/2008 7:53:25 PM

Handy Pressure Vessel Formulas 31
Partial Volumes of Spherically Dished Heads
The equations for partial v olumes of a liquid occup ying spherically dished heads follow.
Spherically Dished Head in Horizontal Position
The partial volume of a horizontal head shown in Figure 2.15 is
Vy R L R yi
�� � �
��
αρ ρ2 2 3 2 2 3
2 2
3 2
( ) ( ) ( )i i i (2.92)
αyi
yi
Ri
y
P
FIGURE 2.15 Partial volume of a spherically dished head in the horizontal position .
EXAMPLE 2.6
For horizontal volume in Figure 2.14(b), fi nd the partial volume for a head with Ri � 50 inches and y � 35 inches:
VP � �277 7
2138 85
.. gal
CH002-H8766.indd 31CH002-H8766.indd 31 6/12/2008 7:53:26 PM6/12/2008 7:53:26 PM

Pressure Vessel and Stacks Field Repair Manual32
EXAMPLE 2.7
A spherically dished head with a 114-inch OD is spun from a 1-inch plate. Determine the partial volume of liquid that is at the bottom portion of the head. The head is shown in Figure 2.16, with a liquid level 10.0 inches below the centerline. From the vessel head manufacturer’s catalog, you can deter-mine the following:
IDD � �16.786 in, 108 inρ
Ri ��
�114 2 1 0
256 0
( ) in
..
α � �� � �
159 43 2 78108 16 786 91 21
. .. .
radians inL
V
V
�� � �
��
�
2 78108 10 108 56
3
91 21 56 10
2
37 677 6
2 2 3 2 2 3 2 2
..
, .
( ) ( ) ( )( )
33 163 1 in gal3 � .
α yi � 10.0"
FIGURE 2.16 Spherically dished head in the horizontal position sho wing the liquid level at 10.0 inches below the centerline.
Spherically Dished Head in Vertical Position
The equation for the partial v olume of a liquid occup ying a spherically dished head in the vertical position is
The partial volume of a vertical head in Figure 2.17 is
V y x y�
�π ( )36
2 2 (2.93)
CH002-H8766.indd 32CH002-H8766.indd 32 6/12/2008 7:53:26 PM6/12/2008 7:53:26 PM

Handy Pressure Vessel Formulas 33
or
V y y�
�π ρ2 33
( ) (2.94)
IDD
RiP
y
�
FIGURE 2.17 Volume of a spherically dished head in the vertical position .
EXAMPLE 2.8
For the same head in the example in Figure 2.16, determine the partial vol-ume of a head of liquid of 9 inches.
x
V
�
��
� �
55 456
9 3 55 456 9
664 4
2 2
.
..
in.
( ) ( )14,874 in gal3
π ⎡⎣⎢
⎤⎦⎥
Partial Volumes of Elliptical Heads
The partial volumes of elliptical heads are described in the horizontal and v er-tical positions as follows:
Elliptical Head in Horizontal Position
The exact partial volume of a horizontal elliptical head, as illustrated in Figure 2.18 , is:
VR
R y� �(IDD) ( )
ii i
α3
2 2 3 (2.95)
CH002-H8766.indd 33CH002-H8766.indd 33 6/12/2008 7:53:26 PM6/12/2008 7:53:26 PM

Pressure Vessel and Stacks Field Repair Manual34
α yi
yi
Riy
End View of Horizontal Head
IDD
FIGURE 2.18 Partial volume of an ellipsoidal head in the horizontal position showing the eleva-tion and front views.
EXAMPLE 2.9
Find the partial volume of a 2:1 elliptical head (Ri/IDD � 2) for which the OD is 108 inches. The level of the liquid is 35 inches and the head is spun from a 1-inch plate.
IDD ��
�108 21 0
426 50
( ) in
..
CH002-H8766.indd 34CH002-H8766.indd 34 6/12/2008 7:53:27 PM6/12/2008 7:53:27 PM

Handy Pressure Vessel Formulas 35
Elliptical Head in Vertical Position
The volume of the top portion, shown as section 2 of Figure 2.20 , is
V R y yIDDi2
23
23� �π
( )⎡
⎣⎢⎢
⎤
⎦⎥⎥ (2.96)
The volume of the bottom portion, shown as section 1 in Figure 2.20 , is
VIDD R
R y yIDD
ii1
22
3
22
3 3� � �
ππ
( )( )
⎡
⎣⎢⎢
⎤
⎦⎥⎥ (2.97)
y
IDD
Ri
2
1
FIGURE 2.20 Partial volume of an elliptical head in the vertical position .
From Eq. 2.95 and Figure 2.19, you get the following:
VIDD
RR y
ii i� �
� �
( )( )
radians
α
α3
138 80 2 42
2 2 3
. .
V
V
� �
� �
( )( )
( )( )
48,851.88 in gal
26 5 2 42
3 5353 19
211 5
2 2 3
3
. .
.
α RiRi
FIGURE 2.19 Ellipsoidal head in horizontal position example .
CH002-H8766.indd 35CH002-H8766.indd 35 6/12/2008 7:53:27 PM6/12/2008 7:53:27 PM

Pressure Vessel and Stacks Field Repair Manual36
Partial Volumes of Torispherical Heads
The equations for a liquid occup ying partial v olumes of torispherical heads follow.
Figures 2.21 and 2.22 use the following nomenclature:
Vk � knuckle volume VD � dish volume KR � knuckle radius y � height of liquid IDD � inside depth of dish ρ � inside dish radius
Torispherical Head in the Vertical Position
For the torispherical head in the v ertical position shown in Figure 2.21(c) , the knuckle-cylinder partial volume is
V y r r rk m� � �π6
42 2 2( )o i (2.98)
The partial volume of the dish region of a torispherical head in the v ertical position is
V y x yD �
�π ( )36
2 2 (2.99)
The total partial v olume of a liquid in a torispherical head in the v ertical position is
VH r r r y x y
V m� � � ��π π
64 3
62 2 2
2 2( ) ( )
o i (2.30)
where y d � IDD – KR .
EXAMPLE 2.10
For the same head in the preceding example for the elliptical head, deter-mine the partial volume for a vertical head with 19 inches of liquid. Using Eq. 2.97, you get the following:
V
V
� � �
�
2 26 50 53 0
353 0 7 5
7 5
3 26 50
22
3
2
ππ
( )( )( )
( )
( )
1
. .. .
.
.
⎡
⎣⎢⎢
⎤
⎦⎥⎥
555,903.62 in 64,418.36 in in
or, V gal
3 3 3� �
�
91485 26
396 04
, .
.
CH002-H8766.indd 36CH002-H8766.indd 36 6/12/2008 7:53:27 PM6/12/2008 7:53:27 PM

FIGURE 2.21 Partial volume of torispherical heads: (a) vertical position, (b) horizontal posi-tion, (c) knuckle region in vertical position, (d) knuckle region in horizontal position .
IDD
x
Di
yi
�x
(a) Vertical head
KR
ρ
y
ρDi
IDD
(b) Horizontal head
y
L
KR
y
y/2 ri
rm
ro
(c) Vertical knuckle region
KR
y
(d) Horizontal knuckle region
H � IDD � KR
Di
Ri
CH002-H8766.indd 37CH002-H8766.indd 37 6/12/2008 7:53:28 PM6/12/2008 7:53:28 PM

Pressure Vessel and Stacks Field Repair Manual38
Torispherical Head in the Horizontal Position
In Figure 2.23 the partial volume of Dish 1 is
Vy R L R y
1
2 2 3 2 2 3 2 2
3 2�
� � ��
�α
ρ ρ( ) ( ) ( )i i i i (2.101)
The volume of the knuckle-cylinder region is
V R R224
3� � � � �α
π(KR) ( KR) ( KR)i i
⎡
⎣⎢⎢
⎤
⎦⎥⎥ (2.102)
Vk
VD yd
FIGURE 2.22 Partial v olume of torispherical head in v ertical position sho wing the dish and knuckle volumes .
End view of dishvolume
I
αρρ yi
LIDD
Ri
yd
21
KR
ρ
yi
y
FIGURE 2.23 Sketch for the e xample of the partial v olume in a torispherical head in the hori-zontal position .
CH002-H8766.indd 38CH002-H8766.indd 38 6/12/2008 7:53:29 PM6/12/2008 7:53:29 PM

Handy Pressure Vessel Formulas 39
The total partial v olume for a torispherical head in the horizontal position is as follows:
V V VT � �1 2 (2.103)
Vy R L R y
KR R KR R
Ti i i i
i i
�� � �
��
� � � � �
α( ) ( ) ( )
( ) ( ) (
ρ ρ
απ
2 2 3 2 2 3 2 2
3 2
43
KKR)2⎡
⎣⎢⎢
⎤
⎦⎥⎥
(2.104)
where L � ρ � IDD.
EXAMPLE 2.11: A Torispherical Head in the Horizontal Position
A 102-inch OD F&D (fl anged and dished, or torispherical) head made to ASME specifi cations (KR � 0.60ρ and KR � 3th, where th � head thickness) is spun from a 1-inch plate. The head is in the horizontal position. The liquid level is 35 inches inside the head. Determine the volume of the liquid that occupies the partial volume of the head.
From the vessel head manufacturer’s catalog and Figure 2.24, you can cal-culate the following:
ρ � � �96 6 125 17 562in, in, inKR IDD. .
R Li � � � � �100
250 96 0 17 562 78 438in, in. . .
From Eq. 2.104, you can determine
VT �� � �
��
�
2 53296 15 96 50
3
78 438 15
2
2 5324 6
2 2 3 2 2 3 2
..
.
( ) ( ) ( )(50 )
(
2
... .
125
350 6 125 50 6 125 2)( ) ( )
34,093.44 in 1473
π� � � �
� �
⎡
⎣⎢⎢
⎤
⎦⎥⎥
VT ..59 gal
α 15"
35"50"
FIGURE 2.24 Example of torispherical head in the horizontal position .
CH002-H8766.indd 39CH002-H8766.indd 39 6/12/2008 7:53:29 PM6/12/2008 7:53:29 PM

Pressure Vessel and Stacks Field Repair Manual40
REFERENCES
1. ASME Section VIII, Division 1, Boiler and Pressure Vessel Code, 2007. 2. API Recommended Practice 579 , Fitness-for-Service , 1st edition , American Petroleum
Institute , January 2000 .
EXAMPLE 2.12: A Torispherical Head in the Vertical Position
A 138-inch OD F&D head not made to ASME specifi cations is spun from a 1 ½-inch plate. The liquid level is 18 inches. Find the volume of the liquid.
From the vessel head manufacturer’s catalog, you can calculate the following:
ρ � � �132 3 20 283in, in, inKR IDD .
Ri ��
�138 21 5
267 50
( )in
..
x H� � � �67 50 3 66 4662 20 5
. ..⎡
⎣⎢⎤⎦⎥ in
For the knuckle-cylinder region,
r R r R KRi i io ; in� � � � � �67 50 67 50 3 00 64 50. . . .≅
rm ��
�67 50 64 50
266 0
. ..
h � � � �20 283 3 0 15 0 2 283. . . .( ) in
VV � � � ��π π( )
( )( ) ( )2 283
667 50 4 66 0 64 5
17 283 3 64 52 2 2
2.
. . .. .
⎡⎣⎢
⎤⎦⎥
117 283
6
2.⎡⎣⎢
⎤⎦⎥
VV � �31,247.726 in 115,645.832 in3 3
VV � �146,893.558 in 635.903 gal3
CH002-H8766.indd 40CH002-H8766.indd 40 6/12/2008 7:53:29 PM6/12/2008 7:53:29 PM
41
Chapter 3
Dynamic Response of Pressure Vessels and Stacks
This chapter describes the dynamic response of pressure v essel columns and stacks. We will focus on screening criteria and methods of remediation and follow with a discussion on methodology.
The subject of a v ertical column or stack responding to wind in dynamic resonance has been addressed in engineering for o ver 100 years. F or the past 50 years, discussion of the subject has gro wn in engineering publications. The subject is more accurately called f uid-structure interaction . The dynamic res-onance is mostly caused by v ortex shedding around the column or stack, b ut where there are two or more stacks, the mechanism of turbulence buffeting can exist.
It has been found that the upper third or fourth of the to wer is signif cant because the correlation length of the v ortices mostly af fects this portion. The correlation length applies to the length o ver which the v ortex streets are syn-chronized with each other . If tw o vortex streets around a to wer are acting at different elevations but are in phase with each other , the distance between the two elevations of the v ortices is called the correlation length . On a v ertical tower, the correlation length is usually the upper third or fourth of the to wer. Below this le vel the v ortices diminish rapidly in magnitude. The correlation length can be tw o-dimensional in one plane or three-dimensional in three planes. In the former case, the to wer behaves much lik e a pendulum. In the latter case, the to wer top mo ves in an elliptical orbit in which the major axis of the ellipse is normal to the air f ow. This latter case is the most common response. Readings from accelerometers mounted on the tops of to wers reveal that the elliptical path is not a pure ellipse, b ut highly irregular jagged patterns that approximate an ellipse. T owers with tw o or more diameters with a sig-nif cant amount of mass in the top one third or fourth tend to be problematic. The piping, platforms, and ladders can act as vortex inhibitors, but the designer should not depend on this outcome.
This elliptical pattern is what in the past w as called ovaling . Some towers display an oval movement in resonance more than others; however, f eld accel-erometers show that the mo vement may not be entirely elliptical; it is random
CH003-H8766.indd 41CH003-H8766.indd 41 6/16/2008 3:12:12 PM6/16/2008 3:12:12 PM

Pressure Vessel and Stacks Field Repair Manual42
in a generally elliptical pattern. Se veral screening criteria can be used to pre-dict dynamic resonance response; these criteria are as follows:
1. Critical wind v elocity is the wind speed in which dynamic resonance occurs, V 1 . This is def ned as follows:
V d
T1
3 40�
. (ft)sec
cycle⎛
⎝⎜⎜⎜⎜
⎞
⎠⎟⎟⎟⎟
(3.1)
where d � average diameter of the top third or fourth portion of a tower T � period of vibration
This is the f rst critical wind velocity and is usually the one that go verns compared to the second critical wind velocity, which is def ned as follows:
V V2 18 25� . (3.2) If the critical wind v elocity is close to the hourly a veraged wind speed,
resonance is possible. This means that if the pre vailing wind remains con-stant over a prolonged time span, lar ge dynamic amplitudes can be possi-ble. Short wind gusts can set up resonance, but usually it is only temporary. When resonance occurs in the f eld, there is diff culty in measuring wind speed. This parameter requires judgment b ut can be helpful when you are using the other criteria.
2. The vortex shedding frequency is the frequenc y in which the v ortices will shed. It is def ned as follows:
f
v
dv � �
0 2. ~ ftsec
(ft)Hertz
⎛⎝⎜⎜⎜
⎞⎠⎟⎟⎟⎟
(3.3)
where v~ � 45 mph or 66 fps d � average diameter def ned previously
It has been found in v arious studies that v ortex shedding de velops over the length of the top one third or top fourth of the to wer, be it a process column or stack. If an y top one third or fourth of the to wer when f r � 2 f v , then an oval pattern response is possible and lik ely. The wind velocity that would theoretically induce ovaling is
V
f dSor�
602
(3.4)
where S � Strouhal number � 0.2 for most applications.
CH003-H8766.indd 42CH003-H8766.indd 42 6/16/2008 3:12:12 PM6/16/2008 3:12:12 PM

Dynamic Response of Pressure Vessels and Stacks 43
3. The computation of the natural frequenc y method using Rayleigh’ s method, which will be discussed later , can be applied to estimate the maximum dynamic displacement of the to wer. This method is for undamped systems but is reasonably accurate in computing the f rst natural period, T , for most engineering applications. If you were to theoretically place the to wer hori-zontally and f x it like a cantilever beam at the base, when it is subjected to gravity, the resulting def ection would be a reasonable estimate of the poten-tial maximum response during resonance. This has been a helpful, and some-what accurate, prediction of the dynamic response. The criterion of 6 inches per 100 feet, or 0.5% of the total height, is used to determine the section modulus of each tower section to minimize the response for process columns with trays. For packed columns, 9 inches per 100 feet, or 0.75% of the total height, is a criterion. Using this approach, you can change each tower section thickness to alter the mass distribution along the tower height. This technique has been a helpful rule of thumb in industrial practice; ho wever, some mem-bers of academia do not lik e its use. This book is not intended for these peo-ple; the target audience here is for people working in the real world.
4. I developed the plot in Figure 3.1 [1] by comparing data for approximately 100 stacks. These data were taken from stacks, not process columns. The dif-ference can be signif cant because the latter ha ve more external attachments, such as piping, ladders, and platforms, and process f uids during operation. You must be cognizant of this difference when using the plot in Figure 3.1 .
The dynamic response of stacks lar gely depends on the structural damp-ing coeff cient, ζ . Table 3.1 pro vides a list of structural damping coeff -cients for stacks. Using this table, you can select a structural damping value and refer to Figure 3.1 to predict a dynamic displacement.
As you can see from the curv es, for one v alue of natural frequenc y, the lower the structural damping coeff cient, the higher the ratio of the dynamic amplitude to the total height, Δ . Thus, for one natural frequenc y, it is pos-sible to obtain a range of dynamic amplitudes between the upper and lo wer bound curves for the design case. If the natural frequenc y is lower than the value shown in the f gure, then you have several options.
If the situation is the design phase of constructing a stack then one can increase the natural frequency and/or increase the structural damping coef-f cient and/or add vibration inhibitors. The latter will be discussed under the topic of remediation. Also, the criterion for the minimum values of nat-ural frequency is discussed later in the chapter . Each stack is inf uenced by its surroundings, including the support at the base. If the stack is mounted on another piece of equipment, then both the stack and supporting equip-ment need to be assessed together . Also, a stack do wnstream from other stacks will respond differently from one standing alone with no other stack in the proximity. This explains some of the wide scatter in the data.
The vast majority of empirical data regarding vibration is widely scattered. It w as found that for the same natural frequenc y and structural damping
CH003-H8766.indd 43CH003-H8766.indd 43 6/16/2008 3:12:12 PM6/16/2008 3:12:12 PM

Pressure Vessel and Stacks Field Repair Manual44
coeff cient, v arious to wers e xhibited dif ferent dynamic amplitudes. The scatter is shown in Figure 3.1 ; the lower line shows the dynamic amplitude for a certain natural frequenc y and structural damping coeff cient, while the upper curves do the same for the higher bound values. Figure 3.1 shows only the extreme values of ζ . You can interpolate for the v alue of ζ in the f gure, using prudent judgment of the application at hand.
5. From steps 3 and 4 earlier in this section, you may suspect that another important parameter for screening dynamic response is the fundamental nat-ural frequency of the tower. I observed that in process columns with the mass distributed toward the upper sections, there w as a correlation between the fundamental natural frequency and excessive dynamic response. I observed
FIGURE 3.1 Probabilistic plot of the stack’s natural frequency f versus Δ , the ratio of the maxi-mum dynamic amplitude (in) to the total height (in) for v arious values of structuralt damping ( ζ ). UB � the upper bound value for Δ for a given frequency value; LB � the lower bound frequency value for Δ .
0.1
0.01
0.001
1�10�2
0 0.5 1 2 3 3.5 4 4.52.51.5
� � 0.008 UB
f � Natural Frequency (Hz)
0.005
� �
Rat
io o
f Dyn
amic
Am
plitu
de/T
otal
Tow
er H
eigh
t
ζ � 0.003 UB
ζ � 0.004 UB
ζ � 0.008 UB
ζ � 0.003 LB
ζ � 0.004 LB
ζ � 0.008 LB
CH003-H8766.indd 44CH003-H8766.indd 44 6/16/2008 3:12:12 PM6/16/2008 3:12:12 PM

Dynamic Response of Pressure Vessels and Stacks 45
that the fundamental frequenc y of the tower should be greater than 1.0 Hz, although slightly less than 1.0 Hz would be acceptable. If the natural fre-quency is not below 0.97 Hz, excessive dynamic amplitude will be avoided. This test has been applied to many process columns, and towers with a nat-ural frequency less than 0.97 Hz failed. Note: This criterion does not say that, if the natural frequenc y of the to wer in the f rst mode is greater than 0.97 Hz, then dynamic resonance will not occur.
6. The ASME STS-1 Steel Stacks [2] governing standard used in the design of steel stacks is important, and e veryone should be f amiliar with it. In Example E.7 in the standard, the mass damping parameter is used as a
TABLE 3.1 Industrial Accepted Structural Damping Coeffi cient, ζ, Values ζT � ζmin � Σζi 0.008
Stacks Supported on Ground ζ Values
Stacks Supported on Elevated Steel ζ Values
Minimum Value—unlined stack, all welded, on rock, or very stiff soil
ζmin � 0.004 Minimum Value—unlined stack, all welded, on steel (such as a furnace)
ζmin � 0.003
ζ Values added to ζmin ζl Values ζ Values added to ζmin ζl Values
• Stack lining (min. 2 thick)
• Stack constructed with a minimum of 5 fl anges
• External piping attaching from 60°–120° between each other
• Stack mounted on soft soil
0.002
0.002
0.003
0.001
• Stack lining (min. 2 thick)
• Stack constructed with a min. of 5 fl anges
• External piping attaching from 60°–120° between each other
• Steel support provided with refractory casing
0.001–0.002 (1)
0.001–0.002 (1)
0.003
0.002
ζT � 0.008 if: ζT � 0.008 if:
• 3 guy wires attached to upper ¼ or 1/3 of height
• Installation of proper damping pads
ζT � 0.012
ζT � 0.012
• 3 guy wires attached to upper ¼ or 1/3 of height
• Installation of proper damping pads
ζT � 0.012
ζT � 0.012
Note: A higher damping value is used if a relatively fl exible stack is mounted on a stiff strcuture (Structure stiffness � 100x stack stiffness)
CH003-H8766.indd 45CH003-H8766.indd 45 6/16/2008 3:12:12 PM6/16/2008 3:12:12 PM

Pressure Vessel and Stacks Field Repair Manual46
TABLE 3.2 ASME STS-1 Representative Structural Damping Values (ξs)
Support Damping Value
Type Welded Stack Rigid Support (1) Elastic Support (2)
Unlined 0.002 0.004
Lined (3) 0.003 0.006
NOTES: (1) Foundations on bedrock, end-bearing piles or other rigid base support conditions.(2) For foundations with friction piles or mat foundations on soil or other elastic base support conditions.(3) Lining must consist of a minimum 2 in. thick, nominally 100 pcf density liner material for stack to be considered lined for the use of this table. (Reprinted from ASME STS-1-2006, by permission of the American Society of Mechanical Engineers. All rights reserved.)
criterion for assessing dynamic response. This parameter is de veloped as follows:
m
mD gr
e�ρ 2
(3.5)
where m r � dimensionless mass ρ � density of air, taken in the example as 0.00238 slugs/ft 3 D – � average diameter of the stack, ft g � 32.17 lb m /slug
Note: If the value of the density is entered as lb m /ft 3 , then
ρe g� �0 00238 32 17 0 0779. ( . ) .slugs
ftlbslug
lbft3
m m3
⎛
⎝⎜⎜⎜
⎞
⎠⎟⎟⎟⎟
and Eq. 3.5 becomes
m
mDre
e�
ρ 2
(3.5a)
The structural damping v alue, ξ s ( β s is used in the standard), is gi ven in
Table 3.2 and is taken from Table 5.2.1 in the standard [2] . The mass damping parameter is def ned as follows:
m mp r s≡ ζ
(3.6) When referring to stacks, you can f nd the structural damping v alue, ξ s , in
Table 3.2 . When referring to process columns, you use either Table 3.1 or 3.2 . Example E.7 in ASME STS-1 [2] says that m p � 0.8 for the stack to be
satisfactory. Findlay [3] reports that ExxonMobil requires m p � 1.1 for the
CH003-H8766.indd 46CH003-H8766.indd 46 6/16/2008 3:12:13 PM6/16/2008 3:12:13 PM

Dynamic Response of Pressure Vessels and Stacks 47
stack or process column to be satisfactory to prevent unacceptable dynamic amplitudes.
We will illustrate the six f uid-structure interaction criteria in Example 3.1. It is important that you are cognizant of the f act that these criteria are based on rules of thumb. They are not to be considered as la ws of physics, and judgment has to be rendered in their application.
Example 3.1
This example (from [1] ) was an actual case where a tower developed dynamic amplitudes that were unacceptable. The internals, ladders, and external pip-ing were installed on the process column. We will evaluate each of the six criteria and see how they apply to this process column, which is shown in Figure 3.2 .
First, you need to fi nd the natural frequency. To this end, refer to Figure 3.2 and Figure 3.3 for the solution.
After solving for the natural frequency, you can continue with the follow-ing calculations.
The fi rst critical wind velocity is
V
d
T1
3 40�
.
L � �
76 96
419 2
.. 4 ft
d � � �
13 0
19 248 74
6 24
19 243 75
.
.. )
.
.( . )
⎛
⎝⎜⎜⎜⎜
⎞
⎠⎟⎟⎟⎟
⎛
⎝⎜⎜⎜⎜
⎞
⎠⎟⎟⎟⎟( 77 122.
From Eq. 3.1, making the vortex shedding frequency equal to the natural frequency, you can calculate
V
f d
sV
1
0 97 7 122
0 234 540� � �
( ft
sec
. )( . )
..
Considering the top portion (Section 1), you can fi nd
V1
0 97 8 74
0 242 39 28� � �
( ft
sec.90 mph
. )( . )
..
Since the fi eld measurements indicated an air velocity of 30 mph and a col-umn dynamic amplitude of 13 inches, this agrees well with the previous cal-culations with a possible amplitude of 13.59 inches. For a stack only 77 feet 5 inches tall, the 13.59 inches is signifi cantly higher than the 6 inches per 100 feet criterion. Thus, if you use criteria 1, 2, and 5, described earlier in the chapter, the process column is a potential vibration problem.
CH003-H8766.indd 47CH003-H8766.indd 47 6/16/2008 3:12:13 PM6/16/2008 3:12:13 PM

1
3
4
5
6
7
8
9
10
2.113k
4.71k
2.71k
2.48k
2.01k
2.23k
3.44k
3.54k
1.91k
11"
6.95
8 ft
6.96
1 ft
8.78
9 ft
13.2
5 ft
9.00
ft8.
00 ft
8.86
2 ft
8.22
1 ft
5.45
8 ft
1.458 ft
1
2
3
4
5
6
7
8
9
FIGURE 3.2 Schematic sho wing the process column that e xperienced unacceptable dynamic amplitudes .
CH003-H8766.indd 48CH003-H8766.indd 48 6/16/2008 3:12:13 PM6/16/2008 3:12:13 PM

Dynamic Response of Pressure Vessels and Stacks 49
Rules Sheet
Rules
EXAMPLE OF A SOLUTION FOR NATURAL FREQUENCY
M1 � 0
M2 � M1 � W1 · L2
M3 � M2 � (W1 � W2) · L3
M4 � M3 � (W1 � W2 � W3) · L4
M5 � M4 � (W1 � W2 � W3 � W4) · L5
M6 � M5 � (W1 � W2 � W3 � W4 � W5) · L6
M7 � M6 � (W1 � W2 � W3 � W4 � W5 � W6) · L7
M8 � M7 � (W1 � W2 � W3 � W4 � W5 � W6 � W7) · L8
M9 � M8 � (W1 � W2 � W3 � W4 � W5 � W6 � W7 � W8) · L9
M10 � M9 � (W1 � W2 � W3 � W4 � W5 � W6 � W7 � W8 � W9) · L10
RAT2 �M2 · 1000
I2
RAT3 �M3 · 1000
I3
RAT4 �M4 · 1000
I4
RAT5 �M5 · 1000
I5
RAT6 �M6 · 1000
I6
RAT7 �M7 · 1000
I7
RAT8 �M8 · 1000
I8
RAT9 �M9 · 1000
I9
RAT10 �M10 · 1000
I10
S10 �(RAT10 � RAT9) · L10
2
S9 �(RAT9 � RAT8) · L9
2
S8 �(RAT8 � RAT7) · L8
2
S7 �(RAT7 � RAT6) · L7
2
FIGURE 3.3(a) Equation sheet for solution for natural frequency.
CH003-H8766.indd 49CH003-H8766.indd 49 6/16/2008 3:12:14 PM6/16/2008 3:12:14 PM

Pressure Vessel and Stacks Field Repair Manual50
F10 � P10
F9 � P10 � P9
F8 � F9 � P8
F7 � F8 � P7
S6 �(RAT6 � RAT5) · L6
2
S5 �(RAT5 � RAT4) · L5
2
S4 �(RAT4 � RAT3) · L4
2
S3 �(RAT3 � RAT2) · L3
2
�S10 � S10
�S9 � S10 � S9
�S8 � �S9 � S8
�S7 � �S8 � S7
�S6 � �S7 � S6
�S5 � �S6 � S5
�S4 � �S5 � S4
�S3 � �S4 � S3
�S2 � �S3 � S2
S2 �RAT2 · L2
2
P10 ��S10 · L10
2
P9 �(�S10 � �S9) · L9
2
P8 �(�S9 � �S8) · L8
2
P7 �(�S8 � �S7) · L7
2
P6 �(�S7 � �S6) · L6
2
P5 �(�S6 � �S5) · L5
2
P4 �(�S5 � �S4) · L4
2
P3 �(�S4 � �S3) · L3
2
P2 �(�S3 � �S2) · L2
2
FIGURE 3.3(a) (Continued)
CH003-H8766.indd 50CH003-H8766.indd 50 6/16/2008 3:12:14 PM6/16/2008 3:12:14 PM

Dynamic Response of Pressure Vessels and Stacks 51
F6 � F7 � P6
F5 � F6 � P5
F4 � F5 � P4
F3 � F4 � P3
F2 � F3 � P2
�Wy � W1 · 1000 · y2 � W2 · 1000 · y3 � W3 · 1000 · y4 � W4 · 1000 · y5 � W5 · 1000 · y6 � W6 · 1000 · y7 � W7 · 100
�Wy2 � W1 · 1000 · y22 � W2 · 1000 · y32 � W3 · 1000 · y42 � W4 · 1000 · y52 � W5 · 1000 · y62 � W6 · 1000 · y7
� 3.1416
y2 �F2 · 12144 · E
y3 �F3 · 12144 · E
y4 �F4 · 12144 · E
y5 �F5 · 12144 · E
y6 �F6 · 12144 · E
y7 �F7 · 12144 · E
y8 �F8 · 12144 · E
y9 �F9 · 12144 · E
y10 �F10 · 12144 · E
�Wy2T � 2 · · 386.4 · �Wy
f � 1T
FIGURE 3.3(a) (Continued)
CH003-H8766.indd 51CH003-H8766.indd 51 6/16/2008 3:12:15 PM6/16/2008 3:12:15 PM

Pressure Vessel and Stacks Field Repair Manual52
Input Name Output Unit Comment
M1
M2 Moment at Section 2, kip-ft
4.71 W1 Weight of Section 1, kips
6.961 L2 ft Length between centroids of Sections 1 & 2
M3 Moment at Section 3, kip-ft
.113 W2 Weight at Section 2, kips
8.789 L3 ft Length between centroids of Sections 2 & 3
M4
0
32.78631
75.175657
174.987907 Moment at Section 4, kip-ft
2.71 W3 Weight at Section 3, kips
13.25 L4 ft Length between centroids of Sections 3 & 4
M5 265.104907 Moment at Section 5, kip-ft
2.48 W4 Weight at Section 4, kips
9 L5 ft Length between centroids of Sections 4 & 5
M6 361.288907 Moment at Section 6, kip-ft
2.01 W5 Weight at Section 5, kips
8 L6 ft Length between centroids of Sections 5 & 6
M7 487.598993 Moment at Section 7, kip-ft
2.23 W6 Weight at Section 6, kips
8.862 L7 ft Length between centroids of Sections 6 & 7
M8 633.053146 Moment at Section 8, kip-ft
3.44 W7 Weight at Section 7, kips
8.221 L8 ft Length between centroids of Sections 7 & 8
M9 748.94286 Moment at Section 9, kip-ft
3.54 W8 Weight at Section 8, kips
5.458 L9 ft Length between centroids of Sections 8 & 9
M10 782.685354 Moment at Section 10, kip-ft
1.91 W9 Weight at Section 9, kips
1.458 L10 ft Length between centroids of Sections 9 &10
RAT2 117513.655914 Ratio of moment to moment of inertia
.279 I2 Moment of inertia of Section 2, ft^4
RAT3 1105524.367647 Ratio of moment to moment of inertia
.068 I3 Moment of inertia of Section 3, ft^4
RAT4 1698911.718447 Ratio of moment to moment of inertia
.103 I4 Moment of inertia of Section 4, ft^4
RAT5 1907229.546763 Ratio of moment to moment of inertia
.139 I5 Moment of inertia of Section 5, ft^4
Variables sheet
FIGURE 3.3 (b) Variable sheet sho wing results and answers for solution of natural frequency.
CH003-H8766.indd 52CH003-H8766.indd 52 6/16/2008 3:12:15 PM6/16/2008 3:12:15 PM

Dynamic Response of Pressure Vessels and Stacks 53
Variables sheet
Input Name Output Unit Comment
S6
S5
S4
S3
S2
�S10
�S9
�S8
�S7
�S6
�S5
�S4
�S3
�S2
P10
P9
P8
P7
P6
P5
P4
P3
Intermediate moment ratio
Intermediate moment ratio
Intermediate moment ratio
Intermediate moment ratio
Intermediate moment ratio
Sum of intermediate ratio
Sum of intermediate ratio
Sum of intermediate ratio
Sum of intermediate ratio
Sum of intermediate ratio
Sum of intermediate ratio
Sum of intermediate ratio
Sum of intermediate ratio
Sum of intermediate ratio
Force per unit length
Force per unit length
Force per unit length
Force per unit length
Force per unit length
Force per unit length
Force per unit length
Force per unit length
15793639.249197
16227635.693441
18579389.070371
5374640.594539
409006.279409
2791392.420015
10958757.799947
30981864.575615
56645958.470539
72439597.719736
88667233.413177
107246622.483548
112621263.078087
113030269.357495
2034925.074191
37524159.950277
172396928.274747
388278883.917505
516342224.761098
724980740.098109
1297929295.315800
966209423.100602
RAT6 2041180.265537 Ratio of moment to moment of inertia
.177 I6 Moment of inertia of Section 6, ft^4
RAT7 3750761.484615 Ratio of moment to moment of inertia
.13 I7 Moment of inertia of Section 7, ft^4
RAT8 1120448.046018 Ratio of moment to moment of inertia
.565 I8 Moment of inertia of Section 8, ft^4
RAT9 1872357.150000 Ratio of moment to moment of inertia
.4 I9 Moment of inertia of Section 9, ft^4
RAT10 1956713.385000 Ratio of moment to moment of inertia
.4 I10 Moment of inertia of Section 10, ft^4
S10 2791392.420015 Intermediate moment ratio
S9 8167365.379932 Intermediate moment ratio
S8 20023106.775667 Intermediate moment ratio
S7 25664093.894924 Intermediate moment ratio
FIGURE 3.3 (b) (Continued)
CH003-H8766.indd 53CH003-H8766.indd 53 6/16/2008 3:12:15 PM6/16/2008 3:12:15 PM

Pressure Vessel and Stacks Field Repair Manual54
Now look at the sixth criterion: the mass damping parameter . According to Table 3.2 (from Table 5.2.1 of ASME STS-1 [2] ), an unlined stack has a structural damping v alue, x, of 0.004, which Findlay [3] states is commonly used. According to Note 3 of this table, a structural damping v alue of 0.006 can be used only when the stack has a lining of a minimum of 2 inches thick
Input Name Output Unit Comment
F5
F4
F3
F2
y2
Section force per unit length
Section force per unit length
Section force per unit length
Section force per unit length
Deflection of vessel section
P2
F10
F9
F8
F7
F6
Force per unit length
Section force per unit length
Section force per unit length
Section force per unit length
Section force per unit length
Section force per unit length
785380158.642043
2034925.074191
39559085.024468
211956013.299215
600234897.216720
1116577121.977820
1841557862.075930
3139487157.391730
4105696580.492330
4891076739.134370
13.586324
3E7 E Modulus of elasticity of metal in vessel section, psi
y3 11.404713 Deflection of vessel section
y4 8.720798 Deflection of vessel section
y5 5.115439 Deflection of vessel section
y6 3.101603 Deflection of vessel section
y7 1.667319 Deflection of vessel section
y8 0.588767 Deflection of vessel section
y9 0.109886 Deflection of vessel section
y10 0.005653 Deflection of vessel section
�Wy 113977.464553
�Wy2 1181876.417781
3.1416
T 1.029293 First period of vibration, sec/cycle
f 0.971541 Natural frequency of first mode, Hz
Variables sheet
FIGURE 3.3 (b) (Continued)
CH003-H8766.indd 54CH003-H8766.indd 54 6/16/2008 3:12:15 PM6/16/2008 3:12:15 PM

Dynamic Response of Pressure Vessels and Stacks 55
and a nominal density of 100 pounds per cubic foot (pcf). A density of 100 pcf is very dense—like f re proof ng. It can be ar gued that, for an operating proc-ess column with an o verhead pipe e xtending most of the full length and with ladders and internal attachments, you can use a structural damping coeff cient of 0.006. Also ASME STS-1 [2] is for stacks, not process columns. No w see what the sixth criterion yields.
Computing the a verage diameter for the top third of the column, you learn that
LT1
3
77 4173
25 806� �. . ft
D � � �
14 41725 806
36 11 38925 806
24 30..
.
.⎛
⎝⎜⎜⎜
⎞
⎠⎟⎟⎟⎟
⎛
⎝⎜⎜⎜
⎞
⎠⎟⎟⎟⎟ ..704
or d � 2.559 ft. For the top head, and referring to Chapter 2 for the weight of a 36-inch ID
2:1 ellipsoidal head with a minimum 5/16-inch head, you can calculate
BD T� � �1 22 2. ( ) ( . .)ID S F (2.82)
BD � � �
� 1 22 36 2 2 5
1648 23. ( ) ( ) .
WgtHD (0.283)
lbin
in im3
2�π4
48 23 516
2⎛
⎝⎜⎜⎜
⎞
⎠⎟⎟⎟⎟
⎛
⎝⎜⎜⎜
⎞
⎠⎟⎟⎟⎟( . ) nn � 161 57. l bm
For the 36-inch ID cylindrical can, the weight is
Wgt in ) in
lbin
2 m3
364
36 625 36 162 0 283 162 2� � �π⎛
⎝⎜⎜⎜
⎞
⎠⎟⎟⎟⎟ ( . ) ( ( . ) 334 4. lbm
For the 24-inch cylindrical can, the weight is
L � �
�� �25 806 162 9
1211 55 138 67. . .ft 6 ft 2 in
⎛
⎝⎜⎜⎜
⎞
⎠⎟⎟⎟⎟
Wgt in in lb2
m244
24 5 24 138 672 747 442 2� � �π⎛
⎝⎜⎜⎜
⎞
⎠⎟⎟⎟⎟ ( . ) ( . ) .
CH003-H8766.indd 55CH003-H8766.indd 55 6/16/2008 3:12:16 PM6/16/2008 3:12:16 PM

Pressure Vessel and Stacks Field Repair Manual56
For the top third of the stack, the weight is
Wgt lbm� � � �161 57 1634 4 747 44 2543 41. . . . The mass per unit length becomes
me � �
2543 4125 806
98 56.
..
lbft
lbft
m m
Now using a structural damping v alue of ζ s � 0.004 and an air density of
0.0779 lb m /ft 3 , you can substitute into Eq. 3.6 to obtain
m mm
Dp r s
e s� � �ζζ
ρ
( . ( . )
( . ) ( .
98 56 0 004
0 0779 2 559
) lbft
lbft
) ft
m
m3
2 22� �0 773 0 8. .
Using the structural damping value of ζ s � 0.006, you obtain
mp � � �
0 0060 004
0 773 1 1592 1 1..
. . .( )
Depending on which structural damping v alue you use, the sixth criterion becomes less certain, and opinions run high on each side for each v alue of ζ s . Hence, it is recommended that all six criteria be used together to pro vide clo-sure to the problem. If one of the criteria indicates the to wer is unacceptable, then this mak es the decision easier . Criterion 6 w as intended for stacks, not process stacks, but like the other criteria, it can be handy.
FLOW-INDUCED VIBRATION-IMPEDING DEVICES
Helical Strakes
Devices can be b uilt into stacks to counter the v ortex shedding, which causes dynamic instability. Helical vortex strakes are the most common and practical vibration inhibitors for stacks. They are generally too awkward to use on proc-ess columns because of e xternal attachments, such as ladders, platforms, and piping.
The application of helical v ortex strakes to v ertical cylindrical towers has shown remarkable results. I independently de veloped the method presented here over 20 years ago in a f abrication shop in Houston, T exas. Others devel-oped the strake concept long before that, b ut the challenge for me at the time was to f gure out ho w to f abricate and install them onto stacks using simple shop tools. This information was published f rst in a technical journal and then later in [1] .
CH003-H8766.indd 56CH003-H8766.indd 56 6/16/2008 3:12:16 PM6/16/2008 3:12:16 PM

Dynamic Response of Pressure Vessels and Stacks 57
The strakes ’ function is to break up v ortices such that mode shapes stimu-lating dynamic response to the to wer are quickly dampened. It is signif cant to note that adding the strak es signif cantly increases the drag and thus wind loading. These strakes are shown in Figure 3.4 .
To minimize the f ow-induced drag and optimize the vortex-breaking effect, you should leave the strake width, W (ft), in the following range:
0 09 0 10. .D D W where D � OD of stack, ft.
Figure 3.4 shows a helix generated on a c ylinder by taking a template π D long by L high and wrapping it around a c ylinder. The length, L , of the helix is the top third of the stack. Wind tunnel tests have shown that vortex-breaking devices are most ef fective on the upper third of the stack. The helix angle, φ , should have a magnitude in the following range:
54 58° ° φ There are always three strakes per stack to counter the alternate formation
of vortices on either side of the stack.
D
� � Helix angle
Development outline-helix on cylinder
“unrolled”
StrakeD
Number ofstrakes � 3
0.09 D ≤ W ≤ 0.1Dφ � Helix angle54° ≤ φ ≤ 58°
— Helix design.
W
L
L
FIGURE 3.4 Cylindrical strake helix geometry.
CH003-H8766.indd 57CH003-H8766.indd 57 6/16/2008 3:12:16 PM6/16/2008 3:12:16 PM

Pressure Vessel and Stacks Field Repair Manual58
Strakes can be f abricated from a f at piece of metal, normally 3/16 inch or 5 mm thick. Each strak e is divided to a certain number of strips, usually 5–20 segments, depending on the length of the stack. The o verall length of the indi-vidual strakes that are divided is determined by
S D L� �π( )2 2
(3.7)
where D � the OD of the stack, as def ned previously L � height of the tower portion straked (one third of total stack height), ft
The number S is di vided into indi vidual strips that are cut from a lar ger piece of plate, as shown in Figure 3.5 .
The strips must be cut to a radius of curv ature, r , which is determined as follows:
r a b
a�
�2 2 2
2ω
ω (3.8)
where
a D
�2
, ft
FIGURE 3.5 Strake fabrication detail.
Strips cut frombase plateBase plate—3/16-in
(5 mm)
r � radius ofcurvature
— Strake fabrication
ro � r � W
W
CH003-H8766.indd 58CH003-H8766.indd 58 6/16/2008 3:12:17 PM6/16/2008 3:12:17 PM

Dynamic Response of Pressure Vessels and Stacks 59
b L
�2πω
ω � number of revolutions around stack cylinder made by helical strak e (usu-ally ω � 1) .
An alternative formula which is within 2%–3% in error of Eq. 3.8, is
r W
��
λλ1
(3.9)
where
interior arc length of helixexterior arc length of
i
oλ � �
SS helix
(3.10)
The value S i is determined by using the outside diameter of the stack in Eq. 3.7 , and S o is obtained by using D � 2 W in place of the same equation. For the most accurate results, you should use Eq. 3.8 because it is the e xact radius of curvature of a helix projected on a cylinder [4] .
Strips are laid out, as shown in Figure 3.5 , with an inner radius of curvature determined by Eq. 3.8 and an outer radius of r � r � W . You want the helix to be perpendicular to the centerline of the c ylinder along the entire length of the helical strake shown in Figure 3.4 . To obtain this, you place each metal strip in a rig, as shown in Figure 3.6 .
Clamp
Brace
Brace
Strake section cutfrom baseplate
Torch Clamp
Forming table45°
45°
FIGURE 3.6 Clamping each strip on 45° of fsets and hot-forming with a torch to obtain the desired geometry.
CH003-H8766.indd 59CH003-H8766.indd 59 6/16/2008 3:12:17 PM6/16/2008 3:12:17 PM

Pressure Vessel and Stacks Field Repair Manual60
The rig is composed of tw o clamps, each 45° from the plane perpendicular to the table, or 90° of fset from each other. Once the metal strip is clamped in, a hot torch is run up and do wn the length of the metal strip, hot-forming it to a shape formed by the clamps. The strip should not be heated an y longer than necessary to hot-form it.
The metal strips should be the same material as the stack. The effectiveness of the system is not impaired by a gap of 0.005D between the inner edge of the helical strake and the outside surface of the stack.
This method leads to ease and quickness in f abricating helical v ortex strakes.
Example 3.2: Stack Helical Strake Design
An exhaust stack 126 ft. tall is to be provided with helical vortex strakes. The length of the stack to have strakes is the top portion 31 ft. 6 inches long (top fourth of the stack). Compute the radius of curvature of the strake to be cut from the fl at plate. Referring to Figure 3.7 , you can compute the following:
D � �OD of stack ft in7 4
Strips cut frombase plate
ro � r � W � 10.5 ft � 0.667 ft
�11' 2"
r � 1
0.52
1 ft
� 1
0.5
ft
Base plate—3/16
W
FIGURE 3.7 Fabricating helical strakes from a f at plate.
CH003-H8766.indd 60CH003-H8766.indd 60 6/16/2008 3:12:18 PM6/16/2008 3:12:18 PM

Dynamic Response of Pressure Vessels and Stacks 61
L � 31 6ft in
a
D� � �
2
7 333
23 667
..
ω � 1
b
L� � �
2
31 5
2 15 013
πω π.
( ).
r
a b
a�
�2 2 2
2
ωω
r �
��
( . ) ( ) . )
( . )( ).
3 667 1 5 013
3 667 110 521
2 2 2
2
(ft
Check: Using the alternate equation, you can calculate
S D Li ointerior arc length ft� � � �( ) .
.π 2 2
0 541 637⎡
⎣⎢⎤⎦⎥
So exterior arc length (� � � �π( . ) . )
.
8 667 31 5 412 2
0 5⎡⎣ ⎤⎦
⎡⎣⎢⎢
⎤⎦⎥⎥
..637 ft
λ � � �
S
Si
o
39 025
41 6370 937
.
..
r
W�
�
λλ1
r
( . )( . )
.. .
0 937 0 667
1 0 9379 966 11 594
�� �ft 9 ft in
% error error�
��
10 521 9 966
10 521100 5 276
. .
.( ) . %
⎛
⎝⎜⎜⎜⎜
⎞
⎠⎟⎟⎟⎟
The fi nal product is shown in Figure 3.8 . The actual value of r used on the fl at plate cutout shown in Figure 3.7 was 10.521 ft.
CH003-H8766.indd 61CH003-H8766.indd 61 6/16/2008 3:12:18 PM6/16/2008 3:12:18 PM

Pressure Vessel and Stacks Field Repair Manual62
Damping Pads
The structural damping of a tower can be increased by the application of a damp-ing pad, as shown in Figure 3.9 . It consist of two components: one is a damping washer or pad between the anchor bolt and the chair plate; and the other is a large pad that f ts between the base plate and leveling, or shim, plate on top of the concrete foundation. There are several kinds of damping pads, each with its own damping characteristics. Normally, a damping pad consists of three layers: a top and bottom elastomer layer with a cork layer in the middle. Common elastomers used are silicone or nitrate, and normally are sold under trade names. Several com-panies make these pads; one is Fabreeka International in Boston, Massachusetts, and another is Tech Products Corporation (TRC) out of Dayton, Ohio.
(a)
(b)
FIGURE 3.8 Helical strakes fabricated using the method described in Example 3.2.
CH003-H8766.indd 62CH003-H8766.indd 62 6/16/2008 3:12:18 PM6/16/2008 3:12:18 PM

Dyn
amic R
espo
nse o
f Pressu
re Vessels and
Stacks
63
2
3
45
12
3
4
5
1
13
13
1
2
3
4
5
6
7
8
10
11
12
13
6
7
8
9
10
11
12
A
A
SECTION “A-A”
ANCHOR BOLT ROD
ANCHOR JAM NUT
ANCHOR HEAVY HEX NUT
MACHINE BOLT WASHER
DAMPING WASHER PAD
COMPRESSION RING
GUSSET PLATE
BASE PLATE
SHIM PLATE
9 DAMPING PAD
GROUT
CONCRETE FOUNDATION
STACK SHELL
FIGURE 3.9 Damping pad details.
CH
003-H8766.indd 63
CH
003-H8766.indd 63
6/16/2008 3:12:19 PM
6/16/2008 3:12:19 PM

Pressure Vessel and Stacks Field Repair Manual64
Several f acilities ha ve stacks e xhibiting e xcessive dynamic amplitudes; the addition of these pads does not al ways add to the e xisting damping of the stack. The pads are ef fective “ win ” situations where the e xisting damping is very lo w, resulting in a net increase in structural damping. Although some manufacturers of the pads claim higher damping v alues, the maximum should be only 2.0% of critical damping, as listed in Table 3.3 .
These pads are ine xpensive and are best used for a ne w stack. F or an existing operational stack, installation costs of these pads may be e xcessive. The disadvantages of these pads are (1) the y cannot withstand temperatures � 200°F and must be insulated from higher temperatures; (2) the pads may deteriorate when exposed to hydrocarbons; and (3) the pads may require main-tenance and inspection. If the pads ha ve deteriorated, their replacement may radically disrupt operations. Gunite linings are used to protect the pads from excessive temperatures or acids. These disadv antages must be considered at each site. If the increase in the structural damping of the stack still does not suff ce for vortex shedding, then FIV inhibitors such as helical strak es or oval-ing rings should be considered. We will cover ovaling rings next.
These damping pads are used for stacks mounted on concrete foundations. According to ASME STS-1, P aragraph 5.2.1(a) [2] , for steel stacks mounted on b uildings, the interaction ef fects of the b uilding need to be included. Generally, this involves modeling the building and stack together. When stacks are mounted on steel structures, such as e xhaust stacks, the steel structure and stack should be modeled together because the structure’ s stif fness will enter into the analysis.
Ovaling Rings
Placing metal rings on a stack can prevent dynamic amplitudes at higher mode shapes. The f rst tw o mode shapes are the stack in translation, retaining its
TABLE 3.3 Minimum Structural Plate Thickness and Maximum Stiffener Spacing
Inside Diameter, D (ft)
Minimum Structural Plate Thickness*
Maximum Stiffener Spacing, ft
D 3.5 0.125 5 D
3.5 � D 6.5 0.1875 3 D
6.5 � D 18.0 0.1875 2 D
D � 18.0 0.25 1½ D
*Note: Minimum plate thickness does not include corrosion allowance. If corrosion allowance is required, the minimum plate thickness will be increased by the magnitude of the corrosion allowance. (Reprinted from ASME STS-1-2006, by permission of the American Society of Mechanical Engineers.)
CH003-H8766.indd 64CH003-H8766.indd 64 6/16/2008 3:12:20 PM6/16/2008 3:12:20 PM

Dynamic Response of Pressure Vessels and Stacks 65
circular shape. The third and fourth mode shapes involve the transformation of the circular outline of the stack cross-section to an elliptical shape. At the f fth and sixth mode shapes, the stack cross-section e volves into a triangular shape. These last two mode shapes do not occur with e very stack because the y are a function of the stack’s diameter-to-thickness ratio (D/t). The occurrence of the higher mode shapes is kno wn as ovaling . The ovaling rings provide a redistri-bution of the mass of the stack, which can of fset the higher mode shapes. This can happen if the o valing rings are located properly . To analyze the ef fect of the rings, you must consider the mass and moment of inertia of the ring as a separate section in Rayleigh’ s method, as sho wn in Example 3-1 . The f nite element method allows you to quickly see mode shapes and optimize the ring locations.
The phenomenon of o valing is predominant with stacks. ASME STS-1, Paragraph 5.2.2(b) [2] , gives guidelines for o valing. For unlined steel stacks, the ovaling natural frequency is computed as follows:
f t
Do �680
2 (3.11)
where ASME STS-1 [2] def nes t � stack shell or liner wall thickness, inches D � diameter of stack at elevation under consideration
The critical wind velocity for ovaling is
v
f DSco
o�2
(3.12)
where S � Strouhal number , mentioned pre viously in Eq. 3.4 , usually tak en as 0.2 for single stacks and may v ary due to Re ynolds numbers and multiple stacks.
If v co is less than Vz , the mean hourly wind speed (ft/sec), the unlined stack should be reinforced with ring stiffeners meeting the requirements of Table 3.3 (Table 4.4.7 in ASME STS-1 [2] ) .
The required minimum section modulus of the ring stif fener, S s (in 3 ), with respect to the neutral axis of its cross-section parallel to the longitudinal axis of the stack, is as follows:
S
v D ls
s
a�
� �( . )( )2 52 10 3 2 2co
σ (3.13)
where l s � spacing between circumferential stif feners, determined as the sum of half
the distance to adjacent stif feners on either side of the stif fener under consideration (ft)
CH003-H8766.indd 65CH003-H8766.indd 65 6/16/2008 3:12:20 PM6/16/2008 3:12:20 PM

Pressure Vessel and Stacks Field Repair Manual66
σ a � 0.6 F y , where F y � specif ed minimum yield strength of the ring material at mean shell temperature, psi
In the area where helical strak es are attached to the stack, ring stif fen-ers may be omitted if you can pro ve that the helical strak es provide adequate stiffness.
Ovaling rings are used often as remediation de vices. They can be welded in during shutdo wns or turnarounds. Y ou can a void them in the design phase if you use thick er plates along the length of the stack using the criteria men-tioned previously.
GUY CABLES, REMEDIATION DEVICES, AND SUPPORT OF FLARE STACKS
Guy cables can be remediation devices to stabilize a dynamic unstable stack or process column, or as a b uilt-in design support mechanism for a tall and nar -row diameter stack. A f are stack is more in volved than other types of stacks because there are thermal gradients to complicate matters.
Determining the pre-tension required for guy cables on f are stacks is nec-essary for proper support. The method discussed here has been used in practice and is therefore tried and proven.
Flare stacks supported by guy cables are ubiquitous in use and seem quite innocuous to the untrained e ye. Ho wever, their f ailure during the f aring of a stack could ha ve dire consequences. This section is based on actual pre-tensioning cases that have proven to be successful.
This section concerns the static problem of guy wires. Experience has shown that if guy cables are properly tensioned, f ow-induced vibration (FIV), induced by vortex shedding, is of minimal concern. The reason is that the nat-ural frequency of the stack is well abo ve the resonant range. One reason for pre-tensioning the cables is to avoid FIV.
Wind loadings should be check ed with the appropriate wind standard or company standard. This section is based on a paper I [5] wrote while w ork-ing in Saudi Arabia. The compan y in Saudi Arabia check ed the wind loads at 100 mph, and the guy wires proved to be more than adequate.
The Basic Methodology
Flare stacks under go several thermal re gimes, hot and cold. If a cold liquid is f ared, and on entering the f are stack, the b urner tip does not ignite, then the entire stack can reach cold temperatures. As a consequence, the stack can shrink for a short time before the burner tip ignites. During this time, a steady-state thermal re gime is established. In this case, the cold temperatures w ould exist in the stack metal in a transient condition. When the f are tip ignites and burns, the temperature of the surroundings and the stack metal elevates. This is
CH003-H8766.indd 66CH003-H8766.indd 66 6/16/2008 3:12:20 PM6/16/2008 3:12:20 PM

Dynamic Response of Pressure Vessels and Stacks 67
a fact observed both in the f eld and by analytical studies. Of course, if a hot f uid enters the stack, the stack will increase in height.
The guy wires therefore must accommodate the various thermal conditions. ASTM SA-333 pipe material (3½ Ni—comparable to BS 3603 HF5503 LT100 CAT.2) is used for the stack. When cold, this material will not e xperience brit-tle fracture under wind loads. Ho wever, the use of this material does not mean that the stack is al ways cold when f aring. In man y instances, the f are metal temperature is hot and will e xperience thermal gro wth. Therefore, the f are must be designed for both cases.
Because the f are stack gets hot and grows in height, the cable has to incor-porate sag to accommodate stretching under tension. Figure 3.10 illustrates the general f are scheme with the guy wires.
The guy wire e xtends from the f are stack ring to the dead man position, forming the hypotenuse of a triangle with the f are stack and the ground. In the nonoperating position, this forms triangle A-B-C. As the f are stack heats up and grows, the distance from the guy cable support ring on the f are stack to
SAG
A�
A
A��
Grade
Thermalcontraction
Thermalexpansion
C B
FIGURE 3.10 Flare stack guy wire thermal mo vements. Points A, A � , and A are at the cable connection on the upper portion of the f are stack; Point C is at the base of the stack; and Point B is where the cable ties into the ground with a dead man . . . . The term “ dead man ” refers to an anchor in the ground that has suff cient rigidity to restrain the forces in the cables. T ypically they are concrete masses embedded in the ground.
CH003-H8766.indd 67CH003-H8766.indd 67 6/16/2008 3:12:20 PM6/16/2008 3:12:20 PM

Pressure Vessel and Stacks Field Repair Manual68
the dead man increases, making the guy cable stretch. This is shown as triangle A � -B-C. If the f are stack cools and contracts, the guy cable will shrink, shown as A -B-C. Because the guy wire is forced to stretch (or break) in the hot case (triangle A � -B�C), the cable incorporates sag to compensate for this movement. There is no sag required for the cold case as the guy cable decreases in length, since line A -C is shorter than A-C. Line A � -C is longer than line A-C and is the worst case for determining the sag. The actual conf guration is sho wn in Figure 3.11 .
The analytical e xpression for the sag of a uniformly loaded beam under tensile loads, shown in Figure 3.12 , is given by the following:
y wL
Pmax � �2
8 (3.14)
SA
G
SA
GS
AG
SA
G
SA
G
Target
26' 09' 44'
44' 09' 06'
Tran
sit
Tran
sit
Wor
k lin
e
Terminal R ‘deadman’ work line
El. 6.61m
W.P. '4' ClevisPin on Anchor rod
532
Bot of baseR El. 6.30 m
Work line
Chord between W.P.
½ Level span ½ Level span
Upperguy
Lowerguy
Chord between W.P.
'8'
'8'Work line El. 23.68 m
Work line El. 41.06 mPaint SAG scaleon scale R seenote step1
34510
Note: View perpendicular to plane of guy wires.
There are 3 sets of 2 guy cables 120° apart.
FIGURE 3.11 Flare stack guy cable details.
CH003-H8766.indd 68CH003-H8766.indd 68 6/16/2008 3:12:20 PM6/16/2008 3:12:20 PM

Dynamic Response of Pressure Vessels and Stacks 69
where y � in (mm) w � cable weight (lb m /in, kg/mm) L � cable length (in, mm) P � tensile force (lb f , N)
The minus sign in Eq. 3.14 indicates that the sag is in the ne gative direc-tion. As you can see from the equation, the amount of sag is in versely propor-tional to the tensile force, P . Thus, to theoretically have zero sag would require an inf nite amount of force. In practical terms, there will al ways be some sag. Solving for the tensile force and using a ne gative value for y max (downward direction), you obtain the following equation:
P wL
y�
2
8 max (3.15)
The amount of sag required depends on the magnitude of thermal e xpan-
sion of the stack. As stated earlier , if the stack e xpands upward, the cable is stretched. If the stack contracts, the cable shrinks in length. Thus, the stack expansion upward sets the amount of cable sag.
The equation for the def ection of a cable under its o wn weight is given by the catenary equation, written as follows:
Py w
wLP
�
�
( )( )
cosh
max
21
⎛⎝⎜⎜⎜
⎞⎠⎟⎟⎟⎟
⎡
⎣⎢⎢
⎤
⎦⎥⎥
(3.16)
It can be shown that for cables (see “ Supplement A ” ), Eq. 3.15 and Eq. 3.16
yield the same results, although each has a dif ferent basis of derivation. In the derivation of Eq. 3.16, a similar equation is developed for the arc length of the cable. This is important in establishing the relati ve inf uence of the thermal movements of the stack on the cable sag. The arc length of the cable is gi ven as follows:
S P
wwL
P� sinh
2⎛
⎝⎜⎜⎜
⎞
⎠⎟⎟⎟⎟
(3.17)
ymax
w (Ib/in) (kg/mm)
P P
I
FIGURE 3.12 Beam subjected to a uniform load with axial tensile load .
CH003-H8766.indd 69CH003-H8766.indd 69 6/16/2008 3:12:21 PM6/16/2008 3:12:21 PM

Pressure Vessel and Stacks Field Repair Manual70
Using Eq. 3.17, the length of the cable arc is seen to be almost identical to line A-B in Figure 3.10 . In the case of the stack in the f eld in Saudi Arabia, the distance A-B w as 1935.07 inches (49.15 m), and the arc length with a sag of 5.244 inches (133.2 mm; installed at 20°C) is 1935.10 inches (49.152 m): a mere 1/32 inch (0.79 mm) difference! This mak es more sense when you con-sider that the 133.2 mm sag is insignif cant compared to 49 m (1935.10 inches). Similarly, if the guy cables are installed at 0°C, the resulting sag is reduced to 4.7 inches (119.38 mm). The resulting tensile load is not greater than the pre-tension load (see “ Supplement B ” ); therefore, the change in sag is acceptable. With this result, it can be reasonably concluded that the cable sag is approxi-mately equal to the thermal mo vement of the stack. As the stack heats up, so do the guy cables from thermal radiation induced from the f ame exhaust from the f are tip. This is an important assumption because it simplif es the solu-tion process. For this reason, the y max parameter in Eq. 3.15 and Eq. 3.16 was selected to be equal to the sag. Thus, y max can be substituted for the parameter SAG . This is shown in the contractor’s drawing in Figure 3.11 .
The solution process be gins with calculating the thermal gro wth of the stack at each guy cable ring support. This thermal expansion is then substituted into Eq. 3.15 or Eq. 3.16 to calculate the corresponding tensile force, P . This was carried out with both equations, and the results v erif ed that the y yielded the same results. However, Eq. 3.16 is more awkward to use, since solving for P requires a trial-and-error process; whereas Eq. 3.15 is direct substitution. For this reason Eq. 3.15 is the basic equation to be used in this method. Ho wever, the use of Eq. 3.16 gives the required mathematical rigor in verifying the engi-neering mechanics of the problem. Its deri vation is simpler than Eq. 3.15 and is published in every elementary textbook on statistics.
To compute the f are stack thermal e xpansion, you compute the a verage temperature of the f are stack by taking the a verage of the temperature at the guy support ring and the temperature at the ground. This is carried out for each elevation of guy cables. T o do this, you use the temperature of the air at the time of tensioning to calculate the thermal e xpansion of the f are stack and, hence, the cable tension. Calculating the length of thermal expansion gives
SAG l L T� �Δ Δα ( ) in (mm) (3.18)
where Δ T � temperature at guy ring—temperature of air at cable tensioning α � coeff cient of thermal e xpansion at temperature of stack at guy support
ring (in/in � °F (mm/mm � °C).
Substituting Δ l � y max ( � SAG ) gives the following:
P wL
�2
8(SAG) (3.19)
CH003-H8766.indd 70CH003-H8766.indd 70 6/16/2008 3:12:21 PM6/16/2008 3:12:21 PM
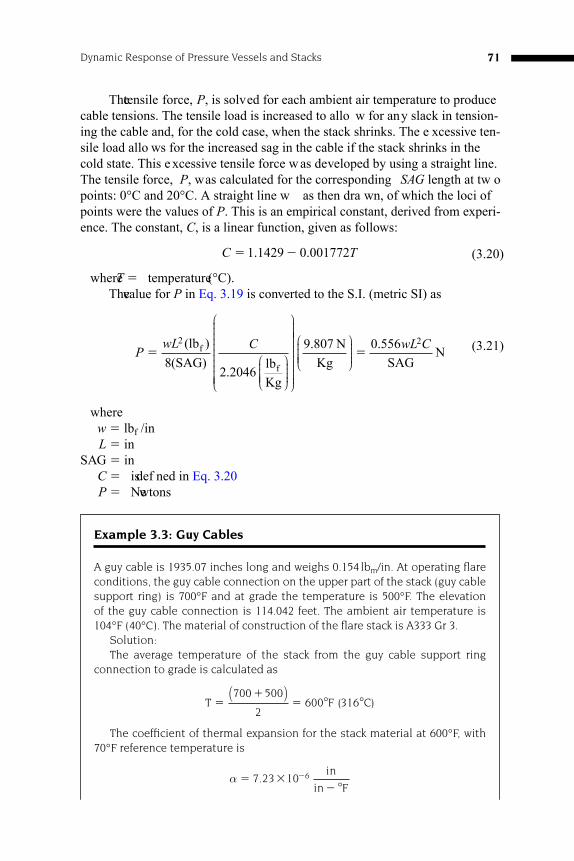
Dynamic Response of Pressure Vessels and Stacks 71
The tensile force, P , is solved for each ambient air temperature to produce cable tensions. The tensile load is increased to allo w for any slack in tension-ing the cable and, for the cold case, when the stack shrinks. The e xcessive ten-sile load allo ws for the increased sag in the cable if the stack shrinks in the cold state. This e xcessive tensile force w as developed by using a straight line. The tensile force, P , was calculated for the corresponding SAG length at tw o points: 0°C and 20°C. A straight line w as then dra wn, of which the loci of points were the values of P . This is an empirical constant, derived from experi-ence. The constant, C , is a linear function, given as follows:
C T� �1 1429 0 001772. . (3.20) where T � temperature (°C).
The value for P in Eq. 3.19 is converted to the S.I. (metric SI) as
PwL C
�2
82 2046
(lb )(SAG) lb
Kg
f
f.⎛
⎝⎜⎜⎜⎜
⎞
⎠⎟⎟⎟⎟
⎛
⎝
⎜⎜⎜⎜⎜⎜⎜⎜⎜⎜⎜⎜
⎞
⎠
⎟⎟⎟⎟⎟⎟⎟⎟⎟⎟⎟⎟⎟⎟
⎛
⎝⎜⎜⎜⎜
⎞
⎠⎟⎟⎟⎟
9.807 NKg SAG
N�0 556 2. wL C
(3.21)
where w � lb f /in L � in SAG � in C � is def ned in Eq. 3.20 P � Newtons
Example 3.3: Guy Cables
A guy cable is 1935.07 inches long and weighs 0.154 lb m /in. At operating fl are conditions, the guy cable connection on the upper part of the stack (guy cable support ring) is 700°F and at grade the temperature is 500°F. The elevation of the guy cable connection is 114.042 feet. The ambient air temperature is 104°F (40°C). The material of construction of the fl are stack is A333 Gr 3.
Solution: The average temperature of the stack from the guy cable support ring
connection to grade is calculated as
T F C�
��
700 500
2600 316
( )° ° ( )
The coeffi cient of thermal expansion for the stack material at 600°F, with
70°F reference temperature is
α � �
��7 23 10 6.
in
in °F
CH003-H8766.indd 71CH003-H8766.indd 71 6/16/2008 3:12:21 PM6/16/2008 3:12:21 PM

Pressure Vessel and Stacks Field Repair Manual72
Solving for the thermal expansion of the stack, you can calculate
Δ Δl l T
FF� � �
���α ( ) . ) ( . ( ) ( )(
in
in) in
in
ft7 23 10 114 04 12 600 706
°°
Δl � 5 244 133 2. .in mm( ) Since we are using 70°F (21°C) as the reference temperature, we must
compensate for the ambient air at 104°F (40°C). At 104°F the coeffi cient of thermal expansion of the cable material is 6.1396 � 10 � 6 in/in�°F. Solving for the expansion of the guy cable, you can calculate
Δ Δl l T
FF� � �
� �� ��α ( ) . ) ( . ) ( )(
in
inin 6 14 10 1935 07 104 706
Δl � 0 404. in The total sag for the cable considering thermal expansion is
SAG � � � �5 244 0 404 5 648 143 46. . . .in in in mm Now solving for C in Eq. 3.20, you have
C � � �1 1429 0 001772 20 1 1075. . ( ) . With total sag of 5.648 inches, the required tension in the guy cable is,
from Eq. 3.21, as follows:
P N� �
(0 556 0 154 1935 07 1 1075
5 64862869 20
2. )( . )( . ) ( . )
..
or P � 14132.996 lb f
This same process is repeated for ambient temperatures of 0°C, 10°C, 20°C, and 50°C—each representative for different seasons in Saudi Arabia.
Supplement A
The following is a comparison of Eq. 3.15 and Eq. 3.16. Setting both equations equal to each other
y w
wL
P
wL
ymax
maxcosh2
18
2
⎛
⎝⎜⎜⎜
⎞
⎠⎟⎟⎟⎟�
�
This equation results in the following:
cosh maxwL
P
y
L21 8
2⎛
⎝⎜⎜⎜⎜
⎞
⎠⎟⎟⎟⎟
⎛
⎝⎜⎜⎜⎜
⎞
⎠⎟⎟⎟⎟
� �
CH003-H8766.indd 72CH003-H8766.indd 72 6/16/2008 3:12:22 PM6/16/2008 3:12:22 PM

Dynamic Response of Pressure Vessels and Stacks 73
Substituting in values for the 20°C case, W � 0.154 lb m /in, L � 1935.07 in, P � 68943.21, N � 15498.338 lb f , you have
cosh .
wL
P21 0000462
⎛
⎝⎜⎜⎜⎜
⎞
⎠⎟⎟⎟⎟ �
1 8 1 0000588
2
� �y
Lmax .
⎛
⎝⎜⎜⎜⎜
⎞
⎠⎟⎟⎟⎟
Comparing these results with those of other installation temperatures, you can assume that Eq. 3.15 and Eq. 3.16 yield the same results for this application.
Supplement B
The purpose of this section is to solve for the tensile load and the result-ing sag for the case of thermal expansion that results in the cable extend-ing from 1935.07 inches to 1938.557 inches at the installation temperature of 0 o C.
Writing Eq. 3.15 and solving for P ,
P
wL
y�
2
8 max Substituting w � 0.154 lb m /in, L � 1938.557 in, you solve for a variable, Δ ,
such that
Δ � � � �
wL
yP
yP
2 2
8
0 154 1938 557
8max max
. ( . )
or
Δ � �
72341 562.
yP
max For Δ � 0, the theoretical solution is y max � 4.7 inches and P �
15391.8 lb f . Since P is less than the pre-tension load of 76396.53 N � 17,173.834 lb f , you can assume that the elongation of the cable has relatively no effect on the cable sag. The cable sag can be assumed to equal the ther-mal expansion of the fl are stack. This is the basis of that assumption.
Note: After the cables were installed at the location in Saudi Arabia, the fl are stack fl ared for 30 days nonstop.
CH003-H8766.indd 73CH003-H8766.indd 73 6/16/2008 3:12:22 PM6/16/2008 3:12:22 PM

Pressure Vessel and Stacks Field Repair Manual74
REFERENCES
1. Escoe , A. Keith , Mechanical Design of Process Systems, vol. 2 , 2nd edition, Gulf Publishing Company , Houston, Texas , 1995 .
2. ASME STS-1-2006, American Society of Mechanical Engineers, New York, NY, 2006. 3. Findlay , Matt , Improved Screening Criteria for the Prediction of Wind Induced Vibration of
Tall Process Vessels Arising from Recent Field Experience , ASME , New York, NY , November 2001 .
4. Thomas , G. B. , Calculus and Analytic Geometry , 3rd edition , Addison-Wesley Publishing Company, Inc., Reading, Massachusetts, U.S.A. , 1960 .
5. Escoe , A. Keith , Guyed Flare Stacks , Hydrocarbon Engineering , Farnham, Surrey, England , Sept., 1998 .
CH003-H8766.indd 74CH003-H8766.indd 74 6/16/2008 3:12:22 PM6/16/2008 3:12:22 PM

75
Chapter 4
Wind Loadings on Pressure Vessels and Stacks
This chapter considers wind loads as the y relate to f eld applications. This discussion is not intended to be for the wind design of problems; albeit, the material presented can be used in wind design. This chapter provides a generic guide to wind because, depending on the location of the f acility where the analysis is being performed, the wind codes may vary. Some areas do not have formal wind codes as such. Often the wind codes of other countries are applied in these locations—e ven though the wind isopleths are not applicable. Most often people estimate an appropriate wind speed and use the preferred code accordingly.
Wind and seismic codes change re gularly, and the trend is a shift to ward the use of the Load and Resistance F actor Design (LRFD) approach v ersus the Allowable Stress Design (ASD) basis. The Canadian codes ha ve done this, making their application to stacks and pressure v essels virtually impractical. Some of the bodies that produce the wind standards argue that their documents were ne ver intended for pressure v essels and stacks; their main concern is buildings and civil structures like bridges. This may lead to the development of a separate wind and seismic code for pressure vessels and stacks. However, for the present, we must use what is available.
The consideration of wind loads in a plant or operating f acility normally happens when a section of a to wer is to be stress-relie ved by post weld heat treatment and an entire shell portion of the v essel is to be heated to the stress-relieving temperature. In this application, you must be cognizant of the impos-ing wind loads on the v essel. Another application w ould be the installation of guy cables, as discussed in Chapter 3, and the loads on these cables. These situations are routine in plants. In the case of relie ving stress on a process col-umn, only the wind shear and bending moments at the location under consid-eration are of interest.
ASME STS-1 [1] follows the latest ASCE 7 standard series—presently ASCE 7-2005 [2] . We will de velop a general guideline of this standard that can be used throughout the w orld in v arious locations that do not ha ve wind codes. If you are located in a country that has such a standard, it is advised that you follow that document. Ho wever, for operational applications, the method-ology proposed here should be adequate.
CH004-H8766.indd 75CH004-H8766.indd 75 6/13/2008 7:37:44 AM6/13/2008 7:37:44 AM

Pressure Vessel and Stacks Field Repair Manual76
The general equation for the wind force imposed on a pressure v essel or columns is
F q GC Az f f� (lb or N)f (4.1)
where q z � velocity pressure at elevation of height z of the centroid of area Af G � gust-effect factor C f � force coeff cient A f � projected area normal to the wind
In this chapter we will discuss the terms in Eq. 4.1 and guidelines on their application.
THE VELOCITY PRESSURE DISTRIBUTION, qZ
The term q z is the velocity pressure and is evaluated at a height z. It is def ned as follows:
q K K K V Iz z zt d= 0 00256 2. (lb /ft )f
2
(4.2)
or
q K K K V I Vz z zt d�0 613 2. ;(N/m ) is in m/s2 (4.2a)
where K d � wind directionality factor K z � velocity pressure exposure coeff cient K zt � topographic factor
WIND DIRECTIONALITY FACTOR, K d
The wind directionality factor, K d , is def ned in Table 4.1 (Table 6.4 of ASCE 7-2005 [2] ).
TABLE 4.1 Wind Directionality Factor, Kd
Structure type—chimneys, tanks, and similar structures
Directionality factor, Kd
Square 0.90
Hexagonal 0.95
Round 0.95
(Courtesy of the American Society of Civil Engineers)
CH004-H8766.indd 76CH004-H8766.indd 76 6/13/2008 7:37:45 AM6/13/2008 7:37:45 AM

Wind Loadings on Pressure Vessels and Stacks 77
VELOCITY PRESSURE COEFFICIENT, K z
The velocity pressure coeff cient factor, K z , is determined from Table 4.2 (Table 6.3 of ASCE 7-2005 [2] ).
TABLE 4.2 Kz and Exposure Coeffi cients
Height above ground level, z Exposure category
ft m B C D
0–15 0–4.6 0.57 0.85 1.03
20 6.1 0.62 0.9 1.08
25 7.6 0.66 0.94 1.12
30 9.1 0.7 0.98 1.16
40 12.2 0.76 1.04 1.22
50 15.2 0.81 1.09 1.27
60 18 0.85 1.13 1.31
70 21.3 0.89 1.17 1.34
80 24.4 0.93 1.21 1.38
90 27.4 0.96 1.24 1.4
100 30.5 0.99 1.26 1.43
120 36.6 1.04 1.31 1.48
140 42.7 1.09 1.36 1.52
160 48.8 1.13 1.39 1.55
180 54.9 1.17 1.43 1.58
200 61 1.2 1.46 1.61
250 76.2 1.28 1.53 1.68
300 91.4 1.35 1.59 1.73
350 106.7 1.41 1.64 1.78
400 121.9 1.47 1.69 1.82
450 137.2 1.52 1.73 1.86
500 152.4 1.56 1.77 1.89
(Courtesy of the American Society of Civil Engineers)
CH004-H8766.indd 77CH004-H8766.indd 77 6/13/2008 7:37:45 AM6/13/2008 7:37:45 AM

Pressure Vessel and Stacks Field Repair Manual78
The velocity pressure coeff cient, K z , may be determined from the following:
For 15 ft � z � zg
K z
zzg
�2 01
2
.⎛
⎝
⎜⎜⎜⎜⎜
⎞
⎠
⎟⎟⎟⎟⎟
α
(4.3)
For z � 15 ft
K
zzg
�2 01 152
.⎛
⎝
⎜⎜⎜⎜⎜
⎞
⎠
⎟⎟⎟⎟⎟
α
(4.4)
The constants α and z g are tabulated in the U.S. Customary system in Table 4.3 and in the metric SI in Table 4.4 .
TOPOGRAPHIC FACTOR, Kzt
The topographic factor, K zt , is perhaps one of the most diff cult to def ne, espe-cially in remote locations. In remote locations in man y regions of the world, it would be undesirable to stak e out the terrain for man y reasons—safety, acces-sibility, ability to record changes in terrain. Paragraph 6.5.7.2 of ASCE 7-2005
TABLE 4.3 Terrain Exposure Constants
Exposure α zg (ft) Zmin (ft)
B 7.0 1200 30
C 9.5 900 15
D 11.5 700 7
(Courtesy of the American Society of Civil Engineers)
TABLE 4.4 Terrain Exposure Constants (Metric)
Exposure α z g (m) Z min (m)
B 7.0 365.76 9.14
C 9.5 274.32 4.57
D 11.5 213.36 2.13
(Courtesy of the American Society of Civil Engineers)
CH004-H8766.indd 78CH004-H8766.indd 78 6/13/2008 7:37:45 AM6/13/2008 7:37:45 AM

Wind Loadings on Pressure Vessels and Stacks 79
[2] states, “ If site conditions and locations of structures do not meet all the conditions specif ed in Section 6.5.7.1 then Kzt � 1.0. ” The wind exposure cat-egories are def ned in Paragraph 6.5.6.2 [2] as a function of the surf ace rough-ness, as follows:
Surface Roughness B: Urban and sub urban areas, w ooded areas or other terrain with numerous closely spaced obstructions ha ving the size of sin-gle-family dwellings or larger.
Surface Roughness C: Open terrain with scattered obstructions ha ving heights generally less than 30 ft (9.1 m). This category includes f at open country, grasslands, and all water surfaces in hurricane-prone regions.
Surface Roughness D: Flat, unobstructed areas and water surfaces outside hurricane-prone regions. This category includes smooth mud f ats, salt f ats, and unbroken ice.
If the topographic f actor def ned in P aragraph 6.5.7 [2] cannot adequately be determined, and if there is no specif cation, such as from a client, nor -mally it is adequate to be conserv ative on the Surface Roughness Category and use K zt � 1.0 in the f eld.
BASIC WIND SPEED, V
The basic wind speed, V , is often found in the isopleth charts of the gi ven wind code for a certain area. Where there is no such standard for the area concerned, you can use various readings and communication with the locals to f nd a conservative wind speed value. In desert re gions, sand storms, kno wn as shamals, can de velop and appear suddenly if there are no mass communication warnings from a weather station. Normally, a shamal can be seen approaching from a long distance, so there is some warning. Some shamals can reach hurricane-force winds, so you must use judgment if an area has a history and occurrence of these storms in desert regions.
IMPORTANCE FACTOR, I
For process columns and stacks, the importance f actor, I, is al ways made 1.0 because of the importance of the tower.
We have now discussed the terms for solving Eq. 4.2 . Now we turn our attention to solving Eq. 4.1.
GUST-EFFECT FACTOR, G
The gust-effect factor, G , is perhaps the most demanding parameter to calcu-late, and the results are nearly always in the same predictable range. Paragraph 6.5.8.1 of ASCE 7-2005 [2] def nes a rigid structure as one in which the struc-ture’s fundamental natural frequenc y is equal to or greater than 1 Hz. F or a rigid structure, G � 0.85. A f exible structure is one in which the fundamental
CH004-H8766.indd 79CH004-H8766.indd 79 6/13/2008 7:37:45 AM6/13/2008 7:37:45 AM

Pressure Vessel and Stacks Field Repair Manual80
natural frequency is less than 1 Hz. In this case, you must perform a v ery long algorithm to obtain G. Normally, G is seldom less than 1.4. If you are making a quick estimate and w ant to be conserv ative, a v alue of G � 1.5 will handle the vast majority of cases. This is a rule of thumb that can be helpful.
Solving for the Gust-Effect Factor, G
The equation for G is given in Paragraph 6.5.8.2 of ASCE 7-2005 [2] for f ex-ible or dynamically sensiti ve structures. This equation, listed as Eq. 6.8 in the standard, reads as follows:
GI g Q g R
g Ifz Q R
v z�
� �
�0 925
1 1 7
1 1 7
2 2 2 2
..
.
⎛
⎝
⎜⎜⎜⎜⎜⎜
⎞
⎠
⎟⎟⎟⎟⎟⎟⎟ (4.5)
where, in Eq. 4.1, G � G f for a f exible structure. The background response, Q , is given by the following:
QOD h
L z
�
��
1
1 0 630 63
..⎛
⎝⎜⎜⎜⎜
⎞
⎠⎟⎟⎟⎟⎟
(4.6)
where OD � vessel or stack outside diameter (ft) (denoted as B in ASCE 7-2005 [2] )
h � height of vessel or stack (ft)
L l z
z �33
⎛
⎝⎜⎜⎜
⎞
⎠⎟⎟⎟⎟
ε
(4.7)
where l and ε are given in the U.S. Customary system in Table 4.5 and in the metric SI in Table 4.6 ( taken from the ASME STS-1 2006 Table I.1 [1]) .
Setting f 1 � fundamental natural frequency of the tower (ASCE 7-2005 [2] uses n 1 ), V � basic wind speed, mph (m/s), in which 80 � V � 140 mph (some note as V ref ) .
ASCE 7-2005 [2] lists the following formulations to solve Eq. 4.5:
V b z Vz �
332215
⎛
⎝⎜⎜⎜
⎞
⎠⎟⎟⎟⎟
⎛
⎝⎜⎜⎜
⎞
⎠⎟⎟⎟⎟
α
(4.8)
CH004-H8766.indd 80CH004-H8766.indd 80 6/13/2008 7:37:45 AM6/13/2008 7:37:45 AM

Wind Loadings on Pressure Vessels and Stacks 81
R R R el h h� � � � �where ( )1 1
21
1 12
21η η
η (4.9)
R R R e Bl B B� � � � ��: 1 1
22 22
22η η
η(1 ), where OD
(4.10)
R R R el d d� � � � �where (1 )1 1
23 32
23η η
η (4.11)
where
η1
14 6�
. f hV z
(4.12)
η2
14 6�
. fVz
(OD) (4.13)
η3
14 6�
. f dV z
(4.14)
TABLE 4.5 Gust-Effect Parameters
Exposure l (ft) ε c α b
B 320 30 0.30 1/4.0 0.45
C 500 15 0.20 1/6.5 0.65
D 650 7 0.15 1/9.0 0.80
(Courtesy of the American Society of Civil Engineers)
TABLE 4.6 Gust-Effect Parameters (Metric)
Exposure l (m) ε c α b
B 97.54 9.14 0.30 1/4.0 0.45
C 152.4 4.57 0.20 1/6.5 0.65
D 198.12 2.13 0.15 1/9.0 0.80
(Courtesy of the American Society of Mechanical Engineers)
CH004-H8766.indd 81CH004-H8766.indd 81 6/13/2008 7:37:45 AM6/13/2008 7:37:45 AM

Pressure Vessel and Stacks Field Repair Manual82
where d � top one third of tower (see ASME STS-1 2006, p. 87 [1] )
N
f LV
z
z1
1� (4.15)
R
NNn �
�
7 471 10 3
1
15 3
.. /( )
(4.16)
R R R R Rn h B d� �
1 0 53 0 47β
⎛
⎝⎜⎜⎜⎜
⎞
⎠⎟⎟⎟⎟
( . . ) (4.17)
where β β�damping ratio → ≤ ≤0 002 0 004. . The intensity of turbulence at height z is Iz , where
I c
zz �33
16⎛
⎝⎜⎜⎜
⎞
⎠⎟⎟⎟⎟ (4.18)
where z h� 0 6. (4.19)
� the equivalent height of the tower
z z≥ min, where z min is listed in Tables 4.3 and 4.4 and c in Eq. 4.18 is listed in Tables 4.5 and 4.6
Now
g g gQ v� � �32 2 3 4
2.
sec; .ft
g f
fR � �2 Ln2 Ln
( ) .( )
3600 0 57736001
1 (4.20)
Now you ha ve the equations to solv e Eq. 4.5 . Paragraph 6.5.8.3 of ASCE
7-2005 [2] notes, “ In lieu of the procedure def ned in 6.5.8.1 and 6.5.8.2 [the above algorithms for solving for the gust-ef fect parameter], determination of the gust-effect factor by any rational analysis def ned in the recognized litera-ture is permitted. ” We have already gi ven rules of thumb for this parameter based on proven engineering practice.
THE PROJECTED AREA NORMAL TO THE WIND, Af
The f nal parameter to solv e for in Eq. 4.1 is the projected area normal to the wind, Af. Figure 4.1 shows the effective wind diameter for a process column.
CH004-H8766.indd 82CH004-H8766.indd 82 6/13/2008 7:37:46 AM6/13/2008 7:37:46 AM

Wind Loadings on Pressure Vessels and Stacks 83
DE
DE
DE
DE �
Pipe header
Platform
Ladder
Effective diameterof area resistingwind
FIGURE 4.1 The effective wind diameter can vary with height [3] .
As shown in the f gure, the ef fective wind diameter can v ary with height. Figure 4.2 shows the effective wind diameter of a conical section.
To calculate the parameter Af , you multiply DE by the length of the section. Now you have the tools to solve Eq. 4.1.
CH004-H8766.indd 83CH004-H8766.indd 83 6/13/2008 7:37:46 AM6/13/2008 7:37:46 AM

Pressu
re Vessel and
Stacks Field
Rep
air Man
ual
84
φ � Platform angle
φHP2
HPT
HC HLAD
DL
DE
WL
DP2DP1
WPL
HP1
Insulation OD
Insulation OD
FIGURE 4.2 Wind area for conical sections [3] .
CH
004-H8766.indd 84
CH
004-H8766.indd 84
6/13/2008 7:37:46 AM
6/13/2008 7:37:46 AM

Wind Loadings on Pressure Vessels and Stacks 85
EXAMPLE 4.1
In this example, a tower that has the same geometry as that in Example 3.1 is made of a different metallurgy and has a different weight distribution. Because of the metallurgy of the tower, any welding requires post weld heat treating (PWHT) of the section having hot work performed for an upcoming turnaround. When performing PWHT, you need to know the wind loads exerted on the subject tower section. The areas of repair will be determined by the turnaround team.
The facility is located on the Texas gulf coast, and the maximum expected basic wind speed during the PWHT is 85 mph, although the wind zone is 120 mph (for this example, do not expect to perform such an operation dur-ing a hurricane, so 85 mph is the maximum expected basic wind speed for analysis; the actual basic wind speed was 30 mph). This application is for an operations facility, not an engineering fi rm that is designing a tower for the worst possible conditions.
What you need is a chart of wind pressures and shear and bending moments for the turnaround.
The ASCE 7-2005 [2] parameters are as follows:
Wind force coeffi cient, C f � 0.7 Basic wind speed, V � 85 mph Importance factor, I � 1 Exposure category � C Wind Directionality Factor, K d � 0.95 Topographic Factor, K zt � 1.00
Vessel Characteristics: Vessel height, h � 80.4152 ft Vessel minimum diameter, b � OD � 2.0417 ft Corrosion allowance � 0 Fundamental Frequency � n 1 � f 1 � 0.9534 Hz Damping coeffi cient for operating condition, β � 0.0191
Basic Load Combinations for Allowable Stress Design (ASD) : D � H � W 0.6 D � H � W � 0.6 D � H � W
where
D � dead load H � Pressure load W � Wind load
Gust-Factor Calculations for the Operating Condition:
z h�
�
�
0 6
0 60 80 4152
48 2491
.
. .
.
( )
CH004-H8766.indd 85CH004-H8766.indd 85 6/13/2008 7:37:47 AM6/13/2008 7:37:47 AM

Pressure Vessel and Stacks Field Repair Manual86
I czz �
�
�
33
0 20033
48 2491
0 1877
16
16
⎛
⎝⎜⎜⎜⎜
⎞
⎠⎟⎟⎟⎟
⎛
⎝⎜⎜⎜⎜
⎞
⎠⎟⎟⎟⎟.
.
.
L lz
z � �
�
33500
48 2491
33
539 467
0 200⎛
⎝⎜⎜⎜⎜
⎞
⎠⎟⎟⎟⎟
⎛
⎝⎜⎜⎜⎜
⎞
⎠⎟⎟⎟⎟
ε.
.
.
33
Q
h OD
Lz
�
��
1
1 0 63
0 63
.
.⎛
⎝⎜⎜⎜⎜
⎞
⎠⎟⎟⎟⎟⎟
⎛
⎝
⎜⎜⎜⎜⎜⎜
⎞
⎠
⎟⎟⎟⎟⎟⎟⎟
Q�0 9156.
V bz
Vz �
�
33
88
60
0 650048 2491
33
⎛
⎝⎜⎜⎜⎜
⎞
⎠⎟⎟⎟⎟
⎛
⎝⎜⎜⎜⎜
⎞
⎠⎟⎟⎟⎟
⎛
⎝
α
ref
..⎜⎜⎜⎜⎜
⎞
⎠⎟⎟⎟⎟
⎛
⎝⎜⎜⎜⎜
⎞
⎠⎟⎟⎟⎟
0 1538
8588
6085 9102
.
( )
.�
N f
L
Vz
z1 1 0 9534
539 4673
85 91025� � �
⎛
⎝⎜⎜⎜⎜
⎞
⎠⎟⎟⎟⎟⎟
⎛
⎝⎜⎜⎜⎜
⎞
⎠⎟⎟⎟⎟.
.
...9867
RN
Nn �
��
�
7 465
1 10 302
7 465 5 9867
1 10 302 5 9867
1
1
53
53
.
.
. .
. .( )( )( )( )
�� 0 0452.
η1
14 60 4 60 0 9534 80 4152
85 91024 1050� � �
. . . .
..
f h
Vz
( )( )
R
n
e
n
eh
n
� ��
� ��
�� �1 1
2
1
4 1050
1
2 4 10500 2139
1
2
12
2 4 1050
2
1
. ( . ).
( . )
CH004-H8766.indd 86CH004-H8766.indd 86 6/13/2008 7:37:47 AM6/13/2008 7:37:47 AM

Wind Loadings on Pressure Vessels and Stacks 87
η2
14 60 4 60 0 9534 2 0417
85 91020 1042� � �
. . . .
..
f OD
Vz
( ) ( )( )
R
e eB � �
�� �
��
� �1 1
2
1
0 1042
1
2 0 10420 9340
2
2
22
2 0 1042
2
2
η η
η
. ( . ).
( . )
η3
115 40 15 40 0 9543 2 0417
85 91020 3489� � �
. . ( . )( . )
..
f d
Vz
R
e ed � �
�� �
��
� �1 1
2
1
0 3489
1
2 0 34890 8029
3
2
32
2 0 3489
2
3
η η
η
. ..
.( )
( )
R R R R Rn h B d� �
10 53 0 47
β
⎛
⎝⎜⎜⎜⎜
⎞
⎠⎟⎟⎟⎟
( ). .
R � �
1
0 01910 0452 0 2139 0 9340 0 53 0 47 0
.( . )( . )( . )( . . ( .
⎛
⎝⎜⎜⎜⎜
⎞
⎠⎟⎟⎟⎟ 88029 0 4286)) .�
g f
fR � �2 3600
0 577
2 36001
1
LnLn
( ).
( )
gR � � �2 3600 0 9534
0 577
2 3600 0 95344 1781Ln
Ln( ( . ))
.
( ( . )).
G
I g Q g R
g Ifz R
v z
�� �
�
0 925 1 1 7
1 1 7
2 2 2 2. ( . )
( . )Q
Gf �
� �
�
0 925 1 1 7 0 1877 3 40 0 8383 4 1781 0 4286
1 1
2 2. . . . . . .( ) ( ) ( ) ( )
(
( ).. . .
.7 3 40 0 1877
1 0303( )( ))
�
CH004-H8766.indd 87CH004-H8766.indd 87 6/13/2008 7:37:47 AM6/13/2008 7:37:47 AM

Pressure Vessel and Stacks Field Repair Manual88
Wind Pressure Calculations:
K
z
z
zz
g
� �2 01 2 01900
20 2105
. ..⎛
⎝
⎜⎜⎜⎜⎜
⎞
⎠
⎟⎟⎟⎟⎟
⎛
⎝⎜⎜⎜⎜
⎞
⎠⎟⎟⎟⎟
α
q K K K V I Kz z zt d z� �0 00256 0 00256 1 0 0 950 85 0 1 02 2. . ( . )( . )( . ) ( . )
WP q G Cz f f� Minimum of
lb
ftf2
10⎛
⎝⎜⎜⎜⎜
⎞
⎠⎟⎟⎟⎟
WP q qz z� �1 0303 0 7 0 7212. . .( )( )
Table 4.7 lists the wind pressures for the job site Table 4.8 shows the wind loadings that the turnaround team requested.
From this table, you can quickly determine the stresses imposed by the wind when the proper areas of repair and PWHT are determined.
TABLE 4.7 Wind Pressures
Height Z (ft) Kz qz (psf) WP: Operating (psf)
15.0 0.8489 14.92 10.76
20.0 0.9019 15.85 11.43
25.0 0.9453 16.61 11.98
30.0 0.9823 17.26 12.45
40.0 1.0436 18.34 13.22
50.0 1.0938 19.22 13.86
60.0 1.1366 19.97 14.40
70.0 1.1741 20.63 14.88
80.0 1.2075 21.22 15.30
90.0 1.2379 21.75 15.69
CH004-H8766.indd 88CH004-H8766.indd 88 6/13/2008 7:37:47 AM6/13/2008 7:37:47 AM

Win
d L
oad
ings o
n P
ressure Vessels an
d S
tacks89
TABLE 4.8 Wind Loadings and Defl ection Report
Component Elevation from above Base (in)
Effective OD (ft)
Elastic modulus E(106) psi Inertia (ft4)
Total wind Shear at Bottom (lbf)
Bending Moment at Bottom (ft-lbf)
Defl ection at top (in)
Ellipsoidal Head
953.67 3.07 29.0 * 36.54 14.97 2.2417
Cylinder #1 791.67 3.05 29.0 0.2834 661.82 4753.67 2.1984
Transition #1 779.67 2.57 29.0 * 700.06 5435.85 1.5800
Cylinder #2 575.67 2.04 29.0 0.0675 1202.15 21651.48 1.5344
Cylinder #3 455.67 2.06 29.0 0.1029 1485.19 35099.30 0.8221
Cylinder #4 359.67 2.08 29.0 0.1393 1705.39 47862.49 0.4954
Cylinder #5 263.67 2.10 29.0 0.1769 1911.91 62339.17 0.2937
Transition #2 146.05 2.39 29.0 * 2159.39 82186.05 0.1480
Cylinder #6 39.70 2.67 29.0 0.5648 2388.89 102242.47 0.0465
Ellipsoidal Head #4 (top)
35.00 2.64 29.0 * 2399.90 103180.23 0.0044
Support Skirt 0.00 2.61 29.3 0.3765 2481.94 110299.57 0.0035
CH
004-H8766.indd 89
CH
004-H8766.indd 89
6/13/2008 7:37:48 AM
6/13/2008 7:37:48 AM

Pressure Vessel and Stacks Field Repair Manual90
REFERENCES
1. ASME STS-1-2006 , American Society of Mechanical Engineers, 2006, New York, NY. 2. ASCE, American Society of Civil Engineers, ASCE 7-2005, Minimum Design Loads for
Buildings and Other Structures , New York, NY, 2005. 3. Escoe, A. Keith, Mechanical Design of Process Systems, vol. 1, 2nd edition. Gulf Publishing
Company , Houston, Texas , 1995 .
CH004-H8766.indd 90CH004-H8766.indd 90 6/13/2008 7:37:48 AM6/13/2008 7:37:48 AM

91
Chapter 5
Pressure Vessel Internal Assessment
The internals of pressure vessels are what make the vessels work. The process-ing of f uids is the inte gral function of these pressure v essels. As a result, the failure of internals af fects the performance of an y operating f acility. The con-sequence of such f ailures normally results in unscheduled shutdo wns, depend-ing on the se verity of the damage. Not much has been written on this subject because people do not w ant to admit to such f ailures—let alone adv ertise the event. Thus, this chapter was diff cult to write but is based on actual cases. This chapter does not address the design of internals, but rather the assessment of the mechanisms that cause f ailures of internals. The most common f ailure of the internals of pressure v essels is f atigue. Figure 5.1 shows a f atigue failure that initiated the collapse of the internals of an MTBR Regenerator air distributor.
The failure shown in Figure 5.1 involved more than just f atigue alone. In a large f uidized bed, pulsation of the internal f uids initiates strong and rapidly changing forces. F or such services, the internals must be designed adequately
FIGURE 5.1 The collapse of internals of an MTBR Regenerator air distributor.
CH005-H8766.indd 91CH005-H8766.indd 91 6/13/2008 7:49:57 AM6/13/2008 7:49:57 AM

Pressure Vessel and Stacks Field Repair Manual92
for these conditions. In this f ailure, the large pulsation responses throughout the f uidized bed ripped out trays and other internals, and the y were piled up at the bottom of the vessel.
Figure 5.2 shows air distributor piping in this scenario. Figure 5.3 provides a closer vie w of the f atigue failure. Here, a f atigue crack initiated in a gusset plate attachment set up the f atigue crack that propagated and allo wed the air distributor pipe to break completely.
FIGURE 5.2 Air distributor piping.
FIGURE 5.3 Gusset plate attachment.
CH005-H8766.indd 92CH005-H8766.indd 92 6/13/2008 7:49:57 AM6/13/2008 7:49:57 AM

Pressure Vessel Internal Assessment 93
The f atigue crack in the gusset plate attachment resulted in lar ge stress concentrations. W ith a highly c yclic service, the f atigue crack initiated and resulted in the e ventual f ailure of the air distrib utor pipe. The use of abrupt geometric boundaries on surfaces is not good practice in cyclic service because of stress intensif cation.
The effect of the lar ge pulsation forces is graphically sho wn in Figure 5.4 . The bent channels and w arped sections resulted from the po werful pressure pulsations extending up and down the regenerator.
The only member of this v essel left standing upright is the center pipe shown on the f ar right in Figure 5.4 . Everything attached to this center pipe was ripped loose—including the thermowells on the walls.
Figure 5.5 shows w arped reinforcing sections, a result of the forces described in the preceding paragraphs.
Regarding the f gures shown here, there w as argument between the parent company and consultants as to what initiated such f ailures. The parent com-pany thought that thermal gradients were the root cause; ho wever, lab tests conf rmed the failure shown in Figure 5.3 was due to fatigue.
During the reb uild, for ged f ttings with smooth surf ace contours and self-reinforced nozzle designed for a c yclic surface, as sho wn in Figure 5.6 , replaced gusset plates shown in Figures 5.2 and 5.3 .
FORCES ON INTERNAL COMPONENTS
Forces exerted on internal components can be controlled with proper opera-tional procedures. Ho wever, if procedures are violated and/or mistak es are made, such internal forces can be multiplied in magnitude.
FIGURE 5.4 Bent and warped channel sections.
CH005-H8766.indd 93CH005-H8766.indd 93 6/13/2008 7:49:58 AM6/13/2008 7:49:58 AM

Pressure Vessel and Stacks Field Repair Manual94
FIGURE 5.5 Warped reinforcing members.
Welds directly into header orvessel for total integral typeconstruction.
Butt-Weld for ease of NDT orin-service inspection.
FIGURE 5.6 Forged f tting designed for c yclic service w as an inte gral part of the reb uild and withstood the pulsation pressure forces (courtesy of WFI International, Inc.).
As you can see in the pre vious f gures, f uid forces acting on internals can be enormous. T ypically, column internals are designed to accommodate the weight of at least one man, depending on the diameter of the column. A typical value would be a do wnward force of 1000 Ne wtons. The weight of f uid on trays in a column w ould be equi valent to twice the weir height with
CH005-H8766.indd 94CH005-H8766.indd 94 6/13/2008 7:49:59 AM6/13/2008 7:49:59 AM

Pressure Vessel Internal Assessment 95
a stipulated minimum hydrostatic weight per unit area of the trays. A typical minimum value would be 1 KPa (0.001 MPa) or 0.145 psi. The upward and downward pressures induced by the process conditions must be stipulated by the process engineers or licensor . Typical v alues for upw ard and do wnward pressures would be approximately 2 KPa.
The def ection of sieve, valve, grid, and bubble trap trays is held to a mini-mum to minimize disruption of the process. One typical v alue is 1/800 times the column diameter with a maximum of 6 mm.
In f uidized bed reactors and re generators, the magnitude of compressed gas pressure varies whether the compression is made slo wly or rapidly. A gas that is compressed slo wly such that the pressure rises uniformly in a con-trol v olume is kno wn as slow , or spatially uniform , compression . A rapidly compressed gas, such as by a rapid piston motion, is kno wn as propagative compression . Figure 5.7 shows the schematics of both spatially uniform and propagative compression.
Slow (spatially uniform) compression
Pi Vi
P V
Rapid (propagative) compression
Shock
Ps Pi
P
FIGURE 5.7 Comparison of spatially uniform compression to propagative compression.
CH005-H8766.indd 95CH005-H8766.indd 95 6/13/2008 7:49:59 AM6/13/2008 7:49:59 AM

Pressure Vessel and Stacks Field Repair Manual96
Moody [1] has shown that, for a gas to be compressed slowly so that its pressure rises uniformly in a c ylinder, the compressed pressure is 43% of the pressure obtained by rapid, or propagati ve, pressure. Referring to Figure 5.7 , the f nal pressure of the gas for each case, you consider the following parameters:
k � 1.4 � gas ratio of specif c heats
VVi
�12
Pi � 1.0 atmosphere Ps � 10 atmospheres F � PA
For spatially uniform compression, the amount of work done is
dW Fdx PAdx PdV
kd PVk � � � � �
�
11
( )
The last term is the change in internal energy, where
dU
kd PV�
�
11
( )
Now,
dPP
k dVVP
P
V
V
i i∫ ∫� �
PP
VVi
ik
� � �⎛
⎝⎜⎜⎜⎜
⎞
⎠⎟⎟⎟⎟ (2)1 4 2 6. .
Likewise, for rapid, or propagati ve, compression, you ha ve the follo wing: Fs � PsA
dW F dx P Adx P dV
kd PVk s s s� � � �
�
11
( )
where
dU
kd PV�
�
11
( )
CH005-H8766.indd 96CH005-H8766.indd 96 6/13/2008 7:50:00 AM6/13/2008 7:50:00 AM

Pressure Vessel Internal Assessment 97
Now,
dPP k P
dVVsP
P
V
V
� �� �
( )i i1∫ ∫
PP
VV
kPP
VVi i
s
i
i� � � �( 1 1)⎛
⎝⎜⎜⎜⎜
⎞
⎠⎟⎟⎟⎟
PPi
� � � �2 1 4 1 10 2 1 6( ( (. ) ) )−
Thus, you can see that the propagati ve compression results in a f nal pres-sure are 2.3 times that produced by spatially uniform compression. There is the added effect of shock with propagati ve compression that can enhance forces exerted on internal vessel components.
LINED PLATES AND INTERNAL COMPONENTS
Vessels are lined with another material to pro vide corrosion resistance. The lining we are addressing here is metal clad plates. These plates ha ve the fol-lowing features:
1. Weld overlaid. 2. They are integrally clad by explosion welding. 3. They are produced from a roll-bonded integrally clad plate by forming into
a cylinder and welding.
In a vessel’s operating life, there will be shutdowns and startups. During each of these cycles, the base metal and clad will e xperience different thermal move-ments, resulting in shear stresses. These stresses v ary as to the relati ve coeff -cient of thermal expansion of the two metals. This phenomenon can be analyzed through fatigue analysis, which we will not go into here. The only justif cation for such an analysis is if man y shutdown and startup cycles are expected, result-ing in cyclic service. The vast majority of time this phenomenon is not a concern in the operating unit.
Most licensors of v arious processes ha ve limitations on loadings on clad metal surfaces. A typical requirement is to limit a structural support welded to a clad surf ace to 13 mm in thickness, with a maximum stress induced by the loading to 34.48 MPa (5 ksi).
CH005-H8766.indd 97CH005-H8766.indd 97 6/13/2008 7:50:00 AM6/13/2008 7:50:00 AM

Pressure Vessel and Stacks Field Repair Manual98
HELPFUL STRUCTURAL FORMULATIONS
The following are formulations for various structural attachments.
Tray Support Ring
Figure 5.8 illustrates a tray support ring. The required thickness and resulting def ection of the support ring are deri ved from Roark [2] . These equations are based on the material ha ving a Poisson ratio of 1/3. F or more comprehensi ve equations, including a different Poisson ratio, refer to Roark [2] . The tray sup-port ring thickness equation and the maximum def ection equations at the ring center are as follows:
t
r wS
ra
MS
ba br
o
r
o
r� � �
�
32
1 182
2
2
2
2 2
⎛
⎝⎜⎜⎜⎜
⎞
⎠⎟⎟⎟⎟
⎛
⎝⎜⎜⎜⎜
⎞
⎠⎟⎟⎟⎟ (5.1)
where, t r � required support ring thickness, not including corrosion allo wance, in,
mm a , b , r o are def ned in Figure 5.8 S r � allowable stress at temperature, psi (MPa) w � Force per unit length at a point on the ring. Sho wn on the right side of
Figure 5.8 is the axisymmetric representation of the support ring, lb f /in (N/mm).
M
wrLN a
rra
� � �o
o
o
62 1
2
2
⎛
⎝⎜⎜⎜⎜
⎞
⎠⎟⎟⎟⎟⎟
⎡
⎣
⎢⎢⎢
⎤
⎦
⎥⎥⎥ (5.2)
a
bb
w wro
a
FIGURE 5.8 Tray support ring .
CH005-H8766.indd 98CH005-H8766.indd 98 6/13/2008 7:50:00 AM6/13/2008 7:50:00 AM

Pressure Vessel Internal Assessment 99
Support Clip Welded on Two Sides with Fillet Welds with Force on Short End
A welded clip is illustrated in Figure 5.9 . The weld stresses are as follows:
σmax
. ,�4 24
2Pe
hLpsi (MPa) (5.3)
τavg psi MPa) Average shear stress in weld�
0 707. , (PhL
— (5.4)
From the von Mises theory, the combined stress is
σ σ τc � �max2 23 (5.5)
Hicks [4] recommends the following for computing weld stresses:
σ β σ τc � �max2 23 (5.6)
where 0.8 � β � 0.9.
P
b
h
e
L
FIGURE 5.9 Support clip welded on two sides with f llet welds; see Giachino et al. [3].
CH005-H8766.indd 99CH005-H8766.indd 99 6/13/2008 7:50:00 AM6/13/2008 7:50:00 AM
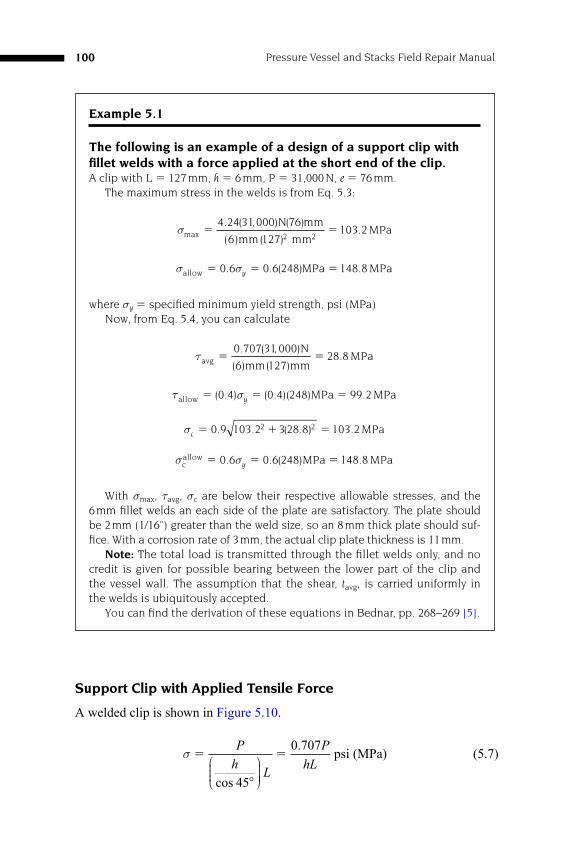
Pressure Vessel and Stacks Field Repair Manual100
Example 5.1
The following is an example of a design of a support clip with fi llet welds with a force applied at the short end of the clip. A clip with L � 127 mm, h � 6 mm, P � 31,000 N, e � 76 mm.
The maximum stress in the welds is from Eq. 5.3:
σmax
. , ).� �
4 24 31 000 76
127103 2
2 2
( ) ( mm
(6)mm( ) mmMPa
N
σ σallow ( MPa MPa� � �0 6 0 6 248 148 8. . ) .y
where σ y � specifi ed minimum yield strength, psi (MPa) Now, from Eq. 5.4, you can calculate
τavg
( )
( )mm( )mmMPa� �
0 707 31 000
6 12728 8
. ,.
N
τ σallow ( ) ( )( )MPa MPa� � �0 4 0 4 248 99 2. . .y
σc � � �0 9 103 2 3 28 8 103 22 2. . . .( ) MPa
σ σcallow ( )MPa MPa� � �0 6 0 6 248 148 8. . .y
With σ max , τ avg, σ c are below their respective allowable stresses, and the 6 mm fi llet welds an each side of the plate are satisfactory. The plate should be 2 mm (1/16 ” ) greater than the weld size, so an 8 mm thick plate should suf-fi ce. With a corrosion rate of 3 mm, the actual clip plate thickness is 11 mm.
Note: The total load is transmitted through the fi llet welds only, and no credit is given for possible bearing between the lower part of the clip and the vessel wall. The assumption that the shear, t avg , is carried uniformly in the welds is ubiquitously accepted.
You can fi nd the derivation of these equations in Bednar, pp. 268–269 [5] .
Support Clip with Applied Tensile Force
A welded clip is shown in Figure 5.10 .
σ �
�
�P
h L
PhL
cos
.
45
0 707⎛⎝⎜⎜⎜
⎞⎠⎟⎟⎟⎟
psi (MPa) (5.7)
CH005-H8766.indd 100CH005-H8766.indd 100 6/13/2008 7:50:00 AM6/13/2008 7:50:00 AM

Pressure Vessel Internal Assessment 101
where
the weld throat size, t h�
�cos 45 in (mm) for each f llet weld
h � leg size of the f llet weld, in (mm)
See the note in the preceding section. Also, for the derivation of these equa-tions, see Bednar, pp. 268–269 [5] .
Support Clip with Out-of-Plane Bending Moment
A support clip with an out-of-plane bending moment is shown in Figure 5.11 .
σ �
�
1 414. MhL b h
yy
( ) psi (MPa) (5.8)
Support Clip with an In-Plane Bending Moment
A support clip with an in-plane bending moment is shown in Figure 5.12 .
σ �
4 242
. MhL
zz psi (MPa) (5.9)
h
P
b
L
FIGURE 5.10 Support clip with applied tensile force; see Giachino et al. [3].
CH005-H8766.indd 101CH005-H8766.indd 101 6/13/2008 7:50:01 AM6/13/2008 7:50:01 AM

Pressure Vessel and Stacks Field Repair Manual102
h
b
L y
y
y
x
Myy
z
FIGURE 5.11 Support clip with an out-of-plane bending moment, M yy ; see Giachino et al. [3] .
Support Clip with Continuous Fillet Weld with an Out-of-Plane Bending Moment, M yy
A support clip with continuous f llet weld with an out-of-plane bending moment is shown in Figure 5.13 .
σ �
� �
4 24
32
. M
h b L b hyy
( ) psi (MPa)
⎡⎣⎢
⎤⎦⎥
(5.10)
Support Clip with Continuous Fillet Weld with an In-Plane Bending Moment, M zz
A support clip with continuous f llet weld with an in-plane bending moment is shown in Figure 5.14 .
σ �
� �
4 2432
. Mh L b L h
zz
( ) psi (MPa)
⎡⎣⎢
⎤⎦⎥
(5.11)
CH005-H8766.indd 102CH005-H8766.indd 102 6/13/2008 7:50:01 AM6/13/2008 7:50:01 AM

Pressure Vessel Internal Assessment 103
hy
b
L
x
Mzzz
z
z
FIGURE 5.12 Support clip with an in-plane bending moment, M zz ; see Giachino et al. [3].
h
x
z
Myy
b
y
L
FIGURE 5.13 Support clip with continuous f llet weld with an out-of-plane bending moment, M yy ; see Giachino et al. [3] .
CH005-H8766.indd 103CH005-H8766.indd 103 6/13/2008 7:50:01 AM6/13/2008 7:50:01 AM

Pressure Vessel and Stacks Field Repair Manual104
h
x
z
b
y
L
Mzz
FIGURE 5.14 Support clip with continuous f llet weld with an in-plane bending moment, M zz ; see Giachino et al. [3].
Example 5.2
An example illustrating the design of a support clip with continuous fi llet weld with an in-plane bending moment. A support clip has an in-plane bending moment of 50 kNM. The clip has the following parameters:
L � 300 mm; b � 120 mm; weld size � t � 5 mm Now, M � 50 KNm � 50,000 Nm
h
t�
��
��
cos cos.
45
5
457 071
mmmm
Using Eq. 5.11, you can calculate
σ �
�
4 24 50 0 01000
7 071 300 3120 302
.
. ) ( )(
( , 0 )Nmmm
m
( mm[
⎛
⎝⎜⎜⎜
⎞
⎠⎟⎟⎟⎟
00 7 071149 5
2��
. ].
mmMPa
Hicks, p. 87−88 [4] , has a more comprehensive solution. However, the preceding equation is much simpler and very accurate.
CH005-H8766.indd 104CH005-H8766.indd 104 6/13/2008 7:50:02 AM6/13/2008 7:50:02 AM

Pressu
re Vessel Intern
al Assessm
ent
10
5
TABLE 5.1 Wire and Sheet-Metal Gauges (Diameters and thickness values are in decimals of an inch)
Gauge No.
American wire
gauge, or Brown
and Sharpe (for
copper wire)
Steel wire gauge, or
Washburn and Moen
or Roebling (for steel
wire)
Birmingham wire
gauge (B.W.G.)
(for steel wire or
sheets)
Stubs steel
wire gauge
U.S. standard gauge
for sheet metal (iron
and steel) 480 lb per
cu ft
AISI inch
equivalent for
U.S. steel sheet
thickness
0000000 0.4900 0.500
000000 0.4615 0.469
00000 0.4305 0.438
0000 0.460 0.3938 0.464 0.406
000 0.410 0.3625 0.425 0.375
00 0.365 0.3310 0.380 0.344
0 0.325 0.3065 0.340 0.312
1 0.289 0.2830 0.300 0.227 0.281
2 0.258 0.2625 0.284 0.219 0.266
3 0.229 0.2437 0.259 0.212 0.250 0.2391
4 0.204 0.2253 0.238 0.207 0.234 0.2242
5 0.182 0.2070 0.220 0.204 0.219 0.2092
6 0.162 0.1920 0.203 0.201 0.203 0.1943
7 0.144 0.1770 0.180 0.199 0.188 0.1793
(continued)
CH
005-H8766.indd 105
CH
005-H8766.indd 105
6/13/2008 7:50:02 AM
6/13/2008 7:50:02 AM

Pressu
re Vessel and
Stacks Field
Rep
air Man
ual
106
TABLE 5.1 Continued
Gauge No.
American wire gauge, or Brown and Sharpe (for copper wire)
Steel wire gauge, or Washburn and Moen or Roebling (for steel wire)
Birmingham wire gauge (B.W.G.) (for steel wire or sheets)
Stubs steel wire gauge
U.S. standard gauge for sheet metal (iron and steel) 480 lb per cu ft
AISI inch equivalent for U.S. steel sheet thickness
8 0.128 0.1620 0.165 0.197 0.172 0.1644
9 0.114 0.1483 0.148 0.194 0.156 0.1495
10 0.102 0.1350 0.134 0.191 0.141 0.1345
11 0.091 0.1205 0.120 0.188 0.125 0.1196
12 0.081 0.1055 0.109 0.185 0.109 0.1046
13 0.072 0.0915 0.095 0.182 0.094 0.0897
14 0.064 0.0800 0.083 0.180 0.078 0.0747
15 0.057 0.0720 0.072 0.178 0.070 0.0673
16 0.051 0.0625 0.065 0.175 0.062 0.0598
17 0.045 0.0540 0.058 0.172 0.056 0.0538
18 0.040 0.0475 0.049 0.168 0.050 0.0478
19 0.036 0.0410 0.042 0.164 0.0438 0.0418
20 0.032 0.0348 0.035 0.161 0.0375 0.0359
21 0.0285 0.0317 0.032 0.157 0.0344 0.0329
CH
005-H8766.indd 106
CH
005-H8766.indd 106
6/13/2008 7:50:02 AM
6/13/2008 7:50:02 AM

Pressu
re Vessel Intern
al Assessm
ent
10
7(continued)
22 0.0253 0.0286 0.028 0.155 0.0312 0.0299
23 0.0226 0.0258 0.025 0.153 0.0281 0.0269
24 0.0201 0.0230 0.022 0.151 0.0250 0.0239
25 0.0179 0.0204 0.020 0.148 0.0219 0.0209
26 0.0159 0.0181 0.018 0.146 0.0188 0.0179
27 0.0142 0.0173 0.016 0.143 0.0172 0.0164
28 0.0126 0.0162 0.014 0.139 0.0156 0.0149
29 0.0113 0.0150 0.013 0.134 0.0141 0.0135
30 0.0100 0.0140 0.012 0.127 0.0125 0.0120
31 0.0089 0.0132 0.010 0.120 0.0109 0.0105
32 0.0080 0.0128 0.009 0.115 0.0102 0.0097
33 0.0071 0.0118 0.008 0.112 0.0094 0.0090
34 0.0063 0.0104 0.007 0.110 0.0086 0.0082
35 0.0056 0.0095 0.005 0.108 0.0078 0.0075
36 0.0050 0.0090 0.004 0.106 0.0070 0.0067
37 0.0045 0.0085 0.103 0.0066 0.0064
38 0.0040 0.0080 0.101 0.0062 0.0060
39 0.0035 0.0075 0.099
CH
005-H8766.indd 107
CH
005-H8766.indd 107
6/13/2008 7:50:02 AM
6/13/2008 7:50:02 AM

Pressu
re Vessel and
Stacks Field
Rep
air Man
ual
108
TABLE 5.1 Continued
Gauge No.
American wire gauge, or Brown and Sharpe (for copper wire)
Steel wire gauge, or Washburn and Moen or Roebling (for steel wire)
Birmingham wire gauge (B.W.G.) (for steel wire or sheets)
Stubs steel wire gauge
U.S. standard gauge for sheet metal (iron and steel) 480 lb per cu ft
AISI inch equivalent for U.S. steel sheet thickness
40 0.0031 0.0070 0.097
41 0.0066 0.095
42 0.0062 0.092
43 0.0060 0.088
44 0.0058 0.085
45 0.0055 0.081
46 0.0052 0.079
47 0.0050 0.077
48 0.0048 0.075
49 0.0046 0.072
50 0.0044 0.069
CH
005-H8766.indd 108
CH
005-H8766.indd 108
6/13/2008 7:50:02 AM
6/13/2008 7:50:02 AM

Pressure Vessel Internal Assessment 109
INTERNAL EXPANSION JOINTS
Internal e xpansion joints are used to accommodate dif ferential e xpansion of vessel components. The most common type of e xpansion joint used in pres-sure vessels is bellows expansion joints. These joints are normally thin-walled, with a normal minimum w all of 1/16 ̋ (1.5 mm). When these devices are used, there should be a contingenc y plan for accessing them when the y fail. Most bellows expansion joints have a life span of 10–11 years. If a bello ws expan-sion joint is located in a space with no access, then the shell w all must be cut open, which results in labor -intensive and complex repairs that require a lar ge number of man hours. Access space in the e xpansion joint enclosure must be designed for personnel to perform maintenance. The access space should also contain enough room to accommodate ne w repair components, such as a clam shell . The clam shell is a bello ws e xpansion joint that f ts o ver an e xisting joint; it eliminates the removal of an existing bellows expansion joint. It has to be welded by a highly skilled welder, and that person needs space to work.
This clam shell de vice is f abricated welding bello ws pro vided in multi-ple sections for installation o ver an e xisting element or o ver a piping system that has internal components such as tube b undles. The welding of clam shells requires the longitudinal seams of the bello ws element to be welded manu-ally, thus requiring a welder who has a very high degree of skill. These devices can signif cantly shorten the shutdo wn or turnaround time required to repair a damaged bellows expansion joint. Along with the repair , expansion joint com-ponents, such as hinges and gimbal boxes, can be installed along with pressure monitoring systems to alert you to future leaks.
Expansion joints bello ws may be described in terms of gauge of metal, being that the y are usually v ery thin. This term is not uncommon in welding and general plant repair w ork. For the reader’ s reference, Table 5.1 lists wire and sheet metal gauges. The Birmingham wire gauge (B.W .G.) is v ery com-mon for tubes.
REFERENCES
1. Moody, Fredrick, Predicting Thermal-Hydraulic Loads on Pressure Vessels , ASME Continuing Education Course Notes PD382. American Society of Mechanical Engineers, New York, NY, 2007.
2. Roark , Raymond J ., Formulas for Stress and Strain , 4th edition . McGraw-Hill , Table X Case 60 , New York, NY , 1965 .
3. Giachino, J.W. , Weeks , W. , and Johnson , G.S ., Welding Technology , 2nd edition . American Technical Society , Chicago, Illinois , 1973 .
4. Hicks , John , Welded Joint Design , 3rd edition . Industrial Press, Inc. , New York, NY , 1999 . 5. Bednar , Pressure Deisgn Handbook , 2nd Edition . Van Nostrand Reinhold Company , NY, NY ,
1986 .
CH005-H8766.indd 109CH005-H8766.indd 109 6/13/2008 7:50:02 AM6/13/2008 7:50:02 AM

111
Chapter 6
Safety Considerations for Lifting and Rigging
Safety cannot be o veremphasized in almost all applications, b ut especially in lifting and rigging of equipment. These principles are v alid for whatever is to be lifted, whether it in volves pressure vessels and stacks, marine ship yard applica-tions, aerospace use, or any of the many more needs for lifting and rigging.
The purpose of this chapter is to highlight safety issues and, more important, relevant safety standards. Also listed are helpful f eld reference cards, which are used widely in the f eld for v aluable reference material; the y are a vailable on weatherproof pocket cards for easy access.
THE CONCEPT OF A TON WEIGHS HEAVY WHEN LIFTING
The unit of measurement, the ton , means different things to different people. In the metric SI, the concept is simple: A metric ton equals 1,000 kilograms. How-ever, in U.S. Customary units, the ton can be tricky. The ton in U.S. Customary units is deri ved from hundredweights. A short ton and long ton are equal to 20 hundredweights; ho wever, a short hundredweight is equal to 100 pounds, and a long hundredweight is equal to 112 pounds. Thus, a short ton is
( ) hundredweights ( ) lbm20 100 2000�
The long ton is likewise
( ) hundredweights ( ) lbm20 112 2240�
In lifting and in general practice, the short ton is used in the United States. However, in countries that formerly used the Imperial system of units, the long ton is referred to as a weight ton or gross ton . The long ton is used for petro-leum products such as oil tank ers hauling petroleum products. This trend is changing toward the wider use of the metric ton.
The metric ton is sometimes referred to as the tonne and is equal to 1,000 kilograms or 2,204.6 lb m . Lifting and rigging in the United States use the short ton, meaning 2000 lb m . The short ton is simply called ton in the United States, or sometimes net ton .
00006
CH006-H8766.indd 111CH006-H8766.indd 111 6/13/2008 7:55:20 AM6/13/2008 7:55:20 AM

Pressure Vessel and Stacks Field Repair Manual112
Another example of the adv antage of the metric SI system of units is that you do not have to worry about long or short, but simply a metric ton, or tonne. The issue is confusing to the point that purchasing groups apply all units for each pressure v essel or stack shipped. Normally , a chart is made sho wing the shipping weight of the item in short tons, long tons, and metric tons to a void confusion.
MAXIMUM CAPACITY OF SLINGS
The angle between a sling and a horizontal plane is v ery important. This con-cept is illustrated by the simple double sling sho wn in Figure 6.1 . When look-ing at this f gure, you can mak e some basic assumptions. One assumption is that the tw o slings are attached to a common body , or mass. The second assumption is that the center of gravity, or CG (to be discussed later), is equallydistant between the two lift points.
The capacity of the tw o slings is a function of the angle θ . For equilibrium to exist,
2F LOADsin θ � (6.1)
Solving for the load in each sling, you have
F LOAD
�2 sin θ
(6.2)
FF
LOAD
LOAD2
LOAD2
θθ
FIGURE 6.1 Load vectors and sling angles. The force vectors are shown in the upper right. The two slings form is known as a two-leg bridle.
CH006-H8766.indd 112CH006-H8766.indd 112 6/13/2008 7:55:21 AM6/13/2008 7:55:21 AM

Safety Considerations for Lifting and Rigging 113
Thus, using U.S. Customary units, if LOAD � 50 tons and θ � 60 °, then the force in each sling is
F LOAD
� � �2
502 60
28 87sin sin
.θ
tons( )
tons
For θ � 45 °,
F � �
502 45
35 36tons( )
tonssin
.
and for θ � 30 °,
F � �
502 30
50tons( )
tonssin
This discussion is in conformance with the ANSI/ASME B30.9 and good engineering practice.
Thus, the maximum capacity ( ML) of each sling conf guration is propor -tional to the sling angle, θ . With a sling angle of 30°, the force in the sling is 50/28.87 � 1.732 times the force in the sling using a sling angle of θ � 60 °.Thus, using a sling angle of θ � 60°, the sling has 1.732 times the capacity of using a sling angle of θ � 30°. Stated dif ferently, using a sling angle of 30° results in a force in the sling which is 1.732 times the force in a sling if one were using a sling angle of 60°.
Sling manufacturers use the concept of ML in maximum capacity charts. In Figure 6.1 using θ � 30°, the load in each sling is equal to the LOAD . Hence, for tw o slings with θ � 60°, a sling manuf actured for taking a tensile force equal to the LOAD , the maximum capacity for the tw o slings, ML, would be 1.732 � LOAD , or
ML LOAD� ( )2 sin θ (6.3)
Thus, for θ � 60°,
ML LOAD LOAD� �[ ( )]2 60 1 732sin . (6.4)
Similarly, for
θ � � � �45 45 1 4142, [2 ]ML LOAD LOADsin( ) . (6.5)
θ � � � �30 2 30, [ ( )]ML LOAD LOADsin (6.6)
It is common practice to mak e the sling angle, θ , equal to or greater than 45°, preferably 60°.
CH006-H8766.indd 113CH006-H8766.indd 113 6/13/2008 7:55:21 AM6/13/2008 7:55:21 AM

Pressure Vessel and Stacks Field Repair Manual114
Example 6.1 The Kilo Newton Problem
For this example, suppose you are in Australia and have to lift an American-built tank that weighs 2500 lb m . The crane from Germany you have availa-ble is rated at 20 KN. The metric SI is the only acceptable system of units in Australia, so you must talk, speak, and calculate in metric SI.
From Chapter 1 remember the following:
F
N
��
�
�( Kg)
m
secKg m
sec
1 09 807
19 8
2
2
..
.
⎛
⎝
⎜⎜⎜⎜⎜⎜⎜⎜⎜
⎞
⎠
⎟⎟⎟⎟⎟⎟⎟⎟⎟⎟⎟
007 N
(1.3)
The German crane could safely lift
20 20 000KN N� ,
Using Eq. 1.3, you have
Mass(Kg) * *
Kg m
secm
sec
� �
�
�Fg
gN Nc
⎛
⎝⎜⎜⎜⎜
⎞
⎠⎟⎟⎟⎟
20 0001
9 807
2
2
,.
⎛⎛
⎝
⎜⎜⎜⎜⎜⎜⎜⎜⎜
⎞
⎠
⎟⎟⎟⎟⎟⎟⎟⎟⎟⎟⎟
� 2039 4. Kg
So the crane is rated at roughly 2039 Kg. Using the U.S. Customary sys-tem of units, you calculate 2039.4 Kg � 4496.1 lb m � 2500 lb m , so the crane is adequate. This is a factor of safety (FOS) of
FOS � �
4496 1
25001 8
..
Now with a sling angle of 60 °, the sling capacity confi guration with two slings would be from Eq. 6.4:
ML LOAD� � � �1 732 1 732 2500 4330 1964 05. . .( ) lb Kgm
You now know that the maximum capacity of both slings exceeds 2500 lb m (1134 Kg) and is thus adequate. Using a typical sling manufacturer chart, shown in Table 6.1 , you can select slings with an angle of 60 ° rated at, say, 1500 Kg, and a diameter of the sling chain of 8 mm.
CH006-H8766.indd 114CH006-H8766.indd 114 6/13/2008 7:55:21 AM6/13/2008 7:55:21 AM

Safety C
on
sideratio
ns fo
r Liftin
g and
Riggin
g11
5
TABLE 6.1 A Typical Sling Manufacturer Chart (Courtesy of Slingmax, Inc.)
Chain Size Inches
Single Branch Sling 90 degree Loading
Double Sling Triple and Quadruple Sling
60°
60 degree
45°
45 degree
30°
30 degree
60°
60 degree
45°
45 degree
30°
30 degree
9/32 3,500 6,100 4,900 3,500 9,100 7,400 5,200
3/8 7,100 12,300 10,000 7,100 18,400 15,100 10,600
1/2 12,000 20,800 17,000 12,000 31,200 25,500 18,000
5/8 18,100 31,300 25,800 18,100 47,000 38,400 27,100
3/4 28,300 49,000 40,000 28,300 73,500 60,000 42,400
7/8 34,200 59,200 48,400 34,200 88,900 72,500 51,300
1 47,700 82,600 67,400 47,700 123,900 101,200 71,500
1–1/4 72,300 125,200 102,200 72,300 187,800 153,400 108,400
1–1/2 80,000 138,600 113,100 80,000 — — —
CH
006-H8766.indd 115
CH
006-H8766.indd 115
6/13/2008 7:55:21 AM
6/13/2008 7:55:21 AM

Pressure Vessel and Stacks Field Repair Manual116
BRIDLES AND CENTER OF GRAVITY (CG)
Figure 6.1 , earlier in the chapter , shows a two-leg bridle. When you are using bridles, lifting lugs, and trunnions, the center of gravity, or CG, is all important on how the loads are distrib uted. This concept is illustrated in more detail in Chapter 7, where we demonstrate lifting analyses.
Suppose you ha ve a four -leg bridle. The loads in the slings v ary because the slings are almost al ways unequal in length. The loads are statically inde-terminate, meaning that the true load in each sling cannot be mathematically solved. In reality, the load is carried by tw o slings, while the other tw o act to balance the load. To solve this problem, you must size the bridle such that just two legs carry the full load, or you must use a spreader.
LIFT CATEGORIES
There are four lift categories described as follows:
● Light Lift: Any lift where the payload lift is 10 tons or less. ● Medium Lift: An y lift where the payload weight is o ver 10 tons but less
than 50 tons. ● Heavy Lift: Any lift where the payload lift is 50 tons or greater. ● Critical Lift: An y lift that e xceeds 90% of the crane’ s chart capacity; or
any multiple-crane lift where either crane e xceeds 75% of the crane’ s load capacity or requires one or both cranes to change locations during the lifting operation; or any lift over operating or occupied facilities, operating process pipe racks, or near po wer lines; any lift involving complex rigging arrange-ment or that requires specialty rigging; also an y lifting operation in volving sensitive or risk to costly equipment.
In Chapter 7 we will discuss lifting hydrocrack ers that ha ve over a 1,000 metric ton lift weight. These cases are critical lifts because of the payload, and consequences of failure are prohibitive.
PREPARING FOR THE LIFT
It is al ways prudent to check with equipment manuf acturers on ho w to lift equipment the y designed and f abricated. In Chapter 3, the e xample of guy cables for f are stacks was a real scenario in Saudi Arabia. The f are tip arrived and had no lifting de vices on it. A project engineer ask ed me to design and install lifting lugs on the f are tip. Upon investigation, I discovered the f are tip was made of Allo y 600 and had v ery low specif ed minimum yield strength, meaning that the lifting lugs w ould have to be massi ve. I advised the project engineer to contact the f are tip manuf acturer on ho w to lift the tip to the top of the f are tip. The f are tip manufacturer responded that it purposely did not
CH006-H8766.indd 116CH006-H8766.indd 116 6/13/2008 7:55:22 AM6/13/2008 7:55:22 AM

Safety Considerations for Lifting and Rigging 117
install lifting lugs on the f are tip and that we should use plastic slings wrapped around it for lifting! The riggers used the plastic rope and successfully lifted and installed the f are tip without any lifting lugs.
Another problem that lifting lugs could ha ve caused is unequal heat distri-bution around the ring during f are. This is a classic e xample of making sure you lift the equipment as it is intended. Note: the same is true for the rigging. Be sure to refer to hoist and rigging equipment manuf acturers ’ specif cations for proper applications and limitations.
AMERICAN NATIONAL STANDARD INSTITUTE (ANSI) SAFETY CODES
ANSI standards provide comprehensive guidelines for the variety of equipment and work operations for rigging w ork. Many of these standards are enforced by the Occupational Safety and Health Administration (OSHA), among other safety regulations. These standards are as follows:
● ANSI B30.1 JACKS: Addressed in this standard are safety requirements for construction, installation, operation, inspection, and maintenance of scre w, ratchet, lever, and hydraulic jacks. Minimum inspection requirements are included before jacks are employed in use.
● ANSI B30.20 Overhead and Gantry Cranes ● ANSI B30.3 Hammerhead Tower Cranes ● ANSI B30.4 Portal, Tower, and Pillar Cranes ● ANSI B30.6 Derricks ● ANSI B30.8 Floating Cranes and Floating Derricks ● ANSI B30.11 Monorail Systems and Underhung Cranes ● ANSI B30.13 Controlled Mechanical Storage Cranes ● ANSI B30.14 Side Boom Tractors ● ANSI B30.17 Ov erhead and Gantry Cranes (T op Running Bridge, Single
Girder, Underhung Hoist) ● ANSI B30.18 Stacker Cranes ● ANSI B30.22 Articulating Boom Cranes ● ANSI B30.24 Container Cranes ● ANSI B30.25 Material Handling Hybrid Cranes: Safety requirements for
various kinds of cranes are established in this standard. Pro vided are fre-quent and periodic inspection requirements, operator qualif cations, and standard hand signals. Emphasized is the importance of utilizing the right standard for the right kind of crane.
● ANSI B30.7 Base Mounted Drum Hoists ● ANSI B30.16 Overhead Hoists (Underhung) ● ANSI B30.21 Manually Le ver Operated Hoists: Pro visions for detailed
requirements for hoists which are frequently used in construction rigging work are covered in this standard.
CH006-H8766.indd 117CH006-H8766.indd 117 6/13/2008 7:55:23 AM6/13/2008 7:55:23 AM

Pressure Vessel and Stacks Field Repair Manual118
● ANSI B30.9 Slings: Provisions are made for a comprehensi ve set of safety standards for the use and periodic inspection of alloy steel chain, wire rope, metal mesh, natural and synthetic f ber rope, and synthetic webbing (nylon, polyester, and polyprop ylene). The rigging personnel must ha ve a good working knowledge of this standard to ef fectively design and use slings in construction work operations.
● ANSI B30.10 Hooks ● ANSI B30.12 Handling Loads from Suspended Rotorcraft (Helicopters) ● ANSI B30.19 Cableways ● ANSI B30.20 Below-the-Hook Lifting Devices: In this standard are pro vi-
sions for lifting de vices such as lifting beams (spreader beams), edge grip sheet clamps, and plate clamps. The requirements for the design, fabrication, inspection, and use of lifting beams.
● ANSI B30.23 Personnel Lifting ● ANSI B56.1 Lift and High Lift Trucks (Forklifts) ● ANSI B56.5 Guided Industrial Vehicles ● ANSI B56.6 Rough Terrain Forklift Trucks ● ANSI B56.7 Industrial Crane Trucks ● ANSI B56.8 Personnel and Burden Carriers ● ANSI B56.9 Operator Controlled Industrial Tow Tractors ● ANSI N45.15 Hoisting, Rigging, and Transporting of Items at Nuclear Plants.
HELPFUL REFERENCES FOR RIGGING
The following references list many helpful rigging tips:
Rigger’s Pocket Guide , by Construction Safety Association of Ontario, 21 Voyager Court South, Etobicoke, Ontario, Canada M9W 5M7, 1-800-781-2726.
Journeyman Rigger’s Reference Card , by Parnell Services Group Training & Inspection Resource Center, PO Box 1660, Woodland, WA 98674, in U.S. 1-888-567-8472.
Master Rigger’s Reference Card , by Parnell Services Group Training & Inspection Resource Center, PO Box 1660 Woodland, WA 98674, in U.S. 1-888-567-8472.
Lineman Rigger’s Reference Card , by Parnell Services Group Training & Inspection Resource Center, PO Box 1660, Woodland, WA 98674, in U.S. 1-888-567-8472.
Rigging Gear Inspection Card (Per ASME B30.9 & 29 CFR 1910.184), by Parnell Services Group Training & Inspection Resource Center, PO Box 1660, Woodland, WA 98674, in U.S. 1-888-567-8472.
Equipment Operator’s Card , by Parnell Services Group Training & Inspection Resource Center, PO Box 1660, Woodland, WA 98674, in U.S. 1-888-567-8472. This handy card list components that need to be checked for mobile cranes and boom trucks, overhead cranes, forklifts, tractor rigs/large trucks, load securement, graders, backhoes, dozers, yard tractors, and snow vehicles.
Mobile Crane Operator Reference Card , by Parnell Services Group Training & Inspection Resource Center, PO Box 1660, Woodland, WA 98674, in U.S. 1-888-567-8472. A handy f eld reference card for planning the lift, from checking out the crane to hitch types and wire rope capacities.
CH006-H8766.indd 118CH006-H8766.indd 118 6/13/2008 7:55:23 AM6/13/2008 7:55:23 AM

119
Chapter 7
Lifting and Tailing Devices
This chapter describes the lifting of pressure v essels and stacks in the f eld. The perspective is from the f eld, and not design, vie wpoint. This information should be v aluable to engineering designers, b ut, as mentioned, the informa-tion is more from a f eld perspective. Unfortunately, many engineering design-ers do not w ork in the f eld and, consequently, are not e xposed to operational and f eld problems. This chapter therefore should serve as a source of informa-tion for both f eld and engineering design off ces.
Lifting and tailing de vices are e xtremely important because their f ailure can result in the loss of property and li ves. The responsibility for lifting sys-tems is very explicit, making the parties responsible accountable.
This chapter is partially based on the w ork of Duerr [1] and Bragassa [2] . Duerr’s work is validated with laboratory tests by v arious investigators. What we are f rst concerned with are the modes of f ailures and how to prevent them. First, we will address tail and lifting lugs for lifting pressure v essels and stacks. Later , we will address lifting trunnions, which are different lifting devices than lugs.
Lifting (and tailing) lugs are pinned connections consisting of a pin extended through the lug hole connected to a shackle or a link-pin arrange-ment. We will discuss the latter arrangement later in this chapter . The stress distribution in a lug pin arrangement is very complex; consequently, the design code requirements are empirical. Ho wever, these empirical relationships ha ve worked o ver man y decades, and the stress prof le of the pin connection is understood well enough for general application.
The lug geometry is shown in Figure 7.1 . Using Figure 7.1 as a starting point, we will discuss the f ve basic mecha-
nisms of f ailure and expand on the others. The f ve basic mechanisms of f ail-ure of a lug plate, as outlined by Duerr [1] , are as follows:
1. Tension at net section 2. Hoop tension (splitting failure beyond hole) 3. Double plane shear failure 4. Failure by out-of-plane instability (dishing) 5. Bearing failure
These failure modes are graphically shown in Figure 7.2(a) and 2(b) . These modes of failure act independently and do not occur at the same time.
CH007-H8766.indd 119CH007-H8766.indd 119 6/17/2008 1:51:39 PM6/17/2008 1:51:39 PM

Pressure Vessel and Stacks Field Repair Manual120
IMPACT FACTOR
In the following discussion the use of impact factors is performed in the examples, whether mentioned or not. The impact factor, also known as the dynamic load fac-tor, is used to consider crane slippage, wind gusts, or an y other f actor resulting in an increase load. The impact f actor can vary from 1.25 to 2.0. T ypically, 1.5 is used. This f actor varies with each compan y. For the hea vy vessels mentioned in the examples in this chapter, the client used an impact factor of 1.35. This factor is not applied to below-the-hook lifting devices, such as shackles. Shackles are proof tested to 1.33 to 2.2, the w orking load limit, depending on the capacity (this may vary with the manufacturer). Thus shackles have a built-in factor of safety making the application of an impact factor unnecessary.
R
R
be beDH
be beDH
WL
FIGURE 7.1 The lifting lug conf guration .
CH007-H8766.indd 120CH007-H8766.indd 120 6/17/2008 1:51:39 PM6/17/2008 1:51:39 PM

Lifting and Tailing Devices 121
*Pin contact
Double plane shear failure
Tension failure
Bearing failure
Hoop tension failure
Double plane shearfailure
Tension failure
AP�P/0.45�y(Tensile failure)
P
(a)
a2
Weff
(b)
FIGURE 7.2(a) The modes of f ailure of a lifting lug (dishing is sho wn in Figure 7.2(b) ) (b) Four of the f ve modes of f ailure of a lifting lug. In dishing, the diagram at the top right is a side view of a lug that is deformed, or dished.
CH007-H8766.indd 121CH007-H8766.indd 121 6/17/2008 1:51:40 PM6/17/2008 1:51:40 PM

Pressure Vessel and Stacks Field Repair Manual122
TENSION AT NET SECTION
This mode of failure is described by the following:
Let F u � ultimate strength of the lug material, MPa (psi) F y � specif ed minimum yield strength of the lug material, MPa (psi) D p � diameter of lift pin, mm (in) C r � capacity reduction factor of the pin and hole diameters
The effective width of the lug is
b b
FF
Dbe
u
y
H
eeff � 0 6.
⎛
⎝
⎜⎜⎜⎜⎜
⎞
⎠
⎟⎟⎟⎟⎟
(7.1)
The capacity reduction factor, Cr , is a function of the ratio of the pin and
hole diameters given by
C
DDr
p
H� � �1 0 275 1
2
2.
(7.2)
The strength of a pin-connected plate in the limit state of tension in the net
section is given by
P b C b tFn r u� 2 eff eff (7.3)
1
0.99
0.97
0.96
0.95
0.94
0.93
0.92
0.98
3.05 3.1 3.15 3.2 3.25 3.3 3.35 3.4 3.45 3.5 3.55 3.6
Ratio of (be/DH) vs. Stress concentration factor kifor ratio � 0.5
Rat
io (
b e/D
H)
Ratio of (be/DH)
Stress concentration factor, Ki
FIGURE 7.3 Ratio of the ratio b e /D H to stress concentration factor, K i .
CH007-H8766.indd 122CH007-H8766.indd 122 6/17/2008 1:51:40 PM6/17/2008 1:51:40 PM

Lifting and Tailing Devices 123
If P n � P , the applied load, then the lug plate is satisf actory for tension at the net section.
The pin clearance in the lug hole as a function of the stress concentration factor has been determined in lab tests. Figure 7.3 shows the pin-to-lug hole ratio plotted against the stress concentration factor for b e / D H � 0.5 .
Figure 7.4 shows a plot of the capacity reduction f actor, Cr , plotted against the ratio D p /D H . In practice the lug hole diameter is 3 mm (1/8' ' ). From the stress viewpoint, as shown in Figure 2.2 and Figure 7.3 , the closer D p is to D H , the lower the stress. However, you must be careful not to specify something that cannot be built. Using a clearance between the pin and lug diameters of 0.8 mm (1/32'') is extremely diff cult to accomplish. One reason is that, after the v essel is lifted, all it takes is for a pin to def ect a very slight amount, and the pin cannot be remo ved from the lug hole. Second, when paint is added to the lifting lug, the pin will not f t. When such tight clearances are used, the w orst event usually happens. The construction personnel cut a lar ger (and uneven) hole with a weld torch in the lug plate, resulting in an undesirable situation. The resulting hole lea ves a conf gura-tion that was not considered in the calculations.
This newly cut hole presents an interesting dilemma when modeling a pin con-nection in a lug plate hole with the f nite element method (FEM). The angle of contact between the pin and lug plate is v ery small—5° or less, depending on the ratio of the diameter of the pin to the diameter of the lug hole. Point contacts are very diff cult to model in FEM; the reason is that, if forces are not distrib uted over several elements, the resulting stress can be enormous and unrealistic. When the pin and lug come into contact, localized yielding occurs in the pin and lug plate.
1
0.975
0.875
0.85
0.825
0.8
0.775
0.75
0.95
0.925
0.9
0.4 0.5 0.6 0.7 0.8 0.9 1
Cr vs. ratio of Dp to DH
Cr (
Cap
acity
red
uctio
n fa
ctor
)
Dp/DH
Cr
FIGURE 7.4 Capacity reduction factor, Cr , versus the ratio of D p /D H.
CH007-H8766.indd 123CH007-H8766.indd 123 6/17/2008 1:51:41 PM6/17/2008 1:51:41 PM

Pressure Vessel and Stacks Field Repair Manual124
The closed-form formulations ha ve proven adequate throughout man y years. The laboratory tests re garding this issue pro vide invaluable data for the use of closed form solutions. The reason for designers specifying a v ery low Dp/D H ratio of 0.8 mm (1/32 '' ) is to provide a greater area of contact. When localized deforma-tion results, which it inevitably will, such tight tolerances are not only unnecessary, but impossible to execute in the f eld. Thus, 3 mm (1.8 '' ) should be adequate for the difference between the pin diameter and lug hole diameter.
HOOP TENSION—SPLITTING FAILURE BEYOND HOLE
The hoop tension phenomenon is perhaps the most likely mode of failure. This mode occurs when the lift force acts in tension in the hoop direction, as sho wn in Figure 7.5 . This mode of f ailure is the tensile force acting on the area of the lug from the top of the lug hole to the lug edge in one plane, and the lug
(a)
(b)
t
a
FIGURE 7.5 Hoop tension forces splitting apart a lifting lug .
CH007-H8766.indd 124CH007-H8766.indd 124 6/17/2008 1:51:42 PM6/17/2008 1:51:42 PM

Lifting and Tailing Devices 125
thickness in the other plane. This is what is meant by the “ hoop ” direction. The hoop tensile force that tends to pull the lug apart is resisted by a direct shear through a single plane. In the AISC Manual of Steel Construction [3] , Chapter D, P aragraph D3.1, states that the allo wable stress on the net area of the pin hole for pin-connected members is 0.45 Fy. Sometimes this mode of failure is referred to as “ tensile splitting. ” The net area, A , is (a)(t) , as shown in Figure 7.5(a) . Figure 7.5(b) shows the actual failure where the lug splits. Using the AISC criterion, you can use the equation for the hoop tension as follows:
t P
F ary
�0 45.
(7.4)
where a � R – DH /2 shown in Figure 7.5(a) , mm (in) F y � specif ed minimum yield strength of the lug material, MPa (psi) P � tensile load on the lifting lug, N, lb f t r � required lug thickness, mm (in)
The strength of a pin-connected plate for the net area abo ve the hole, A , is given by Duerr [1] as follows:
P C F a b
Dtb r u
H� �1 13 0 92. .⎡
⎣⎢⎢
⎤
⎦⎥⎥
(7.5)
where all the terms in the equation are as def ned previously. Now if P b � P and t � tr , where t � the actual lug thickness, then the lug is satisf actory for hoop tension.
Hoop tension is quite often the governing mode.
DOUBLE PLANE SHEAR FAILURE
The double plane shear mode of f ailure is graphically sho wn in Figure 7.6 . T he parameters associated with this failure are shown in Figure 7.7 .
The region beyond the hole is that of shear on tw o planes which are parallel to each other and the v ector of the acting force on the lug, sho wn in Figure 7.6 . The locations of the shear planes are def ned by the angle, φ , shown in Figure 7.7 . The shear plane consists of two vertical lines from the point def ned by φ . The ultimate strength of the material decreases as the clearance between the pin and lug hole increases, provided all other dimensions remain constant. Duerr [1] records lab tests where a relationship for φ was developed to account for this clearance.
The computation of the shear strength of the plate requires kno wledge of the ultimate shear strength of the material, F us . This property is not a vailable
CH007-H8766.indd 125CH007-H8766.indd 125 6/17/2008 1:51:42 PM6/17/2008 1:51:42 PM

Pressure Vessel and Stacks Field Repair Manual126
FIGURE 7.6 Double plane shear mode of failure .
Z
Z1
Applied load PRadius of liftingLug R
φ
FIGURE 7.7 Double plane shear mode of failure and associated parameters .
and usually must be determined by empirical tests. F or purposes of this exam-ple, to be conservative, you have
F Fus u� 0 7. (7.6)
CH007-H8766.indd 126CH007-H8766.indd 126 6/17/2008 1:51:42 PM6/17/2008 1:51:42 PM

Lifting and Tailing Devices 127
The angle φ is def ned as follows:
φ � 55
DD
p
H (7.7)
The length of the shear plane, shown in Figure 7.7 , is as follows:
Z a
Dp� � �
21( cos )φ
(7.8)
For a lug with an outer surf ace that is a circular arc, as in Figure 7.7 , the dimension Z 1 is calculated as follows:
Z R R
Dp1
22
2� � � sin φ
⎛
⎝⎜⎜⎜⎜
⎞
⎠⎟⎟⎟⎟⎟
(7.9)
For a rectangular or square lug, where the outer surf ace is a straight line, then Z 1 � 0.
For the strength of a pin-connected plate in the limit state of a double plane shear for a lug with a circular edge,
P Z Z Fs us� �2 1( ) (7.10)
For a rectangular plate with a straight top edge,
P ZFs us� 2 (7.11)
Now, continuing with the circular edge lug plate, the area of shear is
A Z Z tshear � �2 1( ) (7.12)
The shear stress in the lug plate is
τ �
PA
s
shear
(7.13)
The acceptance criteria for double shear are as follows:
If τ � 0.4 F y then the lug is satisfactory for double shear. If τ � 0.4 F y then the lug is not satisfactory for double shear.
OUT-OF-PLANE INSTABILITY (DISHING) FAILURE
The out-of-plane instability mode of f ailure occurs with slender pin-connected plates that f ail by out-of-plane b uckling. This mode is demonstrated in
CH007-H8766.indd 127CH007-H8766.indd 127 6/17/2008 1:51:43 PM6/17/2008 1:51:43 PM

Pressure Vessel and Stacks Field Repair Manual128
Figure 7.2(b) . The plate above the pin is analogous to a cantilevered beam. The critical buckling stress can be e xpressed in terms of a slenderness ratio KL /r , where L is equal to the plate dimension a in Figure 7.5 and r is the radius of gyration of the plate through the thickness direction ( /t 12) . Tests indicate that the length of the cantilever is not necessarily equal to a . Plates that are wide—with a relatively larger value of b e —are seen to provide less support to the area in compression above the hole, resulting in a larger effective length. This means that the wider the spread of the centroids on each side of the hole, the more likely the plate will b uckle. This phenomenon is accounted for with the effective length factor, K , as follows:
K
bae� 2
(7.14)
The lug plate can either f ail elastically or inelastically . Plates in which the following is true will fail inelastically:
C E
FKLrc
y�
2 2π<
(7.15)
The inelastic critical buckling stress is given as follows:
F C Fcr
KLr
c y��
�
12
1
2
2
2
( )
υ
⎡
⎣
⎢⎢⎢⎢⎢
⎤
⎦
⎥⎥⎥⎥⎥
(7.16)
where υ � Poisson’s ratio ( � 0.3 for steel).
The elastic critical buckling stress is given as follows:
F E
cr KLr
��
πυ
2
2 21( ) ( )
(7.17)
Referring to Figure 7.2(b) , the critical b uckling stress acts on an ef fective area of the plate, equal to W eff /t. W eff is an ef fective width shown in the f gure and the lesser of the v alues given by Eq. 7.16 or Eq. 7.17 . The follo wing is analogous to the effective width model used for some edge-loaded plate b uck-ling problems:
W D apeff � � (7.18)
CH007-H8766.indd 128CH007-H8766.indd 128 6/17/2008 1:51:43 PM6/17/2008 1:51:43 PM
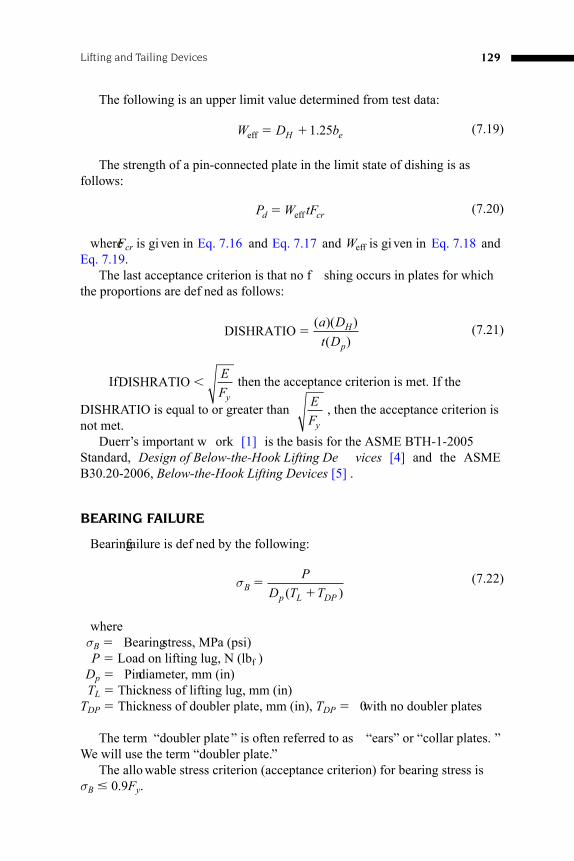
Lifting and Tailing Devices 129
The following is an upper limit value determined from test data:
W D bH eeff � �1 25.
(7.19)
The strength of a pin-connected plate in the limit state of dishing is as follows:
P W tFd cr� eff
(7.20)
where F cr is gi ven in Eq. 7.16 and Eq. 7.17 and W eff is gi ven in Eq. 7.18 and Eq. 7.19.
The last acceptance criterion is that no f shing occurs in plates for which the proportions are def ned as follows:
DISHRATIO �
( )( )( )
a Dt D
H
p (7.21)
If DISHRATIO EFy
then the acceptance criterion is met. If the
DISHRATIO is equal to or greater than EFy
, then the acceptance criterion is not met.
Duerr’s important w ork [1] is the basis for the ASME BTH-1-2005 Standard, Design of Below-the-Hook Lifting De vices [4] and the ASME B30.20-2006, Below-the-Hook Lifting Devices [5] .
BEARING FAILURE
Bearing failure is def ned by the following:
σB
p L DP
PD T T
��( )
(7.22)
where σ B � Bearing stress, MPa (psi) P � Load on lifting lug, N (lb f ) D p � Pin diameter, mm (in) T L � Thickness of lifting lug, mm (in) T DP � Thickness of doubler plate, mm (in), T DP � 0 with no doubler plates
The term “ doubler plate ” is often referred to as “ ears ” or “collar plates. ” We will use the term “doubler plate.”
The allo wable stress criterion (acceptance criterion) for bearing stress is σ B � 0.9 F y .
CH007-H8766.indd 129CH007-H8766.indd 129 6/17/2008 1:51:44 PM6/17/2008 1:51:44 PM

Pressure Vessel and Stacks Field Repair Manual130
Validation Tests for Bearing Failure
Lab tests to conf rm equations used in the bearing deformation of lifting lugs were chronicled by Duerr [1] . We will present just a summary of the results for practicing engineers.
The stiffness coeff cient, K br , attributable to shear deformation be yond the lug hole, is as follows:
K tF
Dbr y
p� 120
25 4
0 8
.
.⎛
⎝⎜⎜⎜⎜
⎞
⎠⎟⎟⎟⎟⎟
(7.23)
When you use U.S. Customary Units (USCU), Eq. 7.23 becomes
K tF Dbr y p� 120 0 8.
(7.24)
The equations for K br are based on the model shown in Figure 7.8 . Referring to Figure 7.8 , the pin bearing area is given by
A D tp p� sin( )α1
(7.25)
where
α1
2 2 20 25 0 25�
� �Arcc os
. .D DD
H p
p
Δ
Δ
⎛
⎝
⎜⎜⎜⎜⎜
⎞
⎠
⎟⎟⎟⎟⎟
(7.26)
DH2
Dp2 α1
Lug hole
Δ
Δbr
Bearing deformation
FIGURE 7.8 Bearing stiffness model .
CH007-H8766.indd 130CH007-H8766.indd 130 6/17/2008 1:51:44 PM6/17/2008 1:51:44 PM

Lifting and Tailing Devices 131
Δ Δ� �
D DH pbr2 2
+
(7.27)
Lab tests indicate that a Δ br � 0.1 mm is a good initial assumption, and that plate deformations are linear up to the value of Δ br � 0.25 mm . The pin load,
P A Fp y� ,
(7.28)
and the stiffness,
K P
brbr
�Δ
,
(7.29)
result in the following:
K C D tFbr p y� 10 1sin( )α
(7.30)
where C � 1.0 in SI units and 25.4 in USCU. In USCU when 10 C sin( α 1 ) � 120 for the range of specimen dimensions reported in lab tests, Eq. 7.30 gives results similar to Eq. 7.24 . You can use the stif fness values given by Eq. 7.30 to compute local bearing deformations up to maximum value Δ br � 0.25 mm .
PIN HOLE DOUBLER PLATES
If you want to increase the bearing area, it is common practice to reinforce lifting lugs with doubler plates sho wn in Figure 7.9 . These plates were described in the
Lifting lug
Doubler plate
FIGURE 7.9 Lifting lug reinforced with doubler plates.
CH007-H8766.indd 131CH007-H8766.indd 131 6/17/2008 1:51:45 PM6/17/2008 1:51:45 PM

Pressure Vessel and Stacks Field Repair Manual132
Example 7.1 Evaluating a Lifting Lug for Five Modes of Failure
To demonstrate the modes of failure for lifting lugs described by Duerr [1] , we use the following example that was successfully used in practice recently. The lug has a maximum tensile load, P , of 10,000,000 Newtons. The lug is shown in Figure 7.10 . This lug has a fl anged lug design that is welded to a cover plate, which is bolted to the top nozzle on a hemispherical head of a hydrocracker. The vessel has 194 mm of wall made of 2-1/4 Cr-1 Mo metal with 321 austenitic stainless steel lining. Typically, the top head in the center of a hemispherical head is one of the most robust components of a vessel.
The algorithm of the lifting lugs is shown in Figures 7.11(a) and (b) .
section on Bearing F ailure. Calculation of the strength of these plates is done by calculating the strength of each plate—each doubler plate and the lug plate—and summing the values. This approach yields good agreement with lab tests.
Another approach is to assume the applied load is distrib uted between the pin and the plates as uniform bearing. The use of doubler plates is ubiqui-tous. However, with heavy lifts where the lug plate thickness e xceeds 100 mm (approximately 4 inches), lifting lugs without doubler plates ha ve successfully been used on many occasions.
be DH be
Flange bolts used for attachmentof cover plate onto vessel nozzle
Cover plate (blind flange)
t
R
P
FIGURE 7.10 The f ange lifting lug used in actual practice and demonstrated in Example 7.1. Here and in the example, note that D h is the same as D H used in the previous discussion.
CH007-H8766.indd 132CH007-H8766.indd 132 6/17/2008 1:51:46 PM6/17/2008 1:51:46 PM

Lifting and Tailing Devices 133
Rules Sheet: ;TENSION IN NET SECTION
Fu Dhbeff 0.6 be
Fy be
⎡ ⎤⎢ ⎥⎣ ⎦
2
2
DpCr 1 0.275 1�
Dh
Pn � 2 . Cr . beff . t . Fu
If Pn � P then Pn � OKT
If Pn � P then Pn � OKTIf Pn P then Pn � NOTOKT
;HOOP TENSION
0.92 bePb Cr Fu 1.13 a t
be1
Dh
⎡ ⎤⎢ ⎥⋅
⎢ ⎥�⎢ ⎥⎣ ⎦If Pb � P then Pb � OKHT
If Pb � P then Pb � OKHT
If Pb P then Pb � NOTOKHTP
HTa t
�⋅
If HT 0.45 ⋅ Fy then HT � OK
If HT � 0.45 ⋅ Fy then HT � OKIf HT � 0.45 ⋅ Fy then HT � NOTOK
;DOUBLE PLANE SHEAR FAILURE
Dp55
Dhϕ = .
DpZ a (1 COS( ))
2⎡ ⎤⎢ ⎥⎣ ⎦
��
�
�
22 Dp
Z1 R R SIN( )2
⎡ ⎤⎡ ⎤� � � ⋅ ϕ⎢ ⎥⎢ ⎥⎣ ⎦⎣ ⎦
Fus � 0.7 ⋅ Fu
Ps � 2 ⋅ (Z�Z1) ⋅ Fus
Ashear � 2 ⋅ ( Z� Z1) ⋅ t
PsτAshear
�
If τ 0.4 Fy then τ � OKS
If τ � 0.4 Fy then τ � OKS
If τ � 0.4 Fy then τ � NOTOKS
FIGURE 7.11(a) Equation sheet for Duerr acceptance criteria .
CH007-H8766.indd 133CH007-H8766.indd 133 6/17/2008 1:51:47 PM6/17/2008 1:51:47 PM

Pressure Vessel and Stacks Field Repair Manual134
;FAILURE BY OUT
;BEARING FAILURE
-OF-PLANE INSTABILITY (DISHING)
beK 2
a�
π � 3.1416
tr
12�
2 ECc
Fy
2⋅ π ⋅�
K LRATIO
r⋅
�
L � a
If Cc � RATIO then RATIO � OK1
If Cc � RATIO then RATIO � OK1If Cc RATIO then RATIO � NOTOK1
u � 0.3 2
2
2
K L1
rFcrie
2 Cc1 u
⎡ ⎤⋅⎡ ⎤⎢ ⎥− ⎢ ⎥⎢ ⎥⎣ ⎦� ⎢ ⎥⋅⎢ ⎥−⎢ ⎥⎣ ⎦
2
22
EFcre
K L1 u
r
π ⋅=
⋅⎡ ⎤ ⎡ ⎤⋅ −⎢ ⎥ ⎣ ⎦⎣ ⎦Weff � MIN((Dp � a), (DH � 1.25 ⋅ be))
Pd1 � Weff ⋅ t ⋅ Fcrie Pd2 � Weff ⋅ t ⋅ Fcre
DISHRATIO =
if DISHRATIO 0.19 .
if DISHRATIO � 0.19 .
if DISHRATIO � 0.19 .
a ⋅ DH
t ⋅ Dp
EFy
EFy
EFy
then DISHRATIO = OK2
then DISHRATIO = NOTOK2
then DISHRATIO = NOTOK2
σB �
If σB 0.9 . Fy then σB � OK3
If σB � 0.9 . Fy then σB � OK3
If σB � 0.9 . Fy then σB � NOTOK3
PDp . (t�tDP)
FIGURE 7.11(a) (continued)
CH007-H8766.indd 134CH007-H8766.indd 134 6/17/2008 1:51:48 PM6/17/2008 1:51:48 PM

Lifting and Tailing Devices 135
Variables sheet
beff 304.680828 Effective width of lug
TENSION IN NET SECTION
245 be Horizontal distance from hole centerlinefrom edge of hole to edge of lug
482.76 Fu Ultimate strength of lug material
262 Fy Specified minimum yield strength of lugmaterial
310 Dh Diameter of hole in lug
Cr 0.955965674 Function of ratio of ratio of pin and holediameters
306 Dp Diameter of lift pin
Pn 104051998 Strength of a pin-connected plate for tensionin the net section, N
370 t Thickness of lug plate
OKT 104051998 If this space is filled then tension in the netsection is acceptable
NOTOKT If this space is filled then tension in the netsection is NOT acceptable
HOOP TENSION (SPLITTING FAILUREBEYOND HOLE)
Pb 68771718.8 Strength of a pin-connected plate for netarea on top of hole, N
OKHT 68771718.8 If this space is filled then Hoop Tension isacceptable
NOTOKHT If this space is filled then the Hoop Tensionis NOT acceptable
245 a Vertical distance from top edge of lug holeto edge of lug plate
HT 110.314396 Hoop Tensile Stress
1E7 P Maximum tensile load on lifting lug, N
OK 110.314396 If this space is filled then Hoop Tensilestress is acceptable
NOTOK
DOUBLE PLANE SHEAR FAILURE
ϕ 54.2903226 Angle from lug centerline to shear plane,radians
Z 495.10066 Vertical distance of shear plane forrectangular lug
Z1 17.8749705 Vertical distance of shear plane in lug withradius of curvature
400 R Radius from lug hole centerline to curvededge of lug
Fus 337.932
mm
mm
MPa
MPa
mm
mm
mm
mm
MPa
mm
mm
mm
MPa Ultimate shear strength
Ps 322539.664 Strength of pin-connected plate in doubleshear, N
If this space is filled then Hoop Tensilestress is NOT acceptable
Input Name Output Unit Comment
FIGURE 7.11(b) Variable sheet showing results and answers for the lifting lug .
CH007-H8766.indd 135CH007-H8766.indd 135 6/17/2008 1:51:48 PM6/17/2008 1:51:48 PM

Pressure Vessel and Stacks Field Repair Manual136
This example shows that the fl ange top lifting lug is acceptable. It worked in practice on 10 vessels, so the design passed the “ acid test. ”
Input Name Output Unit CommentVariables sheet
Ashear 353147.01 Area of double shear, sq. mm
τ 0.91332973 MPa Shear stress
OKS 0.91332973 If this space is filled then Double Shear isnot a problem
NOTOKS If this space is filled then Double Shear is aproblem
FAILURE BY OUT-OF-PLANEINSTABILITY (DISHING)
K 2 Effective length factor
r 106.8098 mm Radius of gyration through thicknessdirection
Cc 122.752470 Elastic stability criterion
200000 E MPa Modulus of elasticity of lug material
RATIO 4.58759403 Slenderness ratio
L 245
OK1 4.58759403 If this space is filled then lug will not failinelastically
NOTOK1 If this space is filled then lug will failinelastically
u .3 Poisson’s Ratio
π 3.1416
Fcrie −0.00073096 MPa Inelastic critical buckling stress
Fcre 103067.187 MPa Elastic plate buckling stress
Weff 551 mm The effective width of lug
Pd1
Pd2
−149.02173 Strength of pin-connected plate in inelasticcondition, N
Strength of pin-connected plate in elasticcondition, N
DISHRATIO 0.670817877 Value of DISHRATIO
OK2 0.670817877 If this space is filled then dishing will notoccur
NOTOK2 If this space is filled the dishing is probable
BEARING FAILURE
σΒ 88.323618 MPa Bearing failure stress
0 tDP mm Thickness of both doubler plates
OK3 88.323618 If this space is filled then value of bearingstress is acceptable
NOTOK3 If this space is filled then value of bearingstress is NOT acceptable
2.10123E10
FIGURE 7.11 (b) (continued)
CH007-H8766.indd 136CH007-H8766.indd 136 6/17/2008 1:51:49 PM6/17/2008 1:51:49 PM

Lifting and Tailing Devices 137
MULTIPLE LOADS ON LIFTING AND TAIL LUGS
We have now established four modes of f ailure in lifting lugs as v alidated in laboratory tests. We now will consider the lugs, and later trunnions, on pres-sure v essels and stacks e xposed to v arious loads. Consider the schematic in Figure 7.12 . Refer to Eq. 1.2 and Eq. 1.3, where the unit of mass, Kg, is con-verted to the unit of force, N, by Newton’s second law.
As the vessel rotates in space in a single plane, the forces LV, LH, LL, TV, TH, and TL vary with the lift angle θ . (In the discussion that follo ws, any variable name followed by the Greek letter theta, θ , varies with this variable.) Thus, to designate these v ariables as a function of the lift angle θ , you write them as follows:
LV LH LL TV TH TLθ θ θ θ θ θ, , , , , and
H C
T H
H L
H T
LV
LL
TL
RB
LH
TV
θ
RBSINθHCCOSθ HTCOSθ
FIGURE 7.12 Lifting schematic of v essel showing forces acting on the v essel. The top lifting lug is a top f ange lug.
CH007-H8766.indd 137CH007-H8766.indd 137 6/17/2008 1:51:49 PM6/17/2008 1:51:49 PM

Pressure Vessel and Stacks Field Repair Manual138
Using these equations, you mak e the conversion from mass to force as fol-lows for the top f ange lug:
P LV g
gTc
� θ⎛
⎝⎜⎜⎜⎜
⎞
⎠⎟⎟⎟⎟⎟
Newtons (lb )f
(7.31)
P LL g
gNc
� θ⎛
⎝⎜⎜⎜⎜
⎞
⎠⎟⎟⎟⎟⎟
Newtons (lb )f
(7.32)
P LH g
gLc
� θ⎛
⎝⎜⎜⎜⎜
⎞
⎠⎟⎟⎟⎟⎟
Newtons (lbf )
(7.33)
When a stack or vessel is lifted, various loads are imposed on the lift devices (lifting lug, tail lug, or trunnions) o ver the v arious v alues of the lift angle, θ . T o assess these stresses, Chapter H ( “ Combined Stresses ” ) of the AISC Manual [3] combines axial tension and bending, illustrated in paragraph H2 in Equation H2-1, as follows:
fF
fF
fF
a
t
bx
bx
by
by� � ≤ 1 0.
(7.34)
Since we are dealing with loads acting in a single plane, Eq. 7.34 reduces to the following:
fF
fF
a
t
b
b� ≤ 1 0.
(7.35)
The stress values f a , f b vary with the lift angle θ , so you can rewrite Eq. 7.35 as follows:
AISCRATθ
σ θσ
σ θσ
� �t
Lb
Ly y0 6 0 66. .
(7.36)
where σ t θ � tensile stress MPa ( psi ) σ b θ � bending stress N – mm ( ft – lb f ) σ y L � specif ed minimum yield strength of lug and co ver plate attachment,
MPa (psi)
The acceptance criterion is as follows:
AISCRATθ ≤ 1 (7.37)
CH007-H8766.indd 138CH007-H8766.indd 138 6/17/2008 1:51:50 PM6/17/2008 1:51:50 PM

Lifting and Tailing Devices 139
Figure 7.13 illustrates the lift force acting on the lug. From Figure 7.12 and Figure 7.13 , you can compute the tensile stress from Eq. 7.33 as follows:
P P L g
gT Hc
� �sin θ⎛
⎝⎜⎜⎜⎜
⎞
⎠⎟⎟⎟⎟⎟
(7.38)
Referring to Figure 7.10 , the net tensile area, A a , is
A W t D t b ta L H e� � �( () ) 2 (7.39)
where W L � width of lug � 2b e � D H mm (in) The tensile stress is as follows:
σ θt
PA
T
a�
(7.40)
The bending stress is computed referring to Eq. 7.31 as
M P e L g
gceHθ θ� �( ) cos ( )
⎛
⎝⎜⎜⎜⎜
⎞
⎠⎟⎟⎟⎟
(7.41)
The section modulus of the lifting lug is
Zlug
t WL L�( )
( )2
3 36
mm in
(7.42)
P
e
θ
FIGURE 7.13 Lift force acting at an angle θ .
CH007-H8766.indd 139CH007-H8766.indd 139 6/17/2008 1:51:51 PM6/17/2008 1:51:51 PM

Pressure Vessel and Stacks Field Repair Manual140
So the bending stress is
σ θ
θb MZ
MPa psi� ( )
(7.43)
The AISCRAT θ parameter must be computed over lift angles of θ � 0–90°.Normally, this is done in 5° increments. Then the AISCRAT θ parameter is plotted versus the lift angle θ . The AISCRAT θ should al ways be less than or equal to 1, as shown in Eq. 7.37.
The tailing lug or lugs are handled in a similar method. The parameter with the tail lug is AISCRT θ , which is def ned as follows:
AISCRTθ
σ θσ
σ θσ
�Ten
LbT
Ly y0 6 0 66. .+
(7.44)
The tensile stress is computed as follows:
σ θ
θθTen MPa� �
TV gg
AbringTV
Abringc
⎛
⎝⎜⎜⎜⎜
⎞
⎠⎟⎟⎟⎟
29 807
2( . )
(7.45)
The bending stress is computed as follows:
σ θ
θbT MbTZtailug
� MPa
(7.46)
The parameters in Eq. 7.45 and Eq. 7.46, Abring and Ztailug , are computed for the ring block cross-section of the location where the tail lug is welded onto the base plate, compression ring, and skirt area shown in Figure 7.14 .
Figure 7.14 shows a spreadsheet solution for the tail lug ring block assem-bly. The parameter Abring � Area � 172.6511 in 2 and Ztailug � the mini-mum value of Z1 and Z2 , which is 361.88 in 3 .
The parameter MbT θ is def ned as follows:
MbT
TV gg
x TH gg
yc cθ
θ θ
�
�⎛
⎝⎜⎜⎜⎜
⎞
⎠⎟⎟⎟⎟
⎛
⎝⎜⎜⎜⎜
⎞
⎠⎟⎟⎟⎟
2 1000( ) (7.47)
In SI metric, this equation becomes
MbT TV x TH y
θθ θ
��( . ) ( . )
( )9 807 9 807
2 1000 (7.48)
CH007-H8766.indd 140CH007-H8766.indd 140 6/17/2008 1:51:52 PM6/17/2008 1:51:52 PM

Lifting and Tailing Devices 141
where x � distance from tail lug hole center to lug edge, mm y � radial distance from tail lug hole center to centerline of skirt, mm
The acceptance criterion for AISCRT θ is the same as AISCRAT θ , as follows:
AISCRTθ ≤ 1 0. (7.49)
3
1
2L2a
h2 h1
L 2b
Di — skirt inside diameter
L1
L1
L1
L3
t3
t1
t2
I
R - radius of neutral axis
Base Ring Blockreinforced with 2 parallel beams
Total tailing weight �
Base ring block material SA-36
Yield strength, Fy � 36,000.000
Ultimate strength, Fu � 58,000.000
1,693,133.00
Location of tail lugs,Theta �
deg.14.00
lbs
psi
psi
t1 � 2.559 in. t2 � 3.150 in. t3 � 2.756 in. L2a � 7.717 in. L2b � 16.890 in.
L3 � 7.717 in. L � 16.535 in. Di � 113.3460 in.
Skirt OD, Do � Di � 2 * t1 � 118.464 in.Effective length, L1 � 0.55*(Do * t1)^0.5 � 9.58 in.Total effective length, Le
Case 1: If 2.L1 L then Le � t3 � L1 * 3Case 2: If 2.L1 �� L then Le � t3 + L1 � L 2.L1� 19.1523 in. � or � L====>> Le � t3 � L1 � L � 28.8672 in.
Part # Width Height Area Location A * C A * d^2 I (in.) (in.) (in^2) (in.) (in^4) (in^4)
1 Skirt 28.8672 2.5590 73.8710 15.611 1153.16 53.59 93.902 Base pl. 3.1500 24.6070 77.5121 12.304 953.67 467.26 4378.423 Top rg. 2.7560 7.7170 21.2681 20.749 441.28 763.04 868.58
Sum () ====>> 172.6511 2548.11 5340.91
h1 � (A*C)/(A) � 14.7587 in. Z1 � (I)/h1 � 361.88 in^3
h2 � 9.8483 in. Z2 � (I)/h2 � 542.32 in^3
Radius of neutral axis, R � 57.1007 in.
Center Line
FIGURE 7.14 Tail lug ring block assembly .
CH007-H8766.indd 141CH007-H8766.indd 141 6/17/2008 1:51:52 PM6/17/2008 1:51:52 PM

Pressure Vessel and Stacks Field Repair Manual142
Another parameter used in the assessment of lifting and tail lugs is the equivalent stress proposed by Hicks [6] , which combines the shear stress with the tensile and bending stress as follows:
σ θ β σ θ σ θ τ θe t b s� � �( )2 23 (7.50)
where 0.8 � β � 0.9 is recommended by Hicks [6] . Eq. 7.50 comes from the von Mises theory of failure. The shear stress τ s is computed from
τ θ
θθs
LH gg
R DH t
LH
R DHc
�
�
�
�
⎛
⎝⎜⎜⎜⎜
⎞
⎠⎟⎟⎟⎟
⎛⎝⎜⎜⎜
⎞⎠⎟⎟⎟⎟
⎛2
2
9 807
22
( . )
⎝⎝⎜⎜⎜
⎞⎠⎟⎟⎟⎟ t
(7.51)
where the g / g c � 9.807 is for SI metric system of units. For the tail lug, the equivalent stress is
σ θ β σ θ σ θ τ θeT bT sT� � �( )Ten 2 23 (7.52)
where the shear stress for the tail lug is computed from
τ θ
θθsT
TV gg
ALUGTV
ALUGc
� �
⎛
⎝⎜⎜⎜⎜
⎞
⎠⎟⎟⎟⎟
49 807
2( . )
(7.53)
where, for the tail lug,
ALUG Wtailug DHtail tlug� �( ) (7.54)
Wtailug � width of tail lug, mm DHtail � diameter of hole in tail lug, mm tlug � thickness of tail lug, mm
The acceptance criteria for the equi valent stress at the top lug and tail lugs are
RATIO e e
Lyσ θ
σ θσ
� ≤ 1 0.
(7.55)
RATIO eT eT
Lyσ θ
σ θσ
� ≤ 1 0.
(7.56)
CH007-H8766.indd 142CH007-H8766.indd 142 6/17/2008 1:51:53 PM6/17/2008 1:51:53 PM

Lifting and Tailing Devices 143
Example 7.2 Rigging Analysis of Lifting A Pressure Vessel
This example shows how the lifting and tail lug loadings are evaluated. The vessel being erected is shown in Figure 7.12 . We want to compute the reac-tion loads on the top fl ange lug and two tail lugs on the bottom. As the vessel is lifted in a two-dimensional plane, the parameters that end with the Greek character θ vary with the lift angle. Figure 7.15(a) shows the equations sheet.
θ = HC ⋅ cosd(θ) + RB ⋅ sind(θ)
HL ⋅ cosd(θ) + RB ⋅ sind(θ)
HL ⋅ cosd(θ) + RB ⋅ sind(θ)RATLL
LLθ = W ⋅ RATLLθ
θ =HT ⋅ cosd(θ)
RATTL
TLθ = W ⋅ RATTLθ LVθ = LLθ ⋅ cosd(θ) TVθ = TLθ ⋅ cosd(θ) LHθ = LLθ ⋅ sind(θ) THθ = TLθ ⋅ sind(θ) LVmax = MAX('LVθ) LHmax = MAX('LHθ) LLmax = MAX('LLθ) Lmax = MAX(MAX('LVθ), MAX('LHθ)) π = 3.1416
PL = LHmax ⋅ 9.807 P = LLmax ⋅ 9.807 PT = LVmax ⋅ 9.807
θ =3 ⋅ e ⋅ LVθ
W1WL2
θθ =
LHW2
WL
Pθ = (W1θ + W2θ) ⋅ 9.807 ⋅ WL M1 = B ⋅ PT
θθ =
⋅ σP
Ar0.4 yL
Aa = (WL ⋅ t) − (DH ⋅ t) Pθmax = MAX('Pθ)
θ=
⋅ σP max
Armax0.4 yL
If Aa > Armax then Aa = Okay1 If Aa = Armax then Aa = Okay1 If Aa < Armax then Aa = NOTOkay1 ;COMPUTING THE AISCRATθ MAXIMUM VALUE FOR THE TOP LIFTING LUG
θ ⋅σ θ =
LH 9.807t
AaMθ = LVθ ⋅ 9.807 ⋅ e
Rules
FIGURE 7.15(a) The equations sheet for the lift assessment of the v essel in Figure 7.12 This f gure is where the spreadsheet lists all the equations used in the algorithm.
CH007-H8766.indd 143CH007-H8766.indd 143 6/17/2008 1:51:53 PM6/17/2008 1:51:53 PM

Pressure Vessel and Stacks Field Repair Manual144
t WL2Zlug
6⋅
�
Mb
Zlugθ
σ θ �
t bAISCRAT
0.6 yL 0.66 yLσ θ σ θ
θ = +⋅ σ ⋅ σ
If AISCRATθ < 1.0 then AISCRATθ = Okay2 If AISCRATθ = 1.0 then AISCRATθ = Okay2 If AISCRATθ > 1.0 then AISCRATθ = NOTOkay2 ;COMPUTING THE AISCRTθ MAXIMUM VALUE FOR THE TAILING LUG
TV 9.807Ten
2 Abringθ ⋅
σ θ =⋅
TV 9.807 x TH 9.807 yMbT
2 1000θ ⋅ ⋅ + θ ⋅ ⋅
θ =⋅
MbTZtailug
bT2 1000000
θ
σ θ =⋅
bT TenAISCRT
0.66 yL 0.6 yLσ θ σ θ
θ = +⋅ σ ⋅ σ
; COMPUTING EQUIVALENT STRESS FOR THE TOP FLANGE LUG
TSLH 9.807
DH2 R t
2
θ ⋅θ =
⎡ ⎤⋅ − ⋅⎢ ⎥⎣ ⎦
eRATIO e
yLσ θ
σ θ =σ
If RATIOσeθ < 1.0 then RATIOσeθ = OKAY3If RATIOσeθ = 1.0 then RATIOσeθ = OKAY3If RATIOσeθ > 1.0 then RATIOσeθ = NOTOK3;COMPUTING EQUIVALENT STRESS IN TAIL LUGS
ALUG = (Wtailug − DHtail) ⋅ tlug
TSTV 9.807
T2 ALUG
θ ⋅θ =
⋅
eTRATIO eT
yLσ θ
σ θ =σ
If RATIOσeTθ < 1.0 then RATIOσeθ = OKAY4If RATIOσeTθ = 1.0 then RATIOσeθ = OKAY4If RATIOσeTθ > 1.0 then RATIOσeθ = NOTOK4
T3
FIGURE 7.15 (a) (continued)
CH007-H8766.indd 144CH007-H8766.indd 144 6/17/2008 1:51:54 PM6/17/2008 1:51:54 PM

Lifting and Tailing Devices 145
InputStatus Name Output Unit Comment
L RATLLθ .489801255
18730 HC mmLength from tailling lug toCenter of Gravity (CG)
L 0 θ Lift angle in degrees
3309.5 RB mmOutside radius of skirt center lineto tail lug hole center
38240 HL mmLength from tailling lug to toplifting lug (HC + HT)
1322172.45 W Kg
Kg
Kg
Kg
Kg
Kg
Lifting weight - includesdynamic load factor
L RATTLθ .510198745
19510 HT mm Length from top lifting lug to CG
L TLθ 674570.724 KgVertical lift load component ateach tail lug varies with θ
L LVθ 647601.726
L LLθ 647601.726
Tangential lift load componentat top lift lug- varies with θ
L TVθ 674570.724Tangential lift load componentat each tail lug - varies with θ
L LHθ 0
L THθ 0
LVmax 650187.413 Kg
Kg
Kg
Max value of LVθ
Max value of LHθ
Max value of LLθ
LHmax
LLmax
1322172.45
1322172.45
Kg
N
N
N
Max load value Lmax 1322172.45
π 3.1416
PL 12966545.2
P 12966545.2
PT 6376387.96
L W1θ 1343.4814
410 eVertical distance from flangesurface to centerline of lug hole
770 WL mm Width of top lug plate
L W2θ 0
L Pθ 10145152
M1 4846054849
760 B mmVert. Dist. from cover platebottom to lug hole centerline
L Arθ 102269.678Required tensile area of top lugfor each value of θ
248 σyL MPaSpecified minimum yieldstrength of lug
Aa 163760 Calculated actual tensilearea, sq mm
356 t mm Thickness of top lug plate
FIGURE 7.15(b) The variables sheet showing all the variables used for the lift assessment.This f gure is where the spreadsheet lists all the variables used in the algorithm.
CH007-H8766.indd 145CH007-H8766.indd 145 6/17/2008 1:51:54 PM6/17/2008 1:51:54 PM

Pressure Vessel and Stacks Field Repair Manual146
InputStatus Name Output Unit Comment
Armax 130711.141Maximum required tensile areaof top lifting lug
Okay1 163760If this space is filled then thebolt area is satisfactory
NOTOkay1 If this space is filled then thebolt area is NOT satisfactory
COMPUTING THE AISCRATθMAX VALUE
Pθmax 12966545.2 N
L σtθ 0 MPaTensile stress in top liftinglug - varies with lift angle θ
L Mθ 2603922351Bending moment in toplifting lug, N-mm
Zlug 35178733.3Section modulus of crosssection of top lifting lug, mm^3
L
L
σbθ 74.0197871 MPaBending stress in top liftinglug - varies with lift angle θ
AISCRATθ .45222255
.45222255
AISC Ratio for top liftinglug - see plot for values
NOTOkay2
Okay2 If this space is filled then theAISCRATθ max value is OK
If this space is filled then theAISCRATθ max value is NOT OK
COMPUTING THE MAXIMUMAISCRTθ VALUE
σTenθ 29.695808 MPaTensile stress in tail lug - varieswith lift angle θ
111388.03 AbringArea of ring block (Fig. 7.12),sq mm
MbTθ 694629.085 MPaBending stress in the taillugs - varies with θ, N-mm
210 x mmDistance from tail lug holeto lug edge
417.5 y mmRadial distance from tail lughole center to centerline of skirt
.006 ZtailugSection modulus of ring block(Fig. 7.12), cu meters
L σbTθ 57.8857571Bending stress in taillugs - varies with lift angle θ
L AISCRTθ .553220588AISC Ratio for taillugs - see plot for values
COMPUTING EQUIVALENTSTRESS IN TOP FLANGE LUG
L TSθ 0 MPa Shear stress in top flange lug
385 R mmRadius of top lug extendingfrom lug hole center to lug edge
310 DH mm Diameter of hole in top lug plate
FIGURE 7.15(b) (continued)
CH007-H8766.indd 146CH007-H8766.indd 146 6/17/2008 1:51:55 PM6/17/2008 1:51:55 PM

Lifting and Tailing Devices 147
Figures 7.16 through 7.21 are plots of the various ratios used in the algo-rithm. The reader can tell at a glance if the ratios are acceptable. The corre-sponding equation number is indicated below each fi gure.
The actual lifting of the hydrocracker in this example is shown in Figures 7.22 and 7.23 . This is validation that the analysis works, as there were 10 similar vessels lifted and installed on site.
LVθ and LHθ plotted against lift angle θ
1,400,000
1,200,000
1,000,000
800,000
600,000
400,000
200,000
00 10 20 30 40 50 60 70 80 90
Lift Angle θ in degrees
LVθ
and
LHθ
for
top
lug
(kg)
FIGURE 7.16 The loads LV θ (solid line) and LH θ (dashed line) v ersus θ for top f ange lug. Refer to Figure 7.12 for the orientation of these forces.
InputStatus Name Output Unit Comment
L σeθ 66.6178084 MPa Equivalent stress in top flange lug
.9 β Factor used in computationof equivalent stress
L RATIOσeθ .268620195
OKAY3 .268620195If this space is filled thenRATIOσeθ is satisfactory
NOTOK3If this space is filled thenRATIOσeθ is NOT satisfactory
COMPUTING EQUIVALENTSTRESS IN TAIL LUGS
ALUG 39750Shear area of each of twotail lugs, sq mm
420 Wtailug mm Width of each of two tail lugs
155 DHtail mm Diameter of hole in each tail lug
150 tlug mm Thickness of each tail lug
L TSTθ 83.2140263 MPa Shear stress in each tail lug
L σeTθ 151.788817 MPa Equivalent stress in each tail lug
L RATIOσeTθ .612051682
OKAY4 .268620195 If this space is filled thenRATIOσeTθ is acceptable
NOTOK4If this space is filled thenRATIOσeTθ is NOT acceptable
FIGURE 7.15 (b) (continued)
CH007-H8766.indd 147CH007-H8766.indd 147 6/17/2008 1:51:55 PM6/17/2008 1:51:55 PM

Pressure Vessel and Stacks Field Repair Manual148
1,400,000
1,200,000
1,000,000
800,000
600,000
400,000
200,000
00 10 20 30 40 50 60 70 80 90
TVθ and THθ plotted against lift angle θ
Tail
lugs
load
s LV
θ an
d LH
θ
Lift angle θ in degrees
0.56
0.55
0.54
0.53
0.52
0.51
0.5
0.49
0.48
0.47
0.46
0.45
AISCRATθ
AISCRATθ versus the lift angle θ
Lift angle θ in degrees
AIS
C r
atio
for
the
top
liftin
g lu
g
0 10 50 60 70 80 904020 30
FIGURE 7.18 The AISCRAT θ for the top f ange lug v ersus the lift angle θ . See Eq. 7.37.
FIGURE 7.17 The loads TV θ (solid line) and TH θ (dashed line) versus θ for top f ange lug. Refer to Figure 7.12 for the orientation of these forces.
0.9
0.8
0.7
0.6
0.5
0.4
0.3
0.2
0.1
00 10 20 30 40 80 90706050
AISCRTθ versus the lift angle θ
Lift angle θ in degrees
AIS
C r
atio
for
the
taili
ng lu
gs AISCRATθ
FIGURE 7.19 The AISCRT θ for each tail lug versus the lift angle θ . See Eq. 7.44.
CH007-H8766.indd 148CH007-H8766.indd 148 6/17/2008 1:51:55 PM6/17/2008 1:51:55 PM

Lifting and Tailing Devices 149
0.6
0.55
0.35
0.3
0.25
0.4
0.5
0.45
0 10 20 30 40 50 60 70 80 90
RATIOσeθ of top flange lug plotted against lift angle θ
Lift angle θ in degrees
RAT
IOσe
θ of
top
flang
e lu
g
RATIOσeθ
FIGURE 7.20 RATIO σ e θ of top f ange lug versus θ . See Eq. 7.53.
0.7
0.4
0.3
0.2
0.1
00 10 20 30 40 50 60 70 80 90
0.6
0.5
Lift angle θ in degrees
RAT
IOσe
Tθ
in e
ach
tail
lug
RATIOσeTθ of each tail lug plotted against lift angle θ
RatioσeTθ
FIGURE 7.21 RATIO σ eT θ for each tail lug versus θ . See Eq. 7.54.
FIGURE 7.22 The actual lifting of the hydrocracker using the top f ange lug and tail lugs.
CH007-H8766.indd 149CH007-H8766.indd 149 6/17/2008 1:51:57 PM6/17/2008 1:51:57 PM

Pressure Vessel and Stacks Field Repair Manual150
TRUNNIONS
Trunnions are used for v essels that are too tall to be lifted by lugs at the top head. Figure 7.24 shows the three basic types of trunnions.
Unlike lifting lugs, it is not as common for trunnions to be designed and f abri-cated by an operating facility. Trunnions are mostly designed by an engineering con-tractor or a fabrication shop and welded into place in the fabrication shop. Trunnions are used to erect vessels that are too tall to be lifted by lugs. Lifting from lugs at top would result in excessive bending stresses and possible distortion in the shell. That is why we will not go into much detail here; this book is intended for f eld appli-cations, although much of the discussion and e xamples are equally applicable to engineering companies and fabricators. However, it is important for f eld personnel to understand trunnions and how to assess them—contractors do make mistakes.
FIGURE 7.23 The lowering and f nal installation of the hydrocrack er referred to in Figure 7.22 .
CH007-H8766.indd 150CH007-H8766.indd 150 6/17/2008 1:52:00 PM6/17/2008 1:52:00 PM

Lifting and Tailing Devices 151
(c)
(b)
(a)
LH
Retainer plate
End plate
Reinforcing pad (if required)
FIGURE 7.24 The three basic types of trunnions: (a) trunnion only; (b) trunnion and f xed lug; (c) trunnion and rotating lug .
CH007-H8766.indd 151CH007-H8766.indd 151 6/17/2008 1:52:01 PM6/17/2008 1:52:01 PM

Pressure Vessel and Stacks Field Repair Manual152
One factor that predicates the use of trunnions is when the v essel is lifted and the stresses at the midsection—either at or close to the centroid—get excessive. The bending stress normally is the most signif cant. When the vessel is lifted and is in the horizontal position, if the bending stresses become e xces-sive, then trunnions are used rather than lifting lugs. Calculations will v erify this fact. On some vessels that are very large and long, such as vacuum towers used in ref neries, trunnions are ubiquitously used.
The trunnion type shown in Figure 7.24(a) is the most common. F or clear-ance purposes the lug plate has to be long, thus justifying the types sho wn in Figure 7.24(b) or 7.24(c) . In some cases there are high torsion loads, and the trunnion type sho wn in Figure 7.24(c) is used to minimize torsion. F or this reason, when the trunnion type in Figure 7.24(a) is used, the entire trunnion is lubricated with grease to minimize torsion.
Trunnion reinforcing pad
Trunnion
TYP
TYP
Vessel
FIGURE 7.25 A trunnion reinforcing pad with plug welds. Along with the weld connecting the reinforcing pad to the shell, the welds in the plug hole add considerably to the weld strength. The trunnion is welded both to the vessel bare wall and the reinforcing pad.
CH007-H8766.indd 152CH007-H8766.indd 152 6/17/2008 1:52:01 PM6/17/2008 1:52:01 PM

Lifting and Tailing Devices 153
There are three cardinal rules about trunnions, which are as follows:
1. The trunnion cylinder should be welded to the vessel shell and the reinforc-ing pad.
2. If the trunnion load is suff ciently high to w arrant a reinforcing pad, and a conventional circular pad is not adequate, then an enlar ged pad should be used with plug hole welds. The plug hole welds will multiply the weld area.
3. The trunnion support should be analyzed like lifting lugs with the lift angle, θ , varying from 0–90°.
If a trunnion is welded to a pad, which in turn is welded to the v essel shell with f llet welds, the f llet welds tak e the entire loads and consequently may shear off the v essel during lift. An enlar ged reinforcing pad with plug welds will multiply the weld area, while at the same time the trunnion is welded to the vessel base metal. This type of arrangement is shown in Figure 7.25 .
Another de vice used with high-lifting loads using a trunnion is a gusset plate, as shown in Figure 7.26 .
FIGURE 7.26 A trunnion with gusset plates welded to the reinforcing pad. The reinforcing pad cannot be seen because of the insulation and aluminum jack et covering the vessel. The vessel operates at high temperatures because it is an FCCU regenerator.
CH007-H8766.indd 153CH007-H8766.indd 153 6/17/2008 1:52:01 PM6/17/2008 1:52:01 PM

Pressure Vessel and Stacks Field Repair Manual154
Example 7.3 Erection Analysis Using Trunnions
This example illustrates the erection analysis of a vacuum tower in a refi nery that has trunnions. The lifting schematic is shown in Figure 7.27 .
HC
TH
TV
LV
LH
TL
HL
HT
θ
R
RSINθ HCCOSθ HTCOSθ
LL
FIGURE 7.27 The lifting schematic of a vacuum tower with trunnions.
CH007-H8766.indd 154CH007-H8766.indd 154 6/17/2008 1:52:02 PM6/17/2008 1:52:02 PM

Lifting and Tailing Devices 155
HC cosd( ) R sind(RATLLθ =
HL cosd( ) R sind(⋅ θ + ⋅ θ)⋅ θ + ⋅ θ)
LLθ = W RATLLθ
HT cosd( )RATTLθ =
HL cosd( ) R sind( )⋅ θ
⋅ θ + ⋅ θ
TLθ = W ⋅ RATTLθ LVθ = LLθ ⋅ cosd(θ) TVθ = TLθ ⋅ cosd(θ) LHθ = LLθ ⋅ sind(θ) THθ = TLθ ⋅ sind(θ) LVmax = MAX ('LVθ) LHmax = MAX ('LHθ) LLmax = MAX ('LLθ)
Lmax = MAX (MAX('LVθ), MAX('LHθ)) Lmax 9.807
F =N⋅
π = 3.1416
4 4[do di ]Z =
do
π⎡ ⎤ ⋅ −⎢ ⎥32⎣ ⎦
LH 9.807FH
Nθ ⋅
θ =
ftball = 0.66 ⋅ SMYS
FH eftbL
Zθ ⋅
θ =
LV 9.807FV
Nθ ⋅
θ =
FV eftbC
Zθ ⋅
θ =
2 2TAREA do di4π⎡ ⎤ ⎡ ⎤= ⋅ −⎢ ⎥ ⎣ ⎦⎣ ⎦
FVθftCPθ�
TAREA
ftCPall � 0.6 ⋅ SMYS
ftbL ftbC ftCPAISCT
ftball ftCPallθ + θ θ⎡ ⎤θ = �⎢ ⎥⎣ ⎦
If AISCTθ 1.0 then AISCTθ � OK1 If AISCTθ � 1.0 then AISCTθ � OK1 If AISCTθ � 1.0 then AISCTθ � NOTOKA
LHθfsTθ �
TAREA
fsall � 0.4 ⋅ SMYS
fsTmax � MAX('fsTθ)
FIGURE 7.28 The equations sheet for the lifting analysis of the v acuum. This f gure is where the spreadsheet lists all the equations used in the algorithm.
CH007-H8766.indd 155CH007-H8766.indd 155 6/17/2008 1:52:02 PM6/17/2008 1:52:02 PM

Pressure Vessel and Stacks Field Repair Manual156
If fs Tθ � fsall then fsTθ � NOTOK2
2 2eT (ftbL ftbC ftCP ) 3 fsTσ θ = θ + θ + θ + θ
eTRAT eT
SMYSσ θσ θ �
TV 9.807 x TH 9.807 yMbtailθ �
2 1000θ ⋅ ⋅ + θ ⋅ ⋅
⋅MbtailθZtailug
btail1000000
σ θ �
TV 9.807Tent
2 Abringθ ⋅σ θ �⋅
ALUG � WLt ⋅ ttail − Dhole ⋅ ttail
TV 9.807τtailθ �4 ALUG
θ ⋅⋅
Tent btailAISCRT
0.6 yL 0.66 yL
⎡ ⎤σ θ σ θθ = +⎢ ⎥⋅ σ ⋅ σ⎣ ⎦
RAT eTσeTailσ �
σyL
WLtRtLug �
2
DholeHA RtLug
2⎡ ⎤
� � ⋅ ttail ⎢ ⎥⎣ ⎦
TVt � MAX('TVθ) PVt � TVt ⋅ 9807
PVtHT
Nt HAσ �
⋅
If σHT 0.45 ⋅ σyL then σHT � OK If σHT � 0.45 ⋅ σyL then σHT � OK
If fsTθ fsall then fsTθ � OK2 If fs Tθ � fsall then fsTθ � OK2
5.66 ⋅ LLθ ⋅ eσbwθ =
AISCWθ =
σbwθ2 � 3 ⋅ Tbwθ2σwθ = 0.9.
�5.66 ⋅ LLθ ⋅ e
h ⋅ do2 ⋅ π hp ⋅ Dp2 ⋅ π
2.83 ⋅ MT 2.83 ⋅ MTτbwθ = �π ⋅ h ⋅do2 π ⋅ hp ⋅ Dp2
σwθσyL
If σHT � 0.45 ⋅ σyL then σHT � NOTOK
;COMPUTING STRESS IN TRUNNION WELDS
FIGURE 7.28 (continued)
CH007-H8766.indd 156CH007-H8766.indd 156 6/17/2008 1:52:03 PM6/17/2008 1:52:03 PM

Lifting and Tailing Devices 157
Comment
Length from tailing lug to Center of Gravity (CG)
Lift angle
Outside radius of center line of skirt tocenter of tail lug hole
Length from tailing lug to trunnion (HC � HT)
Vertical lift force component at trunnion -varies with θ
Lift weight includes dynamic load factor
Length from trunnion to CG
Vertical lift force component at tail lug -varies with θ
Lift weight component perpendicular to vertaxis at trunnion
Lift force component at tail lugperpendicular to vert axis
Top lift force component coincident withvessel vert axis
Tail lift weight component coincident withvert axis
Maximum weight component at topperpendicular to vert axis at 20 degrees
Maximum weight component at top parallelto vessel axis at 90 degrees
Maximum vertical weight component at topat 90 degrees
Maximum weight on lifting trunnion
ANALYSIS FOR TRUNNIONS
Number of trunnions
Maximum force on one lifting trunnion
Section modulus of trunnion crosssection, cu mm
Outside diameter of trunnion
Inside diameter of trunnion
Longitudinal Bending stress in trunnion
Length of trunnion
Allowable bending stress of trunnion
Specified minimum yield stress of trunnionmaterial (SA-516-70)
Unit
mm
deg
mm
mm
Kg
Kg
mm
Kg
Kg
Kg
Kg
Kg
Kg
Kg
Kg
Kg
N
mm
mm
MPa
mm
OutputVariables Sheet
InputStatus
9639
0
L
L
L
L
L
L
L
L
L
L
L
L
6755
30180
840000
20541
2
1500
1450
575
260
θ
F
π
Z
e
Trunnion cross sectional area, sq mm
MPaMaximum longitudinal bending stress ontrunnion
MPaMaximum circumferential bending stress ontrunnion
Name
RATLLθ
HC
R
HL
LLθ
W
RATTLθ
HT
TLθ
LVθ
TVθ
LHθ
THθ
LVmax
LHmax
LLmax
Lmax
N
do
di
ftb
ftball
SMYS
TAREA
ftbLθ
ftbCθ
FHθ
0.31938369
268282.306
0.680616302
571717.694
268282.306
571717.694
0
0
292572.316
840000
840000
840000
4118940
3.1416
42018490.9
171.6
115846.5
0
18.002200
0 N Force component due to LH
FIGURE 7.29 The variable sheet for the vacuum tower lifting analysis. The variable sheet is where the spreadsheet lists all the v ariables used in the algorithm. The computations of Abring and Ztailug are shown in Figure 7.30 .
CH007-H8766.indd 157CH007-H8766.indd 157 6/17/2008 1:52:03 PM6/17/2008 1:52:03 PM

Pressure Vessel and Stacks Field Repair Manual158
1315522.29 Force component due to LV
11.355736 Compressive stress on trunnion
156 Allowable compressive stress
0.177701111AISC Allowable Ratio for bending andshear per Section 5, Chapter H
0.177701111
0 Shear stress at trunnion vessel wall
104 Allowable shear stress
7.25097435Maximum shear stress at trunnion & vesselwall
0If this space contains an entry then shearstress is acceptable
If this space contains an entry then shear stress is NOT acceptable
29.357937 Von Mises equivalent stress for trunnion
0.112915143
ANALYSIS FOR TAIL LUGS
350 Distance from tail lug hole center to lug edge
484Radial distance from tail lug holecenter to centerline of skirt
981196.199 Bending moment at tail lug attachment
87.606803
N
MPa
MPa
MPa
MPa
MPa
MPa
MPa
mm
mm
Nm
MPa Bending stress in each tail lug
.0112 Section modulus of ring assembly fromExcel spreadsheet, cu m
98876 Tensile stress area of each tail lug, sq mm
61200 Shear area of each tail lug, sq mm
700 mm Width of each tail lug
120 mm Thickness of each tail lug
190 mm Diameter of hole in each tail lug
22.903739 MPa Shear stress in each tail lug
222.466320 MPa Von Mises equivalent stress in each tail lug
28.352863 MPa Tensile stress in each tail lug
0.692278282 AISC Ratio for each tail lug based onSec. 5 Chapter H
260 Yield stress of lug plate (SA-516-70)
0.855639691 Ratio of equivalent stress of SMYS
CHECKING HOOP TENSILE STRESS INTAIL LUGS
350 mm Radius of tail lug from center to edge of lug
FVθL
L
L
L
L
L
L
L
L
L
L
ftCPθftCPall
AISCTθ
OK1
NOTOKA
fsTθ
fsall
fsTmax
OK2
NOTOK2
σeTθ
RATσeTθ
x
y
Mbtailθ
σbtailθ
Ztailug
Abring
ALUG
WLt
ttail
Dhole
τtailθ
σeTail
σTentθ
AISCRTθ
σyL
RATσeT
RtLug
HA 30600 Hoop tensile area, sq mm
CommentUnitOutputInput NameStatus
FIGURE 7.29 (continued)
CH007-H8766.indd 158CH007-H8766.indd 158 6/17/2008 1:52:03 PM6/17/2008 1:52:03 PM

Lifting and Tailing Devices 159
Comment
Maximum tensile weight on both tail lugs
Maximum tensile load on both tail lugs
Hoop Tensile stress on each tail lug
Number of tail lugs
COMPUTING WELD STRESSES ONTRUNNION
Bending stress in trunnion-padconfiguration
Diameter of trunnion pad
Unit
MPa
MPa
mm
MPaShear stress in trunnion-padconfiguration
InputStatus
2
L
L
L
2000
0Torsion moment on trunnion� 0 because of grease
Name
TVt
PVt
σHT
Nt
If this space is filled than Hoop Tensionstress is NOTOK
NOTOK
σbwθ
Size of weld connecting trunnionto pad or shell
mm8 h
Size of weld connecting trunnionpad to shell
mm8 hp
Dp
τbwθ
MT
σwθAISCWθ
Output
571717.694
5606835.423459
91.6149579
If this space is filled than Hoop Tensionstress is OK
OK 91.6149579
24.125312
0
21.7127808
0.083510696
FIGURE 7.29 (continued)
CH007-H8766.indd 159CH007-H8766.indd 159 6/17/2008 1:52:04 PM6/17/2008 1:52:04 PM

Pressure Vessel and Stacks Field Repair Manual160
Base Ring Block
reinforced with 2 parallel beams
Total Tailing Weight = 571,717.70 kg
Base Ring Block Material 5A-36Yield Strength, Fy = 248.000 MPaUltimate Strength, Fu = 399.896 MPa
28.000 mm 70.000 mm 70.000 mm 165.000 mm 140.000 mm 165.000 mm 210.000 mm 12,514.0000 mm 70 mm 700 mm
Location of tail lugs,
theta = 11 deg.
Skirt OD, Do = Di + 2 * t1 = 12570 mm
Effective Length, L1 = 0.55 * (Do * t1) ^ 0.5 = 326.29 mm
Total Effective Length, Le
Case 1: If 2.L1 < L then Le = t3 + L1 * 3
Case 2: If 2.L1 > = L then Le = t3 + L1 + L
2.L1 = 652.5884 in. > or = L
====>> Le = t3 + L1 + L = 606.2942 mm
t1 =
t2 =t3 =
t4 =
L2a =L2b =
L3 =
L4 =
L =Di =
L2a L2b
h1
L1
L4t1L3
L1
L1
h2
t4
t3t2
341
2
L
Di — skirt inside diameter
R � radius of neutral axis
Part # Width Height Area Location A * C A * d^2 I (mm) (mm) (mm^2) (mm) (mm^4) (mm^4)
1 skirt 606 28 16976 714 12121033 453217268 4543263822 base pl. 70 305 21350 741 15809675 769864279 9353712583 top rg. 70 165 11550 811 9361275 780135362 8063394244 Top stiff 70 700 49000 350 17150000 1971922224 3972755557
Sum (Σ) ====>> 98876 54441983 6168792622
h1 = Σ(A*C)/Σ(A) � 550.6074 mm Z1 � (I)/h1 � 11203615 mm^3
h2 � 342.3926 mm Z2 � (I)/h2 � 18016721 mm^3
Radius of Neutral Axis, R � 6696 mm
Center Line
FIGURE 7.30 Ring block section properties for vacuum tower, where Abring � 98876 mm 3 and Ztailug � 11203615mm 3 � 0.0112m 3 .
CH007-H8766.indd 160CH007-H8766.indd 160 6/17/2008 1:52:04 PM6/17/2008 1:52:04 PM

Lifting and Tailing Devices 161
0.34
0.32
0.3
0.28
0.26
0.24
0.22
0.2
0.18
0.160 10 20 30 40 50 60 70 80 90
θ vs. AISC ratio for trunnion
Lift angle θ (degrees)
AIS
C r
atio
for
trun
nion
AISCTθ
FIGURE 7.32 The AISC ratio for the trunnions versus the lift angle θ .
θ vs. Trunnion lift loads900,000
800,000
700,000
600,000
500,000
400,000
300,000
200,000
100,000
00 10 20 30 40 50 60 70 80 90
Lift angle θ (degrees)
Trun
nion
lift
wei
ght c
ompo
nent
s LH
θ* &
LV
θ (k
g)
LHθ
LVθ
FIGURE 7.31 Trunnion lift loads LV θ and LH θ plotted against θ .
θ vs. weight components for both tail lugs
600,000
500,000
400,000
300,000
200,000
100,000
00 10 20 30 40 50 60 70 80 90
Lift angle θ (degrees)
TVθ
THθ
TLθ
Wei
ght c
ompo
nent
s fo
r bo
th ta
illu
gs T
Vθ,
TH
θ, T
Lθ (k
g)
FIGURE 7.33 Weight components TV θ , TL θ , and TH θ plotted against the lift angle θ .
CH007-H8766.indd 161CH007-H8766.indd 161 6/17/2008 1:52:04 PM6/17/2008 1:52:04 PM

Pressure Vessel and Stacks Field Repair Manual162
REFERENCES
1. Duerr , David , “ Pinned Connection Strength and Behavior , ” Journal of Structural Engineering ASCE , February 2006 , pp 183 – 194 .
2. Bragassa, P. W., “ Tank TSF-09/18 V-Tanks Remediation Tank Lifting Design, Document ID: EDF-5595, Project No. 22901, ” Idaho National Engineering and Environmental Laboratory, April 18, 2005.
3. American Institute of Steel Construction (AISC), AISC Manual of Steel Construction , 9th edition, Chicago, Illinois, July, 1989.
4. American Society of Mechanical Engineers (ASME) , ASME BTH-1-2005 Design of Below-the-Hook Lifting Devices , ASME , 2005 .
5. American Society of Mechanical Engineers (ASME) , ASME B30.20-2006 Below-the-Hook Lifting Devices , ASME , 2006 .
6. Hicks , John , Weld Joint Design , 3rd edition , Industrial Press, Inc. , New York , 1999 .
0.9
0.8
0.7
0.6
0.5
0.4
0.3
0.2
0.1
00 10 20 30 40 50 60 70 80 90
θ vs. AISC ratio for each tail lug
Lift angle θ (degrees)
AIS
C r
atio
for
each
tail
lug
AISCRATθ
FIGURE 7.34 AISC ratio for each tail lug plotted against the lift angle θ .
Top
4500
200 200
30°
400
400
400
400
1000
2000
1000
25 mm
7.5°
FIGURE 7.35 Drawing of actual trunnion with plug weld reinforcing pad and gusset plates.
CH007-H8766.indd 162CH007-H8766.indd 162 6/17/2008 1:52:05 PM6/17/2008 1:52:05 PM

163
Chapter 8
Assessing Weld Attachments
The assessment of welds attaching lifting lugs, tail lugs, and trunnions to v es-sels and stacks is a v ery important function. A simple lifting lug is sho wn in Figures 8.1(a) and (b) . The lug in Figure 8.1(a) is attached to the v essel or stack with simple “ U ” bend welding—tw o f llet welds on each side and one f llet weld at the bottom of the lug. The lug in Figure 8.1(b) is attached to the vessel or stack by tw o f llet welds on the outside, tw o f llet welds on the tw o bottom portions, two f llet welds on the inside of the cutout, and the f llet weld on the arc at the top of the cutout. The pattern sho wn in Figure 8.1(b) is used when more welding strength is needed.
(a) (b)
FIGURE 8.1 Welding of two simple lifting lugs .
CH008-H8766.indd 163CH008-H8766.indd 163 6/17/2008 1:56:53 PM6/17/2008 1:56:53 PM

Pressure Vessel and Stacks Field Repair Manual164
Example 8.1 Evaluation of the Welds in a Simple “ U ” Confi guration
Here, we will analyze the confi guration shown in Figure 8.1(a) . Refer now to Figure 8.2 .
Figure 8.3(a) shows the equations used in assessing these welds, and Figure 8.3(b) shows the variables and solutions. As you can see from Figure 8.3(b) , the welds are satisfactory.
LB
LS
HTangent line
Lug hole centerline
FIGURE 8.2 Lifting lug with simple “ U ” design .
CH008-H8766.indd 164CH008-H8766.indd 164 6/17/2008 1:56:54 PM6/17/2008 1:56:54 PM

Assessing Weld Attachments 165
;CALCULATION OF "U" SHAPED WELD ON LUG
P2 �P1 IF
2
P3 �P1 IF HC
2 HL
Aw � ( )LB � 2 LS 0.707 h
Th �P3
Aw
LCG �LS2
2 LS � LB
Jw �8 LS3 LS LB2 � LB3� 6
12
LS4
2 LS � LB�
J � 0.707 h JwMw � P3 (H-LCG)
τWa �
MwLB
2
J
τWL �Mw (LS - LCG)
J
TTOT � �h � �WL;STRESS IN WELD WITH VESSEL IN VERTICAL POSITION
σw1 �P2
Awσw1all � 0.4 σywIf σw1 < σw1all then σw1 � OKAY1If σw1 � σw1all then σw1 � OKAY1If σw1 > σw1all then σw1 � NOTOK1
σw2 � τWa2 � τTOT2
σw2all � 0.4 σywIf σw2 < σw2all then σw2 � OKAY2If σw2 � σw2all then σw2 � OKAY2If σw2 � σw2all then σw2 � NOTOK2
;STRESS IN WELD WITH VESSEL IN HORIZONTAL POSITION
-
FIGURE 8.3(a) The equations sheet sho wing the equations used in the assessment of the welds.
CH008-H8766.indd 165CH008-H8766.indd 165 6/17/2008 1:56:54 PM6/17/2008 1:56:54 PM

Pressure Vessel and Stacks Field Repair Manual166
Unit
psi
Comment
Ibm Load on lug in vertical position
Weld area, sq in
in Distance from hole in tailing lug to hole in toplifting lug
in Distance from tailing lug hole to CG
Ibm Load on lug in horizontal position
Ibm Weight of vessel
Impact Factor (Normally 1.5)
in Length of lifting lug on bottom
in Weld height on sides
in Lug weld leg size
psi Shear stress in weld in horizontal position
in Distance to weld centroid
Weld unit polar moment of inertia, in^3
Weld polar moment of inertia, in^4
in Height from bottom of lug to centerline of lug hole
in-Ib Moment in weld
Weld axial torsional stress
psi Weld lateral torsional stress
psi Total lateral weld shear stress
STRESS IN WELD WITH VESSEL IN VERTICALPOSITION
STRESS IN WELD WITH VESSEL IN HORIZONTALPOSTION
psi Stress in weld with vessel in horizontal position
psi Stress in weld with vessel in horizontal postion
psi Allowable stress in weld for vertical position
psi
Input
1500
860
500,000
1.5
28
20
2.5
36
38000
38000 Allowable stress in weld for vertical position
psi Specified minimum yield stress of weld metal
If this space is filled then vertical weld stress is OK
Output
4054.590623
375,000
120.19
215,000
1788.834346
5.882353
12649.725490
22358.389804
6475294.117647
4088.662813
5877.497159
3120.059905
7140.355592
95,000
3120.059905
7140.355592 If this space is filled then horizontal weld stress is OK
If this space is filled then vertical weld stress is NOTOK
h
J
H
P2
Name
�Wa
Aw
HL
HC
P3
P1
IF
LB
LS
τh
LCG
Jw
Mw
�WL
�TOT
�w1
�w2
�w1all
�w2all
oyw
OKAY1
OKAY2
NOTOK1
NOTOK2If this space is filled then horizontal weld stress isNOTOK
FIGURE 8.3(b) The variable sheet with the variables and solutions .
CH008-H8766.indd 166CH008-H8766.indd 166 6/17/2008 1:56:54 PM6/17/2008 1:56:54 PM

Assessing Weld Attachments 167
Example 8.2 Lifting Lug with “ U ” Shape and Cutout
Figure 8.4 illustrates a simple lifting lug with a cutout for more welding area. The solution to this kind of lug weld confi guration is shown in Figures
8.5(a) and 8.5(b) . As you can see in Figures 8.5(a) and 8.5(b) , the welds are satisfactory for this application.
Side and HorizontalWelds(Weld area � ABW)
Side weldson insideof cutout(Weld area � ASW)
Arc weldin cutout(Weld area � ARW)
LB
L1B
y
x
L1h
R2
LS
H
Tangent line
Lug hole centerline
FIGURE 8.4 Lifting lug with weld attachment with a simple cutout .
CH008-H8766.indd 167CH008-H8766.indd 167 6/17/2008 1:56:55 PM6/17/2008 1:56:55 PM

Pressure Vessel and Stacks Field Repair Manual168
P2 �P1 IF
2
P3 �P1 IF HC
2 HL
L1B �LB2
� R2
XB� LB2
L1B2
2 (L1B � L1h)�
YB � LS �2 L1B LS � LS2
2 (L1B � LS)
XS � R2
YS �L1h
2XA � 0
� � 3.1416
YA � L1h2 R2
��
ABW � 0.707 h (L1B�LS)ASW � 0.707 h L1hARW � 0.707 � h R2ATOT � 2 (ABW � ASW) � ARWAY1 � ABW YB
AY3 � ASW YS
AY5 � ARW YA
AY� 2 (AY1 � AY3) � AY5
;By symmetry Xbar � 0
Xbar � 0
Ybar �AY
ATOT
R1 � XB2 � (Ybar�YB)2
R3 � XS2 � (Ybar�YS)2
R5 � YA–Ybar
S3 �P3
ATOT
JB �(L1B � LS)4 6 L1B2 LS2�0.707 h
(L1B � LS)12
JS �0.707 h L1h3
12
JR � 0.707 h � R23
JB JS� ABW R12� ASW R32�J � 2 �JR�ARW R52
FIGURE 8.5(a) The equations sheet for the weld assessment .
CH008-H8766.indd 168CH008-H8766.indd 168 6/17/2008 1:56:55 PM6/17/2008 1:56:55 PM
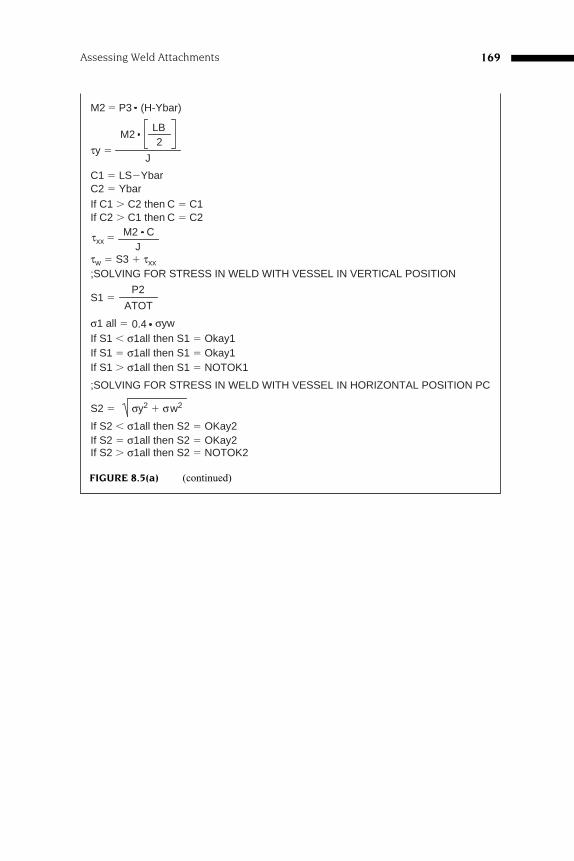
Assessing Weld Attachments 169
M2 P3 (H-Ybar)�
τy �
M2LB2
J
C1 � LS�YbarC2 � Ybar
If C2 � C1 then C � C2If C1 � C2 then C � C1
M2 CJ
τxx �
τw � S3 � τxx
;SOLVING FOR STRESS IN WELD WITH VESSEL IN VERTICAL POSITION
S1 �P2
ATOT
σ1 all � 0.4 σywIf S1 σ1all then S1 � Okay1If S1 � σ1all then S1 � Okay1If S1 � σ1all then S1 � NOTOK1
;SOLVING FOR STRESS IN WELD WITH VESSEL IN HORIZONTAL POSITION PC
S2 � σy2 � σw2
If S2 � σ1all then S2 � OKay2If S2 � σ1all then S2 � NOTOK2
If S2 σ1all then S2 � OKay2
FIGURE 8.5(a) (continued)
CH008-H8766.indd 169CH008-H8766.indd 169 6/17/2008 1:56:55 PM6/17/2008 1:56:55 PM

Pressure Vessel and Stacks Field Repair Manual170
Input Output Unit Comment
1.5
3.1416
1562.13917
170.681583
6.01376709
psi
in
450,000 lb Load on lug with vessel in vertical position
600,000 lb Lift weight
Impact Factor (1.5 is recommended)
263268.443 lb Load on lug with vessel in horizontal position
1464 in Distance from hole in tail lug to hole in lift lug
2 in Centroid of side and horizontal bottom welds in x direction
5 in Centroid of side and horizontal bottom welds in y direction
0 in Centroid of arc weld in cutout (� 0 by symmetry)
11.2732366 in Centroid of arc weld in cutout in y direction
57.349012 Area of side and horizontal welds, sq in
2.897 in Lug weld leg size
168.530722 Sum of weld area, sq in
20.48179 Side welds area on inside of cutout, sq in
12.8691183 Weld area of arc in cutout, sq in
331.804998 Weld areas of outside side welds times centroid, in^3
102.40895 Weld areas of inside side welds times centroid, in^3
145.076615 Weld area of arc in cutout times centroid, in^3
1013.50451 Weld area times sum of centroids
0 Group of welds centroid
6.01376709 Group of welds centroid
9.50273687 in Outside side welds centroid
2.24225862 in Inside side welds centroid
5.25946948 in Centroid of arc in cutout group
Shear stress in weld when vessel is in horizontal position
2561.78427 Polar moment of inertia of outside side and bottom welds, in^4
Polar moment of inertia of inside side weld of cutout, in^4
Extreme fibers below centroid
VESSEL IN VERTICAL POSITION
2670.1363 psi Stress in weld
15,200 psi Allowable weld stress
Name
IF
π
S3
JS
51.4764732 Polar moment of inertia of arc in cutout, in^4JR
16435.8094 Polar moment of inertia of group of welds, in^4J
7894428.84 Moment in weld, in-lbfM2
36 in Vertical distance from bottom horizontal weld to lug hole centerH
5763.82602 psi Weld Torsional stressτy
11.9862329 in Extreme fibers above centroidC1
C2
11.9862329 in Greater of C1 or C2C
5757.21343 psi Lateral torsional stress in weldτxx
7319.3526 psi Total lateral shear stress in weldτw
P2
P1
P3
856.5 in Distance from hole in tail lug to vessel CGHC
HL
10 in Bottom weld leg lengthL1B
24 in Lug width at bottomLB
2 in Radius of arc weld made on lug in cutoutR2
9.5 in Centroid of side and horizontal bottom welds in x directionXB
10 in Weld cutout heightL1h
5.78571429 in Centroid of side and horizontal bottom welds in y directionYB
18 in Side weld heightLS
XS
YS
XA
YA
ABW
h
ATOT
ASW
ARW
AY1
AY3
AY5
AY
Xbar
Ybar
R1
R3
R5
JB
S1
σ1all
38,000 psi Specified minimum yield stress in weldσyw
2670.1363 If this space is filled then weld stress is acceptable in verticalposition
Okay1
NOTOK1 If this space is filled then weld stress is NOTacceptable in vertical position
VESSEL IN HORIZONTAL POSITION
9316.36264S2 Stress in weld
9316.36264
psi
Okay2 If this space is filled then weld stress is acceptable inhorizontal position
NOTOK2 If this space is filled then weld stress is NOT acceptable inhorizontal position
FIGURE 8.5(b) The variables sheet for the weld assessment .
CH008-H8766.indd 170CH008-H8766.indd 170 6/17/2008 1:56:55 PM6/17/2008 1:56:55 PM

Assessing Weld Attachments 171
A FEW WORDS ABOUT REINFORCING PADS AND LIFTING LUGS
Lifting lugs are connected to the shell with f llet welds. If lifting lugs are welded to a reinforcing pad, and the pad is connected to the shell with f llet welds, then the capacity of the lifting lugs is a function of the strength of the pad f llet welds, as well as the f llet welds attaching the lug to the pad. Quite often this is not acceptable. Fillet welds can, and will, shear of f if the loads exceed their capacity . For lifting lugs, quite often the reinforcing pad is rec-tangular or square. If the thickness of the shell is considered too small for the capacity of lifting lugs, then tw o stif fening rings may be welded around the circumference of the shell with the lifting lugs welded between the rings. In this manner the lifting load is distributed around the shell and not localized.
CH008-H8766.indd 171CH008-H8766.indd 171 6/17/2008 1:56:56 PM6/17/2008 1:56:56 PM

Pressure Vessel and Stacks Field Repair Manual172
Example 8.3 Evaluating Welds for Top Flange Lifting Lugs
Top fl ange lifting lugs are mounted on cover plates that are bolted to a nozzle on the centerline of a vessel. They commonly consist of a lug plate welded to a cover plate. One such lug is shown in Figure 8.6(a) . As you can see in the fi gure, the weld sizes vary; hence, the “ line ” weld concept cannot be used because that method depends on all welds being the same size. The algorithm used for assessing the welds in Figure 8.6(a) is shown in Figure 8.6(b) . The corresponding variable sheet is shown in Figure 8.6(c) .
20
20
100
190190
2T
(HO
LD)
SKIPPING CASKET
1045 e1915 3 PHK O.D. 1171.4
N32–44.5 WA. HOLES ON 1089.2 B.C.D.
2020
2020
1009.6 DIA
� 600 �
� 567 �
30
5.2°
250
150
1.6
151.
651
0
691.
6
R260
φ124
41 F
OR
BO
LT
TE
NS
ION
ER
φ1.5/8°–HHN
SHACKLE F TYPE “C2140”
SAFE WORKING LOAD � 200 TonsSUPPLY BY OTHERL�450
150 14
1411
11 150
20
20 20
20
150 100 150
FIGURE 8.6(a) A top f ange lug used to lift a reactor. The lift was successful.
CH008-H8766.indd 172CH008-H8766.indd 172 6/17/2008 1:56:56 PM6/17/2008 1:56:56 PM

Assessing Weld Attachments 173
LTOP20mm � 2 567 100� 2LTOP14mm � 4 2 150 20� 4 150� 8LBOT20mm � 2 600 4 20�
T20mm � 20 cosd (45)T14mm � 14 cosd (45)WA � (LTOP20mm � LBOT20mm) T20mm T14mm� LTOP14mm
WC �(WA) σy
1.35
�act �LHmax 9.807
WAσall � 0.4 σy
If �act σall then τact � OK1If �act � σall then τact � OK1If �act � σall then τact � NOTOK1AreaT1 T20mm 100�
AreaS1 2 567 T20mm�
AreaB1 � T20mm 100SUMA1 � AreaT1�AreaS1�AreaB1yT1 � 283.5yS1 � 0yB1 � �283.5yT1SQ � yT1 yT1yS1SQ � 0yB1SQ � yB1 yB1AyT1 � AreaT1 yT1AyS1 � AreaS1 yS1AyB1 � AreaB1 yB1SUMAy1 � AyT1 AyS1� AyB1�
AyT1sq � AreaT1 yT1 yT1AyS1sq � AreaS1 yS1 yS1AyB1sq � AreaB1 yB1 yB1
SAysq1� AyT1sq�AyS1sq�AyB1sq
IT1 � 0
IS1 �2 T20mm 5673
12IB1 � 0I1 � SAysq1 � IT1 � IS1 � IB1
Z1 �I1
5672
AreaTL � T14mmAreaSL � T14mm
15020
AreaBL � T14mm 150
FIGURE 8.6(b) The equations sheet of the algorithm .
CH008-H8766.indd 173CH008-H8766.indd 173 6/17/2008 1:56:56 PM6/17/2008 1:56:56 PM

Pressure Vessel and Stacks Field Repair Manual174
yTL � 220.0ySL � 230.0yBL � 240.0yTLsq � yTL yTLyS1sq � ySL ySL
yBLsq � yBL yBLAyTL � AreaTL yTLAySL � AreaSL ySLAyBL � AreaBL yBLAyTLsq � AreaTL yTL yTLAySLsq � AreaSL ySL ySLAyBLsq � AreaBL yBL yBL
SAysq � AyTLsq � AySLsq � AyBLsqITL � 0
ISL �T14mm 203
12IBL � 0IL � ITL � ISL � IBL � SAysqIL8 � 8 IL
ZLIL8230
�
AreaTB1 T20mm 100�
AreaSS1 � 2 T20mm 600AreaBB1 � T20mm 100
yTB1 � 300ySB1 � 0yBB1 � �300yTB1sq � yTB1 yTB1ySB1sq � ySB1 ySB1yBB1sq � yBB1 yBB1AyTB � AreaTB1 yTB1AySS � AreaSS1 ySB1AyBB � AreaBB1 yBB1
SAyB � AyTB�AySS�AyBBAyTBsq � AreaTB1 yTB1 yTB1AySSsq � AreaSS1 ySB1 ySB1
AyBBsq � AreaBB1 yBB1 yBB1SAyBB � AyTBsq � AySSsq � AyBBsqIBT � 0
FIGURE 8.6(b) (continued)
CH008-H8766.indd 174CH008-H8766.indd 174 6/17/2008 1:56:56 PM6/17/2008 1:56:56 PM

Assessing Weld Attachments 175
ISS �112
T20mm 6003
IBOT � SAyBB � ISS
ZBOT �IBOT300
ZTOT � Z1 � ZL � ZBOTITOT � I1 � IL � IBOT
b � e � tcp2
PVmax � LVmax 9.807
σb �PVmax b
ZTOT
σy then σb = OK2If σb 0.6σy then σb � OK2Ifσb � 0.6σy then σb � NOTOK2If σb � 0.6
σEFF � β σb2 3 τact2+
σaEFF � 0.9 σyIf σEFF σaEFF then σEFF=OK3If σEFF � σaEFF then σEFF � OK3If σEFF � σaEFF then σEFF � NOTOK3
FIGURE 8.6(b) (continued)
CH008-H8766.indd 175CH008-H8766.indd 175 6/17/2008 1:56:56 PM6/17/2008 1:56:56 PM

Pressure Vessel and Stacks Field Repair Manual176
Input Name Output Unit Comment
248
276960.6
LTOP20mm
LTOP14mm
LBOT20mm
T20mm
T14mm
WA
WC
σy
τact
LHmax
σall
OK1
NOTOK1
AreaT1AreaS1
AreaB1
SUMA1
yT1
yS1
yB1
yT1SQ
yS1SQ
yB1SQ
AyT1
AyS1
AyB1
SUMAy1
AyT1sq
AyS1sq
AyB1sq
SAysq1
IT1
IS1
IB1
I1
Z1
AreaTL
AreaSL
AreaBL
yTL
ySL
yBL
yTLsq
yS1sq
yBLsq
AyTL
AySL
AyBL
AyTLsq
AySLsq
AyBLsq
SAysq
ITL
ISL
IBL
IL
IL8
ZL
1334
2480
1280
14.1421356
9.89949494
61518.29
11301137.7
44.1519523
99.2
44.1519523
1414.2135616037.1818
1414.21356
18865.6089
283.5
0
�283.5
80372.25
0
80372.25
400929.545
0
-400929.54
0
113663526
0
113663526
227327052
0
429648128
0
6569751802317372.77
1484.92424
197.989899
1484.92424
220
230
240
48400
52900
57600
326683.333
45537.6767
356381.818
71870333.2
10473665.6
85531636.3
167875635
0
6599.66329
0
167882235
1343057878
5839382.08
mm
mmmm
mm
mm
MPa
MPa
N
mm
mm
mm
COMPUTING SHEAR CAPACITY
Length of 20 mm fillet welds on top of cover plate
Length of 14 mm fillet welds on top cover plate
Length of 20 mm fillet welds on bottom
Throat of 20 mm fillet weld
Throat of 14 mm fillet weld
Total weld area, sq mm
Weld capacity of welds on top lug
Yield strength of weld metal
Actual shear stress in welds
Maximum vertical force
Allowable shear stress for fillet welds
If this space has a value, the τact is acceptable
If this space has a value, the τact is not acceptable
COMPUTING THE MOMENT OF INERTIA IN THE LUG WELDS
FOR SECTION 1
Weld area for 100 mm top side, sq mm
Weld area for 567 mm sides, sq mm
Weld area for 100 mm bottom side, sq mm
Sum of 20 mm weld area on top of cover plate, sq mm
Distance from centroid of top weld to lug centerline
Distance from centroid of side welds to lug centerline
Distance from centroid of bottom weld to lug centerline
Total moment of inertia of welds on top of cover plate, mm^4
Section modulus of top center lug plate, cu mm
FOR THE FOUR LEGS ATTACHED TO SECTION 1
Weld area on top side of leg, sq mm
Weld area on side of leg, sq mm
Weld area on bottom side of leg, sq mm
Distance from centroid of weld to lug centerline
Distance from centroid of weld to lug centerline
Distance from centroid of weld to lug centerline
Moment of inertia for welds on top legs, mm^4
Section of 8 welded sides of braces, cu mm
FIGURE 8.6(c) The variable sheet of the algorithm .
CH008-H8766.indd 176CH008-H8766.indd 176 6/17/2008 1:56:57 PM6/17/2008 1:56:57 PM

Assessing Weld Attachments 177
Input Name Output Unit Comment
250
150
142782.03
.9
AreaTB1
AreaSS1
AreaBB1
yTB1
ySB1
yBB1
yTB1sq
ySB1sq
yBB1sq
AyTB
AySS
AyBB
SAyB
AyTBsq
AySSsq
AyBBsq
IBT
ISS
IBOT
SAyBB
ZBOT
e
b
tcp
ITOT
ZTOT
σb
LVmax
PVmax
OK2
NOTOK2
σEFFβ
σaEFF
OK3
NOTOK3
1414.21356
16970.5627
1414.21356
300
0
-300
90000
0
90000
424264.069
0
-424264.07
0
127279221
0
127279221
0
254558441
509116882
254558441
1697056.27
325
1333974297
9853811.12
46.183714
1400263.37
46.183714
80.4034035
223.2
80.4034035
mm
mm
mm
MPa
Kg
N
MPa
MPa
FOR WELDS ON BOTTOM OF COVER PLATE
Total moment of inertia of bottom fillet welds, mm^4
Section modulus of welds on bottom center plate, cu mm
COMPUTING THE BENDING STRESS IN LUG WELDS
Distance from lug hole to top of cover plate
Moment arm from hole in lug to center of cover plate thickness
Thickness of cover plate
Total moment of inertial for lug fillet welds, mm^4
Actual bending stress in welds
Maximum horizontal force for bending
If this space is filled then σb is acceptable
If this space is filled then σb is not acceptable
TOTAL EFFECTIVE STRESS IN WELDS
Total stress in weldsFactor of yield stress
Allowable stress for effective stress
If this space has a value then σEFF is acceptable
If this space has a value then σEFF is not acceptable
Maximum horizontal weight for bending at 10 deg from TK run fortop lug 9 Aug 2006
FIGURE 8.6(c) (continued)
CH008-H8766.indd 177CH008-H8766.indd 177 6/17/2008 1:56:57 PM6/17/2008 1:56:57 PM

Pressure Vessel and Stacks Field Repair Manual178
Example 8.4 Capacities of Various Welds
Often you may be required to evaluate the capacity of different types of welds. Figure 8.7 shows a cross-section of a top fl ange lug forged to an inner circular plate that is welded to an outer forged cover plate. The originator wanted to use all fi llet welds, but a combination of fi llet and groove welds produced a much stronger welded piece.
You evaluate the welds as follows:
SL � SHEAR RESISTANCE LENGTH
SL � � � � � �50 38 50 45 38 45 150 23+ cos cos .( ) ( ) mm
The length resisting the shear is the full length of the groove welds and the weld leg of the fi llet weld times cos(45°), which is the fi llet weld throat. The fi llet weld throat is the length that determines the weld capacity. The view of the cover plate attached to the lug is axisymmetric about the center axis of the confi guration. Thus, the weld capacity is as follows:
WC � WELD CAPACITY
With a specifi ed minimum yield strength of 248 MPa and an impact factor for lifting of 1.35, you have
WC
D SL Ny� �π σ
π( )
( )( )mmmm1 35
800 150 23248
1 352
2..
.
⎛
⎝⎜⎜⎜⎜
⎞
⎠⎟⎟⎟⎟
or, WC N� 69 360 855 2, , .
38
50
50
38
38
38
800 mm
310
400
50
LUG THK � 370 mm
50
FIGURE 8.7 Capacities of f llet and groove welds .
CH008-H8766.indd 178CH008-H8766.indd 178 6/17/2008 1:56:57 PM6/17/2008 1:56:57 PM

Assessing Weld Attachments 179
From prior calculations, you know that the actual load on the welds is 13,243,500 N. The actual shear stress is as follows:
τ
π� �
13243500
800 150 2335 08
, ,
..
NMP
( )mm( )mma
The allowable shear stress � 0.40 σ y � 99.20 MPa � 35.08 MPa. The maximum weight that the lug can lift is as follows:
MAX ALLOW LIFT WEIGHTN
N
( )( )� �
13243500
1 35 9 8071 000 30
, ,
. ., ,
Kg
55 9. Kg
The reactor was successfully lifted with the lug. The groove welds added signifi cant strength to the welded confi guration.
CH008-H8766.indd 179CH008-H8766.indd 179 6/17/2008 1:56:57 PM6/17/2008 1:56:57 PM

181
Chapter 9
Rigging Devices
This chapter pro vides an o verview of v arious rigging de vices used in the f eld. The plant engineer’ s responsibilities include the lifting lugs, tail lugs, and trunnions. W e have discussed these items at length in pre vious chapters. Responsibility transfers to riggers when the time comes to lift. It does not hurt for the plant personnel to know some rigging terminology to facilitate commu-nication. During the process of designing lift systems, it is advisable to ha ve riggers informed as to the design. A typical topic is the hole in the lifting lug. Nothing irritates a rigger more than when an engineer specif es that the shackle pin be 1/32 '' in diameter smaller than the lug hole. W ith such close tolerance, the pin cannot be remo ved after the lift. Consequently , construction personnel cut larger holes in the lug to f t the pins—often resulting in une ven holes and high discontinuity stresses in the lug plate.
BLOCKS
A block is a frame that encloses one or se veral sheaves and has a hook that allows attachment to a v essel or stack or other car go to a f xed anchor point. The block has tw o functions: (1) it is used to change the direction of a wire
Diamondpattern
Ovalpattern
Closedposition
Note: Nocheckweights
Openposition
FIGURE 9.1 Different kinds of snatch blocks and wire rope blocks (courtesy of the Bechtel Corporation).
CH009-H8766.indd 181CH009-H8766.indd 181 6/13/2008 11:38:22 AM6/13/2008 11:38:22 AM

Pressure Vessel and Stacks Field Repair Manual182
cable or rope; and (2) when used in pairs, blocks increase the mechanical capacity by allo wing the use of multiple parts of line. Blocks range in size from several hundreds of kilograms (or pounds) to hundreds of tons.
There are three types of blocks: snatch, wire rope, and crane block. Figure 9.1 shows variations of the snatch block and wire rope block. A typical wire rope block is shown in Figure 9.2 .
Becket
Center pin
Sheaves
Shell
Straps
FIGURE 9.2 A typical wire rope block (courtesy of the Bechtel Corporation).
CH009-H8766.indd 182CH009-H8766.indd 182 6/13/2008 11:38:23 AM6/13/2008 11:38:23 AM

Rigging Devices 183
10
9
8
7
6
5
4
3
2
1
16
15
14
13
12
11
1. Side plates2. Center plates3. “Mouse ear” deadend4. Upper tie bolts5. Center pin6. Cheek weight7. Safety precautions plate: Tonnage rating nameplate (opposite sides)8. Lower tie bolts
9. Cheek weight cap screw(s) (1 or 2)10. Trunnion pin, or hook housing trunnion11. Hook12. Hook latch13. Hook housing14. Thrust bearing15. Hook nut16. Wire rope sheaves
FIGURE 9.3 A typical crane block (courtesy of the Bechtel Corporation).
CH009-H8766.indd 183CH009-H8766.indd 183 6/13/2008 11:38:23 AM6/13/2008 11:38:23 AM

Pressure Vessel and Stacks Field Repair Manual184
TABLE 9.1 Multiplication Factors for Snatch Block Loads
Angle Between Lead and Load Lines (Degrees)
MultiplicationFactor
10 1.99
20 1.97
30 1.93
40 1.87
50 1.81
60 1.73
70 1.64
80 1.53
90 1.41
100 1.29
110 1.15
120 1.00
130 0.84
140 0.68
150 0.52
160 0.35
170 0.17
180 0.00
A snatch block is an intermittent service block that jerks or snatches the load over small distances. It is characterized by a side-opening plate that facili-tates threading wire rope through the block.
A crane block, as opposed to a snatch block, is required to perform long lifts under continuous service conditions. A crane block has multiple lar ge diameter shea ves, designed for long service life, with check plate weights added to the block side frame to increase the o verhaul weight. Normally , a crane block is outf tted with swivel hooks that allow the mass being lifted to be rotated without fouling the multiple parts of reeving. Figure 9.3 shows a typical crane block.
SELECTION OF A BLOCK
The go verning criterion for selecting a block is the load to be encountered rather than the diameter or strength of the rope used. In blocks with multiple sheaves, the load is distrib uted among se veral parts of the rope, whereas the
CH009-H8766.indd 184CH009-H8766.indd 184 6/13/2008 11:38:24 AM6/13/2008 11:38:24 AM

Rigging Devices 185
shackles or hooks on the blocks must carry the entire load. F or heavy loads and f ast hoisting, it is recommended that roller or bronze bearings be used. The block anchor supports the total weight of the load, plus the weight of the blocks and load applied to the lead line.
Snatch blocks are either single or double shea ve blocks manuf actured with a shackle eye, hook, and swi vel end f ttings. Snatch blocks are mostly applied for altering the direction of the pull on a line. The stress on a snatch block v aries with the angle between the lead and load line. When the two lines are parallel, 2,000 lbs on the lead line added to the 1,000 lbs on each load line result in a load of 4,000 lbs on the block. Table 9.1 shows the multiplication factors for snatch block loads. Figure 9.4 illustrates the rope angle as a variable of snatch block loads.
LIFTING AND ERECTING PRESSURE VESSELS AND STACKS
Figure 9.5 illustrates a typical method of lifting and erecting pressure v essels and stacks where lifting lugs are attached.
The spreader bar sho wn in Figure 9.5 avoids an y bending moment on the lift lugs because the chok er angle is 90°. As mentioned in Chapter 7, the choker angle should ne ver be more than 45° under an y circumstances. It is
45°
135°90°
0°
1000 pounds1000 pounds
1410 pounds 760 pounds
1000 pounds
1000pounds
2000 pounds 1840 pounds
FIGURE 9.4 Rope angle as a variable of snatch block loads (courtesy of the Bechtel Corporation).
CH009-H8766.indd 185CH009-H8766.indd 185 6/13/2008 11:38:24 AM6/13/2008 11:38:24 AM

Pressure Vessel and Stacks Field Repair Manual186
(a) Horizontal lift
(b) Vertical lift
Choker
Shackle
u u
(c) Spreader bar rig avoids excessive bending moments on lifting lugs
Crane hook
Large shackle
Spreader bar lug plate
Spreader bar –on“I” or “W” beam
Shackle
Short choker
Lifting lug
Shackle
FIGURE 9.5 Lifting lugs and erection procedure.
CH009-H8766.indd 186CH009-H8766.indd 186 6/13/2008 11:38:24 AM6/13/2008 11:38:24 AM

Rigging Devices 187
highly recommended that the chok er angle be as small as possible—normally 15°. Many industrial standards use 30° as the maximum choker angle.
SHACKLES
Shackles are the most common de vices used with lifting lugs. There are three basic types: wide body , bolt type, and scre w pin shackles. Figure 9.6 shows alloy wide body shackles.
Greatly improves wearability of wire rope slings.
“WIDE BODY” SLING SAVER SHACKLES INCREASE SLING LIFE
Can be used to connect HIGH STRENGTH Synthetic Web Slings,HIGH STRENGTH Synthetic Round Slings or Wire Rope Slings.Increase in shackle bow radius provides minimum 58% gainin sling bearing surface and eliminates need for a thimble.
Increases usable sling strength minimum of 15%.
Pin is non-rotating, with weld on handles for easier use(300 ton and larger).
All ratings are in metric tons, embossed on side of bow.
Forged alloy steel from 30 through 300 metric tons.
Cast alloy steel from 400 through 1000 metric tons.
Sizes 400 tons and larger are tested to 1.33 times WorkingLoad Limit.
Sizes 300 tons and smaller are proof tested to 2 times theWorking Load Limit.
All 2160 shackles are individually proof tested, Crosbycertification available at time of order. Shackles requiring ABS,DNV, Lloyds and other certifications are available upon specialrequest and must be specified at time of order.
Shackles are produced in accordance with certified liftingappliance requirements.
PatentedNon Destructive TestingSerialization/IdentificationMaterial Testing (Physical/Chemical/Charpy)Proof Testing
All sizes Quenched and Tempered for maximum strength.
Bows and pins are furnished Dimetcoted. All Pins are Dimetcoted thenpainted red.
Type Approval and certification in accordance with DNV specifications2.7-1 Offshore Containers and DNV rules for Lifting Appliances-Loose Gear.
A
F
GJ
O
E
75 through 300metric tons
“WIDE BODY”SHACKLE
CONVENTIONALSHACKLE
B
D
H
PK G
J
R F
NC O
EC
M
L
G-2160
400 through 100metric tons
NOTICE: All G-2160 shackles are magnetic particle inspected
WorkingLoad Limit*
(metric tons)
G-2160StockNo.
WeightEach(lbs.)
Dimensions (lns.)
� 25.25
� .02.02
A B C D E G H J K P R
† 30 1021575 25 7.75 2.38 1.38 1.63 3.56 2.00 6.50 3.13 2.50 9.13 11.00
† 40 1021584 35 9.06 2.88 1.75 2.00 4.00 2.31 8.06 3.75 3.00 10.62 13.62
† 55 1021593 71 10.41 3.25 2.00 2.26 4.63 2.63 9.38 4.50 3.50 12.88 15.53
† 75 1021290 99 13.62 4.13 2.12 2.76 4.76 2.52 11.41 4.72 3.66 12.32 18.31
† 125 1021307 161 15.75 5.12 2.56 3.15 5.71 3.15 14.37 5.90 4.33 14.96 22.68
† 200 1021316 500 20.00 5.90 3.35 4.13 7.28 4.33 18.90 8.07 5.41 19.49 29.82
† 300 1021325 811 23.27 7.28 4.00 5.25 9.25 5.51 23.62 10.43 6.31 23.64 37.39
†† 400 1021334 1041 28.13 8.66 5.16 6.30 11.02 6.30 22.64 12.60 7.28 27.16 38.78
†† 500 1021343 1378 31.87 9.84 5.59 7.09 12.52 6.69 24.80 13.39 8.86 31.10 42.72
†† 600 1021352 1833 35.94 10.83 6.04 7.87 13.78 7.28 27.56 14.57 9.74 34.06 47.24
†† 700 1021361 2446 39.07 11.81 6.59 8.46 14.80 7.87 28.94 15.75 10.63 37.01 50.18
†† 800 1021254 3016 38.82 12.80 7.19 9.06 15.75 8.27 29.53 16.54 10.92 38.39 52.09
†† 900 1021389 3436 41.34 13.78 7.78 9.84 16.93 8.66 29.80 17.32 11.52 40.35 54.04
†† 1000 1021370 4022 46.30 14.96 8.33 10.63 17.72 9.06 29.92 18.11 12.11 42.32 55.3
Ultimate is 5 times the Working Load Limit.† Forged Alloy Steel. Proof Load is 2 times the Working Load Limit.
†† Cast Alloy Steel. Proof Load is 1.33 times the Working Load Limit.
FIGURE 9.6 Typical catalog of wide body shackles (courtesy of Slingmax).
CH009-H8766.indd 187CH009-H8766.indd 187 6/13/2008 11:38:25 AM6/13/2008 11:38:25 AM

Pressure Vessel and Stacks Field Repair Manual188
In cases where v ery high loads are encountered, such as the f ange lug mounted on a co ver plate bolted to a nozzle on top of the v essel, a link plate and pin assembly is often used. This arrangement is shown in Figure 9.7 .
The adv antage of this de vice o ver a shackle is that it can f t in tighter spaces; sometimes the shackle can interfere with the co ver plate bolts. It can be designed and fabricated for loads beyond conventional commercially avail-able shackles. The arrangement in Figure 9.7 is designed to lift 1600 tonnes (or metric tons).
Other rigging de vices, such as hooks, v arious cables, and types of cranes, can be found in the following recommended sources:
1. Slingmax Rigging Handbook, by II Sling, Inc. 2. Products of Industrial Training International, Inc.
● Crosby User’s Lifting Guide ● Mobile Crane Operator Reference Card ● Equipment Operator’s Card ● Rigging Gear Inspection Card ● Journeyman Rigger’s Reference Card ● Master Rigger’s Reference Card ● Lineman Rigger’s Reference Card
3. Yellow Str and W ire Rope Handbook, by Broderick & Bascom Rope Company, 10440 Trenton Ave St. Louis, Mo 63132
PTC–HD1600 Tonne load block
hooks removed
Link plate and pin assembly
Reactor tophead lift lug
Conceptual lift arrangement for 1000 tonne� reactors
FIGURE 9.7 Link plate and pin assembly arrangement.
CH009-H8766.indd 188CH009-H8766.indd 188 6/13/2008 11:38:25 AM6/13/2008 11:38:25 AM

189
Index
2:1 ellipsoidal head weights , 25–6 Air distributor piping , 92 American Engineering System
(AES) , 1 American National Standard
Institute (ANSI) safety codes , 117–18
American Society of Mechanical Engineers (ASME) , 1 , 4
f anged and dished heads , 26–7 ANSI standards , see American
National Standard Institute (ANSI) safety codes
ASCE 7-2005 , 75 ASME F & D head , 26–7 ASME STS-1, 4, 45, 46, 47, 54, 55,
64, 65, 74 ASTM SA-333 pipe material , 67
Basic wind speed , 79 Bearing failure , 119 , 129
validation tests for , 130–1 Bellows expansion joints , 109 Bending moments and torque , 5–6 Blocks , 181–4
selection , 184–5 Bridles and center of gravity , 116 British Thermal Unit (BTU) , 8
Capacity reduction factor , 122 , 123 Charpy impact test , 7 Circumferential joints , see
Longitudinal stress Circumferential stress:
conical sections , 17–18 in cylindrical shell , 12–13
Clam shell , 109
Coeff cient of thermal expansion , 8 Combined stress , 99 Conical sections:
circumferential stress , 17–18 conical transitions , 20
f air section , 21 half-apex angle, computation
of , 24 knuckle section , 19 , 21 pressure-area force balance
procedure, equations based on , 21–2
f nal values , 19 knuckle section , 19 longitudinal stress , 18
Correlation length , 41 Crane block , 182 , 183 , 184 Critical buckling stress , 128 Critical lift , 116 Critical wind velocity , 42 , 65 Cylindrical shells , 11
circumferential stress , 12–13 f nal/resulting values , 14 longitudinal stress , 13–14
Damping pads , 62–4 Density , 5 Double plane shear failure , 119 ,
125–7 Dynamic response, of pressure
vessels and stacks , 41 f ow-induced vibration-impeding
devices: damping pads , 62–4 helical strakes , 56–62 ovaling rings , 64–6
guy cables , 71–2
IDX-H8766.indd 189IDX-H8766.indd 189 6/17/2008 2:01:26 PM6/17/2008 2:01:26 PM

Index190
Dynamic response, of pressure vessels and stacks (Contd.)
basic methodology , 66–71 screening criteria , 42–56
Effective wind diameter , 82–4 Elliptical head , 14–15
partial volumes of , 33–6 Energy, units of , 7
thermal conductivity units , 8 thermal expansion, coeff cient
of , 8 Expansion joints , see Bellows
expansion joints
Fabreeka International , 62 Fillet and groove welds, capacities
of , 178–9 Finite element method (FEM) , 123 Flare stacks , 66 , 67 , 68
see also Guy cables Flexible structure , 79–80 Flow-induced vibration-impeding
devices: damping pads , 62–4 helical strakes , 56–62 ovaling rings , 64–6
Fluid-structure interaction , 41 criteria , 47–56
Force , 2 Force, pound, and second system
(FPS) system , 3 Forces on internal components , 93–7 Formulas for pressure vessels , 11
ASME F & D head weights , 26–7 conical sections:
circumferential stress , 17–18 conical transitions , 19–22 , 24 f nal values , 19 longitudinal stress , 18
cylindrical shells , 11 circumferential stress , 12–13 f nal or resulting values , 14 longitudinal stress , 13–14
elliptical head , 14–15 head weight computations , 25–6 hemispherical head weights , 27–8 partial volumes , 28
of cylinder in horizontal position , 29
of elliptical heads , 33–6 of hemispherical head , 30–1 of spherically dished heads ,
31–3 torispherical heads , 36–40
spherical shell , 14 torispherical head , 15–17
Groove and f llet welds, capacities of , 178–9
Gross ton , see Long ton Gust-effect factor , 79–82 Guy cables , 66–72
Half-apex angle, computation of , 24 Head weights, formulas for:
2:1ellipsoidal head weights , 25–6 ASME F & D head weights , 26–7 hemispherical head weights , 27–8
Heavy lift , 116 Helical strakes , 56–62 Hemispherical head , 14
partial volume of , 30–1 Hemispherical head weights , 27–8 Hoop tension , 119 , 124–5
Impact factor , 120, 166, 170, 178 Importance factor , 79 Internal assessment, of pressure
vessels , 91 forces on internal components ,
93–7 internal expansion joints , 109 lined plates and internal
components , 97 structural formulations:
support clips , 99–104
IDX-H8766.indd 190IDX-H8766.indd 190 6/17/2008 2:01:26 PM6/17/2008 2:01:26 PM

Index 191
tray support ring , 98 wire and sheet metal gauges ,
105–8
Joule , 5–6 , 7
KiloNewtons (KN) , 4–5
Lift categories , 116 Lifting and erecting pressure vessels
and stacks , 185–7 Lifting and tailing devices:
failure modes , 119 , 121 bearing failure , 121 , 129–31 double plane shear failure , 119,
121 , 125–7 evaluation , 132–6 hoop tension , 119, 121 , 124–5 out-of-plane instability
(dishing) failure , 119, 127–9 tension at net section , 119, 120 ,
121 , 122–4 multiple loads , 137–42 pin hole doubler plates , 131–2 rigging analysis , 143–50 trunnions , 150–62 see also Lifting lugs
Lifting lugs , 163 and erection procedure , 186 and reinforcing pads , 171 with simple “ U ” design , 164
equations sheet for weld assessment , 165
variable sheet for weld assessment , 166
top f ange lifting lugs , 172–7 with “ U ” shape and cutout , 167
equation sheet for weld assessment , 168–9
variables sheet for weld assessment , 170
see also Lifting and tailing devices
Light lift , 116
Lined plates and internal components , 97
Long ton , 111 , 112 Longitudinal joints , see
Circumferential stress, in cylindrical shell
Longitudinal stress , 13–14 , 18
Mass , 2 , 3 Mass damping parameter , 45–6 ,
54–5 Maximum allowable pressure
(MAP) , 11 Maximum allowable working
pressure (MAWP) , 11 Medium lift , 116 Meter, kilogram, and second (MKS)
system , 2 Metric SI system , 1 , 2
in Australia , 114 bending moments and torque ,
5–6 density , 5 familiarity , 4–5 ton, concept of , 111 warning about combining , 6–7
Metric ton , 111–12 MTBR Regenerator air distributor,
internal collapse of , 91–3 Multiple loads, on lifting and tail
lugs , 137–42
rigging analysis , 143–50
Natural frequency method , 43–5 , 49–54 , 65
Net ton , see Short ton
Occupational Safety and Health Administration (OSHA) , 117
Out-of-plane instability (dishing) failure , 119 , 127–9
Ovaling rings , 64–6
IDX-H8766.indd 191IDX-H8766.indd 191 6/17/2008 2:01:27 PM6/17/2008 2:01:27 PM

Index192
Partial volumes pressure vessel calculations , 28
of cylinder in horizontal position , 29
of elliptical heads , 33–6 of hemispherical head , 30–1 of spherically dished heads , 31–3 torispherical heads , 36–40
Pin hole doubler plates , 131–2 Pound , 3 , 4 Pressure, unit for , 6 Propagative compression , 95–7
Rayleigh’s method , 43 , 65 Reinforcing pads and lifting lugs ,
171 Remediation devices , 66 Rigging analysis, of pressure vessel
lifting , 143–50 Rigging devices , 181
blocks , 181–4 selection , 184–5
lifting and erecting pressure vessels and stacks , 185–7
shackles , 187–8 Rigid structure:
guest-effect factor , 79
Safety considerations, for lifting and rigging , 111
American National Standard Institute safety codes , 117–18
bridles and center of gravity , 116 lift categories , 116 preparation for lift , 116–17 slings, maximum capacity of ,
112–15 weight ton, concept of , 111–12
Saudi Arabia , 66 , 70 , 72 , 73 , 116 Screening criteria, of dynamic
resonance response , 42–56 Shackles , 120, 185, 187–8 Shamal , 79
Short ton , 111 , 112 Slings, maximum capacity of ,
112–13 Slow compression , see Spatially
uniform compression Slug , 3 , 4 Snatch block , 181 , 184 , 185 Spatially uniform compression , 95 ,
96 Spherical shell , see Hemispherical
head Spherically dished head:
partial volumes of , 31–3 Stack helical strake design , 60–1 Stress, unit for , 6 Structural damping coeff cient ,
43–45 Structural formulations:
support clips , 99–104 tray support ring , 98
Support clips: with applied tensile force , 100–1 with continuous f llet weld with
in-plane bending moment , 102 , 104
with continuous f llet weld with out-of-plane bending moment , 102
with in-plane bending moment , 101 , 103
with out-of-plane bending moment , 101 , 102
welded on two sides with f llet welds , 99 , 100
Surface roughness , 79 Systems of units , 1
energy, units of , 7 coeff cient of thermal
expansion , 8 thermal conductivity units , 8
metric SI system , 1 , 2 , 3 basic units , 5 bending moments and torque ,
5–6
IDX-H8766.indd 192IDX-H8766.indd 192 6/17/2008 2:01:27 PM6/17/2008 2:01:27 PM

Index 193
density , 5 familiarity , 4–5 warning about combining , 6–7
stress and pressure, units for , 6 toughness, unit of , 9–10
Tech Products Corporation (TRC) , 62 Tensile force , 69 , 71 Tensile splitting , see Hoop tension Tension at net section , 119 , 120 ,
122–4 Thermal conductivity units , 8 Thermal expansion:
coeff cient , 8 of f are stack , 70
Ton, concept of , 111–12 Tonne , see Metric ton Top f ange lifting lugs , 172–7 Topographic factor , 78–9 Torispherical heads , 15
geometrical equations , 16–17 in horizontal position , 38–40 partial volumes of , 36–8
Toughness, unit of , 9–10 Tray support ring , 98 Trunnions , 150–62 , 171
U.S. Customary Units (USCU) , 1
Velocity pressure coeff cient , 77–8 Velocity pressure distribution , 76 Vortex shedding frequency , 42
Weight ton , see Long ton Weld attachments, assessing:
f llet and groove welds, capacities of , 178–9
lifting lugs , 163 and reinforcing pads , 171 with simple “ U ” design ,
164–6 top f ange lifting lugs , 172–7 with “ U ” shape and cutout ,
167–70 Weld stresses , 99, 159 Wide body shackles , 187 Wind directionality factor , 76 , 85 Wind loading, on pressure vessels
and stacks , 75 , 85–9 basic wind speed , 79 gust-effect factor , 79–82 importance factor , 79 projected area normal to wind ,
82–4 topographic factor , 78–9 velocity pressure coeff cient ,
77–8 velocity pressure distribution , 76 wind directionality factor , 76
Wire and sheet metal gauges , 105–8 , 109
Wire rope block , 181 , 182
IDX-H8766.indd 193IDX-H8766.indd 193 6/17/2008 2:01:27 PM6/17/2008 2:01:27 PM