to the graduate council: i am submitting herewith a thesis written … · 2019-09-13 · to the...
TRANSCRIPT
To the Graduate Council:
I am submitting herewith a thesis written by Aleksandra Maguire entitled
"Microsimulation modeling of gate appointment strategies at an intermodal rail terminal.”
I have examined the final copy of this thesis for form and content and recommend that it
be accepted in partial fulfillment of the requirements for the degree of Master of Science
with a major in Civil Engineering.
____________________________________
Martin E. Lipinski, Ph.D.
Major Professor
We have read this thesis and
recommend its acceptance:
_________________________________
Stephanie S. Ivey, Ph.D.
_________________________________
Mihalis Golias, Ph.D.
Accepted for the Council:
___________________________________
Karen D. Weddle-West, Ph.D.
Vice Provost for
Graduate Programs

Statement of Permission to Use
In presenting this thesis in partial fulfillment of the requirements for a Master's
degree at The University of Memphis, I agree that the Library shall make it available to
borrowers under rules of the Library. Brief quotations from this thesis are allowable
without special permission, provided that accurate acknowledgement of the source is
made.
Permission for extensive quotation from or reproduction of this thesis may be
granted by my major professor or in hers absence, by the Head of Interlibrary Services
when, in the opinion of either, the proposed use of the material is for scholarly purposes.
Any copying or use of the material in this thesis for financial gain shall not be allowed
without my written permission.
Signature______________________________________________
Date___________________________________________________

MICROSIMULATION MODELING
OF GATE APPOINTMENT STRATEGIES AT AN INTERMODAL RAIL TERMINAL
A Thesis
Presented for the
Masters of Science
Degree
The University of Memphis
Aleksandra Maguire
December 2009

ii
Dedication
This thesis are dedicated to my dear mom, Mira Stamenkovic,
whose love, encouragement and wonderful sense of life
will inspire me forever
1952-2005

iii
Acknowledgments
This research and the completion of the master’s degree would not have been
possible if Dr. Martin Lipinski have not given me the opportunity to work at the
Intermodal Freight Transportation Institute. Work at the Institute provided many different
opportunities for educational and professional development, and introduced me to freight
transportation. This is where I developed interest for freight transportation and planning
and decided to concentrate my research on freight issues. I would also like to thank my
committee members, Dr. Mihalias Golias and Dr. Stephanie Ivey, for their help and
guidance. Dr. Golias helped me decide on the research topic, introduced me to different
simulation modeling software, and helped me resolve numerous data and modeling
issues. Dr. Ivey spent a lot of time working with me on different issues I had with
microsimulation results presentation and analysis, and helped guide me in thesis writing
and corrections.
I would also like to thank Hisham Gnedy for helping me get the most recent
highway data and the aggregate OD data. I must also acknowledge the support and
encouragement of the student coworkers Kwabena, Roy, Vasudha, Ji, Sandy and Patrick.
Lastly want to thank my Mom and Dad for making sure I was always on the right
path in my life and for instilling importance of education. And finally, I want to thank my
wonderful husband Kevin, and my daughter Mila, for their unconditional love and
support.
iv
ABSTRACT
Maguire, Aleksandra. M.S. The University of Memphis. December 2009.
Microsimulation modeling of gate appointment strategies at an intermodal rail terminal.
Major Professor: Martin E. Lipinski, Ph.D.
The purpose of this thesis was to analyze the potential effect of gate strategies in
reducing the impact of the newly expanded Burlington Northern Santa Fe (BNSF)
intermodal facility on the transportation network adjacent to the yard. The goal of the
research was to evaluate peak hour arrivals at the gate in a 24 hour period, and to
determine if scheduled truck arrivals can relieve congestion at the gates and on the
surrounding roadway network. To understand the effects the yard will have on the road
network, the network was simulated using Paramics Microsimulation Software. Using the
microsimulation software, three cases were evaluated: (1) Existing vehicle demand, (2)
Tripled truck numbers from expected future demand and (3) Use of gate appointment
systems on increased vehicle demand. Results indicate based on available data that gate
appointment systems alone will not have a significant impact on reduction of network
congestion.

v
Table of Contents
List of Figures ................................................................................................................... vii
Section 1: Introduction ........................................................................................................ 1
Section 2: Gate Strategies and Truck Appointment System ............................................... 5
2.1 Gate Appointment Strategies .................................................................................... 6
2.2 Extended Gate Hours ................................................................................................ 7
2.3 Automation Technologies ......................................................................................... 8
2.3.1 Automatic Gate System (AGS) .......................................................................... 9
2.3.2 Pacific Gateway Portal (PGP) .......................................................................... 10
2.3.3 SynchroMet ...................................................................................................... 11
2.3.4 SEA LINK ....................................................................................................... 11
2.3.5 eModal system ................................................................................................. 11
2.3.6 Edge Manager Auto Gate................................................................................. 12
2.4 Terminal Operating Systems (TOS) ....................................................................... 13
2.4.1 NAVIS (Yard Management) ............................................................................ 13
2.4.2 COSMOS System ............................................................................................ 13
2.4.3 Embarcadero (ESC) System ............................................................................ 14
2.4.4 CATOS System ................................................................................................ 15
2.4.5 Jade Master Terminal (JMT) System ............................................................... 15
Section 3: Case Studies and Related Literature ................................................................ 16
3.1 Simulation Studies .................................................................................................. 16
3.2 Impact of Legislation, Policy, and Regulations ...................................................... 21
3.3 Appointment System Examples for Marine Terminals .......................................... 27
Section 4: Model and Methodology Development ........................................................... 34
4.1 BNSF Facility Description ...................................................................................... 34
4.2 Paramics Microsimulation ...................................................................................... 40
4.3 Data Description ..................................................................................................... 40
4.4 Model simulation cases ........................................................................................... 47
4.5 Model Results ......................................................................................................... 49
Section 5: Discussion and Analysis .................................................................................. 58
5.1 Model Assumptions ................................................................................................ 58
5.2 Key Findings of the Research ................................................................................. 59

vi
Section 6: Conclusions and Recommendations ................................................................ 61
6.1 Recommendations for Future Research .................................................................. 63
Bibliography ..................................................................................................................... 65

vii
List of Figures
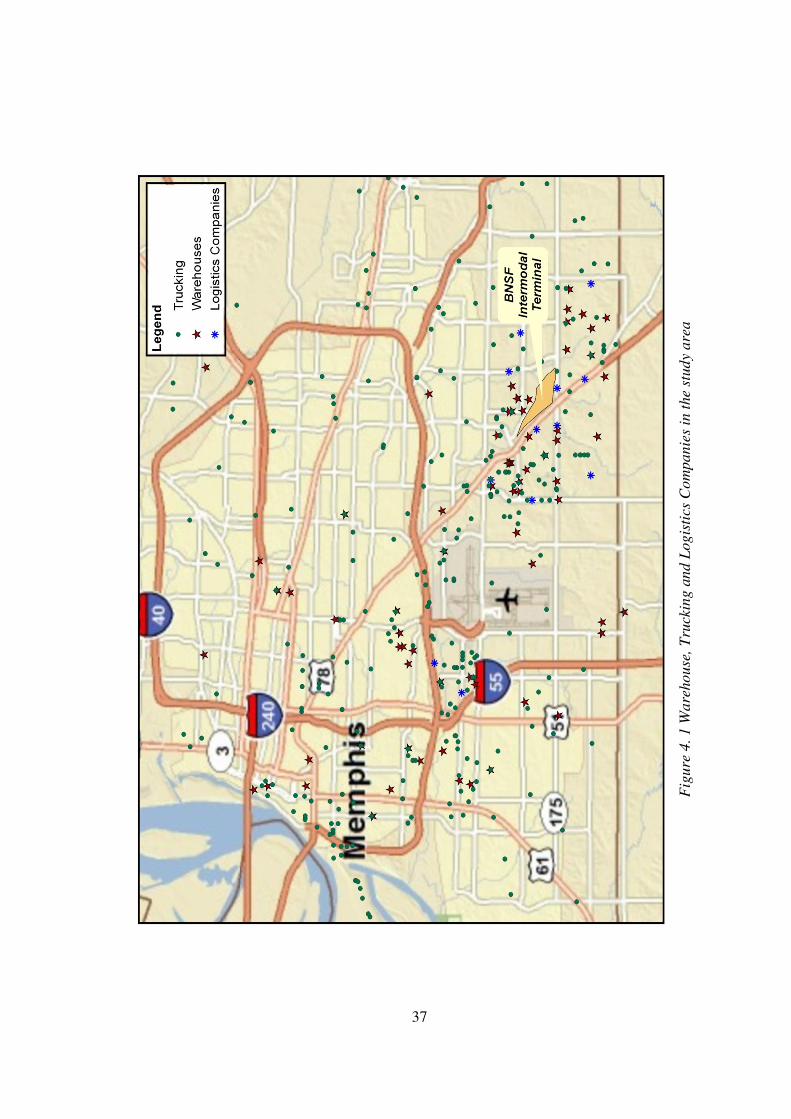
Figure 4. 1 Warehouse, Trucking and Logistics Companies in the study area ................. 37
Figure 4. 2 Zoning and land use in the study area ........................................................... 38
Figure 4. 3 Road network and traffic analysis zones ........................................................ 43
Figure 4. 4 Signalized Intersections in the Modeled Area ................................................ 46
Figure 4. 5 Model Simulation Case 1 AM Peak .............................................................. 51
Figure 4. 6 Model Simulation Case 1 PM Peak ................................................................ 52
Figure 4. 7 Model Simulation Case 2 AM Peak ............................................................... 53
Figure 4. 8 Model Simulation Case 2 PM Peak ................................................................ 54
Figure 4. 9 Model Simulation Case 3 AM Peak ............................................................... 55
Figure 4. 10 Model Simulation Case 3 PM Peak .............................................................. 57

1
Section 1: Introduction
Freight movements in the U.S. are on the rise, and are expected to almost double
by 2035, with international shipments growing faster than domestic shipments (Federal
Highway Administration 2007). Even with the recent downturn in freight volumes due to
recent economic conditions, forecasts are that freight volumes will increase and will
result in substantial increases in congestion. Although the rise in goods movements is
expected, little has been done to control freight congestion. The intermodal industry
which involves more than one form of transportation in a single shipping sequence
(Intermodal Association of North America 2009.), is experiencing significant congestion
and efficiency issues. Container movements at major nodes, from ports to rail or truck, or
from rail to truck are the places where most freight transfers. Delays at these nodes are
increasing and they can cause delay in overall transportation to shippers, especially where
there are products that require just-in-time operations.
A very distinct example of this issue and the impact of the growth in freight
movements at an intermodal terminal is illustrated by the rail-truck terminal of
Burlington Northern Santa Fe (BNSF) Railway Company in Memphis TN. In 2006
BNSF Railway began major expansion of its existing Intermodal facility, increasing the
capacity from the existing level of 300,000 lifts per year to an ultimate capacity at full
build-out of more than one million lifts per year (BNSF Railway 2009). Additional space
and cranes will result in improved terminal operations, but the expansion will generate a
significant increase in truck traffic entering and exiting the site and will add to the
already congested road network around the terminal. The microsimulation modeling

2
approach in this thesis used the BNSF Intermodal terminal expansion as a case study to
determine the potential impact of a gate appointment system for relieving gate and
network congestion.
Improving terminal capacity and reducing throughput time has been a focus area
for operators of intermodal terminals. Some of the measures taken to improve functioning
of intermodal terminals are: use of new or existing technologies, use of new larger cranes,
stacking containers higher, and reducing idling time of trucks at the gates with the use of
different gate strategies.
Efficient gate operations are crucial to intermodal freight terminals since their
impact is not isolated to the efficiency of the operations within the terminal but also on
the road network on nearby arterials, freeways and access ramps. Inefficient gate
operations can spill over to the surrounding roadway network causing serious safety and
congestion problems, degrading the reliability and performance of carriers, shippers, and
terminal operators. Since intermodal freight terminals tend to be located in or near major
cities where right of way is limited and very expensive, implementing operational
strategies to reduce the effect of the truck-related terminal traffic to the surrounding
roadway network becomes more important and more viable than physical capacity
expansions.
Among the gate operation strategies being considered to relieve the impacts of
congestion and delay are:
- Gate appointment systems, which are reservation systems for trucks that can
be made via phone or internet for times available at the terminal, so that truck arrivals at
the terminal can be spaced out.

3
- Extended hours of operation for terminal gates, which have proven to be very
beneficial at ports because they improve throughput of the containers, but they also
require changes in port operations, as well as operations of shippers, warehouses and
trucking companies. The implementation of the extended gate hours is also linked to peak
periods shipping charges to companies that choose to use those times.
- Advanced technologies at the gates and terminals, which involve the use of
new terminal operating systems and the use of new modern equipment (i.e. cameras,
radio frequency readers on containers, fingerprint recognition, GPS technology).
- Truck buffer areas, which are designed for the situations when truck queues in
front of the gate reach the public road. The trucks from public roads are then moved to a
truck buffer area, until the queues in front of the gate are cleared out.
The research presented in this thesis is concentrated on evaluating the potential
impact of gate appointment systems on truck wait times at intermodal terminal gates. A
gate appointment system is used to improve gate efficiency by the scheduling of truck
arrivals throughout the day. In this way, truck arrivals are not concentrated at just peak
hours, and terminals can use the truck arrival information to organize containers within
the yard, by the order of the arrivals. Reduction of the time trucks spend at the gate is
important since truck queues at the gates contribute greatly to congestion problems at the
terminal area, and also congestion on the road network in urban areas. The environmental
impact from idling trucks is also of great concern, because this may cause a significant
decrease in air quality. Reducing the time required for throughput is important, since
delayed trucks in the supply chain increases the total transportation cost, which
eventually is mainly passed on to consumers.
4
A number of marine container terminals (from now on referred to as ports) are
already using gate appointment systems, and there is lot of research published on the use
of appointment systems in different ports around the world. Some terminals that are using
appointment systems are: The Port of Miami, The Port of Vancouver, The West Basin
Container Terminal at L.A., Evergreen L.A. terminal, The Port of New Orleans, The Port
of Georgia, The Port of Rotterdam (Euromax 2), and The Port of Brisbane, Australia. The
Port of New Orleans (EPA Smartway Transportation Partnership) and the Port of
Vancouver have implemented mandatory appointment systems (Port of Vancouver,
2009). Railroad companies use truck appointment systems when they are a part of a port
terminal system. Canadian National Railways uses a mandatory appointment system at
the Brampton and Montreal terminals to deliver or pick up steamship traffic (Canadian
National Railway 2009).
This research investigated the potential impact of gate appointment systems for
improving congestion around intermodal rail terminals. Microsimulation modeling was
applied to a case study of the BNSF intermodal facility to determine whether or not a gate
appointment system would improve congestion levels on the surrounding roadway
network.

5
Section 2: Gate Strategies and Truck Appointment System
The railway industry recognizes that intermodal shipping is increasing, and more
terminals are being built or are expanding and improving their operations efficiency to
serve this growing need. Goods that are shipped by different modes of transportation
need to be delivered in a timely and efficient manner to meet door to door and just-in-
time delivery requirements. This requires the use of on-road diesel trucks to move
containerized cargo and goods in and out of terminals. Most trucks are operated by
independent owner operators or are part of a short haul drayage fleet. At the terminal
gates trucks form queues of idling vehicles at peak times of day. This creates significant
environmental and operational problem.
To improve overall terminal yard side-to-landside operations, reduce congestion
at terminal gates and its resulting economic, operational and environmental implications,
alternative solutions have been proposed and implemented over the last few years. These
can be distinguished into two planning/control levels: a) the strategic level (e.g. capacity
expansion), and b) the tactical/operational level (e.g. extending gate hours, appointment
systems etc). The latter strategy, which is the focus of this thesis, is implemented with the
objective of reducing congestion at peak hour periods by evening out and controlling the
demand at the gate side of the terminal which in theory can reduce or even minimize the
stochasticity of the parameters that affect the yard side operations (i.e. time and sequence
of pick-up or delivery of containers arriving or leaving the terminal by truck). In
addition, overall roadway congestion could be lessened by some of the strategies, due to a
trickle-down effect (Cambridge Systematics 2009). In order for these strategies to be
implemented and be effective, further encouragement and support needs to be provided to

6
the terminal operators through the development of policies, laws, and enforcement
strategies. Examples of such policies are the California Assembly Bill AB 2650 (Giuliano
and O’Brien 2007) and the Off-Peak Program created by PierPass (Cambridge
Systematics 2009). As demand increases and operation efficiency decreases at the
container terminals and the surrounding roadway network, it is expected that more states
will follow this paradigm.
2.1 Gate Appointment Strategies
Gate appointment is a truck reservation system that provides a certain number
(limited by capacity of the terminal) of reserved transactions during a specified time slot
(usually one hour). Appointments are made by the use of the Internet or by phone.
Modern distribution centers that are fully automated have appointment systems for trucks
in use for pick up and drop off of cargo. An appointment system requires dedication of
shippers, drayage operators, and terminal operators, in order to be effective (Giuliano and
O’Brien 2007). Gate appointment systems can be very effective in controlling the random
arrival of trucks, modifying the peak hours of demand, minimizing congestion of idling
trucks, and improving the utilization of the terminals capacity (both at the delivery area
and the storage yard). In order for a gate appointment to be to be successful, further
strategies should be in place for processing the trucks arriving before or after their
appointment time.
Methods of processing arriving trucks with appointments differ from terminal to
terminal, as shown by the review of the current literature (Lord and Morais 2006). One
way of processing trucks with appointments is to have dedicated lanes. Faster processing
7
of trucks with appointments is assured if the conditions inside the terminal are well
organized. Besides separate lanes, another method of processing trucks without
appointments is to gather them all in a marshalling yard and service them according to a
pre-determined pattern. This way all trucks with an appointment have priority (Theofanis
et al.2008). When there are no dedicated lanes for trucks with an appointment, the same
queue can be used for all trucks, and trucks with appointments can be pulled out of line if
the wait time exceeds a limit for trucks with appointments. To fully take advantage of an
appointment system, terminal operations must also be organized, so that when a truck
makes an appointment, containers are ready for pick up. To facilitate this objective
containers can be reshuffled the day before, or when time is available, based on the
appointment schedule so there are no delays at the slot interchange area of the terminal
(i.e. area for pick-up and delivery of the containers by trucks).
2.2 Extended Gate Hours
In addition to a gate appointment system, the strategy of extending the hours of
operations of the gates is another way to manage the demand patterns of truck arrivals
and avoid high concentration during peak hour periods. Both strategies can exist in
isolation or can be implemented together to complement each other. The latter strategy
allows the demand for processing containers to be spread out throughout the evening,
night, and even on weekends. This reduces the likelihood of congestion occurring during
peak hours. There are three main issues that affect the successful implementation of the
this strategy: a) providing incentives to drayage operators that will encourage them to
utilize the extended hours of gate operations, b) adjustment of hours and pay of workers
8
at the terminal (Giuliano and O’Brien 2007), and c) the ability of delivery locations to
accommodate the truckers that pick-up containers during the extended hours of gate
operations. Peak hour surcharges are an option to encourage traffic in off-peak hours. The
improved truck turn times (time it takes to go through terminal) within the terminal and
increased credibility of the terminal operator in keeping the promised truck turn times,
could also facilitate the successful implementation of this strategy.
2.3 Automation Technologies
Growth of freight and containerized traffic around the world has influenced industries to
use new and advanced automation technologies for management and operating systems at
intermodal terminals. Use of these systems increases gate productivity and overall truck
turn time through the terminal. Automated identification and container tracking is also
very important for security issues. New technologies use a Terminal Operation System
(TOS), which manages every component of the terminal. Every individual terminal is
different and they all decide which technologies they want to implement within the TOS.
Technologies used at the terminal gate are:
- Optical Character Recognition (OCR) which is used to automatically identify
containers, chassis information and truck plate at entry and exit gates, with the use
of cameras and scanners (Ioannou).
- Global Positioning System (GPS) used to identify container position anywhere
within a terminal
- Radio Frequency Identification Devices (RFID) are objects that wirelessly
transmit locations by radio waves. This system is used to track trucks, containers
9
and cargo at terminals. It can also “pass information at marine terminals from one
piece of equipment to another” (Ioannou 255).
- Closed-Circuit Television Camera is used to monitor traffic and terminal
activities and gates.
- Bar Code Readers and Mounted Data Collection Computer is used to identify
containers at gates and anywhere else at terminals.
- Real-Time Location Systems (RTLS) are used to track and identify location of
trucks and containers in real time using simple, inexpensive tags attached to
containers and devices that receive wireless signals from these tags. They are used
to improve terminal gate congestion and help terminal operators manage
movements more efficiently. RTLS can also combine “information on queues and
traffic delays with terminals and delivery scheduling” (Ioannou 255).
2.3.1 Automatic Gate System (AGS)
An Automatic Gate System or AGS helps establish a connection at gate terminals
between trucks and terminal operators. Truck handling at the terminal gates is controlled
by the Gate Operating System (GOS). In order to process the collected data,
communication needs to be established between the customer's advanced Gate Operating
System and the terminals application or usually TOS (COSMOS 2008). AGS uses
camera portals and optical recognition to read the number on the container, search the
billing file to see whose cargo it is, and to determine where it needs to go. Drivers can be
identified with fingerprints of the first two fingers on the left hand, increasing security

10
and accountability. Workers, therefore, will not need to be on the ground checking in
drivers.
2.3.2 Pacific Gateway Portal (PGP)
Pacific Gateway Portal is a nonprofit company operated by the Port of
Vancouver. PGP is a port user information system in a web based form. The information
available on PGP includes container status, vessel activity, and real time video images
from both the port terminal side and also truck and driver identification. This system also
has an option of an appointment system for trucks and dangerous goods applications. A
truck appointment system is in use at all three terminals within the Port of Vancouver,
and is very successful. In order to make appointments truck companies use the terminals
web page. Appointments are matched with transactions determined by the terminal on the
basis of terminal capacities. Dedicated lanes are in use for trucks with an appointment
(Pacific Gateway Portal 2008). An approved Truck Licensing System (TLS) License is
required by any party wishing to access Port of Vancouver's property for the purposes of
draying marine containers to or from any of the terminals under the jurisdiction of Port
Metro Vancouver. Trucks without a TLS license are not allowed to access Port Metro
Vancouver property (Port Metro Vancouver 2009). Truckers also have to be in line at the
gate entrance at least 15 minutes before expiration of their reservation time. If trucks
arrive late they are required to go to the line for trucks with no reservation, or they will
need new reservation. There is no fee to use the reservation system, but there is a fee to
use the web portal.

11
2.3.3 SynchroMet
SynchroMet is a virtual container yard service provider used at the Port of
Oakland, as an on-line service. It integrates ocean carriers with motor carriers through a
virtual container yard (VCY) to perform mutually beneficial congestion management, to
reduce costs and to ease port and public road congestion. The SynchroMet™ service,
accessed through the Internet at www.synchromet.com, is where “inbound containers can
be posted as empty street-turn opportunities and matched in real time with off-dock
equipment needs to cover export bookings” (SynchroMet). SynchroMet reduces empty
truck miles and waiting time at local marine terminals, which has a positive impact on the
local environment.
2.3.4 SEA LINK
SEA LINK ®
provides trucking companies serving the port of New York and New
Jersey access to the regions highway system, helping them move cargo to their final
destinations. SEA LINK ®
is a uniform truck driver identification system, which helps
trucks move more efficiently through terminal gates. SEA LINK ®
uses ACES
(Automated Cargo Expediting System) to send out information from truck drivers to
terminal operators (The Port Authority of NY &NJ).
2.3.5 eModal system
The eModal system applications focus on truck and marine terminal gate
interfaces. This system is designed to improve efficiency and deal with the congestion at
container terminals, so that it can reduce truck queuing and idling (eModal 2009).

12
eModal uses a common portal of container and export booking status information (US
Environmental Protection Agency). eModal has information on detailed container status,
vessel schedules, terminal locations, truck driver lists and other important terminal
information. Trucking companies and terminal operators can also use eModal for a gate
appointment system. Trucking companies use it to pre-approve their drivers for container
pick up and drop off. When drivers are pre-approved eModal sends this information to
terminals, which helps reduce the time drivers spend at gates. With the possibility to
integrate all the processes online eModal helps to speed up transactions at terminals. The
only problem is that there needs to be greater usage of the system by trucking companies
in order to fully realize the system benefits.
2.3.6 Edge Manager Auto Gate
Edge Manger Auto Gate is developed by NAVIS, a part of Zebra Enterprise solutions
and it is one of the leading solutions for automated gate systems. Gate transactions are
monitored with the use of different technologies like RFID, OCR, GPS positioning,
reefer monitoring, e-seals and mobile computers (Zebra Enterprise Solutions, 2009).
Truck drivers use a self service pedestal to check-in. Terminal inspectors use mobile
graphical interface for checking the cargo that comes to terminal. Edge Manager Auto
gate can be used with Navis Yard mangement or other Terminal Operating Systems,
which provides easier and more integrated overall terminal operations.

13
2.4 Terminal Operating Systems (TOS)
Terminal Operating Systems are operating systems that manage the flow of containers
through terminals, ensuring the containers are properly shipped and handled. There are
many companies which offer TOS services, but most of them use specific functions of
terminal operations. The following section describes TOS available for use on the market.
2.4.1 NAVIS (Yard Management)
NAVIS is an automated system which allows terminal operators to see what is happening
in real time from terminal gate to rail or vessel, at their terminals yard. Paper based
systems and bar code based systems at yards are not able to provide real time and up-to-
date automated information. NAVIS yard management software includes software for
dock and yard management, gate scheduling and automation, security, container tracking
and visibility of property (NAVIS 2009). With the use of NAVIS customers are served
better, operating cost of the terminal is lowered and capacity is increased.
2.4.2 COSMOS System
COSMOS System is a fully automated and integrated yard control and planning system
for terminals. COSMOS system has a lot of different software that can be customized for
different yards or terminals. It can help optimize and automate operations like yard and
vessel planning, equipment control and tracking, gate administration, invoicing and
management reporting. COSMOS uses already available components of an individual
terminal to build the best possible terminal (COSMOS). COSMOS also provides gate
14
control and container tracking capabilities. Software programs are linked so that a when
container is checked at a gate, all the container information is used to plan activities
inside of the yard. Every time the container is moved, the COSMOS system software is
updated (Lord and Morais 2006).
2.4.3 Embarcadero (ESC) System
ESC is a full service provider to marine, rail and intermodal terminal operators, and it
offers technology software and integration services. ESC automates intermodal
operations, providing integration of cargo handling and visibility inside and outside the
terminal. Web based tools used by ESC are VoyagerTrack and webTAMS and they use
Differential Global Positioning System (DPGS), and wireless local area networks
(WLANS) to pinpoint the exact equipment position and provide real-time communication
for the terminal operating software. ESC uses Premier Appointment System (PAS) which
comes with VoyagerTrack, and this allows truck companies to schedule arrival
appointments at the gate. The other solution from ESC is SmartGATE, which is an
automated terminal access solution, and it provides centralized gate transaction.
SmartGATE uses Optical Character Reader (OCR), RFID, and GPS and technologies. A
unique feature feature to SmartGATE is Intelligent Camera, a CCTV (Closed Circuit
Television) that improves the accuracy of OCR, giving terminal operators better real time
images. With the use of this system productivity of the gate terminal is improved, and the
yard security and safety is greatly enhanced (Lord and Morais 2006).
15
2.4.4 CATOS System
CATOS system is a fully integrated TOS which is used in 72 container terminals
worldwide (Total Soft Bank 2009). Most of the terminals that use CATOS are in Asia
(Thailand, Taiwan, Malaysia and Vietnam) and they have been using it for more than 10
years. CATOS has capability to use one database server for different terminals. CATOS
system is integrated with different parts of terminal system which provides better system
optimization. CATOS system is interfaced with Gate Automation System, Gate Weighing
Scale, Crane Automation and Monitoring System and RFID System.
2.4.5 Jade Master Terminal (JMT) System
Jade Master Terminal TOS is used in container terminals, rail company operations, bulk
and general cargo operations, log marshalling and vessel scheduling. It has been used in
New Zealand for past 15 years, in more than 15 terminals (Jade Logistics 2009). US and
Austarlia have started to use Jade TOS recently. Jade TOS operates best in small or mid-
sized terminlas. Jade is installed on every terminlas computer like any other program, and
it makes technology for terminals systems. Jade can offer intergration for any part of
terminla system from gate to vessel scheduling. New techologies like OCR, RFID, GPS
can be used with Jade TOS, and this techologies can be added if terminal wants to use
them.

16
Section 3: Case Studies and Related Literature
The impact of tactical/operational level gate strategies on drayage operation
efficiency is not very well understood, and is an area where researchers and practitioners
are becoming increasingly involved. This section provides a detailed description of the
studies that have been published to date.
3.1 Simulation Studies
One of the first studies to appear on modeling the truck arrivals at a marine
container terminal was by Sgouridis and Angelides (2002) who performed simulation
modeling of all the major processes and handling of containers arriving at a port, in order
to improve operational efficiency of the second largest container terminal yard in Greece.
This paper focused on the service of the arriving trucks at the terminal. A discrete event
simulation model for the inbound arriving containers and their processes was developed
based on the existing conditions at the port. The potential terminal improvements were
also considered in the model. The objective was to minimize the truck turnaround time
(TTT) and to better utilize available handling equipment. Benefits of a computer
management system for yard operations were also analyzed. The findings from the
modeling were that the arrival of trucks should be organized and evened out throughout
the day in order for the TTT to be minimized. The TTT was reduced by 15% with trucks
arriving evenly during the day. The use of a computer management system was
implemented in the simulation, and the truck import area was improved with the use of
two instead of one import pads for trucks waiting to be serviced. The organization proved

17
to be very effective with 40% improvement of TTT, and 24 % improvement of TTT with
heavier truck traffic.
Delay of trucks waiting at queues at port terminals is caused by different factors,
some of which are large truck arriving volumes, short operation hours of ports and slow
gate processes (Juang and Liu 2003). A queuing model was applied to study delay factors
by Juang and Liu at the A.P. Moller, Port Elizabeth Terminal (APM). The purpose of the
model was to analyze the needs for state legislation in extending gate hours. Parameters
used in model are average arriving volume of trucks and service time at gate. Numerous
interviews and observations and terminal functions were used to come up with these
parameters. Trucks are arriving on random bases at terminal gates, and this arrival pattern
is represented with Poisson's distribution. The model results showed that when port
terminal has a low ratio of containers arriving over service time, there are no queues.
Operations at port terminals should than be organized with fewer gates open and full
utilization of terminal equipment. Results from the model also indicated that service time
is very sensitive, and any changes to service time can cause huge delays (Juang and Liu
2003).
Impacts of appointment systems on drayage truck efficiency are not very well
known. A paper from The Logistics Institute of Georgia on planning of container drayage
operations given a port appointment access system looks at planning of drayage
operations. Planning is based on an “Integer programming heuristic that explicitly models
a port appointment access control system” (Errera and Namboothiri 185). Real world
situations are represented by a set of hypothetical problems that represent most accurately
behavior or the drayage companies. The model is based on the minimal transportation
18
cost, to determine drayage company operations of pickup and delivery. Drayage firm
operations are restricted by the port appointment access system that the port is using. The
schedule for a driver of a drayage company is determined on the basis of appointments
made to pick up certain numbers of containers during the day, and best routes for a
drayage company with the use of appointments during the day. The research shows that
optimization of drayage operations is complicated by adding port appointment access
systems. Access capacity provided by port terminals is important, since vehicle
productivity can be increased by 10 to 24 percent when access capacity is increased by 30
percent (Errera and Namboothiri 2008). Drayage firms need to schedule an appointment
by the demands of customers, and also to improve customer satisfaction. The length of
the appointment window is also important for drayage firms, and test results indicate that
reducing appointment windows by half can have significant impact on drayage firm
functioning by reducing their ability to maintain expected levels of customer service.
Modeling of marine container terminals is also important in order to optimize all
the processes evolving at an intermodal terminal. A critical issue at marine terminals is
gate capacity, since limited gate capacity leads to congestion. A model published in 2008
used “a multi-server queing model to analyze marine terminal gate congestion and
analyze cost of trucks waiting at the gate” (Guan and Liu 4). The authors chose one of the
marine container terminals in the Port of New York/New Jersey. An optimization model
was developed to minimize ovearall gate system cost. Minimizing queing at a gate is
good both for the trucking companies, since they don’t have to wait long and the gate
operators, since they can have a minimum number of gates open while providing good
service to all trucks. The goal is to have both satisfied. Capacity of a gate system is
19
determined by the number of gate lanes, by hours of operation, and the productivity that
gates operate under. A model that was developed based on gate capacity is the Multi-
Server queing model, and it depended on physical layaout and characteristics of the
terminal and its operations. The model also depends on truck arrival rate which is
dynamic. In order to optimize a gate system, two costs are analyzed – gate operating cost
and truck waiting cost. These two costs have an opposite relationship. The goal is to keep
both costs at a minimum so that total system cost is minimized. The model is validated
using field observed data and statistical testing. For truck arrivals two peak periods in a
day were analyzed, one in the morning and one in the early afternoon. The goal was to
even out the truck arrival throughout the day.
In order order for a system to be optimized, there are two things that can be done:
one is to increase number of gate booths, and the other is to control truck arrival rates,
which can be done with truck appointment systems. The authors (Guan and Liu 2008)
find the appointment system approach more feasable since it doesn’t require greater
expenditure of manpower and land expansion. But in order for an appointment sytem to
work there has to be coordination between shipping lines, terminal operators, shippers
and trucking companies (Guan and Liu 2008). This option needs to include major
stakeholders to work on new operating procedures of all the major players included to
implement a succesful appointment system.
Huynh (2005) observed operations at the port of Houston (Babours Cut
Terminal), to identify potential solutions to reduce truck turn time. Two alternatives that
can have a positive effect on truck turn time reduction time are the increase of the yard
cranes and the introduction of truck appointment systems. This dissertation (Huynh 2005)

20
looked at the effect of both alternatives, through a simulation model done with simulation
package Arena, and also with a regression model for adding more cranes to the yard
terminal. Findings were that if more road cranes are used to handle trucks in and out of
the terminal, truck turn time will decrease. Huynh also looked at the implementation of
truck appointment systems, and he proposed a methodology for determining the number
of trucks terminals should allow, especially the trucks allowed in a specific area of yard
per time window (referred to as cap) (Huynh 2005). Capping was important in order for
an appointment system to be effective so that the number of trucks entering a yard with
the appointment system schedule can be served by yard cranes in the shortest time. The
issue of no-show and delay is also a part of the model. The model was developed with the
maximum number of trucks a terminal can handle with the specified resources. The
results of the model showed that truck appointment system was beneficial in reducing
truck turn time. On the other hand if the cap was set too low for a certain time frame, it
had a reverse effect on both the crane operation and truck turn time.
Freight Information Real-Time System for Transport (FIRST) is supported by the
Federal Highway Administration’s Office of Freight Management and Operations, the
Congestion Mitigation and Air Quality Improvement Program, and the I-95 Coalition. It
began in 2001 to provide real time information to the port of NY/NJ freight community
members (Srour et al. 2003). FIRST uses Intelligent Transportation Systems (ITS)
technology to manage intermodal freight systems. It is an internet-based, real-time
network that incorporates different sources of freight information into a web portal that is
accessed by port users to obtain port and cargo information. It was designed by the
private sector of the intermodal freight industry and public sector partners. The web site

21
used for the FIRST system, provides real-time information on cargo status to all involved
customers and terminal operators. Trucking companies can find out the status of
containers online and plan each trip to the port so unnecessary trips are not made. A
simulation model using accepted transportation queuing theory concepts was developed
to study benefits of the appointment system. Queuing activity at terminals was observed
with or without the appointment system in use at various levels of acceptance (0-100%).
Data used was from field observation of queuing activity over a five-day period in June
of 2002. The results were that when appointment systems were used at 100%, the total
time vehicles spent in terminal was reduced by 48%, compared to 0% use of the
appointment systems. The success of the appointment system depended on the level of
compliance, since with the low acceptance queuing increased at gate terminals.
According to the FIRST evaluation report (Srour e t al. 2003), this system did not make a
significant impact since it was not used as desired.
3.2 Impact of Legislation, Policy, and Regulations
In California in September 2002, AB 2650 (California Assembly Bill) was
passed. The bill became active in 2003, and it presents regulations that require marine
port terminals to either extend hours of operation for truck pick-ups and deliveries, or
begin use of appointment systems for trucks, or find some other ways to reduce truck
queues at terminal gate entries (Giuliano and O’Brien 2007). This was the first bill in any
US state implemented to lower congestion and air pollution. It includes fines on marine
terminal operators who allow heavy-duty trucks to idle for more than 30 minutes while
waiting to enter the terminal. The California Port Community Grant Program was

22
established by this law, funded from fines on marine terminals, to provide grants to truck
drivers to replace and retrofit diesel engines.
The approach to use a gate appointment system at the port of Los Angeles and
Long Beach was studied for the assessment of AB 2650. The appointment system was
monitored over a 16 month period from January 2004 through June 2005 (Giuliano and
O’Brien 2007). Data was gathered from different sources – interviews with managers of
both ports, eight marine terminal operators, trucking industry representatives, longshore
labor, public agency representatives and elected officials. During this period both
terminals were observed. Surveying of trucking companies supplemented the
observations. Data was also provided by terminals.
One constraint this study had is lack of data on terminal gate queues prior to the
use of the gate appointment system. Terminal operators had flexibility in making
appointments, and a wide range of policies was used across terminals. Trucking
companies used 5-30 % of appointments on all three port gates during the observed
period. The problem was that no terminal had special arrangements for trucks once they
entered the gate and were inside the terminal.
The response from terminal operators on use of the gate appointment was mixed.
Some operators did not see a purpose for using them, since appointment systems made
their work more complicated with all the activity going on in a port all day. The terminal
operators that liked appointments thought that they are essential for terminal operations
since arrival of trucks is leveled out throughout the day and this made peak hour times
more bearable.
23
Trucking company response showed that appointment systems were mainly used
for import pick up, when trucks would not spend a lot of time in a terminal anyway. The
main problem was that even the trucks that had appointments didn’t have reduced turn
time, because once inside the gate they didn’t have priority. Also, there were a significant
number of missed appointments.
The study showed that although appointments were used there was no evidence
that truck wait time was lowered significantly. The problem with this study is that they
did not use any previous queue data (before the use of appointment system), the number
of appointments was small, and there was almost no priority for trucks with appointment
once inside the terminal. Effectiveness of appointment systems in reducing truck turn
times was analyzed with the use of comparison between the averages of terminals that
used appointments for 35% or less, and for more than 35% of transactions. The average
turn time was compared for both groups, and the wait time was larger for second group,
since it was 3 hours, compared to 2.4 hours for the first group. Truck turn time for
companies that have used appointments for most of the transactions were longer. The
conclusions were that for appointment systems to be effective, a large number of trucks
will have to use the appointment system, and there has to be some priority for trucks
entering the terminal. For the appointment systems to work some incentives have to be
used encouraging trucks and terminals to use them. Terminals do not see gate congestion
as a problem, and trucks saw no advantage because it did not reduce their turn time. In
order for this study to show good results, more appointments must be made to show the
effects of evening out truck arrivals. Gate appointment is still a more favored alternative
than extended gate hours, since the cost is lower (Giuliano and O’Brien 2007).
24
A second publication from Metrans Transportation Center (Giuliano et al. 2008)
gave broader explanation on the extent of survey and interviews performed in California
terminals from January 2004 through June 2005. Research was limited by lack of data,
since the private sector typically does not share data, and data is usually available just for
the state or region level. Data and information varied from terminal to terminal, and
terminals are not required to share data with the public. All the previous information
before the appointment system was in use is assumed. The main concern is lowering
queue time, but just outside the gate, since once inside the gate truck waiting is the
responsibility of the terminal. The problem was that containers at the terminal were not
ready for a truck with an appointment. Average queue length at observed terminals
ranged from 5 to 26 minutes, and maximum was up to 122 minutes (Giuliano et al. 2008).
The Air District in California stated that in 2004 AB 2650 contributed to annual reduction
of emissions by 30%. The overall conclusion is that marine terminal operators need to be
required to use appointment systems in order for it to work. That way emissions and
noise will be reduced, overall terminal operations improved, and truckers will benefit
from better operations.
In February 2004, Assembly Bill (AB) 2041 was introduced in California
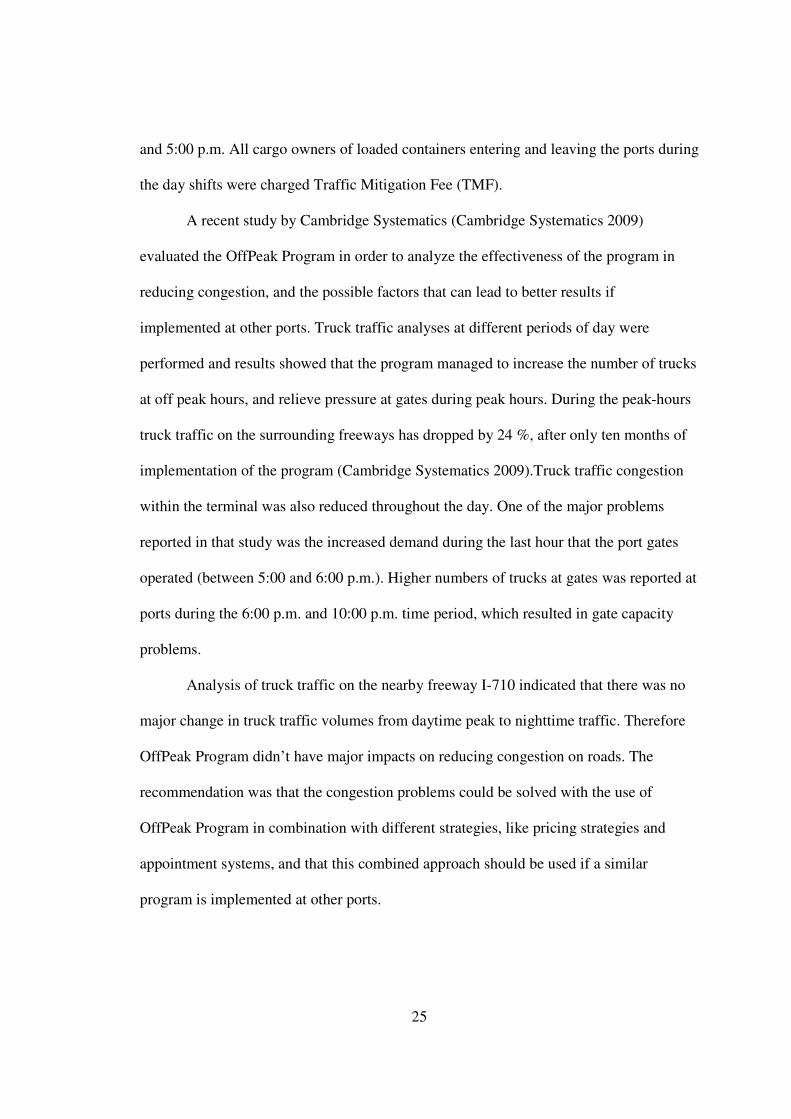
requiring extended gate hours (Solomon and Bailey 2004). The OffPeak program was
created to provide an incentive for cargo owners to move cargo at night and on weekends,
in order to reduce truck traffic and pollution during peak daytime traffic hours and to
alleviate port congestion, at the ports of Los Angeles (LA) and Long Beach (LB). In July
of 2005, the program was implemented and through legislative influence (AB 2041),
required the Ports of LA and LB to charge for goods moved at peak hours from 8:00 a.m.
25
and 5:00 p.m. All cargo owners of loaded containers entering and leaving the ports during
the day shifts were charged Traffic Mitigation Fee (TMF).
A recent study by Cambridge Systematics (Cambridge Systematics 2009)
evaluated the OffPeak Program in order to analyze the effectiveness of the program in
reducing congestion, and the possible factors that can lead to better results if
implemented at other ports. Truck traffic analyses at different periods of day were
performed and results showed that the program managed to increase the number of trucks
at off peak hours, and relieve pressure at gates during peak hours. During the peak-hours
truck traffic on the surrounding freeways has dropped by 24 %, after only ten months of
implementation of the program (Cambridge Systematics 2009).Truck traffic congestion
within the terminal was also reduced throughout the day. One of the major problems
reported in that study was the increased demand during the last hour that the port gates
operated (between 5:00 and 6:00 p.m.). Higher numbers of trucks at gates was reported at
ports during the 6:00 p.m. and 10:00 p.m. time period, which resulted in gate capacity
problems.
Analysis of truck traffic on the nearby freeway I-710 indicated that there was no
major change in truck traffic volumes from daytime peak to nighttime traffic. Therefore
OffPeak Program didn’t have major impacts on reducing congestion on roads. The
recommendation was that the congestion problems could be solved with the use of
OffPeak Program in combination with different strategies, like pricing strategies and
appointment systems, and that this combined approach should be used if a similar
program is implemented at other ports.
26
The Transportation Development Centre of Canada published a study in 2006 that
reviewed current practices and startegies used at North American ports to speed up
handling of cargo in order to reduce congestion and idling of trucks at the gate, (Lord and
Morais 2006). Information for the project was assembled via literature review and
surveys of ports in North America, followed by on-site visit and interviews. Gathered
information included port and terminal activities, technologies, information systems and
environmental programs and legislation. The report concetrated on the twelve largest
North American ports by highest annual transiting container volumes (TEUs per year),
and by availabilty of automated technologies.
The report findings are important for recommendation to Canadian ports to improve
port/terminal operations efficiency, reduce delays, reduce congestion and GHG(Green
House Gasses) emissions. One of the ways to improve efficiency is use of gate
appointment systems and the report studies previous experience of ports that used it. In
order for improvements to take place at Canadian ports there has to be strategy in place.
This startegy includes policies and regulations, air quality mitigation programs,
infrastructure improvemnts, and new port information systems and technologies. Close
coordination of all stakeholders is necessary for the succesfull operations.
The use of appointment systems at observed ports was mostly successful (Lord and
Morais 2006), and it depended on factors that are producing congestion. The major
problem at the ports with no mandatory appointment system was that the truck drivers
didn’t use it. One reasons for not using the appointment system was the difficulty for
truck drivers to set up an appointment 24 hours in advance, mainly because of the other
transactions scheduled that day. There is also the unknown of road congestion on a given
27
day, and the number of trips planned for one day. Some drivers just fail to show up for
appointment times. The findings of the report indicate that appointment system must be
flexible to be successful. This means that it can: “
- Handle cancellations
- Re-assign reserved time that has been canceled
- Allow appointments to be made during the day of arrival, not just 24 hours ahead
of time
- Decline or discourage double/triple appointments for the same container
- Assess fines for missed reservations
- Allow one hour window for trucks to show up
- Operate based on container appointment (not truck appointment)
- Allow for reservation by phone “ (Lord and Morais 2006)
The researchers found one of the best ways to improve efficiency is by the use of
gate appointment systems and documented components to establish a good system in
Canada. They found that in order for improvements to take place at Canadian ports there
has to be a detailed strategy in place, which includes policies and regulations, air quality
mitigation programs, infrastructure improvements, and new port information systems and
technologies (Lord and Morais 2006). Close coordination of all stakeholders is necessary
for the succesful operations.
3.3 Appointment System Examples for Marine Terminals
Hong Kong International Terminals (HIT) is one of the world’s busiest ports. It
operates with limited space, with no possibility to expand to meet the growing demand.

28
In 2003 Hong Kong operators handled 20 million TEUs, making Hong Kong the busiest
port in the world (Murty et al. 2005). With the increase in exports from this region Hong
Kong terminal had to optimize their operations.
In 1995 one of the authors professor Katta G. Murty and several IEEM faculty
members, started working on a decision support system for the Hong Kong port. One of
the critical decision problems at the port is allocation of appointment times to external
trucks to minimize their turnaround time, to smooth out truck arrivals, and reduce the
number of trucks in the yard during busiest times. Hong Kong International Terminals
started using an appointment system in 1997. Trucks coming to terminal to pick up had to
make an appointment, and the trucks bringing export containers didn’t have to make the
appointment. The reason for this is because most trucks that bring export containers
arrive from mainland China and they have to wait at the border crossing.
In every 30 - minute time slot, each block at the terminal has a certain number of
appointments available. Numbers of appointments at each block are determined using a
simulation model. In order to develop the simulation model some values had to be
estimated. The number of external trucks that didn’t show up for appointments is
estimated from past data. The time it takes a yard crane to serve a truck is also estimated.
The target is to keep the number of trucks waiting for service at six or less. Since there
are not a lot of slots available the earlier the trucker makes an appointment the more slots
it will be able to choose from. If the truck tries to come in with no appointment, it has to
go to a booking center to make an appointment, unless it is an external truck with an
export container that also has to pick up a container. The results from implementing the

29
gate appointments at the Hong Kong International Port Terminal were that turnaround
time for external trucks was reduced by 30 percent from 60 minutes to 40 minutes.
The Port of New Orleans uses an appointment system, which is mandatory, to
improve the terminal operations and the use of the system. The appointments are made
online with the use of a Gate Entry Management (GEM) system. The operation of the
web-based system is organized with the use of digital cameras, optical character readers,
transponders and AM radio broadcasting within gate system (EPA Smartway
Transportation Partnership 2009). This system allows trucks companies to make
appointments within available time periods, and it also allows terminal operators to
organize terminal operations in the order of arriving trucks. Truck drivers have a 30
minute window within their scheduled appointment. The amount of time a truck spends at
the gate is also reduced, because all the paperwork is eliminated with the use of the web
application. Terminal operators also have more time to eliminate possible errors. The use
of the appointment system was very beneficial for the Port of New Orleans, since truck
idling at gate was reduced, terminal operations and throughput was improved, and truck
companies and terminal operators are cooperating better with fewer delays.
The Georgia Port Authority including Port of Savannah also implements a web-
based appointment system for containers entering and leaving the port. The system is a
real-time online system and it provides 24-hour access to customers to update data on
container shipments. Since its implementation, the system has been very beneficial to The
Georgia Port Authority because it has managed to lower truck queues and waiting times
at gates and overall truck processing time at terminals by 30 percent (EPA Smartway
Transportation Partnership 2009).

30
3.4 Potential Impact of Gate Strategies at Intermodal Container Terminals
Gate strategies at intermodal container terminals are a very important part of the
terminal operation process. These strategies can solve problems of truck queues at the
gate and help with congestion problems associated with queues, as well as the vehicle
emission problems. Random arrival of trucks can also be controlled with the use of
different gate strategies, and peak hour truck traffic can be handled better. Terminal
operations can be better utilized and organized, when truck arrival is more even, and the
congestion is lower.
In order for the gate strategies to work all the involved users need to agree to use
gate strategies as required. A large percentage of trucks will have to use the appointment
system, and there has to be some priority for trucks with appointments. Incentives are
necessary to get trucking companies to buy-in to appointment systems and make their
appointments. Incentives may also be needed for the terminals to use the systems
effectively. Gate appointments are a more favored alternative than extended gate hours,
since the cost is lower.
Gate appointment systems have the potential to dramatically improve operations
inside the terminal as well as at the gate, and as a secondary result, reduce congestion on
the roadway system, and therefore reduce harmful emissions in the neighboring
communities. Of course, as this type of shipping increases, there will be a point that
limits the amount of trucks and containers that can physically be processed within the
constraints of terminal boundaries, but there is certainly room for improvement now,
before reaching that point. For extended gate hours, additional workers are required at
off-peak times, but this is a good option to increase throughput at terminals. It will

31
require that additional workers be added, hours and pay contracts adjusted and buy-in
from associated businesses, but there is potential for greater amounts of container
movement without the need to expand terminals.
Terminal operators at the container terminals usually do not like to use
appointment systems, because it adds extra effort to an already busy terminal operation
process. The trucks have to make the appointment within the available slots, and terminal
operators have to organize not only appointments, but also containers in order for
efficient pick up. Trucks arriving at gates have to be registered and identified. This
process can take some time depending on the level of automation each terminal uses.
Additionally, extra effort has to be made to speed up the processing of trucks with
appointments inside the terminal.
The length of the appointment window or time provided for a trucking company
to drop off or pick up the container is also an important measure. It is important that
trucks are given enough time, considering the fact that they can be delayed on roads. The
possibility of rescheduling appointments is another option that intermodal terminals need
to offer. As there are no fines or other penalties associated with missing an appointment
window, not all trucks will show up for scheduled appointments. That is why regulations
and incentives need to be in place for both terminals and truck companies.
The most favored option in regulation of truck traffic at the terminal gate is the
use of technology. Automation Technologies mentioned in the previous section are very
advanced and promise solutions to a lot of problems in terminal operations. Gate
technologies like AGS are already used in a lot of terminals, and they are good because
they don’t need as many terminal operators on the gate side. The BNSF Intermodal

32
terminal in Memphis is already using AGS combined with Optical Character Readers and
cameras, which is helping significantly in speeding up gate operations. AGS is favored
for both terminal operators and truck drivers because no extra work is involved in making
or arranging gate operations and access.
Intermodal rail terminals use a lot of similar equipment and technologies, as well
as the strategies as the marine container terminals. Port terminals are usually open
Monday-Friday from 8am to 6pm; while most of the rail intermodal yards are open
longer (e.g. The Burlington Northern Santa Fe - BNSF yard in Memphis is open 24
hours, 7 days a week). Rail terminals have an advantage over port gate terminals, since
they do not have operating time constraints. The increase in containerized traffic and bulk
traffic is a problem for both, since more trucks move at the same time, making queues of
idling trucks at the gate.
Gate strategies in intermodal rail terminals are mostly in use when they are part of
marine container terminals, and the intermodal rail terminals mainly use the AGS. AGS
provides efficiency and security at the rail terminal gates, ensuring that trucks get inside
rail terminals much faster, which eliminates or lowers the wait time at the gate. Use of
gate appointments system with AGS at the intermodal terminals can be a good option
when trucks arrive at the terminals at the peak times of the day.
Storage of containers can be either on chassis or storage on the ground. Storage
on chassis requires more space, but it is beneficial because it can lower truck turnaround
time. Chassis storage of containers does not require yard cranes or stacking equipment, as
these containers are parked at the assigned places. Trucks that come to drop off or pick
up containers usually use chassis storage. These trucks typically use appointment systems

33
less, as they only come to pick up or drop off a container, and the containers on chassis
do not have to be reorganized as in grounded operations. Storage on the ground is similar
to storage of containers at the ports where containers are usually stacked at a storage area,
which saves space, but can slow down operational time. The rail intermodal terminal
organization is thus different because of the use of on-chassis storage.
Gate strategies are becoming a very important part of the organization of the
Intermodal terminals. Currently they are in use more at the marine container terminals
than in rail intermodal terminals. As the amount of containers handled by rail increases
some new strategies may have to be implemented to insure efficient rail terminal
operations. Thus, gate strategies, and in particular appointment systems, may prove to be
useful in improving operations at rail intermodal terminals.
In order to evaluate effectiveness of gate strategies on the BNSF Rail Intermodal
Terminal, especially potential use of appointment systems, a road network model is
developed for this research. The model represents actual road conditions on the
transportation network around the yard, and is used to simulate the effect of gate
strategies on the truck arrivals and potential queues at the gate assuming truck volumes
increase with the expanded facility capacity.

34
Section 4: Model and Methodology Development
This research was conducted in order to further evaluate the importance of gate
strategies and appointment systems using the specific case study of the BNSF intermodal
terminal in Memphis. Outlining the advantages and disadvantages of gate systems is also
a part of the research objectives.
The road network in the area around the BNSF Intermodal terminal was modeled
with the Paramics micro-simulation software. The simulation was performed to analyze
the effect of road network delays and congestion in a 24-hour period on the gate
operations. The simulation was performed for current demand, and expected worst case
scenario numbers after the expansion of the BNSF intermodal terminal. Using a gate
appointment system and smoothing out the arrival of trucks was also simulated to
evaluate the potential impacts. The results were used for the representation and
comparison of different scenarios designed to approximate the current system, potential
truck volume increases due to the facility expansion, and the effect of an appointment
system. The model methodology and the results from the simulation can be used in future
research when more current and representative volume data is available.
4.1 BNSF Facility Description
The BNSF intermodal rail-rail and rail-truck terminal in Memphis is an example
of a large intermodal terminal that may experience some of the problems that the freight
industry is facing, and thus was selected as the case study for this research. Memphis is
strategically located on the Mississippi River and in the central United States. It is served
by five class one railroads, seven interstates, fourth largest inland port in the U.S., the
35
world largest hub airport by freight volume handled and it is a preferred location for
numerous distribution centers and logistics companies because of its location (The
Memphis Regional Chamber Departments of Economic and Community Develpoment
2007).
The BNSF Railways intermodal terminal expansion was completed in 2009. The
new intermodal facility encompasses 185 acres, and it has a total of 48,000 feet of
railway tracks. The new facility can load and unload trains up to 7,500 feet long, and the
yard is equipped with 8 total electric, rail-mounted gantry cranes. These cranes are
environmentally friendly, because they do not produce any emissions, and the number of
container lifts per year can be tripled from the existing number of containers handled by
previous intermodal facility. The parking area is designed for up to 6000 trucks, with
4000 spaces for stacked parking and 2000 spaces for wheel parking. The gate layout at
the BNSF Intermodal terminal consist of 8 In-Gate lanes and 7 Out-Gate lanes. The gate
operations are utilized with the use of AGS and optical character cameras. The yard
management can also use data from this gate system to better organize overall terminal
operations (American Shipper 2009). The BNSF Intermodal terminal is located in a
major industrial corridor of southeast Memphis, with a high concentration of trucking
companies, warehouses and distribution centers, See, Figure 4.1. Warehouses, Trucking
and Logistics Companies in the study area, and Figure 4.2 Zoning and land use in the
study area. Most of the BNSF customers are located within 15-mile radius of the
terminal. The current expansion, if fully utilized, will exacerbate the congestion problems
on the transportation network in the area, which is already used heavily by trucks. One of
major congested freight corridors in area is a Lamar Avenue. It is considered a major

36
connector in the area since it connects various distribution centers, warehouses, trucking
companies, the BNSF Intermodal terminal, the Memphis International Airport and the
FedEx hub. To reduce the impact of road congestion problems, there are some strategies
that can be applied within the intermodal terminal.
37
Fig
ure
4. 1
Wa
reho
use
, T
ruck
ing a
nd
Log
isti
cs C
om
pa
nie
s in
the
stud
y a
rea

38
Fig
ure
4.
2
Zo
nin
g a
nd l
and
use
in
the
stud
y a
rea

39
The entrance and exit for the BNSF yard is located at the Lamar Avenue and
Pleasant Hill road intersection. Truck traffic is heavy on the Lamar Avenue, as well as
the surrounding roads, leading all the way to the Interstate 240 and the Interstate 55. The
average level of service on Lamar Avenue at each intersection at different time periods is
obtained from the University of Memphis Intermodal Freight Transportation Institute
study from 2009, which is yet to be published ( Cambridge Systematics and the
University of Memphis) shown in Table 4.1.
Table 4.1. Average Level of Service in Lamar Avenue at Various Times
Intersection
A.M. Peak
Hour
7:30-8:30
Lunch Peak
Hour
11:30-12:30
Midday Peak
Hour
2:30-3:30
P.M. Peak
Hour
4:30-5:30 Average
Lamar at American Way C C D F D
Lamar at Pearson B D B B C
Lamar at Democrat C E B B C
Lamar at Knight Arnold B C B C C
Lamar at Winchester F F F F F
Lamar at Concorde E B A B C
Lamar at Shelby F F F F F
Lamar at Tuggle E F A B D
Lamar at Holmes F E E F F
Average D D C D D
Source: The University of Memphis Intermodal Freight Transportation Institute
Major highways and roads are used by trucks and that is why the simulation
model only concentrates on those roads and the roads that lead to main transportation
facilities.
40
4.2 Paramics Microsimulation
Simulation modeling is useful and effective for different transportation problems,
and microscopic simulation is a good alternative that can help users evaluate potential
solutions to many transportation problems. Microsimulation is a process of modeling
individual vehicles and it is useful in modeling the area at and around intermodal terminal
gate operations to predict congestion. Paramics is microscopic simulation software and it
is very useful because it can model behavior and movement of individual vehicles on
road networks (Quadstone Paramics 2009). Capabilities of Paramics are virtual modeling
of transportation infrastructure and simulation of road traffic and other forms of
transportation in microscopic detail. Paramics can model different types of vehicles,
which can have different behaviors and characteristics associated with them. This is very
valuable for areas with a high percentage of truck traffic. To accurately represent this
complex and dynamic system, however, extensive data are needed to capture the overall
movement of traffic in and around the rail intermodal terminal, as well as the spatial and
temporal variations of these movements.
4.3 Data Description
The simulation model development for the BNSF intermodal terminal was
feasible only if availability of data is sufficient. For the model development a number of
data sources were required:
• Roadway network data which including the number of lanes, length of roadways,
speed limit of the roadways, number of nodes and design of intersections.

41
• Number of passenger vehicles that travels between the zones in boundary area in
the form of Origin/Destination Matrix
• Number of trucks that travel between zones in the boundary area in the form of
Origin/Destination Matrix.
• Signal timing at the intersections.
The network in Paramics was built based on the road geometry obtained from the
City of Memphis geographic information files. Network data had to be checked for errors
and corrected to represent the actual road network. More specifically, the number of lanes
and posted speed limits were adjusted based on Shelby County aerial photography and
data provided from the geographic information files. Some nodes in the network were
disconnected or were not properly aligned, and this had to be corrected as well. Some of
the intersections in the network had multiple fragments, and this made signalization of
intersections impossible. These data were edited in the Paramics editor to reflect the most
accurate conditions on the roadways as possible.
Borders of the modeled area were selected based on the connectivity from the
point of the BNSF Intermodal yard and the exits to major roads and highways. The area
was divided into zones based on US Census Bureau data on Traffic Analysis Zones
(TAZ) from the year 2000 (US Census Bureau Traffic Analyis Zone). A traffic analysis
zone (TAZ) is an area defined for traffic related data, especially trip to work and work to
home statistics. Boundaries of these zones usually follow physical and natural geographic
features, like roads, rivers, borders. Data on the transportation facilities in the area is
important for development of Traffic Analysis Zones (TAZ), as theses data help define
the TAZ boundary area better.
42
The data on transportation facilities were gathered from the Memphis Chamber of
Commerce, which is compiled from the InfoUSA data (InfoUSA). Zones with large
numbers of transportation and warehouse facilities generate and produce more truck
related traffic than other zones, and they were divided in two separate zones. The
Memphis International Airport, FedEx Hub and the BNSF Intermodal terminal were
considered as the special generators. Highway ramps and exits were also considered
major connectivity zones. The final simulation model developed for this research
consisted of 53 zones, of which 45 were internal, or zones within the boundary area, and
8 were external zones, or zones outside the boundary area. Figure 4.3 shows a snapshot
of the roadway network and the traffic analysis zones. The external zones were located
on the major roads or highway exits in the area, and they were numbered from 10 to 80.
The internal zones were numbered based on the US Census Bureau original TAZ zones
derived for the model.

43
Figure 4. 3 Road network and traffic analysis zones
One of the most important pieces of information needed for simulating the traffic
condition in the study area was the number of vehicles during the 24-hour period so that
the effects this has on the gate at the BNSF intermodal yard could be evaluated.
Passenger vehicle demand data was obtained from the Memphis long range travel
demand model (Memphis Long Range Transportation Plan 2007). The origin and
destination (OD) data from the Memphis model was aggregated for the modeled area
44
around the BNSF intermodal terminal. External zone trip data was also obtained from the
Memphis long range travel demand model and the number of zones was aggregated to
represent major road exits and entrances.
All of the OD data was complied into one 53 x 53 OD matrix, for a 24 hour
period, from four different matrices in the Memphis model, for four different time
periods. This matrix contains trips made between internal to internal zones, internal to
external zones, and external to external zones.
Truck count data as well the OD data for all the TAZs in the modeled area were
harder to collect. The Quick Freight Response Manual (QRFM) has guidelines available
for incorporating freight into modeling processes (QRFM II 2007). Truck trip generation
rates (Table 4.2) were obtained from the Phoenix Metropolitan Urban Truck Model (U.S.
Department of Transportation 2008), and were applied to the socioeconomic data at the
zone level, resulting in the total number of trucks, and also number of Four-Tire trucks,
Single Unit Trucks and Combination trucks.

45
Table 4.2. QRFM Trip Generation rates
Generation Variable
(Employment or Households)
Four-Tire
Trucks
Single Unit
Trucks (6+ Tires)
Combination
Trucks
Agriculture, Mining, and Construction 1.110 0.289 0.174
Manufacturing,
Transportation/Communications/Utilities,
and Wholesale
0.938 0.242 0.104
Retail Trade 0.888 0.253 0.065
Office and Services 0.437 0.068 0.009
Households 0.251 0.099 0.038
Source : Quick Freight Response Manual II, 2007
Effort was made to collect information on the industries located in the area,
including type of industry and number of employees. The data on types of industries
acquired from the Memphis Chamber of Commerce were only available for
Manufacturing and Transportation Industries, but not for the remaining clusters of
industries that the QRFM provides truck trip rates for.
To address this issue, data for the generation variables per TAZ was obtained
through the U.S. Census Bureau which has data availability at the Zip code level, (i.e.
number of employees per different type of industry). Estimation by the portion of the
square footage area of TAZ, within the square footage area of the zip code was made.
Truck trip numbers were then generated, but the QRFM guidelines assume that these
truck numbers are for both production and attraction at the zones. The next step was to
obtain an OD matrix for the truck movements between all the zones. These data could not
be developed, due to the lack of information on the factors for truck distribution between
zones. Truck OD’s in the modeled area were then assumed in order to run the model. The

46
percentage of trucks in the whole modeled area was assumed to be 10 percent of all the
vehicles.
Signal timing at the intersections for the modeled area was applied at 13
intersections (Figure 4.4 shows these signalized intersections). Signal phase data was
provided by the City of Memphis. The remaining intersections were left unsignalized.
Figure 4. 4 Signalized Intersections in the Modeled Area

47
4.4 Model simulation cases
Three different cases were simulated
Case 1. Evaluation of the existing road network conditions and current demand
Case 2. Estimation of the impact of the new BNSF intermodal rail terminal expansion.
For this case, truck demand was tripled from the existing estimated truck demand.
Case 3. Evaluation of adding a gate appointment system at the BNSF intermodal rail
terminal. Truck demand generated and attracted at the BNSF terminal from Case 2 was
released on the road network evenly over the 24 hour period.
Time of day distribution of the demand for the first two cases was obtained from
the Memphis long range travel demand model (Memphis Long Range Transportation
Plan 2007), and is shown in Table 4.3. All purpose trips were used for modeling
purposes. Peak hour periods for the trucks in the simulation model were assumed to
follow closely peak hour periods for the other vehicles. The Memphis model provides
peak hour period truck demand from the vehicle classification count data, as shown in
Table 4.3. When compared, values for peak periods for trucks and other vehicles by all
purposes are very close. The simulation of the road network is performed using hourly
demand distribution of all purpose trips for all vehicles. Release of the vehicles in the
network was based on the hourly factors shown in tables 4.3 and 4.4.

48
Table 4.3. Trip by purpose by time period
Percent of trips by purpose
Time
Period
Journey-
to-work
HBSchool/
HBUniversity
Other Home-
Based
Purposes
Non-Home-
Based
All
Purposes
0:00-1:00 0.8 0 0.4 0.1 0.4
1:00-2:00 0.2 0 0.1 0.1 0.15
2:00-3:00 0.3 0 0.2 0.1 0.15
3:00-4:00 0.4 0 0.1 0 0.17
4:00-5:00 0.7 0 0.2 0 0.3
5:00-6:00 2.9 0.2 0.5 0.2 1.16
6:00-7:00 9.3 7.8 2.5 0.8 5.46
7:00-8:00 16.7 23.6 7 3.8 12.52
8:00-9:00 7.8 11.7 5.8 3.4 6.79
9:00-10:00 3.1 3.1 5.1 3.8 3.9
10:00-11:00 1.3 2.6 4.4 5.4 3.27
11:00-12:00 1.8 3.3 4.7 13.2 4.42
12:00-13:00 2.2 3.7 4.8 19.1 5.17
13:00-14:00 2.4 2.1 4.7 12.2 4.41
14:00-15:00 4 13.8 7 11.4 8.54
15:00-16:00 7.1 12.3 8.4 9 9.4
16:00-17:00 10.1 3.6 7.3 5.2 7.39
17:00-18:00 12.3 4.4 8.6 3.7 8.56
18:00-19:00 6.4 1.9 8.9 3.1 6.22
19:00-20:00 3.1 1.6 7.4 2.3 4.2
20:00-21:00 2 2.3 5.1 1.4 2.95
21:00-22:00 1.9 0.9 3.7 1 2.24
22:00-23:00 1.7 1 2.1 0.4 1.32
23:00-24:00 1.4 0.2 1.2 0.2 0.9
Total 100% 100% 100% 100% 100%
Source: Memphis Long Range Transportation Plan 2007.

49
Table 4.4 Time of day release factors by truck type
AM Peak
Midday
Peak PM Peak Off Peak
Total
Four Tire Trucks 17.8 29.6 26.2 26.4 100
Single Unit trucks 17.4 34.5 25.2 22.9 100
Combination trucks 16 33 23.8 27.2 100
Source: Memphis Long Range Transportation Plan 2007.
4.5 Model Results
The simulation was performed for a 24 hour period, and the measures of
performance were generated for every hour. These measures included: vehicle flow,
delay, occupancy of lanes, average travel time for vehicles between specific OD pairs,
queue lengths, intersection delay and LOS (Level of Service).
We should note that although the model was successfully implemented, the results
are derived from assumed truck data. Truck data collection is a detailed process and
every Metropolitan Planning Organization (MPO) should be involved in gathering it in
order to perform successful modeling of the urban areas with a high percentage of truck
trips. When more data is available on truck activity, more accurate results can be
generated.
The results from the simulation can be applied for network analysis, and possible
truck delays and congestion at different points of the network. These results can be used
to analyze the queues at the terminal gates at the certain times of day in a 24-hour period
of time.

50
Model results were described for the three different cases defined in the previous
section. The first case is the analysis of the existing network with the current numbers of
vehicles provided from the OD matrix. The results are shown in Figure 4.5 which show
the LOS for the different links in the network for the AM peak time from 8 am till 9 am,
and in Figure 4.6 from 5 pm till 6 pm. These times showed the worst overall LOS on all
the intersections in the area. The area chosen for analysis is the area around BNSF
terminal, since the impact from the truck traffic on the surrounding intersections is the
greatest.
The results from AM Peak show that there is significant congestion and delay at
the Lamar Avenue and east Shelby Drive intersection, as the LOS is mainly F in both
directions on Lamar Avenue. The other critical area is at the Lamar Avenue and Holmes
Road intersection, where there is significant delay at westbound direction of Holmes
Road, and northbound direction of Lamar Avenue.
The results for the PM Peak show significant delay on the same intersections of
Lamar Avenue and east Shelby drive, with more delay at east bound direction of east
Shelby Road. Holmes Road is also congested at the PM peak time, with longer delays at
eastbound direction.
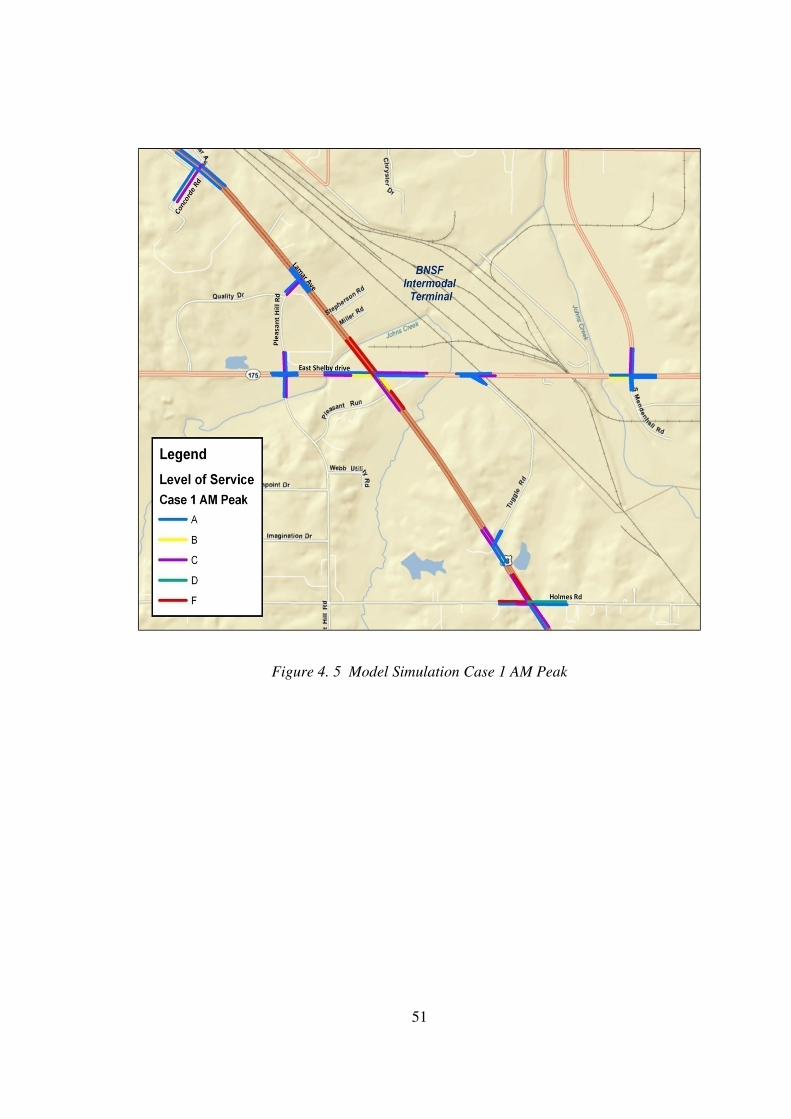
51
Figure 4. 5 Model Simulation Case 1 AM Peak

52
Figure 4. 6 Model Simulation Case 1 PM Peak
Model results from Case 2, when truck numbers that originate and are destined to
the zone in which BNSF Intermodal terminal is located are tripled, are shown in Figure
4.7, for the AM Peak period and Figure 4.8, for the PM Peak period. The results from the
AM peak show congestion and delay on the same intersections of Lamar Avenue with
east Shelby Drive and Holmes Road. In Case 2, congestion is slightly higher on Lamar
Avenue and East Shelby Drive, as the eastbound direction of East Shelby Drive and the
northbound direction of Lamar Avenue have LOS C, compared to LOS B in Case 1.

53
Holmes Road is experiencing even greater congestion in Case 2, since LOS is now E at
westbound direction of Holmes road, compared to LOS D in Case 1. The eastbound
direction on Holmes road is now LOS D compared to LOS C in Case 1. The intersection
of Lamar Avenue at Concorde Road is now more congested as indicated by LOS C at
eastbound direction of Concorde road, compared to LOS A in Case 1.
Figure 4. 7 Model Simulation Case 2 AM Peak

54
In Case 2 for the PM peak, more links on Lamar Avenue and Shelby Road have
LOS F, making the overall LOS at this intersection F. The other links in the area do not
show any significant differences from Case 1.
The results from Case 3, with the applied gate appointment system at the BNSF
Intermodal terminal, when the truck arrivals are evened out during 24 hours, are shown in
Figure 4.9, for the AM Peak period, and Figure 4.10, for the PM Peak period. Results for
the AM peak show just a slight improvement of the Lamar Avenue and East Shelby
Figure 4. 8 Model Simulation Case 2 PM Peak

55
Drive intersection, as the eastbound direction of east Shelby Drive has improved from
LOS C to LOS B. The intersection of Holmes Road and Lamar Avenue has the same
LOS as in Case 2 on all links at the intersection. The LOS at the southbound direction of
south Mendenhall Road has improved from LOS C to LOS B. The LOS on the other links
in the area did not change significantly.
Figure 4. 9 Model Simulation Case 3 AM Peak

56
Results for the PM peak time period for Case 3 show additional improvement of LOS on
the Lamar road and East Shelby Drive intersection from Case 2. LOS is reduced from
LOS F to LOS C at the southbound direction of Lamar Avenue, and at the northbound
direction from LOS C to LOS B. East Shelby Drive has a slight decline in LOS at the
eastbound direction from LOS C to LOS D. The LOS on the intersection of east Shelby
Drive and south Mendenhall Road has declined in LOS in Case 3 at the southbound
direction of South Mendenhall Road from LOS B to LOS D and at the east bound
direction of East Shelby Drive from LOS B to LOS C.
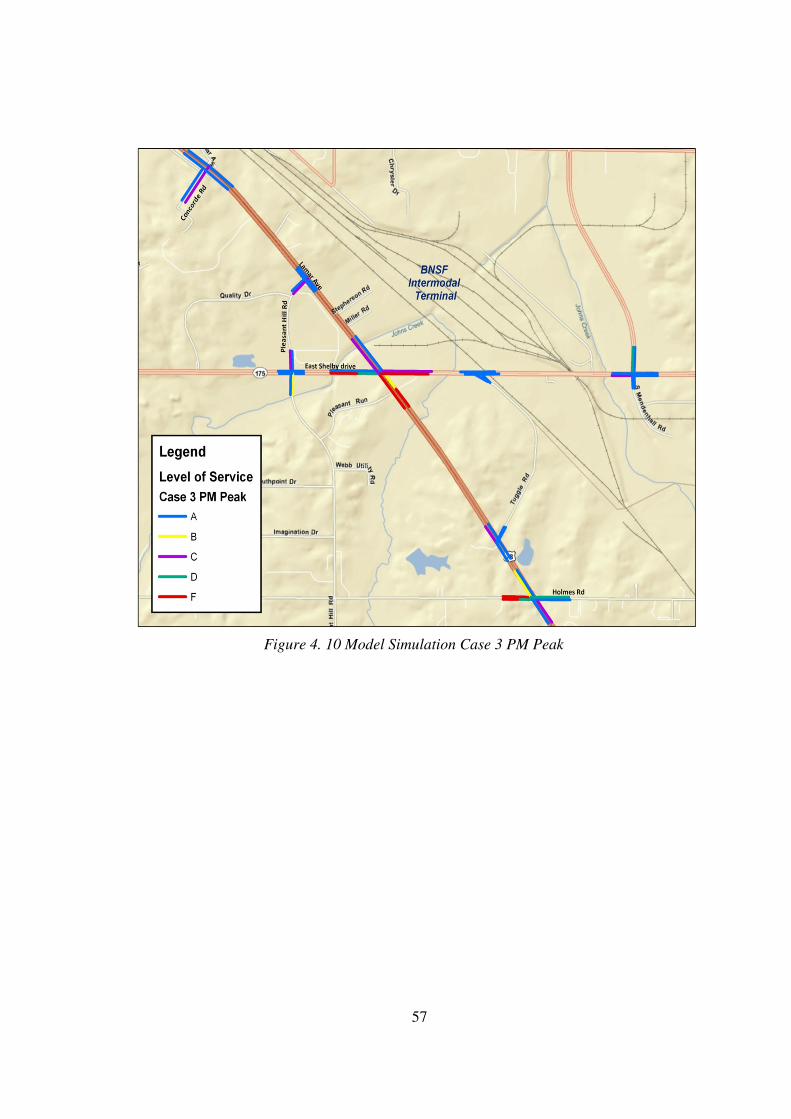
57
Figure 4. 10 Model Simulation Case 3 PM Peak
58
Section 5: Discussion and Analysis
5.1 Model Assumptions
The micro-simulation modeling of the roadway network around BNSF Intermodal
terminal was performed successfully for all the cases. The results for all three cases are
derived from the assumed truck data. The number of trucks on the network was assumed,
due to lack of information on the number of trucks that travel between the zones in the
network. The assumption was that 10 percent of trucks are released between all the zones,
and this should be a reasonable assumption, since the network consists of both residential
and industrial areas. The time of day factors, or the percent of release of vehicles in the
24 hour period, were also assumed, but they represent factors derived from a survey of
passengers in 1998 (Memphis Long Range Transportation Plan 2007), and the results
from this kind of traffic release were reasonable for all three cases.
The modeled area is very large, and there are around 60 signalized intersections,
but for the purpose of analysis of the congestion and delay at and around BNSF
Intermodal terminal, only 13 intersections were signalized. Other intersections in the
model act like free flow intersections, and this assumption is not expected to create any
significant problems given that the other intersections were far away from the study site
and should not significantly impact flow around the BNSF facility.
Another assumption in Case 2 was that the truck numbers from the new BNSF
facility will triple, and this is the worst case scenario for the numbers of loads handled in
a year stated by BNSF. The results from this simulation are a better representation of the
impact this increase of truck traffic will have on the road network.
59
In Case 3 simulation results are derived from the assumptions that all the trucks
use gate strategies in Zone 370 where BNSF Intermodal yard terminal is located. The
truck release times in the Paramics microsimulation are evened out in 24 hours for Zone
370 and this is a reasonable assumption for evaluating potential impact of the
appointment system strategy since in order for a gate appointment system to be effective,
a large number of trucks must use it.
5.2 Key Findings of the Research
The results of all three Cases of the micro-simulation modeling show significant
congestion and delay at the main intersections in the area, at Lamar Avenue and east
Shelby Drive and at Lamar Avenue and Holmes Road. The results from tripled truck
numbers in Case 2 for both AM and PM time periods demonstrate that the overall LOS
has declined at almost all of approaches at these intersections. This suggests that if the
BNSF facility operates at full capacity the congestion on the surrounding road network
will be high. The terminal gates at the BNSF intermodal terminal can be affected by this
congestion, which will result in more trucks idling at the terminal gates, which is a
significant environmental concern.
In Case 3 when the gate strategies were applied at the BNSF Intermodal terminal
on an already tripled truck demand OD, congestion on the roadways for the AM and the
PM peak time period was slightly reduced. This improvement was mainly observed at the
intersection of Lamar Avenue and east Shelby Drive, although some links remained at
LOS F. In the PM peak time period the intersections of the east Shelby Drive and south
Mendenhall Road show declines in LOS. This may mean that Paramics micro-simulation

60
is rerouting traffic from the busy intersections to the intersections with a lesser amount of
delay.
The results from Case 3 are just slightly improved, and some links on the key
intersections in the area still have LOS F. The simulation preliminarily indicates that the
proposed gate appointment system will only lower the congestion slightly. Based on
simulation results, this reduction in congestion and delay would only happen if the gate
appointment system is mandatory at the terminal, and if the truck drivers are given
incentives to use it. Since the congestion and the LOS are only slightly improving, this
suggests that the gate appointment system strategy alone may not be effective in
achieving significant reductions in congestion. The gate appointment strategy
implemented with other complementary approaches might lead to more significant
reductions in network and facility congestion. It should also be noted that while
reasonable assumptions were made in the development of this model, the lack of
available data, in particular with regard to truck volumes, may not accurately reflect the
potential impact of a gate appointment system. If additional data becomes available
allowing a more representative model to be developed, these scenarios should be
revisited to further evaluate the potential impact of a gate appointment system on the
BNSF facility and network congestion.

61
Section 6: Conclusions and Recommendations
The BNSF intermodal terminal expansion completion in 2009 is posing a major
concern for the already congested road network in the heavy industrial area of Memphis.
Truck traffic in the area is already great, and with the expected rise of truck demand at
the BNSF terminal, it could potentially reach a point where all the intersections in the
area are highly congested. That is why it is important to evaluate strategies that could be
applied at the BNSF terminal to reduce congestion, before surrounding roads reach
capacity.
Although not indicated in the results of the BNSF intermodal facility study, gate
appointment systems have the potential to significantly improve operations inside the
terminal as well as at the gate, based on results from previous studies. As a secondary
result, reduce congestion on the roadway system, and therefore reduce harmful emissions
in the neighboring communities. Of course, as freight shipping increases, there will be a
point that limits the amount of trucks and containers that can physically be processed
within the constraints of terminal boundaries, but there is certainly room for improvement
now, before reaching that point.
Coordination between trucking companies and the intermodal terminals is
essential for efficient terminal operations. Gates that are clogged can worsen terminal
capacity and this creates not only an operational but also an environmental problem. For
a tactical/operational level gate strategy system to be effective, a large percentage of
trucks will have to use it, and there has to be some priority or benefit for trucks with
appointments. Incentives are necessary to get trucking companies to buy into
62
appointment systems and actually make appointments (and keep them). Incentives may
also be needed for the terminals to use the systems effectively.
Results from the simulated road network at the BNSF Intermodal rail terminal are
beneficial for the analysis of the congestion and delay on the major roadways and the
intersections. Paramics micro-simulation results give a detailed representation of the
behavior of travelers at the individual level. These results are also beneficial because the
feedback from micro-simulation modeling can be provided for small time intervals, so
that the congestion and delay on the network can be identified for particular times of the
day. The only problem is the amount of data that is needed for Paramics microsimulation,
especially for larger scale networks. Traffic counts and patterns between the zones and
selection of zones is a major part of this problem, since the most recent data that is best
for the modeling is not always available.
The results from modeling the most recent data available for this research
demonstrate that the impact from the BNSF Intermodal rail terminal expansion, if
capacity is reached, is going to have an impact on increasing delay and congestion on two
of the intersections closest to the entrance on Lamar Avenue. A gate strategy simulation
was applied on the increased capacity, with the assumption that large percentages of
trucks are using appointments, and that the trucking companies as well as the rail
terminal are given incentives. The results from these of assumptions and gate strategies
application did not show significant decrease of the congestion on the major roadways
and the intersections around the intermodal yard. One of the problems with these
assumptions was that not enough truck data was available for just the BNSF Intermodal

63
yard terminal truck traffic, and there is no real information on actual truck queues at the
new AGS gates.
The solution to a problem of the congestion on the roadways around the BNSF
terminal may have to be combination of gate strategies, gate technologies, and also road
improvements. Analyzed results can be utilized for cost categorization in possible road
improvements, such as adding more lanes, redesign of traffic signal timing, intersection
improvements and upgrading existing roads to higher functionality roads.
6.1 Recommendations for Future Research
Increased efficiency at intermodal rail terminals due to any or all of the strategies
discussed in this research can affect the overall transportation community by allowing
more containers to be shipped, and moved more quickly away from the terminals, onto
the other forms of transportation, and to their final destinations. The gate appointment
strategies did not prove to be very effective for the analyzed time periods and assumed
data in the modeled cases for the BNSF rail intermodal facility. However there was a lack
of recent passenger vehicle data, and also the truck data was assumed for the whole area.
There was also no data on actual truck queues at the new BNSF terminal.
In order to get more precise results new models runs with more recent and
accurate data needs to be performed. The data from the most recent traffic counts was not
matched with the observed count data due to lack of software extension for the Paramics
software. This extension is the Paramics Estimator, and its major function is to estimate
OD matrix data. The most recent OD data, especially truck data is also very important in
getting most accurate results from the microsimulation. The Paramics microsimulation

64
results can also be compared with the other microsimulation software, like Vissim
(Visual Solutions Incorporated), TransCad (Caliper Corporation), and/or VISTA (Vista
Transport Group Inc.). A comparative analysis of these kinds of results can give a better
understanding of the potential problem that BNSF Intermodal terminal activities can have
at their gate and terminal operations, as well as the surrounding roadways and
intersections. New model runs can also be performed when there is a better understanding
of the actual number of trucks that BNSF plans to handle with the new facility capacity,
and also the actual truck traffic release times for a 24 hour period.
The results from this research can be very beneficial to future modeling purposes,
or planning purposes. The structure of the network can be changed or evaluated to see
what road improvements might best lower congestion. The problems at the nodes or
intersections can also be analyzed with changes in traffic signal timings, or changing a
design and intersection approach. This kind of model and results can be beneficial to all
involved stakeholders, including the Memphis MPO and City of Memphis in planning
future road improvements and the BNSF rail intermodal facility in identifying an
effective combination of gate strategies to reduce congestion.
65
Bibliography
Cambridge Systematics, The University of Memphis. "Lamar Avenue Corridor Study."
yet to be published.
BNSF Railway. "Key Costumers Get Advance Look at BNSF's Expanded Memphis
Intermodal Facility." October 2009. November 2009
<http://bnsf.com/media/news/articles/2009/10/2009-10-06a.html>.
Bureau of Transportation Statistics. "Freight in America, A New National Picture." 2006.
Bureau, U.S. Census. US Census Bureau Traffic Analyis Zone. 2009. July 2009
<http://www.census.gov/geo/www/cob/tz_metadata.html>.
Caliper Corporation. TransCad. 15 November 2009 <http://www.caliper.com/>.
Cambridge Systematics, Inc. "Port Peak Pricing Program Evaluation." 2009.
"Canadian National Railway." 2009. Gate Appointment. May 2009
<http://www.cn.ca/en/tools-schedule-gate-appointment.htm>.
COSMOS. Automatic Gate System. 2008. 31 July 2009
<http://www.cosmosworldwide.com/automatic_gate_system.aspx>.
Edge Manager Auto Gate. Zebra Enterprise Solutions. September 2009
<http://zes.zebra.com/products/application-software-solutions/gate-
operations/edge-manager-auto-gate.jsp>.
eModal. 2009. 31 July 2009 <http://www.emodal.com/default.aspx>.
Federal Highway Administration. "Freight Mangement and Operations." 2007. Weight of
Shipments by Mode: 2002, 2006, 2035 (Millions of Tons). 20 October 2009
<http://ops.fhwa.dot.gov/freight/freight_analysis/nat_freight_stats/docs/07factsfig
ures/table2_1.htm>.
Genevieve Giuliano, Sara Hayden, Paul Dell’aquila, Thomas O’Brien. "Evaluation of the
Terminal Gate appointment system at the Los Angeles/Long Beach Ports." Final
Report. 2008.
Genevieve Giuliano, Thomas O’Brien. "Reducing port-related truck emissions: The
terminal gate appointment system at the Ports of Los Angeles/Long Beach."
Transportation Research Part D, Vol.12, No.7 (2007): 460-473.

66
Guan, Chang Qian and Rongfang (Rachel) Liu. "Modeling Marine Container Terminal
Gate Congestion, Truck waiting cost, and optimization." Transportation Research
Board (2008): 1-15.
Huynh, Huynh Nhan. "Methodologies for reducing Truck turn Time at Marine Conatiner
Terminals." Austin, Texas: Doctoral Dissertation, May 2005.
InfoUSA. InfoUSA. 2009. November 2009 <http://www.infousa.com/>.
Intermodal Association of North America. Intermodal Fact Sheet. 31 July 2009
<http://www.intermodal.org/statistics_files/Intermodal%20Fact%20Sheet.pdf>.
Ioannou, Petros A. "Intelligent Freight Transportation." 2008. Google books. April 2009
<http://books.google.com/books?id=-
HI1YZarRAkC&pg=PA3&lpg=PA3&dq=Intelligent+Freight+Transportation&so
urce=bl&ots=SfBnR44pZI&sig=jGpqU9jSEuv2KDDov_tHABJgxck&hl=en&ei=
QBr7SqCuNYa1tgegi4GmCw&sa=X&oi=book_result&ct=result&resnum=2&ve
d=0CAwQ6AEwAQ#v=onepage&q=>.
J. Srour (SAIC), J. Kennedy (SAIC), M. Jensen (SAIC), C. Mitchell (SAIC). "Freight
Information Real-Time System for Transport (FIRST), Evaluation final report."
2003.
Jade Logistics. "Scaling new heights of funcionality." September 2009
<http://www.jadeworld.com/downloads/news/CS_Jul_Aug07_p3941.pdf>.
Juang, J. and R. Liu. " Evaluating Marine Terminal Gate-In Delays and Rationale Of
state Bills. CD-ROM. ." Transportation Research Board of National Academies,
Washington, D.C (2003): 3-7.
Katta G. Murty, Yat-wah Wan, Jiyin Liu, Mitchell M. Tseng, Edmond Leung, Kam-
Keung Lai, HermanW.C. Chiu. "Hongkong International Terminals Gains Elastic
Capacity Using a Data-Intensive Decision-Support System." INFORMS (2005):
61-75.
Memphis and Shelby County Department of Regional Services. Memphis Long Range
Transportation Plan. 2007. September 2009
<http://dpdgov.com/rs/resourcedocs/Executive%20Summary.pdf>.
NAVIS. NAVIS yard management solutions. 2009. September 2009
<http://navis.com/products/navis/yard-management-solutions/index.jsp>.
Pacific Gateway Portal. 2008. May 2009
<http://www.pacificgatewayportal.com/pgpsite/>.
Philippe Morais - Roche Ltee, Groupe-conseil; Elisabeth Lord - Levelton Consultants
Ltd. "Terminal appointment system study." 2006.

67
Port Metro Vancouver. Trucking. 2009. July 2009
<http://www.portmetrovancouver.com/users/landoperations/trucking.aspx>.
Quadstone Paramics. 2009. 2009 <http://www.paramics-online.com/>.
Rajeev Namboothiri, Alan L. Errera. "Planning local container drayage operations given
a port access appointment system." Transportation Research Part E.Vol 44, No. 2
(2008): 185-202.
Sgouridis, S.P. and D.C. Angelides. "Simulation-Based Analysis of Handling Inbound
Containers in a Terminal." Winter Simulation Conference, San Diego, CA, USA
(2002): 1716-1724.
Shipper, American. The Intermodal Terminal of the future. October 2008.
<http://zes.zebra.com/pdf/Terminal_58-69_AS1008_lrsp.pdf>.
Solomon, D., Bailey G. "Pollution Prevention at Ports:Cleaning the Air." 2004.
State Environmental Resource Center. "Diesel Pollution at ports." 2009. State
Environmental Resource Center. October 2009
<http://www.serconline.org/dieselPortPollution.html>.
SynchroMet. SynchroMet. July 2009 <http://www.synchromet.com/index.asp>.
The Memphis Regional Chamber Departments of Economic and Community
Develpoment. "Memphis Logistics Assets." Memphis Chamber of Commerce,
2007.
The Port Authority of NY &NJ. Sea Link. 2009. September 2009
<http://www.panynj.gov/port/sea-link.html>.
Theofanis S.,Boile M., Golias M. "Evaluating roadside impact of different gate operation
startegies at the container terminal using microsimulation." Annual Transportation
Research Forum, 16-19 March 2008.
Total Soft Bank. Computer Operated Terminal Operating System (CATOS). 14
September 2009 <http://www.tsb.co.kr/Ver1/Products/0101-5.php>.
U.S. Department of Transportation, Federal Highway Administartion. "Quick Freight
Response Manual II." 2008. Incorportating Freight into "Four-Step" Travel
Forecasting. 2009
<http://ops.fhwa.dot.gov/freight/publications/qrfm2/sect04.htm>.
US Environmental Protection Agency. "EPA Smartway Transportation Partnership." A
glance at clean freight strategies: EModal port community system for drayage.
July 2009 <http://epa.gov/smartway/transport/documents/tech/420f06008.pdf>.

68
Vista Transport Group Inc. VISTA. 15 November 2009
<http://www.vistatransport.com/products/>.
Visual Solutions Incorporated. VISSIM. 15 November 2009 <http://vissim.com/>.