to review of basic skills education program (bsep) i and · m review of basic skills education...
TRANSCRIPT

to
M Review of Basic Skills EducationProgram (BSEP) I and II
Robert E. Krug, Clifford P. Hahn, and Lauress L. WiseAmerican Institutes for Research
andJoan Harman
Army Research Institute
Instructional Technology Systems Technical AreaTraining Research Laboratory
DTICELECTE
JUL 1 M986I
D
U. S. Army
Research Institute for the Behavioral and Social Sciences
_January 1985
4,--*.* . 0-....7,. *,
A ;,r v ed f o f 11 I)I i .I{ a s (I, .r,+ If i b t I n u l t ol Ul lllt(I.

U. S. ARMY RESEARCH INSTITUTE
FOR THE BEHAVIORAL AND SOCIAL SCIENCES
A Field Operating Agency under the Jurisdiction of the
Deputy Chief of Staff for Personnel
*L. NEALE COSBY
EDGAR M. JOHNSON Colonel, INTechnical Director Commander
Research accomplished under contractfor the Department of the Army
American Institutes for Research
Technical review by
Douglas DresselDavid W. Bessemer
NOTICES
DISTRIBUTION: Primary distribution of this report has been made by ARI.Please address correspondence concerning distribution of reports to: U.S.
Army Research Institute for the Behavioral and Social Sciences, ATTN:
PERI-POT, 5001 Eisenhower Avenue, Alexandria, Virginia 22333-5600.
FINAL DISPOSITION: This report may be destroyed when It Is no longer
needed. Please do not return It to the U.S. Army Research Institute for
the Behavioral and Social Sciences.
NOTE: The findings in this report are not to be construed as an officialDepartment of the Army position, unless so designated by other authorized
4 documents.
UNCLASSIFIEDSECURITY CLASSIFICATION OF THIS PAGE (Wh.n flta .Fntv. ed)
REPORT DOCUMENTATION PAGE READ INSTRUCTIONSBEFORE COMPLETING FORM
1. REPORT NUMBER 2. GOVT ACCESSION NO. 3. RECIPIENT'S CATALOG NUMBER
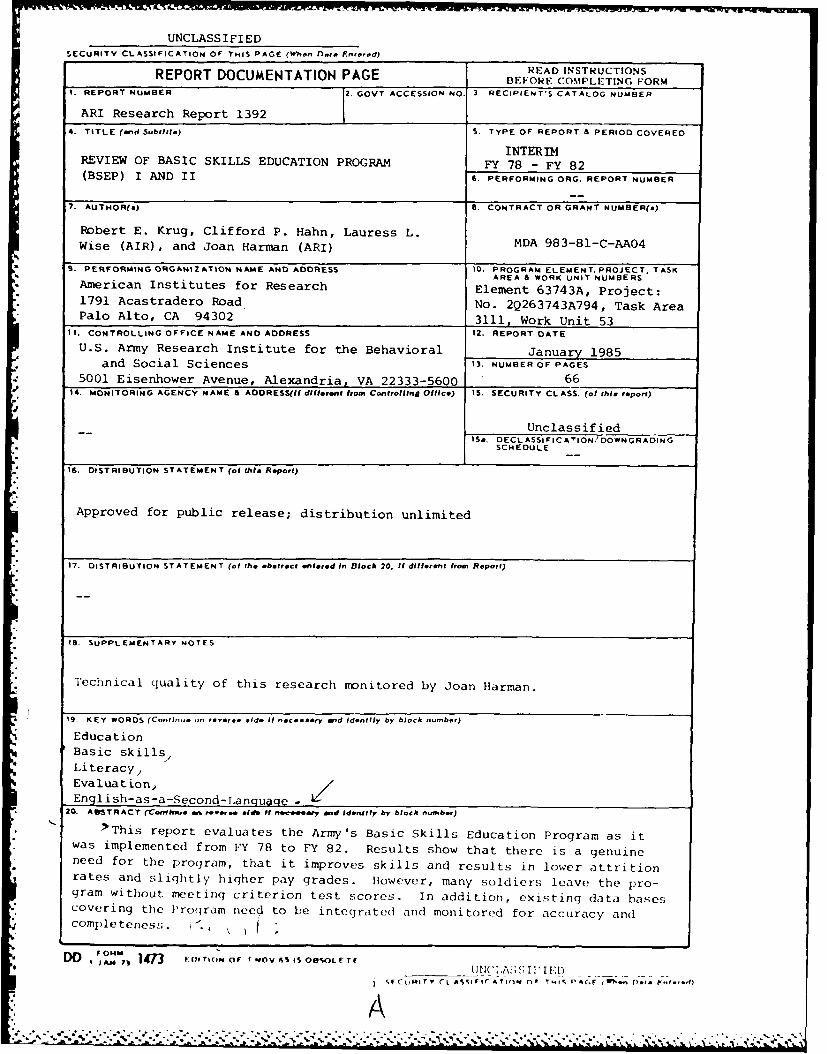
ARI Research Report 1392J4. TITLE (rid S.btitle) S. TYPE OF REPORT & PERIOD COVERED
INTERIMREVIEW OF BASIC SKILLS EDUCATION PROGRAM FY 78 - FY 82(BSEP) I AND II 6. PERFORMING ORG. REPORT NUMBER
7. AUTHOR(o) 8. CONTRACT OR GRANT NUMBER(.)
Robert E. Krug, Clifford P. Hahn, Lauress L.Wise (AIR), and Joan Harman (ARI) MDA 983-81-C-AA04
9. PERFORMING ORGANIZATION NAME AND ADDRESS 10. PROGRAM ELEMENT. PROJECT. TASK
AREA 6 WORK UNIT NUMBERSAmerican Institutes for Research Element 63743A, Project:1791 Acastradero Road No. 2Q263743A794, Task AreaPalo Alto, CA 94302 3111, Work Unit 53
1. CONTROLLING OFFICE NAME AND ADDRESS 12. REPORT DATE
U.S. Army Research Institute for the Behavioral January 1985and Social Sciences 13. NUMBER OF PAGES
5001 Eisenhower Avenue, Alexandria, VA 22333-5600 6614. MONITORING AGENCY NAME & ADORESS(If dilfferent from Controllind Office) 15. SECURITY CLASS. (of this report)
UnclassifiedIS*. DECL ASSI FICATION/DOWNGRADING
SCHEDULE
16. DISTRIBUTION STATEMENT (of thi Report)
Approved for public release; distribution unlimited
17. DISTRIBUTION STATEMENT (of the obstrct entered In Block 20, It different from Report)
t1. SUPPLEMENTARY NOTES
Technical quality of this research monitored by Joan Harman.
19. KEY WORDS (Conline on revoe. oide, If necessary eid Identify by block number)
EducationBasic skills.Literacy,
Evaluation)English-as-a-Second-Inqua -
20. A STRACT (rCanh.- e e -.. re. . d f ne .esary And Idetlity by block number)
*>This report evaluates the Army's Basic Skills Education Program as itwas implemented from FY 78 to FY 82. Results show that there is a genuineneed for the program, that it improves skills and results in lower attritionrates and slightly higher pay grades. However, many soldiers leave the pro-gram without meeting criterion test scores. In addition, existing data basescovering the Program need to be integrated and monitored for accuracy and
completeness ,
DO, FONM 3 1473 NOtNO S SOiOE[AM IJN('I ,A,-F I t "D
jSTee PAt(J WP. . .
",,' -"." 1".,,' ." .-- ''. ". "."".'"." ." .* ." " "-%-".-".-. , .- '-" ". "-' -. , -"-" " ".- - - .,. . ..- • . • , .-. -.S ., ..

Research Report 1392
Review of Basic Skills EducationProgram (BSEP) I and 11
Robert E. Krug, Clifford P. Hahn, and Lauress L. WiseAmerican Institutes for Research
andJoan Harman
* Army Research Institute
Submitted byZita M. Simutis, Chief
Instructional Technology Systems Technical Area
Approved as technically adequateand submitted for publication byDonald F. Haggard, Acting DirectorTraining Research Laboratory
U.S. ARMY RESEARCH INSTITUTE FOR THE BEHAVIORAL AND SOCIAL SCIENCES5001 Eisenhower Avenue, Alexandria, Virginia 22333
* Office, Deputy Chief of Staff for PersonnelDepartment of the Army
January 1985
Army Project Number Evaluation of the Basic*20263743A794 Skills Education Program
Appfove'd for prtjw)ic rorloasr: (iisw(IoutI~li iflrts

ARI Research Reports and Technical Reports are intended for sponsors ofR&D tasks and for other research and military agencies. Any findings readyfor implementation at the time of publication are presented in the last partof the Brief. Upon completion of a major phase of the task, formal recom-mendations for official action normally are conveyed to appropriate militaryagencies by briefing or Disposition Form.
i,4
a,
bi
4 J- |as .q4 ~ S

FOREWORD
The Curriculum and Evaluation Team in the Instructional Technology Sys-tems Technical Area of the U.S. Army Research Institute for the Behavioraland Social Sciences performs evaluation and curriculum development applicableto military education and training. A major focus of this research is thedevelopment of information on which the Department of the Army can base de-cisions about its Basic Skills Education Program.
This report evaluates the Army's Basic Skills Education Program as itwas implemented from FY 78 to FY 82. Results show that there is a genuineneed for the program, that it improves skills and results in lower attritionrates and slightly higher pay grades. However, many soldiers leave the pro-gram without meeting criterion test scores. In addition, existing data basescovering the Program need to be integrated and monitored for accuracy andcompleteness.
This research effort was supported by the Office of the Adjutant Gen-eral and the Training and Doctrine Command.
EDGAR M. JOHNSONTechnical Director
P DEC T
Accesion ForNTIS CRA&WUL1 IC TABU. .anno.ced o I
By............. .........
"By
Di4t ibutio, i I
Availability Codesce Avail a;d o
NTSCR4.1 I AB[
U.ana,;cd [
J ifct1,
B y ......... ......... .......

REVIEW OF BASIC SKILLS EDUCATION PROGRAM (BSEP) I AND II
EXECUTIVE SUMMARY
Requi rement:
The Department of the Army has a need for information on which to basedecisions about the future of its Basic Skills Education Program.
Procedure:
Two major efforts were made to evaluate the Basic Skills EducationProgram:
1. Analysis of archival data, and
2. Field investigations.
Findings:
There is a genuine need for the Program. It improves soldiers' basicskills and results in lower attrition rates and slightly higher pay grades.However, many soldiers leave the Program without meeting criterion testscores. In addition, existing data bases covering participants' records
need to be integrated and monitored for accuracy and completeness.
i
Utilization of Findings:
The Department of the Army can use these findings to guide future de-cisions concerning the Basic Skills Education Program.
V
j vii
C . . . . . .

REVIEW OF BASIC SKILLS EDUCATION PRO)GRAM4 (BSEP) I AND II
CONTENTS
Page
INTRODUCTION................................. . ...... . .. .. .. .. ... 1
THE BSEP CONCEPT..............................4
koPROCEDURES.................................8
Background................................8Review of General Literacy Problems...................8
* Analyses of Archival Data.........................11Review of Existing ESL Program......................15
* ~FINDINGS.......................... .. . . ...... ... .. ............. 1
The Program................................18
* Documentation Review..........................20
* Analyses of Archival Data.........................22BSEP I Literacy............................22BSEP IESL..............................26
BSEP II Literacy...........................29
THE STATUS OF BSEP: A SUMMARY AND SOME SUGGESTIONS............45
REFERENCES.................................49
APPENDIX..................................51
ix

~~%7 1.--------
CONTENTS (Continued)
Page
LIST OF TABLES
Table 1. SelectABLE scores and AIT completion .... ............. 21
2. BSEP I enrollment and AIT completion SelecTABLE scoresbelow 18 ............ ........................... 21
3. Eligibility and enrollment in BSEP I (Literacy) ......... 23
4. Mean grade level gains as measured by ABLE I tests forparticipants in BSEP I, 6-week literacy programs ........ . 25
5. Gains in BSEP I as a function of entry level .......... . 26
6. Eligibility and enrollment in BSEP I (ESL) .. .......... 27
7. ESL enrollment and ECLT scores ..... ................ 27
8. ESL enrollment and AIT attrition ............... 28
9. ECLT<40 and AIT attrition ....... .................. 28
10. ECLT gain by weeks of instruction .... .............. 29
11. Participation rates in BSEP II among reported BSEP IIeligibles ............... ........................ 31
12. Percentage of BSEP II eligibles achieving selected grdd!levels on the five ABLE II (Form A) pre-tests betwtenFY78 and FY80 .......... ........................ 32
13. Percentage of BSEP II eligibles achieving selected gradelevels on the six TABE pre-tests ............... 33
14. Percentage of BSEP II participants achieving selected gradelevels on the five ABLE II (Form B) post-tests betweenFY78 and FY80 .......... ........................ 34
15. Percentage of BSEP II participants achieving selected gradelevels on the six TABE post-tests .... .............. 35
16. Average grade level gains between pre-tests and post-tests forthe five ABLE II tests among participants completing BSEP IIbetween FY78 and FY80 ........ .................... 37
17. Average grade level gains between pre-test and post-test forthe TABE tests for successful graduates of BSEP II ...... . 38
4x
% C )

- ~ ~ ~ ~ ~ ~ ~ 7 1 .. -9-
CONTENTS (Continued)
Page
Table 18. Termination codes armong BSEP II participants .. ........ 39
19. Original GT scores of BSEP II eligibles. ........... 41
20. GT retest scores for BSEP II participants. .......... 42
21. Gains in GT scores by BSEP II participants .. ......... 43
22. General technical composites for BSEP II participantsFY 1981-82. ..................... .. ... 44
A-1. Percent achieving each ECL level by initial ECL level(FY 79 and 80). ........................ 53
*A-2. Percent achieving each ECL level by initial ECL level(FY 81Cohort). ........................ 54
*A-3. Distribution of length of ESL training by initial ECL level(FY 79 and 80). ........................ 55
A-4. Distribution of length of ESL training by initial ECL level(FY 81Cohort). ........................ 56
A-5. Percent achieving each ECL level by number of weeks ofinstructin(FY 79aand80). ........... 57
A-6. Percent achieving each ECL level by number of weeks ofinstruction (FY 81) ...................... 58
xi

INTRODUCTION
The Army's Basic Skills Education Program (BSEP) is a large
undertaking. It is difficult to determine precisely how large it
is since figures maintained by different agencies do not always
agree. The data reported to the Army Continuing Education System
(ACES) on DA Form 1821-R provide reasonably complete accountings
for the past several years. For FY 80 and 81, the ACES data show
BSEP I individual enrollments of 15,984 and 15,662 respectively.
For the same two years, individual enrollments in BSEP II are
shown as 64,643 and 73,263.
While the term BSEP I is sometimes used to describe any type
of remedial skills training designed for soldiers who test out at
less than grade level 5 on basic verbal and numerical skills, in
this report BSEP I designates those programs implemented in the
training base either prior to or concurrent with Basic Combat
Training (BCT), Advanced Individual Training (AIT), or One
Station Unit Training (OSUT). Such programs include both general
literacy programs and English-as-a-Second Language (ESL)
programs. BSEP 11 programs involve soldiers assigned to
permanent duty stations within FORSCOM, TRADOC, and other Major
Commands (MACOMS). The literacy component is dominant,
accounting for 80% of BSEP I enrollments and 95% of BSEP II
enrollments.
I-
* . -%..
• -" ' " oo &*L "& , o o .. t -f o ° -iax °.° 0* * * - .° -- * o •.o-. - o -.- * o - - " " o . °

Both BSEP I and BSEP II are decentralized. The programs are
monitored by Education Service Officers (ESOs); instruction is
provided by contract teachers who may have individual contracts
with the local installation or may be employed by an institution
that has contracted to provide instructional services for one or
more installations. Both BSEP I and II are variable and
heterogeneous programs. Neither has had a standardized
curriculum; each school or contractor has selected its own
* syllabus, materials, lesson plans and instructional approach.
The closest approaches to standardized curricula have occurred
when institutional contractors have been responsible for
operating programs at multiple installations (Big Bend Community
College/Temple University in Germany or Central Texas Union
Junior College within FORSCOM) and in the ESL component of BSEP
I, where the American Language Course (ALC) developed by the
- Defense Language Institute (DLI) has been used in some form by
"" nearly all contractors. Even in this case, there is significant
variation across training sites; local modifications have
produced highly variable applications of the ALC. A standardized
ESL program developed for TRADOC by DLI is now being introduced,
and developmental work is underway for a standardized set of
modules to be used in functionally oriented BSEP II programs.
But for the period covered by this report, FY79 to FY82, both
BSEP I and II are to be regarded as labels for a set of
instructional projects. In a strict sense, neither can be
regarded as a program.
2

Contract MDA 903-81-C-AA04 between the U.S. Army Research
Institute (ARI) and the American Institutes for Research (AIR)
calls for a review of the existing BSEP. The review should be
based on observations, interviews, existing literature and on
analyses and re-analyses of archival data. Some of the Task 1
effort was accelerated in response to changes in emphasis within
the BSEP programs: ESL received far more attention in the first
two contract years than had been planned, and literacy programs
received less. The major consequence is that some Task 1 results
were published prior to this report (Holland, Rosenbaum and
Stoddart, 1982a, 1982b; Krug and Wise, 1982). The purpose of
this report is to (1) describe the activities that were
undertaken, (2) summarize the findings, and (3) present the
tabular documentation that support the findings.
.3
4',
'p I3

THE BSEP CONCEPT
The program is defined and established in AR621-5 of 15
October 1981, from which the following excerpts are taken.
" The program is designed to develop educational
competencies required for a soldier's job perfor-mance, skill qualifications, and career growth.
(Section 2-1.)
" BSEP will develop job-related educational skills
from soldier's entry into active service through
completion of the Advanced Course, NCOES. Formal
entry into BSEP is a commander's decision, made
after coordination with the ACES ESO and dis-
cussion with the soldier. One main thing to con-sider in selecting participants should be that
soldiers are willing to learn and use thisknowledge productively in the Army. The purpose
of this effort is to fulfill the Army's obligationto provide a fully functional education.Section 2-4, italics added.)
" TRADOC will conduct BSEP I during initial entry
training; BSEP I ends once a soldier earns an MOS.This phase of BSEP provides soldiers basic literacy
instruction in reading and arithmetic to form a
basis for MOS training. The instruction will be
given prior to or during advanced individual train-
ing (AIT) or at any point during the One Station
Unit Training (OSUT) cycle. ESL instruction alsois provided to soldiers who need it. Normally,
ESL is given prior to basic training (BT) or toOSUT but may be initiated at any phase of initial
entry training when test results or commanderevaluation of performance indicates a need. Troopcommanders in the training base may refer anysoldiers who might have to be released due toreading, writing, speaking, listening, or comput-ing trouble to the AEC staff for special counselingand entry into BSEP I literacy or ESL instruction.Soldiers who score below a raw score of 19 in
verbal and numerical concepts on the Select AdultBasic Learning Examination (SelectABLE) or belowa score of 70 on the English Comprehension LevelTest (ECLT) will be considered first for BSEP I.Soldiers who score between 19 and 26 on theSelectABLE will also be reported to the commanderas potential eligibles for literacy instruction.(Section 2-4(a).)
4
44

BSEP II provides soldiers instruction in reading,writing, speaking, listening, and computing skillsneeded for them to perform military duties throughgrade E5. This instruction will be oriented tothe job being performed and will include militarylife-coping skills and learning strategies. TheTest of Adult Basic Education (TABE) will be usedas a basis to place members in proper levels andmeasure their educational achievement after in-struction. Instruction will be geared to raiseliteracy skills to at least the ninth-grade levelas measured by the TABE and to raise Englishlanguage comprehension to a score of 70 on the ECLT.Soldiers are normally identified as potentiallyeligible for BSEP II instruction in one of thefollowing three ways:
(1) Referrals based on GT scores. Duringinprocessing at permanent duty stations, soldierswho have a GT score of less than 90 will be re-ferred within 30 days.
(2) Unit commander referrals. These arebased on supervisors' assessments or on voluntaryrequests by soldiers.
(3) SQT referrals. Those who score lessthan the minimum required for MOS verification onSQTs as reported on the individual soldier'sreport (ISR). Soldiers whose retention is inthe best interests of the Army will be consideredfirst. (Section 2-4(b).)
In simplest form, the rationale that underlies the Basic
Skills Education Program that is defined in AR 621-5 has the
following elements.
1. Some enlistees lack sufficient skills in read-* ing, writing, speaking, listening, and/or computing,. to perform effectively in their assigned duty
positions.
2. These deficiencies are remediable; if enlisteesare motivated to learn, they can be taught theskills necessary for effective job performance.
3. BSEP is the vehicle that will provide thenecessary remediation.
5
.. ","""-

. .........
Until the Summer of 1981, all new enlisted accessions were
administered the SelectABLE or, if they were non-native speakers
of English, the ECLT. The scores were used to determine BSEP
eligibility, as specified in AR 621-5. The ABLE IA battery was
given to further diagnose soldier deficiencies prior to
instruction. The ABLE IB or IIA batteries were used to measure
proficiency during and at the end of BSEP I training. These
scores were reported to TRADOC on DA Form 1821-2-R, 1 October
1978 and DA Form 1821-2-R, 1 April 1980 for inclusion in a
computer data base for purposes of program evaluation. The
mandatory testing was eliminated in the Summer of 1981 and
installation commanders now have discretionary control over BSEP
I testing and training programs on their installation. BSEP I
eligibility ends when a soldier earns an MOS.
BSEP II is conducted at installations in all major commands;
it is intended for soldiers serving at permanent duty stations in
MOS positions at skill levels 1 and 2. This phase of BSEP
provides instruction in the reading, writing, speaking,
• "listening, and computing skills needed to perform military duties
through grade E5. Soldiers are identified as eligible for BSEP
II in one of the following ways. Soldiers who are identified
during inprocessing at permanent duty stations as having GT
scores of less than 90 should be referred to Army Education
Center (AEC) counselors for possible inclusion in BSEP II. In
actual practice, some installations set the GT lower boundary at
95 or 100. Soldiers who score lower on the SQT than the minimum
6

required for MOS verification are also to be referred as BSEP II
eligibles. Many installations refer soldiers who are preparing
for an upcoming SOT even though they have not taken or failed an
SOT. Recent changes in the SOT procedures may affect this source
of BSEP II candidates. Unit commander referrals is another
source of BSEP II candidates. Such referrals include soldiers
who request and are approved by their commanders for
participation in BSEP II programs, as well as those whose unit
commanders believe are in need of, and will benefit from such
programs. All referrals to AEC counselors are now tested with
the Test of Adult Basic Education (TABE) to determine proper
placement in the program and to measure their general educational
achievement after instruction. (Formerly, the Adult Basic
Learning Examination (ABLE) battery was used for these purposes
except in USAREUR where the TABE was used from the outset.)
I-St
I7
p-. / cI.~ ~ ~ - *~~-' x - * - ~ ~ ~ *

PROCEDURES
Background
The intent of BSEP review activities was to provide a
snapshot view of the overall BSEP as it existed prior to the
planned implementation of revised components. From the
standpoint of program evaluation, the snapshot was to serve two
major purposes. First, it was to provide some initial indices of
what benefits the Army had derived or was deriving from existing
programs, and second, it was to provide baseline indices that
could later be used for comparative evaluations of newly
developed BSEP components.
In the review of procedures that follows, three emphases
should be kept in mind. First, because several experimental
efforts were underway, ESL received more attention than it
otherwise would have. Second, the major command focus was on
TRADOC; there were no site visits to other commands. Finally,
. more effort was devoted to BSEP I program comporents than to BSEP
II. Review of BSEP II components was limited to review of
documentation, BSEP II analyses of archival data, and visits to
four BSEP II programs at TRADOC installations.
Review of General Literacy Programs
The review of existing general literacy programs relied much
more heavily on documentation and upon analyses and re-analyses
of archival data than on direct observations and interviews. The
' ' * *I. * ** .

initial activity involved a review of the general BSEP program as
spelled out in AR 621-45 and updated in Chapter 2 of AR 621-5,
Army Continuing Education System (ACES), 15 October 1981.
Documentation review. The earliest evaluation document
reviewed was An Analysis of the USAREUR Basic Skills Education
Program (BSEP) prepared by Headquarters USAREUR, ODCSOPS, ACES
Division, 22 December 1978. This document concerned the BSEP
being conducted at that time by Big Bend Community College
*' (BBCC). It addressed the issues of the extent to which BSEP
objectives were being achieved by program participants; the
manner in which ACES personnel, BBCC staff members, and USAREUR
commanders were performing their responsibilities; and whether or
not there was a need to revise the implementing instructions for
the program and/or the contract with BBCC. Numerous problems
were identified and recommendations were made for suggested
changes.
Another document concerning evaluation of early phases of
the BSEP was TRADOC Evaluation - Basic Skills Education Program,
Phase I, BSEP I, June 1980. As the title implies, this report
*dealt exclusively with the BSEP I program in the training base.
In an effort to verify the conclusions of this early report, and
to update results of the BSEP I program, the AIR staff ran
analyses of archival data taken from the BSEP I TRADOC data base
derived from data supplied on DA Form 1821-2-R. Comparisons were
made between results from these analyses and those reported
earlier by TRADOC.
9
V1 A' If 4: le *
The earliest documentation of the BSEP II program was an
informal summary prepared by the Evaluation Branch of the
Education Directorate, TAGO, entitled Analysis of Test Results
from the Army's Basic Skills Education Program (BSEP II): FY 1978
to FY 1980. This summary reported the results of analyses of
data supplied to TAGO on DA Form 1821-1-R concerning referral and
participation rates, hours of instruction, pre- and post-test
results on ABLE, gains in grade level attainment, reasons for
termination from the program, changes in GT scores and G.E.D.
scores.
Field observations. There was no systematic attempt to
conduct on-site reviews of BSEP II literacy programs. Those
programs that were observed by AIR staff were located at TRADOC
installations that were being visited for some other project
task. These fortuitous visits did, however, give the staff an
opportunity to review some of the materials used, to see some
classes in action, and to talk with members of the ACES
instructional and administrative staff about the programs.
On-site observations and interviews with staff of literacy
programs were conducted at Ft. Knox, Ft. Gordon, Ft. Jackson,
and Ft. Lee. No attempt was made to collect objective data
during these visits.
to
I* .* s 1' 7:-
. . . . . . . . . . . .

Analyses of Archival Data
Procedures used in building longitudinal data files. The
data on BSEP I and II eligibles and participants were supplied to
AIR in five separate files. The BSEP I data were divided into
two files, one for FY79 and 80 BSEP-eligibles (File IA) and one
for FY81 eligibles (File IB). These data files were separate
because of minor changes in the data coding forms beginning in
FY81. The data from FY79 and FY80 were reported on DA Form
1821-2-R, dated 1 Oct. 1978 and the data for FY81 were reported
on DA Form 1821-2-R, with a revision date of 1 April 1980. The
data on BSEP II eligibles were similarly divided into pre-FY81
(File IIA) and post-FY81 files, (File IIB) although in this case
the differences in format were more profound. Specifically, the
FY81 data included pre and post TABE scores, where the earlier
data included ABLE scores. The ABLE data were reported on DA
Form 1821-1-R, 1 August 1978, while the TABE data were reported
on DA Form 1821-Ia, September 1980. A third BSEP II file,
covering FY82 (File IIC), was received in the Spring of 1983.
This file was identical to the FY81 BSEP II file in content and
format.
To recapitulate, five files were available:
0 IA = FY79 and 80 BSEP I eligibles* 1B = FY81 BSEP I eligiblese IIA = FY79 and 80 BSEP II eligibles* IN1 = FY81 BSEP II eligibles* 1IC = FY82 BSEP II eligibles
IIoo*.~p.****~........ . * t * . *). * . . .
*****.v* t . ~ & * . t t t * w .

The two BSEP I files were combined, making some adjustment
for the minor differences in codes used in the AIT completion and
discharge variables (AITOSUT & DISCHAR). The combined BSEP I
file was later split into separate files, one for ESL eligibles
and the other for Literacy program eligibles. Very different
data were available for these two sets and there was virtually no
overlap between the two. The ESL eligibles had ECLT scores but
no ABLE scores, while the Literacy eligibles had ABLE scores but
no ECLT scores. The three BSEP II files were kept separate
because of the different test scores recorded and because the
FY81 data and FY82 data were processed at different points in
time.
The next step in creating a longitudinal data file was to
create a file of SSNs for whom followup data would be sought.
Some sampling was used to reduce the total number of cases to a
more manageable number. For the BSEP I data files, cases with
missing scores were eliminated. This reduced the number of BSEP
I cases from 15,642 to 13,128. The BSEP IIA file contained
33,948 cases. After eliminating cases with missing scores,
restricting the sample to those using form A of ABLE II in the
*pretest and form B in the posttest, and taking a 25% sample of
the FORSCOM cases, a sample of 10,989 cases remained. For the
BSEP 1I1 file, cases with different levels of the TABE or with
the same form at the same level (pre and post) were eliminated
reducing the total from 8,048 to 6,927. The BSEP IIC was smaller,
containing 4,176 records. Eliminating duplicates produced 4,071
useable cases.
12

%7~wu-~ur 1vwu LIT XU1-iE1T IT X~Wv*6.7W -F d' 11- W w~l W~~wwr lr7 WJvJ
The follow-up samples were combined into a single file and
duplicates were eliminated. Cases in the special 6-month and
3-month DLI ESL courses were also merged in at this time. The
resulting sample of SSNs was sent to the Defense Manpower Data
Center (DMDC) in Monterey, where the SSNs were matched against
the 1981 year-end Enlisted Master File (EMF) and against "Loss"
files for 1976 through 1981. Information for matches to our list
was pulled off into a file that was returned to us. We then
merged the data in this file back into our original data files to
create a longitudinal data file. The match rates varied for the
different files from 60% for the BSEP I file to 86% for the BSEP
*. IIB file.
The DMDC files do not include all of the variables on the
EMF. In particular, SQT scores and Enlisted Evaluation Reports
(EERs) are not available on the DMDC files. In order to obtain
these scores, our list of SSNs was submitted to ARI personnel who
matched against a version of the 1981 fiscal year-end EMF. This
file was a 50% sample of the full file so that only half as many
matches could be expected. The resulting data were merged back
into our initial files.
Problems encountered in processing the data. A number of
problems were encountered in processing the BSEP data files. So
that other users may profit from our experience, we list these
problems and, where applicable, document our approach to them.
These problems fall into four general categories: form changes,
r1

data documentation, missing or erroneous values, and duplicate
records.
Form changes. For both the BSEP I and BSEP II data files,
there were significant changes in the data coding forms beginning
in FY81. This meant that many fields were available for one year
but not another (e.g. MENTCAT was available only for FY79 & 80).
The most profound difference was the use of TABE scores in the
FY81 BSEP II files instead of ABLE scores. This meant that the
files had to be analyzed separately in many cases.
Data documentation. The primary documentation for the BSEP
I files was a copy of the coding sheets used and a set of
instructions that accompanied the earlier form. In general,
these were reasonably adequate. The only real problem was that
for the later form two fields were combined into one (the AIT
*pass/fail field and the discharge status field) and we did not
have full documentation of the codes used for the combined field.
For the BSEP II files, the documentation was somewhat less
complete. The BSEP [IA file (FY79 & 80) had been previously
processed by TRASANA, where grade-equivalent ABLE scores were
added along with a number of other variables that were not
documented. The documentation supplied by DMDC was relatively
complete, as was our documentation on the EMF. A major omission,
however, was some information as to why fields such as the EER
score! were missing in most cases.
14

._W % - -. A - . - 1
*Missing or erroneous values. Each of the files had a
significant number of missing values for key variables and
erroneous values for some other variables. The BSEP I data file,
in particular, appears not to have been edited very thoroughly.
This is inferred from the very low match rate to the DMDC files
(60% where close to 100% should have been obtained) and by the
fact that the SSN field had no check digits to facilitate
verification of the numbers entered.
Duplicate records. Each of the files processed contained
some cases with multiple records for the same SSN. In some
instances, an individual may have actually participated in two
different programs, but in a majority of cases, the records
appeared to be identical in all fields including installation and
date submitted.
One other problem that was perhaps unique to our effort was
* the necessity of translating from ASCII files generated by UNIVAC
computers to the standard EBCDIC format used with IBM equipment.
In general, this was not a problem so long as an external ASCII
translation was used in generating the Univac files. In one
case, however, an internal "field" format was used and these
files proved to be virtually unreadable.
Review of Existing ESL Programs
Schedule of visits. A preliminary visit was made to Ft.
Dix in October 1981. Between December 1981 and March 1982,
2 0

two-person teams of ESL specialists from the American Institutes
for Research (AIR) made two or more visits to Forts Benning, Dix,
*Gordon, Jackson, Knox, Sill, and Leonard Wood. These sites
". include all posts with BSEP I/ESL programs that had more than 100
students during the three-year period covered by the TRADOC data
base (FY 79-81), and still had active BSEP I/ESL programs.
Data collection techniques. Both formal and informal
research techniques were used. The formal instruments were:
o questionnaires on background andattitude given to soldiers andteachers,
* oral proficiency interviews given asa pre-test to all soldiers entering theprogram during the first visit andas a post-test to the same soldiersfive weeks later, and
* a structured observation form to describethe activities in the ESL classes.
In addition, staff collected ECLT scores from the soldiers'
records. Samples of curriculum materials and lesson plans were
also collected at each post to facilitate both the description of
the program and cross-program comparisons. Informal techniques
included:
0 unstructured interviews, both in groupsessions and individually, and
o unstructured observations during whichthe staff took field notes; thesesupplemented the information on theclassroom observation forms.
16

Informal interviews with the soldiers were particularly
important. When the written questionnaires were handed out the
soldiers wer( assured that the information they wrote would be
kept in confidence and not shown to their drill sergeants, but
many of them were still reluctant to put their concerns in
writing. When the staff spoke to them informally in Spanish
after they had completed the questionnaires, they expressed
themselves openly on a range of issues.
Considerations in the data collection. Using several
approaches to obtaining data provided a more comprehensive view
than could have been obtained from any one source alone. It also
allowed for verification of the data. Confidence in the
qualitative data grows as the same information is obtained from
multiple sources.
Several aspects of the approach were particularly useful in
building comprehensive and accurate descriptions. These included
* being open and non-judgmental,
* spending sufficient time on each postto speak to all interested parties andto observe full days of ESL classes,
0 returning to each post five weeks afterthe initial visit,
0 interviewing a wide range of individualsin a range of settings, and
* working in cross-gender and cross-languageteams.
|1 17

qI
FINDINGS
The Program
In the introduction to this report we described BSEP as a
decentralized and heterogeneous program. Within the context of
U.S. Army training programs, this characterization is certainly
accurate; with other frames of reference, it would not be. BSEP
is more centralized and offers a more homogeneous approach than
the U.S. public school system, for example. But the typical
training program in the Army is far more standardized than is
BSEP. In the description of the programs that were observed, we
note the commonalities as well as the variations.
The instructional staff for BSEP is civilian and
predominantly female. Some instructors are employed under
individual non-personal services contracts. The majority are
employed by educational institutions that have institutioanl
contracts with a site or a MACOM. The individual contract is
more common for BSEP I than for BSEP II.
Most programs are offered during on-duty hours. In BSEP I,
programs tend to be full-time, five days per week for six weeks;
exit is possible after three weeks if the 5.0 grade level is
reached in vocabulary, reading, spelling, arithmetic
comprehension, and arithmetic problem solving. In BSEP II, the
programs tend to be on-duty, half-day programs of eight to twelve
weeks duration. In USAREUR, however, the standard program is 20
hours of instruction per week for three weeks.
.18
-. * > . . . - , - - ...-. -.- - ,- ,-..- ' ,- .- .- .- -.. - f. -/ .'...-*. .- - - . .-

The instructional materials used vary widely. Most often,
some combination of commercially available and locally developed
materials are employed; the local instructional staff generally
has considerable discretion in the selection of materials. Where
an institutional contractor is responsible for the program, a
more uniform set of materials is likely to be used by all
teachers. In spite of the considerable diversity in
instructional materials, they all tend to be arranged in some
type of "modular" scheme. A modular arrangement permits the
instructor to make individual assignments in response to the
varying abilities and deficiencies likely to be found in a BSEP
class. Much of the classroom time is spent in individual,
self-paced activity, with the instructor monitoring the
activities and working with individual soldiers in one-on-one
consultations.
The program goals that are emphasized also vary from one
site to another and are reported to vary from one time period to
another at the same installation. The differing emphases may
reflect the wishes of the local commander and/or the educational
goals believed important by an institutional contractor. Raising
GT scores was a goal at most installations, to help soldiers meet
requirements for MOS reclassification and/or reenlistment
eligibility. Some programs emphasized obtaining a high school
diploma or G.E.D. certificate. Improvement of the soldier's job
performance in the short term was seldom offered as an objective.
19

Documentation Review
The earliest systematic review of data was that presented by
TRADOC in its 1980 evaluation report on BSEP I. The results and
conclusions included in the TRADOC report (roughly for the period
October 1978 through November 1979), were compared to those
obtained through AIR analyses of data for FY79-81 on the TRADOC
BSEP I data tape. A summary of these findings is reported below.
Summary. The TRADOC evaluation effort and report included
the collection, analysis, and interpretation of objective data
and of qualitative data collected from TRADOC training
installation commanders involved in conducting BSEP I programs.
The specific evaluative conclusions and statements are included
separately for commanders' comments and statistical evaluations.
The overall conclusions in the TRADOC report, presented below,
were based on some combination of both data sources. The AIR
analyses concerned only statistical data.
1. Less than 10% of BSEP I eligibles are from mentalcategories I and II of the AFQT. The AIR analysesdid not address this issue.
2. SelectABLE is a reasonably valid predictor ofdifficulty with reading/math during initial entrytraining. The TRADOC report contained no objectivedata that would either confirm or refute thisconclusion. The AIR analyses did confirm thatscores on the SelectABLE were positively related tosuccessful completion of AIT, as shown in Table 1below. There is no question that those scoring above18 on SelectABLE are more likely to complete AIT.But there is no direct evidence that AIT attritionis related to difficulty with reading and math.For the 10,605 soldiers who scored below 18, thoseenrolled in BSEP I were less likely to complete
20

AIT than the not-enrolled group. The data arepresented in Table 2.
Table ISelectABLE Scores and AIT Completion
Score N % Completing AIT
0-18 10,605 75.9
19 and above 59,432 88.6
t = 35.57, p <.001
Table 2BSEP I Enrollment and AIT Completion
SelecTABLE Scores Below 18
N % Completing AIT
Enrolled 3,888 73.4
Not Enrolled 6,717 77.3
t = 4.52, p <.001
3. The SelectABLE score of 19 did not identify allthose who may have a need for BSEP I instruction.The statement is true as it stands; no test will
* "identify everyone who may need a particular pro-* gram. But the objective data are not relevant to* the finding; it may be that commanders' comments
are the source of the statement. The objectivefacts are that some soldiers who score below 19complete AIT (with or without BSEP) while some whoscore above 19 fail to complete.
4. Tracking procedures may not have accuratelyidentified the relationship between qrade leveland attrition in initial entry training. Thisstatement is true of the period covered in the
21
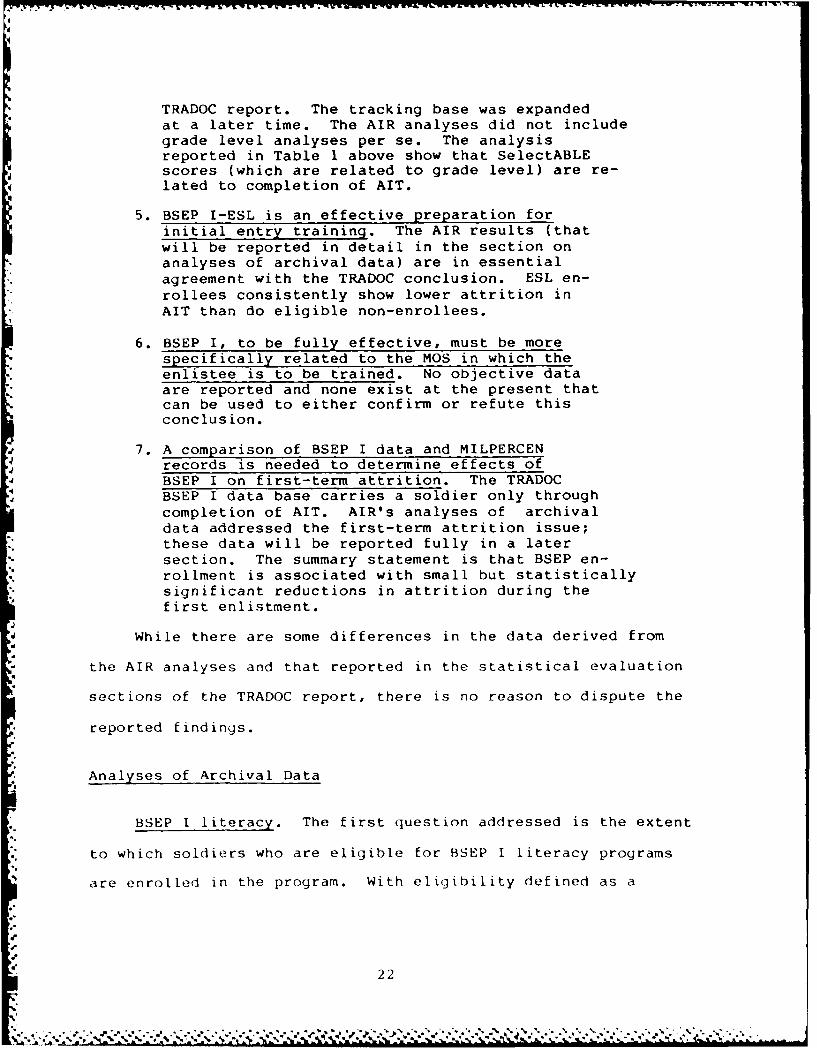
TRADOC report. The tracking base was expandedat a later time. The AIR analyses did not includegrade level analyses per se. The analysisreported in Table 1 above show that SelectABLEscores (which are related to grade level) are re-lated to completion of AIT.
5. BSEP I-ESL is an effective preparation forinitial entry training. The AIR results (thatwill be reported in detail in the section onanalyses of archival data) are in essentialagreement with the TRADOC conclusion. ESL en-rollees consistently show lower attrition inAIT than do eligible non-enrollees.
6. BSEP I, to be fully effective, must be morespecifically related to the MOS in which theenlistee is to be trained. No objective dataare reported and none exist at the present thatcan be used to either confirm or refute thisconclusion.
7. A comparison of BSEP I data and MILPERCENrecords is needed to determine effects of
BSEP I on first-term attrition. The TRADOCBSEP I data base carries a soldier only throughcompletion of AIT. AIR's analyses of archivaldata addressed the first-term attrition issue;these data will be reported fully in a latersection. The summary statement is that BSEP en-rollment is associated with small but statisticallysignificant reductions in attrition during thefirst enlistment.
While there are some differences in the data derived from
the AIR analyses and that reported in the statistical evaluation
sections of the TRADOC report, there is no reason to dispute the
reported findings.
Analyses of Archival Data
BSEP I literacy. The first question addressed is the extent
to which soldiers who are eligible for BSEP I literacy programs
are enrolled in the program. With eligibility defined as a
22

SelectABLE score of 18 or lower, the results are shown in
Table 3.
Table 3
Eligibility and Enrollment in BSEP I (Literacy)
Eligible Enrolled Percent Enrolled
FY 79-80 7,464 2,594 34.8
FY 81 3,141 1,294 41.2
Total 10,605 3,888 36.7
The 10,605 eligibles shown in Table 3 are, of course, the same
soldiers who appeared in Tables 1 and 2 in the preceding section.
We saw there that the 3,888 enrollees had a higher attrition rate
in AIT (26.6%) than did the 6,717 eligible non-enrollees (22.7%).
We also saw that the non-eligibles (those scoring above 18 on
SelectABLE) had about half as much attrition in AIT (11.4%) as
did the eligibles. What are we to make of these findings?
First, if there were doubt as to whether a problem existed
for which BSEP might be a solution, those doubts must be
dispelled. The very high loss rate in AIT for soldiers scoring
below the 19 cut-off on SelectABLE is evidence of a srious
problem that must be addressed in some way. Second, it is not
possible to "evaluate," from archival data, the extent to which
* the existing BSEP alleviated the problem. From the gross
attrition rates, one mijht conclude that the program hurt, rather
than helped, the soldier's chances of completinj A[T
........... . ...-....-... .,,.....-, .... .- . - .. ' .. -,, . ._: : . . . , ._. . .. - - .. . , . . . . , .. .

successfully, but such a conclusion makes no sense at all. It is
difficult to imagine how one might go about designing a remedial
program that would make the student less competent in the skill
areas being remediated; it is inconceivable that the Army
inadvertently designed such a program while attempting to design
one that would improve basic skills. The answer to the puzzle
must be elsewhere.
It must be understood that there is no magic that can be
applied to the archival data bases that will produce a clear-cut
answer; all that we can do is to "think about" the findings and
construct an explanation that, if true, would be consistent with
the evidence. Two such rational constructions seem plausible to
us; some readers may think of others. The first rationale is
that assignment to BSEP is seen by some enrollees as evidence
that the Army views them as incompetent. Since many of these
youth have experienced failure in civilian school settings, being
sent to the Army school house may reinforce the belief that they
also will fail in the Army. And 26.6% of them do fail. A second
construction focuses on the differences between enrolled and
non-enrolled eligibles. Since the latter group comprises well
over half of all eligibles, it is obvious that enrollment is not
an automatic response to a SelectABLE score below 19. If
assignment to BSEP is a non-random process that incorporates the
judgment (of an NCO or a counselor) that a particular soldier
"needs BSEP," then the enrolled group might be significantly
-- lower in true ability than the non-enrolled group. The fact that
24
* . . - ; •"- "% ." " *" "* " <% * ". .5 * "- * ".. -" a-. - " '" - 5 "- * "-".-. -. -. " " -" *55 55 %" -." "--"*" ' :

* . . -j , - -. - *" . "- -. : - " - . t" - , .-. : = ; - - - - -•
nearly 23% of the non-enrolled group fail to complete AIT would
indicate only that the assign/not-assign judgments are less than
perfectly valid. We will have more to say about this line of
reasoning later in this report.
A final question addressed by the archival analyses is the
extent to which the BSEP I literacy programs increased the grade
level scores on ABLE I Tests. The average gains are shown in
Table 4.
Table 4Mean Grade Level Gains as Measured by ABLE I Testsfor Participants in BSEP I, 6-Week Literacy Programs
Arithmetic ArithmeticN Reading Vocabulary Spelling Computation Problems
All
FY 1979 1,399 0.17 0.26 1.11 0.55 0.42
FY 1980 1,883 0.16 0.19 1.53 0.57 0.46
FY 1981 1,062 0.17 0.26 1.60 0.62 0.51
Total 4,344 0.47 0.23 1.44 0.58 0.46
It is clear from these data that modest average gains were
realized in all five areas, with spelling and arithmetic showing
larger improvement than reading and vocabulary. While the gains
are not sufficient to move all enrolled soldiers to the 5.0
level, the Table 4 data reveal a clear treatment effect. The
"expected" gains over a 6-week period for youth enrolled in
public schools are in the range of .06 to .12 grade levels andp.
the BSEP program clearly exceeds this. The gains shown are
averages for all enrollees; some individuals jain more and some
4,
2
-- .-. J.* .

gain less. As one would expect, soldiers who enter with very low
grade level scores show greater gains than those entering at
higher levels; this is shown in Table 5. These data reflect, in
part, the regression artifact;* they are also influenced at the
higher levels by ceiling effects on the ABLE test. But if we
ignore the extremes and focus on those enrollees who are not
affected by either artifact (those entering with grade level
scores of 3 and 4), we see that the gains are quite respectable,
averaging slightly more than 1.1 grade levels across the five
subject matter areas.
Table 5Gains in BSEP I as a Function of Entry Level
Arithmetic ArithmeticEntry Level Reading Vocabulary Spelling Computation Problems
Grade 1 1.14 2.16 1 22 3.89 2.21
Grade 2 1.14 1.45 1.69 2.45 1.46
Grade 3 0.86 1.07 1.97 1.54 1.11
Grade 4 0.55 0.60 1.60 0.99 0.74
Grade 5 -0.01 -0.08 0.37 0.71 0.30
Grade 6 -0.25 -0.22 -0.14 -018 -0.22
BSEP I ESL. As in the case of literacy, our analysis begins
with the extent to which ESL-eligibles are enrolled in ESL
programs. Table 6 presents the results with eligibility defined
as a score below 70 on the ECLT.
*The regression effect refers to the fact that on any test, the
very low scores are likely to be underestimates of the averagetrue score while very high scores overestimate, on the average,the true score. On any re-test, with or without -n interveningtreatment, these groups will earn scores that ir, "regressed"toward the true score, e.g., the lowest group will 3how "gains"whileo the hijhest jroup wiLL how "Iosses," The tD the or jinal
e:?r rOc. rs ,1 easure!ent.
. -.. . S . - /> v

Table 6Eligibility and Enrollment in BSEP I (ESL)
Eligible Enrolled Percent Enrolled
FY 79-80 2,970 1 ,840 62.0
FY 81 1,618 1,014 62.7
Total 4,588 2,854 62.2
The likelihood of being enrolled in an ESL course is greater for
those scoring very low than for those scoring near the cut-off.
Table 7 shows this relationship. As in the case of literacy
programs, enrollment in BSEP-ESL is not automatic. While
eligibility is defined by a score on the ECLT, actual assignment
to the program is based on the score plus someone's judgment that
the soldier "needs ESL." Table 7 shows that this judgment is
made more frequently for low scorers than for those scoring
higher.
Table 7ESL Enrollment and ECLT Scores
N Enrolled Percent Enrolled
ECLT 0-29FY 79-80 912 631 69.2FY 81 495 354 71.5
ECLT 30-49FY 79-80 1,164 771 66.2FY 81 624 414 66.3
ECLT 50-69FY 79-80 831 438 52.7
" FY 81 499 246 493
€2d
S /
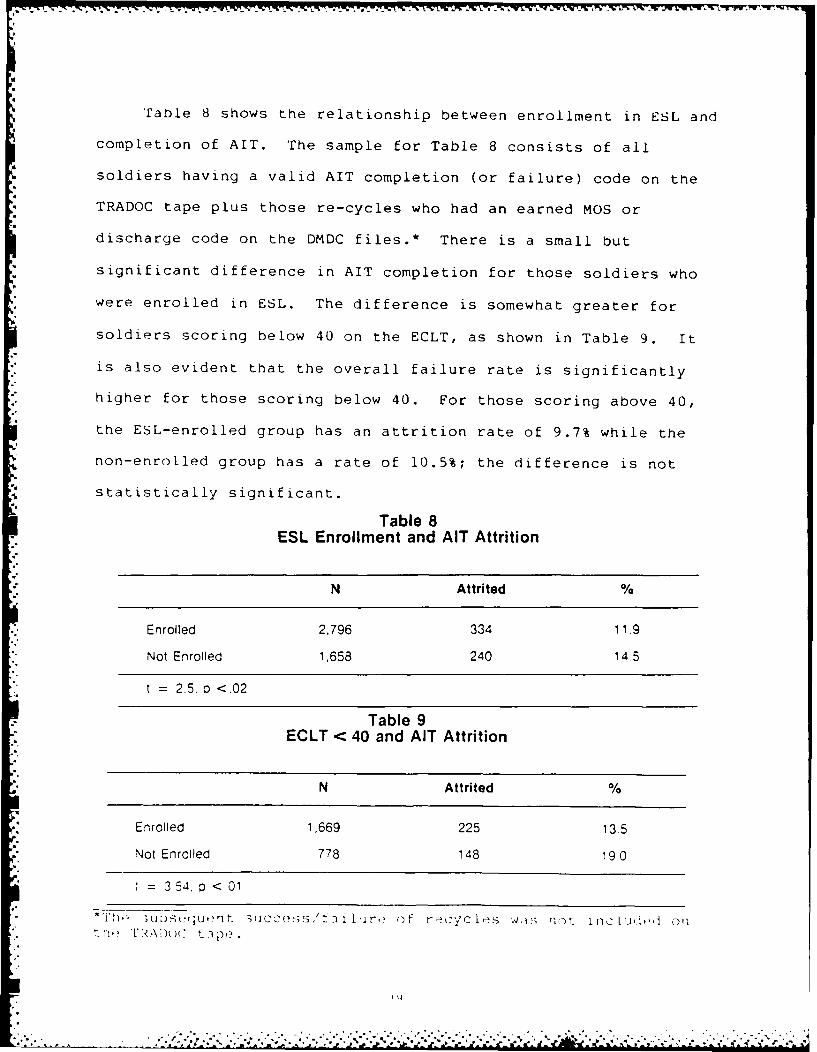
'able 8 shows the relationship between enrollment in ESL and
completion of AIT. The sample for Table 8 consists of all
soldiers having a valid AIT completion (or failure) code on the
TRADOC tape plus those re-cycles who had an earned MOS or
discharge code on the DMDC files.* There is a small but
significant difference in AIT completion for those soldiers who
were enrolled in ESL. The difference is somewhat greater for
soldiers scoring below 40 on the ECLT, as shown in Table 9. It
is also evident that the overall failure rate is significantly
higher for those scoring below 40. For those scoring above 40,
the ESL-enrolled group has an attrition rate of 9.7% while the
non-enrolled group has a rate of 10.5%; the difference is not
statistically significant.
Table 8ESL Enrollment and AIT Attrition
N Attrited %
Enrolled 2,796 334 11.9
Not Enrolled 1,658 240 14.5
t= 25. p <.02
Table 9ECLT < 40 and AIT Attrition
N Attrited %
Enrolled 1,669 225 13.5
Not Enrolled 778 148 19 0
= 3.5,. o < 01
"ji*%+ ;U )s ?(;u, nt 1 3IcC ' s ' S 1I I r, ot r -cyC le s L rb fln [u,,d i
t , , ' '[' .\ )t)( : , ,-
• - " ," " . . ." "- -' . .'... . .. . a ' ' ' . * ' -* -' ',a a". ' '' - - - . . - . - .- , a. . , . -
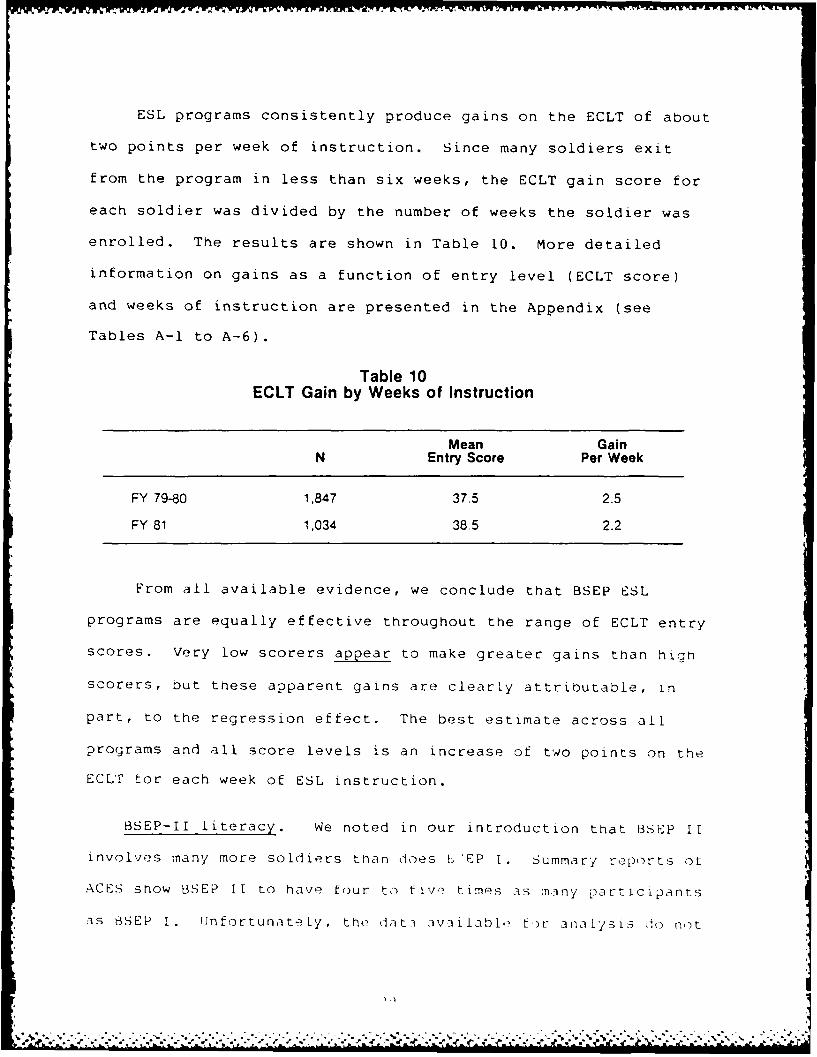
ESL programs consistently produce gains on the ECLT of about
two points per week of instruction. Since many soldiers exit
from the program in less than six weeks, the ECLT gain score for
each soldier was divided by the number of weeks the soldier was
enrolled. The results are shown in Table 10. More detailed
information on gains as a function of entry level (ECLT score)
and weeks of instruction are presented in the Appendix (see
Tables A-1 to A-6).
Table 10ECLT Gain by Weeks of Instruction
Mean GainN Entry Score Per Week
FY 79-80 1,847 37.5 2.5
FY 81 1,034 38.5 2.2
From all available evidence, we conclude that BSEP ESL
programs are equally effective throughout the range of ECLT entry
scores. Very low scorers appear to make greater gains than high
scorers, but these apparent gains are clearly attributable, in
part, to the regression effect. The best estimate across all
programs and all score levels is an increase of two points on the
ECLT for each week of ESL instruction.
BSEP-II literacy. We noted in our introduction that BSEP I
involves many more soldiers than does ! "*P 1. Summary reports of
ACES snow BSEP [I to have four to five times as many participants
ais BSEP I. Uinfortunately, the dat av3ilable t)- analysis do nz)t

reflect this fact; individual participation is grossly under
reported. Summary data for FY81 showed some 73,000 soldiers
participating in BSEP II; individual reports (DA Form 1821,la)
were received on some 8,000 cases. Some MACOMS do not complete
(or do not send) individual reports at all; USAREUR is absent in
*" FY78-80 and seriously underrepresented in other years; Korea is
* adequately represented only in the FY78-80 data set. Overall,
the available data appear to represent no more than a five
percent sample over the FY78 to FY82 time period. The results we
will report must be interpreted very cautiously since there is no
evidence at all concerning the representativeness of the
available sample. Under-reporting has become more serious in
recent years; reports averaged 13,000 per year from FY78 to FY80,
declined to 8,000 in FY81 and to fewer than 5,000 in FY82.
Participation in BSEP II ESL is reported so infrequently (12
cases in FY 82) that we can report no results for the ESL
program.
In terms of participation rates, our very incomplete data
suggest that about 70% of eligibles are actually enrolled; the data
3

are shown in Table II. For this data set, the principal reasons
for referral to BSEP were:
* GT score less than 90 (40%)0 voluntary, self referral (38%)a command (20%)
TABLE 11
Participation Rates in BSEP II Among Reported BSEP II Eligibles
Between FY78 and FY80 FY81 FY82
N Percentage N Percentage N Percentage
Participants 27,860 69.5 5,633 70.2 2,622 62.8
EligibleNonparticipants 12,233 30.5 2,388 29.8 1,554 37.2
TOTAL 40.093 100.00 8.021 100.0 4,176 100.0
Table 12 and 13 show the entry grade levels for tested
variables for all reported BSEP II eligibles. The average entry
grade levels for FY81 and FY82 were almost identical. They
ranged from a low of 6.96 for Language Mechanics-Expression to a
high of 8.37 for Reading Comprehension. These grade levels were
higher than for similar variables in the FY78-80 period which
were based on ABLE rather than TABE grade level norms. For all
years, grade levels for reading skills were higher than for
mathematic skills. Language expression and spelling scores were
the lowest.
Table 14 and 15 show the exit grade levels for tested
variables for all tSEP 1I participants. The averrage exit jrade
l v,?l r -,ll 'Iariahl,?s ,,xc(ed,!d tle tntry grad, l I tar the
sm' v3r . Te dv t- rr lCe n. a.1 .Irllet s t r') n M t h k TI, s

TABLE 12
Percentage of BSEP 11 Eligibles Achieving Selected GradeLevels on the Five ABLE 11 (Form A) Pre-Tests
Between FY78 and FY80
Percentages Within Grade Levels Grade GradeABLE It Below 3.00 4.00 5.00 6.00 7.00 8.00 9.00 Level Level
Pre-Tests 3.00 3.99 4.99 5.99 6.99 7.99 8.99 + Mean S.D. N
* Vocabulary 0.6 2.5 4.7 9.3 8.6 7.8 9.1 57.4 7.9 1.6 34,377
Reading 1.6 2.3 3.0 4.5 5.4 14.7 21.7 46.7 8.0 1.5 36,116
* Spelling - 12.1 25.0 26.1 12.2 9.1 6.2 9.4 5.7 1.7 27.340
Computation 0.5 3.9 11,5 273 31.9 18.5 4.5 2.0 6.1 1.3 35,915
Problem Solving 3.9 5.2 75 19.5 10.0 25.6 6.2 22.1 6.7 1.8 35.662
32

TABLE 13
Percentage of BSEP II Eligibles Achieving Selected GradeLevels on the Six TABE Pre-Tests
Percentages Within Grade Levels Grade Grade
3.00 4.00 5.00 6.00 7.00 8.00 9.00 Level LevelTABE TEST 3.99 4.99 5.99 6.99 7.99 8.99 + Mean S.D. N
Reading VocabularyFY81 1.3 1.9 9.6 13.5 20.6 16.9 36.0 8.30 2.07 7,096FY82 1.2 2.0 8.8 13.3 21.7 18.7 34.3 8.28 2.00 3,823
Reading ComprehensionFY81 1.3 2.0 10.9 7.0 19.2 18.5 41.2 8.37 195 7.113FY82 1.1 1.3 11.2 7.3 20.4 17.9 40.8 8.34 1.89 3,806
Reading TotalFY81 .8 1.5 8.9 12.9 19.0 20.1 36.8 8.27 1.87 7,063FY82 9 1.0 8.6 12.9 20.7 20.3 35.7 8.25 1 80 3,795
Language-Mechanical Exp.FY81 4.2 7.1 22.4 16.9 20.3 14.2 14.9 6.96 1.92 6.772FY82 3.5 6.2 22.0 17.4 20.8 14.5 15.6 7.00 1.90 3,347
Language-SpellingFY81 4.8 7.3 24.5 8.8 16.3 14.2 24.2 7.27 2.31 6.801FY82 4.5 7.5 22.7 8.2 17.0 15.3 24.7 7.34 2.28 3.334
Mathematics-ComoutationFY81 4 2.2 15.6 25.2 28.0 16.0 12.7 725 1.52 7.111FY82 4 1 5 144 248 291 16.9 12.9 730 1 48 3.852
Marnematics-Conceotsand Proolems
FY81 9 2.3 13.9 16.3 29.6 23.4 13.6 751 1 58 7,130FY82 9 1.6 13.6 15.9 29.5 25.1 13.5 756 1 53 3.867
33
o.
• " . . .. . . . ... ... . ... ..-. , - .., -. - -. -, - ,- .-, , -, -.- "* " .. '. ",, ;'- -,- ' , " ., " .. .- .

I.
TABLE 14
Percentage of BSEP II Participants Achieving SelectedGrade Levels on the Five ABLE 11 (Form B) Post-Tests
Between FY78 and FY80
Percentages Within Grade Levels Grade Grade
ABLE II Below 3.00 4.00 5.00 6.00 7.00 8.00 9.00 Level LevelPost-Tests 3.00 3.99 4.99 5.99 6.99 7.99 8.99 + Mean S.D. N
Vocabulary 0.6 0.8 2.5 4.3 11.9 21.5 24.4 34.2 7.9 1.3 13,786
Reading 1.0 1.4 1.9 4.5 10.4 14.2 21.2 45.4 8.0 1.4 14,154
Spelling - 6.2 10.6 14.2 14.2 11.4 8.4 34.9 7.0 1.9 15,265
Computation 0.5 1.7 4.9 7.4 20.2 10.6 11.9 42.8 7.7 1.5 17,307
Problem Solving 0.9 2.5 2.8 8.7 14.1 17.2 17.4 36.4 7.7 1.5 16.477
34

TABLE 15
Percentage of BSEP II Participants Achieving SelectedGrade Levels on the Six TABE Post-Tests
Percentages Within Grade Levels Grade Grade
3.00 4.00 5.00 6.00 7.00 800 9.00 Level LevelTABE TEST 3.99 4.99 5.99 6.99 7.99 8.99 + Mean S.D. N
Reading VocabularyFY81 .6 1.2 5.1 8.1 18.5 16.9 49.7 8.72 1,81 3,561FY82 1.2 2.0 4.9 7.3 20.2 17.8 46.6 8.49 1.67 1.484
Reading ComprehensionFY81 .5 1.4 6.9 7.3 15.1 17.8 51.1 8.77 1.81 3,445FY82 1.0 1.6 6.8 8.2 15.0 19.8 47.6 8.57 1.72 1,396
Reading TotalFY81 .2 .8 5.0 10.6 16.5 18.1 48.7 8.70 1.70 3.340FY82 .7 1.2 6.2 9.3 21.4 19.7 41.5 8.42 1.61 1,307
Language-MechanicalExpression
FY81 1.3 3.6 11.0 13.5 17.8 16.2 36.6 8.08 203 3.754FY82 1.3 2.8 10.6 11.2 17.8 18.0 38.4 8.13 184 1.598
Mathematics-ComputationFY81 0.0 .2 3.4 7.5 13.4 15.8 59.7 9.25 1 86 3.976FY82 .1 .5 3.3 6.1 12.8 14.6 62.6 9.19 1 71 1.709
Mathematics-Conceptsand Problems
FY81 .3 1.3 6.0 7.8 21.3 25.5 37.8 8.49 1 73 3,975FY82 .4 .8 5.9 6.4 20.1 28.9 375 8.49 1 58 1.725
'5
l 35
4o
S.
!

computation, concepts and problem solving, and language
expression all of which had the lowest entry levels. The exit
grade levels for FY81 and FY82 variables were higher than for
similar variables for the FY78-80 period which were based on ABLE
rather than TABE norms.
Table 16 shows that average grade level gains during FY78-80
achieved by BSEP II participants were: .53 for vocabulary
(average BSEP I gain of .26); .53 for reading (.17 for BSEP I);
1.30 for spelling (1.11 for BSEP I); 1.65 for arithmetic
computation (.55 for BSEP I); and 1.21 for arithmetic problem
solving (.42 for BSEP I). In terms of comparable grade level
gains, BSEP II achieved uniformly higher gains than did BSEP I.
Average grade level gains for FY81 and FY82 for participants who
successfully completed BSEP II are shown in Table 17. For both
tests and over all years, gains were greatest for mathematics
computation.
The percent of participants reaching criterion level was
greatest in FY81, about twice that of the FY79-30 period, with a
slight drop off in FY82 accounted for by voluntary withdrawals.
(See Table 18). While the mean exit grade level did not reach
the 9.0 level except for mathematics computation in FY81 and
FY82, in all years between one-third to two-thirds of the
participants achieved the 9.0 level in one or more tested
variables. The percent of soldiers completing the course but not
reach ing criterion level remained about the sme tor the entire
36
* *.* * . - .4. -• " * . . """ ,.:*.--,,, - . ". ", - "- " * ".. - "- " " "" "" ." .- "- ."." .' . . .-. .
°%"-" . "".,. . "

TABLE 16
Average Grade Level Gains Between Pre-Tests and Post-Testsfor the Five ABLE II Tests Among Participants Completing
BSEP II Between FY78 and FY801
ABLE Mean 2 StandardTest Gain Deviation N
Vocabulary 0.53 0.96 9,573
Reading 0.53 1.00 10,118
Spelling 1.30 1.26 9,180
Computation 1.65 1.13 12,219
Problem Solving 1.21 1.32 11,561
These figures are based on those who took different forms of the ABLE before and after BSEPinstruction; in addition, only those coded as "successful graduates" or as having "completedinstruction" under the termination code categories are included in the above figures. Conse-quently, the N's for each test are smaller than the N's reported elsewhereIn computing the average gains, negative gains are treated as zero.
J
I
* 37
- -.. * -- "

TABLE 17
Average Grade Level Gains Between Pre-Test and Post-Test forthe TABE Tests for Successful Graduates of BSEP 11
Mean Gain Standard Deviation N
*TABE Test FY81 FY82 FY81 FY82 FY81 FY82
*Reading Vocabulaty .90 1.05 1.46 1.37 3,386 1,376
*Reading Comprehension .77 .93 1.60 1.61 3,268 1,307
Reading Total- .86 .98 1.23 1.22 3,156 1,223
* Language Mechanical*Expression 1.45 1.51 1.72 1.60 3,536 1,459
-Mathematics-Computation 2.14 2.15 1.58 1.51 3.780 1,568
Mathematics-Concepts 1.11 1.17 1.45 1.37 3,772 1,585
Total Mathematics 1.69 1.70 1.26 1.17 3,663 1,480
38

Va-L--I LI Ir LM V- V-wTOUNU
TABLE 18
Termination Codes Among BSEP II Participants
N Percentage
Termination Code FY78.80 FY81 FY82 FY78-80 FY81 FY82
Successful graduate 3,159 938 469 12.1 25.3 20.9
Voluntary withdrawal 3.033 178 204 11.6 4.8 9.1
Withdrawn by unit(mission related) 3,759 176 69 14.4 4.8 3.1
,, Dismissed for disciplinaryreasons 376 72 10 1.4 1.9 .4
Completed instruction' 11,555 1,451 834 44.4 39.2 37.1
Other 4,163 890 661 16.0 24.0 29.4
TOTAL 26,045 3,705 2,247 100.0 100.0 100.0
The category, "completed instruction," refers to those completing instruction who failed toattain a ninth grade level on each of the five ABLE post-tests (FY78-80) or each of the TABEpost-tests (FY81/FY82).
39
_. . . ..% *~' ',' * ~ ~ ' ~ '
-|**~~* *• • • ° • • . . ." o " - °. • " " """ % - .J °

period. It should be noted that these "non-graduates" had
average gains comparable to those of the graduates. The
non-graduates just started lower. Additional instructional hours
would permit most of these soldiers to reach the 9.0 level.
Tables 19, 20, and 21 present the entry level GT scores of
BSEP II eligibles, the exit level GT scores for BSEP II
participants and the average gain in GT score reported for BSEP
II participants. Average exit GT scores are almost identical for
the entire period. BSEP II programs have consistently shown raw
gains of about 17 points in GT scores. But this gain cannot be
treated as a "program effect" for two important reasons.
The first reason is the regression artifact noted in an
earlier section of this report. Since the BSEP II population
includes many soldiers who scored very low on the ASVAB when they
entered the service, one would expect some "gains" upon retest,
even with no intervening treatment. That raw gains are related
to the entry level GT is shown clearly in Table 22, where the raw
gain scores for soldiers entering with GT scores at or below 80
average almost 30 points. A better estimate of gain is based on
the subset of BSEP II participants who scored within one-half
standard deviation of the mean on initial testing (GT from 90 to
110). For the 789 soldiers within this range, the average gain
was 13.1 GT points. For the subset of 133 soldiers scoring
between the mean and +.5 standard deviations, the mean gain was
10.8 GT points. It is entirely justified to claim that a real
40

TABLE 19
Original GT Scores of BSEP II Eligibles
FY78-FY80 FY81 FY82
Cumulative Cumulative CumulativeGT Score N Percentage Percentage N Percentage Percentage N Percentage Percentage
Below 70 758 2.0 2.0 80 1.2 1.2 53 1.5 1.5
70-74 1.280 3.3 5.3 194 2.9 4.1 146 4.2 5.775-79 1,668 4.3 9.6 240 3.6 7.7 277 8.0 13.780-84 6,898 17.8 27.3 990 14.8 22.5 608 17.4 31.1
, 85-89 7,420 19.1 46.5 1,164 17.5 40.0 702 20.2 51.390-94 6,937 17.9 64.4 1,331 20.0 60.0 599 17.2 68.595-99 5,942 15.3 79.7 1,229 18.4 78.4 518 14.8 83.3
100-104 2,748 7.1 86.8 565 8.5 86.9 225 6.5 89.8105-109 2,616 6.7 93.5 484 7.3 94.1 214 6.2 96.0
- 110-114 1,263 3.3 96.8 191 2.9 97.0 73 2.0 98.0115-119 645 1.7 98.5 126 1.9 98.9 41 1.2 99.2
120+ 598 1.5 100.0 76 1.1 100.0 27 8 1000
TOTAL 38,773 6,670 3.483
Mean 91.61 92.58 90.18
Median 90.04 92.51 84.68
StandardDeviation 11.40 10.80 10.77
41
" ; .- , :,a ' *.. - .. ,'. .. . ,, . " " "* " " * "- " -""" . " •.. .

TABLE 20
GT Retest Scores for BSEP II Participants
FY78-FY80 FY81 FY82
Cumulative Cumulative CumulativeGT Score N Percentage Percentage N Percentage Percentage N Percentage Percentage
Below 70 61 0.9 0.9 14 .9 .9 3 .5 .570-74 75 1.1 2.0 18 1.1 20 4 .6 1.175-79 48 0.7 2.7 22 1.4 3.4 7 1.0 2.180-84 319 4.7 7.3 50 3.1 6.5 15 2.3 4.4
85-89 309 4.5 11.8 70 4.3 10.8 26 4.0 8490-94 638 9.3 21.1 138 8.6 19.4 57 8.7 17.195-99 1,018 14.8 36.0 225 14.0 33.4 80 12.2 29.3
100-104 718 10.5 46.5 178 11.0 44.4 104 15.8 45.1105-109 1,108 16.2 62.6 250 15.5 59.9 121 18.5 63.6110-114 814 11.9 74.5 210 13.1 73.0 94 14.3 77.9115-119 686 10.0 84.5 222 13.8 86.8 80 12.2 90.1
120+ 1.064 15.5 100.0 213 13.2 100.0 65 9.9 100.0
TOTAL 6,858 1.610 656
Mean 105.52 105.65 105.70
Median 106.34 106.80 106.32
StandardDeviation 13.91 13.34 12.11
42
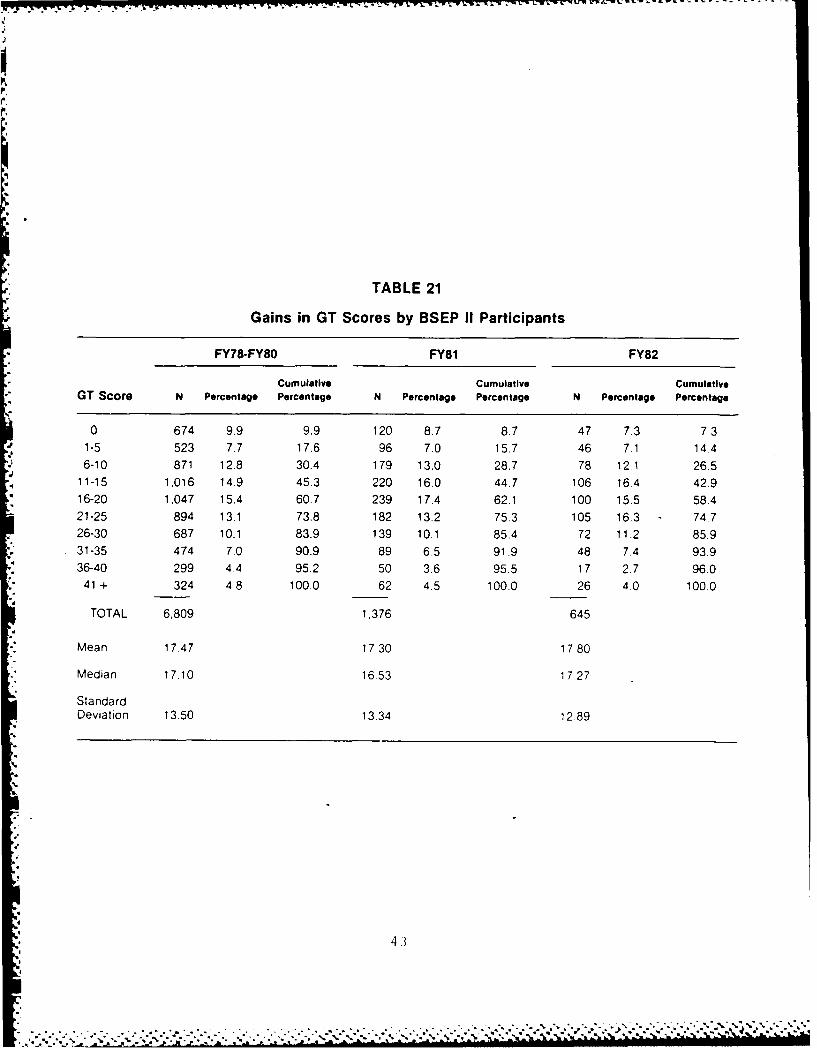
TABLE 21
Gains in GT Scores by BSEP 11 Participants
FY78-FY80 FY81 FY82
Cumulative Cumulative Cumulative*GT Score N Percentage Percentage N Percentage Percentage N Percentage Percentage
0 674 9.9 9.9 120 8.7 8.7 47 7.3 7 31-5 523 7.7 17.6 96 7.0 15.7 46 7.1 14.4
*6-10 871 12.8 30.4 179 13.0 28.7 78 12.1 26.511-15 1.016 14.9 45.3 220 16.0 44.7 106 16.4 42916-20 1,047 15.4 60.7 239 17.4 62.1 100 15.5 58.4
21-25 894 13.1 73.8 182 13.2 75.3 105 16.3 - 74.726-30 687 10.1 83.9 139 10.1 85.4 72 11.2 85.931-35 474 7.0 90.9 89 6.5 91.9 48 7.4 93.936-40 299 4.4 95.2 50 3.6 95.5 17 2.7 96.0
*41 + 324 4.8 100.0 62 4.5 100.0 26 4.0 100.0
TOTAL 6,809 1,376 645
*Mean 1747 17.30 1780
-Median 17.10 16.53 17T27
StandardDeviation 13.50 13.34 12.89
* 43
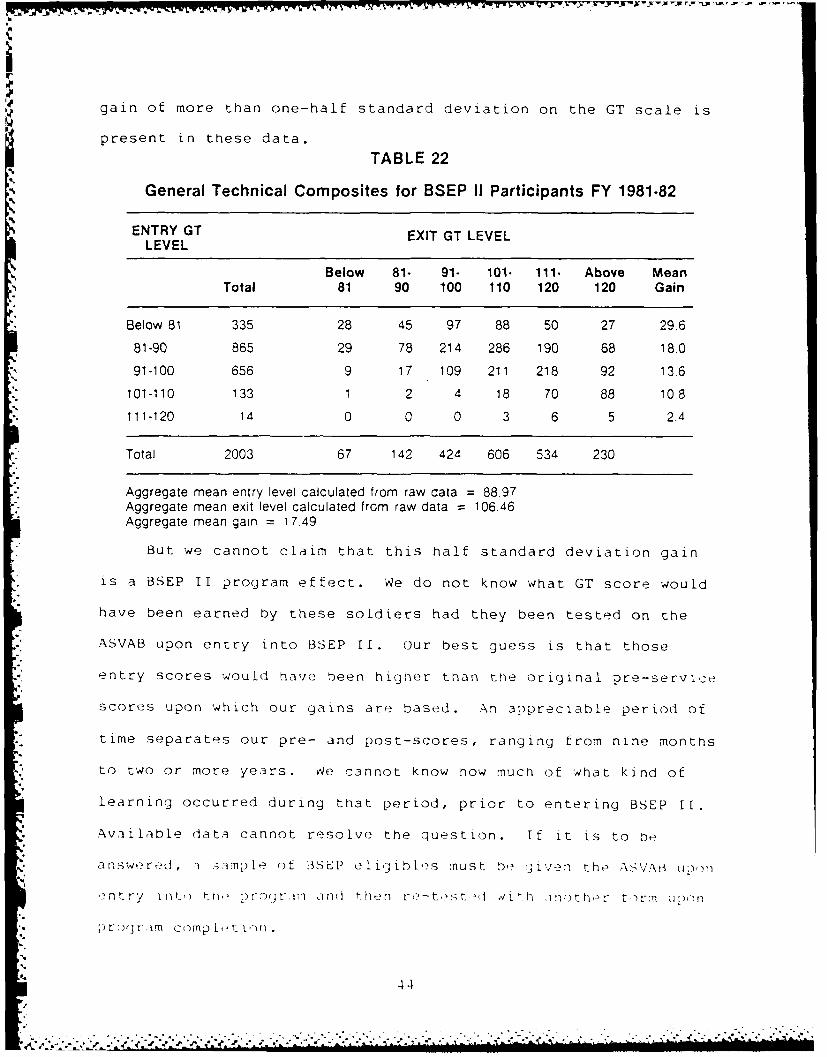
gain of more than one-half standard deviation on the GT scale is
present in these data.
TABLE 22
General Technical Composites for BSEP II Participants FY 1981-82
ENTRY GT EXIT GT LEVELLEVEL
Below 81- 91- 101- 111. Above MeanTotal 81 90 100 110 120 120 Gain
Below 81 335 28 45 97 88 50 27 29.6
81-90 865 29 78 214 286 190 68 18.0
91-100 656 9 17 109 211 218 92 13.6
101-110 133 1 2 4 18 70 88 10.8
111-120 14 0 0 0 3 6 5 2.4
Total 2003 67 142 424 606 534 230
Aggregate mean entry level calculated from raw data = 88.97Aggregate mean exit level calculated from raw data 106.46Aggregate mean gain = 17.49
But -we cannot claim that this half standard deviation gain
, is a BSEP II program effect. We do not know what GT score would
have been earned by these soldiers had they been tested on the
ASVAB upon entry into BSEP Il. Our best guess is that those
°, entry scores would have oeen higher than the original ore-service
scores upon which our gains are based. An appreciable period of
. time separates our pre- and post-scores, ranging from nine months
to two or more years. vie cannot know now much of what kind of
learning occurred during that period, prior to entering BSEP I[.
Available data cannot resolve the question. If it is to be
answe red , .i j)lpe , of 3 5EP el igi b les must D, gi ven the AS\/A tiu p)n
,,ntr! int tn., :)ro gU im an(i then ro-t,st }il with in-thor L, ):n u:,)n
• . ;)r:gr comp ]i t n- .
. -. '.,,: ,,.-.-" ,, ,/ ? ' -n'- .. .. . .. . .. . .. .. . .. . .. . .. . .. .. . .. . .. . .. . .. .. . .. . .. . ...ll mmm mm m

THE STATUS OF BSEP: A SUMMARY AND SOME SUGGESTIONS
It is abundantly clear from the analyses that we have
reported that the existing, capturable data base does not permit
an "evaluation" of the overall BSEP program in any rigorous sense
of the term. Some of the factors that constrain our ability to
provide definitive answers to sensible questions can be remedied,
in part, by the better data bases currently being developed under
other ARI-sponsored projects. Other constraints could be
overcome by mounting relatively small-scale, one-shot efforts.
But some constraints--most notably, the absence of adequate
comparison groups--can probably not be overcome in the Army
environment. Before offering some comments and suggestions
concerning the constraints, we will briefly summarize what we
have leaned in the course of our review.
First, the problem for which BSEP is the intended solution
is real. However trite that may appear, it is a fact to which
attention must be paid. There are, and will continue to be,
substantial numbers of soldiers with serious deficiencies in such
basic skills as reading, listening, and computing. While the
presumed causal arrow cannot be verified by existing data, there
is no question that this skill-deficient subset contributes
disproportionately to attrition rates during the first
enlistment.
4 5

Second, despite the great diversity in BSEP I programs, the
immediate objectives of the programs are attained. As measured
by standardized tests such as ABLE and TABE, basic skills are
improved during the six week literacy training program. In BSEP
I ESL, gains on the ECLT are found consistently. In both the ESL
and literacy programs, many soldiers fail to reach the specified
level on the criterion test, but they do improve. The
improvements appear to be orderly--especially in ESL--so that
given a fixed program length one can estimate the entry level
required to reach the specified exit level.
Third, the same case can be made for BSEP II: gains on ABLE
or TABE are always found on the post-test. The case is a little
weaker than for BSEP I because the time between pre- and
post-test is more variable in BSEP II. This variability
increases the possibility that some of the observed gain may be
attributable to learning that occurred outside of the BSEP
program. Nonetheless, we feel secure in attributing at least a
portion of the observed gains in grade level to the program.
In regard to the gains on GT that are associated with BSEP
II, the data cannot support their attribution to the program. We
simply cannot know, given the many unknowns of the lengthy and
variable period that separates the two administrations of the
ASVAB. The BSEP II program occupies but a tiny portion of that
period, and much GT-relevant learning may have occurred outside
the program.
46

We can say almost nothing conclusively about BSEP effects on
longer term performance. The only defensible analysis of such
effects is one that involves a comparison of BSEP particinants
with a comparison group of eligible non-participants. We have
come to believe that all such comparisons that can be made with
the existing data are fundamentally flawed. Our belief rests on
the simple assertion that non coms and junior officers make valid
judgments about the men they train and supervise. When a platoon
sergeant decides that Soldier A "needs BSEP" while Soldier B does
not, his judgment is based on a large number of observations of
job performance. Soldiers A and B may both have SelectABLE
scores of 18, but Soldier B is learning his job while Soldier A
is having all sorts of problems. There may be differences in
motivation and commitment to the Army between the two. Whatever
*the differences are, a comparison group composed of soldiers like
-B will generally out perform the "treatment" group of the A's who
need BSEP. The "eligible non-participant" group is not an
adequate group for comparisons with BSEP participants.
Finally, the existing data base, in spite of its weaknesses,
does provide a benchmark against which the new BSEP programs can
* be measured. We know that the old BSEP I ESL produced ECLT
gains of between 1.7 and 2.0 points per week of instruction. We
know that the old BSEP II literacy program produced gains of
* about 1.1 grade levels after six weeks of instruction.
47
iA

There are several things that can be done to make better
data available. Among the one-shot mini-studies that might be
mounted, we would recommend the following:
* Re-administering the ASVAB to a small sampleof BSEP II applicants (or referrals) at thestart of the program, using an alternativeform for the post-test. If we could vary thetime between initial ASVAB and pre-test ASVAB(say at nine, twelve, eighteen months) wecould get an estimate of the effect on GT ofsimply being in the Army. A total sample oftwo to three hundred soldiers would suffice.
• An alternative would be to select sampleswith regard to BSEP such as random, convenience,or soldiers with nine, twelve, eighteen monthsof service, and admininster two forms of theASVAB six weeks apart.
e A modified random assignment procedure for BSEP.We recognize all of the arguments againstrandom assignment in the real world; but thereis a modification that might be acceptable: anysoldier assigned to the non-treatment group couldbe re-assigned to the treatment group if itbecame evident to the trainees that he or she wasnot going to complete the training programsuccessfully. If this could be done at oneinstallation over a six-month period, the gain inour understanding of BSEP would be increasedenormously.
a Test (TABE) and interview a small sample (N 50)of "eligible non-participants" upon completionof AIT or OSUT.
48
'- *
REFERENCES
Holland, V.M., Rosenbaum, H., & Stoddart, S. BSEP I/ESLprograms, Volume one: Findings. Washington, D.C.:American Institutes for Research, July 1982.
Holland, V.M., Rosenbaum, H., & Stoddart, S. BSEP I/ESLprograms, Volume two: Program descriptions. Washington,D.C.: American Institutes for Research, July 1982.
Krug, R.E., & Wise, L.L., Analyses of BSEP I and II datafiles. Research Memorandum 82-1, Washington, D.C.:American Institutes for Research, July 1982.
4
i4
ia
........................... v & *~~~-

APPENDIX
a5

TABLE A-1
Percent Achieving Each ECL Levelby Initial ECL Level
(FY 79 and 80)
InitialECL ECL Level Achieved
Level N < 40 40-49 50-59 60-69 70.79 80+
< 30 634 63 16 11 6 3 1
30-39 461 37 27 22 9 4 140-49 313 12 15 27 29 16 150-59 213 4 5 19 37 31 460-69 226 2 2 3 19 60 15
Overall 34 16 16 16 16 3
(N) (1847) (619) (289) (298) (290) (291) (60)
".
J53

TABLE A-2
Percent Achieving Each ECL Levelby Initial ECL Level
(FY 81 Cohort)
Intil ECL Level Achieved
Level N < 40 40-49 50.59 60-69 70.79 80+
< 30 354 65 14 12 4 3 230-39 262 37 23 23 10 6 240-49 152 7 22 37 26 7 150-59 136 5 6 23 32 29 560-69 130 5 2 3 12 51 28
Overall 35 15 19 13 14 5
(N) (1034) (351) (155) (192) (139) (141) (56)
54

-~T WIM - 3--
.1,
TABLE A.3
Distribution of Length of ESL Training*by Initial ECL Level
(FY 79 and 80)
Initial Length of ESL TrainingECL < 2 2 3 4 5 6 7+
Level N wk wks wks wks wks wks wks
< 30 634 0 1 9 12 18 60 130-39 461 0 0 10 16 19 53 140-49 313 0 2 17 14 19 48 150-59 213 0 2 29 22 13 34 060-69 226 2 4 35 22 13 24 0
Overall 0 2 16 16 17 49 1
(N) (1847) (6) (28) (292) (291) (319) (899) (12)
Figures shown are the percentage completing the indicated number of full weeks.
.35
.1*
,P
4,
iP
. . . -,.-, .*~ .- *.- ..-..- . -.:_.-.*.V,.. -* : '. ; ,' .., .., ".',''.. .4C_, .', ''t.,: '''.,'' ,,,'; ' ..','..- ' .. , . , 4 ,

TABLE A-4
Distribution of Length of ESL Training*by Initial ECL Level
(FY 81 Cohort)
Initial Length of ESL TrainingECL <2 2 3 4 5 6 7+
Level N wk wks wks wks wks wks wks
< 30 354 0 0 5 9 13 61 1130-39 262 0 1 6 10 12 60 1140-49 152 0 1 5 17 11 52 1450-59 136 1 3 15 14 8 45 1360-69 130 2 4 17 25 6 41 6
Overall 1 1 8 13 11 56 11
(N) (1034) (6) (12) (85) (136) (114) (565) (116)
Figures shown are the percentage completing the indicated number of full weeks.
J
.
I
56
. . .,, . .. • . . .. . .. . . . . ._ . ,,...,.'. ' ... ,., -,' .:, .,.,,'. ,.','2. ., .,

TABLE A-5
Percent Achieving Each ECL Levelby Number of Weeks of Instruction
(FY 79 and 80)
FullWeeks ofFinal ECI Level
Training N -4 40 40-49 50-59 60.69 70.79 80+
1 6 17 0 0 0 67 172 28 25 0 0 21 46 73 292 17 7 8 21 39 84 291 27 17 15 20 17 35 319 39 16 19 14 8 36 899 39 19 18 13 9 17 12 33 0 42 17 8 0
*Overall 34 16 16 16 16 3
(N) (1847) (619) (289) (298) (290) (291) (60)
57
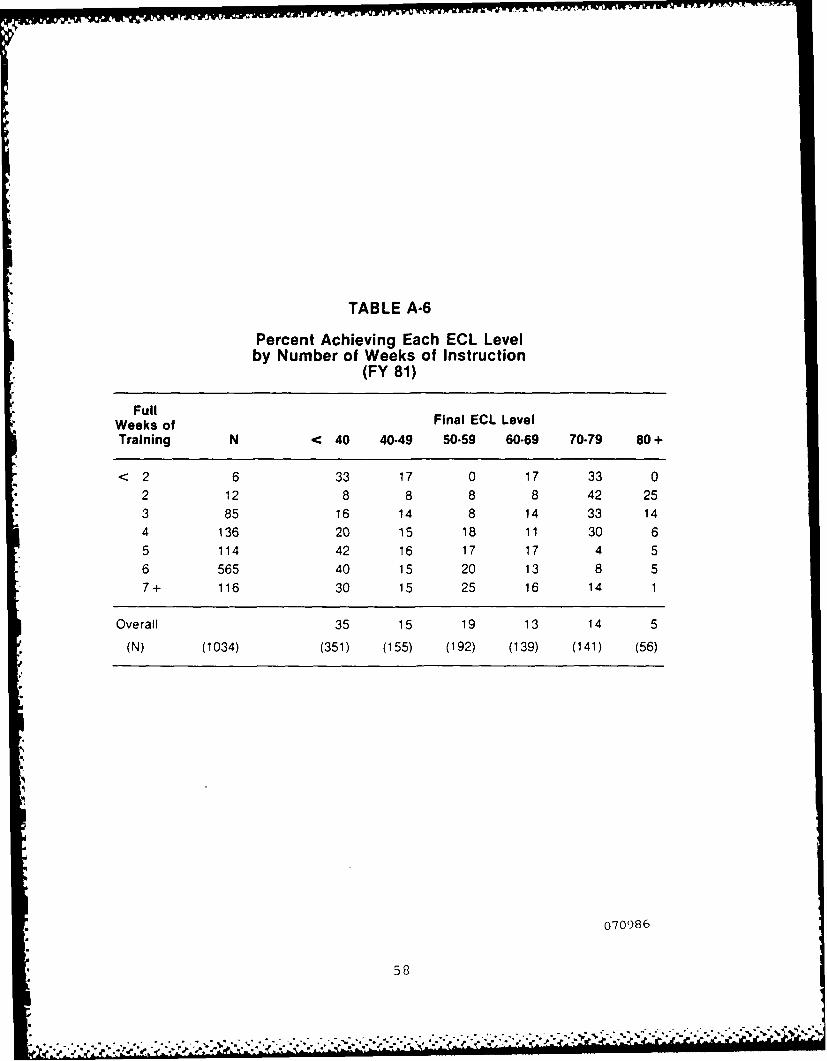
TABLE A-6
Percent Achieving Each ECL Levelby Number of Weeks of Instruction
(FY 81)
FullWeeks of Final ECL LevelTraining N < 40 40-49 50-59 60-69 70-79 80+
< 2 6 33 17 0 17 33 02 12 8 8 8 8 42 25
3 85 16 14 8 14 33 14
4 136 20 15 18 11 30 6
5 114 42 16 17 17 4 5
6 565 40 15 20 13 8 57+ 116 30 15 25 16 14 1
Overall 35 15 19 13 14 5
(N) (1034) (351) (155) (192) (139) (141) (56)
070986
, 58
I . . . . .. ... . -- . - . - - . -'-:" .- - "'' - ' ; .- -- . :