to reach your goal you must take the first step. there is only one boss. the customer! and he can...
TRANSCRIPT

To reach your goalTo reach your goalyou must take the first stepyou must take the first step
There is only one boss.There is only one boss.
The The CUSTOMER!CUSTOMER!
And he can fire anyone in the And he can fire anyone in the company from the chairman oncompany from the chairman ondown, simply by spending hisdown, simply by spending hismoney somewhere else.money somewhere else.
SAM WALTONSAM WALTON
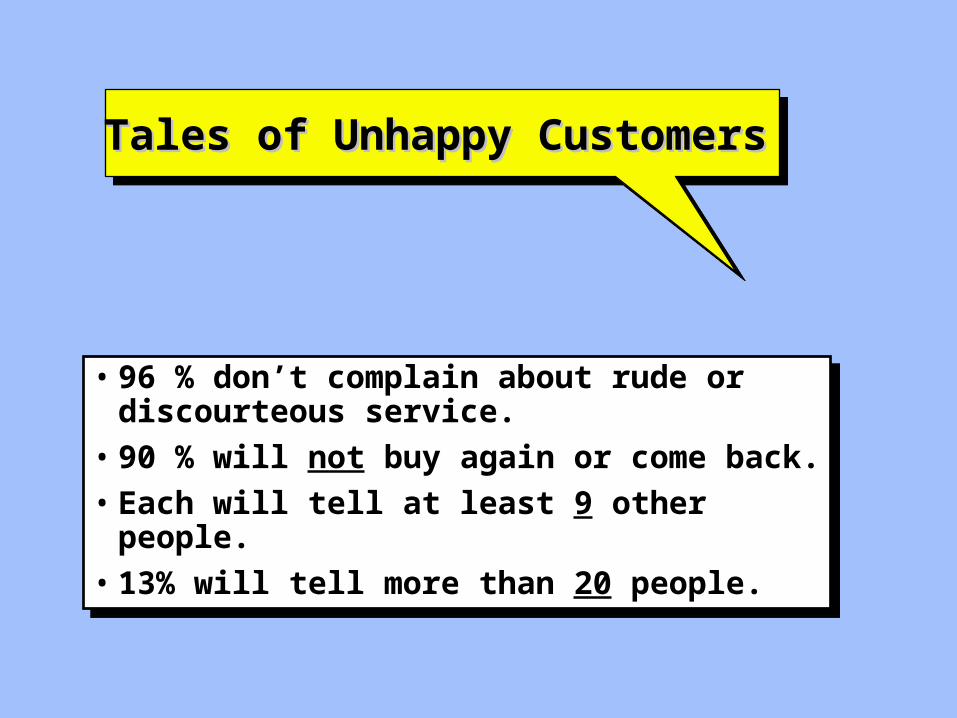
• 96 % don’t complain about rude or discourteous service.
• 90 % will not buy again or come back.
• Each will tell at least 9 other people.
• 13% will tell more than 20 people.
• 96 % don’t complain about rude or discourteous service.
• 90 % will not buy again or come back.
• Each will tell at least 9 other people.
• 13% will tell more than 20 people.
Tales of Unhappy CustomersTales of Unhappy Customers

Product Life CycleProduct Life CycleProduct Life CycleProduct Life Cycle
AnnualAnnualSalesSales
AnnualAnnualProfitsProfits
ProductProductPlanningPlanning
IntroductionIntroductionGrowthGrowth
MaturityMaturityDeclineDecline

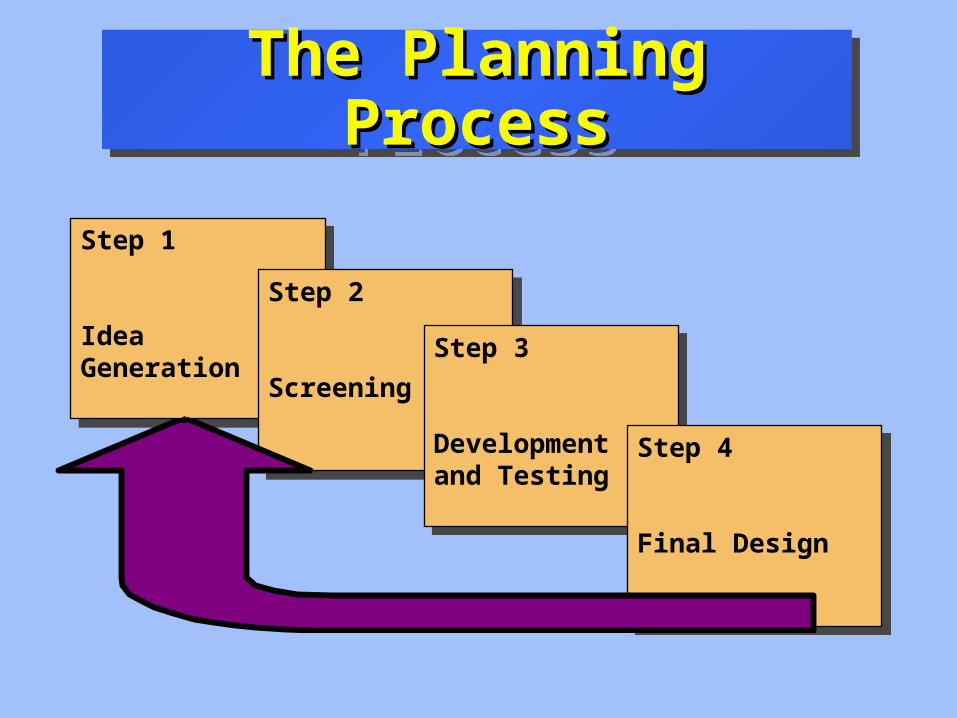
Step 1
IdeaGeneration
Step 1
IdeaGeneration
The Planning ProcessThe Planning ProcessThe Planning ProcessThe Planning Process
20 -25 new ideas for 20 -25 new ideas for every new productevery new product
20 -25 new ideas for 20 -25 new ideas for every new productevery new product

Step 1
IdeaGeneration
Step 1
IdeaGeneration
The Planning ProcessThe Planning ProcessThe Planning ProcessThe Planning Process
Step 2
Screening
Step 2
ScreeningDiscard most ideasDiscard most ideasduring screeningduring screening
Discard most ideasDiscard most ideasduring screeningduring screening

Threshold is 800 - reject alternativeThreshold is 800 - reject alternative
Preference MatrixPreference Matrix
Performance Criterion Weight Score Weighted Score
Market potential 30 8 240
Unit profit margin 20 10 200
Operations compatibility 20 6 120
Competitive advantage 15 10 150
Investment required 10 2 20
Project risk 5 4 20
750

Step 1
IdeaGeneration
Step 1
IdeaGeneration
The Planning ProcessThe Planning ProcessThe Planning ProcessThe Planning Process
Step 2
Screening
Step 2
ScreeningDiscard most ideasDiscard most ideasduring screeningduring screening
Discard most ideasDiscard most ideasduring screeningduring screening

Step 1
IdeaGeneration
Step 1
IdeaGeneration
The Planning ProcessThe Planning ProcessThe Planning ProcessThe Planning Process
Step 2
Screening
Step 2
ScreeningStep 3
Developmentand Testing
Step 3
Developmentand Testing
Design prototypesDesign prototypesConduct Market testsConduct Market tests
Design prototypesDesign prototypesConduct Market testsConduct Market tests

Step 1
IdeaGeneration
Step 1
IdeaGeneration
The Planning ProcessThe Planning ProcessThe Planning ProcessThe Planning Process
Step 2
Screening
Step 2
ScreeningStep 3
Developmentand Testing
Step 3
Developmentand Testing
Step 4
Final Design
Step 4
Final Design
Pilot production,Pilot production,Promotion startsPromotion starts
Pilot production,Pilot production,Promotion startsPromotion starts
Step 1
IdeaGeneration
Step 1
IdeaGeneration
The Planning ProcessThe Planning ProcessThe Planning ProcessThe Planning Process
Step 2
Screening
Step 2
ScreeningStep 3
Developmentand Testing
Step 3
Developmentand Testing
Step 4
Final Design
Step 4
Final Design

BREAK EVEN ANALYSISBREAK EVEN ANALYSISBREAK EVEN ANALYSISBREAK EVEN ANALYSIS
Total Revenue = Total CostTotal Revenue = Total Cost
P P = = FF + c+ c QQ
( P - c )( P - c )
QQ = = FF
QQ( P - c )( P - c )
= = FF
bebe
.. ..

Total annualrevenues
Total annualcost
Fixed Cost
Dollars400
300
200
100
25% 50% 75% 100%
Loss
Profit
Break-evenquantity
% of capacity

Total annualrevenues
Total annualcost
Fixed Cost
Dollars400
300
200
100
Break-evenquantity
% capacity
25% 50% 75% 100%

Total Cost
of B
Dollars
20000
15000
10000
5000
5000 10000 15000 20000
Break-evenquantity
units = Qunits = Q
Total CostTotal Costof Aof A
$70000 + $10 x = $50000 + $12 x
$20000 = 2 x $10000 = x = Breakeven

Product QualityProduct Quality
Reliability: Probability that a component (or several components working together) will function properly for a given period of time.

ReliabilityReliability
Reliability of System = Combined Reliabilities of all components
or mathematically, R = R x R x R 1 2 3s
R = .9 x .8 x .99 = .713 = 71.3%s
.9 .8 .99

ReliabilityReliability
R = .9 + .9 (1 - .9) x .8 + .8 (1 - .8) x .99 = .94 = 94 %s
.9 .8 .99
If the system reliability is too low, we can improve it by building in redundancy in some or all of the components.
.9 .8

Product/Process MatrixProduct/Process MatrixProduct/Process MatrixProduct/Process Matrix
ProcessProcessFocusFocus
IntermediateIntermediateStrategyStrategy
ProductProductFocusFocus
Volume/StandardizationVolume/Standardization
ProcessProcessChoiceChoice
HIGHHIGHLOWLOW

Product/Process MatrixProduct/Process MatrixProduct/Process MatrixProduct/Process Matrix
ProcessProcessFocusFocus
Volume/StandardizationVolume/Standardization
ProcessProcessChoiceChoice
HIGHHIGHLOWLOW
More customizationMore customizationMore resource flexibilityMore resource flexibilitymore labor intensivemore labor intensiveless vertical integrationless vertical integration
More customizationMore customizationMore resource flexibilityMore resource flexibilitymore labor intensivemore labor intensiveless vertical integrationless vertical integration

Product/Process MatrixProduct/Process MatrixProduct/Process MatrixProduct/Process Matrix
ProductProductFocusFocus
Volume/StandardizationVolume/Standardization
ProcessProcessChoiceChoice
HIGHHIGHLOWLOW
More standardizationMore standardizationmore capital intensivemore capital intensivemore vertical integrationmore vertical integration
More standardizationMore standardizationmore capital intensivemore capital intensivemore vertical integrationmore vertical integration