to our shareholders · journey and developed an integrated plan to enhance our performance, which...
TRANSCRIPT

To Our Shareholders:
As I write this letter, I have just passed my one year anniversary at the Vitamin Shoppe. My first yearwas both challenging and exciting. It was also a year of significant accomplishments as we worked to pivot thecompany to be more relevant to our customers’ evolving health and wellness needs. Some of the actions takenwere structural, and we had to make some tough calls to streamline our business. We also strengthened the seniormanagement team and added new capabilities. We institutionalized a continuous focus on productivityimprovements and opportunities for margin enhancement, of which we are already realizing some of the benefits.
During 2015 our vision for the Vitamin Shoppe’s future began to take form, and I am very pleased with therapid progress we made with our reinvention strategy. We focused on our customer experience and shoppers’journey and developed an integrated plan to enhance our performance, which we call Project Evolve. We gainedclarity on the Vitamin Shoppe’s core customers and what drives their health and wellness goals. We focused onboth short term growth drivers and the continued build out of capabilities to develop new initiatives positioning theVitamin Shoppe for long term growth.
The vitamins, minerals and supplements (VMS) industry continued to face headwinds in 2015, includinglack of product innovation, an increase in negative media and increased scrutiny from government and regulatorybodies. As a result, industry growth slowed from historical trends, and the Vitamin Shoppe’s sales were at the lowend of our expectations. Importantly, our financial position remained strong, which enabled us to continue to investin new stores and other growth initiatives, as well as, repurchase $146 million worth of our common shares.
2015 OverviewOur 2015 results were mixed. We reported a totalsales increase of 4.4%. Total comparable sales wereflat, which was weaker than we originallyanticipated, primarily due to product mix changes assports nutrition, our largest category, experiencedslower growth. The lower overall sales performancewas partially offset by improving product marginsand cost savings. We also incurred certain costs tostreamline and position the company for futuregrowth, resulting in net income down year over year.
During fiscal 2015, we invested approximately $39million to open 50 new stores and further enhancedour e commerce business, which also included ITinvestments at our distribution centers. At year endwe operated 758 stores in 45 states, the District ofColumbia, Puerto Rico and Canada.
We recognize that our strategic investments overthe past few years have been significant. While weare focused on growing sales and improving margins,
we are also focused on identifying efficiencies tohelp fund growth initiatives. We have realigned theassortment in the Super Supplements stores toimprove supply chain efficiencies and undertookother cost savings initiatives across the organizationand have initially identified $10 million in costsavings to be realized over the next three years.
As we finalized our reinvention strategy and theassociated capital investments, we recognized anopportunity to further use our balance sheet andreturn capital to shareholders. To do so, we issued$144 million of 2.25% five year Convertible SeniorNotes and used the proceeds to repurchase slightlyover $100 million worth of our common stock. TheBoard also authorized another $100 million sharerepurchase resulting in an aggregate total of $300million share repurchase authorizations in an 18month period. At year end 2015, there was $96million remaining under the buyback authorizations.

2016: The Evolution ContinuesThe Vitamin Shoppe today is not the same as adecade ago and will be different three years fromnow. Ten years ago we were a private companygrowing at an exceptional rate. Today we are anational retailer with close to 800 stores across theUnited States. We grew and prospered because ofour knowledgeable health enthusiasts and broadproduct selection carried in the stores. The broadproduct selection represented an attractive andmany times the only option for customers lookingfor VMS products. Our customer research revealedthat the retail landscape and today’s shoppers’journey have changed, and we need to evolve inorder to thrive in this new environment.
Reinventing the customer experience is necessaryand challenging. At the same time, we are excitedabout our plans to accomplish this. Every survey wehave conducted indicates that the Vitamin Shoppecontinues to resonate with our customers, and wehave an opportunity to increase our share of walletwith our target customers as well as win newshoppers. Though we are undertaking a substantiallevel of change over the next few years, I amconfident in our leadership team and their ability tosuccessfully execute our plan.
We will enhance the customer experience anddifferentiate ourselves from the competition. Weplan to introduce new products, categories andservices that will build deeper relationships with ourtarget customers. Our digital experience, including anew mobile app, will be a key component of ourstrategy. Our initiatives reflect the long termpotential we see for the Vitamin Shoppe.
In broad terms, we plan to focus on three key areas:
Customer Experience (omni channel)- More personalization- More engagement- Improved loyalty program
Invest in Health Enthusiasts- More training and tools- Improved incentives- Greater focus on customer
acquisition and relationshipsProduct Assortment/Solutions
- Increased private brand offerings- Curate existing assortment- Additional growth categories
While we are focused on driving top line growth, wealso plan to continue to be more efficient in our coststructure. Working with an outside cost consultant,we plan to implement initiatives to drive furtherimprovements in gross margins and reductions inselling, general and administrative expenses.
Our leadership team focused on four key return oninvested capital goals as we developed our longterm strategy: increasing revenue growth, enhancingmargins, improving the cost structure, and allocatingcapital wisely, all while putting in place the driversfor long term earnings growth. You can expect to seecontinued capital allocation tactics to ensure thecapital we deploy delivers strong returns. We willalso test some new store concepts and undertakeother initiatives that could offer the potential forhigher returns. We are committed to returningexcess capital to our shareholders.
The final and most important area of distinction forus is our people and our culture. We have highlyengaged employees as revealed in our firstengagement survey and we are a great place towork. I am very proud that we were recently namedto the top 100 of Forbes “Best Midsize Companies toWork For” list.
I would like to thank you, our shareholders, for yoursupport and belief in both our company and ourvision. I would also like to thank our Board whosecounsel continues to shape our strategy and supportthe initiatives we are pursuing. And, a veryappreciative thank you to our Health Enthusiasts forproviding an Inspiring Experience and NourishingSolutions for our customers, enabling them to ThriveEvery Day.
Sincerely,
Colin WattsChief Executive Officer & Chief Health EnthusiastApril 12, 2016

Forward Looking Statements
Statements in the Letter to Shareholders that are not historical facts are "forward looking statements" for thepurposes of the safe harbor provided by Section 21E of the Securities Exchange Act of 1934, as amended andSection 27A of the Securities Act of 1933, as amended. We caution readers that such "forward lookingstatements", including without limitation, those relating to the Company's future business prospects, newproducts, revenue, new stores, wherever they occur are necessarily estimates reflecting the judgment of theCompany's senior management and involve a number of risks and uncertainties that could cause the Company'sactual results to differ materially from those suggested by the "forward looking statements.”You can identify thesestatements by forward looking words such as "may", "will", and "intend"and similar words. Such "forward lookingstatements" should, therefore, be considered in light of the factors set forth throughout the Annual Report onForm 10 K, including Item 1A, "Risk Factors" and Item 7, "Management's Discussion and Analysis of FinancialCondition and Results of Operations.” Except as required by law, we disclaim any intent or obligation to update"forward looking statements" to reflect changed assumptions, the occurrence of unanticipated events, or changesto future operating results over time.


UNITED STATESSECURITIES AND EXCHANGE COMMISSION
Washington, DC 20549
FORM 10-KÈ ANNUAL REPORT PURSUANT TO SECTION 13 OR 15(d) OF THE
SECURITIES EXCHANGE ACT OF 1934For the fiscal year ended December 26, 2015
or
‘ TRANSITION REPORT PURSUANT TO SECTION 13 OR 15(d) OF THESECURITIES EXCHANGE ACT OF 1934
for the transition period from to .Commission file number: 001-34507
VITAMIN SHOPPE, INC.(Exact name of registrant as specified in its charter)
Delaware 11-3664322(State or Other Jurisdiction ofIncorporation or Organization)
(IRS EmployerIdentification No.)
300 Harmon Meadow Blvd.Secaucus, New Jersey 07094
(Addresses of Principal Executive Offices, including Zip Code)
(201) 868-5959(Registrant’s Telephone Number, Including Area Code)
2101 91st StreetNorth Bergen, New Jersey 07047
(Former Name, Former Address and Former Fiscal Year, if changed since last report)
Securities registered pursuant to Section 12(b) of the Act:Title of Class Name of the exchange on which registered
Common Stock, $0.01 par value per share New York Stock ExchangeSecurities registered pursuant to Section 12(g) of the Act: None
Indicate by check mark if the registrant is a well-known seasoned issuer, as defined in Rule 405 of the SecuritiesAct. È Yes ‘ NoIndicate by check mark if the registrant is not required to file reports pursuant to Section 13 or Section 15(d) of theAct. ‘ Yes È NoIndicate by check mark whether the registrant (1) has filed all reports required to be filed by Section 13 or 15(d) of the SecuritiesExchange Act of 1934 during the preceding 12 months (or for such shorter period that the registrant was required to file suchreports), and (2) has been subject to such filing requirements for the past 90 days. È Yes ‘ NoIndicate by check mark whether the registrant has submitted electronically and posted on its corporate Web site, if any, everyInteractive Data File required to be submitted and posted pursuant to Rule 405 of Regulation S-T (§232.405 of this chapter) duringthe preceding 12 months (or for such shorter period that the registrant was required to submit and post such files). È Yes ‘ NoIndicate by check mark if disclosure of delinquent filers pursuant to Item 405 of Regulation S-K (§229.405 of this chapter) is notcontained herein, and will not be contained, to the best of registrant’s knowledge, in definitive proxy or information statementsincorporated by reference in Part III of this Form 10-K or any amendment to this Form 10-K. ‘
Indicate by check mark whether the registrant is a large accelerated filer, an accelerated filer, a non-accelerated filer, or a smallerreporting company. See the definitions of “large accelerated filer,” “accelerated filer” and “smaller reporting company” in Rule12b-2 of the Exchange Act. (Check one):
Large accelerated filer È Accelerated filer ‘
Non-accelerated filer ‘ (Do not check if a smaller reporting company) Smaller reporting company ‘
Indicate by check mark whether the registrant is a shell company (as defined in Rule 12b-2 of the Exchange Act). ‘ Yes È NoThe aggregate market value of the registrant’s voting and non-voting common stock held by non-affiliates of the registrant wasapproximately $1,135,564,171 as of June 27, 2015, the last business day of the registrant’s most recently completed second fiscalquarter, based on the closing price of the common stock on the New York Stock Exchange.As of January 23, 2016, Vitamin Shoppe, Inc. had 25,787,461 shares of common stock outstanding.
DOCUMENTS INCORPORATED BY REFERENCEThe information required by Part III of this report, to the extent not set forth herein, is incorporated by reference from theRegistrant’s definitive Proxy Statement to be filed for the 2016 Annual Meeting of the Stockholders.

TABLE OF CONTENTS
Page
PART I
Item 1. Business 4Item 1A. Risk Factors 16Item 1B. Unresolved Staff Comments 30Item 2. Properties 31Item 3. Legal Proceedings 31Item 4. Mine Safety Disclosures 31
PART II
Item 5. Market for Registrant’s Common Equity, Related Stockholder Matters and Issuer Purchasesof Equity Securities 32
Item 6. Selected Financial Data 34Item 7. Management’s Discussion and Analysis of Financial Condition and Results of Operations 36Item 7A. Quantitative and Qualitative Disclosures About Market Risk 51Item 8. Financial Statements and Supplementary Data 52Item 9. Changes in and Disagreements with Accountants on Accounting and Financial Disclosure 52Item 9A. Controls and Procedures 52Item 9B. Other Information 52
PART III
Item 10. Directors, Executive Officers and Corporate Governance 53Item 11. Executive Compensation 53Item 12. Security Ownership of Certain Beneficial Owners and Management and Related Stockholder
Matters 53Item 13. Certain Relationships and Related Transactions, and Director Independence 53Item 14. Principal Accounting Fees and Services 53
PART IV
Item 15. Exhibits, Financial Statement Schedules 54
EX 3.2EX 10.13EX 10.29EX 10.35EX 10.53EX 21.1EX 23.1EX 31.1EX 31.2EX 32.1EX 32.2
EX-101 INSTANCE DOCUMENTEX-101 SCHEMA DOCUMENTEX-101 CALCULATION LINKBASE DOCUMENTEX-101 DEFINITION LINKBASE DOCUMENTEX-101 LABELS LINKBASE DOCUMENTEX-101 PRESENTATION LINKBASE DOCUMENT
2

Forward-Looking Statements
This Annual Report on Form 10-K contains “forward-looking” statements within the meaning of Section 27A ofthe Securities Act of 1933 and Section 21E of the Securities Exchange Act of 1934, including, without limitation,statements regarding future financial results and performance, future business prospects, revenue, stores, ourability to implement strategic initiatives and meet market expectations, share repurchases, product offerings,contract manufacturing, supply chain network utilization, intellectual property, confidential information,integration of acquisitions, working capital, liquidity, capital expenditures, capital needs and interest costs,industry based factors, including the level of competition in the vitamin, mineral and supplement industry,continued demand from the primary markets Vitamin Shoppe, Inc. (the “Company” or “we”) serves, consumerperception of our products, the availability of raw materials, as well as economic conditions generally and factorsmore specific to the Company such as compliance with manufacturing, healthcare, environmental and otherregulations, changes in accounting standards, certifications and practices and restrictions imposed by theCompany’s revolving credit facility, including financial covenants and limitations on the Company’s ability toincur additional indebtedness and the Company’s future capital requirements, and other risks, uncertainties andfactors set forth under Item 1A., entitled “Risk Factors” in this Annual Report on Form 10-K. You can identifythese forward-looking statements by the use of words such as “outlook”, “believes”, “expects”, “potential”,“continues”, “may”, “will”, “should”, “seeks”, “predicts”, “intends”, “plans”, “estimates”, “anticipates”, “target”,“could” or the negative version of these words or other comparable words. These statements are subject tovarious risks and uncertainties, many of which are outside our control, including, among others, product liabilityclaims and recalls, the availability of insurance, the strength of the economy, changes in the overall level ofconsumer spending, the performance of the Company’s products within the prevailing retail environment,implementation of omni-channel retailing, trade restrictions, international operations, availability of suitablestore locations at appropriate terms, new credit card technology, e-commerce relationships, disruptions ofmanufacturing, warehouse or distribution facilities or information systems, and other specific factors discussedherein and in other SEC filings by us (including our reports on Forms 10-K and 10-Q filed with the SEC).
We believe that all forward-looking statements are based on reasonable assumptions when made; however, wecaution that it is impossible to predict actual results or outcomes or the effects of risks, uncertainties or otherfactors on anticipated results or outcomes with certainty and that, accordingly, one should not place unduereliance on these statements. Forward-looking statements speak only as of the date when made and we undertakeno obligation to update these statements in light of subsequent events or developments. Actual results may differmaterially from anticipated results or outcomes discussed in any forward-looking statement.
Electronic Access to Company Reports
Our investor website can be accessed at www.vitaminshoppe.com under “Investor Relations”. Our AnnualReports on Form 10-K, Quarterly Reports on Form 10-Q, Current Reports on Form 8-K and amendments to thosereports filed with or furnished to the Securities and Exchange Commission (the “SEC”) pursuant to Section 13(a)or Section 15(d) of the Securities Exchange Act of 1934, as amended, are available free of charge on our investorwebsite under the caption “SEC Filings” promptly after we electronically file those materials with, or furnishthose materials to, the SEC. No information contained on any of our websites is intended to be included as partof, or incorporated by reference into, this Annual Report on Form 10-K. Information relating to corporategovernance at our Company, including our Corporate Governance Guidelines, our Standards of BusinessConduct for all directors, officers, and employees, and information concerning our directors, Committees of theBoard, including Committee charters, and transactions in Company securities by directors and executive officers,is available at our investor website under the captions “Corporate Governance” and “SEC Filings”. Paper copiesof these filings and corporate governance documents are available to stockholders free of charge by writtenrequest to Investor Relations, Vitamin Shoppe, Inc., 300 Harmon Meadow Blvd., Secaucus, New Jersey 07094.Documents filed with the SEC are also available on the SEC’s website at www.sec.gov.
3

PART I
Unless the context requires otherwise, references in this Annual Report on Form 10-K to “VSI”, the “Company”,“we”, “us” and “our” collectively refer to Vitamin Shoppe, Inc., its wholly owned subsidiary, Vitamin ShoppeIndustries Inc. (“VS Industries”) and the wholly owned subsidiaries of VS Industries. References to “Fiscal” or“Fiscal Year” mean the fifty-two weeks ended December 26, 2015, December 27, 2014 and December 28, 2013for Fiscal Year 2015, Fiscal Year 2014 and Fiscal Year 2013, respectively, and references to “Fiscal” and“Fiscal Year” for other years are similarly based on a fifty-two week or fifty-three week fiscal year, asapplicable.
Item 1. Business
Overview of our Company
We are a multi-channel specialty retailer and contract manufacturer of vitamins, minerals, herbs, specialtysupplements, sports nutrition and other health and wellness products. We market approximately 800 nationallyrecognized brands as well as our own brands, which include Vitamin Shoppe®, BodyTech®, True Athlete®,Mytrition®, plnt®, ProBioCare™, Next Step®, Nutri-Force® Sport and Betancourt Nutrition™. We believe weoffer one of the largest varieties of products among vitamin, mineral and supplement (“VMS”) retailers withapproximately 7,400 stock keeping units (“SKUs”) offered in our typical store and approximately 12,000additional SKUs available through our e-commerce and other direct sales channels. Our broad product offeringenables us to provide our customers with a depth of selection of products that may not be readily available atother specialty retailers or mass merchants, such as discount stores, supermarkets, drugstores and wholesaleclubs. We believe our product offering and emphasis on product knowledge and customer service helps us meetthe needs of our target customer and serves as a foundation for enhancing customer loyalty.
We sell our products through three operating segments: retail, direct and manufacturing. In our retail segment,which includes Vitamin Shoppe, Super Supplements and Vitapath retail store formats, we have leveraged ourstore economic model by opening a total of 163 new stores and acquiring 31 stores from the beginning of FiscalYear 2013 through Fiscal Year 2015. As of December 26, 2015, we operated 758 stores in 45 states, the Districtof Columbia, Puerto Rico and Ontario, Canada, primarily located in retail centers and stand alone locations. Inour direct segment, we sell our products directly to consumers through the internet, primarily atwww.vitaminshoppe.com. Our e-commerce sites and our catalog complement our in-store experience byextending our retail product offerings and enable us to access customers outside our retail markets and those whoprefer to shop online. Our manufacturing segment provides custom manufacturing and private labeling of VMSproducts, and develops and markets our own branded products for both sales to third parties and for the VSIproduct assortment.
During the second quarter of Fiscal 2015, the Company began development of a strategic plan focused onupgrading our customers’ experience across our retail and e-commerce channels, the “reinvention strategy”. TheCompany has worked with outside consultants to analyze qualitative and quantitative information relevant to ourcustomers’ experience. The reinvention strategy is focused on upgrading the customer experience to inspire ourtarget customers with changes to our product assortment, opportunities to increase private brands penetration,enhancements to the in-store and digital experience, store layout, as well as changes to improve the effectivenessof our loyalty program. The Company expects to incur approximately $10.0 million to $15.0 million of selling,general and administrative costs during Fiscal 2016 in connection with the reinvention strategy, and expects torealize improved financial results from the reinvention strategy beginning in Fiscal 2017.
In an on-going effort to identify efficiencies and stream-line processes, the Company has performed a review ofcertain business operations. As part of this review, the Company is implementing changes to the productassortment and supply chain operations of Super Supplements to more closely align Super Supplements withcurrent processes and assortments in the Vitamin Shoppe retail stores. As a result, costs of $1.8 million wereincurred during the fourth quarter of Fiscal 2015 and $1.8 million are expected to be incurred during the first
4

quarter of Fiscal 2016. Annual cost savings resulting from these actions are estimated to be $1 million to $2million. In addition, the Company has evaluated its Canadian operations in order to determine whether tocontinue investments in the Canadian market and has decided to cease operations at the end of the first quarter ofFiscal 2016. As a result, costs of $0.9 million were incurred during the fourth quarter of Fiscal 2015 and $3.7million are expected to be incurred during the first quarter of Fiscal 2016. The annual cost savings related toceasing operations in Canada are estimated to be approximately $1.0 million. Costs for these two initiativesinclude lease liabilities, markdown charges on inventory and employee severance. The Company plans onengaging a consultant in Fiscal 2016 to further identify other efficiencies and cost reduction opportunities.
On December 9, 2015, the Company closed its offering of $143.8 million of its 2.25% Convertible Senior Notesdue 2020 (the “Convertible Notes”). The Convertible Notes are senior unsecured obligations of the Company.Interest is payable on the Notes on June 1 and December 1 of each year, commencing on June 1, 2016 until theirmaturity date of December 1, 2020. In connection with the issuance of the Convertible Notes, the Companyentered into convertible note hedge transactions for which it paid an aggregate $26.4 million. In addition, theCompany sold warrants for which it received aggregate proceeds of $13.0 million. The net proceeds from theConvertible Notes of $125.7 million, net of commissions and offering costs of $4.6 million, are being used torepurchase shares of our common stock under the Company’s share repurchase programs. For additionalinformation, refer to Note 8., “Credit Arrangements” and Note 11., “Share Repurchase Programs” to ourconsolidated financial statements included in this Annual Report on Form 10-K.
Segment Information
We operate through three business segments: retail, which includes Vitamin Shoppe, Super Supplements andVitapath retail store formats, direct, which consists of our e-commerce and catalog formats, and manufacturing,which consists of the Nutri-Force manufacturing operations. For additional information, refer to Note 15,“Segment and Product Data” to our consolidated financial statements included in this Annual Report on Form10-K.
Retail. Through our retail store formats, we believe we differentiate ourselves in the VMS industry, which hasbeen successful across geographic and demographic markets. What makes us unique is our broad selection ofVMS products and our stores are staffed with trained and knowledgeable employees, who we refer to as HealthEnthusiasts®, and who are able to inform our customers about product features and assist in product selection.
We continue to pursue new store growth. Since the beginning of Fiscal 2013 through Fiscal 2015, we haveopened 163 new stores and acquired 31 stores, expanding our presence in our existing markets as well as enteringnew markets. In addition, our new stores since the beginning of Fiscal 2013 are approximately 2,900 square feetcompared to the average of our total store portfolio of approximately 3,500 square feet.
Direct. We sell our products directly to consumers through the internet, primarily at www.vitaminshoppe.com.Our e-commerce sites and our catalog complement our in-store experience by extending our retail productofferings with approximately 12,000 additional SKUs that are not available in our stores and enable us to accesscustomers outside our retail markets and those who prefer to shop online.
Manufacturing. Through Nutri-Force, we provide custom manufacturing and private labeling of VMS productsand develop and market our own branded products for both sales to third parties and for the VSI productassortment.
Industry
The VMS industry is large, approximately $38 billion according to the Nutrition Business Journal (“NBJ”), webelieve is fragmented, and continued growth is expected as health and wellness trends continue. According to theNBJ, the VMS industry is expected to register a CAGR of 6.2% from 2015 to 2020, driven by growth within thesports nutrition, specialty supplements and meal replacement categories and from the e-commerce channel.
5

Increased focus on healthy diet and nutrition, along with growing fitness and wellness program participation,serves as a positive trend for the nutritional supplements industry. Retailers of VMS products primarily includespecialty retailers and mass merchants, such as discount stores, supermarkets, drugstores and wholesale clubs.The specialty retailers typically cater to the more sophisticated VMS customer by focusing on selection andcustomer service, while the mass merchants generally offer a limited assortment comprised of more mainstreamproducts with less customer service. NBJ anticipates that the specialty retail channel, of which the VitaminShoppe is a leading player, will remain the major market driver for supplements through 2020, and the specialtyretail channel is expected to add over $6 billion in new annual sales by that time. Additionally, NBJ forecasts theinternet channel to achieve 9.9% compound annual growth from 2015 to 2020.
Although long-term prospects noted above suggest continued growth, recent trends have created volatility in thenear term and we expect continued volatility. Recent industry trends have been mixed, driven in part by theprospects of more federal and state involvement in the industry. A lack of clarity on regulation appears to bedissuading manufacturers from investing in and developing new ingredients/products. We believe the lack ofsuch guidance has kept the new product pipeline relatively dry. Additionally, negative publicity about thenutritional supplement industry has increased over the past two years and adds further uncertainty to thefundamental outlook. With product innovation remaining slower than in past years, and negative headlines/mediaat heightened levels, VMS industry headwinds appear poised to persist over the near term.
Industry and market data contained or incorporated by reference in this Form 10-K were obtained throughcompany research, surveys and studies conducted by third parties and industry and general publications or basedon our experience in the industry. We have not independently verified market and industry data from third-partysources.
Competitive Strengths
We believe there is an opportunity to capitalize on the VMS industry dynamics, and we plan to further developthe following competitive strengths as part of the foundation of our reinvention strategy:
Value-Added Customer Service. We believe we offer a high degree of customer service. We place a strongemphasis on employee training and customer service, and view our Health Enthusiasts as a source for health andwellness information while assisting our customers with their product selections.
Product Selection, Including a Strong Assortment of Private-Label Brands. We believe we have a broadmerchandise assortment. We complement our assortment with our private-label brands merchandise whichaccounted for approximately 20% of our net sales in Fiscal 2015.
Highly Refined Real Estate Strategy. We apply demanding criteria to our retail site selection. We locate ourstores primarily in attractive stand-alone locations or endcap (corner) positions in retail centers. We believe thatthe location and visibility of our real estate is an important component of our customer acquisition strategies.
Attractive Customer Base. We have a large base of customers who proactively manage their health and wellnessthrough the use of vitamins and supplements. In Fiscal 2015, 88% of our net sales (excluding Super Supplementsand Nutri-Force net sales) were attributable to our Healthy Awards customers. Our no-fee Healthy AwardsProgram promotes brand loyalty among our customers and allows our customers to earn points redeemable forfuture purchases, approximately 69% of which were redeemed in Fiscal 2015. We also utilize our HealthyAwards Program database to track customer purchasing patterns across our retail and direct business segments,analyze market and industry trends and create targeted merchandising and marketing strategies. In Fiscal 2016,we announced enhancements to this program, including the issuance of certificates on a quarterly basis.
Multi-Channel Retailer. We are a multi-channel retailer, distributing products through our retail stores and oure-commerce sites, enabling us to access customers outside our retail markets and those who prefer to shop online.This business model affords us multiple touch points of interaction with our customers, which allows us to gather
6

data and communicate with them in person, through our call center and via the internet. In addition, we plan onimproving our customers’ ability to shop across both our retail and direct channels by continuing to implementimproved order management systems during Fiscal 2016 and Fiscal 2017.
Experienced Management Team with Proven Track Record. We have assembled a management team across abroad range of disciplines with extensive experience in building leading national specialty retailers.
Business Strategy
We intend to pursue the following key strategies in order to execute our reinvention strategy:
• Upgrading our Customers’ Shopping Experience – To upgrade our customers’ shopping experience byexecuting our reinvention strategy, focusing on enhancing our in-store and digital experience and our storelayout, changes to our product assortment and increasing the penetration of private brands;
• Store and Comparable Sales Growth – To increase sales and profitability of our existing store base as wellas continue opening new stores in the future. As part of our reinvention strategy, we are further evaluatingchanges to our store format in order to enhance our customers’ shopping experience;
• Increase Emphasis on our Digital Experience – To increase sales of our e-commerce business bycontinuing to enhance the features and functionality of our e-commerce sites and providing our customerswith a more personalized shopping experience. We plan to continue to enhance our e-commerce platformattributes for customer tracking and marketing ability, which will allow us, among other things, to bettermarket to our customers;
• Continuous Health Enthusiast Education and Training – To improve and strengthen Health Enthusiasttraining in order to deliver a better customer experience. We hold an annual product education conference,attended by our retail store and district managers, and many of our vendors. In addition, we continue toimprove and expand our online learning website, Vitamin Shoppe University®, which provides theopportunity for our Health Enthusiasts to expand their knowledge and stay current on new products anddevelopments in our industry; and
• Vertical integration – The acquisition of the manufacturing operations of Nutri-Force allows us to bettercontrol the production and timing of new product introductions, control costs and enhance profitability. Weintend to focus on increasing our third party business and continue to transition a portion of the VSI privatebrands assortment to Nutri-Force in order to leverage capacity.
Store Counts and Locations
We plan to open approximately 30 new stores in Fiscal 2016 and the rate of new store growth and remodeling ofexisting stores is being further evaluated as part of the reinvention strategy. The following table shows thechange in our network of stores for the Fiscal Years 2011 through 2015:
Fiscal Year
2015 2014 2013 2012 2011
Store Data:Stores open at beginning of year 717 659 579 528 484
Stores opened 50 61 52 54 48Stores acquired — — 31 — —Stores closed (9) (3) (3) (3) (4)
Stores open at end of year 758 717 659 579 528
7

New stores have typically required approximately four to five years to mature, generating lower store level salesin the initial years than our mature stores. As a result, new stores generally have a negative impact on our overalloperating margin. In addition, our new stores since the beginning of Fiscal 2013 are approximately 2,900 squarefeet compared to the average of our total store portfolio of approximately 3,500 square feet. Additionally, storesopened in new markets have lower brand awareness compared to stores in existing markets, and as a resultinitially experience a lower sales volume than stores opened in existing markets. As these stores mature, weexpect them to contribute meaningfully to our operating results. The following table reflects our store count bystate, as well as the District of Columbia, Puerto Rico and Ontario, Canada, at December 26, 2015:
Stores Open atDecember 26, 2015
Stores Open atDecember 26, 2015
Alabama 4 Nebraska 2Arizona 13 Nevada 7Arkansas 2 New Hampshire 6California 92 New Jersey 33Colorado 8 New Mexico 3Connecticut 11 New York 72Delaware 3 North Carolina 24District of Columbia 1 Ohio 24Florida 71 Oklahoma 3Georgia 23 Oregon 9Hawaii 7 Pennsylvania 28Idaho 2 Rhode Island 2Illinois 40 South Carolina 14Indiana 13 South Dakota 1Iowa 3 Tennessee 12Kansas 3 Texas 54Kentucky 5 Utah 3Louisiana 8 Vermont 1Maine 2 Virginia 26Maryland 21 Washington 35Massachusetts 18 Wisconsin 6Michigan 18Minnesota 10Missouri 8 Ontario, Canada 3Mississippi 1 Puerto Rico 3
Total 758
As of December 26, 2015, we leased the property for all of our 758 stores. Our typical lease terms are ten years,with one or two five-year renewal options. We do not believe that any individual store property is material to ourfinancial condition or results of operations. Of the leases for our stores, 36 expire in Fiscal 2016, 58 expire inFiscal 2017, 99 expire in Fiscal 2018, 104 expire in Fiscal 2019, 95 expire in Fiscal 2020 and the balance expirein Fiscal 2021 or thereafter. The Company intends to close the Vitapath format stores which are located inCanada at the end of the first quarter of Fiscal 2016. For the majority of our leases, renewal options remainavailable.
Products
We organize our products by category enabling comparisons between different brands within each product sub-category. In addition, our stores are staffed with experienced and knowledgeable Health Enthusiasts, many ofwhom are regular and informed VMS consumers. Our Health Enthusiasts are trained to inform our customersabout product features and assist our customers in product selection. To further inform our customers, our storesare equipped with Aisle 7®, an independent source of health and wellness information.
8

We offer a comprehensive selection of vitamins, minerals, herbs, homeopathic remedies, specialty supplementssuch as fish oil, probiotics, glucosamine and Co Q10, sports nutrition, weight management, as well as naturalbath and beauty products. Our offering includes approximately 19,400 SKUs from approximately 800 brands,including our own brands such as Vitamin Shoppe®, BodyTech®, True Athlete®, Mytrition®, plnt®,ProBioCare™ , Next Step®, Nutri-Force® Sport and Betancourt Nutrition™ brands which include products suchas Ultimate Man, Ultimate Woman, Ultimate 10 Probiotic, Whey Tech and Whey Tech Pro 24 Proteins. We alsooffer a comprehensive assortment from leading national brands such as Optimum Nutrition®, Cellucor®, Gardenof Life®, Quest Nutrition®, Solaray®, Solgar® and Nature’s Way®. This extensive assortment is designed toprovide our customers with a unique selection of available products to help them achieve their health andwellness goals. Sales of our branded products accounted for approximately 20% of our net sales in Fiscal 2015.
Key Product Categories
Below is a comparison of our net merchandise sales by major product category and the respective percentage ofour total net merchandise sales for the periods shown (dollars in thousands).
Fiscal 2015 (a) Fiscal 2014 (a) Fiscal 2013
Product Category Dollars % Dollars % Dollars %
Vitamins, Minerals, Herbs and Homeopathy $ 301,520 24% $ 285,775 24% $ 276,447 26%Sports Nutrition 432,205 34% 428,845 35% 393,659 36%Specialty Supplements 308,162 24% 313,025 26% 305,320 28%Other 222,615 18% 182,352 15% 109,554 10%
Total 1,264,502 100% 1,209,997 100% 1,084,980 100%Delivery Revenue 2,047 3,049 2,489
$1,266,549 $1,213,046 $1,087,469
(a) In Fiscal 2015 and Fiscal 2014, the “Other” product category includes net merchandise sales to third partiesof Nutri-Force of $56.6 million and $40.3 million, respectively.
Vitamins, Minerals, Herbs and Homeopathy
Vitamins and minerals are recommended to maintain health, proactively to improve health and in support ofspecific health conditions. These products help prevent nutrient deficiencies that can occur when diet alone doesnot provide all the necessary vitamins and minerals our bodies need. The vitamin and mineral product categoryincludes multi-vitamins, which many consider to be a foundation of a healthy regimen, lettered vitamins, such asVitamins A, C, D, E, and B-complex, along with major and trace minerals such as calcium, magnesium,chromium and zinc. With approximately 3,000 SKUs, a wide range of potency levels and multiple deliverysystems, our customers have many choices to fit their individual needs.
Herbs offer a natural remedy to address specific conditions. Certain herbs help support specific body systems,including ginkgo to support brain function and milk thistle to help support liver function, as well as other lesscommon herbs such as black cohosh for menopause support. Herbal products include whole herbs, standardizedextracts, herb combination formulas and teas. Homeopathic remedies offer our customers the ability to addresshealth concerns while providing the safety of having no known drug interactions or side effects. Withapproximately 4,000 SKUs, a wide range of potency levels and multiple delivery systems, our customers havemany choices to fit their individual needs.
Sports Nutrition
Our sports nutrition consumers are looking for products to help maintain or supplement a healthy lifestyle. Theseproducts are used in conjunction with cardiovascular conditioning, weight training and sports activities. Majorcategories in sports nutrition include protein and weight gain powders, meal replacements, weight management,
9

and pre and post-workout supplements to either support energy production or enhance recovery after exercise.Our sports nutrition products are offered in many convenient forms, such as powders, tablets, capsules, soft gelsand liquids. Our sports nutrition consumers include the sports enthusiast, weekend warrior, endurance athlete,marathoner, serious bodybuilder, as well as those seeking to maintain a healthy fitness level. We offerapproximately 2,000 SKUs in sports nutrition.
Specialty Supplements
Specialty supplements help supply higher levels of nutrients than diet alone can provide, help individuals stayhealthy, and support specific conditions and life stages such as childhood, pregnancy, menopause and aging.Categories of specialty supplements include omega fatty acids, probiotics and condition specific formulas.Certain specialty supplements, such as organic greens, psyllium fiber and soy proteins, provide added supportduring various life stages. Folic acid is specifically useful during pregnancy. Super antioxidants, such ascoenzyme Q-10, grapeseed extract and pycnogenol, address specific conditions. High ORAC (oxygen radicalabsorptive capacity) fruit concentrates such as; gogi, mangosteen, pomegranate and blueberry help preventoxygen radical damage. Other specialty supplement formulas are targeted to support specific organs, biosystemsand body functions. We offer approximately 5,000 SKUs of specialty supplements.
Other
Our “Other” category represents all other product classifications we stock that do not fit within the previouslydescribed categories. These products include items such as on the go bars, drinks and snacks, natural beauty andpersonal care and natural pet food. Our on the go bars, drinks and snacks offer our customers access to anoffering of protein, low carb and natural bars, protein, energy and functional beverages and natural snacks.Natural beauty and personal care products offer an alternative to traditional products that often contain syntheticand/or other ingredients that our customers find objectionable. Our customers choose these products over moretraditional products because they contain organic and natural ingredients, are free of pesticides or not tested onanimals and/or are more closely aligned with the health and wellness goals of our customers. Our natural petproducts include nutritionally balanced foods and snacks along with condition specific supplements such asglucosamine for joint health. We offer approximately 5,000 SKUs for our Other category. In Fiscal 2015 andFiscal 2014, our Other product category includes net merchandise sales to third parties of Nutri-Force of $56.6million and $40.3 million, respectively.
Delivery Revenue
Delivery revenue represents amounts billed to customers for shipping fees.
Access to New Products
One of the many components of customer satisfaction is the introduction of new products. We identify customerand market trends by listening to our customers, Health Enthusiasts, vendors, contract manufacturers and marketinfluencers. We maintain active partnerships with our vendors to stay on top of their product offerings and tobring new products to our customers quickly. In addition, we have a knowledgeable team in-house who focuseson bringing new Vitamin Shoppe branded products to our offering. Each year we launch many new productsunder our own brands, including the launch in Fiscal 2015 of approximately 75 new products. These include newproduct expansions into sustained release proteins and flavor expansions in our whey isolate products in ourBodyTech® brand. We continued to expand our plnt® brand with the addition of key items such as plant proteins,liquid coconut oil and meal replacements. We also launched new Carnitine Plus products under our Betancourtbrand.
Manufacturing
Through Nutri-Force, we provide custom manufacturing and private labeling of VMS products and develop andmarket our own branded products for both sales to third parties and for the VSI product assortment. Ourmanufacturing operations, which are located in Miami Lakes, Florida, produce tablets, capsules, soft-gels and
10

powders. By operating our own manufacturing facilities, we believe we have the ability to better control theproduction and timing of new product introductions, control costs, maintain high standards of product quality andenhance profitability.
Suppliers and Inventory
The Company had two suppliers from whom we purchased at least 5% of our merchandise during Fiscal 2015and one supplier from whom we purchased at least 5% of our merchandise during Fiscal 2014 and Fiscal 2013.We purchased approximately 17% of our total merchandise from these suppliers during Fiscal 2015 andapproximately 12% during Fiscal 2014 and 10% during Fiscal 2013.
We consider numerous factors in supplier selection, including, but not limited to, quality, price, credit terms, andproduct offerings. As is customary in our industry, we generally do not have long-term contracts with anysupplier and most suppliers may discontinue selling to us at any time.
We strive to maintain sufficient inventory to enable us to provide a high level of service to our customers.Inventory, accounts receivable and accounts payable levels, payment terms and return policies are in accordancewith standard business procedures. We maintain a distribution network which we use in conjunction with a just-in-time inventory ordering system that we use to replenish our stores based upon customer demand of a givenproduct or products. Our working capital requirements for merchandise inventory will continue to increase as wecontinue to open additional stores and expand our distribution network. Currently, our practice is to establish aninventory level of approximately $155,000 at cost for each of our new stores, the cost of which is partially offsetby vendor incentive and allowance programs. Additionally, 30 day payment terms have been extended to us bysome of our suppliers allowing us to effectively manage our inventory and working capital. We believe that ourbuying power enables us to receive favorable pricing terms and enhances our ability to obtain high demandmerchandise.
Warehouse and Distribution
We operate our supply chain primarily from three Company operated distribution center facilities. The Companyoperates distribution centers in North Bergen, New Jersey, Ashland, Virginia and Seattle, Washington. Byoperating our own facilities we gain greater control over operations and costs. Our products manufactured byNutri-Force are warehoused and distributed through its Miami Lakes, Florida facilities. We expect to close theSeattle, Washington distribution center in Fiscal 2016.
In Fiscal 2015, the Company began implementation of a new warehouse management system application(“WMS”) at its Ashland, Virginia distribution center in order to realize further productivity improvements andfunctionality. Implementation of the new WMS is expected to be completed in Fiscal 2016. Additionally, theCompany has entered into an agreement with a west coast third-party facility to provide us with warehousing anddistribution functions. We began operations with this third-party facility in the fourth quarter of Fiscal 2015. Thisthird-party facility replaces the previous west coast third-party facility which we terminated our relationship withduring the first half of Fiscal 2015.
Regulatory and Quality Control
The Food and Drug Administration (“FDA”) is the regulatory authority charged with overseeing the products weoffer and the Federal Trade Commission (“FTC”) regulates the advertising of those products.
Our Scientific and Regulatory Affairs (“S&RA”) and Legal departments review all aspects of our Company’sFDA and FTC regulatory processes, ensuring compliance with regulations. We have established processes toreview the underlying safety and efficacy of our branded products, including Vitamin Shoppe®, BodyTech®,True Athlete®, Mytrition®, plnt®, ProBioCare™, Next Step®, Nutri-Force® Sport and Betancourt Nutrition™.These processes include review of the ingredients’ safety information, product formulation, product form,
11

product labeling, the efficacy and claim support for the product and any marketing materials. All consumercommunications that deal with product and health issues must be approved by S&RA prior to being disseminatedto the public.
We have standard procedures whereby all potential Vitamin Shoppe contract manufacturers are reviewed andapproved before they can supply any of our branded products. In addition, all potential new products areevaluated and approved prior to being accepted into our branded product lines.
Our relationships with manufacturers require that all of our branded products, including Vitamin Shoppe®,BodyTech®, True Athlete®, Mytrition®, plnt®, ProBioCare™, Next Step®, Nutri-Force® Sport and BetancourtNutrition™, not be adulterated or misbranded under any provisions of the Federal Food, Drug, and Cosmetic Act(“FDCA”) and the regulations promulgated thereunder. This includes, but is not limited to, compliance withapplicable Current Good Manufacturing Practices (“cGMP”). This means that ingredients in our products mustbe tested for identity, purity, quality, strength, and composition before being incorporated into our brandedproducts, and that our final branded products must again be tested for identity, purity, quality, strength, andcomposition prior to being released. All of these products require a certificate of analysis, which includescertification to 100% of label claim.
We have established a standard quality control operating procedure that calls for on-site audits of our contractmanufacturers’ facilities and processes, and have established an internal team that will audit each of thesefacilities and work with our contract manufacturers to resolve any noncompliance with dietary supplement cGMPregulations. We require that our manufacturers have certificates of analysis (such as for microbial testing andlabel testing).
Third party vendors, are also subject to a standard review, must comply with our vendor purchase agreement andare required to carry adequate insurance policies to satisfy our standards. Each new product proposed to becarried by us is reviewed by our S&RA department. They reject those products that they believe may presentundue risk or be unsafe.
Healthy Awards Program
Our Healthy Awards Program, which we established over 15 years ago, encourages our customers to make repeatpurchases and enables us to enhance customer loyalty. The program is open to Vitamin Shoppe customers and isfree of charge to join. Members of the program earn one point for every dollar they spend, starting with the firstpurchase upon joining the program. Beginning in Fiscal 2016, the Company implemented enhancements to theprogram, including the issuance of credit certificates on a quarterly basis compared with annual issuances underthe previous program. We enrolled approximately 1.9 million new members in Fiscal 2015. The number of activemembers between retail and online shoppers was approximately 5.9 million as of December 26, 2015. An activemember is a customer that has purchased an item within the last twelve months.
We utilize our Healthy Awards Program database to track customer purchasing patterns across our retail anddirect business segments, analyze market and industry trends and create targeted merchandising and marketingstrategies. In addition, it provides us with customer and demographic data we use to assist us in the selection offuture store locations.
Marketing
We believe our high quality real estate is one of our primary marketing tools, as we locate our stores in high-visibility areas. We also conduct targeted marketing efforts by mailing offers and promotional announcements tomembers of our Healthy Awards Program. We advertise in national magazines, and engage in local advertisingvia direct mail, radio and television for certain new stores. We continue to develop our social media presence anddigital marketing.
12

We promote our own branded products, including Vitamin Shoppe®, BodyTech®, True Athlete®, Mytrition®,plnt®, ProBioCare™ , Next Step®, Nutri-Force® Sport and Betancourt Nutrition™ through our retail channel byplacing the products in strategic and highly visible locations in our stores.
Competition
The U.S. nutritional supplements retail industry is highly competitive and fragmented. Competition is basedprimarily on quality, product assortment, price, customer service, convenience, marketing support andavailability of new products. We compete with publicly and privately owned companies with broad geographicalmarket coverage and product categories. We compete with other specialty and mass market retailers, includingVitamin World®, GNC®, Whole Foods®, Natural Grocers®, Sprouts Farmers Market®, Costco® and Wal-Mart®,drugstore chains including Rite-Aid®, CVS® and Walgreens®, internet and mail order companies, includingAmazon.com®, Puritan’s Pride®, Vitacost.com®, Bodybuilding.com®, Doctors Trust®, Swanson® and iHerb®, inaddition to a variety of independent health and vitamin stores and e-commerce outlets.
Insurance and Risk Management
We purchase insurance to partially offset standard risks in our industry, including policies to cover productsliability, travel liability, auto liability and other casualty and property risks. We are self-insured and utilize highdeductible programs for certain losses related to our employee medical benefits, workers’ compensation andgeneral liability, although we maintain stop-loss coverage with third-party insurers to limit our liability exposure.Our insurance rates are based on our safety record, claims experience and trends in the insurance industry.
We face an inherent risk of exposure to product liability claims if, among other things, the use of our productsresults in injury. With respect to product liability coverage, we carry insurance coverage typical of our industryand product lines. Our coverage involves self-insured retentions with primary and excess liability coverage abovethe retention amount. We have the ability to refer certain claims to our contract manufacturers, third-partyvendors and their respective insurers to pay the costs associated with any claims arising from those contractmanufacturers’ or third-party vendors’ products. Our insurance covers claims that are not adequately covered bya contract manufacturer’s or third-party vendor’s insurance and provides for excess secondary coverage abovethe limits provided by our contract manufacturers or third-party vendors. We believe we have obtained a prudentamount of insurance for the insurable risks associated with our business. Our experience is that our insurancecosts have increased in the past, and may increase in the future.
Tradenames and Other Intellectual Property
We believe trademark protection is particularly important to the maintenance of the recognized proprietary brandnames under which we market our products. We own trademarks or trade names that we use in conjunction withthe sale of our products, including the Vitamin Shoppe®, BodyTech®, True Athlete®, Mytrition®, plnt®,ProBioCare™ , Next Step®, Nutri-Force® Sport and Betancourt Nutrition™ brand names. We also rely upontrade secrets, know-how, continuing technological innovations and licensing opportunities to develop andmaintain our competitive position. We protect our intellectual property rights through a variety of methodsincluding trademark and trade secret laws, as well as confidentiality agreements and proprietary informationagreements with vendors, employees, consultants and others who have access to our proprietary information.Protection of our intellectual property often affords us the opportunity to enhance our position in the marketplaceby precluding our competitors from using or otherwise exploiting our technology and brands. The carrying valueof our trademarks and brands, which are primarily indefinite lived intangible assets, was $79.5 million atDecember 26, 2015 and $80.6 million at December 27, 2014.
Sales from International Sources
For each of the last three years, less than 1.0% of our sales have been derived from international sources.
13
Employees
As of December 26, 2015, we had a total of 4,255 full-time and 1,431 part-time employees, of whom 4,477 wereemployed in our retail channel and 1,209 were employed in corporate, manufacturing, distribution and directchannel support functions. None of our employees belong to a union or are a party to any collective bargaining orsimilar agreement except for certain employees at one of our Seattle based stores, who are members of theUnited Food & Commercial Workers Local No. 367. We consider our relationships with our employees to begood.
Environmental
We are subject to numerous federal, state, local and foreign laws and regulations governing our operations,including the handling, transportation and disposal of our products and our non-hazardous and hazardoussubstances and wastes, as well as emissions and discharges into the environment, including discharges to air,surface water and groundwater. Failure to comply with those laws and regulations could result in costs forcorrective action, penalties or the imposition of other liabilities. Changes in environmental laws or theinterpretation thereof or the development of new facts could also cause us to incur additional capital andoperational expenditures to maintain compliance with environmental laws and regulations. We also are subject tolaws and regulations that impose liability and cleanup responsibility for releases of hazardous substances into theenvironment without regard to fault or knowledge about the condition or action causing the liability. Undercertain of these laws and regulations, such liabilities can be imposed for cleanup of previously owned or operatedproperties. The presence of contamination from those substances or wastes could also adversely affect our abilityto utilize our leased properties. Compliance with environmental laws and regulations has not had a materialeffect upon our earnings or financial position; however, if we violate any environmental obligation, it could havea material adverse effect on our business or financial performance.
Government Regulation
The formulation, manufacturing, processing, labeling, packaging, advertising and distribution of our products aresubject to regulation by various federal agencies, including the FDA, the FTC, the Consumer Product SafetyCommission, the U.S. Department of Agriculture (“USDA”) and the Environmental Protection Agency (“EPA”).These activities are also regulated by various agencies of the states and localities in which our products are sold.The FDA, under the Federal Food, Drug, and Cosmetic Act (“FDCA”) regulates the processing, formulation,safety, manufacture, packaging, labeling and distribution of dietary supplements (including vitamins, minerals,and herbs) and cosmetics. The FTC regulates the advertising of these products.
The Dietary Supplement Health and Education Act of 1994 (“DSHEA”) amended the FDCA to establish a newframework governing the composition, safety, labeling and marketing of dietary supplements. “Dietarysupplements” are defined as vitamins, minerals, herbs, other botanicals, amino acids and other dietary substancesfor human use to supplement the diet, as well as concentrates, metabolites, constituents, extracts or combinationsof such dietary ingredients. Generally, under DSHEA, dietary ingredients that were on the market prior toOctober 15, 1994 may be used in dietary supplements without notifying the FDA. New dietary ingredients (i.e.,not marketed in the U.S. prior to October 15, 1994) must be the subject of a new dietary ingredient notificationsubmitted to the FDA unless the ingredient has been “present in the food supply as an article used for food”without being “chemically altered.” A new dietary ingredient notification must provide the FDA with evidence ofa “history of use or other evidence of safety” establishing that use of the dietary ingredient “will reasonably beexpected to be safe.” A new dietary ingredient notification must be submitted to the FDA at least 75 days beforethe initial marketing of the new dietary ingredient. There can be no assurance that the FDA will accept theevidence of safety for any new dietary ingredients that we may want to market, and the FDA’s refusal to acceptsuch evidence could prevent the marketing of such dietary ingredients. In 2011, the FDA issued draft guidanceregarding new dietary ingredient notifications, including the scope of the notification requirement and the contentof such notifications. While the draft guidance is not enforceable, it may be deemed to represent the FDA’scurrent point of view. FDA has announced its intention to issue revised draft guidance in 2016. Should the FDA
14

enforce the draft guidance as currently written, it would have a negative effect on the innovation and continuedmarketing of dietary supplements. There is no certainty that the FDA will accept any particular evidence ofsafety for any new dietary ingredient. The FDA’s refusal to accept such evidence could prevent the marketing ofthose dietary ingredients.
DSHEA permits “statements of nutritional support” to be included in labeling for dietary supplements withoutpremarket FDA approval. Such statements must be submitted to the FDA within 30 days of first use in marketingand must be accompanied by a label disclosure that “This statement has not been evaluated by the Food and DrugAdministration. This product is not intended to diagnose, treat, cure, or prevent any disease.” Such statementsmay describe how a particular dietary ingredient affects the structure, function or general well-being of the body,or the mechanism of action by which a dietary ingredient may affect body structure, function or well-being, butmay not expressly or implicitly represent that a dietary supplement will diagnose, cure, mitigate, treat, or preventa disease. Any statement of nutritional support we make in labeling must possess scientific evidencesubstantiating that the statement is truthful and not misleading. If the FDA were to determine that a particularstatement of nutritional support was an unacceptable drug claim or an unauthorized version of a health claimabout disease risk reduction for a food product, or if the FDA were to determine that a particular claim was notadequately supported by existing scientific data or was false or misleading, we would be prevented from usingthat claim. In addition, the FDA deems internet materials as labeling; therefore, our internet materials mustcomply with FDA requirements and could be the subject of regulatory action by the FDA, or by the FTC if thatagency, reviewing the materials as advertising, considers the materials false and misleading.
DSHEA provides that so-called “third-party literature,” such as a reprint of a peer-reviewed scientific publicationlinking a particular dietary ingredient with health benefits, may be used “in connection with the sale of a dietarysupplement to consumers” without the literature being subject to regulation as labeling. Such literature must notbe false or misleading; the literature may not “promote” a particular manufacturer or brand of dietarysupplement; and a balanced view of the available scientific information on the subject matter must be presented.If the literature fails to satisfy each of these requirements, we may be prevented from disseminating suchliterature with our products, and any dissemination could subject our product to regulatory action as an illegaldrug.
In June 2007, the FDA published current Good Manufacturing Practice (“cGMP”) regulations that govern themanufacturing, packing and holding of dietary ingredients and dietary supplements. cGMP regulations requiredietary supplements to be prepared, packaged and held in compliance with strict rules, and require quality controlprovisions similar to those in the cGMP regulations for drugs. The FDA could inspect one of our facilities orthose of one of our contract manufacturers and determine that the facility was not in compliance with theseregulations, and cause affected products made or held in the facility to be subject to FDA enforcement actions.We believe our manufacturing and distribution facilities and practices comply with these rules. In addition, as iscommon practice in the industry, we rely on our third-party contract manufacturers to ensure that the productsthey manufacture and sell to us comply with all applicable regulatory requirements and seek representations andwarranties in our agreements with these contract manufacturers confirming such compliance.
The FDA has broad authority to enforce the provisions of the FDCA applicable to foods, dietary supplements,and cosmetics, including powers to issue a public warning letter to a company, to publicize information aboutillegal products, to request a recall of illegal products from the market, and to request the United StatesDepartment of Justice to initiate a seizure action, an injunction action, or a criminal prosecution in the U. S.courts.
The FTC exercises jurisdiction over the advertising of foods, dietary supplements and cosmetics. In recent years,the FTC has instituted numerous enforcement actions against dietary supplement companies for failure to haveadequate substantiation for claims made in advertising or for the use of false or misleading advertising claims. Asa result of our efforts to comply with applicable statutes and regulations, we have from time to time reformulated,eliminated or relabeled certain of our products and revised certain provisions of our sales and marketing
15

program. The FTC has broad authority to enforce its laws and regulations applicable to foods, dietarysupplements and cosmetics, including the ability to institute enforcement actions which often result in consentdecrees, injunctions, and the payment of civil penalties by the companies involved. Failure to comply with theFTC’s laws and regulations could impair our ability to market our products.
We are also subject to regulation under various state and local laws that include provisions governing, amongother things, the registration, formulation, manufacturing, packaging, labeling, advertising and distribution offoods, dietary supplements and cosmetics. In addition, in the future, we may become subject to additional laws orregulations administered by the FDA or by other federal, state, local or foreign regulatory authorities, to therepeal of laws or regulations that we consider favorable, such as DSHEA, or to more stringent interpretations ofcurrent laws or regulations. In the future, we believe the dietary supplement industry will likely face increasedscrutiny from federal and state regulatory authorities. It is difficult to predict the effect future laws, regulations,repeals or interpretations will have on our business. However, such changes in the regulatory landscape couldrequire the reformulation of certain products, recalls or discontinuance of certain products, additionaladministrative requirements, revised or additional labeling, increased scientific substantiation or other newrequirements. Any such changes could have a material adverse effect on our business or financial performance.
Corporate Information
We were incorporated in Delaware on September 27, 2002. Our principal executive offices are located at 300Harmon Meadow Blvd., Secaucus, New Jersey 07094.
Item 1A. Risk Factors
You should carefully consider the following factors, in addition to other information in this Annual Report onForm 10-K, in evaluating our Company and our business.
Risks Related to Our Business and Industry
Unfavorable publicity or consumer perception of our products and any similar products distributed by othercompanies could have a material adverse effect on our reputation, which could result in decreased sales andsignificant fluctuations in our business, financial condition and results of operations.
We depend significantly on consumer perception regarding the safety and quality of our products, as well assimilar products distributed by other companies. Consumer perception of products can be significantly influencedby adverse publicity in the form of published scientific research, national media attention or other publicity,whether or not accurate, that associates consumption of our products or any other similar products with illness orother adverse effects, or questions the benefits of our or similar products or that claims that any such products areineffective. A new product may initially be received favorably, resulting in high sales of that product, but thatsales level may not be sustainable as consumer preferences change. Future scientific research or publicity couldbe unfavorable to our industry or any of our particular products and may not be consistent with earlier favorableresearch or publicity. Unfavorable research or publicity could have a material adverse effect on our ability togenerate sales.
Our failure to appropriately and timely respond to changing consumer preferences and demand for newproducts and services could significantly harm our customer relationships and our business, financialcondition and results of operations.
Our business is subject to changing consumer trends and preferences. Our failure to accurately predict or react tothese trends could negatively impact consumer opinion of us as a source for the latest products, which in turncould harm our customer relationships and cause us to lose market share. The success of our product offeringsdepends upon a number of factors, including our ability to:
• anticipate customer needs;
• innovate and develop new products;
16

• successfully introduce new products in a timely manner;
• price our products competitively with retail and online competitors;
• deliver our products in sufficient volumes and in a timely manner; and
• differentiate our product offerings from those of our competitors.
If we do not introduce new products or make enhancements to meet the changing needs of our customers in atimely manner, some of our products could be rendered obsolete, which could have a material adverse effect onour sales and other operating results.
We continue to explore new strategic initiatives, including our reinvention strategy, but we may not be able tosuccessfully execute on, or realize the expected benefits from the implementation of, our strategic initiatives,and our pursuit of new strategic initiatives may pose significant costs and risks.
In Fiscal 2015, we began development of our reinvention strategy to refocus our business on market-basedopportunities for stronger growth. As part of our reinvention strategy, we are comprehensively reviewing ourcustomer experience. Our reinvention strategy may include initiatives to optimize product assortment, integrationof technology and e-commerce, changes to the layout and design of our retail stores, and improvements inservice levels provided by our Health Enthusiasts. We will implement our reinvention strategy throughout Fiscal2016 and beyond. Our strategic initiatives are also focused on, among other things, developing a presence in newinternational markets through franchise, wholesale and retail distribution opportunities, developing new products,and evaluating acquisitions and joint ventures. Our future operating results are dependent, in part, on ourmanagement’s success in implementing the reinvention strategy and other strategic initiatives, and as a resultcould divert management’s attention from our existing business as management focuses on developing theinitiative and related operations. Also, our short-term operating results could be unfavorably impacted by theopportunity and financial costs associated with the implementation of our strategic plans, such as consulting feesincurred in connection with the reinvention strategy, and we might not realize the benefits from such strategies.In addition, we may not be successful in achieving the intended objectives of the reinvention strategy andother strategic initiatives in a timely manner or at all.
We may experience product recalls, withdrawals or seizures, which could materially and adversely affect ourbusiness, financial condition and results of operations.
We may be subject to product recalls, withdrawals or seizures if any of the products we sell or the products thatwe manufacture for third parties is believed to cause injury or illness or if we are alleged to have violatedgovernmental regulations in the manufacturing, labeling, promotion, sale or distribution of those products. Asignificant recall, withdrawal or seizure of any of the products we manufacture or sell may require significantmanagement attention, would likely result in substantial and unexpected costs and may materially and adverselyaffect our business, financial condition or results of operations. Furthermore, a recall, withdrawal or seizure ofany of our products may adversely affect consumer confidence in our brands and thus decrease consumerdemand for our products. As is common in the VMS industry, except with respect to the products that wemanufacture at our manufacturing facility, we rely on our contract manufacturers and suppliers to ensure that theproducts they manufacture and sell to us comply with all applicable regulatory and legislative requirements. Ingeneral, we seek representations and warranties, indemnification and/or insurance from our contractmanufacturers and suppliers. However, even with adequate insurance and indemnification, any claims of non-compliance could significantly damage our reputation and consumer confidence in our products. In addition, thefailure of those products to comply with applicable regulatory and legislative requirements could prevent us frommarketing the products or require us to recall or remove such products from the market, which in certain casescould materially and adversely affect our business, financial condition and results of operations.
17

Disruptions at our or our contract manufacturers’ manufacturing facilities or loss of our or theirmanufacturing certifications could materially and adversely affect our business, financial condition, results ofoperations and customer relationships.
Our private-label brands merchandise accounted for approximately 20% of our net sales in Fiscal 2015. Anysignificant disruption in a contract manufacturers’ manufacturing facilities for any reason, including regulatoryrequirements, an FDA determination that the facility is not in compliance with the cGMP regulations, the loss ofcertifications, power interruptions, destruction of or damage to facilities, terrorist attacks, civil unrest, war or theperceived threat thereof, fires, hurricanes and other natural disasters could disrupt our contract manufacturers’ability to manufacture products for the Vitamin Shoppe assortment as well as disrupt our ability to manufactureproducts for our contract manufacturing customers and our own branded products. Any such disruption couldhave a material adverse effect on our business, financial condition and results of operations. While we do notbelieve it would be difficult to source our products from other contract manufacturers, a transition period wouldbe required in order to source our own branded products from other contract manufacturers.
Although we expect that our acquisition of Nutri-Force will result in benefits to our business, we may notrealize those benefits because of integration difficulties and other challenges.
The success of our acquisition of Nutri-Force will depend in large part on the ability of our management torealize the anticipated benefits from the acquisition of Nutri-Force. To realize these anticipated benefits, thebusinesses of Nutri-Force must be successfully integrated with the Company. Management may face challengesin consolidating the functions of the Company and Nutri-Force, integrating the technologies, organizations,procedures, policies and operations, as well as addressing the different business cultures at the two companies,and retaining key management, employees and customer relationships of Nutri-Force. If integration is notsuccessful, the anticipated benefits of the acquisition may not be realized fully or at all or may take longer torealize than expected. The integration may also be time consuming and require substantial resources and effort.In addition, there can be no assurance that the transition of business from our existing contract manufacturers toNutri-Force will be seamless and, oftentimes, this type of transition results in significant operational challengesthat can cause financial difficulties. The integration process and other disruptions resulting from the acquisitionmay disrupt our ongoing businesses or adversely affect relationships with employees, regulators and others withwhom we have business or dealings.
Since the acquisition, Nutri-Force has experienced disruption in its ability to optimize production capacity andcorrespondingly has experienced lower service levels to customers. We have taken steps to improve theoperations at Nutri-Force, including the hiring of new leadership and the engagement of third-partymanufacturing consultants to implement and improve manufacturing processes. The Company believes thisdisruption should not impact the long-term opportunity from the Nutri-Force acquisition. However, shouldfinancial performance deteriorate further or remain depressed for a prolonged period of time, estimates of futurecash flows may be insufficient to support the carrying value of goodwill and intangibles assigned to Nutri-Force,which may result in impairment charges which could have an adverse impact on our results of operations andfinancial position.
Our customers for whom we contract manufacture may significantly influence our business, financialcondition and results of operations.
Our contract manufacturing business is dependent on demand for the products we manufacture for our customersand we have no control or influence over the market demand for those products. Demand for our customers’products can be adversely affected by, among other things, regulatory issues, the loss of patent or otherintellectual property rights protection, the emergence of competing products, competition from other contractmanufacturers, negative public or consumer perception of those products or our industry and changes in themarketing strategies for such products.
18

If production volumes of products that we manufacture for third parties and related revenues are not maintained,it may have a material adverse effect on our business, financial condition and results of operations. Additionally,any changes in product mix due to our customers’ products may adversely affect our results of operations.
Increases in the price or shortages of supply of key raw materials could materially and adversely affect ourbusiness, financial condition and results of operations.
Our products and the products we manufacture for third parties are composed of certain key raw materials. If theprices of these raw materials were to increase significantly, it could result in a significant increase to us in theprices charged to us for our own branded products and third-party products. Raw material prices may increase inthe future and we may not be able to pass on those increases to customers who purchase our products. Asignificant increase in the price of raw materials that cannot be passed on to customers could have a materialadverse effect on our business, financial condition and results of operations.
We are reliant upon the supply of raw materials that meet our specifications and the specifications of third partiesfor which we manufacture. If any raw material is adulterated and does not meet our specifications or thirdparties’ specifications, it could significantly impact our ability to manufacture products and could materially andadversely affect our business, financial condition and results of operations.
In addition, if we are no longer able to obtain products from one or more of our suppliers on terms reasonable tous or at all, our ability to perform under contracts with third parties for whom we manufacture products and ourcustomer relationships could be materially and adversely affected. Events such as terrorist attacks, civil unrest orwar, or the perceived threat thereof, may also have a significant adverse effect on raw material availabilityessential to the manufacturing of our products which could have a material adverse effect on our business,financial condition and results of operations.
The cost of construction materials we use to build and remodel our stores is also subject to significant pricevolatility based on market and economic conditions. Higher construction material prices would increase thecapital expenditures needed to construct a new store or remodel an existing store and could increase the rentpayable by the Company under its leases.
We currently rely primarily on two warehouse and distribution facilities to distribute most of the products wesell. Disruptions to these warehouse and distribution facilities could adversely affect our business.
Our primary warehouse and distribution operations are currently concentrated in two locations; in North Bergen,New Jersey and in Ashland, Virginia. Although we added a west coast third-part logistics provider to ouroperations during 2015 (which replaced our previous west coast third-party logistics provider) to service certainstores on the west coast and in Texas, any significant disruption to our two primary distribution centersoperations for any reason, such as a flood, fire or hurricane, could adversely affect our product distributions andsales until we are able to secure an alternative distribution method. Unexpected delays in deliveries or increasesin transportation costs (including through increased fuel costs) could significantly decrease our sales andoperating results. In addition, labor shortages in the transportation industry or long-term disruptions to thenational and international transportation infrastructure that lead to delays or interruptions of deliveries couldnegatively affect our business.
Failure to increase the utilization of our supply chain network could have a material adverse effect on ourbusiness.
If we fail to increase the utilization of our supply chain network and expand functionality of our informationtechnology systems, we could experience increased costs associated with diminished productivity and operatinginefficiencies related to the flow of goods through our supply chain, which could have a material adverse effecton our financial results.
19

Our existing stores, or any stores we open in the future, may not achieve sales and operating levels consistentwith historical results. In addition, our growth strategy includes the addition of a significant number of newstores each year. We may not be able to successfully implement this strategy on a timely basis or at all, andour business could be materially and adversely affected if we are unable to successfully negotiate favorablelease terms.
We continue to pursue new store growth. Since the beginning of Fiscal 2013, we have opened 163 new stores andacquired 31 stores, expanding our presence in our existing markets as well as entering new markets. Historically,our new stores have reached sales that are consistent with our mature stores over the course of approximatelyfour to five years. Our new stores opened since the beginning of Fiscal 2013 average approximately 2,900 squarefeet compared to the average of our total store portfolio of approximately 3,500 square feet. Existing stores, orany new stores we open in the future, may not achieve sales and operating levels consistent with our historicalresults. In addition, customer migration from retail stores to e-commerce may also reduce store potential. Thefailure of our existing stores and new stores to achieve sales and operating levels consistent with our historicalresults could have a material adverse effect on our financial condition and operating results. As of December 26,2015, we leased 758 stores along with our corporate headquarters, additional office space and manufacturing anddistribution facilities. The store leases are generally for a term of ten years and we have options to extend mostleases for a minimum of five years. Our business, financial condition, and operating results could be materiallyand adversely affected if we are unable to continue to negotiate acceptable lease and renewal terms.
In addition, our growth continues to depend, in part, on our ability to open and operate new stores successfully.The success of this strategy depends upon, among other things, the identification of suitable sites for storelocations, the negotiation of acceptable lease terms, the hiring, training and retention of competent salespersonnel, and the effective management of inventory to meet the needs of new and existing stores on a timelybasis. Our continued expansion will also place increased demands on our operational, managerial andadministrative resources. These increased demands could cause us to operate our business less effectively, whichin turn could cause deterioration in the financial performance of our existing stores. Further, our new storeopenings may result in reduced net sales volumes in the direct channel, as well as in our existing stores in thosemarkets. We expect to fund our expansion through cash flow from operations and, if necessary, by borrowingsunder our revolving credit facility. If we experience a decline in performance, we may slow or discontinue storeopenings. If we fail to successfully implement these strategies, our financial condition and operating results maybe materially and adversely affected.
Some of our new stores may be located in areas where we have little or no presence or brand awareness. Thosemarkets may have different competitive conditions, market conditions, consumer tastes and discretionaryspending patterns than our existing markets, which may cause our new stores to be less successful than stores inour existing markets. Alternatively, many of our new stores will be located in areas where we have existingstores. Although we have experience in these markets, increasing the number of locations in these markets mayresult in inadvertent over-saturation of markets and temporarily or permanently divert customers and sales fromour existing stores, thereby adversely affecting our overall financial performance.
We operate in a highly competitive industry and our failure to compete effectively could materially andadversely affect our sales and growth prospects.
The U.S. nutritional supplements retail industry is a large and highly fragmented industry. We compete primarilyagainst other specialty retailers, supermarkets, drugstores, mass merchants, multi-level marketing organizationsand e-commerce companies. This market is highly sensitive to the introduction of new products, which mayrapidly capture a significant share of the market. As certain products become more mainstream, with broaderdistribution, we experience increased competition for those products. For example, as the trend in favor of lowcarb products developed, we experienced increased competition for our low carb products from supermarkets,drug stores, mass merchants and other food companies. Increased competition from companies that distributethrough retail, e-commerce or wholesale channels could have a material adverse effect on our financial conditionand results of operations. Certain of our competitors may have significantly greater financial, technical and
20

marketing resources than we do. In addition, our competitors may be more effective and efficient in introducingnew products. Furthermore, if we fail to increase the utilization of our supply chain network, fail to maximize theefficiency of our ship direct to customers strategy, or fail to provide our customers with an attractive omni-channel experience, our business and results of operations could be materially and adversely affected. We maynot be able to compete effectively, and any of the factors listed above may cause price reductions, reducedmargins and losses of our market share.
The loss of key management could negatively affect our business.
Our success largely depends on the efforts and abilities of our senior executive group and key personnel. The lossof the services of one or more of our key executives or personnel, or the increased demands placed on our keyexecutives and personnel by our continued growth could adversely affect our financial performance and ourability to execute our strategies. Our continued success also depends on our ability to attract and retain qualifiedteam members to meet our future growth needs. We may not be able to attract and retain necessary teammembers to operate our business.
Our inability to attract, train and retain highly qualified Health Enthusiasts could adversely impact ourbusiness, financial condition and results of operations.
Our success depends on the continued contributions of our Health Enthusiasts, and the loss of these contributionscould have a material adverse effect on our business. We must attract, train and retain a large and growingnumber of qualified Health Enthusiasts, while controlling related labor costs and maintaining our core values.Our ability to control labor and benefit costs is subject to numerous external factors, including regulatorychanges, prevailing wage rates, and healthcare and other insurance costs. We compete with other retail and non-retail businesses for these Health Enthusiasts and invest significant resources in training and motivating them.There is no assurance that we will be able to attract or retain qualified Health Enthusiasts in the future, whichcould have a material adverse effect on our business, financial condition and results of operations.
If we fail to protect our brand names, competitors may adopt tradenames that dilute the value of our brandnames.
We may be unable or unwilling to strictly enforce our tradenames in each jurisdiction in which we do business.In addition, because of the differences in foreign trademark laws concerning proprietary rights, our trademarksmay not receive the same degree of protection in foreign countries as they do in the U.S. Also, we may notalways be able to successfully enforce our trademarks against competitors or against challenges by others. Ourfailure to successfully protect our trademarks could diminish the value and efficacy of our past and futuremarketing efforts, and could cause customer confusion, which could, in turn, materially and adversely affect oursales and profitability.
Disruptions in our information systems could damage our reputation, be expensive to remedy and have amaterial adverse effect on our business and results of operations.
We rely extensively on information systems for point-of-sale processing in our stores, our e-commerce business,supply chain, manufacturing operations, financial reporting, human resources and various other processes andtransactions. Our information systems, including those provided and maintained by third-party service providers,are subject to damage or interruption from power outages or other types of damage, including those due tocomputer and telecommunications failures, natural events including hurricanes, fires, floods, earthquakes,tornadoes, high winds and other severe weather, and from events caused by humans, including computer viruses,physical or electronic break-ins and acts of war or terrorism. Any of these events could cause systeminterruptions, delays and loss of critical data, and could prevent us from accepting and fulfilling customer orders,process and receive shipments of products, process financial and credit card transactions and providing services,which could make our product offerings less attractive and subject us to liability as well as result in lost customerconfidence. Additionally, changes in technology could cause our information systems to become obsolete and itmay be necessary to incur additional costs to upgrade such systems, and if our information systems prove
21

inadequate to handle our growth, we could lose customers, which could have a material adverse effect on ourbusiness, financial condition and results of operations. Our systems are not fully redundant and our disasterrecovery planning may not be sufficient. In addition, we may have inadequate insurance coverage to compensatefor any related losses. Any of these events could damage our reputation, be expensive to remedy and have amaterial adverse effect on our business and results of operations.
If we fail to protect the integrity and security of customer-related and other confidential information, we couldbe exposed to litigation, increased costs and reputational damage, and our business, results of operations andfinancial condition could be materially and adversely affected.
The use of individually identifiable data by us, our customers, our Health Enthusiasts and others is regulated atthe state, federal and international levels. Privacy and information security laws and regulations change fromtime to time, and increasing costs of compliance with those laws and regulations and related technologyinvestments could materially and adversely affect our business and results of operations. Additionally, thesuccess of our e-commerce operations depends upon the secure transmission of confidential information overpublic networks, including the use of cashless payments, and we use computers in substantially all other aspectsof our business operations, including for point-of-sale processing in our stores. Such uses give rise tocybersecurity risks, including security breach, espionage, system disruption, theft and inadvertent release ofinformation. While we have taken significant steps to protect customers’ personal information, consumerpreferences and credit card information, and other confidential information including our employees’ privateinformation and financial and strategic data about the Company and our business partners, the intentional ornegligent actions of Health Enthusiasts, our suppliers or others may undermine our security measures. As aresult, unauthorized parties may obtain access to our data systems and misappropriate confidential data.Furthermore, because the methods used to obtain unauthorized access change frequently and may not beimmediately detected, we may be unable to anticipate these methods or implement preventative measures, andour incident response efforts may not be entirely effective. Any preventative measures we implement may havethe potential to negatively affect our relations with our customers or decrease activity on our websites by makingthem less user-friendly. If our data security is compromised, it could have a material adverse effect on ourreputation, results of operations and financial condition, materially increase the costs we incur to protect againstthose events in the future and subject us to additional legal risk and a competitive disadvantage. In addition, ourcustomers could lose confidence in our ability to protect their personal information, which could cause them tostop shopping at our stores or online. The loss of confidence from a data security breach involving HealthEnthusiasts could hurt our, and their, reputation and as a result cause Health Enthusiast recruiting and retentionchallenges.
The timing and implementation of new credit card technology could adversely affect our business, financialcondition and results of operations.
Credit card companies have mandated new technology in order to process chip enabled credit card transactionsand that such technology be implemented as of October 2015. The Company is actively working to deploy thistechnology. Since the new technology has not been fully deployed, the Company may bear liability for certainfraudulent transactions which could adversely affect our business, financial condition and results of operations.
Natural disasters and unusually adverse weather conditions could cause permanent or temporary damage toour distribution centers or stores, impair our ability to purchase, receive or replenish inventory or causecustomer traffic to decline, all of which could result in lost sales and otherwise materially and adversely affectour results of operations.
The occurrence of one or more natural disasters, such as hurricanes, fires, floods, earthquakes, tornadoes, highwinds and other severe weather, could materially and adversely affect our operations and results of operations.To the extent these events result in the closure of our distribution centers, our corporate headquarters, or asignificant number of our stores, or to the extent they adversely affect one or more of our key suppliers, ouroperations and results of operations could be materially and adversely affected through an inability to make
22

deliveries to our stores and through lost sales. In addition, these events could result in increases in fuel (or otherenergy) prices or a fuel shortage, delays in opening new stores, the temporary lack of an adequate work force in amarket, the temporary or long-term disruption in the supply of products from suppliers, delay in the delivery ofgoods to our distribution centers or stores, the temporary reduction in the availability of products in our storesand disruption to our information systems, as noted above. These events also could have indirect consequences,such as increases in the cost of insurance, if they were to result in significant loss of property or other insurabledamage.
Our e-commerce business is dependent on certain third parties. Changes in business practices or terms bysuch third parties could have a material adverse effect on our results of operations.
Our e-commerce business has several third-party relationships that contribute to our ability to generate revenuefrom a variety of online sources. These relationships may be dependent upon third-party tools, such as searchengines, or established business terms negotiated by the Company. If the economics of these relationships or theuse of the third-party tools used to drive revenue change materially, this could affect our decision to maintainthese relationships, and could result in lost sales and otherwise materially and adversely affect our financialperformance.
If we do not successfully develop and maintain a relevant omni-channel experience for our customers, ourbusiness and results of operations could be materially and adversely affected.
Omni-channel retailing is rapidly evolving, and we must keep pace with changing customer expectations andnew developments by our competitors. Our customers are increasingly using computers, tablets, mobile phones,and other devices to shop online. As part of our omni-channel strategy, we are making technology investments. Ifwe are unable to make, improve, or develop relevant customer-facing technology in a timely manner, our abilityto compete and our business and results of operations could be materially and adversely affected. In addition, ifour e-commerce businesses or our other customer-facing technology systems do not function as designed, wemay experience a loss of customer confidence, lost sales, or data security breaches, any of which could materiallyand adversely affect our business and results of operations.
We have significant lease obligations, which may require us to continue paying rent for store locations that weno longer operate.
Our stores are leased. We are subject to risks associated with our current and future real estate leases. Our costscould increase because of changes in the real estate markets and supply or demand for real estate sites. Wegenerally cannot cancel our leases, so if we decide to close or relocate a location, we may nonetheless becommitted to perform our obligations under the applicable lease including paying the base rent for the remaininglease term. As each lease expires, we may fail to negotiate renewals, either on commercially acceptable terms orany terms at all and may not be able to find replacement locations that will provide for the same success ascurrent store locations. Of the current leases for our stores, 36 expire in Fiscal 2016, 58 expire in Fiscal 2017, 99expire in Fiscal 2018, 104 expire in Fiscal 2019, 95 expire in Fiscal 2020 and the balance expire in Fiscal 2021 orthereafter.
Our international operations may result in additional market risks, which may harm our business.
As of December 26, 2015, we had 4 international franchise stores in Panama and 1 in Guatemala, and alsodistribute products to other countries and manufacture products for third parties in other countries. In addition, ifthe opportunity arises, we may expand our operations into new and high-growth international markets. However,we are subject to risks associated with international operations, including but not limited to: (i) fluctuations incurrency exchange rates; (ii) changes in international staffing and employment issues; (iii) tariff and other tradebarriers; (iv) greater difficulty in using and enforcing our intellectual property rights; (v) failure to understand thelocal culture and market; (vi) inconsistent product regulation or sudden policy changes by foreign agencies orgovernments; (vii) compliance with U.S. laws applicable to international operations, including the Foreign
23

Corrupt Practices Act and regulations promulgated by the Office of Foreign Asset Control; (viii) compliancewith foreign laws, including tax laws and financial accounting standards; and (ix) political and economicinstability and developments. Any of these risks could have a material adverse effect on our internationaloperations and our growth strategy.
In addition, there is no assurance that we will expand our operations in new international markets. To expand ouroperations into new international markets, we may enter into business combination transactions, makeacquisitions or enter into strategic partnerships, joint ventures or alliances, any of which may be material. Wemay enter into these transactions to acquire other businesses or products to expand our products or takeadvantage of new developments and potential changes in the industry. Our lack of experience operating in newinternational markets and our lack of familiarity with local economic, political and regulatory systems couldprevent us from achieving the results that we expect on our anticipated time frame or at all. If we areunsuccessful in expanding into new or high-growth international markets, it could adversely affect our operatingresults and financial condition.
Legal and Regulatory Risks
We may incur material product liability claims, which could increase our costs and adversely affect ourreputation with our customers, which in turn could materially adversely affect our business, financialcondition and results of operations.
As a retailer, direct marketer and manufacturer of products designed for human consumption, we are subject toproduct liability claims if the use of our products or the products that we manufacture for third parties is allegedto have resulted in injury or to include inadequate instructions for use or inadequate warnings concerningpossible side effects and interactions with other substances. Most of our products and the products that wemanufacture for third parties are vitamins, minerals, herbs and other ingredients that are classified as foods ordietary supplements and are not subject to pre-market regulatory approval in the U. S. Our products or theproducts that we manufacture for third parties could contain contaminated substances, and some of our productsand the products that we manufacture for third parties contain ingredients that do not have long histories ofhuman consumption. Previously unknown adverse reactions resulting from human consumption of theseingredients could occur. In addition, third-party manufacturers produce many of the products we sell. We rely onthese manufacturers to ensure the integrity of their ingredients and formulations. As a distributor of productsmanufactured by third parties, we may also be liable for various product liability claims for products we do notmanufacture. While we attempt to manage these risks by obtaining indemnification agreements from themanufacturers of products that we sell (other than our own branded products) and insurance, third parties maynot satisfy their indemnification obligations to us and/or our insurance policies may not be sufficient or available.A product liability claim against us, whether with respect to products of a third party that we sell, our brandedproducts or products that we manufacture for third parties, could result in increased costs and could adverselyaffect our reputation with our customers, which in turn could materially adversely affect our business, financialcondition and results of operations.
We may not be able to obtain insurance coverage in the future at current rates, or we may experienceunfavorable claims.
While we believe we will be able to obtain liability insurance in the future, because of increased selectivity byinsurance providers we may only be able to obtain such insurance at increased rates and/or with reducedcoverage levels. Additionally, we may experience unfavorable claims. Changes in insurance rates, reducedcoverage levels, or unfavorable claims could reduce our income from operations.
24

Compliance with governmental regulations could increase our costs significantly and adversely affect ouroperating income.
The processing, formulation, manufacturing, packaging, labeling, advertising and distribution of our productsand the products that we manufacture for third parties are subject to federal laws and regulation by one or morefederal agencies, including the FDA, the FTC, the USDA and the EPA. These activities are also regulated byvarious state, local and international laws and agencies of the states and localities in which our products and theproducts that we manufacture for third parties are sold. Regulations may prevent or delay the introduction, orrequire the reformulation, of our products or the products that we manufacture for third parties, which couldresult in lost sales and increased costs to us. A regulatory agency may not accept the evidence of safety for anynew ingredients that we may want to market, may determine that a particular product or product ingredientpresents an unacceptable health risk, may determine that a particular statement of nutritional support on ourproducts or that parties use on the products we manufacture for them, or that we want to use on our products orthat third parties want to use on the products we manufacture for them, is an unacceptable drug claim or anunauthorized version of a food “health claim.” A regulatory agency may determine that particular claims are notadequately supported by available scientific evidence. Any such regulatory determination would prevent us orthird parties, as applicable, from marketing particular products or using certain statements on those products, orforce us to recall a particular product, which could adversely affect our sales of those products
We are subject to environmental, health and safety laws and regulations, which could subject us to liabilities,increase our costs or restrict our operations in the future.
Our operations are subject to a variety of environmental, health and safety laws and regulations in each of thejurisdictions in which we operate. These laws and regulations govern, among other things, air emissions,wastewater discharges, the handling and disposal of hazardous substances and wastes, soil and groundwatercontamination and employee health and safety. We are also subject to laws and regulations governing thehandling and disposal of raw materials, non-compliant products and waste, the handling of regulated materialthat is included in our products or products that we manufacture for third parties and the disposal of products atthe end of their useful life. These laws and regulations have increasingly become more stringent, and we mayincur additional expenses to ensure compliance with existing or new requirements in the future. Any failure by usto comply with environmental, health and safety requirements could result in the limitation or suspension of ouroperations, including operations at our manufacturing facility. We also could incur monetary fines, civil orcriminal sanctions, third-party claims or cleanup or other costs as a result of violations of or liabilities under suchrequirements. In addition, compliance with environmental, health and safety requirements could restrict ourability to expand our facilities or require us to acquire costly pollution control equipment, incur other significantexpenses or modify our manufacturing processes.
Our manufacturing facilities use, store and dispose of hazardous substances in connection with the manufacturingprocesses. It is possible that these facilities may expose us to environmental liabilities associated with historicalsite conditions that have not yet been discovered. Some environmental laws impose liability for contamination oncurrent and former owners and operators of affected sites, regardless of fault. If remediation costs or potentialclaims for personal injury or property or natural resource damages resulting from contamination arise, they maybe material and may not be recoverable under any contractual indemnity or otherwise from prior owners oroperators or any insurance policy. Additionally, we may not be able to successfully enforce any such indemnityor insurance policy in the future. In the event that new or previously unknown contamination is discovered ornew cleanup obligations are otherwise imposed at any of our currently or previously owned or operated facilities,we may be required to take additional, unplanned remedial measures and record charges for which no reserveshave been recorded.
25

Congress and/or regulatory agencies may impose additional laws or regulations or change current laws orregulations, and state attorneys general may increase enforcement of existing or new laws, and compliancewith new or changed governmental regulations, or any state attorney proceeding, could increase our costssignificantly and materially and adversely affect our business, financial condition and results of operations.
From time to time, Congress, the FDA, the FTC, or other federal, state, local or foreign legislative and regulatoryauthorities may impose additional laws or regulations that apply to us, repeal laws or regulations that we considerfavorable to us or impose more stringent interpretations of current laws or regulations. We are not able to predictthe nature of such future laws, regulations, repeals or interpretations or to predict the effect that additionalgovernmental regulation, when and if it occurs, would have on our business in the future. Those developmentscould require reformulation of certain products to meet new standards, recalls or discontinuance of certainproducts (including products that we sell and products that we manufacture for third parties) not able to bereformulated, additional record-keeping requirements, increased documentation of the properties of certainproducts, additional or different labeling, additional scientific substantiation, adverse event reporting or othernew requirements. Any developments of this nature could increase our costs significantly and could have amaterial adverse effect on our business, financial condition and results of operations.
On July 5, 2011, the FDA issued draft guidance governing the notification of new dietary ingredients (“NDIs”).We believe that the draft guidance, if implemented as proposed, would have a material impact on our operations.FDA enforcement of the NDI guidance as written could require us to incur additional expenses, which could besignificant, and negatively affect our business in several ways, including, but not limited to, the detention andrefusal of admission of imported products, the injunction of manufacturing of any dietary ingredients or dietarysupplements until the FDA determines that those ingredients or products are in compliance, and the potentialimposition of penalties for non-compliance.
Our failure to comply with FTC regulations could result in substantial monetary penalties and could adverselyaffect our operating results.
The FTC exercises jurisdiction over the advertising of dietary supplements and has instituted numerousenforcement actions against dietary supplement companies, including us, for failure to have adequatesubstantiation for claims made in advertising or for the use of false or misleading advertising claims. Failure byus to comply with applicable regulations could result in substantial monetary penalties, which could have amaterial adverse effect on our financial condition or results of operations.
We may be subject to intellectual property litigation and infringement claims by others.
We may be subject to intellectual property litigation and infringement claims initiated by others, othercompetitors or entities may assert rights in, or ownership of, our trademarks and other intellectual property rightsor in marks that are similar to ours, and we may not be able to successfully resolve these types of conflicts to oursatisfaction. Claims and litigation of this nature could cause us to incur significant expenses or prevent us frommanufacturing, selling or using some of our products or the products that we manufacture for third parties, whichcould, in turn, adversely affect our sales and profitability.
Changes in accounting standards and estimates could have a material adverse effect on our results ofoperations and financial position.
Generally accepted accounting principles and the related authoritative guidance for many aspects of our business,including revenue recognition, inventories, goodwill and intangible assets, leases, income taxes and stock-basedcompensation, are complex and involve subjective judgments. Changes in these rules or changes in theunderlying estimates, assumptions or judgments by our management could have a material adverse effect on ourresults of operations. For example, proposed authoritative guidance for lease accounting, once finalized andenacted, could have a material adverse effect on our results of operations and financial position.
26

The accounting method for our convertible debt securities that may be settled in cash could have a materialeffect on our reported financial results.
In May 2008, the Financial Accounting Standards Board, which we refer to as FASB, issued FASB Staff PositionNo. APB 14-1, Accounting for Convertible Debt Instruments That May Be Settled in Cash Upon Conversion(Including Partial Cash Settlement), which has subsequently been codified as Accounting Standards Codification470-20, Debt with Conversion and Other Options, which we refer to as ASC 470-20. Under ASC 470-20, anentity must separately account for the liability and equity components of the convertible debt instruments(including our Convertible Notes) that may be settled entirely or partially in cash upon conversion in a mannerthat reflects the Company’s economic interest cost. The effect of ASC 470-20 on the accounting for theConvertible Notes is that the equity component is required to be included in the additional paid-in capital sectionof stockholders’ equity on our consolidated balance sheet, and the value of the equity component would betreated as original issue discount for purposes of accounting for the debt component of the Convertible Notes. Asa result, we are required to record a greater amount of non-cash interest expense in current periods presented as aresult of the amortization of the discounted carrying value of the Convertible Notes to their face amount over theterm of the Convertible Notes. We report lower net income in our financial results because ASC 470-20 requiresinterest to include both the current period’s amortization of the debt discount and the instrument’s couponinterest, which could adversely affect our reported or future financial results and the trading price of our commonstock.
In addition, under certain circumstances, convertible debt instruments (including the Convertible Notes) that maybe settled entirely or partly in cash are currently accounted for utilizing the treasury stock method, the effect ofwhich is that the shares issuable upon conversion of the Convertible Notes are not included in the calculation ofdiluted earnings per share except to the extent that the conversion value of the Convertible Notes exceeds theirprincipal amount. Under the treasury stock method, for diluted earnings per share purposes, the transaction isaccounted for as if the number of shares of common stock that would be necessary to settle such excess, if weelected to settle such excess in shares, are issued. We cannot be sure that the accounting standards in the futurewill continue to permit the use of the treasury stock method. If we are unable to use the treasury stock method inaccounting for the shares issuable upon conversion of the Convertible Notes, then our diluted earnings per sharewould be adversely affected.
Risks Related to our Capital Structure
Our debt, and potential future additional indebtedness, could adversely affect our results of operations andfinancial condition and otherwise adversely impact our operating income and growth prospects.
As of December 26, 2015, our total consolidated indebtedness was $123.5 million, consisting of borrowingsunder our Convertible Senior Notes and our credit facility.
Our current and potential future debt financing could:
• increase our vulnerability to general adverse economic, industry and competitive conditions;
• require us to dedicate a substantial portion of our cash flow from operations to payments on ourindebtedness, thereby reducing the availability of our cash flow to fund working capital, new storegrowth and other capital expenditures, research and development efforts and other general corporatepurposes;
• limit our flexibility in planning for, or reacting to, changes in our business and the industry in which weoperate;
• place us at a competitive disadvantage compared to our competitors that have less debt; and
• limit our ability to borrow additional funds.
27

Restrictions in the agreements governing our existing and future indebtedness may prevent us from takingactions that we believe would be in the best interest of our business.
The agreements governing our existing indebtedness contain, and the agreements governing our futureindebtedness will likely contain, customary restrictions on us or our subsidiaries, including covenants that restrictus or our subsidiaries, as the case may be, from incurring additional indebtedness, granting liens on our assets,making investments, consolidating or merging with another business, selling or otherwise disposing of our assets,paying dividends and entering into transactions with our affiliates.
Our ability to comply with these covenants and other provisions of our Revolving Credit Facility may be affectedby changes in our operating and financial performance, changes in general business and economic conditions,adverse regulatory developments or other events beyond our control. The breach of any of these covenants couldresult in a default under our debt, which could cause those and other obligations to become immediately due andpayable. In addition, these restrictions may prevent us from taking actions that we believe would be in the bestinterest of our business and may make it difficult for us to successfully execute our business strategy oreffectively compete with companies that are not similarly restricted.
Our ability to continue to access credit on the terms previously obtained for the funding of our operations andcapital projects may be limited due to changes in credit markets.
In the past, the credit markets and the financial services industry have experienced disruption characterized bythe bankruptcy, failure, collapse or sale of various financial institutions, increased volatility in securities prices,diminished liquidity and credit availability and intervention from the U.S. and other governments. Continuedconcerns about the systemic impact of potential long-term or widespread downturn, energy costs, geopoliticalissues, the availability and cost of credit, the global commercial and residential real estate markets and relatedmortgage markets and reduced consumer confidence have contributed to increased market volatility. The costand availability of credit has been and may continue to be adversely affected by these conditions. We cannot becertain that funding for our capital needs will be available from our existing financial institutions and the creditmarkets if needed, and if available, to the extent required and on acceptable terms. The Revolving Credit Facilitymatures in 2018, and the Convertible Notes mature in 2020. If we cannot renew or refinance this facility and ournotes upon their maturities or, more generally, obtain funding when needed, in each case on acceptable terms, wemay be unable to continue our current rate of growth and store expansion, which may have an adverse effect onour revenues and results of operations.
Servicing our debt requires a significant amount of cash, and we may not have sufficient cash flow from ourbusiness to pay our substantial debt.
Our ability to make scheduled payments of the principal of, to pay interest on or to refinance our indebtedness,including the Convertible Notes, depends on our future performance, which is subject to economic, financial,competitive and other factors beyond our control. Our business may not continue to generate cash flow fromoperations in the future sufficient to service our debt and make necessary capital expenditures. If we are unableto generate such cash flow, we may be required to adopt one or more alternatives, such as selling assets,restructuring debt or obtaining additional equity capital on terms that may be onerous or highly dilutive. Ourability to refinance our indebtedness will depend on the capital markets and our financial condition at such time.We may not be able to engage in any of these activities or engage in these activities on desirable terms, whichcould result in a default on our debt obligations.
Despite our current debt levels, we may still incur substantially more debt or take other actions which wouldintensify the risks discussed above.
Despite our current consolidated debt levels, we and our subsidiaries may be able to incur substantial additionaldebt in the future, subject to the restrictions contained in Revolving Credit Facility. We will not be restrictedunder the terms of the indenture governing the Convertible Notes from incurring additional debt, securing
28

existing or future debt, recapitalizing our debt or taking a number of other actions that are not limited by theterms of the indenture governing the Convertible Notes. Our Revolving Credit Facility restricts our ability toincur additional indebtedness, including secured indebtedness, but if the facility matures or is repaid, we may notbe subject to such restrictions under the terms of any subsequent indebtedness.
In December 2015, we issued $143.8 million of 2.25% Convertible Senior Notes due 2020, which could diluteour existing stockholders’ equity and lower our reported earnings per share.
We issued $143.8 million of indebtedness in December 2015 in the form of 2.25% Convertible Senior Notes due2020. The issuance of the Convertible Notes substantially increased our principal payment obligations. Theholders of the Convertible Notes are entitled to convert the Convertible Notes into shares of our common stockunder certain circumstances which would dilute our existing stockholders and lower our reported per shareearnings.
In addition, in the event the conditional conversion feature of the Convertible Notes is triggered, holders ofConvertible Notes will be entitled to convert the Convertible Notes at any time during specified periods at theiroption. If one or more holders elect to convert their Convertible Notes, unless we elect to satisfy our conversionobligation by delivering solely shares of our common stock (other than paying cash in lieu of delivering anyfractional share), we would be required to settle a portion or all of our conversion obligation through the paymentof cash, which could adversely affect our liquidity. In addition, even if holders do not elect to convert theirConvertible Notes, we could be required under applicable accounting rules to reclassify all or a portion of theoutstanding principal of the Convertible Notes as a current rather than long-term liability, which would result in amaterial reduction of our net working capital.
The convertible notes hedge and warrant transactions we entered into in connection with the issuance of theConvertible Notes may affect the value of the Convertible Notes and our common stock.
In connection with the pricing of the Convertible Notes, we entered into convertible note hedge transactions withthe option counterparties. The convertible note hedge transactions are expected generally to reduce the potentialdilution upon conversion of the Convertible Notes and/or offset any cash payments we are required to make inexcess of the principal amount of converted Convertible Notes, as the case may be. We also entered into warranttransactions with the option counterparties. However, the warrant transactions could separately have a dilutiveeffect on our common stock to the extent that the market price per share of our common stock exceeds theapplicable strike price of the warrants.
In addition, the option counterparties or their respective affiliates may modify their hedge positions by enteringinto or unwinding various derivatives with respect to our common stock and/or purchasing or selling ourcommon stock or other securities of ours in secondary market transactions prior to the maturity of theConvertible Notes (and are likely to do so during any observation period related to a conversion of theConvertible Notes). This activity could also cause or avoid an increase or a decrease in the market price of ourcommon stock or the Convertible Notes, which could affect the noteholders’ ability to convert the ConvertibleNotes and, to the extent the activity occurs during any observation period related to a conversion of theConvertible Notes, it could affect the number of shares and value of the consideration that the holders willreceive upon conversion of the Convertible Notes.
In addition, if any such convertible note hedge and warrant transactions fail to become effective, the optioncounterparties may unwind their hedge positions with respect to our common stock, which could adversely affectthe value of our common stock and the value of the Convertible Notes.
29

Hedging instruments often involve counterparty risks.
We will be subject to risk with respect to our counterparties to the convertible notes hedge transactions.Counterparty risk is the risk that the other party in a derivative transaction will not fulfill its contractualobligation. Changes in the credit quality of our counterparties with respect to their derivative transactions mayaffect the value of those instruments. By entering into derivatives, we assume the risk that these counterpartiescould experience financial hardships that could call into question their continued ability to perform theirobligations.
If a counterparty becomes bankrupt or otherwise fails to perform its obligations under a derivative contract due tofinancial difficulties, it is likely to result in a default under such derivative contract, unless such default is cured.Default by a party with whom we enter into a hedging transaction may result in the loss of unrealized profits,leaving us with unsecured exposure and force us to cover our resale commitments, if any, at the then currentmarket price. It may not always be possible to dispose of or close out a hedging position without the consent ofthe hedging counterparty, and we may not be able to enter into an offsetting contract in order to cover our risk.We cannot assure our shareholders that a liquid secondary market will exist for hedging instruments purchased orsold, and we may be required to maintain a position until exercise or expiration, which could result in losses.
Furthermore, upon the bankruptcy of a counterparty, we may experience significant delays in obtaining anyrecovery under the derivative contract in a dissolution, assignment for the benefit of creditors, liquidation,winding-up, bankruptcy, or other analogous proceeding. In addition, in the event of the insolvency of acounterparty to a derivative transaction, the derivative transaction would typically be terminated at its fair marketvalue. If we are owed this fair market value in the termination of the derivative transaction and these claims areunsecured, we will be treated as general creditors of such counterparty, and will not have any claim with respectto the underlying security. We may obtain only a limited recovery or may obtain no recovery in suchcircumstances and the enforceability of agreements for hedging transactions may depend on compliance withapplicable statutory and other regulatory requirements and, depending on the identity of the counterparty,applicable international requirements.
Our failure to meet market expectations could adversely affect the market price and volatility of our stock.
We believe that the price of our stock generally reflects market expectations for our future operating results. Anyfailure to meet, or delay in meeting, these expectations, including our comparable store sales growth rates, grossmargin, earnings and earnings per share or new store openings, could cause the market price of our stock todecline, as could changes in our stock repurchase policies.
Item 1B. Unresolved Staff Comments
None.
30

Item 2. Properties
As of December 26, 2015, there were 758 Vitamin Shoppe, Super Supplements and Vitapath retail stores open inthe United States, Puerto Rico and Ontario, Canada. See “Item 1—Business—Store Counts and Locations” foradditional information on the growth in our network of stores for Fiscal 2011 through 2015 and the location ofour stores as of December 26, 2015. As of December 26, 2015, we leased the property for all of our stores. Wedo not believe that any individual store property is material to our financial condition or results of operation,however, more highly populated geographic areas may have a higher concentration of store locations. Of theleases for our stores as of December 26, 2015, 36 expire in Fiscal 2016, 58 expire in Fiscal 2017, 99 expire inFiscal 2018, 104 expire in Fiscal 2019, 95 expire in Fiscal 2020 and the balance expire in Fiscal 2021 orthereafter. We have options to extend most of these leases for a minimum of five years.
Our leased properties also include the following:
Location DescriptionSquareFootage Lease Termination Year Renewal Options
North Bergen, NewJersey
Warehouse, DistributionCenter and Corporate
Offices
230,000 2017 One Five-YearRenewal Option
Ashland, Virginia Warehousing andDistribution Center
312,000 2028 Three Five-YearRenewal Options
Secaucus, New Jersey CorporateHeadquarters
56,000 2029 Two Five-YearRenewal Options
Seattle, Washington Warehousing andDistribution Center
60,000 2017 Two Five-YearRenewal Options
Miami Lakes, Florida ManufacturingFacilities
212,000 2016 and 2018 Three Five-YearRenewal Options
The Company intends to close its three stores in Ontario, Canada at the end of the first quarter of Fiscal 2016. Inaddition, we expect to close the Seattle, Washington distribution center in Fiscal 2016.
Additionally, the Company has entered into an agreement with a west coast third-party facility to provide us withwarehousing and distribution functions. We began operations with this third-party facility in the fourth quarter ofFiscal 2015.
We believe that all of our current facilities are in good condition.
Item 3. Legal Proceedings
The Company is party to various lawsuits arising from time to time in the normal course of business, many ofwhich are covered by insurance. As of December 26, 2015, the Company was not party to any material legalproceedings. Although the impact of the final resolution of these matters on the Company’s financial condition,results of operations or cash flows is not known, management does not believe that the resolution of theselawsuits will have a material adverse effect on the financial condition, results of operations or liquidity of theCompany.
Item 4. Mine Safety Disclosures
Not applicable.
31

PART II
Item 5. Market for Registrant’s Common Equity, Related Stockholder Matters and Issuer Purchases ofEquity Securities
Market Information
Since October 28, 2009, our common stock has been traded on the New York Stock Exchange (“NYSE”) underthe trading symbol “VSI”. At December 26, 2015, there were 25,873,581 common shares outstanding, and theclosing sale price of our common stock was $33.51. Also as of that date, we had approximately 183 commonshareholders of record. The table below sets forth the high and low sale prices of our common stock for theperiods indicated:
Fiscal period High Low
2015 Quarter ended:March $48.85 $39.64June 44.54 37.57September 38.87 32.73December 34.41 26.57
2014 Quarter ended:March $52.47 $40.57June 49.83 40.42September 46.78 36.90December 49.04 40.35
Issuer Purchases of Equity Securities
The following table summarizes the Company’s purchases of shares of common stock during the quarter endedDecember 26, 2015:
Period
Total Numberof Shares (or
Units)Purchased
(1)
Average PricePaid per Share
(or Unit)
Total Number ofShares (or Units)
Purchased as Part ofPublicly AnnouncedPlans or Programs
(2)
Maximum Number (orApproximate DollarValue) of Shares (or
Units) that May Yet BePurchased Under the
Plans or Programs(in thousands)
(2)
September 27, 2015 through October 24, 2015 — $ — — $104,221October 25, 2015 through November 21, 2015 201,717 $31.00 201,637 $ 97,970November 22, 2015 through December 26, 2015 3,057,823 $33.33 3,056,740 $ 96,078
Totals 3,259,540 3,258,377
(1) Includes 1,163 shares withheld to cover required tax payments on behalf of employees as their restrictedshares vest.
(2) On August 5, 2014, May 6, 2015 and November 23, 2015, the Company’s board of directors approved sharerepurchase programs that enable the Company to purchase up to an aggregate of $300 million of its sharesof common stock from time to time over three year periods ending on August 4, 2017, May 5, 2018 andNovember 22, 2018, respectively.
32

Stock Performance Graph
The line graph below compares the cumulative total stockholder return on the Company’s common stock withthe Russell 2000 Index (RUT), S&P Retail Index (SPXRT) and the NYSE Composite Index (NYA) for the fiveyear period from December 25, 2010 through December 26, 2015. The graph assumes an investment of $100made at the closing of trading on December 23, 2010, in (i) the Company’s common stock, (ii) the stockscomprising the RUT, (iii) the stocks comprising the SPXRT and (iv) the stocks comprising the NYA. All valuesassume reinvestment of the full amount of all dividends, if any, into additional shares of the same class of equitysecurities at the frequency with which dividends are paid on those securities during the applicable time period.
12/25/2010 12/31/2011 12/29/2012 12/28/2013 12/27/2014 12/26/2015
50
100
150
200
250
300
VSI RUT SPXRT NYA
12/25/2010 12/31/2011 12/29/2012 12/28/2013 12/27/2014 12/26/2015
Vitamin Shoppe, Inc. 100.00 118.20 165.92 152.46 139.80 99.32Russell 2000 Index 100.00 93.91 105.47 147.17 154.03 146.36S&P Retail Index 100.00 102.22 124.95 182.52 200.64 250.37NYSE Composite Index 100.00 94.34 104.93 130.63 138.61 129.44
This graph and the accompanying table are not “soliciting material”, are not deemed filed with the Securities andExchange Commission and are not to be incorporated by reference in any filing by us under the Securities Act of1933, as amended, or the Securities Exchange Act of 1934, as amended, whether made before or after the datehereof and irrespective of any general incorporation language in any such filing.
Share Repurchase Programs
On August 5, 2014, May 6, 2015 and November 23, 2015, the Company’s board of directors approved sharerepurchase programs that enable the Company to purchase up to an aggregate of $300 million of its shares ofcommon stock from time to time over three year periods ending on August 4, 2017, May 5, 2018 andNovember 22, 2018, respectively. As of December 26, 2015, 5,511,769 shares have been repurchased for a totalof $203.9 million. The shares were retired upon repurchase. For additional information, refer to Note 11., “ShareRepurchase Program”, to our consolidated financial statements included in this Annual Report on Form 10-K.
33

Dividends
We have not paid cash dividends on our common stock and we do not anticipate paying any cash dividends in theforeseeable future.
Item 6. Selected Financial Data
We have derived the selected financial data presented below from our consolidated financial statements for theFiscal Years ended December 26, 2015, December 27, 2014, December 28, 2013, December 29, 2012and December 31, 2011. Financial results for all fiscal years presented are based on a 52-week period, with theexception of financial results for the Fiscal Year ended December 31, 2011 which are based on a 53-week period,unless otherwise stated. The selected financial data for the Fiscal Years ended December 26, 2015, December 27,2014 and December 28, 2013 presented below, should be read in conjunction with such consolidated financialstatements and notes included herein and in conjunction with Item 7., “Management’s Discussion and Analysis ofFinancial Condition and Results of Operations”.
Fiscal Year Ended
December 26,2015
December 27,2014
December 28,2013
December 29,2012
December 31,2011
(data presented in thousands, except for share, per share data,number of stores and average store square footage)
Statement of Operations Data:Net sales $ 1,266,549 $ 1,213,046 $ 1,087,469 $ 950,902 $ 856,586Cost of goods sold 847,634 808,787 709,823 617,920 563,627
Gross profit 418,915 404,259 377,646 332,982 292,959Selling, general and administrative expenses 329,922 301,603 267,354 233,610 216,125
Income from operations 88,993 102,656 110,292 99,372 76,834Loss on extinguishment of debt and other (1) — — — — 635Interest expense, net 1,105 495 495 659 2,325
Income before provision for income taxes 87,888 102,161 109,797 98,713 73,874Provision for income taxes 34,717 40,920 43,251 37,888 29,010
Net income $ 53,171 $ 61,241 $ 66,546 $ 60,825 $ 44,864
Weighted average shares outstanding:Basic 28,954,804 30,239,183 29,992,620 29,473,711 28,802,103Diluted 29,203,429 30,664,105 30,541,057 30,110,237 29,556,024
Net income per share:Basic $ 1.84 $ 2.03 $ 2.22 $ 2.06 $ 1.56Diluted $ 1.82 $ 2.00 $ 2.18 $ 2.02 $ 1.52
Other Financial Data:Depreciation and amortization of fixed and intangible
assets $ 38,495 $ 34,219 $ 28,026 $ 23,076 $ 20,300Acquisition and integration related costs (2) $ 1,874 $ 10,242 $ 4,336 $ 1,281 $ —
Operating Data:Number of stores at end of period 758 717 659 579 528Total retail square feet at end of period 2,662 2,568 2,390 2,130 1,969Average store square footage at end of period 3,511 3,582 3,627 3,679 3,730Net sales per store (3) $ 1,426 $ 1,453 $ 1,471 $ 1,468 $ 1,451Comparable store sales growth (4) 0.1% 2.8% 3.5% 8.2% 7.4%E-commerce sales growth (5) -0.6% 12.0% 19.4% 16.4% 11.3%
Balance Sheet Data:Working capital $ 157,089 $ 125,382 $ 172,341 $ 153,453 $ 69,343Total assets 748,691 722,391 682,064 586,285 487,830Total debt, including capital lease obligations 123,525 8,195 347 168 956Stockholders’ equity 475,301 551,934 528,340 447,418 355,803
(1) For Fiscal 2011, loss on extinguishment of debt includes $0.6 million for the write-off of unamortized deferred financing feesrelated to the repurchase of the remaining portion of our floating rate notes in February 2011 and $0.1 million for the write-offof unamortized deferred financing fees related to the early termination of our term loan in October 2011.
34

(2) For Fiscal 2015, these amounts represent costs incurred related to the integration of Nutri-Force. In Fiscal 2014, these amountsrelated to acquisition costs of $3.4 million and integration costs of $1.4 million ($0.6 million for Nutri-Force and $0.8 millionfor Super Supplements), charges to cost of goods sold for the inventory valuation step-up of $4.5 million and the contingentconsideration adjustment for the Nutri-Force acquisition of $1.0 million. In Fiscal 2013 and 2012, these amounts represent costsincurred related to the acquisition and integration of Super Supplements.
(3) Net sales per store are calculated by dividing retail net sales by the number of stores open at the end of the period.(4) A new retail store is included in comparable store sales after 410 days of operation, and acquired retail stores from the Super
Supplements acquisition are included in comparable store sales after 365 days. For Fiscal 2011, comparable store sales growth isbased on a 52-week period.
(5) E-commerce sales growth is based on a 52-week period. Fiscal 2015, Fiscal 2014 and Fiscal 2013 sales growth includes sales ofthe acquired Super Supplements e-commerce business.
For additional information on certain costs included in our operating results, refer to Note 17., “SelectedQuarterly Financial Information (unaudited)” to our consolidated financial statements included in this AnnualReport on Form 10-K.
35

Item 7. Management’s Discussion and Analysis of Financial Condition and Results of Operations
The following Management’s Discussion and Analysis of Financial Condition and Results of Operations shouldbe read in conjunction with the consolidated financial statements and notes thereto included as part of thisAnnual Report on Form 10-K. The discussion in this section contains forward-looking statements that are basedupon current information and expectations. We sometimes identify forward-looking statements with such wordsas “may”, “expect”, “intend”, “anticipate”, “plan”, “believe”, “seek”, “should”, “estimate”, “outlook”,“trends”, “future benefits”, “strategies”, “goals” and similar words. The forward-looking statements containedherein, include, without limitation, statements concerning future revenue sources and concentration, gross profitmargins, selling and marketing expenses, general and administrative expenses, capital resources, liquidity,capital expenditures, new stores, integration of acquisitions, retail inflation, additional financings or borrowingsand are subject to risks and uncertainties including, but not limited to, those discussed below and elsewhere inthis Annual Report on Form 10-K that could cause actual results to differ materially from the resultscontemplated by these forward-looking statements. We also urge you to carefully review the risk factors set forthin Item 1A. – “Risk Factors”. See also “Forward-Looking Statements” for additional information regardingforward-looking statements.
References to “Fiscal” or “Fiscal Year” mean the fifty-two weeks ended December 26, 2015, December 27,2014 and December 28, 2013 for Fiscal Year 2015, Fiscal Year 2014 and Fiscal Year 2013, respectively.
Overview
We are a multi-channel specialty retailer and contract manufacturer of vitamins, minerals, herbs, specialtysupplements, sports nutrition and other health and wellness products. We market approximately 800 nationallyrecognized brands as well as our own brands, which include Vitamin Shoppe®, BodyTech®, True Athlete®,Mytrition®, plnt®, ProBioCare™ , Next Step®, Nutri-Force® Sport and Betancourt Nutrition™. We believe weoffer one of the largest varieties of products among VMS retailers with approximately 7,400 SKUs offered in ourtypical store and approximately 12,000 additional SKUs available through our e-commerce and other direct saleschannels. Our broad product offering enables us to provide our customers with a depth of selection of productsthat may not be readily available at other specialty retailers or mass merchants, such as discount stores,supermarkets, drugstores and wholesale clubs. We believe our product offering and emphasis on productknowledge and customer service helps us meet the needs of our target customer and serves as a foundation forenhancing strong customer loyalty.
During the second quarter of Fiscal 2015, the Company began development of a strategic plan focused onupgrading our customers’ experience across our retail and e-commerce channels, the “reinvention strategy”. TheCompany has worked with outside consultants to analyze qualitative and quantitative information relevant to ourcustomers’ experience. The reinvention strategy is focused on upgrading the customer experience to inspire ourtarget customers with changes to our product assortment, opportunities to increase private brands penetration,enhancements to the in-store and digital experience, store layout, as well as changes to improve the effectivenessof our loyalty program. In Fiscal 2015, the Company incurred $2.7 million of professional fees related to thedevelopment of the reinvention strategy. The Company expects to incur approximately $10.0 million to $15.0million of selling, general and administrative costs during Fiscal 2016 in connection with the reinventionstrategy, and expects to realize improved financial results from the reinvention strategy beginning in Fiscal 2017.
In an on-going effort to identify efficiencies and stream-line processes, the Company has performed a review ofcertain business operations. As part of this review, the Company is implementing changes to the productassortment and supply chain operations of Super Supplements to more closely align Super Supplements withcurrent processes and assortments in the Vitamin Shoppe retail stores. As a result, costs of $1.8 million wereincurred during the fourth quarter of Fiscal 2015 and $1.8 million are expected to be incurred during the firstquarter of Fiscal 2016. Annual cost savings resulting from these actions are estimated to be $1 million to $2million. In addition, the Company has evaluated its Canadian operations in order to determine whether tocontinue investments in the Canadian market and has decided to cease operations at the end of the first quarter of
36

Fiscal 2016. As a result, costs of $0.9 million were incurred during the fourth quarter of Fiscal 2015 and $3.7million are expected to be incurred during the first quarter of Fiscal 2016. The annual cost savings related toceasing operations in Canada are estimated to be approximately $1.0 million. Costs for these two initiativesinclude lease liabilities, markdown charges on inventory and employee severance. The Company plans onengaging a consultant in Fiscal 2016 to further identify other efficiencies and cost reduction opportunities.
On December 9, 2015, the Company completed an offering of $143.8 million of its 2.25% Convertible SeniorNotes due 2020 (the “Convertible Notes”). The Convertible Notes are senior unsecured obligations of theCompany. Interest is payable on the Notes on June 1 and December 1 of each year, commencing on June 1, 2016until their maturity date of December 1, 2020. In connection with the issuance of the Convertible Notes, theCompany entered into convertible note hedge transactions for which it paid an aggregate $26.4 million. Inaddition, the Company sold warrants for which it received aggregate proceeds of $13.0 million. The net proceedsfrom the Convertible Notes of $125.7 million, net of commissions and offering costs of $4.6 million, are beingused to repurchase shares of our common stock under the Company’s share repurchase programs. For additionalinformation, refer to Note 8., “Credit Arrangements” and Note 11., “Share Repurchase Programs” to ourconsolidated financial statements included in this Annual Report on Form 10-K.
On August 5, 2014, May 6, 2015 and November 23, 2015, the Company’s board of directors approved sharerepurchase programs that enable the Company to purchase up to an aggregate of $300 million of its shares ofcommon stock from time to time over three year periods ending on August 4, 2017, May 5, 2018 andNovember 22, 2018, respectively. As of December 26, 2015, 5,511,769 shares have been repurchased for a totalof $203.9 million. The shares were retired upon repurchase. For additional information, refer to Note 11., “ShareRepurchase Program”, to our consolidated financial statements included in this Annual Report on Form 10-K.
On June 6, 2014, the Company acquired all of the outstanding equity interests of Nutri-Force, a company whichprovides custom manufacturing and private labeling of vitamins, dietary supplements, nutraceuticals andnutritional supplements, as well as, develops and markets its own branded products. The total purchase price was$86.1 million in cash. For additional information, refer to Note 3., “Acquisitions”, to our consolidated financialstatements included in this Annual Report on Form 10-K. During Fiscal 2015, we incurred $1.9 million ofintegration costs primarily related to professional fees. We do not anticipate incurring additional costs related tothe integration of Nutri-Force. In addition, we incurred a $1.4 million charge in Fiscal 2015 to increase theallowance for doubtful accounts for Nutri-Force, related to one wholesale customer that abruptly ceasedoperations.
On February 14, 2013, the Company acquired substantially all of the assets and assumed certain liabilities ofSuper Supplements, a specialty retailer of vitamins, minerals, specialty supplements and sports nutrition,including 31 retail locations, a distribution center and an e-commerce business in the Pacific Northwest. The totalpurchase price was $50.5 million in cash and the assumption of certain liabilities. For additional information,refer to Note 3., “Acquisitions”, to our consolidated financial statements included in this Annual Report on Form10-K. We do not anticipate incurring significant additional costs related to the integration of Super Supplements,however, we continue to evaluate further integration initiatives.
Trends and Other Factors Affecting Our Business
The Company initiated a reinvention strategy in Fiscal 2015 which includes a comprehensive review of thecustomer experience. This work is expected to continue into Fiscal 2016. The results of this work includeinitiatives to optimize the product assortment, integration of technology and e-commerce, the layout and designof the retail store and the service levels provided by the Health Enthusiast. The implementation of theseinitiatives may require incremental costs or investments to be incurred in Fiscal 2016 and subsequent years.
Our performance is affected by industry trends including, among others, demographic, health and lifestylepreferences, as well as other factors, such as industry media coverage and governmental actions. For example,our industry is subject to potential regulatory activity and other legal matters that could affect the credibility of a
37

given product or category of products. Consumer trends, such as those described in the following paragraph, theoverall impact on consumer spending, which may be affected heavily by current economic conditions, andlimited product innovation and introductions in the VMS industry can dramatically affect purchasing patterns.Even though our business model allows us to respond to changing industry trends by introducing new productsand adjusting our product mix and sales incentives, such actions may not offset adverse trends. Additionally, ourperformance is affected by competitive trends such as the entry of new competitors, changes in promotionalstrategies or expansion of product assortment by various competitors.
Sales of weight management products are generally more sensitive to consumer trends, such as increased demandfor products recommended by the media, resulting in higher volatility than our other products. Due to thevolatility of the weight management sector, we typically launch new weight management products on an ongoingbasis in response to prevailing market conditions and consumer demands. In Fiscal 2015, weight managementproduct sales declined significantly, whereas Fiscal 2014 weight management sales growth was relatively flat.This change in trend negatively impacted the overall sales growth rate for Fiscal 2015. We expect continuedvolatility in the demand for weight management products.
In addition to the weight management product lines, we intend to continue our focus in meeting the demands of arapidly growing health conscious public.
The acquisition of Nutri-Force has affected our operating results. Historically Nutri-Force generates lowermargins on its third-party sales than our retail and direct operations. However, as we transition more of the VSIprivate label assortment to Nutri-Force, we expect an improvement in overall gross margin. Since the acquisition,Nutri-Force has experienced disruption in its ability to optimize production capacity and correspondingly hasexperienced lower service levels to customers. We have taken steps to improve the operations at Nutri-Force,including the hiring of new leadership and the engagement of third-party manufacturing consultants to implementand improve manufacturing processes. The Company believes this disruption should not impact the long-termopportunity from the Nutri-Force acquisition. However, should financial performance deteriorate further orremain depressed for a prolonged period of time, estimates of future cash flows may be insufficient to support thecarrying value of goodwill and intangibles assigned to Nutri-Force, which may result in impairment charges.
Our historical results have also been significantly influenced by our new store openings. Since the beginning ofFiscal 2013, we have opened 163 stores, acquired 31 stores and as of December 26, 2015 operate 758 storeslocated in 45 states, the District of Columbia, Puerto Rico and Ontario, Canada.
New stores have typically required approximately four to five years to mature, generating lower store level salesin the initial years than our mature stores. As a result, new stores generally have a negative impact on our overalloperating margin. In addition, our new stores since the beginning of Fiscal 2013 are approximately 2,900 squarefeet compared to the average of our total store portfolio of approximately 3,500 square feet. Additionally, storesopened in new markets have lower brand awareness compared to stores in existing markets, and as a resultinitially experience a lower sales volume than stores opened in existing markets. As these stores mature, weexpect them to contribute meaningfully to our operating results.
In Fiscal 2015, the Company has begun implementation of a new warehouse management system application(“WMS”) at its Ashland, Virginia distribution center in order to realize further productivity improvements andfunctionality. Implementation of the new WMS is expected to be completed in Fiscal 2016. Additionally, theCompany has entered into an agreement with a west coast third-party facility (which replaced our previous westcoast third-party facility) to provide us with warehousing and distribution functions. We began operations withthis third-party facility in the fourth quarter of Fiscal 2015.
Critical Accounting Policies
The preparation of financial statements in conformity with accounting principles generally accepted in the UnitedStates of America requires management to make estimates and assumptions that affect the reported amounts ofassets and liabilities and disclosure of contingent assets and liabilities at the date of the financial statements, and
38

the reported amounts of revenue and expenses during the reporting period. Critical accounting policies are thosethat are the most important portrayal of our financial condition and results of operations, and require our mostdifficult, subjective and complex judgments as a result of the need to make estimates about the effect of mattersthat are inherently uncertain. While our significant accounting policies are described in more detail in the notes toour consolidated financial statements, our most critical accounting policies, discussed below, pertain to revenuerecognition, inventories, vendor allowances, impairment of long-lived assets, goodwill and other intangibleassets, deferred sales for our Healthy Awards Program, and income taxes. In applying such policies, we must usesome amounts that are based upon our informed judgments and best estimates. Estimates, by their nature, arebased on judgments and available information. The estimates that we make are based upon historical factors,current circumstances and the experience and judgment of management. We evaluate our assumptions andestimates on an ongoing basis.
Revenue Recognition. We recognize revenue upon sale of our products when merchandise is sold “at point ofsale” in retail stores or upon delivery to a direct customer. Wholesale revenue is recognized when risk of loss,title and insurable risks have transferred to the customer. All revenue is recognized net of sales returns. Inaddition, we classify amounts billed to customers that represent shipping fees as sales. To arrive at net sales,gross sales are reduced by deferred sales, customer discounts, actual customer returns, and a provision forestimated future customer returns, which is based on management’s review of historical and current customerreturns. Sales taxes collected from customers are presented on a net basis and as such are excluded from revenue.
Inventories. Inventories are stated at the lower of cost or market value. Cost is determined using the weightedaverage method. As applied to inventories, cost means in principle the sum of the applicable expenditures andcharges directly or indirectly incurred in bringing the product to its existing condition and location. Finishedgoods inventory includes costs on freight on internally transferred merchandise, and costs associated with ourbuying department, distribution facilities, and manufacturing overhead, which are capitalized into inventory andthen expensed as merchandise is sold. In addition, the cost of inventory is reduced by purchase discounts andother allowances received from certain of our vendors. We adjust our inventory to reflect situations in which thecost of inventory is not expected to be recovered. We regularly review our inventory, including when a product isclose to expiration and not expected to be sold, when a product has reached its expiration date, or when a productis not expected to be saleable. In determining the reserves for these products we consider factors such as theamount of inventory on hand and its remaining shelf life, and current and expected market conditions, includingmanagement forecasts and levels of competition. In addition, we have established a reserve for estimatedinventory shrinkage between physical inventories. Physical inventories and cycle counts are taken on a regularbasis, and inventory is adjusted accordingly. For each reporting period, we estimate inventory shrinkage based ona historical trend analysis. We have evaluated the current level of inventory considering historical trends andother factors, and based on our evaluation, have recorded adjustments to reflect inventory at net realizable value.These adjustments are estimates, which could vary significantly from actual results if future economicconditions, customer demand or competition differ from expectations. These estimates require us to makeassessments about the future demand for our products in order to identify such inventory items as slow moving,expiring, obsolete or in excess of need. These future estimates are subject to the ongoing accuracy ofmanagement’s forecasts of market conditions, industry trends and competition. We are also subject to volatilechanges in specific product demand as a result of unfavorable publicity, government regulation and rapidchanges in demand for new and improved products or services. Inventory reserves were $4.9 million and $3.1million at December 26, 2015 and December 27, 2014, respectively.
Vendor Allowances. Vendor allowances include discounts, allowances and rebates received from vendors andare based on various contract terms. Vendor allowances are recognized as either purchase discounts whichrepresent a reduction of product cost, funding which is capitalized into inventory and recognized in the statementof income as the merchandise is sold, or direct offset which represents funding subject to immediate recognitionin the statement of income, depending on the nature of the allowance.
Long-Lived Assets. We evaluate long-lived assets, including fixed assets and intangible assets with finite usefullives, periodically for impairment whenever events or changes in circumstances indicate that the carrying amount
39
of any such asset may not be recoverable. If the sum of our estimated undiscounted future cash flows is less thanthe asset’s carrying value, we recognize an impairment loss, measured as the amount by which the carrying valueexceeds the fair value of the asset. These estimates of cash flow require significant management judgment andcertain assumptions about future sales and expense growth rates, devaluation and inflation. As such, theseestimates may differ from actual cash flows. The Company recognized impairment charges of $1.2 millionduring Fiscal 2015 on fixed assets related to five of its underperforming retail locations still in use in theCompany’s operations and three retail locations in Ontario, Canada which the Company expects to close duringthe second quarter of Fiscal 2016. The Company recognized impairment charges of $0.4 million during Fiscal2014 on fixed assets related to three of its underperforming retail locations still in use in the Company’soperations. Impairment charges are included in selling, general and administrative expenses in the consolidatedstatements of income.
Goodwill and Other Intangible Assets. On an annual basis, or whenever impairment indicators exist, we perform anevaluation of goodwill and indefinite-lived intangible assets. In the absence of any impairment indicators, goodwilland other indefinite-lived intangible assets are tested in the fourth quarter of each fiscal year. With regards togoodwill, our evaluations are based on our three reporting units. The evaluations of goodwill and indefinite-livedintangible assets may first consider qualitative factors to determine whether the existence of events or circumstancesleads to a determination that it is more likely than not that the fair value of a reporting unit or indefinite-livedintangible asset is less than its carrying value. A quantitative evaluation is performed if the qualitative evaluationresults in a more likely than not determination or if a qualitative evaluation is not performed. Our quantitativeevaluation for goodwill utilizes the discounted cash flow method, based on operating projections, as well as themarket multiples method. For indefinite-lived tradenames, we utilize the royalty relief method in our quantitativeevaluations. For those intangible assets which have definite lives, we amortize their cost on a straight-line basis overtheir estimated useful lives, the periods of which vary based on their particular contractual terms.
Our annual impairment review requires extensive use of accounting judgment and financial estimates. Judgmentsregarding the existence of impairment indicators are based on market conditions and operational performance ofthe business. Future events could cause us to conclude that impairment indicators exist, and therefore thatgoodwill and other intangible assets may be impaired. The valuation of goodwill and indefinite-lived intangibleassets is affected by, among other things, our business plan for the future and estimated results of futureoperations. Changes in the business plan, operating results, or application of alternative assumptions that aredifferent than the estimates used to develop the valuation of the assets may materially impact their valuation.
In Fiscal 2015, the Company performed a quantitative analysis of its retail, direct and manufacturing reportingunits and determined that the fair value of these reporting units was greater than their respective carrying values.As a result, the Company believes the fair values of each of the Company’s reporting units and indefinite-livedtradenames substantially exceeds their respective carrying values, with the exception of the manufacturingreporting unit.
Since the acquisition, Nutri-Force has experienced disruption in its ability to optimize production capacity andcorrespondingly has experienced lower service levels to customers.
As of the annual testing date, the fair value of the manufacturing reporting unit exceeded the carrying value byapproximately 5%. Goodwill for the manufacturing reporting unit is $32.6 million. The assumptions whichimpact the estimated fair value include management projections, the weighted average cost of capital percentageincluding the company specific risk premium and the selection of comparable companies. The uncertaintyassociated with the key assumptions relates primarily to the performance of Nutri-Force in comparison tomanagement projections, which includes improvements in operating efficiencies, the ability to transitionadditional Vitamin Shoppe branded products and increase sales to third parties.
We have taken steps to improve the operations at Nutri-Force, including the hiring of new leadership and theengagement of third-party manufacturing consultants to implement and improve manufacturing processes. TheCompany believes the disruption noted above should not impact the long-term opportunity from the Nutri-Force
40

acquisition. However, should financial performance deteriorate further or remain depressed for a prolongedperiod of time, estimates of future cash flows may be insufficient to support the carrying value of goodwill andintangibles assigned to Nutri-Force, which may result in impairment charges.
Deferred Sales. Deferred sales primarily consists of the liability pertaining to our Healthy Awards Program. TheHealthy Awards Program allows customers to earn points toward free merchandise based on the volume ofpurchases. Points are earned each year under the Healthy Awards Program and are redeemable within the firstthree months of the following year or they expire. We defer sales as points are earned, based on historicalredemption data as well as marketing data within the current period, and record a liability for points earned basedon the value of points that are expected to be redeemed. The balances for the deferred sales liability were $20.5million and $22.5 million at December 26, 2015 and December 27, 2014, respectively. A hypothetical 1%increase in the redemption rate would result in an increase of $0.3 million in the deferred sales liability.
Income Taxes. Deferred income taxes reflect the tax effects of temporary differences between the carryingamounts of assets and liabilities for financial reporting purposes and the amounts used for income tax purposes.We record valuation allowances to reduce deferred tax assets to the amount that is more likely than not to berealized. When assessing the need for valuation allowances, we consider future taxable income and ongoingprudent and feasible tax planning strategies. Should a change in circumstances lead to a change in judgmentabout the realization of deferred tax assets in future years, we would adjust related valuation allowances in theperiod that the change in circumstances occurs, along with a corresponding increase or charge to income.
We account for our tax positions based on the provisions of the accounting literature related to accounting foruncertainty in income tax positions. That literature provides guidance for the recognition threshold andmeasurement attribute for financial statement recognition and measurement of a tax position taken or expected tobe taken in a tax return. For tax positions that are not more likely than not sustainable upon audit, we recognizethe largest amount of the benefit that is more likely than not to be sustained. We make estimates of the potentialliability based on our assessment of all potential tax exposures. In addition, we use factors such as applicable taxlaws and regulations, current information and past experience with similar issues to make these adjustments. Thetax positions are analyzed regularly and adjustments are made as events occur that warrant adjustments for thosepositions. We record interest expense and penalties payable to relevant tax authorities as income tax expense. SeeNote 9., “Income Taxes”, to our consolidated financial statements for more information.
General Definitions for Operating Results
Net Sales consist of sales, net of sales returns, deferred sales, customer incentives and a provision for estimatedfuture returns, from comparable and non comparable sales. Total comparable net sales include sales generated byretail stores after 410 days of operation, e-commerce sales, and sales generated by acquired retail stores from theSuper Supplements acquisition after 365 days. Sales to third parties of manufactured products generated byNutri-Force are considered non-comparable sales.
Cost of goods sold includes the cost of inventory sold, costs of warehousing, distribution, manufacturing andstore occupancy costs and excludes depreciation and amortization related to the retail and direct segments that isincluded within selling, general and administrative expenses. Warehousing, distribution and manufacturing costs,which are capitalized into inventory and then expensed as merchandise is sold, include freight to transfermerchandise, costs associated with our buying department, distribution facilities and manufacturing overhead.Store occupancy costs include rent, common area maintenance, real estate taxes and utilities.
Gross profit is net sales minus cost of goods sold.
Selling, general and administrative expenses consist of depreciation and amortization of fixed and intangibleassets, operating payroll and related benefits, advertising and promotion expense, and other selling, general andadministrative expenses.
41

Income from operations consists of gross profit minus selling, general and administrative expenses.
Interest expense, net includes interest on our revolving credit facility and convertible notes, letters of credit fees,interest on our capital leases, as well as amortization of financing costs, offset with interest income earned fromhighly liquid investments (investments purchased with an original maturity of three months or less).
Key Performance Indicators and Statistics
We use a number of key indicators of financial condition and operating results to evaluate the performance of ourbusiness, including the following (in thousands):
Fiscal Year Ended
December 26,2015
December 27,2014
December 28,2013
Net sales $1,266,549 $1,213,046 $1,087,469Increase in total comparable net sales (1) 0.0% 3.7% 4.6%Increase in comparable store net sales 0.1% 2.8% 3.5%Increase (Decrease) in e-commerce comparable net sales (0.6%) 11.2% 14.4%Gross profit as a percent of net sales 33.1% 33.3% 34.7%Income from operations $ 88,993 $ 102,656 $ 110,292
(1) Total comparable net sales are comprised of comparable retail store sales and e-commerce sales.
The following table shows the growth in our network of stores for Fiscal 2015, 2014 and 2013:
Fiscal Year
2015 2014 2013
Stores open at beginning of year 717 659 579Stores opened 50 61 52Stores acquired — — 31Stores closed (9) (3) (3)
Stores open at end of year 758 717 659
Results of Operations
The information presented below is for the Fiscal years ended December 26, 2015, December 27, 2014, andDecember 28, 2013 and was derived from our audited consolidated financial statements, which, in the opinion ofmanagement, includes all adjustments necessary for a fair presentation of our financial position and operatingresults for such periods and as of such dates. The following table summarizes our results of operations for theFiscal years ended December 26, 2015, December 27, 2014, and December 28, 2013 as a percentage of net sales:
Fiscal Year Ended
December 26,2015
December 27,2014
December 28,2013
Net sales 100.0% 100.0% 100.0%Cost of goods sold 66.9% 66.7% 65.3%
Gross profit 33.1% 33.3% 34.7%Selling, general and administrative expenses 26.0% 24.9% 24.6%
Income from operations 7.0% 8.5% 10.1%Interest expense, net 0.1% 0.0% 0.0%
Income before provision for income taxes 6.9% 8.4% 10.1%Provision for income taxes 2.7% 3.4% 4.0%
Net income 4.2% 5.0% 6.1%
42

Figures may not sum due to rounding.
The results of operations presented for the Fiscal years ended December 26, 2015, December 27, 2014 andDecember 28, 2013 are each based on a 52-week period (“Fiscal 2015”, “Fiscal 2014” and “Fiscal 2013”).
Fiscal 2015 Compared to Fiscal 2014
2015 Financial Highlights:
• Net sales increased 4.4%
• Total comparable net sales were flat
• Comparable store net sales increased 0.1%
• E-commerce sales decreased 0.6%
• Opened 50 retail stores
• Issued $143.8 million of Convertible Notes
• Fully diluted earnings per share of $1.82
Outlook for 2016, management expects on a 53-week basis:
• Total comparable net sales to be flat to positive low single digits
• To open approximately 30 new stores
• Capital expenditures of approximately $40 million
The following tables summarize our results of operations for Fiscal 2015 and Fiscal 2014 (in thousands):
Fiscal Years Ended
December 26,2015
December 27,2014
$Change
%Change
Net sales $1,266,549 $1,213,046 $ 53,503 4.4%Cost of goods sold 847,634 808,787 38,847 4.8%
Cost of goods sold as % of net sales 66.9% 66.7%Gross profit 418,915 404,259 14,656 3.6%
Gross profit as % of net sales 33.1% 33.3%Selling, general and administrative expenses 329,922 301,603 28,319 9.4%
SG&A expenses as % of net sales 26.0% 24.9%
Income from operations 88,993 102,656 (13,663) (13.3)%Income from operations as % of net sales 7.0% 8.5%
Interest expense, net 1,105 495 610 123.2%
Income before provision for income taxes 87,888 102,161 (14,273) (14.0)%Provision for income taxes 34,717 40,920 (6,203) (15.2)%
Net income $ 53,171 $ 61,241 $ (8,070) (13.2)%
The results of Nutri-Force, included in the Company’s results of operations, reflect a full year for Fiscal 2015 andthe period from June 6, 2014 through December 27, 2014 for Fiscal 2014.
Net Sales
The increase in net sales was the result of an increase in our total non-comparable net sales of $53.8 million,which includes an increase in Nutri-Force net sales of $16.3 million to third parties. Sales increased $24.0 million
43

in the Other product category (which includes on the go bars, drinks and snacks, as well as natural beauty andpersonal care products). Sales in the Sports Nutrition category (which includes sports and performance nutritionand weight management products) were relatively flat with the increase in sales of sports and performancenutrition products substantially offset by the decrease in sales of weight management products. In addition, thegrowth rate in sales of sports and performance nutrition products is below historical trends.
Net sales for our three business segments, as well as a discussion of the changes in each segment’s net salesfrom the comparable prior year period, are provided below (in thousands):
Fiscal Years Ended
December 26,2015
December 27,2014
$Change
%Change
Net Sales:
Retail (a) $1,081,123 $1,042,054 $ 39,069 3.7%Direct (b) 128,825 130,644 (1,819) (1.4)%Manufacturing (c) 91,159 48,102 43,057 89.5%
Segment net sales 1,301,107 1,220,800 80,307 6.6%Elimination of intersegment revenues (34,558) (7,754) (26,804) 345.7%
Total net sales $1,266,549 $1,213,046 $ 53,503 4.4%
(a) The change in retail sales resulted from an increase in non-comparable store sales of $38.5 million and incomparable store sales of $0.6 million, or 0.1%. The increase in comparable store sales was driven byaverage transaction value substantially offset by a decrease in customer traffic.
(b) Direct sales declined due to a decrease in catalog sales of $1.0 million and a decrease in e-commerce salesof $0.8 million, or 0.6%.
(c) Manufacturing sales reflect an increase of $26.8 million in product manufactured for the Vitamin Shoppeassortment and an increase of $16.3 million in product manufactured for third parties.
Cost of Goods Sold
The dollar increase of cost of goods sold was primarily due to an increase in sales. The increase of cost ofgoods sold as a percentage of net sales was primarily due to 0.5% of deleverage of retail occupancy costspartially offset by 0.2% related to Nutri-Force. Cost of goods sold for Fiscal 2015 includes a $1.3 million chargefor the write-off of USPlabs® products which the Company ceased selling and for Fiscal 2014 includes a $4.5million charge from adjusting Nutri-Force inventory to fair value as part of purchase accounting.
Selling, General and Administrative Expenses
Fiscal Years Ended
December 26,2015
December 27,2014
$Change
%Change
SG&A Expenses (in thousands):Payroll and Benefits (a) $128,217 $119,499 $ 8,718 7.3%
Payroll & benefit as % of net sales 10.1% 9.9%Advertising and Promotion (b) 21,621 19,290 2,331 12.1%
Advertising & promotion as % of net sales 1.7% 1.6%Other SG&A (c) 180,084 162,814 17,270 10.6%
Other SG&A as % of net sales 14.2% 13.4%
Total SG&A Expenses $329,922 $301,603 $28,319 9.4%
(a) Payroll and benefits increased primarily due to the increase in head count added to operate new stores andhigher medical benefits costs.
44

(b) Advertising and promotion increased with the addition of Nutri-Force of $1.7 million and an increase indigital advertising of $0.8 million partially offset by lower retail expenditures of $0.2 million.
(c) Other SG&A expenses include an increase in costs related to Nutri-Force of $5.8 million and increaseddepreciation and amortization expenses of $4.0 million. In addition, other SG&A increased as a result ofmanagement realignment charges of $3.4 million, reinvention costs of $2.7 million, a charge to increase theallowance for doubtful accounts for Nutri-Force of $1.4 million and a net reduction in acquisition relatedcosts of $2.9 million.
Income from Operations
Operating income (loss) for our three business segments are provided below (in thousands):
Fiscal Years Ended
December 26,2015
December 27,2014
$Change
%Change
Income from operations:Retail (a) $ 192,598 $ 194,864 $ (2,266) (1.2)%
% of net sales 17.8% 18.7%Direct (b) 20,904 22,755 (1,851) (8.1)%
% of net sales 16.2% 17.4%Manufacturing (c) (1,977) (1,830) (147) 8.0%
% of net sales (2.2%) (3.8%)Corporate costs (d) (122,532) (113,133) (9,399) 8.3%
% of net sales (9.7%) (9.3%)
Income from operations $ 88,993 $ 102,656 $(13,663) (13.3)%
(a) Decrease in retail income from operations as a percentage of net sales is due to 0.5% related to occupancycosts and 0.4% from payroll and benefits costs.
(b) Decrease in direct income from operations as a percentage of net sales is due to 0.7% related to advertisingand promotion expenses and 0.4% related to product margin.
(c) During the period ended December 26, 2015, the manufacturing segment recognized an increase in costs ascompared to the prior year due to operational inefficiencies, and includes a $1.4 million charge for accountsreceivable for one wholesale customer which were deemed uncollectible. The period ended December 27,2014 includes a $4.5 million charge from adjusting Nutri-Force inventory to fair value as part of purchaseaccounting.
(d) The increase in corporate costs includes an increase in depreciation and amortization expenses of $4.0million. In addition, corporate costs increased as a result of management realignment charges of $3.4million, reinvention costs of $2.7 million and a net reduction in acquisition related costs of $2.9 million.
In addition to the items noted above, income from operations includes $1.8 million of Super Supplementsconversion costs and $0.9 million of closing costs for the stores in Canada.
Provision for Income Taxes
The effective tax rate for Fiscal 2015 was 39.5%, compared to 40.1% for Fiscal 2014. The effective tax ratedecreased primarily due to a decrease in permanent non-deductible items during Fiscal 2015 as compared toFiscal 2014.
45

Fiscal 2014 Compared To Fiscal 2013
The following tables summarize our results of operations for Fiscal 2014 and Fiscal 2013 (in thousands):
Fiscal Years Ended
December 27,2014
December 28,2013
$Change
%Change
Net sales $1,213,046 $1,087,469 $125,577 11.5%Cost of goods sold 808,787 709,823 98,964 13.9%
Cost of goods sold as % of net sales 66.7% 65.3%Gross profit 404,259 377,646 26,613 7.0%
Gross profit as % of net sales 33.3% 34.7%Selling, general and administrative expenses 301,603 267,354 34,249 12.8%
SG&A expenses as % of net sales 24.9% 24.6%
Income from operations 102,656 110,292 (7,636) (6.9)%Income from operations as % of net sales 8.5% 10.1%
Interest expense, net 495 495 — 0.0%
Income before provision for income taxes 102,161 109,797 (7,636) (7.0)%Provision for income taxes 40,920 43,251 (2,331) (5.4)%
Net income $ 61,241 $ 66,546 $ (5,305) (8.0)%
Net Sales
The increase in net sales was the result of an increase in our total comparable net sales of $39.7 million, or3.7%, as well as an increase in our non-comparable sales of $85.9 million, which includes $40.3 million fromNutri-Force. Sales increased primarily in the Sports Nutrition category which increased $35.2 million and in theOther category which increased $32.5 million (excluding Nutri-Force) primarily due to new productintroductions.
Net sales for our three business segments, as well as a discussion of the changes in each segment’s net salesfrom the comparable prior year period, are provided below (in thousands):
Fiscal Years Ended
December 27,2014
December 28,2013
$Change
%Change
Net Sales:
Retail (a) $1,042,054 $ 969,610 $ 72,444 7.5%
Direct (b) 130,644 117,859 12,785 10.8%Manufacturing (c) 48,102 — 48,102 —
Segment net sales 1,220,800 1,087,469 133,331 12.3%Elimination of intersegment revenues (7,754) — (7,754) —
Total net sales $1,213,046 $1,087,469 $125,577 11.5%
(a) The change in retail sales resulted from an increase in non-comparable store sales of $45.6 million and incomparable store sales of $26.8 million, or 2.8%. The increase in comparable store sales was driven bycustomer traffic.
(b) The increase in direct sales was due to an increase in e-commerce sales of 12.0% which was offset in part bya decrease in catalog sales. The increase in e-commerce sales was largely due to retention marketingprograms.
(c) Net sales to third party manufacturing customers were $40.3 million for Fiscal 2014, representing net salessince the date of the acquisition of Nutri-Force.
46
Cost of Goods Sold
Cost of goods sold, which includes product, warehouse, distribution, manufacturing and occupancy costs,increased $99.0 million, or 13.9%, to $808.8 million for Fiscal 2014 compared to $709.8 million for Fiscal 2013.The dollar increase was primarily due to an increase in sales, as well as $35.0 million from the addition of Nutri-Force. Cost of goods sold as a percentage of net sales increased to 66.7% for the year ended December 27, 2014,compared to 65.3% for the year ended December 28, 2013. The increase of cost of goods sold as a percentage ofnet sales was primarily due to 0.7% resulting from the acquired manufacturing operations of Nutri-Force and0.5% due to higher supply chain costs.
Fiscal Years Ended
December 27,2014
December 28,2013
$Change
%Change
SG&A Expenses (in thousands):
Payroll and Benefits (a) $119,499 $107,723 $11,776 10.9%Payroll & benefit as % of net sales 9.9% 9.9%
Advertising and Promotion (b) 19,290 16,533 2,757 16.7%Advertising & promotion as % of net sales 1.6% 1.5%
Other SG&A (c) 162,814 143,098 19,716 13.8%Other SG&A as % of net sales 13.4% 13.2%
Total SG&A Expenses $301,603 $267,354 $34,249 12.8%
(a) Payroll and benefits increased primarily due to the increase in head count added to operate new stores andan increase in the average wage rates.
(b) Advertising and promotion increased primarily due to an increase in digital advertising.(c) The increase in other SG&A expenses was primarily due to an increase in depreciation and amortization
expense of $5.9 million, costs related to the addition of Nutri-Force of $5.8 million, acquisition andintegration expenses of $4.8 million and additional contingent consideration for the acquisition of Nutri-Force of $1.0 million. Fiscal 2013 included proceeds from insurance recoveries of $1.1 million and costsrelated to the acquisition and integration of Super Supplements of $4.3 million.
Income from Operations
Operating income (loss) for our three business segments are provided below (in thousands):
Fiscal Years Ended
December 27,2014
December 28,2013
$Change
%Change
Income from operations:
Retail (a) $ 194,864 $ 192,439 $ 2,425 1.3%% of net sales 18.7% 19.8%
Direct (b) 22,755 21,930 825 3.8%% of net sales 17.4% 18.6%
Manufacturing (c) (1,830) — (1,830) —% of net sales (3.8%) 0.0%
Corporate costs (d) (113,133) (104,077) (9,056) 8.7%% of net sales (9.3%) (9.6%)
Income from operations $ 102,656 $ 110,292 $(7,636) (6.9)%
(a) Decrease in retail income from operations as a percentage of net sales is primarily due to supply chain costsof 0.6% and payroll related benefits costs of 0.3% as a percentage of net sales.
47

(b) Decrease in direct income from operations as a percentage of net sales is primarily due to advertising andpromotion expenses of 0.6% and general operating expenses of 0.5% as a percentage of net sales.
(c) Loss from operations for the manufacturing segment was $1.8 million for Fiscal 2014, and includesdepreciation and amortization expense of $0.9 million. Excluding $4.5 million in charges related to theinventory valuation step up for inventory sold subsequent to the acquisition of Nutri-Force, income fromoperations for the manufacturing segment was $2.7 million, or 6.6% of net sales for the manufacturingsegment
(d) The increase in corporate costs was primarily due to an increase in depreciation and amortization expense of$4.9 million, acquisition and integration costs of $4.8 million and additional contingent consideration for theacquisition of Nutri-Force of $1.0 million. Fiscal 2013 included proceeds from insurance recoveries of $1.1million and costs related to the acquisition and integration of Super Supplements of $4.3 million.
Provision for Income Taxes
The effective tax rate for the year ended December 27, 2014 was 40.1%, compared to 39.4% for the yearended December 28, 2013. The effective tax rate increased primarily due to an increase in permanent non-deductible items during Fiscal 2014 as compared to Fiscal 2013 and a benefit in Fiscal 2013 from the reversal ofcharges previously recorded relating to uncertain tax positions due to the expiration of the applicable statutes oflimitations that did not recur in Fiscal 2014.
Key Indicators of Liquidity and Capital Resources
The following table provides key indicators of our liquidity and capital resources (in thousands):
December 26,2015
December 27,2014
Balance Sheet Data:Cash and cash equivalents $ 15,104 $ 12,166Working capital 157,089 125,382Total assets 748,691 722,391Total debt, including capital lease obligations 123,525 8,195
Fiscal Year Ended
December 26,2015
December 27,2014
December 28,2013
Other Information:Depreciation and amortization (1) $ 38,495 $ 34,219 $ 28,026
Cash Flows Provided By (Used In):Operating activities $ 60,667 $ 100,147 $ 81,122Investing activities (39,430) (125,184) (93,650)Financing activities (18,428) (36,877) 5,463Effect of exchange rate changes on cash and cash equivalents 129 44 (67)
Net (decrease) increase in cash and cash equivalents $ 2,938 $ (61,870) $ (7,132)
(1) Excludes amortization of deferred financing fees.
Liquidity and Capital Resources
Our primary uses of cash have been to fund working capital, operating expenses and capital expenditures relatedprimarily to the build-out of new stores, the remodeling of existing stores and information technologyinvestments as well as to repurchase shares of our common stock. Historically, we have financed ourrequirements predominately through internally generated cash flow, supplemented with short-term financing. In
48

Fiscal 2015, we issued $143.8 million of Convertible Notes to fund the repurchase of shares of our commonstock. Refer to Note 8., “Credit Arrangements”, to our consolidated financial statements included in this AnnualReport on Form 10-K for additional information. We believe that the cash generated by operations and cash andcash equivalents, together with the borrowing availability under our revolving credit facility, will be sufficient tomeet our working capital needs for the next twelve months, our store growth plans, systems development, storeimprovements and interest payments on the Convertible Notes, as well as the repurchase of shares of ourcommon stock from time to time.
We purchased $146.1 million of common stock under our $300.0 million share repurchase programs duringFiscal 2015. Refer to Note 11., “Share Repurchase Programs”, to our consolidated financial statements includedin this Annual Report on Form 10-K for additional information. We invested $39.4 million in capitalexpenditures during Fiscal 2015, most of which pertains to new stores, the remodeling of existing stores andinformation technology investments. During Fiscal 2016 we plan to spend approximately $40 million in capitalexpenditures, including costs for building new stores, remodeling existing stores and information technology. Weopened 50 new stores and closed 9 stores during Fiscal 2015. We plan to open approximately 30 new stores inFiscal 2016. Our working capital requirements for merchandise inventory will continue to increase as wecontinue to open additional stores. Currently, our practice is to establish an inventory level of approximately$155,000 at cost for each of our stores, the cost of which is partially offset by vendor incentive and allowanceprograms. Additionally, 30 day payment terms have been extended to us by some of our suppliers allowing us toeffectively manage our inventory and working capital.
The Company is subject to concentrations of credit risk associated with cash and cash equivalents, and at timesholds cash balances in excess of Federal Deposit Insurance Corporation limits. Currently, the Company’s cashmanagement practice is to hold cash balances in quality institutions and invest in highly liquid and secureinvestments.
We were in compliance with all debt covenants relating to our Revolving Credit Facility and Convertible Notesas of December 26, 2015. We expect to be in compliance with these same debt covenants during Fiscal 2016 aswell.
Cash Provided by Operating Activities
Net cash provided by operating activities was $60.7 million and $100.1 million during Fiscal 2015 and Fiscal2014, respectively. The $39.5 million decrease in net cash flows from operating activities is primarily due to anincrease in inventory purchases to support activities including the transition to a new third-party warehouse andthe transition of products to our manufacturing facility.
Net cash provided by operating activities was $100.1 million and $81.1 million during Fiscal 2014 and Fiscal2013, respectively. The $19.0 million increase in net cash flows from operating activities is primarily due toreductions in prepaid taxes and inventory purchases.
Cash Used in Investing Activities
Net cash used in investing activities was $39.4 million during Fiscal 2015 as compared to $125.2 million duringFiscal 2014. The $85.8 million decrease in cash used in investing activities is primarily due to the $81.5 millionfor the acquisition of Nutri-Force in Fiscal 2014.
Net cash used in investing activities was $125.2 million during Fiscal 2014 as compared to $93.7 million duringFiscal 2013. The $31.5 million increase in cash used in investing activities is primarily due to the $81.5 millionfor the acquisition of Nutri-Force in Fiscal 2014 partially offset by the $50.5 million for the acquisition of SuperSupplements.
49

Cash Used in and Provided by Financing Activities
Net cash used in financing activities was $18.4 million in Fiscal 2015 as compared to $36.9 million in Fiscal2014. The $18.4 million decrease in cash used in financing activities was primarily due to purchases of commonstock under the Company’s share repurchase programs of $146.1 million in Fiscal 2015 and $57.8 million inFiscal 2014 partially offset by the net proceeds from the issuance of Convertible Notes of $125.7 million inFiscal 2015 and by net borrowings under the Company’s revolving credit facility of $8.0 million in Fiscal 2014.In addition, proceeds from exercises of stock options decreased $8.0 million in Fiscal 2015 as compared to Fiscal2014.
Net cash used in financing activities was $36.9 million in Fiscal 2014 as compared to net cash provided byfinancing activities of $5.5 million in Fiscal 2013. The $42.3 million increase in cash used in financing activitieswas primarily due to purchases of common stock under the Company’s share repurchase program of $57.8million and an increase in purchases of treasury stock of $2.1 million partially offset by net borrowings under theCompany’s revolving credit facility of $8.0 million, an increase in the proceeds from exercises of stock optionsof $5.9 million and an increase in the tax benefits on exercises of stock options of $3.3 million.
Revolving Credit Facility
The terms of our Revolving Credit Facility extend through October 11, 2018, and allow the Company to borrowup to $90.0 million, subject to the terms of the facility, with a Company option to increase the facility up to atotal of $150.0 million. For information regarding the terms of our Revolving Credit Facility, refer to Note 8.,“Credit Arrangements”, to our consolidated financial statements included in this Annual Report on Form 10-K.As of December 26, 2015, the Company had $8.0 million of borrowings outstanding on its Revolving CreditFacility. The largest amount borrowed at any given point during Fiscal 2015 was $28.0 million. The unusedavailable line of credit under the Revolving Credit Facility at December 26, 2015 was $79.1 million.
Convertible Notes
On December 9, 2015, the Company closed its offering of $143.8 million of its 2.25% Convertible Notes. TheConvertible Notes are senior unsecured obligations of the Company. Interest is payable on the Notes on June 1and December 1 of each year, commencing on June 1, 2016 until their maturity date of December 1, 2020. Foradditional information regarding the terms of our Convertible Notes, refer to Note 8., “Credit Arrangements”, toour consolidated financial statements included in this Annual Report on Form 10-K.
Contractual Obligations and Commercial Commitments
As of December 26, 2015, our lease commitments and contractual obligations were as follows (in thousands):
Fiscal year ending Total
OperatingLeases
Real Estate (1)Convertible
Notes
Interest onConvertible
Notes
OperatingLeases
EquipmentCapital LeaseObligations
2016 $123,817 $119,983 $ — $ 3,173 $571 $ 902017 116,478 112,965 — 3,234 254 252018 102,073 98,839 — 3,234 — —2019 84,871 81,637 — 3,234 — —2020 213,366 66,382 143,750 3,234 — —Thereafter 195,019 195,019 — — — —
$835,624 $674,825 $143,750 $16,109 $825 $115
(1) Store operating leases included in the above table do not include contingent rent based upon sales volume.Operating leases do not include common area maintenance costs or real estate taxes that are paid to thelandlord during the year, which combined represented approximately 17.5% of our minimum leaseobligations for Fiscal 2015. In addition, not included are variable activity based fees associated with ourwest coast logistics facilities, which were approximately $0.6 million during Fiscal 2015 and are expected tobe approximately $5.0 million during Fiscal 2016.
50

We are not party to any long-term purchase commitments. Our typical merchandise purchase orders are generallyperformed upon within a four to six week period. However, as of December 26, 2015, we have an obligation,excluded from the above commitments, of approximately $18.0 million to purchase an agreed upon supply of ourown branded merchandise and raw materials during Fiscal 2016 which has been produced by, and resides with,the applicable vendors.
In addition to the contractual obligations set forth in the table above, we have employment agreements withcertain of our executives and an executive severance policy for all our officers that provide for compensation andcertain other benefits. Under certain circumstances, these agreements and the policy provide for severance orother payments.
Off-Balance Sheet Arrangements
We have not created, and are not party to, any special-purpose or off-balance sheet entities for the purpose ofraising capital, incurring debt or operating our business. We do not have any off-balance sheet arrangements orrelationships with entities that are not consolidated into our financial statements that have or are reasonably likelyto have a material current or future effect on our financial condition, changes in financial condition, revenues,expenses, results of operations, liquidity, capital expenditures or capital resources. The Company hascommitments for its operating leases, primarily related to its stores as well as its manufacturing and corporatefacilities, which are not reflected on our balance sheet.
Effects of Inflation
We do not believe that our sales or operating results have been materially affected by inflation during the periodspresented in our financial statements. During Fiscal 2015, retail price inflation was approximately 1%. DuringFiscal 2016, we anticipate retail inflation to be in line with the Fiscal 2015 rate. Additionally, we may experienceincreased cost pressure from our suppliers which could have an adverse effect on our gross profit results in thefuture.
Recent Accounting Pronouncements
Except as discussed in Note 2., “Summary of Significant Accounting Policies”, to our consolidated financialstatements included in this Annual Report on Form 10-K, we have considered all new accountingpronouncements and have concluded that there are no new pronouncements that may have a material impact onour results of operations, financial condition, or cash flows, based on current information.
Item 7A. Quantitative and Qualitative Disclosures About Market Risk
Interest Rate Risk
The Company’s market risks relate primarily to changes in interest rates. Market risk represents the risk ofchanges in the value of market risk sensitive instruments caused by fluctuations in interest rates and commodityprices. Changes in these factors could cause fluctuations in the results of our operations and cash flows.
Our Revolving Credit Facility carries a floating interest rate and, therefore, our statements of income and ourcash flows are exposed to changes in interest rates. As of December 26, 2015, there was $8.0 million ofborrowings outstanding on our Revolving Credit Facility. At December 26, 2015, a hypothetical 10% change inthe floating interest rate would have a de minimis impact on our consolidated financial statements.
Foreign Currency Risk
The Company is minimally exposed to foreign currency exchange risk. We lease and operate three stores inCanada. Sales made from the Canadian stores are made in Canadian dollars. The Company does not currentlyhedge against the risk of exchange rate fluctuations. At December 26, 2015, a hypothetical 10% change in valueof the U.S. dollar relative to the Canadian dollar would have a de minimis impact on our consolidated financialstatements.
51

Item 8. Financial Statements and Supplementary Data
The response to this item is incorporated herein by reference to the financial statements and supplementaryfinancial data in Item 15. “Exhibits and Financial Statement Schedules” appearing at the end of this AnnualReport on Form 10-K.
Item 9. Changes in and Disagreements with Accountants on Accounting and Financial Disclosure
None.
Item 9A. Controls and Procedures
Conclusion Regarding the Effectiveness of Disclosure Controls and Procedures
We carried out an evaluation, under the supervision and with the participation of our management, including ourChief Executive Officer and Chief Financial Officer, who are our principal executive officer and principalfinancial officer, respectively, of the design and operation of our disclosure controls and procedures as such termis defined in Rules 13a-15(e) and 15d – 15(e) under the Securities Exchange Act of 1934 (the “Exchange Act”)as of December 26, 2015, pursuant to Exchange Act Rule 13a-15 and 15d-15. Based on such evaluation, theChief Executive Officer and Chief Financial Officer concluded that our disclosure controls and procedures wereeffective at a reasonable assurance level as of December 26, 2015.
Management’s Report on Internal Control Over Financial Reporting
See Item 15. “Exhibits and Financial Statement Schedules” appearing at the end of this Annual Report on Form10-K for Management’s Report on Internal Control Over Financial Reporting.
Changes in Internal Control over Financial Reporting
There have been no changes in our internal control over financial reporting during the quarter endedDecember 26, 2015, that have materially affected, or are reasonably likely to materially affect, our internalcontrol over financial reporting.
Inherent Limitations on Effectiveness of Controls
Our management, including the Chief Executive Officer and Chief Financial Officer, do not expect that ourdisclosure controls and procedures or our internal control over financial reporting will prevent or detect all errorsand all fraud. A control system, no matter how well designed and operated, can provide only reasonable, notabsolute, assurance that the control system’s objectives will be met. The design of a control system must reflectthe fact that there are resource constraints, and the benefits of controls must be considered relative to their costs.Further, because of the inherent limitations in all control systems, no evaluation of controls can provide absoluteassurance that misstatements due to error or fraud will not occur or that all control issues and instances of fraud,if any, within the Company have been detected. These inherent limitations include the realities that judgments indecision-making can be faulty and that breakdowns can occur because of simple error or mistake. Controls canalso be circumvented by the individual acts of some persons, by collusion of two or more people, or bymanagement override of the controls. The design of any system of controls is based in part on certainassumptions about the likelihood of future events, and there can be no assurance that any design will succeed inachieving its stated goals under all potential future conditions. Projections of any evaluation of controlseffectiveness to future periods are subject to risks. Over time, controls may become inadequate because ofchanges in conditions or deterioration in the degree of compliance with policies or procedures.
Item 9B. Other Information
None.
52

PART III
Item 10. Directors, Executive Officers and Corporate Governance
Information with respect to this Item will be included in the Company’s Proxy Statement to be filed in April2016, which is incorporated herein by reference under the captions “Proposal Two – Election of Directors”,“Corporate Governance”, “Executive Officers” and “Section 16(a) Beneficial Ownership ReportingCompliance”.
Item 11. Executive Compensation
Information with respect to this Item will be included in the Company’s Proxy Statement to be filed in April2016, which is incorporated herein by reference under the captions, “Director Compensation”, “CompensationDiscussion and Analysis” and “Executive Compensation”.
Item 12. Security Ownership of Certain Beneficial Owners and Management and Related StockholderMatters
Information with respect to this Item will be included in the Company’s Proxy Statement to be filed in April2016, which is incorporated herein by reference under the captions “Security Ownership” and “EquityCompensation Plan Information”.
Item 13. Certain Relationships and Related Transactions, and Director Independence
Information with respect to this Item will be included in the Company’s Proxy Statement to be filed in April2016, which is incorporated herein by reference under the captions “Corporate Governance – DirectorIndependence”, “Corporate Governance – Policies with Respect to Transactions with Related Persons” and“Certain Relationships and Related Party Transactions, and Director Independence”.
Item 14. Principal Accounting Fees and Services
Information with respect to this Item will be included in the Company’s Proxy Statement to be filed in April2016, which is incorporated herein by reference under the caption “Principal Accountant Fees and Services”.
53

PART IV
Item 15. Exhibits, Financial Statement Schedules
(a) The following documents are filed as part of this annual report on Form 10-K:
1. The following consolidated financial statements listed below are filed as a separate section of thisannual report on Form 10-K:
Management’s Reports and Reports of Independent Registered Public Accounting Firm – Deloitte &Touche LLP.
Consolidated Balance Sheets as of December 26, 2015 and December 27, 2014.
Consolidated Statements of Income for the Fiscal years ended December 26, 2015, December 27, 2014,and December 28, 2013.
Consolidated Statements of Comprehensive Income for the Fiscal years ended December 26,2015, December 27, 2014, and December 28, 2013.
Consolidated Statements of Stockholders’ Equity for the Fiscal years ended December 26,2015, December 27, 2014, and December 28, 2013.
Consolidated Statements of Cash Flows for the Fiscal years ended December 26, 2015, December 27,2014, and December 28, 2013.
Notes to Consolidated Financial Statements for the Fiscal years ended December 26,2015, December 27, 2014, and December 28, 2013.
2. Exhibits:
ExhibitNo. Description
2.1 Asset Purchase Agreement, dated as of December 17, 2012, by and among Super Supplements,Inc., John Wurts, Vitamin Shoppe Mariner, Inc. and, solely for certain specified provisions thereof,Vitamin Shoppe, Inc. (Incorporated by reference to Exhibit 10.1 in our Current Report on Form8-K filed on December 18, 2012 (File No. 001-34507))
2.2 Amendment No. 1 to Asset Purchase Agreement, dated as of December 30, 2012, by and amongSuper Supplements, Inc., John Wurts, Vitamin Shoppe Mariner, Inc. and Vitamin Shoppe, Inc.(Incorporated by reference to Exhibit 10.1 in our Current Report on Form 8-K filed on January 2,2013 (File No. 001-34507))
2.3 LLC Interest Purchase Agreement, dated as of June 6, 2014, by and among VS Hercules LLC, FDCVitamins, LLC, MBF/FDC Acquisition, LLC, FDC Management, LLC, FDC Limited II, LLC, Nutri-Force Nutrition, Inc., the individuals listed therein and, solely for certain specified provisions thereof,Vitamin Shoppe, Inc. (Incorporated by reference to Exhibit 2.1 in our Current report on Form 8-Kfiled on June 9, 2014 (File No. 001-34507))
3.1 Amended and Restated Certificate of Incorporation of Vitamin Shoppe, Inc. (Incorporated byreference to Exhibit 3.1 in Amendment No. 1 to our Form 10-Q filed on November 13, 2009 (File No.001-34507))
3.2 Fourth Amended and Restated By-laws of Vitamin Shoppe Inc. (Filed herewith)
4.1 Specimen certificate for shares of common stock, $0.01 par value, of Vitamin Shoppe, Inc.(Incorporated by reference to Exhibit 4.4 in Amendment No. 4 to our Registration Statement No.333-160756 on Form S-1 filed on October 14, 2009 (File No. 333-160756))
4.2 Indenture, dated as of December 9, 2015, by and between Vitamin Shoppe, Inc. and WilmingtonTrust, National Association. (Incorporated by reference to Exhibit 4.1 in our Current Report on Form8-K filed on December 10, 2015 (File No. 001-34507))
54

ExhibitNo. Description
10.1 Base Convertible Bond Hedge Confirmation, dated as of December 3, 2015, by and between VitaminShoppe, Inc. and Bank of America, N.A. (Incorporated by reference to Exhibit 10.2 in our CurrentReport on Form 8-K filed on December 10, 2015 (File No. 001-34507))
10.2 Base Convertible Bond Hedge Confirmation, dated as of December 3, 2015, by and betweenVitamin Shoppe, Inc. and J.P. Morgan Chase Bank, National Association, London Branch.(Incorporated by reference to Exhibit 10.3 in our Current Report on Form 8-K filed onDecember 10, 2015 (File No. 001-34507))
10.3 Base Warrant Confirmation, dated as of December 3, 2015, by and between Vitamin Shoppe, Inc.and Bank of America, N.A. (Incorporated by reference to Exhibit 10.4 in our Current Report on Form8-K filed on December 10, 2015 (File No. 001-34507))
10.4 Base Warrant Confirmation, dated as of December 3, 2015, by and between Vitamin Shoppe, Inc.and J.P. Morgan Chase Bank, National Association, London Branch. (Incorporated by reference toExhibit 10.5 in our Current Report on Form 8-K filed on December 10, 2015 (File No. 001-34507))
10.5 Additional Convertible Bond Hedge Confirmation, dated as of December 8, 2015, by and betweenVitamin Shoppe, Inc. and Bank of America, N.A. (Incorporated by reference to Exhibit 10.6 in ourCurrent Report on Form 8-K filed on December 10, 2015 (File No. 001-34507))
10.6 Additional Convertible Bond Hedge Confirmation, dated as of December 8, 2015, by and betweenVitamin Shoppe, Inc. and J.P. Morgan Chase Bank, National Association, London Branch.(Incorporated by reference to Exhibit 10.7 in our Current Report on Form 8-K filed on December10, 2015 (File No. 001-34507))
10.7 Additional Warrant Confirmation, dated as of December 8, 2015, by and between Vitamin Shoppe,Inc. and Bank of America, N.A. (Incorporated by reference to Exhibit 10.8 in our Current Report onForm 8-K filed on December 10, 2015 (File No. 001-34507))
10.8 Additional Warrant Confirmation, dated as of December 8, 2015, by and between Vitamin Shoppe,Inc. and J.P. Morgan Chase Bank, National Association, London Branch. (Incorporated by referenceto Exhibit 10.9 in our Current Report on Form 8-K filed on December 10, 2015 (File No. 001-34507))
10.9 Amended and Restated Loan and Security Agreement, dated as of January 20, 2011, by and amongVitamin Shoppe Industries Inc. and VS Direct Inc., as Borrowers, Vitamin Shoppe, Inc., asGuarantor, the Lenders and Issuing Bank from time to time party thereto, and JPMorgan Chase Bank,N.A. as Administrative Agent. (Incorporated by reference to Exhibit 10.2 in our Annual Report onForm 10-K filed on March 9, 2011 (File No. 001-34507))
10.10 First Amendment to Amended and Restated Loan and Security Agreement, dated as of January 10,2013, by and among Vitamin Shoppe Industries Inc., VS Direct Inc. and Vitamin Shoppe Mariner,Inc., as Borrowers, each guarantor party thereto, the lenders party thereto, and JPMorgan ChaseBank, N.A., as Agent, the Issuing Bank and a Lender. (Incorporated by reference to Exhibit 10.1 inour Current Report on Form 8-K filed on October 16, 2013 (File No. 001-34507))
10.11 Second Amendment to Amended and Restated Loan and Security Agreement and First Amendmentto Existing Guarantees, dated as of October 11, 2013, by and among Vitamin Shoppe Industries Inc.,VS Direct Inc., Vitamin Shoppe Mariner, Inc., and Vitamin Shoppe Global, Inc., as Borrowers, eachguarantor party thereto, and JPMorgan Chase Bank, N.A., as Agent. (Incorporated by reference toExhibit 10.2 in our Current Report on Form 8-K filed on October 16, 2013 (File No. 001-34507))
55

ExhibitNo. Description
10.12 Third Amendment to Amended and Restated Loan and Security Agreement, dated as of December 2,2015, by and among Vitamin Shoppe Industries Inc., VS Direct Inc., Vitamin Shoppe Mariner, Inc.,and Vitamin Shoppe Global, Inc., VS Hercules LLC, FDC Vitamins LLC, Betancourt SportsNutrition, LLC, Vitamin Shoppe Procurement Services, Inc., as Borrowers, the guarantors partiesthereto, the lenders parties thereto, and JPMorgan Chase Bank, N.A., as Agent. (Incorporated byreference to Exhibit 10.1 in our Current Report on Form 8-K filed on December 10, 2015 (File No.001-34507))
10.13 Fourth Amendment to Amended and Restated Loan and Security Agreement, dated as of January 29,2016, by and among Vitamin Shoppe Industries Inc., VS Direct Inc., Vitamin Shoppe Mariner, Inc.,and Vitamin Shoppe Global, Inc., VS Hercules LLC, FDC Vitamins LLC, Betancourt SportsNutrition, LLC, Vitamin Shoppe Procurement Services, Inc., as Borrowers, the guarantors partiesthereto, the lenders parties thereto, and JPMorgan Chase Bank, N.A., as Agent. (Filed herewith)
10.14 Intellectual Property Security Agreement, dated as of September 25, 2009, by and among VitaminShoppe Industries Inc., VS Direct Inc. and Vitamin Shoppe, Inc. (f/k/a VS Holdings, Inc.) andJPMorgan Chase Bank, N.A., as Administrative Agent. (Incorporated by reference to Exhibit 99.5 inour Current Report on Form 8-K filed on September 30, 2009 (File No. 333-134983-02))
10.15 Second Amended and Restated Intellectual Property Security Agreement, dated as of October 6,2014, by and between Vitamin Shoppe Industries Inc., as Grantor and JPMorgan Chase Bank, N.A.,as Administrative Agent. (Incorporated by reference to Exhibit 10.1 in our Current Report on Form8-K filed on October 10, 2014 (File No. 001-34507))
10.16 Stock Pledge Agreement, dated as of September 25, 2009, by and between Vitamin Shoppe, Inc. (f/k/a VS Holdings, Inc.), as Pledgor, and JPMorgan Chase Bank, N.A., as Pledgee. (Incorporated byreference to Exhibit 99.6 in our Current Report on Form 8-K filed on September 30, 2009 (File No.333-134983-02))
10.17 Amended and Restated Stock Pledge Agreement, dated as of October 11, 2013, by and betweenVitamin Shoppe Industries Inc., as Pledgor, and JPMorgan Chase Bank, N.A., as Pledgee.(Incorporated by reference to Exhibit 10.3 in our Current Report on Form 8-K filed on October 16,2013 (File No. 001-34507))
10.18 Stock Pledge Agreement, dated as of August 21, 2014, by and between Vitamin Shoppe Global, Inc.,as Pledgor, and JPMorgan Chase Bank, N.A., as Pledgee. (Incorporated by reference to Exhibit 10.3in our Current Report on Form 8-K filed on August 27, 2014 (File No. 001-34507))
10.19 Stock Pledge Agreement, dated as of August 21, 2014, by and between VS Hercules LLC, asPledgor, and JPMorgan Chase Bank, N.A., as Pledgee. (Incorporated by reference to Exhibit 10.4 inour Current Report on Form 8-K filed on August 27, 2014 (File No. 001-34507))
10.20 Stock Pledge Agreement, dated as of August 21, 2014, by and between FDC Vitamins, LLC, asPledgor, and JPMorgan Chase Bank, N.A., as Pledgee. (Incorporated by reference to Exhibit 10.5 inour Current Report on Form 8-K filed on August 27, 2014 (File No. 001-34507))
10.21 Guarantee of Vitamin Shoppe Industries Inc. and Vitamin Shoppe, Inc. (f/k/a VS Holdings, Inc.),dated as of September 25, 2009, of obligations of VS Direct Inc. under the Amended and RestatedLoan and Security Agreement, as amended. (Incorporated by reference to Exhibit 99.8 in our CurrentReport on Form 8-K filed on September 30, 2009 (File No. 333-134983-02))
10.22 Guarantee of VS Direct Inc. and Vitamin Shoppe, Inc. (f/k/a VS Holdings, Inc.), dated as ofSeptember 25, 2009, of obligations of Vitamin Shoppe Industries Inc. under the Amended andRestated Loan and Security Agreement, as amended. (Incorporated by reference to Exhibit 99.9 inour Current Report on Form 8-K filed on September 30, 2009 (File No. 333-134983-02))
56

ExhibitNo. Description
10.23 Guarantee of Vitamin Shoppe, Inc., Vitamin Shoppe Industries Inc. and VS Direct Inc., dated as ofJanuary 10, 2013, of obligations of Vitamin Shoppe Mariner, Inc. under the Amended and RestatedLoan Agreement, as amended. (Incorporated by reference to Exhibit 10.5 in our Current Report onForm 8-K filed on October 16, 2013 (File No. 001-34507))
10.24 Guarantee of Vitamin Shoppe, Inc., Vitamin Shoppe Industries Inc., VS Direct Inc. and VitaminShoppe Mariner, Inc., dated as of October 11, 2013, of the obligations of Vitamin Shoppe Global,Inc. under the Amended and Restated Loan Agreement, as amended. (Incorporated by reference toExhibit 10.7 in our Current Report on Form 8-K filed on October 16, 2013 (File No. 001-34507))
10.25 Guarantee, dated as of August 21, 2014, by Vitamin Shoppe, Inc., Vitamin Shoppe Industries Inc.,VS Direct Inc., Vitamin Shoppe Mariner, Inc., Vitamin Shoppe Global, Inc., VS Hercules LLC, FDCVitamins, LLC and Betancourt Sports Nutrition, LLC, of the obligations of one another under theAmended and Restated Loan Agreement, as amended. (Incorporated by reference to Exhibit 10.2 inour Current Report on Form 8-K filed on August 27, 2014 (File No. 001-34507))
10.26 Joinder Agreement, dated as of January 10, 2013, by and between Vitamin Shoppe Mariner, Inc., andJPMorgan Chase Bank, N.A. (Incorporated by reference to Exhibit 10.4 in our Current Report onForm 8-K filed on October 16, 2013 (File No. 001-34507))
10.27 Joinder Agreement, dated as of October 11, 2013, by and between Vitamin Shoppe Global, Inc., andJPMorgan Chase Bank, N.A. (Incorporated by reference to Exhibit 10.6 in our Current Report onForm 8-K filed on October 16, 2013 (File No. 001-34507))
10.28 Joinder Agreement, dated as of August 21, 2014, by and between VS Hercules LLC, FDC Vitamins,LLC, Betancourt Sports Nutrition, LLC, and JPMorgan Chase Bank, N.A. (Incorporated by referenceto Exhibit 10.1 in our Current Report on Form 8-K filed on August 27, 2014 (File No. 001-34507))
10.29 Joinder Agreement, dated as of March 20, 2015 by and between Vitamin Shoppe ProcurementServices and JPMorgan Chase Bank, N.A. (Filed herewith)
10.30 Form of Indemnification Agreement by and among executive officer, Vitamin Shoppe, Inc. (f/k/a VSHoldings, Inc.) and Vitamin Shoppe Industries Inc. * (Incorporated by reference to Exhibit 10.29 inAmendment No. 4 to our Registration Statement No. 333-160756 on Form S-1 filed on October 14,2009 (File No. 333-160756))
10.31 Form of Indemnification Agreement by and among director, Vitamin Shoppe, Inc. (f/k/a VSHoldings, Inc.) and Vitamin Shoppe Industries Inc. * (Incorporated by reference to Exhibit 10.30 inAmendment No. 4 to our Registration Statement No. 333-160756 on Form S-1 filed on October 14,2009 (File No. 333-160756))
10.32 VS Parent, Inc. 2006 Stock Option Plan. * (Incorporated by reference to Exhibit 10.27 in AmendmentNo. 5 to our Registration Statement No. 333-160756 on Form S-1 filed on October 22, 2009(File No. 333-160756))
10.33 2009 Vitamin Shoppe Equity Incentive Plan. * (Incorporated by reference to Exhibit 10.27 inAmendment No. 2 to our Registration Statement No. 333-160756 on Form S-1 filed onSeptember 22, 2009 (File No. 333-160756))
10.34 Vitamin Shoppe 2010 Employee Stock Purchase Plan. * (Incorporated by reference to Exhibit 10.16in our Annual Report on Form 10-K filed on March 17, 2010 (File No. 001-34507))
10.35 Vitamin Shoppe, Inc. Executive Severance Pay Policy, amended and restated effective as ofOctober 29, 2014. (Filed herewith)
10.36 Director Compensation Plan and Stock Ownership Guidelines.* (Incorporated by reference to Exhibit10.2 in our Current Report on Form 8-K filed on January 4, 2016 (File No. 001-34507))
57

ExhibitNo. Description
10.37 Employment and Non-Competition Agreement, dated as of September 9, 2009, among RichardMarkee, VS Parent, Inc., VS Direct, Inc. Vitamin Shoppe, Inc. (f/k/a VS Holdings, Inc.) andVitamin Shoppe Industries Inc. * (Incorporated by reference to Exhibit 10.26 in Amendment No. 2to our Registration Statement No. 333-160756 on Form S-1 filed on September 22, 2009(File No. 333-160756))
10.38 Amendment No. 1 to Employment and Non-Competition Agreement, dated as of February 28,2011, by and among Richard Markee, Vitamin Shoppe, Inc. and Vitamin Shoppe Industries Inc. *(Incorporated by reference to Exhibit 10.32 in our Annual Report on Form 10-K filed on March 9,2011 (File No. 001-34507))
10.39 Amendment No. 2 to Employment and Non-Competition Agreement, dated as of March 29, 2012, byand among Richard Markee, Vitamin Shoppe, Inc. and Vitamin Shoppe Industries Inc. *(Incorporated by reference to Exhibit 10.1 in our Current Report on Form 8-K filed on April 2, 2012(File No. 001-34507))
10.40 Employment Agreement, effective January 1, 2015, by and between Vitamin Shoppe, Inc. andVitamin Shoppe Industries Inc. and Richard Markee. * (Incorporated by reference to Exhibit 10.1 inour Current Report on Form 8-K filed on January 7, 2015 (File No. 001-34507))
10.41 Letter Agreement, dated as of December 31, 2015, among Vitamin Shoppe, Inc., Vitamin ShoppeIndustries Inc. and Richard Markee. * (Incorporated by reference to Exhibit 10.1 in our CurrentReport on Form 8-K filed on January 4, 2016 (File No. 001-34507))
10.42 Employment and Non-Competition Agreement, dated as of March 3, 2015, among Colin Watts andVitamin Shoppe, Inc., Vitamin Shoppe Industries Inc. and all of their subsidiaries and affiliates. *(Incorporated by reference to Exhibit 99.2 in our Current Report on Form 8-K filed on March 4, 2015(File No. 001-34507))
10.43 Amended and Restated Employment and Non-Competition Agreement, dated as of June 12, 2006, byand among Anthony Truesdale, VS Parent, Inc., Vitamin Shoppe, Inc. (f/k/a VS Holdings, Inc.) andVitamin Shoppe Industries Inc. * (Incorporated by reference to Exhibit 10.17 in Amendment No. 1 toour Registration Statement No. 333-134983 on Form S-4 filed on June 14, 2006 (File No. 333-134983-02))
10.44 Amendment to Amended and Restated Employment and Non-Competition Agreement, dated as ofDecember 28, 2007, by and among Anthony Truesdale, VS Parent, Inc., Vitamin Shoppe, Inc. (f/k/aVS Holdings, Inc.) and Vitamin Shoppe Industries Inc. * (Incorporated by reference to Exhibit 10.36in our Annual Report on Form 10-K filed on March 28, 2008 (File No. 333-134983-02))
10.45 Amendment No. 2 to Employment and Non-Competition Agreement, dated as of September 25, 2009by and among Anthony Truesdale, VS Parent, Inc., Vitamin Shoppe, Inc. (f/k/a VS Holdings, Inc.)and Vitamin Shoppe Industries Inc. * (Incorporated by reference to Exhibit 99.2 in our CurrentReport on Form 8-K filed on September 30, 2009 (File No. 333-134983-02))
10.46 Amendment No. 3 to Employment and Non-Competition Agreement, dated as of February 28, 2011,by and among Anthony Truesdale, Vitamin Shoppe, Inc. and Vitamin Shoppe Industries Inc. *(Incorporated by reference to Exhibit 10.31 in our Annual Report on Form 10-K filed on March 9,2011 (File No. 001-34507))
10.47 Amendment No. 4 to Employment and Non-Competition Agreement, dated as of March 29, 2012, byand among Anthony Truesdale, Vitamin Shoppe, Inc. and Vitamin Shoppe Industries Inc. *(Incorporated by reference to Exhibit 10.2 in our Current Report on Form 8-K filed on April 2, 2012(File No. 001-34507))
58

ExhibitNo. Description
10.48 Letter Agreement, dated as of March 31, 2015, by and between Vitamin Shoppe, Inc. and AnthonyTruesdale. * (Incorporated by reference to Exhibit 10.1 in our Current Report on Form 8-K filed onApril 7, 2015 (File No. 001-34507))
10.49 Employment and Non-Competition Agreement, dated as of January 15, 2007, by and among Louis H.Weiss, VS Parent, Inc., VS Direct, Inc., Vitamin Shoppe, Inc. (f/k/a VS Holdings, Inc.) and VitaminShoppe Industries, Inc. * (Incorporated by reference to Exhibit 10.29 in our Current Report on Form8-K filed on January 16, 2007 (File No. 333-134983-02))
10.50 Amendment to Employment and Non-Competition Agreement, dated as of December 28, 2007, byand among Louis H. Weiss, VS Parent, Inc., VS Direct, Inc., Vitamin Shoppe, Inc. (f/k/a VSHoldings, Inc.) and Vitamin Shoppe Industries Inc. * (Incorporated by reference to Exhibit 10.33 inour Annual Report on Form 10-K filed on March 28, 2008 (File No. 333-134983-02))
10.51 Amendment No. 2 to Employment and Non-Competition Agreement, dated as of March 29, 2012,by and among Louis H. Weiss, Vitamin Shoppe, Inc. and Vitamin Shoppe Industries Inc. *(Incorporated by reference to Exhibit 10.4 in our Current Report on Form 8-K filed on April 2,2012 (File No. 001-34507))
10.52 Amendment No. 3 to Employment and Non-Competition Agreement, dated as of March 27, 2015,by and among Louis H. Weiss, Vitamin Shoppe, Inc. and Vitamin Shoppe Industries Inc. *(Incorporated by reference to Exhibit 10.2 in our Current Report on Form 8-K filed on March 30,2015 (File No. 001-34507))
10.53 Letter Agreement, dated as of January 29, 2016, among Vitamin Shoppe, Inc., Vitamin ShoppeIndustries Inc. and Louis H. Weiss (Filed herewith)
10.54 Letter Agreement, dated as of February 10, 2011, by and between Brenda Galgano and VitaminShoppe Industries, Inc. * (Incorporated by reference to Exhibit 10.29 in our Annual Report on Form10-K filed on March 9, 2011 (File No. 001-34507))
10.55 Employment and Non-Competition Agreement, dated as of March 29, 2012, by and among BrendaGalgano, Vitamin Shoppe, Inc. and Vitamin Shoppe Industries Inc. * (Incorporated by reference toExhibit 10.5 in our Current Report on Form 8-K filed on April 2, 2012 (File No. 001-34507))
10.56 Amendment to Employment and Non-Competition Agreement, dated as of March 27, 2015, byand among Vitamin Shoppe, Inc., Vitamin Shoppe Industries Inc. and Brenda Galgano. *(Incorporated by reference to Exhibit 10.1 in our Current Report on Form 8-K filed on March 30,2015 (File No. 001-34507))
10.57 Lease Agreement, dated as of May 2, 2002, by and between Hartz Mountain Industries, Inc. andVitamin Shoppe Industries Inc. (Incorporated by reference to Exhibit 10.22 in our RegistrationStatement No. 333-134983 on Form S-4 filed on June 13, 2006 (File No. 333-134983-02))
10.58 Lease Agreement, dated as of August 27, 2012, by and between CLF Ashland, LLC and VitaminShoppe Industries Inc. (Incorporated by reference to Exhibit 10.1 in our Current Report on Form 8-Kfiled on August 31, 2012 (File No. 001-34507))
10.59 Master Confirmation - Capped Accelerated Share Repurchase, dated as of November 3, 2014, by andamong Vitamin Shoppe, Inc. and JP Morgan Securities LLC, as Agent for JPMorgan Chase Bank,National Association, London Branch. (Incorporated by reference to Exhibit 10.1 in our CurrentReport on Form 8-K filed on November 6, 2014 (File No. 001-34507))
10.60 Master Confirmation - Capped Accelerated Share Repurchase, dated as of December 7, 2015, by andamong Vitamin Shoppe, Inc. and JP Morgan Securities LLC, as Agent for JPMorgan Chase Bank,National Association, London Branch. (Incorporated by reference to Exhibit 10.10 in our CurrentReport on Form 8-K filed on December 10, 2015 (File No. 001-34507))
59

ExhibitNo. Description
10.61 Agreement, dated as of January 12, 2016, by and between the Company and Carlson Capital.(Incorporated by reference to Exhibit 10.1 in our Current Report on Form 8-K filed on January 12,2016 (File No. 001-34507))
21.1 Subsidiaries of the Registrant. (Filed herewith)
23.1 Consent of Independent Registered Public Accounting Firm. (Filed herewith)
31.1 Certification of Chief Executive Officer pursuant to Section 302 of the Sarbanes-Oxley Act of 2002.(Filed herewith)
31.2 Certification of Chief Financial Officer pursuant to Section 302 of the Sarbanes-Oxley Act of 2002.(Filed herewith)
32.1 Certification pursuant to 18 U.S.C. Section 1350, as adopted pursuant to Section 906 of the Sarbanes-Oxley Act of 2002 – Chief Executive Officer. (Filed herewith )
32.2 Certification pursuant to 18 U.S.C. Section 1350, as adopted pursuant to Section 906 of the Sarbanes-Oxley Act of 2002 – Chief Financial Officer. (Filed herewith )
101 The following financial information from the Company’s Annual Report on Form 10-K for the fiscalyear ended December 26, 2015, formatted in eXtensible Business Reporting Language (XBRL): (a)Consolidated Balance Sheets as of December 26, 2015 and December 27, 2014; (b) ConsolidatedStatements of Income for the fiscal years ended December 26, 2015, December 27, 2014, andDecember 28, 2013; (c) Consolidated Statements of Comprehensive Income for the fiscal yearsended December 26, 2015, December 27, 2014, and December 28, 2013; (d) Consolidated Statementsof Stockholders’ Equity for the fiscal years ended December 26, 2015, December 27, 2014, andDecember 28, 2013; (e) Consolidated Statements of Cash Flows for the fiscal years endedDecember 26, 2015, December 27, 2014, and December 28, 2013; and (f) Notes to ConsolidatedFinancial Statements for the fiscal years ended December 26, 2015, December 27, 2014, andDecember 28, 2013.
* Management contract or compensation plan or arrangement.
60

SIGNATURES
Pursuant to the requirements of Section 13 or 15(d) of the Securities Exchange Act of 1934, the registrant hasduly caused this report to be signed on its behalf by the undersigned, thereunto duly authorized, on February 23,2016.
VITAMIN SHOPPE, INC.
By: /S/ Colin Watts
Colin WattsChief Executive Officer
(Principal Executive Officer)
Pursuant to the requirements of the Securities Exchange Act of 1934, this report has been signed below by thefollowing persons on behalf of the registrant and in the capacities and on the dates indicated.
Name Title Date
By: /S/ Richard L. Markee
Richard L. Markee
Non-Executive Chairman, Director February 23, 2016
By: /S/ Colin Watts
Colin Watts
Chief Executive Officer, Director(Principal Executive Officer)
February 23, 2016
By: /S/ Brenda Galgano
Brenda Galgano
EVP, Chief Financial Officer(Principal Financial Officer)
February 23, 2016
By: /S/ Daniel Lamadrid
Daniel Lamadrid
SVP, Chief Accounting Officer(Principal Accounting Officer)
February 23, 2016
By: /S/ John Bowlin
John Bowlin
Lead Director February 23, 2016
By: /S/ B. Michael Becker
B. Michael Becker
Director February 23, 2016
By: /s/ Catherine Buggeln
Catherine Buggeln
Director February 23, 2016
By: /S/ Deborah M. Derby
Deborah M. Derby
Director February 23, 2016
By: /S/ John H. Edmondson
John H. Edmondson
Director February 23, 2016
By: /S/ David H. Edwab
David H. Edwab
Director February 23, 2016
By: /S/ Richard L. Perkal
Richard L. Perkal
Director February 23, 2016
By: /S/ Beth M. Pritchard
Beth M. Pritchard
Director February 23, 2016
61

MANAGEMENT’S REPORT ON INTERNAL CONTROL OVER FINANCIAL REPORTING
Our management is responsible for establishing and maintaining adequate internal control over financialreporting (as defined under the Exchange Act) to provide reasonable assurance regarding the reliability offinancial reporting and the preparation of financial statements for external purposes in accordance with generallyaccepted accounting principles in the United States of America (“GAAP”). Such internal control includes thosepolicies and procedures that (i) pertain to the maintenance of records that in reasonable detail accurately andfairly reflect the transactions and dispositions of the assets; and (ii) provide reasonable assurance (A) thattransactions are recorded as necessary to permit preparation of financial statements in accordance with GAAPand that receipts and expenditures of the Company are being made only in accordance with authorizations ofmanagement and directors; and (B) regarding prevention or timely detection of unauthorized acquisition, use ordisposition of our assets that could have a material effect on the financial statements.
Our management assessed the effectiveness of our internal control over financial reporting as of December 26,2015. In making this assessment, it used the criteria set forth in Internal Control – Integrated Framework issuedby the Committee of Sponsoring Organizations of the Treadway Commission (COSO) published in 2013. Basedon this assessment, management has determined that, as of December 26, 2015, our internal control overfinancial reporting is effective based on those criteria.
The Company’s internal control over financial reporting as of December 26, 2015 has been audited by Deloitte &Touche LLP, an independent registered public accounting firm, as stated in their attestation report which appearsherein.
February 23, 2016
/S/ Colin Watts /S/ Brenda Galgano
Colin Watts Brenda GalganoChief Executive Officer EVP and Chief Financial Officer
62

MANAGEMENT’S RESPONSIBILITY FOR FINANCIAL STATEMENTS
The management of Vitamin Shoppe, Inc. is responsible for the preparation, objectivity and integrity of theconsolidated financial statements and other information contained in this Annual Report on Form 10-K. Theconsolidated financial statements have been prepared in accordance with accounting principles generallyaccepted in the United States of America and include some amounts that are based on management’s informedjudgments and best estimates.
Deloitte & Touche LLP, an independent registered public accounting firm, has audited these consolidatedfinancial statements in accordance with the standards of the Public Company Accounting Oversight Board(United States) and has expressed herein their unqualified opinion on those financial statements.
The Audit Committee of the Board of Directors, which oversees all of the Company’s financial reporting processon behalf of the Board of Directors, consists solely of independent directors, meets with the independentregistered public accounting firm, internal auditors and management periodically to review their respectiveactivities and the discharge of their respective responsibilities. Both the independent registered public accountingfirm and the internal auditors have unrestricted access to the Audit Committee, with or without management, todiscuss the scope and results of their audits and any recommendations regarding the system of internal controls.
February 23, 2016
/S/ Colin Watts /S/ Brenda Galgano
Colin Watts Brenda GalganoChief Executive Officer EVP and Chief Financial Officer
63

REPORT OF INDEPENDENT REGISTERED PUBLIC ACCOUNTING FIRM
To the Board of Directors and Stockholders ofVitamin Shoppe, Inc.Secaucus, New Jersey
We have audited the internal control over financial reporting of Vitamin Shoppe, Inc. and Subsidiary (the“Company”) as of December 26, 2015, based on criteria established in Internal Control – Integrated Framework(2013) issued by the Committee of Sponsoring Organizations of the Treadway Commission. The Company’smanagement is responsible for maintaining effective internal control over financial reporting and for itsassessment of the effectiveness of internal control over financial reporting, included in the accompanyingManagement’s Report on Internal Control over Financial Reporting. Our responsibility is to express an opinionon the Company’s internal control over financial reporting based on our audit.
We conducted our audit in accordance with the standards of the Public Company Accounting Oversight Board(United States). Those standards require that we plan and perform the audit to obtain reasonable assurance aboutwhether effective internal control over financial reporting was maintained in all material respects. Our auditincluded obtaining an understanding of internal control over financial reporting, assessing the risk that a materialweakness exists, testing and evaluating the design and operating effectiveness of internal control based on theassessed risk, and performing such other procedures as we considered necessary in the circumstances. We believethat our audit provides a reasonable basis for our opinion.
A company’s internal control over financial reporting is a process designed by, or under the supervision of, thecompany’s principal executive and principal financial officers, or persons performing similar functions, andeffected by the company’s board of directors, management, and other personnel to provide reasonable assuranceregarding the reliability of financial reporting and the preparation of financial statements for external purposes inaccordance with generally accepted accounting principles. A company’s internal control over financial reportingincludes those policies and procedures that (1) pertain to the maintenance of records that, in reasonable detail,accurately and fairly reflect the transactions and dispositions of the assets of the company; (2) provide reasonableassurance that transactions are recorded as necessary to permit preparation of financial statements in accordancewith generally accepted accounting principles, and that receipts and expenditures of the company are being madeonly in accordance with authorizations of management and directors of the company; and (3) provide reasonableassurance regarding prevention or timely detection of unauthorized acquisition, use, or disposition of thecompany’s assets that could have a material effect on the financial statements.
Because of the inherent limitations of internal control over financial reporting, including the possibility ofcollusion or improper management override of controls, material misstatements due to error or fraud may not beprevented or detected on a timely basis. Also, projections of any evaluation of the effectiveness of the internalcontrol over financial reporting to future periods are subject to the risk that the controls may become inadequatebecause of changes in conditions, or that the degree of compliance with the policies or procedures maydeteriorate.
In our opinion, the Company maintained, in all material respects, effective internal control over financialreporting as of December 26, 2015, based on the criteria established in Internal Control – Integrated Framework(2013) issued by the Committee of Sponsoring Organizations of the Treadway Commission.
We have also audited, in accordance with the standards of the Public Company Accounting Oversight Board(United States), the consolidated financial statements as of and for the fiscal year ended December 26, 2015 ofthe Company and our report dated February 23, 2016 expressed an unqualified opinion on those financialstatements.
/s/ Deloitte & Touche LLPNew York, New YorkFebruary 23, 2016
64

REPORT OF INDEPENDENT REGISTERED PUBLIC ACCOUNTING FIRM
To the Board of Directors and Stockholders ofVitamin Shoppe, Inc.Secaucus, New Jersey
We have audited the accompanying consolidated balance sheets of Vitamin Shoppe, Inc. and Subsidiary (the“Company”) as of December 26, 2015 and December 27, 2014, and the related consolidated statements ofincome, comprehensive income, stockholders’ equity, and cash flows for each of the three fiscal years in theperiod ended December 26, 2015. These financial statements are the responsibility of the Company’smanagement. Our responsibility is to express an opinion on these financial statements based on our audits.
We conducted our audits in accordance with the standards of the Public Company Accounting Oversight Board(United States). Those standards require that we plan and perform the audit to obtain reasonable assurance aboutwhether the consolidated financial statements are free of material misstatement. An audit includes examining, ona test basis, evidence supporting the amounts and disclosures in the financial statements. An audit also includesassessing the accounting principles used and significant estimates made by management, as well as evaluatingthe overall financial statement presentation. We believe that our audits provide a reasonable basis for ouropinion.
In our opinion, such consolidated financial statements present fairly, in all material respects, the financialposition of the Company as of December 26, 2015 and December 27, 2014, and the results of their operationsand their cash flows for each of the three fiscal years in the period ended December 26, 2015, in conformity withaccounting principles generally accepted in the United States of America.
We have also audited, in accordance with the standards of the Public Company Accounting Oversight Board(United States), the Company’s internal control over financial reporting as of December 26, 2015, based oncriteria established in Internal Control – Integrated Framework (2013) issued by the Committee of SponsoringOrganizations of the Treadway Commission and our report dated February 23, 2016 expressed an unqualifiedopinion on the Company’s internal control over financial reporting.
/s/ Deloitte & Touche LLPNew York, New YorkFebruary 23, 2016
65

VITAMIN SHOPPE, INC. AND SUBSIDIARYCONSOLIDATED BALANCE SHEETS
(In thousands, except share and per share data)
December 26,2015
December 27,2014
ASSETSCurrent assets:
Cash and cash equivalents $ 15,104 $ 12,166Accounts receivable, net of allowance of $897 and $1,883 in 2015 and 2014,
respectively 7,437 10,376Inventories 226,830 187,027Prepaid expenses and other current assets 25,194 29,580Deferred income taxes — 7,449
Total current assets 274,565 246,598Property and equipment, net 140,158 140,596Goodwill 243,269 243,269Other intangibles, net 87,270 89,025Other long-term assets 3,429 2,903
Total assets $748,691 $722,391
LIABILITIES AND STOCKHOLDERS’ EQUITYCurrent liabilities:
Revolving credit facility $ 8,000 $ 8,000Accounts payable 41,217 37,396Deferred sales 20,483 22,499Accrued expenses and other current liabilities 47,776 53,321
Total current liabilities 117,476 121,216Convertible notes, net 115,410 —Deferred income taxes — 9,151Deferred rent 39,889 39,388Other long-term liabilities 615 702
Commitments and contingencies
Stockholders’ equity:Preferred stock, $0.01 par value; 250,000,000 shares authorized and no shares
issued and outstanding at December 26, 2015 and December 27, 2014 — —Common stock, $0.01 par value; 400,000,000 shares authorized, 25,993,715
shares issued and 25,873,581 shares outstanding at December 26, 2015, and30,106,337 shares issued and 30,048,881 shares outstanding at December 27,2014 260 301
Additional paid-in capital 139,827 267,083Treasury stock, at cost; 120,134 shares at December 26, 2015 and 57,456 shares
at December 27, 2014 (5,225) (2,695)Accumulated other comprehensive loss (60) (83)Retained earnings 340,499 287,328
Total stockholders’ equity 475,301 551,934
Total liabilities and stockholders’ equity $748,691 $722,391
See accompanying notes to consolidated financial statements.
66

VITAMIN SHOPPE, INC. AND SUBSIDIARYCONSOLIDATED STATEMENTS OF INCOME(In thousands, except share and per share data)
Fiscal Year Ended
December 26,2015
December 27,2014
December 28,2013
Net sales $ 1,266,549 $ 1,213,046 $ 1,087,469Cost of goods sold 847,634 808,787 709,823
Gross profit 418,915 404,259 377,646Selling, general and administrative expenses 329,922 301,603 267,354
Income from operations 88,993 102,656 110,292Interest expense, net 1,105 495 495
Income before provision for income taxes 87,888 102,161 109,797Provision for income taxes 34,717 40,920 43,251
Net income $ 53,171 $ 61,241 $ 66,546
Weighted average common shares outstandingBasic 28,954,804 30,239,183 29,992,620Diluted 29,203,429 30,664,105 30,541,057
Net income per common shareBasic $ 1.84 $ 2.03 $ 2.22Diluted $ 1.82 $ 2.00 $ 2.18
See accompanying notes to consolidated financial statements.
67

VITAMIN SHOPPE, INC. AND SUBSIDIARYCONSOLIDATED STATEMENTS OF COMPREHENSIVE INCOME
(In thousands)
Fiscal Year Ended
December 26,2015
December 27,2014
December 28,2013
Net income $53,171 $61,241 $66,546Other comprehensive income (loss):
Foreign currency translation adjustments 23 3 (87)
Other comprehensive income (loss) 23 3 (87)
Comprehensive income $53,194 $61,244 $66,459
See accompanying notes to consolidated financial statements.
68

VITAMIN SHOPPE, INC. AND SUBSIDIARYCONSOLIDATED STATEMENTS OF STOCKHOLDERS’ EQUITY
(In thousands, except share data)
Common Stock Treasury Stock AdditionalPaid-InCapital
AccumulatedOther
Comprehensive(Loss) Income
RetainedEarnings TotalShares Amounts Shares Amounts
Balance at December 29, 2012 30,170,627 $302 — $ — $ 287,574 $ 1 $159,541 $ 447,418Comprehensive (loss) income — — — — — (87) 66,546 66,459Equity compensation — — — — 8,333 — — 8,333Issuance of restricted shares 166,573 1 — — (1) — — —Purchase of treasury stock — — (6,316) (280) — — — (280)Cancelation of restricted
shares (16,610) — — — — — — —Issuance of shares under
employee stock purchaseplan 20,887 — — — 849 — — 849
Exercise of stock options 190,073 2 — — 3,485 — — 3,487Tax benefits on exercise of
equity awards — — — — 2,074 — — 2,074
Balance at December 28, 2013 30,531,550 305 (6,316) (280) 302,314 (86) 226,087 528,340Comprehensive income — — — — — 3 61,241 61,244Equity compensation — — — — 6,901 — — 6,901Issuance of restricted shares 194,929 2 — — (2) — — —Purchases of treasury stock — — (51,140) (2,415) — — — (2,415)Purchases of shares under
Share Repurchase Program (1,183,714) (12) — — (57,803) — — (57,815)Cancelation of restricted
shares (14,691) — — — — — — —Issuance of shares under
employee stock purchaseplan 24,289 — — — 923 — — 923
Exercise of stock options 553,974 6 — — 9,387 — — 9,393Tax benefits on exercise of
equity awards — — — — 5,363 — — 5,363
Balance at December 27, 2014 30,106,337 301 (57,456) (2,695) 267,083 (83) 287,328 551,934Comprehensive income — — — — — 23 53,171 53,194Equity compensation — — — — 5,402 — — 5,402Issuance of restricted shares 271,716 3 — — (3) — — —Issuance of shares 5,184 — — — 167 — — 167Purchases of treasury stock — — (62,678) (2,530) — — — (2,530)Purchases of shares under
Share Repurchase Program (4,328,055) (43) — — (146,065) — — (146,108)Cancelation of restricted
shares (145,117) (2) — — 2 — — —Issuance of shares under
employee stock purchaseplan 27,187 — — — 892 — — 892
Exercise of stock options 56,463 1 — — 1,351 — — 1,352Equity portion of convertible
notes, net — — — — 24,948 — — 24,948Bond hedge purchase — — — — (26,407) — — (26,407)Warrant sale — — — — 12,966 — — 12,966Tax benefits on exercise of
equity awards — — — — (509) — — (509)
Balance at December 26, 2015 25,993,715 $260 (120,134) $(5,225) $ 139,827 $ (60) $340,499 $ 475,301
See accompanying notes to consolidated financial statements.
69

VITAMIN SHOPPE, INC. AND SUBSIDIARYCONSOLIDATED STATEMENTS OF CASH FLOWS
(In thousands)
Fiscal Year Ended
December 26,2015
December 27,2014
December 28,2013
Cash flows from operating activities:Net income $ 53,171 $ 61,241 $ 66,546Adjustments to reconcile net income to net cash provided by operating activities:
Depreciation and amortization of fixed and intangible assets 38,495 34,219 28,026Impairment charges on fixed assets 1,177 419 —Contingent consideration for acquisition of FDC Vitamins, LLC (959) 959 —Gain on insurance recoveries — — (1,079)Amortization of deferred financing fees 237 164 96Amortization of debt discount on convertible notes 223 — —Deferred income taxes (1,364) (3,950) 545Deferred rent (2,294) (503) 810Equity compensation expense 5,491 6,901 8,333Issuance of shares for services rendered 167 — —Proceeds from insurance recoveries — — 757Tax benefits on exercises of equity awards 509 (5,363) (2,074)Changes in operating assets and liabilities:
Accounts receivable 2,939 1,499 —Inventories (38,284) (2,458) (13,429)Prepaid expenses and other current assets 3,889 3,782 (15,668)Other long-term assets (139) 2,441 (968)Accounts payable (3,709) (9,869) 11,688Deferred sales (2,011) 787 734Accrued expenses and other current liabilities 394 8,483 (1,416)Other long-term liabilities 2,735 1,395 (1,779)
Net cash provided by operating activities 60,667 100,147 81,122
Cash flows from investing activities:Capital expenditures (39,403) (42,957) (42,782)Acquisition of FDC Vitamins, LLC 487 (81,538) —Acquisition of Super Supplements, Inc — — (50,542)Trademarks and other intangible assets (514) (689) (648)Proceeds from insurance recoveries — — 322
Net cash used in investing activities (39,430) (125,184) (93,650)
Cash flows from financing activities:Borrowings under revolving credit agreement 47,000 15,000 —Repayments of borrowings under revolving credit agreement (47,000) (7,000) —Proceeds from issuance of convertible notes 143,750 — —Debt issuance costs on convertible notes (4,593) — —Bond hedge purchase (26,407) — —Proceeds from sale of warrants 12,966 — —Contingent consideration payment for acquisition of FDC Vitamins, LLC (4,041) — —Bank overdraft 6,973 — —Payments of capital lease obligations (80) (152) (135)Proceeds from exercises of common stock options 1,352 9,393 3,487Issuance of shares under employee stock purchase plan 892 923 849Purchases of treasury stock (2,530) (2,415) (280)Purchases of shares under Share Repurchase Programs (146,108) (57,815) —Tax benefits on exercises of equity awards (509) 5,363 2,074Deferred financing fees and other (93) (174) (532)
Net cash (used in) provided by financing activities (18,428) (36,877) 5,463
Effect of exchange rate changes on cash and cash equivalents 129 44 (67)
Net increase (decrease) in cash and cash equivalents 2,938 (61,870) (7,132)Cash and cash equivalents beginning of year 12,166 74,036 81,168
Cash and cash equivalents end of year $ 15,104 $ 12,166 $ 74,036
Supplemental disclosures of cash flow information:Interest paid $ 440 $ 249 $ 390Income taxes paid $ 33,659 $ 37,652 $ 57,064
Supplemental disclosures of non-cash investing activities:Liability for purchases of property and equipment $ 7,497 $ 8,379 $ 7,106Assets acquired under capital lease $ — $ — $ 314
See accompanying notes to consolidated financial statements.
70

VITAMIN SHOPPE, INC. AND SUBSIDIARYNOTES TO CONSOLIDATED FINANCIAL STATEMENTS
1. Basis of Presentation
Vitamin Shoppe, Inc. (“VSI”), is incorporated in the State of Delaware, and through its wholly-owned subsidiary,Vitamin Shoppe Industries Inc. (“Subsidiary” or “Industries” together with VSI, the “Company”), is a multi-channel specialty retailer and contract manufacturer of nutritional products. Sales of both national brands and ourown brands of vitamins, minerals, herbs, specialty supplements, sports nutrition and other health and wellnessproducts (“VMS products”) are made through VSI-operated retail stores, and the internet to customers locatedprimarily in the United States. In addition, the Company manufactures products for both sales to third parties aswell as for the VSI product assortment.
The consolidated financial statements for the fiscal years ended December 26, 2015, December 27, 2014 andDecember 28, 2013 include the accounts of VSI and Subsidiary. All intercompany transactions and balances havebeen eliminated in consolidation.
The Company’s fiscal year ends on the last Saturday in December. As used herein, the term “Fiscal Year” or“Fiscal” refers to a 52-week period, ending on the last Saturday in December.
On June 6, 2014, the Company acquired all of the outstanding equity interests of FDC Vitamins, LLC d/b/aNutri-Force Nutrition (“Nutri-Force”), a company which provides custom manufacturing and private labeling ofvitamins, dietary supplements, nutraceuticals and nutritional supplements, as well as, develops and markets itsown branded products. The total purchase price was $86.1 million in cash, which includes $5.0 million ofcontingent consideration which was paid in Fiscal 2015. Refer to Note 3. Acquisitions for additional information.
On February 14, 2013, the Company acquired substantially all of the assets and assumed certain liabilities ofSuper Supplements, Inc. (“Super Supplements”), a specialty retailer of vitamins, minerals, specialty supplementsand sports nutrition, including 31 retail locations in the Pacific Northwest, a distribution center in Seattle,Washington and an e-commerce business. The total purchase price was $50.5 million in cash and the assumptionof certain liabilities. Refer to Note 3. Acquisitions for additional information.
2. Summary of Significant Accounting Policies
Use of Estimates – The preparation of financial statements in conformity with accounting principles generallyaccepted in the United States of America (“GAAP”) requires management to make estimates and assumptionsthat affect the reported amounts of assets and liabilities, and disclosures of contingent assets and liabilities at thedate of the financial statements, and revenue and expenses during the reporting period. Actual results could differfrom those estimates.
Cash and Cash Equivalents – Cash and cash equivalents include all highly liquid investments with originalmaturities of ninety days or less. The Company reclassifies cash overdrafts to accounts payable.
Accounts Receivable – Through Nutri-Force, the Company sells product to third-party wholesale customers. TheCompany monitors the financial condition of its third-party wholesale customers and establishes an allowance fordoubtful accounts for balances estimated to be uncollectible. In addition, customer allowances includingpromotional discounts and allowances are provided to wholesale customers based on various contract terms andare recorded as a reduction to revenue.
71

The following table details the activity and balances for the Company’s customer allowances for the years endedDecember 26, 2015 and December 27, 2014 (in thousands):
Balance atBeginningof Fiscal
Year Additions Deductions
Balance atEnd of
Fiscal Year
Period Ended December 26, 2015 $1,883.2 $2,751.9 $(3,738.4) $ 896.7Period Ended December 27, 2014 $ — $3,194.2 $(1,311.0) $1,883.2
Inventories – Inventories are stated at the lower of cost or market value. Cost is determined using the weightedaverage method. Finished goods inventory includes costs of freight on internally transferred merchandise, andcosts associated with our buying department and distribution facilities, as well as manufacturing overhead whichare capitalized into inventory and then expensed as merchandise is sold. In addition, the cost of inventory isreduced by purchase discounts and other allowances received from certain of our vendors. The Companyestimates losses for expiring inventory and the net realizable value of inventory based on when a product is closeto expiration and not expected to be sold, when a product has reached its expiration date, or when a product is notexpected to be saleable. In determining the reserves for these products, consideration is given to such factors asthe amount of inventory on hand, the remaining shelf life, current and expected market conditions, historicaltrends and the likelihood of recovering the inventory costs based on anticipated demand. The following tabledetails the activity and balances for the Company’s reserve for inventory for the years ended December 26,2015, December 27, 2014, and December 28, 2013 (in thousands):
Balance atBeginningof Fiscal
Year
AmountsCharged to
Cost ofGoods Sold
Write-OffsAgainstReserves
Balance atEnd of
Fiscal Year
Fiscal Year Ended December 26, 2015 $3,121.0 $9,809.2 $(7,991.1) $4,939.1Fiscal Year Ended December 27, 2014 2,640.3 5,866.6 (5,385.9) 3,121.0Fiscal Year Ended December 28, 2013 1,841.2 4,637.9 (3,838.8) 2,640.3
Property and Equipment, Net – Property and equipment, net is stated at cost less accumulated depreciation andamortization. Depreciation and amortization are provided for on a straight-line basis over the estimated usefullives of the related assets. Furniture, fixtures and equipment are generally depreciated over seven years.Leasehold improvements are amortized generally over the shorter of their useful lives or related lease terms. Thedirect internal and external costs associated with the development of the features and functionality of theCompany’s website, transaction processing systems, telecommunications infrastructure and network operations,are capitalized and are amortized on a straight line basis over the estimated useful lives of generally five years.Capitalization of costs begins when the preliminary project stage is completed and management authorizes andcommits to funding the computer software project and that it is probable that the project will be completed andthe software will be used to perform the function intended. Depreciation of the assets commences when they areput into use. Expenditures for repairs and maintenance are expensed as incurred and expenditures for majorrenovations and improvements are capitalized. Upon retirement or disposition of property and equipment, theapplicable cost and accumulated depreciation are removed from the accounts and any resulting gains or losses areincluded in the results of operations.
Impairment of Long-Lived Assets – The Company reviews its long-lived assets for impairment whenever eventsor changes in circumstances, including store closures, indicate that the carrying amount of an asset may not berecoverable. Recoverability of assets held and used is measured by a comparison of the carrying amount of anasset to undiscounted pre-tax future net cash flows expected to be generated by that asset. If the undiscountedfuture cash flows are not adequate to recover the carrying value of the asset, an impairment loss is recognized forthe amount by which the carrying amount of the assets exceeds the fair value of the assets.
72

Goodwill and Other Intangibles – Goodwill and other indefinite-lived intangibles are not amortized. Evaluationsfor impairment are performed at least annually, in the fourth quarter of each year, or whenever impairmentindicators exist. Goodwill is evaluated for impairment at the reporting unit level (the Company’s operatingsegments). The evaluation of goodwill and other indefinite-lived intangibles may first consider qualitative factorsto determine whether the existence of events or circumstances leads to a determination that it is more likely thannot that the fair value is less than its carrying value. A quantitative evaluation is performed if the qualitativeevaluation results in a more likely than not determination or if a qualitative evaluation is not performed. TheCompany’s quantitative impairment tests involve calculating the fair value of each reporting unit using thediscounted cash flow analysis method along with the market multiples method which is used for additionalvalidation of the fair value calculated. These valuation methods require certain assumptions and estimates bemade by the Company regarding certain industry trends and future profitability. It is the Company’s policy toconduct goodwill impairment testing from information based on current business projections, which includeprojected future revenues and cash flows. The cash flows utilized in the discounted cash flow analysis are basedon five-year financial forecasts developed internally by management. Cash flows for each reporting unit arediscounted using an internally derived weighted average cost of capital which reflects the costs of borrowing forthe funding of each unit as well as the risk associated with the units themselves. If the carrying amount of areporting unit exceeds its fair value, the Company would compare the implied fair value of the reporting unitgoodwill with its carrying value. To compute the implied fair value of goodwill, the Company would assign thefair value of the reporting unit to all of the assets and liabilities of that unit (including any unrecognizedintangible assets) as if the reporting unit had been acquired in a business combination. The excess of the fairvalue of a reporting unit over the amounts assigned to its assets and liabilities is the implied fair value ofgoodwill. Also as part of the quantitative test, the Company conducts the test using a 10% decrease in its revenueprojections as an additional sensitivity test to ensure the reporting unit’s fair value is greater than its carryingvalue should events in the future be less favorable than anticipated. For indefinite-lived tradenames, we utilizethe royalty relief method in our quantitative evaluations. Under the royalty relief method, a royalty rate isdetermined based on comparable licensing arrangements which is applied to the revenue projections for theapplicable indefinite-lived tradename and the fair value is calculated using a discounted cash flow analysis. Tothe extent that the implied fair value associated with the goodwill and indefinite-lived intangible assets is lessthan the recorded value, this would result in a write down of the carrying value of the asset. Impairment testsbetween annual tests may be undertaken if an event occurs or circumstances change that could reduce the fairvalue of a reporting unit below its carrying value. The valuation of the goodwill and indefinite-lived intangibleassets is affected by, among other things, the Company’s projections for the future and estimated results of futureoperations. Changes in the business plan or operating results that are different than the estimates used to developthe valuation of the assets may impact these valuations. For those intangible assets which have definite lives, theCompany amortizes their cost on a straight-line basis over their estimated useful lives, the periods of which varybased on their particular contractual terms.
In Fiscal 2015, the Company performed a quantitative analysis of its retail, direct and manufacturing reportingunits and determined that the fair value of these reporting units and indefinite-lived tradenames weresubstantially greater than their respective carrying values, with the exception of the manufacturing reporting unit.
Since the acquisition, Nutri-Force has experienced disruption in its ability to optimize production capacity andcorrespondingly has experienced lower service levels to customers.
As of the annual testing date, the fair value of the manufacturing reporting unit exceeded the carrying value byapproximately 5%. Goodwill for the manufacturing reporting unit is $32.6 million. The assumptions whichimpact the estimated fair value include management projections, the weighted average cost of capital percentageincluding the company specific risk premium and the selection of comparable companies. The uncertaintyassociated with the key assumptions relates primarily to the performance of Nutri-Force in comparison tomanagement projections, which includes improvements in operating efficiencies, the ability to transitionadditional Vitamin Shoppe branded products, and increase sales to third party customers.
73

The Company has taken steps to improve the operations at Nutri-Force, including the hiring of new leadershipand the engagement of third-party manufacturing consultants to implement and improve manufacturingprocesses. The Company believes the disruption noted above should not impact the long-term opportunity fromthe Nutri-Force acquisition. Although the Company believes it has used reasonable estimates and assumptions tocalculate the fair value of the manufacturing reporting unit, these estimates and assumptions could be materiallydifferent from actual results. If actual market conditions are less favorable than those projected, or if events occuror circumstances change that would reduce the fair value of this reporting unit below its carrying value, theCompany may be required to conduct an interim test and possibly recognize impairment charges, which may bematerial, in future periods.
There have been no impairment charges related to other intangibles during Fiscal 2015, Fiscal 2014 and Fiscal2013.
Rent Expenses, Deferred Rent and Landlord Construction Allowances – Rent expense and rent incentives,including landlord construction allowances, are recognized on a straight-line basis over the lease term. TheCompany records rent expense for stores, distribution centers and manufacturing facilities as a component of costof goods sold. The Company accounts for landlord construction allowances as lease incentives and records themas a component of deferred rent, which is recognized in cost of goods sold over the lease term.
Revenue Recognition – The Company recognizes revenue when merchandise is sold “at point of sale” in retailstores or upon delivery to a direct customer. In addition, shipping fees billed to customers are classified as sales.Amount recognized as shipping revenue during Fiscal 2015, Fiscal 2014, and Fiscal 2013, were $2.0 million,$3.0 million, and $2.5 million, respectively. Nutri-Force sells product primarily to third-party customers and toour retail and direct segments. Wholesale revenue is recognized when risk of loss, title and insurable risks havetransferred to the customer, net of estimated returns and allowances. To arrive at net sales, gross sales arereduced by deferred sales, customer discounts, actual customer returns and a provision for estimated futurecustomer returns, which is based on management’s review of historical and current customer returns. Sales taxescollected from customers are presented on a net basis and as such are excluded from revenue.
Cost of Goods Sold – The Company includes the cost of inventory sold, costs of warehousing, distribution,manufacturing and store occupancy costs in cost of goods sold and excludes depreciation and amortizationrelated to the retail and direct segments, which is included within selling, general and administrative expenses.Warehousing, distribution and manufacturing costs, which are capitalized into inventory and then expensed asmerchandise is sold, include freight on internally transferred merchandise as well as for shipments to direct andwholesale customers and costs associated with our buying department and distribution facilities, as well asmanufacturing overhead. Store occupancy costs include rent, common area maintenance, real estate taxes andutilities.
Vendor Allowances – Vendor allowances include discounts, allowances and rebates received from vendors andare based on various contract terms. Vendor allowances are recognized as either purchase discounts whichrepresent a reduction of product cost, funding which is capitalized into inventory and recognized in the statementof income as the merchandise is sold, or direct offset which represents funding subject to immediate recognitionin the statement of income, depending on the nature of the allowance.
Frequent Buyer Program – The Company has a frequent buyer program (“Healthy Awards Program”), wherebycustomers earn points toward free merchandise based on the dollar volume of purchases. Points are earned eachcalendar year and must be redeemed within the first three months of the following year or they expire. Sales aredeferred at the time points are earned based on the value of points that are projected to be redeemed, which arebased on historical redemption data. The Company records a liability in the period points are earned with acorresponding reduction of sales.
Store Pre-opening Costs – Costs associated with the opening of new retail stores and start up activities areexpensed as incurred.
74

Advertising Costs – The costs of advertising for online marketing arrangements, magazines, direct mail,television and radio are expensed the first time the advertising takes place. Advertising expense was $21.6million, $19.3 million and $16.5 million for Fiscal 2015, Fiscal 2014 and Fiscal 2013, respectively.
Online Marketing Arrangements – The Company has entered into online marketing arrangements with variousonline companies. These agreements are established for periods of 24 months, 12 months or, in some cases, alesser period and generally provide for compensation based on revenue sharing upon the attainment of stipulatedrevenue amounts, a percentage of the media expenditure managed by the online partner, or based on the numberof visitors that the online company refers to the Company. The Company had no fixed payment commitmentsduring Fiscal 2015, Fiscal 2014 and Fiscal 2013.
Income Taxes – Deferred income tax assets and liabilities are recorded in accordance with the liability method.Deferred income taxes have been provided for temporary differences between the tax bases and financialreporting bases of the Company’s assets and liabilities using the tax rates and laws in effect for the periods inwhich the differences are expected to reverse.
The Company accounts for tax positions based on the provisions of the accounting literature related toaccounting for uncertainty in income tax positions. Such literature provides guidance for the recognitionthreshold and measurement attribute for financial statement recognition and measurement of a tax position takenor expected to be taken in a tax return. For tax positions that are not more likely than not sustainable upon audit,the Company recognizes the largest amount of the benefit that is more likely than not to be sustained. TheCompany makes estimates of the potential liability based on our assessment of all potential tax exposures. Inaddition, the Company uses factors such as applicable tax laws and regulations, current information and pastexperience with similar issues to make these assessments. The tax positions are analyzed regularly andadjustments are made as events occur that warrant adjustments for those positions. The Company records interestexpense and penalties payable to relevant tax authorities as income tax expense.
Concentrations of Credit Risk – Financial instruments, which potentially subject the Company to concentrationsof credit risk, include accounts receivable from wholesale customers as well as debit and credit card processorsof retail transactions. As of December 26, 2015 and December 27, 2014, five customers representedapproximately 53% and 60%, respectively, of the accounts receivable from wholesale customers. Accountsreceivable from debit and credit card processors, included in prepaid expenses and other current assets on theconsolidated balance sheets, totaled $10.2 million at December 26, 2015 and $7.2 million at December 27, 2014.
The Company had two suppliers from whom we purchased at least 5% of our merchandise during Fiscal 2015and one supplier from whom we purchased at least 5% of our merchandise during Fiscal 2014 and Fiscal 2013.We purchased approximately 17% of our total merchandise from these suppliers during Fiscal 2015 andapproximately 12% during Fiscal 2014 and 10% during Fiscal 2013.
The Company is subject to concentrations of credit risk associated with cash and cash equivalents, and at timesholds cash balances in excess of Federal Deposit Insurance Corporation limits.
Stock-Based Compensation – Stock-based compensation cost is measured at the grant date based on the fairvalue of awards and is recognized as expense on a straight-line basis over the requisite service period for eachseparately vesting portion of the award, net of anticipated forfeitures. With the exception of restricted shares andrestricted share units, determining the fair value of stock-based awards at the grant date requires considerablejudgment, including estimating expected volatility, expected term and risk-free rate. Compensation expenseresulting from the granting of restricted shares and restricted share units is based on the grant date fair value ofthose common shares and is recognized generally over the two to three year vesting period for restricted sharesand over the quarterly or one year vesting periods for restricted share units. For accounting purposes, the expensefor performance based stock options and performance based restricted shares is calculated and recorded, based on
75

the determination that the achievement of the pre-established performance targets are probable, over the relevantservice period. The vesting requirements for performance based stock options and performance based restrictedshares permit a catch-up of vesting at the end of the vesting period.
Expense related to shares purchased under the Company’s Employee Stock Purchase Plan (“ESPP”) is accountedfor based on fair value recognition requirements similar to stock options. ESPP participation occurs eachcalendar quarter (the “Participation Period”) and the expense of which is subject to employee participation in theplan. Under the ESPP, participating employees are allowed to purchase shares at 85% of the lower of the marketprice of the Company’s common stock at either the first or last trading day of the Participation Period.Compensation expense related to the ESPP is based on the estimated fair value of the discount and purchase priceoffered on the estimated shares to be purchased under the ESPP. Expense is calculated quarterly, based on theemployee contributions made over the applicable three-month Participation Period, using volatility and risk freerates applicable to that three-month period.
Net Income Per Share – The Company’s basic net income per share excludes the dilutive effect of stock options,unvested restricted shares and unvested restricted share units. It is based upon the weighted average number ofcommon shares outstanding during the period divided into net income.
Diluted net income per share reflects the potential dilution that would occur if securities or other contracts toissue common stock were exercised or converted into common stock. Stock options, unvested restricted shares,warrants and unvested restricted share units are included as potential dilutive securities for the periods applicable,using the treasury stock method to the extent dilutive.
The components of the calculation of basic net income per common share and diluted net income per commonshare are as follows (in thousands except share and per share data):
Fiscal Year Ended
December 26,2015
December 27,2014
December 28,2013
Numerator:Net income available to common stockholders $ 53,171 $ 61,241 $ 66,546
Denominator:Basic weighted average common shares outstanding 28,954,804 30,239,183 29,992,620Effect of dilutive securities:Stock options 97,114 235,057 402,814Restricted shares 150,353 184,995 141,573Restricted share units 1,158 4,870 4,050
Diluted weighted average common shares outstanding 29,203,429 30,664,105 30,541,057
Basic net income per common share $ 1.84 $ 2.03 $ 2.22
Diluted net income per common share $ 1.82 $ 2.00 $ 2.18
Stock options and restricted shares for the fiscal years ended December 26, 2015, December 27, 2014 andDecember 28, 2013 for 48,538, 18,089 and 23,319 shares, respectively, have been excluded from the abovecalculation as they were anti-dilutive.
The Company has the intent and ability to settle the principal portion of its Convertible Notes in cash, and assuch, has applied the treasury stock method, which has resulted in the underlying convertible shares beinganti-dilutive in Fiscal 2015 as the Company’s average stock price from the issuance of the Convertible Notesthrough December 26, 2015 is less than the conversion price. Refer to Note 8. Credit Arrangements for additionalinformation on the Convertible Notes.
76

Recent Accounting Pronouncements – Except as noted below, the Company has considered all new accountingpronouncements and has concluded that there are no new pronouncements that may have a material impact on itsresults of operations, financial condition, or cash flows, based on current information.
In May 2014, the Financial Accounting Standards Board (“FASB”) issued Accounting Standards UpdateNo. 2014-09 (“ASU 2014-09”), Revenue from Contracts with Customers (Topic 606). Under ASU 2014-09, anentity should recognize revenue to depict the transfer of promised goods or services to customers in an amountthat reflects the consideration to which the entity expects to be entitled in exchange for those goods or services.In July 2015, the FASB deferred the effective date of ASU 2014-09 by one year. As a result of this deferral, ASU2014-09 will be effective for annual reporting periods beginning after December 15, 2017 for public companiesand early adoption of ASU 2014-09 is permitted for public companies for annual reporting periods beginningafter December 15, 2016. The Company is evaluating ASU 2014-09 to determine if this guidance will have amaterial impact on the Company’s consolidated financial statements.
In April 2015, the FASB issued Accounting Standards Update No. 2015-03 (“ASU 2015-03”), Interest –Imputation of Interest (Subtopic 835-30) – Simplifying the Presentation of Debt Issuance Costs. ASU 2015-03requires an entity to present debt issuance costs related to a recognized debt liability as a direct deduction fromthe carrying amount of that debt liability, consistent with the treatment of debt discounts. This standard does notaffect the recognition and measurement guidance for debt issuance costs. Amortization of such costs willcontinue to be reported as interest expense. ASU 2015-03 is effective for fiscal years beginning afterDecember 15, 2015. Early adoption is permitted and the Company has elected to early adopt this standard,concurrent with the issuance of the Convertible Notes. As a result, issuance costs attributable to the liabilityportion of the Convertible Notes have been recorded as a direct deduction from the carrying amount of theConvertible Notes liability. The adoption of ASU 2015-03 has no impact on any prior period financial statementspresented, as debt issuance costs previously incurred relate to the Company’s revolving credit facility and willcontinue to be recorded in other long-term assets.
In July 2015, the FASB issued Accounting Standards Update No. 2015-11 (“ASU 2015-11”), Simplifying theMeasurement of Inventory (Topic 330). ASU 2015-11 simplifies the subsequent measurement of inventory byrequiring inventory to be measured at the lower of cost and net realizable value. Net realizable value is theestimated selling price in the ordinary course of business, less reasonably predictable costs of completion,disposal and transportation. ASU 2015-11 is effective for public companies for annual reporting periodsbeginning after December 15, 2016, and interim periods within those fiscal years. Early adoption of ASU 2015-11 is permitted. The Company is evaluating ASU 2015-11 to determine if this guidance will have a materialimpact on the Company’s consolidated financial statements.
3. Acquisitions
Nutri-Force
On June 6, 2014, the Company acquired all of the outstanding equity interests of Nutri-Force. The total purchaseprice was $86.1 million in cash, which includes $5.0 million of contingent consideration which was paid in Fiscal2015. See Note 15. Segment and Product Data for additional information. The acquisition was funded by cash onhand. The results of operations of the acquired business are included in the Company’s results from theacquisition date.
The Company has recorded its accounting for this acquisition in accordance with accounting guidance onbusiness combinations. The acquisition resulted in goodwill primarily related to the expected benefits resultingfrom vertical integration as well as growth opportunities. The Company recorded $1.9 million and $4.0 millionof acquisition and integration related costs during Fiscal 2015 and Fiscal 2014, respectively, which are includedin the consolidated statement of income within selling, general and administrative expenses.
77

The purchase price of the acquisition has been allocated to the net tangible and intangible assets acquired, withthe remainder recorded as goodwill on the basis of estimated fair values. The goodwill was allocated to theCompany’s manufacturing segment. The allocation is as follows (in thousands):
Consideration transferred $ 81,538Working capital adjustment (487)Estimated contingent consideration 4,041(a)
Total consideration $ 85,092
Less: net identifiable assets acquiredCurrent assets 33,798Non-current assets 10,008Intangible assets 18,800Current liabilities (10,150)
Total net identifiable assets acquired $ 52,456
Goodwill $ 32,636
(a) In the fourth quarter of Fiscal 2014, the Company recorded approximately $1.0 million of additionalcontingent consideration, which is included in the consolidated statement of income within selling, generaland administrative expenses.
As a result of fair value accounting for the acquisition, current assets includes an inventory valuation step-up of$4.5 million, which was charged to cost of goods sold during Fiscal 2014. Intangible assets consist of brandstotaling $10.0 million, customer relationships of $7.5 million and internally-developed software of $1.3 millionwhich are being amortized over their estimated useful lives of 18 years, 20 years and 5 years, respectively. Thegoodwill of $32.6 million is being amortized for tax purposes.
From June 6, 2014 through December 27, 2014, the acquired business generated net sales to third parties of $40.3million and a pre-tax net loss of $1.8 million, excluding acquisition and integration costs. The pre-tax net lossincludes the $4.5 million of charges related to the inventory valuation step-up noted above. The results representthe manufacturing segment. Pro forma results are not presented as the acquisition was not significant to theoperating results for Fiscal 2015, Fiscal 2014 or Fiscal 2013.
Super Supplements
On February 14, 2013, the Company acquired substantially all of the assets and assumed certain liabilities ofSuper Supplements, a specialty retailer of vitamins, minerals, specialty supplements and sports nutrition,including 31 retail locations in the Pacific Northwest, a distribution center in Seattle, Washington and an e-commerce business. The total purchase price was $50.5 million in cash and the assumption of certain liabilities.The acquisition was funded with existing cash on the Company’s balance sheet. The results of operations of theacquired business are included in the Company’s results from the acquisition date.
The acquisition resulted in goodwill primarily related to growth opportunities. The Company expensedacquisition and integration costs of $0.8 million and $4.3 million during Fiscal 2014 and Fiscal 2013,respectively, which are included in the consolidated statements of income within selling, general andadministrative expenses.
78

The purchase price of the acquisition has been allocated to the net tangible and intangible assets acquired, withthe remainder recorded as goodwill on the basis of estimated fair values. The goodwill was allocated to theCompany’s retail segment. The allocation is as follows (in thousands):
Total consideration transferred $50,542Less: net identifiable assets acquired:
Current assets 13,876Non-current assets 7,027Intangible assets 2,400Current liabilities (5,350)Long-term liabilities (796)
Total net identifiable assets acquired $17,157
Goodwill $33,385
Intangible assets consist of a tradename of $2.4 million which is being amortized over the estimated useful life.Long-term liabilities include unfavorable leases for certain retail locations of $0.8 million. The unfavorable leaseliabilities are being amortized to rent expense over their respective lease terms, ranging from 2 to 9 years. Thegoodwill of $33.4 million is being amortized for tax purposes.
From February 15, 2013 through December 28, 2013 the acquired business generated net sales of $66.1 millionand net income of $3.1 million, excluding acquisition and integration costs. Pro forma results are not presented asthe acquisition was not significant to the operating results for Fiscal 2015, Fiscal 2014 and Fiscal 2013.
4. Inventories
The components of inventories are as follows (in thousands):
December 26,2015
December 27,2014
Finished goods $211,879 $171,896Work-in-process 6,180 4,592Raw materials 8,771 10,539
$226,830 $187,027
5. Goodwill and Intangible Assets
Goodwill is allocated between the Company’s segments (reporting units), retail, direct and manufacturing. Thefollowing table discloses the carrying value of all intangible assets (in thousands):
December 26, 2015 December 27, 2014
GrossCarryingAmount
AccumulatedAmortization Net
GrossCarryingAmount
AccumulatedAmortization Net
Intangible assets:Goodwill $243,269 $ — $243,269 $243,269 $ — $243,269Tradenames – Indefinite-lived 68,405 — 68,405 68,405 — 68,405Brands 10,000 880 9,120 10,000 324 9,676Customer relationships 7,500 594 6,906 7,500 219 7,281Tradenames – Definite-lived 4,673 2,722 1,951 4,250 1,735 2,515Software 1,300 412 888 1,300 152 1,148Intangibles related to asset
purchase — — — 2,950 2,950 —
$335,147 $4,608 $330,539 $337,674 $5,380 $332,294
79

Intangible amortization expense for Fiscal 2015, Fiscal 2014 and Fiscal 2013 was $2.3 million, $1.7 million and$0.9 million, respectively. The annual impairment tests for goodwill and tradenames were performed during thefourth quarter of Fiscal 2015. There have been no impairment charges related to goodwill or other intangiblesduring Fiscal 2015, Fiscal 2014 and Fiscal 2013.
The useful lives of the Company’s definite-lived intangible assets are between 3 to 20 years. The expectedamortization expense on definite-lived intangible assets on the Company’s consolidated balance sheet atDecember 26, 2015, is as follows (in thousands):
Fiscal 2016 $ 1,515Fiscal 2017 1,415Fiscal 2018 1,415Fiscal 2019 1,260Fiscal 2020 1,155Thereafter 12,108
$18,865
6. Property and Equipment
Property and equipment consists of the following (in thousands):
December 26,2015
December 27,2014
Leasehold improvements $ 168,830 $ 160,348Furniture, fixtures and equipment 170,391 155,927Software 59,049 52,040
398,270 368,315Less: accumulated depreciation and amortization (274,222) (238,613)
Subtotal 124,048 129,702Construction in progress 16,110 10,894
$ 140,158 $ 140,596
Depreciation and amortization expense on property and equipment for the fiscal years ended December 26,2015, December 27, 2014, and December 28, 2013 was approximately $36.1 million, $32.5 million and $27.1million, respectively. The Company recognized impairment charges of $1.2 million during Fiscal 2015 on fixedassets related to five of its underperforming retail locations still in use in the Company’s operations and threeretail locations in Ontario, Canada which the Company expects to close during the second quarter of Fiscal 2016.The Company recognized impairment charges of $0.4 million during Fiscal 2014 on fixed assets related to threeof its underperforming retail locations still in use in the Company’s operations.
Depreciation and amortization expense on property and equipment for the Company’s retail and direct segmentsis recorded in selling, general and administrative expenses on the consolidated statements of income.Depreciation on property and equipment used in the manufacturing process is recorded in cost of goods sold onthe consolidated statements of income. All other depreciation and amortization for the manufacturing segment isrecorded in selling, general and administrative expenses on the consolidated statements of income.
80

7. Accrued Expenses and Other Current Liabilities
Accrued expenses and other current liabilities consist of the following (in thousands):
December 26,2015
December 27,2014
Accrued salaries and related expenses $10,115 $ 8,824Sales tax payable and related expenses 6,975 6,494Accrued fixed asset additions 5,842 7,290Other accrued expenses 24,844 30,713
$47,776 $53,321
The Company is involved in ongoing examinations with various taxing authorities regarding non-income basedtax matters for Fiscal 2015 and prior. The final obligation to these authorities may be subject to either an increaseor decrease to the initial estimates recorded. As of December 26, 2015, the Company believes the reserves forthese matters are adequately provided for in its consolidated financial statements, the reserves of which arereflected in “Sales tax payable and related expenses” in the table above.
8. Credit Arrangements
Convertible Senior Notes due 2020
On December 9, 2015, the Company completed an offering of $143.8 million of its 2.25% Convertible SeniorNotes due 2020 (the “Convertible Notes”). The Convertible Notes are senior unsecured obligations of theCompany. Interest on the Convertible Notes is payable on June 1 and December 1 of each year, commencing onJune 1, 2016 until their maturity date of December 1, 2020. The Company may not redeem the Convertible Notesprior to the maturity date.
Prior to July 1, 2020, the Convertible Notes will be convertible only under the following circumstances:(1) during any calendar quarter commencing after the calendar quarter ending on March 31, 2016, if the lastreported sale price of the common stock for at least 20 trading days (whether or not consecutive) during a periodof 30 consecutive trading days ending on the last trading day of the immediately preceding calendar quarter isgreater than or equal to 130% of the conversion price on each applicable trading day; (2) during the five businessday period after any ten consecutive trading day period in which the trading price per $1,000 principal amount ofConvertible Notes for such trading day was less than 98% of the product of the last reported sale price of ourcommon stock and the conversion rate on each such trading day; or (3) upon the occurrence of specifiedcorporate events. On or after July 1, 2020 until the close of business on the second scheduled trading dayimmediately preceding the maturity date, holders may convert all or any portion of their notes, in multiples of$1,000 principal amount, at the option of the holder regardless of the foregoing circumstances.
The Convertible Notes will be convertible at an initial conversion rate of 25.1625 shares of the Company’scommon stock per $1,000 principal amount of the Convertible Notes, which is equivalent to an initial conversionprice of approximately $39.74. The conversion rate will be subject to adjustment in some events but will not beadjusted for any accrued and unpaid interest. In addition, following certain corporate events that occur prior tothe maturity date, the Company is required to increase, in certain circumstances, the conversion rate for a holderwho elects to convert its Convertible Notes in connection with such a corporate event including customaryconversion rate adjustments in connection with a “make-whole fundamental change” as defined. Uponconversion, the Company may satisfy its conversion obligation by paying or delivering, as applicable, cash,shares of its common stock or a combination of cash and shares of its common stock, at its election.
The Company allocated the principal amount of the Convertible Notes between its liability and equitycomponents (see table below). The carrying amount of the liability component was determined by measuring thefair value of a similar debt instrument of similar credit quality and maturity that did not have the conversion
81

feature. The carrying amount of the equity component, representing the embedded conversion option, wasdetermined by deducting the fair value of the liability component from the principal amount of the ConvertibleNotes as a whole. The equity component was recorded to additional paid-in capital and is not remeasured as longas it continues to meet the conditions for equity classification. The excess of the principal amount of theConvertible Notes over the carrying amount of the liability component was recorded as a debt discount, and isbeing amortized to interest expense using an effective interest rate of 3.8% over the term of the ConvertibleNotes. The Company allocated the total amount of transaction costs incurred to the liability and equitycomponents using the same proportions as the proceeds from the Convertible Notes. Transaction costsattributable to the liability component were recorded as a direct deduction from the liability component of theConvertible Notes, and are being amortized to interest expense using the effective interest method through thematurity date. Transaction costs attributable to the equity component were netted with the equity component ofthe Convertible Notes in additional paid-in capital.
The Convertible Notes consist of the following components as of December 26, 2015 (in thousands):
Liability component:Principal $143,750Conversion feature (24,800)Liability portion of debt issuance costs (3,800)Amortization 260
Net carrying amount $115,410
Equity component:Conversion feature $ 24,800Equity portion of debt issuance costs (793)Deferred taxes 941
Net carrying amount $ 24,948
In connection with the issuance of the Convertible Notes, the Company entered into convertible note hedgetransactions for which it paid an aggregate $26.4 million. In addition, the Company sold warrants for which itreceived aggregate proceeds of $13.0 million. The convertible note hedge transactions are expected generally toreduce potential dilution of the Company’s common stock upon any conversion of notes and/or offset any cashpayments the Company is required to make in excess of the principal amount of converted notes. However, thewarrant transaction could separately have a dilutive effect to the extent that the market value per share of theCompany’s common stock exceeds the applicable strike price of the warrant transactions, which is approximately$52.99 at inception. As these transactions meet certain accounting criteria, the convertible note hedge andwarrant transactions are recorded in stockholders’ equity, are not accounted for as derivatives and are notremeasured each reporting period.
The net proceeds from the Convertible Notes and related transactions of $125.7 million, net of commissions andoffering costs of $4.6 million, are being used to repurchase shares of the Company’s common stock under theCompany’s share repurchase programs. Refer to Note 11. Share Repurchase Programs for additional information.
Revolving Credit Facility
As of December 26, 2015 and December 27, 2014, the Company had $8.0 million of borrowings outstanding onits Revolving Credit Facility.
Subject to the terms of the Revolving Credit Facility, which has a maturity date of October 11, 2018, theCompany may borrow up to $90.0 million, with a Company option to increase the facility up to a total of $150.0million. The availability under the Revolving Credit Facility is subject to a borrowing base calculated on the
82
value of certain accounts receivable as well as certain inventory of the Company. The obligations thereunder aresecured by a security interest in substantially all of the assets of the Company. Under the Revolving CreditFacility, VSI has guaranteed the Company’s obligations, and Industries and its wholly-owned subsidiaries haveeach guaranteed the obligations of the other respective entities. The Revolving Credit Facility provides foraffirmative and negative covenants affecting the Company. The Revolving Credit Facility restricts, among otherthings, the Company’s ability to incur indebtedness, create or permit liens on the Company’s assets, declare orpay dividends and make certain other restricted payments, consolidate, merge or recapitalize, sell assets, makecertain investments, loans or other advances, enter into transactions with affiliates, change our line of business,and restricts the types of hedging activities the Company can enter into. The largest amount borrowed at anygiven point during Fiscal 2015 was $28.0 million. The unused available line of credit under the Revolving CreditFacility at December 26, 2015 was $79.1 million.
Borrowings under the Revolving Credit Facility accrue interest, at the Company’s option, at the rate per annumbased on an “alternative base rate” plus 0.25% or 0.50% or the adjusted Eurodollar rate plus 1.25% or 1.50%, ineach case with the higher spread applicable in the event that the aggregate amount of the borrowings under theRevolving Credit Facility exceeds 50% of the borrowing base availability under the Revolving Credit Facility.The weighted average interest rate for the Revolving Credit facility for Fiscal 2015 was 1.47%. The commitmentfee on the undrawn portion of the $90.0 million Revolving Credit Facility was 0.25% as of December 26, 2015and December 27, 2014.
Interest expense, net for Fiscal 2015, 2014 and 2013 consists of the following (in thousands):
Fiscal Year Ended
December 26,2015
December 27,2014
December 28,2013
Interest / fees on the revolving credit facility and other interest $ 487 $344 $419Amortization of deferred financing fees 237 164 96Interest on convertible notes 159 — —Amortization of debt discount on convertible notes 223 — —Interest income (1) (13) (20)
Interest expense, net $1,105 $495 $495
9. Income Taxes
The provision for income taxes for Fiscal 2015, Fiscal 2014 and Fiscal 2013 consists of the following (inthousands):
Fiscal Year Ended
December 26,2015
December 27,2014
December 28,2013
Current:Federal $30,696 $38,432 $36,070State 5,385 6,438 6,636
Total current 36,081 44,870 42,706
Deferred:Federal (1,283) (3,497) 256State (81) (453) 289
Total deferred (1,364) (3,950) 545
Provision for income taxes $34,717 $40,920 $43,251
83

A reconciliation of the statutory Federal income tax rate and effective rate of the provision for income taxes is asfollows:
Fiscal Year Ended
December 26,2015
December 27,2014
December 28,2013
Federal statutory rate 35.0% 35.0% 35.0%State income taxes, net of Federal income tax benefit 3.4% 4.2% 4.4%Adjustments for uncertain tax positions — — (0.5)%Other 1.1% 0.9% 0.5%
Effective tax rate 39.5% 40.1% 39.4%
Deferred income taxes reflect the net tax effects of temporary differences between the carrying value of assetsand liabilities for financial reporting purposes and amounts used for income tax purposes. The temporarydifferences and carryforwards that give rise to deferred tax assets and liabilities at December 26, 2015 andDecember 27, 2014 are as follows (in thousands):
December 26,2015
December 27,2014
Deferred tax assets:Net operating loss carryforward $ 1,806 $ 1,142Deferred rent 11,389 11,861Tenant allowance 4,215 3,667Deferred sales 4,011 4,386General accrued liabilities 6,790 6,165Deferred wages and compensation 569 711Inventory 7,205 4,339Equity compensation expense 3,400 6,304Debt 1,002 —Other 3,299 2,062
43,686 40,637Valuation allowance (1,806) (1,142)
Deferred tax assets 41,880 39,495
Deferred tax liabilities:Trade name and goodwill (29,777) (29,368)Accumulated depreciation (9,488) (9,612)Prepaid expenses (2,012) (2,217)
Deferred tax liabilities (41,277) (41,197)
Net deferred tax asset (liability) $ 603 $ (1,702)
In November 2015, the FASB issued Accounting Standards Update No. 2015-17 (“ASU 2015-17”), BalanceSheet Classification of Deferred Taxes (Topic 740) to simplify the presentation of deferred taxes by requiring theclassification of all deferred tax assets and liabilities as noncurrent in a classified statement of financial position.The Company is electing a prospective early application of ASU 2015-17 for Fiscal 2015. Prior periods were notretrospectively adjusted.
Management periodically assesses whether the Company is more likely than not to realize some or all of itsdeferred tax assets. As of December 26, 2015, with the exception of $1.8 million of deferred tax assets arisingfrom a foreign and state net operating loss carryforward against which there is a valuation allowance (see above
84

table), management determined that the Company is more likely than not to realize the deferred tax assetsdetailed above. Realization of deferred tax assets associated with the state net operating loss carryforwards isdependent upon generating sufficient taxable income prior to their expiration by tax jurisdiction.
The total amount of unrecognized tax benefits that, if recognized, would impact the effective tax rate wasapproximately $0.4 million at December 26, 2015, $0.4 million at December 27, 2014 and $0.3 million atDecember 28, 2013. A reconciliation of the beginning and ending amount of unrecognized tax benefits is asfollows (in thousands):
Balance at December 29, 2012 $ 5,630Additions based on tax positions related to the current year 13Additions for tax positions of prior years —Decreases for tax positions of prior years due to revaluation of positions (4,627)Decreases for tax positions of prior years due to lapse of statutes (612)
Balance at December 28, 2013 $ 404Additions based on tax positions related to the current year 148Additions for tax positions of prior years —Decreases for tax positions of prior years due to revaluation of positions —Decreases for tax positions of prior years due to lapse of statutes (93)
Balance at December 27, 2014 $ 459Additions based on tax positions related to the current year 107Additions for tax positions of prior years —Decreases for tax positions of prior years due to revaluation of positions —Decreases for tax positions of prior years due to lapse of statutes (97)
Balance at December 26, 2015 $ 469
The Company and its subsidiaries file income tax returns in the U.S. federal jurisdiction, various statejurisdictions, Puerto Rico and Canada. The Company recognizes interest related to uncertain tax positions inincome tax expense. The Company is no longer subject to U.S. federal examinations by tax authorities for yearsbefore 2012 and for state examinations before 2009. However, the tax authorities still have the ability to reviewthe relevance of net operating loss carryforwards created in closed years if such tax attributes are utilized in openyears (subsequent to 2009).
The Company has domestic (U.S. state) and foreign net operating losses of approximately $1.4 million and $6.3million at December 26, 2015, against which a full valuation allowance is recorded. Domestic net operatinglosses generated in the state of New Jersey will continue to expire annually through Fiscal 2032. The Company’sforeign net operating loss is generated through operations in Canada, and will expire in Fiscal 2034.
10. Stock Based Compensation
Equity Incentive Plans – The Company has two equity incentive plans that provide stock based compensation tocertain directors, officers, consultants and employees of the Company; the 2006 Stock Option Plan (the “2006Plan”) and the Vitamin Shoppe 2009 Equity Incentive Plan (the “2009 Plan”), under which the Company hasgranted stock options (includes non-qualified as well as performance based stock options), restricted shares(includes time based as well as performance based restricted shares) and restricted share units. The issuance of upto 7,453,678 shares of common stock is authorized under these plans. As of December 26, 2015, there were2,484,022 shares available to grant under both plans, which includes 120,134 shares currently held by theCompany as treasury stock. Restricted shares and restricted share units are issued at a value not less than the fairmarket value of the common shares on the date of the grant and stock options are exercisable at no less than thefair market value of the underlying shares on the date of grant. Equity awards of restricted shares generally shall
85

become vested between two and three years subsequent to the date on which such equity grants were awarded.Generally, stock options awarded shall become vested in four equal increments on each of the first, second, thirdand fourth anniversaries of the date on which such equity grants were awarded and generally have a maximumterm of 10 years. However, regarding performance based restricted shares and performance based stock options,vesting is dependent not only on the passage of time, but also on the attainment of certain internal performancemetrics. The vesting requirements for performance based restricted shares and performance based stock optionspermit a catch-up of vesting at the end of the vesting period. For accounting purposes, the expense forperformance based stock options and performance based restricted shares is calculated and recorded, based onthe determination that the achievement of the pre-established performance targets are probable, over the relevantservice period. Restricted share units generally shall become vested quarterly, or one year, subsequent to the dateon which such equity grants were awarded.
The following table summarizes restricted shares for the 2009 Plan as of December 26, 2015 and changes duringFiscal 2015:
Number ofUnvestedRestricted
Shares
WeightedAverage Grant
Date FairValue
Unvested at December 27, 2014 448,611 $45.04Granted 251,603 $39.57Vested (156,535) $43.13Canceled/forfeited (145,117) $44.17
Unvested at December 26, 2015 398,562 $42.65
The total intrinsic value of restricted shares vested during Fiscal 2015, Fiscal 2014 and Fiscal 2013 was $6.3million, $5.7 million and $1.3 million, respectively.
The following table summarizes stock options for the 2006 and 2009 Plans as of December 26, 2015 and changesduring Fiscal 2015:
Number ofOptions
WeightedAverage
Exercise Price
WeightedAverage
RemainingContractualLife (years)
AggregateIntrinsic Value(in thousands)
Outstanding at December 27, 2014 383,577 $24.14Granted — —Exercised (56,463) $23.93Canceled/forfeited (42,276) $34.47
Outstanding at December 26, 2015 284,838 $22.65 2.88 $3,464
Vested or expected to vest at December 26, 2015 284,588 $22.65 2.88
Vested and exercisable at December 26, 2015 282,338 $22.36 2.85 $3,464
The total intrinsic value of options exercised during Fiscal 2015, Fiscal 2014 and Fiscal 2013 was $1.0 million,$16.0 million and $6.1 million, respectively. The cash received from options exercised during Fiscal 2015, Fiscal2014 and Fiscal 2013 was $1.4 million, $9.4 million and $3.5 million, respectively.
86

The following table summarizes restricted share units for the 2009 Plan as of December 26, 2015 and changesduring Fiscal 2015:
Number ofUnvestedRestricted
Share Units
WeightedAverage Grant
Date FairValue
Unvested at December 27, 2014 9,633 $51.37Granted 20,747 $39.99Vested (19,100) $47.35Canceled/forfeited — —
Unvested at December 26, 2015 11,280 $37.25
The total intrinsic value of restricted share units vested during Fiscal 2015, Fiscal 2014, and Fiscal 2013 was $0.6million, $0.3 million and $0.3 million, respectively.
Compensation expense attributable to stock-based compensation for Fiscal 2015 was $5.5 million, for Fiscal2014 was $6.9 million and for Fiscal 2013 was $8.3 million. As of December 26, 2015, the remainingunrecognized stock based compensation expense for non-vested stock options, restricted shares and restrictedshare units to be expensed in future periods is $6.1 million, and the related weighted average period over which itis expected to be recognized is 1.6 years. Forfeitures are estimated at the time of grant and revised, if necessary,in subsequent periods if actual forfeitures differ from those estimates. The Company estimates forfeitures basedon its historical forfeiture rate since the inception of granting stock based awards. The estimated value of futureforfeitures for stock options, restricted shares and restricted share units as of December 26, 2015 isapproximately $0.6 million.
The weighted average grant date fair value of stock options was $18.99 and $23.76 for Fiscal 2014 and Fiscal2013, respectively. These valuations represent the fair value of subsequent annual tranches of performance basedstock option grants, and there were no such valuations during Fiscal 2015. The fair value of each option grantwas estimated on the date of grant using the Black-Scholes option-pricing model with the following assumptions:
December 27,2014
December 28,2013
Expected dividend yield 0.0% 0.0%Weighted average expected volatility 35.3% 39.0%Weighted average risk-free interest rate 1.4% 0.6%Expected holding period (s) 4.00 – 4.43 years 4.00 – 4.93 years
Treasury Stock – As part of the Company’s equity incentive plans, the Company makes required tax paymentson behalf of employees as their restricted shares vest. The Company withholds the number of vested shareshaving a value on the date of vesting equal to the minimum statutory tax obligation. The shares withheld arerecorded as treasury shares. During Fiscal 2015, the Company purchased 62,678 shares in settlement ofemployees’ tax obligations for a total of $2.5 million. The Company accounts for treasury stock using the costmethod. These shares are available to grant under the Company’s equity incentive plans.
11. Share Repurchase Programs
On August 5, 2014, May 6, 2015 and November 23, 2015, the Company’s board of directors approved sharerepurchase programs that enable the Company to purchase up to an aggregate of $300 million of its shares ofcommon stock from time to time over three year periods ending on August 4, 2017, May 5, 2018 andNovember 22, 2018, respectively. As of December 26, 2015, 5,511,769 shares have been repurchased for a totalof $203.9 million. The repurchase program does not obligate the Company to acquire any specific number of
87

shares of its common stock and may be suspended, terminated or modified at any time for any reason, includingmarket conditions, the cost of repurchasing such shares, the availability of alternative investment opportunities,liquidity, and other factors deemed appropriate. These factors may also affect the timing and amount of sharerepurchases.
During Fiscal 2015 and Fiscal 2014, the Company repurchased 1,182,990 and 201,000 shares, respectively, of itscommon stock in the open market. The shares were retired upon repurchase. Open market share repurchases were$44.2 million in Fiscal 2015 and $7.8 million in Fiscal 2014 with average repurchase prices per share of $37.38and $38.88, respectively.
Additionally, the Company has entered into accelerated share repurchase (“ASR”) arrangements with financialinstitutions. In exchange for an up-front payment, the financial institutions initially deliver shares of theCompany’s common stock. The total number of shares ultimately delivered, and therefore the average repurchaseprice paid per share, is determined at the end of the purchase period of each ASR based on the volume weighted-average price of the Company’s common stock during that period. The shares are retired in the periods they aredelivered, and each up-front payment is accounted for as a reduction to stockholders’ equity in the Company’sConsolidated Balance Sheet in the period the payment was made. The Company reflects each ASR as arepurchase of common stock in the period delivered for purposes of calculating earnings per share and as aforward contract indexed to its own common stock. The ASRs met all of the applicable criteria for equityclassification, and therefore, were not accounted for as derivative instruments.
The following table summarizes the Company’s ASR arrangements:
Beginningof ASRPeriod
Up-frontPayment
(in millions)Initial Share
Deliveries
Endof ASRPeriod
FinalShares
Delivered
AverageRepurchase
Price
November, 2014 $50.0 982,714 January, 2015 88,325 $46.68
December, 2015 $50.0 1,391,940 * * *
* To be determined at the end of the purchase period of the ASR.
In December 2015, the Company also repurchased 1,664,800 shares of its common stock for $51.9 million, or$31.17 per share, from purchasers of the Convertible Notes in privately negotiated transactions.
12. Benefit Plans
The Company sponsors the Vitamin Shoppe Industries, Inc. 401(k) Plan (“401k Plan”). Employees who havecompleted one month of service are eligible to participate in the 401k Plan. The 401k Plan provides forparticipant contributions of 1% to 100% of participant compensation into deferred savings, subject to IRSlimitations. The 401k Plan provides for Company contributions upon the participant meeting the eligibilityrequirements. Participants are 100% vested in the Company matching contribution upon receipt. The Companymatching contribution is 100% of the first 3% of participant compensation contributed to the 401k Plan and 50%of the next 2% of participant compensation contributed to the 401k Plan. The Company may make discretionarycontributions for each 401k Plan year.
The Company recognized expenses for the 401k Plan of $1.9 million in Fiscal 2015, $1.6 million in Fiscal 2014,and $1.5 million in Fiscal 2013.
The Company had a Non-qualified Deferred Compensation Plan (“DC Plan”) which was terminated in January2015 and did not have a material effect on the Company’s financial statements. The DC Plan allowed participantsthe opportunity to defer pretax amounts up to 75% of base salary and up to 100% of other eligible compensation.The DC Plan was primarily funded by elective contributions made by the participants. The assets of the DC Plan
88

were $2.7 million at December 27, 2014. Accordingly, gains and losses on the underlying investments, which areheld in a Rabbi Trust, were recognized in the consolidated statements of income. The liabilities for the DC Planwere $2.3 million at December 27, 2014.
13. Lease Commitments
The Company has non-cancelable real estate operating leases, which expire through 2036. These leases generallycontain renewal options for periods ranging from 1 to 10 years and require the Company to pay costs such as realestate taxes and common area maintenance. Contingent rentals are paid based on a percentage of gross sales asdefined by lease agreements. The following table provides the net rental expense for all real estate operatingleases (in thousands):
Fiscal Year Ended
December 26,2015
December 27,2014
December 28,2013
Minimum rentals $117,578 $107,456 $97,332Contingent rentals 154 103 110
117,732 107,559 97,442Less: Sublease rentals (273) (245) (244)
Net rental expense $117,459 $107,314 $97,198
As of December 26, 2015, the Company’s real estate lease commitments are as follows (in thousands):
Fiscal year
TotalOperatingLeases (1)
2016 119,9832017 112,9652018 98,8392019 81,6372020 66,382Thereafter 195,019
$674,825
(1) Store operating leases included in the above table do not include contingent rent based upon sales volume.Operating leases do not include common area maintenance costs or real estate taxes that are paid to thelandlord during the year, which combined represented approximately 17.5% of our minimum leaseobligations for Fiscal 2015. In addition, not included are variable activity based fees associated with ourwest coast logistics facility, which were approximately $0.6 million during Fiscal 2015.
14. Legal Proceedings
The Company is party to various lawsuits arising from time to time in the normal course of business, many ofwhich are covered by insurance. As of December 26, 2015, the Company was not party to any material legalproceedings. Although the impact of the final resolution of these matters on the Company’s financial condition,results of operations or cash flows is not known, management does not believe that the resolution of theselawsuits will have a material adverse effect on the financial condition, results of operations or liquidity of theCompany.
89

15. Segment and Product Data
The Company currently operates three business segments, retail, direct and manufacturing. The operatingsegments are segments of the Company for which separate financial information is available and for whichoperating results are evaluated regularly by executive management in deciding how to allocate resources and inassessing performance. The Company’s management evaluates segment operating results based on severalindicators. The primary key performance indicators are sales and operating income for each segment. The tablebelow represents key financial information for each of the Company’s business segments as well as corporatecosts. The retail segment primarily includes the Company’s retail stores. The retail segment generates revenueprimarily through the sale of VMS products through Vitamin Shoppe, Super Supplements and Vitapath retailstores in the United States, Puerto Rico and in Canada. The direct segment generates revenue through the sale ofVMS products primarily through the Company’s websites. The Company’s websites offer customers onlineaccess to a full assortment of approximately 19,400 SKUs. The manufacturing segment supplies the retail anddirect segments, along with various thirds parties, with finished products for sale. Corporate costs represent allother expenses not allocated to the retail, direct or manufacturing segments which include, but are not limited to:human resources, legal, retail management, direct management, finance, information technology, depreciation(primarily related to assets utilized by the retail and direct business segments as well as corporate assets) andamortization, and various other corporate level activity related expenses. Intercompany sales transactions areeliminated in consolidation.
The Company’s segments are designed to allocate resources internally and provide a framework to determinemanagement responsibility. The Company has allocated $165.3 million, $45.3 million and $32.6 million of itsrecorded goodwill to the retail, direct and manufacturing segments, respectively. The Company does not haveidentifiable assets separated by segment, with the exception of the identifiable assets of the manufacturingsegment, which were $88.4 million and $96.2 million as of December 26, 2015 and December 27, 2014,respectively. Capital expenditures for the manufacturing segment during Fiscal 2015 were $3.5 million and fromthe acquisition date of June 6, 2014 through December 27, 2014 were approximately $0.5 million. AtDecember 26, 2015 and December 27, 2014, long lived assets of the manufacturing segment were $60.4 millionand $59.9 million, respectively. Depreciation and amortization expense, included in selling, general andadministrative expenses, for the manufacturing segment during Fiscal 2015 was $1.5 million and from theacquisition date of June 6, 2014 through December 27, 2014 was $0.9 million.
The following table contains key financial information of the Company’s business segments (in thousands):
Fiscal Year Ended
December 26,2015
December 27,2014
December 28,2013
Net sales:Retail $1,081,123 $1,042,054 $ 969,610Direct 128,825 130,644 117,859Manufacturing 91,159 48,102 —
Segment net sales 1,301,107 1,220,800 1,087,469Elimination of intersegment revenues (34,558) (7,754) —
Net sales 1,266,549 1,213,046 1,087,469
Income from operations:Retail 192,598 194,864 192,439Direct 20,904 22,755 21,930Manufacturing (1) (1,977) (1,830) —Corporate costs (2) (122,532) (113,133) (104,077)
Income from operations $ 88,993 $ 102,656 $ 110,292
90
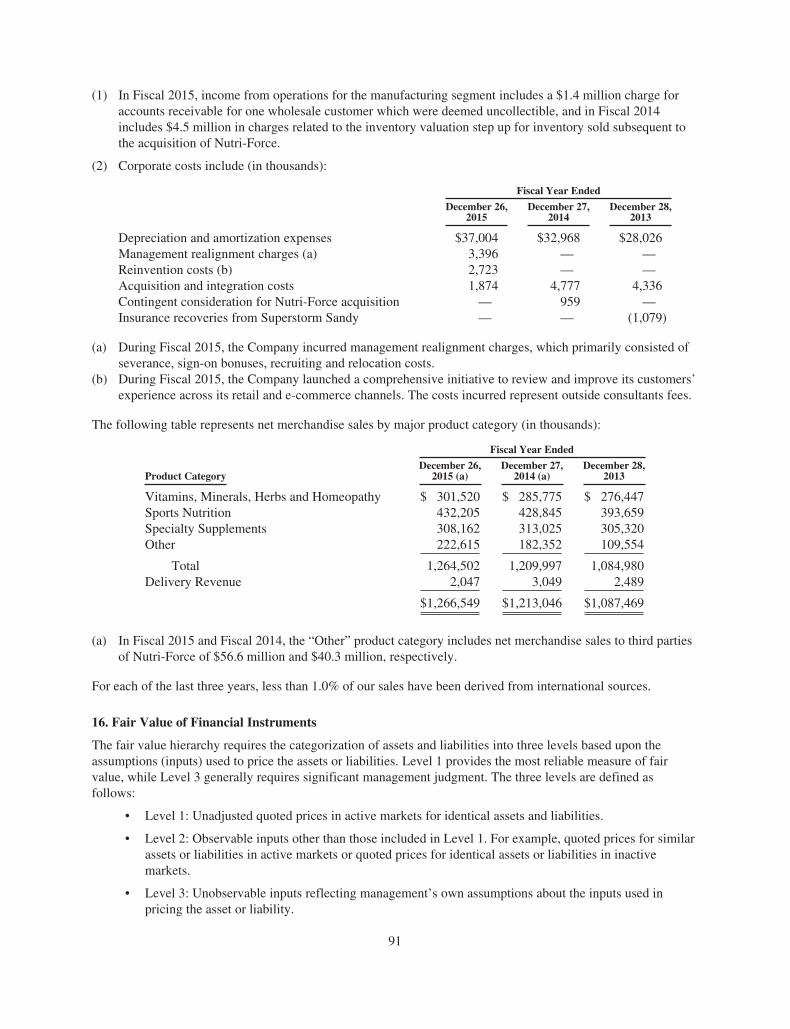
(1) In Fiscal 2015, income from operations for the manufacturing segment includes a $1.4 million charge foraccounts receivable for one wholesale customer which were deemed uncollectible, and in Fiscal 2014includes $4.5 million in charges related to the inventory valuation step up for inventory sold subsequent tothe acquisition of Nutri-Force.
(2) Corporate costs include (in thousands):
Fiscal Year Ended
December 26,2015
December 27,2014
December 28,2013
Depreciation and amortization expenses $37,004 $32,968 $28,026Management realignment charges (a) 3,396 — —Reinvention costs (b) 2,723 — —Acquisition and integration costs 1,874 4,777 4,336Contingent consideration for Nutri-Force acquisition — 959 —Insurance recoveries from Superstorm Sandy — — (1,079)
(a) During Fiscal 2015, the Company incurred management realignment charges, which primarily consisted ofseverance, sign-on bonuses, recruiting and relocation costs.
(b) During Fiscal 2015, the Company launched a comprehensive initiative to review and improve its customers’experience across its retail and e-commerce channels. The costs incurred represent outside consultants fees.
The following table represents net merchandise sales by major product category (in thousands):
Fiscal Year Ended
Product CategoryDecember 26,
2015 (a)December 27,
2014 (a)December 28,
2013
Vitamins, Minerals, Herbs and Homeopathy $ 301,520 $ 285,775 $ 276,447Sports Nutrition 432,205 428,845 393,659Specialty Supplements 308,162 313,025 305,320Other 222,615 182,352 109,554
Total 1,264,502 1,209,997 1,084,980Delivery Revenue 2,047 3,049 2,489
$1,266,549 $1,213,046 $1,087,469
(a) In Fiscal 2015 and Fiscal 2014, the “Other” product category includes net merchandise sales to third partiesof Nutri-Force of $56.6 million and $40.3 million, respectively.
For each of the last three years, less than 1.0% of our sales have been derived from international sources.
16. Fair Value of Financial Instruments
The fair value hierarchy requires the categorization of assets and liabilities into three levels based upon theassumptions (inputs) used to price the assets or liabilities. Level 1 provides the most reliable measure of fairvalue, while Level 3 generally requires significant management judgment. The three levels are defined asfollows:
• Level 1: Unadjusted quoted prices in active markets for identical assets and liabilities.
• Level 2: Observable inputs other than those included in Level 1. For example, quoted prices for similarassets or liabilities in active markets or quoted prices for identical assets or liabilities in inactivemarkets.
• Level 3: Unobservable inputs reflecting management’s own assumptions about the inputs used inpricing the asset or liability.
91

The Company’s financial instruments include cash, accounts receivable, accounts payable and its revolvingcredit facility. The Company believes that the recorded values of these financial instruments approximate theirfair values due to their nature and respective durations.
The fair value and carrying value of the Convertible Notes as of December 26, 2015 was $119.8 million and$115.4 million, respectively. The fair value of the Convertible Notes was determined based on inputs that areobservable in the market or that could be derived from, or corroborated with, observable market data, includingthe trading price of the Company’s Convertible Notes, when available, the Company’s stock price and interestrates based on similar debt issued by parties with credit ratings similar to the Company (Level 2).
Certain assets are measured at fair value on a non-recurring basis, that is, the assets are subject to fair valueadjustments in certain circumstances such as when there is evidence of impairment. These measures of fair value,and related inputs, are considered level 2 or 3 measures under the fair value hierarchy.
17. Selected Quarterly Financial Information (unaudited)
The following table summarizes the Fiscal 2015 and Fiscal 2014 quarterly results (in thousands, except for sharedata):
Fiscal Quarter Ended
March June September December
Fiscal Year Ended December 26, 2015Net sales $336,835 $322,338 $313,886 $293,490Gross profit 114,649 108,260 104,709 91,297Income from operations 30,955 23,564 23,357 11,117Net income 18,700 14,241 14,098 6,132Net income per common share:
Basic $ 0.63 $ 0.49 $ 0.49 $ 0.22Diluted $ 0.63 $ 0.48 $ 0.48 $ 0.22
Fiscal Year Ended December 27, 2014Net sales $307,836 $306,218 $308,910 $290,082Gross profit 109,469 102,907 97,294 94,589Income from operations 34,247 28,166 20,549 19,694Net income 20,509 16,926 12,197 11,609Net income per common share:
Basic $ 0.68 $ 0.56 $ 0.40 $ 0.39Diluted $ 0.67 $ 0.55 $ 0.40 $ 0.38
92

The following table summarizes certain items for Fiscal 2015 and Fiscal 2014 which impacted quarterly resultson a pre-tax basis (in thousands):
Fiscal Quarter Ended
March June September December
Fiscal Year Ended December 26, 2015Integration costs (1) $ 360 $ 410 $ 617 $ 487Management realignment charges (2) — 2,174 — 1,222Accounts receivable bad debt reserve charge (3) — 1,370 — —Reinvention costs (4) — — 1,026 1,697Super Supplements conversion costs (5) — — — 1,766Product write-off (6) — — — 1,330Canada stores closing costs (7) — — — 885
Fiscal Year Ended December 27, 2014Acquisition and integration costs $1,758 $2,248 $ 289 $ 482Inventory valuation step-up recognized in cost of goods sold — 1,200 3,306 —Contingent consideration for Nutri-Force acquisition — — — 959
(1) Represents integration costs related to the acquisition of Nutri-Force, consisting primarily of professionalfees.
(2) Management realignment charges primarily consist of severance, sign-on bonuses, recruiting and relocationcosts.
(3) Represents a charge to increase the allowance for doubtful accounts for Nutri-Force, related to onewholesale customer that abruptly ceased operations.
(4) The costs represent outside consultants fees in connection with the Company’s “reinvention strategy”.(5) Conversion costs primarily include inventory reserve charges, product markdowns and accelerated
depreciation.(6) Represents a charge to inventory reserves for the write-off of USPlabs® products which the Company
ceased selling.(7) Costs include inventory reserve charges, impairment charges to fixed assets and severance charges.
93

[THIS PAGE INTENTIONALLY LEFT BLANK]

Exhibit 21.1
SUBSIDIARIES OF THE REGISTRANT
Vitamin Shoppe Industries Inc.VS Direct, Inc.Vitamin Shoppe Mariner, Inc.VS Hercules, LLCVitamin Shoppe Procurement Services, Inc.Vitapath Canada LimitedVitamin Shoppe Global, Inc.FDC Vitamins, LLCBetancourt Sports Nutrition, LLCVitamin Shoppe Asia Limited

Exhibit 23.1
CONSENT OF INDEPENDENT REGISTERED PUBLIC ACCOUNTING FIRM
We consent to the incorporation by reference in Registration Statements No. 333-165897, No. 333-162990 andNo. 333-207800, all on Form S-8, of our reports dated February 23, 2016, relating to the consolidated financialstatements of Vitamin Shoppe, Inc. and Subsidiary and the effectiveness of Vitamin Shoppe, Inc. andSubsidiary’s internal control over financial reporting, appearing in this Annual Report on Form 10-K of VitaminShoppe, Inc. and Subsidiary for the year ended December 26, 2015.
/s/ Deloitte & Touche LLPNew York, New YorkFebruary 23, 2016

Exhibit 31.1
CERTIFICATIONS
I, Colin Watts, certify that:
1. I have reviewed this Form 10-K of Vitamin Shoppe, Inc.;
2. Based on my knowledge, this report does not contain any untrue statement of a material fact or omit to statea material fact necessary to make the statements made, in light of the circumstances under which suchstatements were made, not misleading with respect to the period covered by this report;
3. Based on my knowledge, the financial statements, and other financial information included in this annualreport, fairly present in all material respects the financial condition, results of operations and cash flows ofthe registrant as of, and for, the periods presented in this report;
4. The registrant’s other certifying officer and I are responsible for establishing and maintaining disclosurecontrols and procedures (as defined in Exchange Act Rules 13a-15(e) and 15d-15(e)) and internal controlover financial reporting (as defined in Exchange Act Rules 13a-15(f) and 15d-15(f)) for the registrant andwe have:
a) Designed such disclosure controls and procedures, or caused such disclosure controls and procedures tobe designed under our supervision, to ensure that material information relating to the registrant,including its consolidated subsidiaries, is made known to us by others within those entities, particularlyduring the period in which this report is being prepared;
b) Designed such internal control over financial reporting, or caused such internal control over financialreporting to be designed under our supervision, to provide reasonable assurance regarding thereliability of financial reporting and the preparation of financial statements for external purposes inaccordance with generally accepted accounting principles;
c) Evaluated the effectiveness of the registrant’s disclosure controls and procedures and presented in thisreport our conclusions about the effectiveness of the disclosure controls and procedures, as of the endof the period covered by this report based on such evaluation; and
d) Disclosed in this report any change in the registrant’s internal control over financial reporting thatoccurred during the registrant’s most recent fiscal quarter (the registrant’s fourth fiscal quarter in thecase of an annual report) that has materially affected, or is reasonably likely to materially affect, theregistrant’s internal control over financial reporting; and
5. The registrant’s other certifying officer and I have disclosed, based on our most recent evaluation of internalcontrol over financial reporting, to the registrant’s auditors and the audit committee of the registrant’s boardof directors (or persons performing the equivalent function):
a) All significant deficiencies and material weaknesses in the design or operation of internal control overfinancial reporting which are reasonably likely to adversely affect the registrant’s ability to record,process, summarize and report financial information; and
b) Any fraud, whether or not material, that involves management or other employees who have asignificant role in the registrant’s internal control over financial reporting.
Date: February 23, 2016
By: /s/ Colin Watts
Colin WattsChief Executive Officer

Exhibit 31.2
CERTIFICATIONS
I, Brenda Galgano, certify that:
1. I have reviewed this Form 10-K of Vitamin Shoppe, Inc.;
2. Based on my knowledge, this report does not contain any untrue statement of a material fact or omit to statea material fact necessary to make the statements made, in light of the circumstances under which suchstatements were made, not misleading with respect to the period covered by this report;
3. Based on my knowledge, the financial statements, and other financial information included in this annualreport, fairly present in all material respects the financial condition, results of operations and cash flows ofthe registrant as of, and for, the periods presented in this report;
4. The registrant’s other certifying officer and I are responsible for establishing and maintaining disclosurecontrols and procedures (as defined in Exchange Act Rules 13a-15(e) and 15d-15(e)) and internal controlover financial reporting (as defined in Exchange Act Rules 13a-15(f) and 15d-15(f)) for the registrant andwe have:
a) Designed such disclosure controls and procedures, or caused such disclosure controls and procedures tobe designed under our supervision, to ensure that material information relating to the registrant,including its consolidated subsidiaries, is made known to us by others within those entities, particularlyduring the period in which this report is being prepared;
b) Designed such internal control over financial reporting, or caused such internal control over financialreporting to be designed under our supervision, to provide reasonable assurance regarding thereliability of financial reporting and the preparation of financial statements for external purposes inaccordance with generally accepted accounting principles;
c) Evaluated the effectiveness of the registrant’s disclosure controls and procedures and presented in thisreport our conclusions about the effectiveness of the disclosure controls and procedures, as of the endof the period covered by this report based on such evaluation; and
d) Disclosed in this report any change in the registrant’s internal control over financial reporting thatoccurred during the registrant’s most recent fiscal quarter (the registrant’s fourth fiscal quarter in thecase of an annual report) that has materially affected, or is reasonably likely to materially affect, theregistrant’s internal control over financial reporting; and
5. The registrant’s other certifying officer and I have disclosed, based on our most recent evaluation of internalcontrol over financial reporting, to the registrant’s auditors and the audit committee of the registrant’s boardof directors (or persons performing the equivalent function):
a) All significant deficiencies and material weaknesses in the design or operation of internal control overfinancial reporting which are reasonably likely to adversely affect the registrant’s ability to record,process, summarize and report financial information; and
b) Any fraud, whether or not material, that involves management or other employees who have asignificant role in the registrant’s internal control over financial reporting.
Date: February 23, 2016
By: /s/ Brenda Galgano
Brenda GalganoChief Financial Officer

Exhibit 32.1
CERTIFICATION PURSUANT TO 18 U.S.C. SECTION 1350, AS ADOPTED PURSUANT TOSECTION 906 OF THE SARBANES-OXLEY ACT OF 2002
In connection with this annual report on Form 10-K of Vitamin Shoppe, Inc. (the “Company”) for the year endedDecember 26, 2015 as filed with the Securities and Exchange Commission on the date hereof (the “Report”), I,Colin Watts, Chief Executive Officer of the Company, hereby certify pursuant to 18 U.S.C. Section 1350, asadopted pursuant to Section 906 of the Sarbanes-Oxley Act of 2002, that to the best of my knowledge:
(i) The Report fully complies with the requirements of Section 13(a) or Section 15(d) of the SecuritiesExchange Act of 1934, as amended; and
(ii) The information contained in the Report fairly presents, in all material respects, the financial conditionand results of operations of the Company.
Date: February 23, 2016
/S/ Colin Watts
Colin WattsChief Executive Officer
(Principal Executive Officer)
The foregoing certification is being furnished solely pursuant to 18 U.S.C. Section 1350 and is not being filed aspart of this Report.

Exhibit 32.2
CERTIFICATION PURSUANT TO 18 U.S.C. SECTION 1350, AS ADOPTED PURSUANT TOSECTION 906 OF THE SARBANES-OXLEY ACT OF 2002
In connection with this annual report on Form 10-K of Vitamin Shoppe, Inc. (the “Company”) for the year endedDecember 26, 2015 as filed with the Securities and Exchange Commission on the date hereof (the “Report”), I,Brenda Galgano, Chief Financial Officer of the Company, hereby certify pursuant to 18 U.S.C. Section 1350, asadopted pursuant to Section 906 of the Sarbanes-Oxley Act of 2002, that to the best of my knowledge:
(i) The Report fully complies with the requirements of Section 13(a) or Section 15(d) of the SecuritiesExchange Act of 1934, as amended; and
(ii) The information contained in the Report fairly presents, in all material respects, the financial conditionand results of operations of the Company.
Date: February 23, 2016
/S/ Brenda Galgano
Brenda GalganoChief Financial Officer
(Principal Financial Officer)
The foregoing certification is being furnished solely pursuant to 18 U.S.C. Section 1350 and is not being filed aspart of this Report.

[THIS PAGE INTENTIONALLY LEFT BLANK]

[THIS PAGE INTENTIONALLY LEFT BLANK]

CORPORATE INFORMATIONExecutive TeamColin Watts Brenda GalganoChief Executive Officer EVP, Chief Financial Officer
Michael Beardall Doug Henson Doug JonesPresident, Nutri Force SVP, Retail SVP, Chief Merchandise Officer
David Kastin Dan Lamadrid Teresa OrthSVP, General Counsel/Corp. Secretary SVP, Chief Accounting Officer SVP, Human Resources
Richard Tannenbaum Rose Hamilton John HnanicekSVP, Supply Chain & IT Chief Digital Officer Chief Information Officer
Susan SandersonChief Brand Officer
Board of Directors
Richard Markee Colin WattsNon Executive Chairman of the Board, Vitamin Shoppe Chief Executive Officer, Vitamin Shoppe
B. Michael Becker (1, 2) John Bowlin, Lead Director (1)Senior Retired Audit Partner, Ernst & Young LLP Private Investor & Consultant
Catherine Buggeln (2) Deborah Derby (2, 3)Senior advisor to Irving Place Capital, a private equity firm Consultant to Horizon Group, a leading arts, crafts and
consumer product company
John Edmondson (1, 3) David Edwab (1, 3)Private Investor & Consultant Non Executive Vice Chairman – Tailored Brands
Guillermo Marmol (3) Richard PerkalPresident, Marmol & Assoc., consulting firm for Advisor to Irving Place Capital, private equity firmearly stage technology companies
Beth Pritchard (2, 3) Timothy Theriault (1)Principal & Strategic Advisor for Sunrise Beauty Studio, Advisor to the CEO Walgreens Boots Alliancedeveloper and manufacturer of third party personalcare and fragrance products
(Board Committees: 1=Audit; 2= Compensation; 3=Nomination & Governance)
Annual Meeting Corporate Communications Media RelationsTuesday, June 7, 2016 at 10:00 a.m. ET Meghan Biango, Manager Corporate CommunicationsLaQuinta Inn & Suites [email protected] Lighting WaySecaucus, NJ 07094 Investor Relations Contact
Kathleen Heaney [email protected]
Stock Listing For More Information or Shop OnlineNew York Stock Exchange (VSI) www.vitaminshoppe.com
Independent Public Accounting Firm Registrar and Transfer AgentDeloitte & Touche,LLP Computershare Investor Services30 Rockefeller Plaza P.O. Box 43078New York, NY 10112 Providence, RI 02940
