to - defense technical information center coefficient of viscosity of air, slugs per foot-eecond. [o...
TRANSCRIPT

UNCLASSIFIED
AD NUMBER
ADB184826
NEW LIMITATION CHANGE
TOApproved for public release, distributionunlimited
FROMDistribution authorized to U.S. Gov't.agencies and their contractors;Administrative/Operational Use; OCT 1948.Other requests shall be referred toNational Aeronautics and SpaceAdministration, Washington, DC 20546.
AUTHORITY
NASA TR Server Website
THIS PAGE IS UNCLASSIFIED

AD-B 184 826
S NATIONAL ADVISORY COMMIIEFOR AERONAUTICS
TCIXCA NOnh
No. 16970
THE EFFECTS OF COMvPRESSIBILIT7Y ON THE LIFT, PRESSURE,
AND LOAD CHARACTERISTICS OF A TAPERED WING OF
NACA 66-SERIES AIRFOILSECTIONS
By Morton Cooper and Peter F. Korycinslci
Langley Aeronautical LaboratoryLangley Field, Va.
Washington ELECIZOctober 1948
94-15112 -qI j =8PET RSCMUD
94 5 .19 027-.
*0000 0 0 0 0

NATIONAL AD7ISCRY CC4T1'U FOR AERONAUTICS
TECHNICAL NOTE NO. 1697
T EFFECTS OF Ca4PR1SSIBfIT ON THE LIFT, PRES[JRE,
AND LOAD CHARACTERISTICS OF A TAPERED WING OF
NACA 66-SERIES AIRFOIL SECTIONS 0
By Morton Cooper and Peter F. Korycinski
SUMMARY
Tests of a 12-foot-span wing having 16-percent-thick NACA 66-seriessections, 2:1 taper ratio, and an aspect ratio of 6 have been conductedin the Langley 16-foot high-speed tunnel at Mach numbers up to 0.69 todetermine the effects of compressibility on the lift, pressure, and loadcharacteristics of the wing.
The m xium lift coefficient increases from a value of 1.07 at a.Mach number of 0.15 to a peak value of 1.135 at a Mach number of 0.25and a Reynolds nmnber of 3,500,000, then decreases, more rapidly atfirst, to a value of 0.895 at a Mach number of 0.50, after which itincreases very rapidly to a value of 1.10 at a Mach number of 0.60 * *(limit of the maximum-lift tests). The increase in maximum lift coeffi-cient at the higher Mach numbers is associated primaily with the
unusually high acceleration of the flow around the sharp leading edgeof the wing and with the rearward movement of the shock formationon the upper surface of the wing. At the lower Mach numbers seriouslosses in maximum lift coefficient were found to result from premature •transition of the laminar boundary layer to a turbulent boundary layercaused by leading-edge roughness.
No significant changes in span load distribution and root bending-moment coefficients occurred throughout the Mach number range for allangles of attack below the stall. For all Mach numbers investigated, 0the spanvise distribution of normal loads on the wing can be predictedadequately for most structural purposes.
The formation of extensive local supersonic-flow regions over theupper surface of the wing, with peak local Mach numbers as high as 1.75,caused the center of pressure to move forward and thereby reduced the 0section twisting-ument and root twisting-moment coefficients.
I'fiC QUALITY f'SiF' .
* 0

So.2 NACA TN No.- 1697
0]Y]!RODUCTON 4
The significance of the interrelated influence of Reynolds numberand Mach number in analyses of wind-tunnel maxim-lift data has beenknown for several years. During tests of a three-dimensional wing ofNACA 0012 airfoil sections (reference 1) at low Mach numbers (M < 0.37),pronounced compressibility effects on the maximum lift coefficient were Sfound in addition to the usual effects of Reynolds number on the maximumlift coefficient. These adverse compressibility effects, which occurredat relatively low speeds, were associated with the extremely high localinduced velocities over the wing at high angles of attack and with theresultant inability of the flow to overcome the adverse pressure gradients.Similar effects were reported in a previous investigation (reference 2) Sof the m-imum-lift characteristics of typical NACA 16-series propellersections to obtain airfoil data applicable to the static-thrust condition.The results of reference 2 also showed an extremely rapid rise in maximumlift coefficient between Mach numbers of 0.4,8 and 0.60 for comparativelythick (15 percent) NACA 16-series sections. The necessity for an under-standing of this rapid rise in maxim lift coefficient with an increase Sin Mach number is apparent from a consideration of the prediction of wingloads in high-speed maneuvers.
As a result of the scattered results from wind-tunnel tests (refer-ences 1 and 2) and flight tests (references 3 and 4) showing the signifi-cance of both Reynolds number and Mach number in determining the maximum- S 0lift characteristic of airfoils, a comprehensive investigation of aseries of conventiola fighter-type wings was undertaken in the Langley16-foot high-speed tunnel and the Langley 19-foot pressure tunnel. By meansof tests in both tunnels, it was considered possible that the maineffects of Mach nunber and Reynolds number on the maximum lift coeffi-cient could be isolated and in that way individually evaluated. Inaddition, since the test wings were selected representative offighter-type airplanes, important load and pressure data could beobtained as a corollary to the basic maximm-lift investigation. Thedata obtainable in the Langley 19-foot pressure tunnel at high Reynoldsnumber and low Mach number would be useful for predicting landing loadsand landing performance, and the data obtained in the Langley 16-foothigh-speed tunnel at high Reynolds number and high Mach number would beapplicable to high-speed maneuvers.
The first wing in the series to be investigated had a 12-foot span,NACA 230-series airfoil sections of varying thickness, a 2:1 taper ratio,and an aspect ratio of 6. The results of the high-speed investigation Sare presented in references 5 and 6, and the results of the low-speedinvestigation are presented in reference 7. The results of reference 5indicate an increase in maxim- lift coefficient to a peak value of 1.46at a Mach number of 0.30 (Reynolds number of 4,500,000), then a rapid
0 00 00 0 00

NACA TN No. 1697 3 )
0decrease from a Mach number of 0.30 to 0.55, and a lover rate of decreasefrm a Mach number of 0.55 to 0.625. 7he magnitude of max-- lift atthe lo-speed peak and the Mach number at which it occurred depended onthe Reynolds number; as the Reynolds number was increased, the maximumlift coefficient increased in magnitude and occurred at a lower Machnumber (reference 7). It was also shown that the effect of Reynoldsnumber on the naxim lift coefficient decreased appreciably after thelow-speed peak ma1 lift coefficient was reached.
The present paper contains the results of the high-speed maximzm--lift tests conducted in the Iangley 16-Coot high-epeed tunnel on a 12-foot-span wing having 16-percent-thick NACA 66-series sections, 2:1 taperratio, and an aspect ratio of 6. In addition to the maxi-um-liftcharacteristics, high-speed bending-moment, twisting-moment, and pressuredata representative of present-day fighter-type airplanes having wingsof similar plan forms and sections are presented.
5YMBOI 0
free-stream conditions:
Vo corrected airspeed, feet per second • *ao speed of sound in air, feet per second
MO Mach number (Vo/%)
PO mass density of air, slugs per cubic foot
qO ~dynamic pressure, pounds per square foot (- 0 2)PV
PO static pressure, pounds per square foot
go coefficient of viscosity of air, slugs per foot-eecond. [
o Reynolds number (pLTo/pio )
Wing gemetry:
S wing are, square feet £,lattlity %
b ving span, feet last
A aspect ratio (b 2 /8)
mean chord, feet (S/b)
Y spnwise distance measured from plane of symetry of wing, feet

NACA TN No. 1697
x cha:rdvise distance measured from airfoil leading edge, feet 0
0 airfoil chord at any spanvise station, feet
acorrected angle of attack of ving at plane of smmetry, degrees
Force data:
L ving lift, pounds
CL ving lift coefficient (L/qoS)
Pressure data:
p local static pressure, pounds per square foot
Ppressure coefficient p P
Pcr pressure coefficient corresponding to a local Mach number of 1 0
en section noul-force coefficieut (Po (PL - PU (&)
CnC section noi -load parameter 0 0
C1 ving normal-force coefficient c
C13 root bending-mcment coefficient
( P cnc _ \ .Root bendi
I b/2 12) q0Sb 0
section pitching-mcment coefficient due to normal forcesC-X about a line perpendicular to lane of sy try and passing
through 25-percent position of root chord
yl distance from leading edge of each spenvise station to lineperpendicular to plane of symnetry and passing through 025-percent position of root chord, feet
... ......... ,0 ,,. . .. . .. . ... . .. . 5 .. ... . 0 0 " ,..

NAcA Tx No. 1697 5
-2 section twistim-mcnent parameter
C root twisting-moment coefficient about a line perpendicularto plane of sY=6et7 and passing through 25-percentposition of root chord
(1 1I ON,; C2 d - Boot twisting moet)
Subscripts:
L lover surface 0
U upper surface
i incompressible
c compressible 0
cr critical
MDIL, IALAON, TETS, AND C0RREMTIONS
Model
Force and pressure tests were conducted in the langley 16-foothigh-speed tunnel with the test wing mounted on two conventional supportstruts as shown in figure 1. The test wing was constructed from solidsteel to airfoil section ordinates given in table I. The geometricproperties of the wing are as follows:
Span, feet * . 12•
Wing area, square fee ........ . ......... . 24Aspect ratio .... * . . . .*... .... ... 6Taper rato . . . . . . . . . . . . . . . 2:1
Wing sections . . . . ............. MACA 66 series (a 0.6)
Thickness ratioRoot section, percent .. . . * ... .. . . . . . . . . . .. 16 •Tip section, percent . . . .. .. .. .. .. ... . . . . . 16
Design lift coefficientRoot section * ...*e e.. *... ...... .... 0.1Tip section " "0~ i li 0 0d; 0 . " " * . ...... 0.2
Sweepback (along quarter-chord line), degrees ........... 3.18Dihedral (along uarter-chord line), degrees . . . ........ 0Geometric twist (ashout), degrees . . . . . . . . . . . . . . . . . 1.55
.. .. .. . . . .. . . . . .. II I 0 . . I 1 I I0I lll I0II I I ili . .. . II, 0 . . .,

0
6 ACA TN No. 1697
The left semispan of the wing contained 210 pressure orifices, 035 orifices along the chord at each of six spanvise stations. (See 9fig. 2.) The locations of the spanvise stations at 10, 30, 50, 70,85, and 95 percent of the wing semispan were selected to determineadequately the span load distribution and yet to minimize the localinfluence of the support struts on the nearby pressure orifices.
During all the tests the wing was frequently inspected and polished 0in order to mintain an aerodynamically smooth surface.
Installation
Force touts.- In order to obtain the basic lift data, the wing Svs mounted on two conventional support struts. (See fig. 1.) Allpressure orifices were sealed within the wing, and a short fairing capcovered the pressure-tube exit located at the tralling edge of theroot section of the wing (fig. 2). In addition to the conventionalinstallation for the basic force tests, the wing was Installed invertedwith and without imge struts and upright with I struts (fig. 3)to obtain the tare force and afr-etream misalinement corrections asdiscussed in reference 8.
Prsue est uJs.- An auxiliary counterbalanced floating-tail strutwas installed during tests to determine the pressure distributionsover the wing. (See figs. 4(a) and 4(b).) The pressure tubes were r ebrou#t out from the wing through a circular pipe section muntedrigidly to the wing and then through the floating-tail strut tomdtiple-tube ancoeters.
Tests 0
The basic force and pressure data were obtained for a range ofangle of attack from -40 to the stalling angle for Mach numbers from0.15 to 0.60. At Mach numbers from 0.60 to 0.69, the power limitationsof the tunnel prevented the attaiment of the higher angles of attack.The tests were conducted by varying the tunnel speed and mintaininga constant indicated angle of attack for the lower angle range (below100 for the force tests and 60 for the pressure tests). For thehigher angles, the data were obtained by holding a constant indicatedtunnel Mach number and varying the angle of attack in =all incrementsto define the stall sharply. Several additional tests were made todetermine the influence of leading-edge rougness (covering approxi- Smately 5 percent of the chord measured along the surface) on the maximulift coefficient.
The variation of average test Reynolds number with Mach numberfor the force and pressure tests is presented in figure 5. Individualcurves are presented for the force and pressure tests because these S

0
NACA TW No. 1697 7
data was bbtalned 4 atha apart and differences in the curves reflectOhba . in atmospheric conditlons. A eynol A umber of 7.5 x j66 0oocurrin at a Mach umber of 0.7 (fig. 5) o eponds rougay to full-cle opeatiUCn of presenb-day fthter airplanes at 40,000 feet altitude.
Corrections
Ferce tests.- The farce data have been corrected for strut tares,air-strem mualineant, and vind-tunnl vail effect.; these factorsare disoussed In reference 5. 8pecifically, the method of reference 8ug used to determine strtrt tares and air-Strem misalinement corrections,and the methods of reference. 9, 10, and i were used to deteruineangle-of-attack and blockage corrections. The following table .ianrizes Sthe ianitmie of the corrections applied to the test data:
Maxima z-geitud ofCorrection Ihil masinSitude correction atof correction movximz lift 0
angle, degrees AO o.18 0.18
Azgle-of-attack correction dueto the 1et03..03 00uced 0upvash at the lifting line, 1.03 1.03degrees
Andle-af-attack correction dueto the jet-btmdAry-indueod .18 .18strzeamline 0tze
degrees (A.c.)
Incrint In lift coefficientdue to struts(OO 03Ngiil
to ruit a .de
Lift-oefficient norm ant dueto blockage, percent 1
Nwh nber Increment due to
to blockage, percent 1/2 1/2
0 00 00 0 00

8 NAcA -in No. 1697
Pressure tests.- At the Vresent tim no aequate method in kovn0for calculating the vind-tul wall effects on individual pressurereadjge obtained from statio-Presar orifices on a relatively largewing at hie% speeds. In the snalysis of the pressure, data, attemptswere therefore mae to correlate the normal forces obtained from theintegrated pressure measuresmants with the lift forces obtained fromforce mes ee t his correlation showed that @Dod agreeiment betveen 0the presure and force data me obtained when the pressure data verebased on a taazel-ampty calibration (force-test ata are based on tunnel-empty calibration) and that recalibrating the tunnl to account for the
local effects of the strata overcorrected the data by about * percent.
AllI presure data presented are therefore based an a tunnel-emptycalibration.
All angle-cf-attack corrections that were determined for the force-test data wer applied to the pressure data.
0PJOTMON (W rasa=8
Force tests.- Mhe data obtained in the force and preasure testshave been corrected to equivalent free-afr conditions and are presentedin standard nondimensional form convenient for practical analysis. *The lift-coefficient characteristics are suited in the form of alift "carpet" presented in figure, 6. The abscissas shown on the liftcarpet are angle of attack (for No a 0.20) and mach n==ber (for a - 00)..Lift curves for constant Mach numbers other than 0.20 are offset ho' In~angle of attack for each 0.10 change In Nubh nmbr; lift curves forconstant angles of attack other then 00 are offset 0.05 in Msch numnber0for each 20 change In angle of attack. In several Instances the dataof the lift carpet have been replotted to illustrate pertinent liftcharacteristics an to afford caeisons with other available data.The data of f igure 7(a), taken from figuare 6, permit a comnparison of theexperimental and theoretical variation of lift coefficient with Machnumber for angles of attack from -4 0 to 20an show the influence ofthe critical Mach number In affecting this comprison. The variationof the lift coefficient with Hoch number at angles of attack near thestall1 is shown in figoe 7(b); the nazim-lift-coetfIcilent curve isincluded to show the limiting conditions of lift. The critical Machnuber cumv has amain beqn added to define subritical and superriticalflow regions. The critical Mach number used In this paper is that0free-stram Mach nuber at which the speed of sound is first reachedlocally on the airfol for a given ofigueration. rigure 8 shows thevariation of the maxim lift coefficient with Mach umber and theeffect of leading-edge rou~ness on the maximum lift coefficient at lowspeeds. 1ligbt-tost data of reference 12 hae been added to figure 8to permit a comparison of the tunnl results with flight data obtained0for a simlar wing.

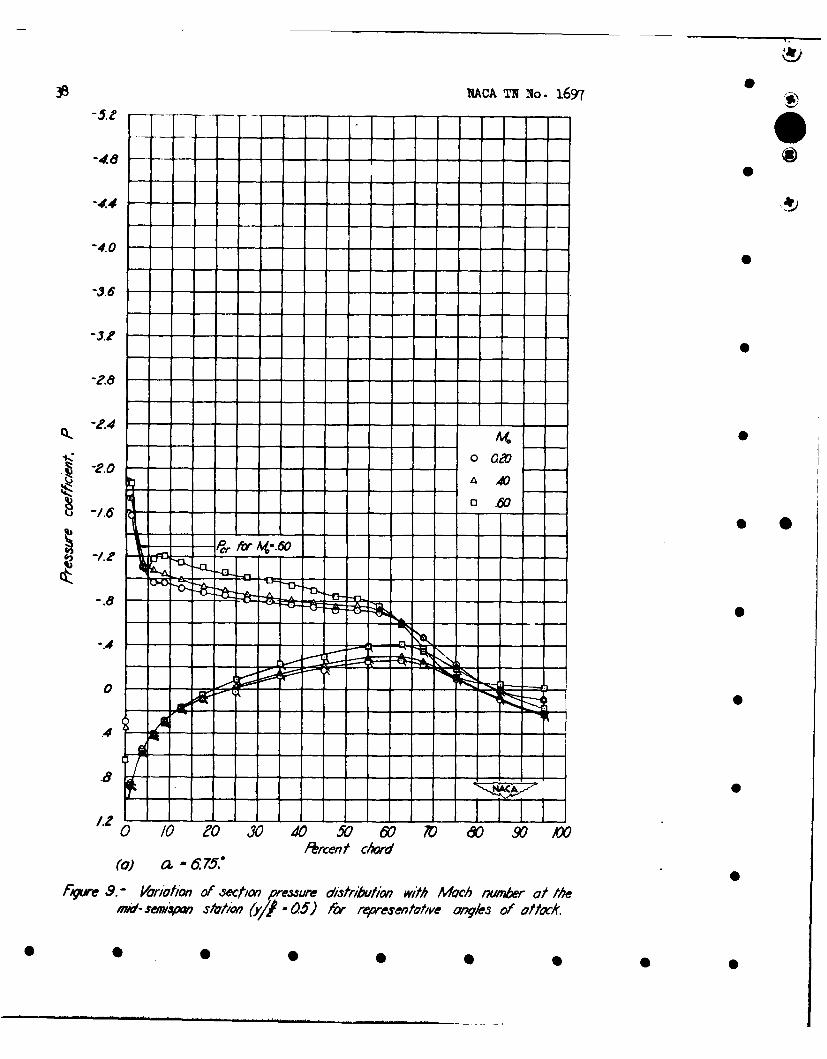
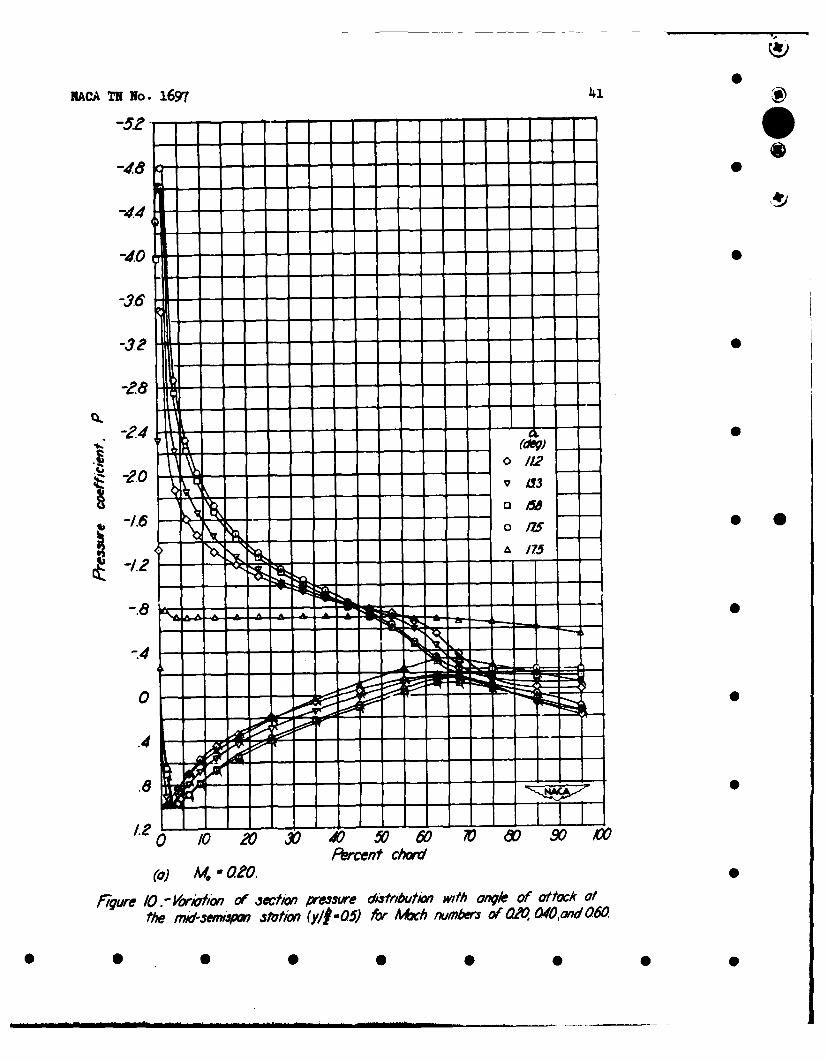
MACA Tx wo. 1697 9 4Pressure teat..- Representative pressure distributions obtained at 0
the aid-semtspan station are shown in figure 9 for constant angles ofattack and variable Mach numbers and in figure 10 for constant Mach num-bers and variable angles of attack. Contours of constant pressure alongthe entire span of the wing are presented for Mach numbers of 0.20, 0.40,and 0.60 in figures 11 to 13. A ccprehensive compilation of the pressuredistributions for all mix spanvise stations Is presented in reference 13. 0In order to provide a comperison of the maxlzum-lift characteristics ofthe ACA 230-series wing reported in reference 5 with those of the RACA66-series wing presented herein, representative pressure distributionsof the two vings are plotted in figure 14. The pressure distributionsfor the 230-series wing wore taken at the 47-percent semispan station.The chordvise pressure distributions obtained from measurement over the 0left semlepan of the wing were integrated to uield the section norual-force coefficient cn and section pitching-ment coefficient crx.
The spanise distribution of the section normal-torce coefficient ispresented in figre 15 in the forn of span load distributions forrepreesntative wing normal-torc. coefficients for Mach nmbers of 0.20,o.0, and 0.60. F7Sm. 15(a) also contains calculated span loaddistributions obtained by the method of reference 1 for a Nach nimberof 0.20. The wing nomzl-t'orce coefficients obtained by the integrationof the sp load distributions are presented in fiezre 16 as a norml-force carpet. Me method of presentation of the nomzl-orce data isthe mem as that used for presenting the lft data. The rwiation of 0the root bedin&nament coefficient with NMach n=ber, obtained from the
Minnt of the spen load distributions about the plane of sYMeitry, isshown in figure 17 along with the alues of root bendlat-umuat ooeffi-cients obtained by integration of the thoretical span load distribu-tion for a Mach nuber of 0.20. The section pitchineiment data alongthe span have been presented in figr 18 for representative normal-force coefficients for Mach numbs of 0.20, 0.40, and 0.60. Thesedata have been presented in the form of a twistIne-mt
parameter n- (1)2 which is referenced to a line perpenicular to
the plane of symtry and passing tro the 25-percent position of the 0root chord. The integration of these twitin.mesnt distributionsyields the wing twistingma t coefficlents about the 25-parentpoeition o the root cho d, qrod these Integrated coefficients aeplotted ainst snle of attack in figure 19.
Lift an rmal-fme Mactertstics
Uftt eers.- fe SmaszL lift and sta1ing characteristics of thetest vi, as , as certain 1ir6-owTe chMrateristics which my be

10 MACA TH No. 1697?
associated with 66-owi.o airfoils. are readily discernible in the lift
carpet presented in ffne 6. Beyond the lmit of the low drag range, 0
mhich is reached at an angle of attack of approximately , the lift
curve shifts and a decrease in elope occurs. This phennon, which ischaracteristic of the airfoil section, is discussed In reference 15and has been previously reported for a tapered wing In reference 16.At INwh nobers above 0.50, the shift or Jog in the lift curves tonds 0to disappear. The eliminatlon of this Jog io associated with theIncreased Reynolds numbers which occur at the higher Nsch numbere, and,as a rosultj, the extent of the 1Inaz separation near the leadingedes I reduced. The lift curve for a achb number of 0.5 has adecreasing slope thich starts at an angle of attack of about 4o andpersists up to 10 ; at angles of attack beyond 100, the slope of the 0lift curve Increase. rapidly to apprxomntely 5.7 per radian, a valueconolderably lsare than the lift-curve slope of 4.8 per radlan determinedfor the low angle-of-attack range. Lift curves for Mach nmbers above0.55 follow a slii) but awe pronounced pattern. As will be discussedin a following section, this initial reduction in lift-curve slope and 0the subsequent rapid rise are associated with the build-up of trailing-edge separation and the formation of extensive regions of supersonicflow on the forward portion of the upper surface of the ving.
Gcunarison of lift and aQz-Erce data,.- In mneral, the lift andnormal-force data (fig. 6 and 16) obtained independentl y during these *tests show very good agemnt, and any qualitative discussion ofeither the lift or the noruml-force characteristics to directly applicableto the other. In particular, however, a comparison of figures 6 and 16does show a marked difference in the vicinity of the stall at low Machnribers. Part of this discrepancy in mazlun lift coefficient can beattributed to a difference In the Rbenolds nmber (fig. 5) between theforce end premue tests. In addition, a varying type of stall at lowMach numbers me also, encountered during several re t force tests ata gIven Mach number (approximately a given leynolds number) and isassociated with the eztm ly sensitive reaction of this type of airfoilto "app&rnt" flow changes Caused by a variation in surface conditions.Although attempto were ms to minteij an aerodyically sooth 0wrace at all timoe, the remalts at low Nsch numbers near the stal
were probably Influenced by suface conditions. his phennon will,however, be of no practical importance boeaus of ite occurrence atlow Peynolds numbers only. A typical present-day frihter airplane willbe a landing eynoldo nmnber of about 6,000,000, a value which Isabove this ex 1my critical Feynolds umer range. (A simllar phenoin 0vas encountered In a preliminary InvetlSatlon prior to the man testsreported in reference 17.)
V arit1 of lft c ictit with ibk .- 7e exper isntalrlse in lift coffic iet with MNch nmbr soown in figure 7 is c paredwith theoretical predictions based on the Mamort-Prndtl theory 0modified for a finite o by the method t refrence 18. If the
0 .. I I I il i 0 0

mNAcA TvNo :d 1697 U
to- 4.lmlcmal lift-urve elope Is asumed to be 2s, the theoreticalrise In lift coefficient due to cmpresibIlity is given by: 0
CIV A+ 2
The data of flWe 7 aho exoellent egement between the experimentaland theoretical variations for all subritical Mach numbers up to ane4le of attack at 12a. As mleht be expected from the force data thepreeswre dlietributions for a repsesentative angle of attack a - 9.7o(f 1,. 9(a)) ehov no umusml or radical Mach number effects. At super- 0critical ich nub , hover, there is a marked dlsearement betweenthe experimental and theoretical curves; a dieagreemnt which increasesin ienitude as the erale of attack is increased and which, because ofIts in ltude, Invalidates the use of this extrapolation to predicteven rou~oay the lift coefficient in euperritloel floes. At angles ofattack Sreater than 120 (fig. 7(b)), the approximtions inherent In 0this linearized theory are sufliciently in error to underestlmateappreclably the mitude of the lift coefficient in subcritical flowand henc prohibit Its use.
In the azperrltical reglon, the varlation of the lift coefficientwith Hoh nmber for moderate and hilI angles of attack is associated S 0with the bull&-up of trailing-edp separation and the formation ofshock cn the upper surface of the wing. The decrease in lift coeffi-cient which occ when the critical Wre is exceeded reaches amininum in the Mach er ra of 0.50 to 0.60 (fig. 7(b)); for arePre tlve anle of attack of 1.10 the finimum occurs at a Machnuber of 0.", wle for a - 13.20, It occurs at a Mach number of 0.50. 0AM ex ation of the pressure d1agms (fig. 9(b) and 9(c)) at thecoresponjdilaio points (Mo s 0.5" at a - 1.10 and No - 0.50at - 13.2), lmodiately sbe that the t of separation and theloss in lift over the rear portion of the upper surface resulting frmthis separation Is a mi at these points and, furthermore, thepositive contribution of the under surface to the lift Is a minm at 0thes points. After the mInI value or the lift coefficient in theeuperortical region Is reachod, a further Increase in lech number willresult in a very rmpid Increase in the lift coefficient. At a Machnuber of 0." nd n ole attack ot 13.20 (fIS. 9(c)), a well-established shock io evident with a local supersonic region of aboutlA percent of the chard a sd a peek local Each number of about 1. 75. A 0further incease in fh number to 0.60 moves the shock rearward an
extends the local supersonic region to about 24 percent of the chord.
The Inc et of lift coefficient cased by the local supersonic flow tolom lately apparen froa a consideration of the increased arms under
0 0 0 S 0 0 0 0 0

S12 MNACA TN No. 16976
the pressure-distribution curves. According to the data of figure 6it is probable that no further significant increase in lift coefficient 0would occur with increasing Mach number for 13.20 angle of attack. Thedata of figure 6 show that the angle of attack for maximum lift Is13.50 for a Mach number of 0.60 and that the angle for maxim- liftdecreased with increasing Mach number. Hence, since 13.20 will be theangle for maxnimu lift for some Mach number only slightly in excessof 0.60, the distribution presented for a Mach number of 0.60 isassumed to be sufficiently close to the maxizlm pressure distributionfor all practical purposes.
For an angle of attack of 11.10, an extensive supersonic region
of 22* percent of the chord is formed when the free-stream Mach numberis raised from 0.55 to 0.60. This broadening of the local supersonic •region results, as in the case of a = 13.20, in a rapid rise in liftcoefficient. Surprisingly enough, a slight reduction in separationoccurs with this increase in Mach number.
For an angle of attack of 140, the data of figure 7(b) show arapid loss in lift coefficient at Mach numbers exceeding 0.575.The indications are, therefore, that after the maximum lift coeffi-cient is reached (for a given angle of attack) with a strong shockpresent in the flow, a further increase in Mach number will result ina serious loss of lift.
Maximum lift coefficient.- The value of the maximum lift coeffi- 0 0cient (fig. 8) increased from a value of 1.07 at a Mach number of 0.15to a peak value of 1.135 at a Mach number of approximately 0.25 (aReynolds number of 3,500,000). This increase of maximum lift coeffi-cient was essentially a Reynolds number effect. Beyond a Mach numberof 0.25, the increase in maximum lift coefficient with Reynolds number 0was counteracted by adverse compressibility effects resulting in a flowbreakdown characterized by laminar separation from the leading edge ofthe wing and a decrease in maximum lift coefficient. The value of themaximtm lift coefficient continued to decrease until the minimumattainable critical Mach number of approximately 0.33 was reachedduring the pressure tests. (Because of the varying type of stall atlow Mach numbers and the difference in Reynolds number between theforce and pressure tests, it is quite possible that the minimumattainable critical Mach number was slightly lower during the forcetests.) As the Mach number was further increased, the forwardpressure peaks broadened and decreased in magnitude; these changesthereby tended partly to compensate for the continued loss in maximum 0lift and to reduce the rate of decrease of maximm lift with Machnumber between Mach numbers of 0.35 and 0.50. After the minimum valueof the maximum lift coefficient (0.895) was attained at a Mach numberof 0.50, further increases in Mach number resulted in rapid increasesin maximum lift coefficient to a value of 1.10 at a Mach number of 0.60(the limit of the tests). 0
0 0 0 0 0 0 0 0 0

NACA TN No. 1697 13
Flight tests reported in reference 12 for an airplane having a wingwhose plan form and airfoil sections are very similar to the model wing 0produced data which are in very close agreement with the present data.(See fig. 8.) The flight data were obtained at an altitude of 32,300 feetunder conditions whereby the flight Reynolds number was roughly equal tothe test Reynolds number. The minimum value of the maximum lift coeffi-cient for both tests (fig. 8) was approximately 0.9 and occurred at aMach number of about 0.50. In each case this minimum was followed by a 0rapid rise in maximum lift coefficient which reached a secondary peakvalue of 1.095 in the flight tests. Although no secondary peak had beenfeached in the tunnel tests, a comparison of the tunnel tests with theflight tests shows that the final maximum lift coefficient of 1.1 obtainedat a Mach number of 0.60 would be very close to the value obtained at tBsecondary peak of the test wing. 0
These maximum-lift characteristics of the 66-series wing are con-siderably different from those of the 230-series wing discussed inreference 5. Unlike the 66-series wing the value of the maximum liftcoefficient for the 230-series wing decreased with Mach number throughoutthe range of the tests after attaining its peak value at a Mach number 0of about 0.30. This marked difference in maximum-lift characteristicsof the wings is of extreme importance from structural-design consider-ations in addition to aerodynamic aspects. The representative pressuredistributions (fig. 14) for both wings show that the build-up and rear-ward movement of the shock formation, though much more pronounced forthe 6 6 -series wing, is somewhat similar for both configurations. The 0 0most significant difference in the pressure distributions is the locationof the peak points. From figure 14 the pressure peaks for the 6 6 -serieswing are seen to occur within about 1 percent of the chord after a veryrapid acceleration around the leading edge. Furthermore, these peaklocations do not vary significantly over the Mach number range. Conse-quently, as the shock moves downstream along the chord, the highly •negative pressures extend over larger portions of the chord, and thelift coefficient is thereby appreciably increased. In contrast to theseresults, the pressure distributions of the 2 30-series wing (fig. 14) showless rapid accelerations around the leading edge and a peak pressure thatmoves downstream as the Mach number is increased. This loss in lift inthe vicinity of the leading edge of the 230-series wing overcompensates 0for the gain caused by the rearward shock movement and results in a netdecrease in the maximum lift coefficient.
As to the fundamental explanation of the high accelerations aroundthe leading edge of the 66-series wing, inadequate experimental dataexist from which any positive conclusions can be drawn. It is quite 0probable, however, that because of the sharpness of the leading edge ofthe airfoil a very small, localized separation region is formed on theupper surface in the vicinity of the leading edge (reference 19). Incase of such a phenomenon, the main flow would then turn supersonicallyaround this region and become reattached to the airfoil surface. Theflow would then be expanded more than is required by the physical 0

NACA TN No. 1697
boundary and would thus be directed back to the airfoil surface. Thisoverexpansion would result In the abnormally high pressure peaks veryclose to the leading edge. The flow then undergoes a slight stabilizingcompression prior to the main deceleration shock. The probability of anoverexpansion at the leading edge is also indicated by the fact thatthe 66-series wing attained peak local Mach numbers as high as 1.75 ascompared to 1.55 for the 230-series wing.
It Is, therefore, apparent that the main difference in maximum-liftcharacteristics at the higher Mach numbers is essentially a leading-edgeeffect and that airfoils having sharp leading edges such as theNACA 66 series will exhibit the rise in maximum lift coefficient withMach number, whereas airfoils having blunter leading edges such as theNACA 230 series will not exhibit this rise. 0
Leading-edge-roughness tests were made at low Mach numbers to deter-mine the effect of the boundary layer upon the maximum lift coefficient.The data of figure 8 show that the condition of the leading edge is ofutmost importance in determining the maximum lift coefficient and thatserious losses in maximum lift will result from premature thickening andtransition of the boundary layer in the vicinity of the leading edge. 0No significant Mach number or Reynolds number effect occurred within theMach number or Reynolds number range of the roughness tests, and thus thepresence of a fully developed turbulent boundary layer without excessivepressure peaks was indicated.
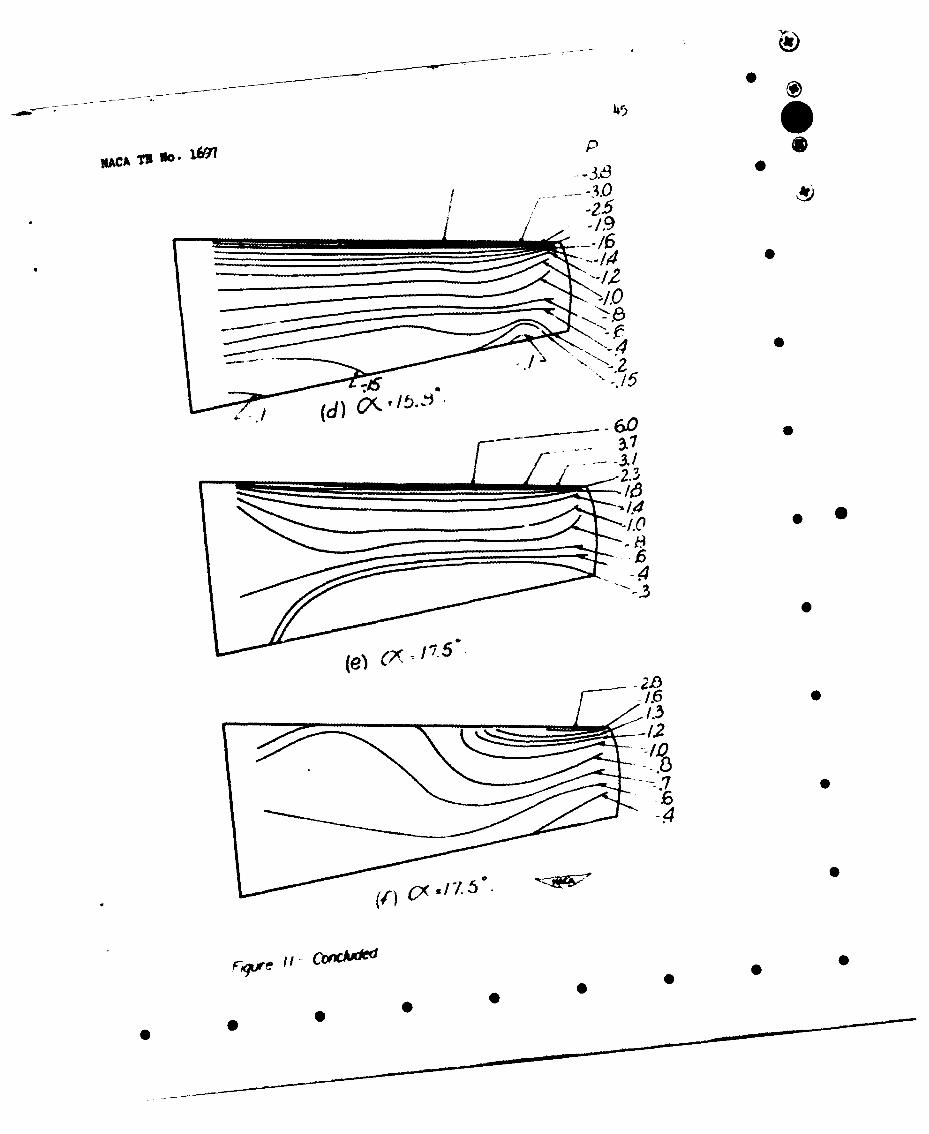
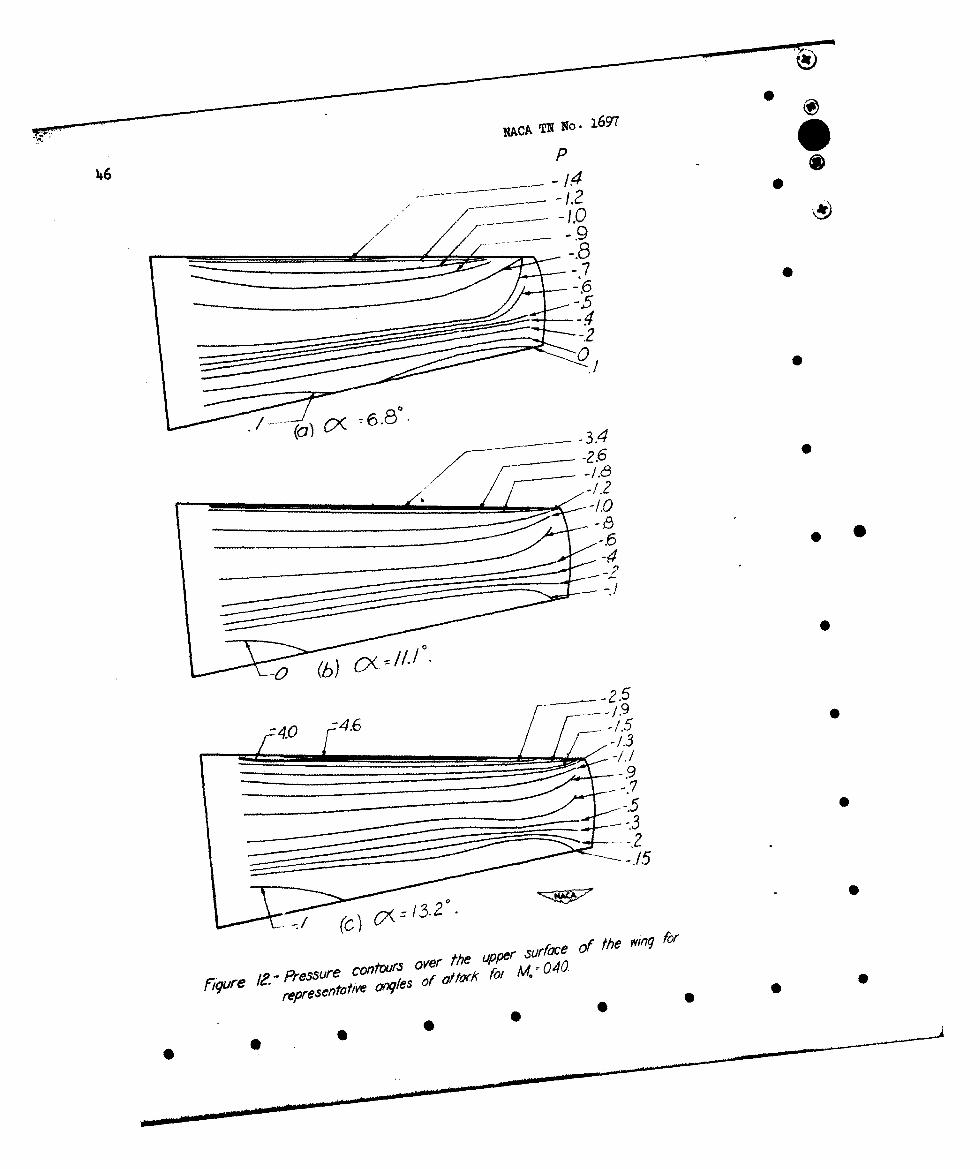
Stallina characteristics .- An examination of the force data of * 0figure 6 shows that a discussion of the general stalling characteristicscan be divided into three representative groups: low-speed stall(Mo = 0.20), moderate-speed stall Mo = 0.40), and high-speed stall(Mo = 0.60). In order to trace the build-up and spanwise progressionof the stall, pressure contours for various high angles of attack forMach numbers of 0.20, 0140, and 0.60 have been presented (figs. 11 to 13) 0in addition to the pressure distributions for the mid-semispan station.(See fig. 10.)
The low-speed stall (figs. 10(a) and 11) Is essentially characterizedby a laminar separation of the flow from the leading edge with a sharplydefined stall and a rapid flow breakdown. The pressure distributions for •various increasing angles of attack (fig. 10(a)) show the progressivelyincreasing leading-edge peak and only slight increases in trailing-edgeseparation. At an angle of attack of 17.50, the adverse pressure gradientwas of sufficient strength to cause a sharp flow breakdown at the leadirgedge (evidenced by two distributions, one stalled and one unstalled,at a = 17.50). Although the stall rapidly covered the entire wing, the •
first station observed to stall was located at b2 = 0.1 (fig. 11(e)),
and then the stall progressed almost instantaneously to the mid-semispan(fig. 11(f)). Although the stall finally reached the tip, the intensity
was not very severe from b = 0.8 outboard for this Mach number (0.20)
and all other Mach numbers tested.
. . .. .. . .. .. . . . 0 .. .. . . . . . . . . . . . . . . . . . . 0 .. .. 0

NACA TN No. 1697 1 20
The character of the stall at a Mach number of o.40 (figs. 10(b) 0and 12) was entirely different from that at a Mach number of 0.20(figs. 10(a) and 31). The maxlmum lift coefficient was attained atan angle of attack of 13.60, the lift curve having a rounded peak andonly a small variation in lift on either side of the peak (fig. 6).Stall in this case was caused by a build-up of trailing-edge separationwhich gradually extended forward (figs. 10(b) and 12). Stall began 0first at the mid-eemispan station and spread slowly to cover the restof the wing (fig. 12). The pressure distribution for an angle ofattack of 17.20 (fig. 10(b)), 3.60 beyond the maximum lift, thoughshowing pronounced separation, does not indicate a serious loss in lift.
The high-speed stall (Mo = 0.60) occurred sharply after a slight •roundling off of the lift curve (fig. 6). Increasing the angle of attackfrom 10.00 to 12.80 (fig. 10(c)) resulted in a large increase in thelocal supersonic region and, therefore, in a large increase in lift-curve slope. As the angle of attack was further increased to the stall,the amount of separation increased and resulted in the rounding off ofthe lift curve. The stall was probably precipitated by trailing-edge 0separation accompanied by a large loss in lift when the shock reachedsufficient strength to cause a complete flow breakdown. The gradualrecompression shown in figure 10(c) for an angle of attack of 13.50 isbelieved to be caused by the shock moving a significant distance abovethe airfoil over a region of separated flow. In this way, the pressurediscontinuity which may exist in the free stream will be recorded by the • *sarface orifices as a gradual compression through the separated flow.The spanwise contours of figure 13 show that stall occurred first
at - = 0.5 and progressed inboard and outboard.b/2
Load Distributions
Span load distributions.- The span load distributions forrepresentative normal-forcecoefficients for Mach numbers of 0.20,0.4O, and 0.60 (fig. 15) show no significant shift in load or center ofpressure with Mach number even when strong shock formations are present Son the wing. A comparison of the experimental data with theoreticalcalculations based on the method of reference 14 is made at a Machnumber of 0.20. The good agreement for all normal-force coefficientsbelow the stall indicates that the spanwise distribution of normalloads can be predicted adequately for most structural purposes.
Root bending-mcment coefficients.- The variation of the rootbending-moment coefficient with Mach number for various representativenormal-force coefficients (fig. 17) shows no compressibility effectsand, for all practical purposes, may be considered constant. The peakvalues of the bending-moment coefficient vary considerably with Machnumber and in general reflect the variation of maximum lift coefficient •with Mach number. Bending-moment coefficients obtained from the

16 NAcA TN No. 1697
thsoretical span load distributions show, as would be expected, very 0good agreement with the experimentally determined coefficients.
Twisting-moment distributions.- The root twistin-moment distribu-tions presented in figure 19, in general, show the influence of stalland shock formation on the wing. Figure 18(a) (Mo = 0.20) shows theprogressive build-up of negative twisting load at the tip with increasing 0normal-force coefficient. The fact that the tip twisting-momentparameter is larger than the root parameter indicates that the longertip-moment arm from the reference axis to the section center of pressurehas a greater influence on the local twisting-moment parameter than thelarger root chord. The sudden increase in twisting moment at the rootat a normal-force coefficient of 1.00 is attributed to the stall initially 0
yoccurring at ;- = 0.1 and to the accompanying rearward movement ofb/2the center of pressure at this station. The essentially flat distributionfor a normal-force coefficient of 0.72 was obtained after the wing stallbecame extensive.
Figure 18(b) presents the twisting-moment parameter for a Mach 0
number of 0.40 and, as in the case of a Mach number of 0.20, closely followsthe stall pattern. An irregular increase in the twisting-momentparameter for a normal-force coefficient of 0.95 occurring at the wingmid-semispan is again attributable to stall. The severity of the stallincreases with increasing angle of attack and can be seen to spread out • *from the middle of the semispan.
For the high-speed condition, No = 0.60, (fig. 18(c)) the twisting-
moment parameter increases as expected from CN = 0.2 to GN = 0.4. As
the angle of attack is further increased, the stations inboard of y = 0.7
show a decreasing twisting-moment parameter which indicates a forwar
7
movement of the center of pressure. This forward movement of the centerof pressure is associated with the formation of extensive local super-sonic regions on the forward portion of the upper surface of the airfoil,as previously discussed. The influence of mid-semispan stall is againnoted and occurs for the 0.915 normal-force distribution. •
Root twisting-mcuent coefficients.- The wing root twisting-momentcoefficients presented in figure 19 are referenced to a line perpendicularto the 25-percent position of the root chord. This point was arbitrarilyselected as a point of interest for the structural design of the wing-root section and attachment. There is a slight Mach number effect on •the root twisting-moment coefficient for angles of attack below 50 (inthe subcritical range); the effect, however, is much less than that
based on the Glauert factor 1 At angles of attack above 50, the
0 0 0 0 0 0 0 0

NACA TN No. 1697 17
twistlng-ment coefficient for a Mach number of 0.60 undergoes a largedecrease due to the forward movement of the center of pressure resultingfr the local regions of supersonic flow. The rapid stall at highspeeds to again evidenced by the sudden rise of the root twisting-momentcoefficient at an angle of attack of about 13.50. For Mach numbers of 0.20and 0.40, the slopes of the curves of root twisting-moent coefficientagainst angle of attack undergo decreases at the higher angles of attack 0corresponding to similar changes in the lift curves. The gadual stallat a Mach number of 0.40 and the sharp stall at a Mach number of 0.20 canbe seen from this figure.
CONCLUSIONS0
Tests of a 12-foot-span wing having 16-percent-thick NACA 66-seriessections, 2:1 taper ratio, and an aspect ratio of 6 have been conductedin the Iangley 16-foot high-speed tunnel up to a Mach number of 0.69and indicate the following conclusions:
1. The -ma--m lift coefficient increases from a value of 1.07 at aMach number of 0.15 to a peak value of 1.135 at a Mach number of 0.25and a Reynolds number of 3,500,000, then decreases, more rapidly at first,to a value of 0.895 at a Mach number of 0.50, after which it increasesvery rapidly to a value of 1.10 at a Mach number of 0.60 (limit of theminim-lift tests). At the lower Mach numbers serious losses in maximumlift coefficient were found to result from premature transition of thelaminar boundary layer to a turbulent boundary layer caused by leading-edge roughness.
2. The leading-edge radius has a significant effect on the marinm-lift characteristics of airfoils at the higher Mach numbers. The rapidrise of the maxi- lift coefficient for the NACA 66-series wing isattributed primarily to the unusually high acceleration of the flowaround the sharp leading edge of the wing and to the rearward movementof the shock formation on the upper surface of the wing.
3. No significant changes in span load distribution and rootbening-otient coefficients occurred throughout the Mach number rangefor all angles of attack below the stall. For all Mach numbersinvestigated, the spanwise distribution of normal loads on the wing canbe predicted adequately for most structural purposes.
4. Extensive local supersonic-flow regions are formed over theupper surface of the wingj peak local Mach numbers of about 1.75 areobtained for a free-stream Mach number of 0.55 and an angle of attackof 13.20.
0 I I .. I 0 0 i i

e018 NkcA TN No. 1697
5. Tihe effect of the formation of the extensive local supersonic- )flow regions over the upper murface of the vin is to move the center 0of pressure forward and reduce the seotion tvisting-mcment and roottvist~ngmfett coefficients for given nozmal-torce coefficients.
Langley Aeronautical LaboratoryNational Adviaory Ccmittee for Aeronautics
langley Field, Va., April 12, 1948
* 0
. , , ,, . - , ,. . m . .. . .. . . ...

BACA TN No. 1697 19
0
1. Mase, Thoms C.: Som ITects of Reynods and Mach Nimber. on theLift of an KA 0012 a Wing n the RACk 19-Foot PressureTunn1. SM CS go. 319, 193.
2. Cleary, Narold .: Iffeots of Cosressibiltty on aimum LiftCoefficiets for Six Propeller Airfoils. XAG ACR No. L4J12la,
3. Nsen, Jams M., ad Oadeberg, Burnett L.: Iffect of Mah andReynolds lumbers on the Power-Off Xszbm Lift CoefficientObtainable on a P-391-l Airplane as Deterained in Flight. 0RaA ACR *o. 4n8, 19k1.
I4. lode, Richard v.: correlation of Flight Data on Limit PressureCoefficients and Their Relation to Nigh-Speed Burbling andCritical Tail L"ds. RACA ACE No. LI27, 19).
5. Pearson, 1. 0., Jr., Evans, A. J., andWest, F. 1., Jr.: Effects ofCpressibility on the Mwoimn Lift Careteristics and SpenviseLoad Distribution of a 12-loot-Spean Fighter-ype Wing ofNACA 230-Series Airfoil Sections. NRCA ACR No. L5I0, .194.
6. Pearson, E. 0., Jr.: ffect of Ccrnessibility on the Distribution * •of Pressures over a Tapered Wing of NACA 230-Beries AirfoilSections. RACA TN No. 1390, 1917.
7. Furlong, G. Chenter, and Fitzpatrick, James I.: Effects of Machmber and Reynolds limber on the eimtm Lift Coefficient of a
Wing of ZCA 230-Series Airfoil Sections. NACA TN No. 129,19&7.
8. Swanson, Robert S., and Gillis, Clarence L.: Wind-Tannel Calibrationand Correction Procedures for Tbree-DJtsnaional Models. NACA AERNo. L)3, 19ik4.
9. Goldstein, S., and Young, A. D.: The Linear Perturbation Theory ofCcmpressible Flow, vith Applications to Wind-unnel Interference.R. & M. No. 1909, Britsh A.R.C., 1913.
10. Lots, Irup'd: Cmrection of Doaivah in Wind Tunnels of Circularand miptic sections. NAA Tx No. 801, 1936. 0
11. Thom, A.: Blockage Corrections in a Closed High-Speed Tunnel.R. & M. No. 2033, British A.B.C., 1943.
12. Seiter, Jchn R. p and Steffen, Paul J.: Effect of Mach and Reynoldslimbers on Nazi== Lift Coefficient. NACA TI No. 104), 1916.

20 NACA TN No. 1697
013. Wal, *&MY 1.: dwvi.e Preame Distributions on a 12-Foot-- 9
pma Wing of ILCh 66-Series Airfoil Seotions up to a Machamber or M.6. NAcA TN No. 16%6, 191..
1. Anon.: Spaenvie Air-Load Distribution. AbO-l(l), A.y--ayv-Cr.e Cmitt.e on Aircraft Requirements. U.S. Govt.Printing Ofioe, April 1938. 0
15. Abbott, fra I., Von Doemboff, Albert Z., and StiTers, Louis S., Jr.:S - of Airfoil Data. NACA Rep. -No. 824, 1945.
16. Neely Robert I., and Foster, Gerald V.: Win&-Mmel Investiationof an NAC 66-Seres 16- t- ok Loi4-Ih Tapered Wing with SFowler and Split Flaps. JACk ACR No. 45128, 19116.
17. Sivells, James C.: kperlmental and Calculat d Chaacteristics ofTbe Wings of NACA 640-lo and 65-e10 Airfoil Sections with andvithout 21' Washout. NACA TR No. 142, 1947.
18. G5tbert, B.: Plane and T ree-Dimensional Flaow at High Subsonicspeeds. NACA mK No. lo5, 196.
19. Lindsey, W. F., Daley, Beard N., and Hmphreys, Milton D.: TheFlow and Force Characteristics of Supersonic Airfoils at IighSubsonic Speeds. NACA TN No. 1211, 1947. 0 0
0- - . . . . . . . . . .. . . . . .. .. .. .. . . . I l ] [ 1 I I IIIII . . . I i i i i i 0

NACA Tn No. 1697 21
TAIU I
Ammm aDIn s W 6&-== w13m
(Staions ad ordinates are given In percent of airfoil chord]
Root section Tip section
Upper suface Lover surface Upper smrface Lover surface
Station Ordinate Station Ordinate Station Ordinate Station Ordinate
0 0 0 0 0 0 0 0. 3 1.21 .57 -1.15 .37 1.24 .63 -1.31.68 1.16 .82 -1.37 .61 1.50 .89 -1.32
1.17 1.82 1.33 -1.68 1.09 1.89 1.41 -1.612.11 2.50 2.59 -e.25 2.32 2.61 2.68 -2.131.90 3.50 5.10 -3.08 4.79 3.70 5.21 -2.87
1..28 7.61 -3. .28 1.56 7.72 -3-441.97 lo -1.2 9.78 5.31 10.22 -3.93
14.89 6.05 15.31 -5.15 14.79 6.50 15.21 -4-.7019.90 6.89 20.10 -5.83 19.81 7.43 20.19 -5.2921.92 7.55 25.08 -6.3 21.83 8.16 25.17 --5.7429.93 8.05 30.07 -6.-7 29.86 8.71 30.14 -6.0834.95 8.1 35.05 -7.02 31.90 9.11 35.10 -6.3239.97 8.63 0.03 -7.18 39.9 9.36 40.06 -6.644.99 8.73 15.Ol -7.26 4.98 9.7 15.03 -6.5250.01 8.69 49.99 -7.22 50.03 9.43 19.98 -6.4855.04 8.50 5.96 -7.06 55.08 9.23 51.93 -6.360.07 8.n 59.93 -6.71 60.11 8.80 59.86 -6.0565.10 7.46 64.90 -6.20 65.19 8.08 64.81 Z.70.10 6.52 69.90 -5.42 70.20 7.07 69.80 .8675.09 5.43 74.91 -1.50 75.18 5.89 71.82 -4.0380.08 1.23 79.93 -3.19 80.15 1.59 79.85 -3.1185.05 2.99 81.95 -2.1 85.U2 3.26 81.89 -e.1790.03 1.76 89.97 -1.1 90.06 1.9 89.94 -1.2495.01 .68 94.99 -.52 95.02 .76 91.98 -.43
100 0 100 0 100 0 100 0
leading-edg. radius - 1.475o leading-edge radius - 1.475cSlope of radius throu& leading Slope of radius through leading
ede. 0.058 dege - 0.117
I.

0
NACA TN No. 169i 23 00
-A
0
U)
U, 0
Li0
00
0
* .-aU)-a
0
G) 0
'20
'20
0U,
0
0
* 0 0 0 0 0 0 0 0

EAcA TN no. 1697 25w
0
4 1...
am'-0 NOW

NAck TN~ .. 160
L-477 U,
Z~ovstr-tr, viw O tet 7i4 r~outeJ n nrmi a0
imagesupprt sruts

.aL.L6/' ~.9 0
U0
0
0
i.
L. 0
- L-i
-q
'~
t~. -.-
5.. 0
71
.1~ 0
0
0
0 0 0 0 0 0 0 0 0

NACA T No. 697 3
0
-C5,
00
U22
CL0
D0

NACA TN No.- 1697 330
9x/Oorc - - -7 - - 0
fl-ure5. Yrlaon f vefge es RenolsPumedr t/ Mch tests

31& NAcA TN No. 1697
0 0 0 0 4 a a 0 a
_z 0)N0 @0 l
7__ ___NY- 4(7rC

NAcA TN wo. 1697 350
a.
.5-
.66
0~
4~-4
Mo., 4vhrM
00

0
36 NAcA TN No. 1697
a LI// L.z ~ (deg)
16S
0
*
.6
40
() a from 6' to stall.
F9ure 7 Concluded
0
*0 0 0 0 0 0 0 0

NAcA TN so. 1697 "37
0
W07
a •
.
I 0
7 7ao/a d/ n-0o
0 N
• • •• • •• •0
38 ACA TI No. 1697
-44 - - -
-40 - - -
4 .O -e4- -
3.6 - --.- 0
3.2PC /b - - -0
06
(o) a. -5.
Fip"~~~~ ~~ ~ ~ S.-0rdo fmfo rmr lsrbfo ~hMc u ra h
-. 8elSM~le17Ve5O

IACA TN No. 1697 39
5 1 - I I -- I I -I- I 1 0-48 0
-44
-4.0 ' 0--, 9/-.40
-3.6
-3.2 0
-24
-20
o .40
-. 6 55
PC, r 600 .60
j*
oWIN
00
0 /0 m0 M40506070 0 .Percent chord
F,"ure 9. Conthwed*0 I0 ZO 3 0 0 0 0 30 S0

40 -52NACA TN No. 1697
-52--- - - -- O -
-48 -
-44 --
-40 -
-3.6 Pa. ,r M 4o
-32 ---
-,1 -4 0M.
" M-- .580
0
0 50
10 I0 0 0 4050 0 70 90 )
Percent chord(c,) - 13Z.
Fiqure 9. - Conc/uded
* 0 0 0 0 0 0 0 0
RACA TN No. 1697 1
-48 --
-44 --
-40
-36-
-24 -
0 11
15
00
-. 6- a
0~ //75
- m. - -o
M.e 0l-smmaei Y~e rAc ub, f00 A~d6
00 /0 X

12 IACA T No. 1697
-52
-44 -- - - --.--
-40
-36 - -.
-3.2 -rf S
-28
"-------1- -1l -
1 33
-4.
00Pg- K6 - Cc° /kw.
4 0i< ,
0 V M0 30 40 50 0 V0 X0 X VOPe cent Chod
6 6) M. - 0o40.Figur /0. - Continow.

UACA TN no. 1697 43 0
-52~~~- - --- -4
-48
-40
-36 -
-3.2
S-24 ----
V i
-16360
030
0•0
-.4
(c) t - 060.
r~o /0- C&XAA*d
0 0 0 0 0 0 0 0 0

xAcA TUoo167
-14
C. 7
q00
1412 0
4
-/9
armo-I *W e FWiw~r f * -/0~yOnorf )/or*fw b - 6
4&5
MACA TiU No..6130
-- 60
3.7@
.8----. 70
.6
ICwvcAgk'l
......0..
MACA TN No. 1697
-26
3.2 0.
Fiqu C Prssur C~lt~JTJover the upper rface f the wing for
resenta five aloqes of iffd(ft/. Q0

0
-3.0
-2.
(d) Q(~ /.6
-1.0
-2.9 0
F'ue/.-Concluded 0

148 NACA TN No. 1697 )
440
-. 9
-. 6
-. 7
-- 2.0
flqure /3. -Pre3sure contouri over #A-- qoper surface of the w,,'g forrepre~gen totle anq/es dl olt/ocX for M. -060

NacA TN No. 169T 49 )
-/0
-2
0 o(
?.0
fl-pre 13 - Concluded

50 NACA TN No. 1697
d a-r"A
- - - .- ..
S E.!,--
- o- -- i • 0
. . . .. . . . . . ... . ... .. .. . . .. . ... :" i~n l I . . .. II - . ..i - .. . ' , .. . . .

NACA TN No. 1697 510
ts0
Q0
RR
RS
(F)
L~ZJ
Ulf0-4. Ql -

52 NArA TN No. 1697
I b
IE0
fa*-0 0vj
ul 61 -l
N z 0 0 04 '4

NAcA TN No. 1697 53
0
0
* 0

0
54 NACA TN No. 1697
00
---- --- 0
_ _ k S
0
~
0
_ _ I 0@
0
0
'~ -~
- - a - -- ---- -- - -. 0
5 ,~tW.~ijjDO3 ~34I -/~"-~V
0
0 0 0 0 0 0 0 0

v
NACA TN No. 1697 55
0
,Peak C vo/u-SF:: P::CN./0 -. 9
__ - - .8
_ _ __ __- .6
Theoretlcol-\
_ _ _ _ _ _ _ .40.04
x 0 - .2 * *
0 - -0
-0 .4 .5 .6 .7
Mach number, Mo
Fire 17. Variaoton of root ending- moment coefficientwith Mach number for represento/ive normal-force coefficienta.

56 NACA TN No. 1697
1000
0
.0,
lo* 0
ol'
J1'CIO

NAcA Ty no. 1697 57
0 oe0
4* V
"Ill,0
Ab

NACA 19 o.1697
oor0
PO0
N,
F\ 1\
momewswomyuwi 0

BACA TNo.1697 59
cs 0
~1
IN0
_ _ _ _ _ _

-d~ 49n 49 0.d00 0~ 000 00
9' 00 1 0!0 9
1j. 49~0
1 0 . -
00
00 4.OH 0
d~ 04
43 4 S~
41143 0 $40 4 0
D....
j 010*. * 0 !0

'-4
'I q4
0
-1 0 0 1
frH v4 9~ 00r4 0 q-D .4 4 0
#. in 0*r P4 -I 8
0 c
Nk 9
N P45* Hzld '
ft 0~ r-4 0
0 41I 0.
-4 , 0 w- rz.0
1 0 0)
H Cc :4 U r 4 )
o0 1"410 -C.)
0 43 +3*- o
04) HA J C) 9 0 o 'ro
.1-I .004 * ~ ~ 5
.1ID.164