to apply or not to apply: fafsa completion and … apply or not to apply: fafsa completion and...
TRANSCRIPT

To Apply or Not to Apply:FAFSA Completion and Financial Aid Gaps
Michael S. Kofoed∗
United States Military Academy
January 14, 2015
Abstract
In the United States, college students must complete the Free Application forStudent Federal Aid (FAFSA) to access federal aid. However, many eligible studentsdo not apply and consequently forgo significant amounts of financial aid. Using datafrom the National Postsecondary Student Aid Survey, I find that 19.35 percent ofeligible students who attend college do not complete FAFSA and forgo significantamounts of financial aid. These students tend to be lower to middle income, white,and male. Using propensity score matching, I find that each year applicants forgo$9,741.05 in total aid which aggregates to $24 billion annually.
Keywords: Student Financial Aid; FAFSA Completion; Economics of Higher Education;Propensity Score Matching.
JEL Classification Numbers: I2.
∗I thank David Mustard, Christopher Cornwell, Ian Schmutte, and Jonathan Williams for helpful com-ments and advice. I also appreciate the comments of seminar and conference participants at the University ofGeorgia, the Association of Education Finance and Policy, the Southern Economic Association, and the Mid-western Economic Association. Address: Department of Social Sciences, United States Military Academy,607 Cullum Road, West Point, New York, USA, telephone: 1-845-938-2932, e-mail: [email protected].
1

1 Introduction
One way to make college more affordable is to ensure that each eligible student completes
the Free Application for Federal Student Aid (FAFSA). FAFSA serves as the gateway for
many programs sponsored by the federal government including Pell Grants, Stafford loans,
Perkins loans, and work-study. In addition to federal aid, many states, institutions, and
private organizations sponsoring scholarships require FAFSA completion to qualify for
other financial aid programs. Despite the large amounts of aid at stake, many students who
are eligible for aid fail to complete FAFSA (King 2004). Possible explanations for why
eligible students do not complete FAFSA include the complexity of the form1 (Deming and
Dynarski 2009) and a lack of information regarding eligibility for aid2 (Avery and Kane
2004).
Using the National Postsecondary Student Aid Study (NPSAS), I investigate which
individual, academic, and institutional attributes influence a student’s decision to not
complete FAFSA, and quantify the amount of financial aid that a non-applicant forgoes.
The NPSAS is an excellent source of information describing students who are already
enrolled in college and what resources students used to cover costs of attendance. These
data contain personal information from the FAFSA, academic characteristics such as high
school GPA, detailed scholarship, grant, and loan information, and institutional
1Dynarski and Scott-Clayton (2006) outline the financial aid process and discuss the complexity of theFAFSA. The FAFSA is five pages long with 128 questions and is compared to the IRS 1040EZ which is onepage with 37 questions and the 1040 form is two pages with 118 questions. The authors use simulationsand econometric analysis to find that a number of questions on the FAFSA have no effect on eligibilitydetermination or financial aid allocation.
2Bettinger et al. (2012) conduct an interesting, natural experiment to measure the effect of complexityand information asymmetry on the probability a student completes FAFSA. Partnering with H & R Block,a tax preparation company, Bettinger and coauthors assist students completing FAFSA. The authors dividestudents into three groups. The first group is paired with an H & R Block employee who calculates theexpected family contribution (EFC) for the student and then helps the student complete FAFSA. For thesecond group, the employee calculates the student’s EFC only, and the third group receives no help buta brochure explaining the benefits of college. The students in the first group are more likely to apply forfederal aid and enroll in college.
2

characteristics. While the NPSAS contains student responses from the FAFSA, the
National Center for Education Statistics (NCES) collects information that would have been
on the FAFSA form from students who did not complete FAFSA. Using the data collected
from student interviews, the NCES imputes the Expected Family Contribution3 (EFC) for
students who did not complete FAFSA.4
I find that students who attend college but do not complete FAFSA are more likely
to be white, male, independent from parents5 and come from families making less than
$50,000 annually. These students may have incomplete information regarding federal
student aid eligibility before enrolling in college, and thus do not apply.
I use propensity score matching to calculate the amount of aid that a student
forgoes by not completing FAFSA. I find that the average total financial aid gap6 between
applicants and non-applicants is $9,741.05, of which $1,281.00 are Pell Grants, $2,439.50
are subsidized student loans, $1,986.65 are the balance of unsubsidized student loans, and
$1,016.04 are institutional grants. Given the 20,966,826 college students in the United
States in 2012,7 these estimates imply that non-applicants forgo a total of $24 billion in aid
of which $3.2 billion are Pell grants, $6.0 billion are subsidized student loans, $5.6 billion
are unsubsidized student loans, and $2.9 billion in institutionally funded grants. The
3The EFC is the government’s estimate of how much the student or student’s family can contribute to thestudent’s education. The federal government uses a formula that incorporates family income and the numberof dependents in the student’s family. I include a detailed description of the EFC formula in Appendix A.
4This imputation is done “by regression using dependency, family size, income, and number in college.”While these imputed observations must be treated with caution, the NCES does include all components ofthe federal aid formula so there should be no concern about omitted variable bias. These data construct ahelpful counterfactual to estimate how much aid a student would have received if he would have completedFAFSA.
5The difference between independent and dependent students is very important when studying federalfinancial aid. A student is considered independent if he or she is over the age of 24, has dependents, ismarried, or is a military veteran. Otherwise the federal government classifies the student as a dependent.If the student is an independent, then the government uses the student’s income to determine need. If thestudent is a dependent then the government uses parents’ income to determine need.
6In this study, I define the term financial aid gap to be the difference in financial aid between studentswho complete FAFSA and students who do not apply for federal financial aid.
7National Center for Education Statistics (2012).
3

reminder of the total aid consists of work-study, and state and private aid programs.
Considering that the average student in 2012 took on $9,480 in both federally backed and
private student loans, these estimates show that a considerable amount of student loan
debt could be avoided by receiving grant aid for which the student is already eligible.
Increasing FAFSA completion rates may alleviate the total balance of student loan debt
which is, as of 2012, approaching one trillion dollars.
The failure to apply for and obtain federal aid is of great concern because financial
aid can influence whether a student enrolls in college (Cornwell et al. 2006; Leslie and
Brinkman 1987; van der Klauuw 2002; Dynarski 2000), the type and quality of the
institution a student chooses (Bruce and Carruthers (2014), Avery and Hoxby 2004; Fuller
et al. 1982; Kim 2004), and the probability that a student persists to graduation
(Bettinger 2004; Dynarski 2008; Singell 2004; Alon 2011; Novak and McKinney 2011;
Lovenheim and Owens 2013; McKinney and Novak 2013). While the data used in this
study do not permit me to address these education outcomes directly, the financial aid
literature provides evidence that failure to complete FAFSA and thus forgoing financial aid
has negative consequences for student success.
This paper contributes to the literature by using various econometric techniques8 to
understand what factors affect a student’s decision to complete FAFSA, and how much aid
an eligible student forgoes by not applying for federal aid. While much of the literature
focuses on the effects of financial aid on educational outcomes, this paper shows how
completing FAFSA influences how financial aid is allocated, which correspondingly has a
substantial effect on the student’s academic and occupational success.
8King (2004) presents summary statistics from the 1999-2000 wave of the National Postsecondary StudentAid Survey (NPSAS). Characteristics that are negatively correlated with FAFSA completion include if thestudent is considered an independent, income, full or part time enrollment, and the type of school to whicha student enrolls. The NPSAS inputs an estimated expected family contribution for non-applicants. Usingthese data, the author concludes that many students who do not complete FAFSA, would have been eligiblefor financial aid.
4

The results from this paper can help policymakers and higher education
administrators identify certain groups of students who are not reached by school counselors
or other programs before they entered college. Completing FAFSA and helping students to
obtain the financial aid resources for which they are already eligible, reduces the cost of
attendance and the growing amount of student loan debt. While increased FAFSA
completion would increase the amount of money spent by the Federal Government on
education, the returns in the form of increased tax revenue from workers’ increased income,
possible health benefits (Eide and Showalter 2011), and a more engaged citizenry (Dee
2004) may be worth the increased investment.
2 Data and Trends
2.1 Description of Data
2.1.1 National Postseconday Student Aid Study (NPSAS)
I use data from the 1999-2000, 2003-2004, 2007-2008 waves of the National Postsecondary
Student Aid Survey (NPSAS). The National Center of Education Statistics (NCES), a
subsidiary of the United States Department of Education, compiles the NPSAS and
updates it with a new cross section every four years. These data contain information from
many sources including student interviews, student responses to the FAFSA, and surveys
completed by college and university administrators about their institutions. Data
contained in the NPSAS describe student characteristics such as grades, standardized test
scores, and parents’ income. NPSAS also identifies the college or university that the
student attends and provides data about enrollment size, institutional control, and tuition
pricing. All monetary variables are expressed in 2008 dollars.
NCES constructed the NPSAS by randomly sampling both institutions and students
5

to create a representative sample of typical college students for each of the fifty states, the
District of Columbia, and Puerto Rico. Each institution of higher education that is eligible
for federal student aid (i.e. Title IV compliant) was assigned a sampling probability and
sampled with replacement so that the NPSAS creates a representative sample of the college
student population in each state. After the number of observations per institution was
determined, NCES randomly sampled students such that the data represent the student
body with regards to demographic information, types of financial aid, and major.
2.1.2 Sample Selection
I limit my sample to undergraduate students who are American citizens, attend only one
institution during the school year, and attend a four-year public or private not-for profit
institution. I drop observations that are over the age of 65 and under the age of 15 (115
observations). I also drop observations of students whose institutions reported a “sticker
price” tuition rate less than $100 for full-time students (22 observations) and attend
universities with headcount enrollment less than 100 students (51 observations). The
tuition observations for these institutions were probably mistakes because they are large,
well known universities whose tuition prices are much greater.
2.1.3 Summary Statistics
Eligibility for federal financial aid is determined by the cost of attendance (including
tuition, fees, books, room and board, etc.) minus the Expected Family Contribution. One
unique attribute of the NPSAS is that the NCES calculates a hypothetical EFC for
non-applicants. Using the cost of attendance and EFC data from the NPSAS, I calculate
potential eligibility and then sort observations into four groups: eligible and applied;
eligible and did not apply; non-eligible and applied; non-eligible and did not apply.
Table 1 shows descriptive statistics for the 83,600 observations in this study. As a
6

condition of the restricted use license, all summary statistics and number of observations
are rounded to the nearest ten. Across the three cross-sections, the average total financial
aid package and federal need based grant are $8,140 and $760 respectively. The average
expected family contribution during this time period was $10,640 and the average GPA
and SAT scores were 3.00 and 1060 respectively. The universities in the sample charged an
average $7,490 for the entire school year in tuition and fees and have an enrollment of
14,580 students. The students in this sample are representative of student bodies for most
colleges and universities. Table 2 describes the differences in key summary statistics
between students who are eligible for any type of federal aid who complete FAFSA, eligible
students who do not complete FAFSA, non-eligible students who do not complete FAFSA,
and non-eligible students who do not complete FAFSA. Of these students 58.90 percent are
eligible for aid and complete FAFSA, 19.35 percent are eligible for aid but do not complete
FAFSA, 8.29 percent are not eligible for any federal aid and complete FAFSA, and 13.46
percent are not eligible for any federal aid and do not complete FAFSA.
The differences between non-applicants and applicants conditional on being eligible
for any federal aid are significant. The EFC for eligible non-applicants (column 2) is $5,200
more than eligible students who apply (column 1). Eligible, non-applicants (or their
parents) tend to make around $13,500 more than non-applicants. Non-applicants also tend
to be older, more white and Asian, and more likely to be independent from their parents.
Academically, non-applicants have higher GPA and SAT scores, but attend colleges that
are less expensive. Non-applicants are also less likely to earn financial aid even when
compared to not-eligible students who complete FAFSA.
Students who are not eligible (columns 3 and 4) for any federal aid have, on
average, $18,642 more in EFC and $61,437 more in parent or family income than eligible
students (columns 1 and 2). However, eligible and non-eligible students are quite similar
when comparing GPA. Also, students who were not eligible for aid attend schools who
7

charge, on average, $2,531 less than students who are eligible for aid. These results may
reflect the aid formula used by the Department of Education that accounts for cost of
living expense (including tuition, room, and board) in addition to financial need. Students
attending schools with lower tuition prices would have less incentive to complete FAFSA
and less likely to be eligible for federal financial aid compared to students at more
expensive institutions.
Table 3 displays summary statistics for students whose EFC is below the eligibility
cap for a Pell Grant. Pell Grants are only available to students whose EFC is under a
certain limit determined each year and whose cost of attendance exceeds the EFC. The
maximum EFC for Pell Grant eligibility was $4,110 in 2008, $3,850 in 2004, and $2,925 in
2000.
The summary statistics for Pell Eligible students are similar to those for the whole
sample in Table 2. Pell elgible students who complete FAFSA receive, on average, $10,297
more than those students who did not complete FAFSA. Non-applicants, however, only
have $100 more in Expected Family Contribution than those Pell-elgible students who
complete FAFSA. Also non-applicants are more likely to be white or Asian, older,
independent from their parents, and attend institutions with lower tuition prices. The pool
of students who are not eligible for federal aid (meaning that their cost of attendance is
still less than their EFC) is quite small. Non-eligible students account for 156 observations
of 34,408 (or around 0.453% of the sample).
2.2 Trends in FAFSA Completion
Figure 1 shows the percentage of dependent and independent students who completed
FAFSA for each year by parents’ income. The Department of Education classifies a student
as a dependent if she is under the age of 24, single, a non-veteran, and has no children. For
financial aid purposes, a dependent student reports her income along with her parents’
8

income, while an independent student reports solely her own income.
Income reduces the percentage of students who complete FAFSA because eligibility
for many federal programs is need based. What is surprising, however, is how quickly the
share of students who do not complete FAFSA drops as income rises; particularly for
independent students. For example, around 80% of independent students who make less
than $10,000 complete FAFSA, but only 50% of independent students who make $40,000
apply for federal aid.
Eligibility for federally based financial aid is determined by the difference between
the cost of living and the EFC. Figure 2 plots the percentage of students who completed
FAFSA given the amount of federal aid (including grants, loans, and work-study
employment) for which the student is eligible. If students have complete information
regarding their eligibility before their decision to complete FAFSA, then a student would
not complete FAFSA when the EFC exceeds the cost of attendance; while all students who
are eligible for aid would complete FAFSA. Thus there would exist a clear discontinuity
where zero percent of students complete FAFSA when they are not eligible and then all
students with positive need would complete FAFSA.
The vertical line in Figure 2, plots what the FAFSA completion trend should look
like if students have perfect information and low transaction costs of completing FAFSA
(compared to actual trends for both dependent and independent students). This figure
indicates that students do not have complete information regarding their eligibility because
85 percent of eligible, dependent students and around 70 to 80 percent of eligible,
independent students complete FAFSA. One reason that independent student consistently
complete FAFSA at lower rates is that they do not have parents or high school counselors
to motivate or ensure FAFSA completion.
While non-eligible applicants may waste time and other non-monetary resources
while completing FAFSA, the group of students of most concern to policymakers are the
9

eligible students who do not complete FAFSA. FAFSA completion varies greatly depending
on the extent of need. Marginally needy students complete FAFSA at a rate from 55 to 80
percent. However, the FAFSA completion rate drops for the extremely needy students who
may be most sensitive to changes in financial aid.
Figure 3 plots the percentage of students who complete FAFSA across the high
school GPA distribution by dependency status. Between 60 and 70 percent of independent
students complete FAFSA until the 70th percentile where the completion rate drops to 50
percent. GPA may not significantly influence on FAFSA completion as income or tuition
because of two reasons. First, the federal government allocates aid by considering financial
need not academic merit and students who receive institutional or private merit aid are
still eligible for federal need based aid. Second, only students at the very top of the grade
distribution are generally eligible for merit aid.9 While one may suppose that a student
who already has a full merit scholarship may have less incentive to complete FAFSA,
Figure 3 shows that this trend may not be general for all students.
3 Estimation Strategy
This study examines three questions regarding the application for federal student aid.
First, how do demographic characteristics and family finances influence whether a student
completes FAFSA? Second, what characteristics influence eligible students to mistakenly
not apply even though they would have been eligible for aid? Finally, how much aid does a
non-applicant forgo?
9Notable exceptions include HOPE-style merit aid programs that are usually very generous. For example,during the sample periods, Georgia students were only required to have a 3.0 high school GPA to be eligible.
10

3.1 Applying for Federal Aid
3.1.1 Probit Model
I estimate a probit model, to calculate how personal characteristics, financial resources,
and institutional characteristics influence a student’s decision to complete FAFSA. If all
students have complete information about their eligibility for federal aid before they
complete FAFSA, then the only variables that should influence FAFSA completion are the
cost of attendance and the expected family contribution. All other variables such as
income, gender, race, and GPA should not be statistically significant because they do not
directly determine aid eligibility.10 However, if students do not have complete knowledge
about their aid eligibility before they complete FAFSA, many of these characteristics will
influence their decision because it biases the student’s belief about their eligibility. One
helpful aspect of the NPSAS, is that the Department of Education provides a random
sample of students who did not complete FAFSA and calculates their hypothetical EFC.
This EFC serves as a helpful counterfactual to determine the eligibility status of
non-applicants. I also estimate a probit model using only students who are eligible for Pell
Grants.
3.1.2 Multinomial Logit Model
Knowing which groups of students are eligible for federal aid, but do not apply would help
policy makers boost FAFSA completion and ensure that deserving students receive the
financial aid for which they are eligible. If the assumption of complete information does
not hold, then there are essentially four possible outcomes: eligible students who do
complete FAFSA, non-eligible students who do not complete FAFSA, non-eligible students
10While Federal aid is means tested, income is only one component of the EFC and thus if studentshave complete information, then EFC should be statistically significant while income should not. Howeverwith incomplete information, a student may incorrectly estimate her EFC. I summarize how the federalgovernment calculates EFC in the Appendix.
11

who do not complete FAFSA, and eligible students who do not complete FAFSA. To
measure how personal, financial, and institutional characteristics influence the probability
that given an ineligible student does not complete FAFSA, I estimate a multinomial logit
model. The multinomial logit model has response probabilities:
P (y = j|X, I) =exp(XβJ + αI + γS)[
1 +∑J
h=1 exp(XβJ + αI + γS)] , (1)
where I is a student’s own or family income, X is a matrix containing all other personal
characteristics, S is a matrix of school characteristics, and J indicates which
eligibility/application group a student finds herself in.
Unlike the probit model, I do not estimate the multinomial logit model for only
students whose EFC is below the cutoff for possible Pell eligibility. It is possible to have an
EFC below this cutoff but not receive a Pell Grant because the student attends an
institution where the cost of attendance is less than the EFC. In my sample, this condition
applies only to 156 observations that account for only 0.453% of the sample of students
with sufficiently low EFCs for Pell eligibility. If one removes these two options with small
numbers of observations, then the multinomial logit model collapses to the standard logit
model.
3.2 Propensity Score Matching and the Financial Aid Gap
Propensity score matching calculates the difference between an outcome and its
counterfactual when using non-experimental data. The basic conceptual framework for
propensity matching is provided by the Roy (1951) and Rudin (1974) models. I consider
students who complete FAFSA as the treated group and students who fail to complete
FAFSA as a control group. The financial aid gap is essentially the average treatment on
the treated, which can be calculated by the following formula:
12

τatt = E(y|w = 1)− E(y|w = 0),
where y is the amount of financial aid that a student receives, w is a latent variable
indicating whether a student completed FAFSA, and τatt is the average treatment on the
treated.
One challenge in using this framework is that one cannot observe E(y|w = 1) or
E(y|w = 0) at the same time for the same student because either the student completes
FAFSA and receives an observable financial aid package or does not complete FAFSA and
receives no federal aid. The other observation is purely counterfactual.
Propensity score matching calculates a counterfactual with similar characteristics to
a given treated observation. To avoid problems with dimensionality, the researcher first
calculates a propensity score for receiving the treatment for each individual and then uses
one of many available algorithms to match a student who completed FAFSA with a similar
student who did not complete FAFSA.
In this study, I use Gaussian kernel matching. While, nearest neighbor is the
simplest algorithm and is considered a good baseline for comparison to other forms of
estimation (Caliendo and Kopeinig 2008), I use Kernel matching because this technique
uses all of the observations within a certain bandwidth (Heckman et al. 1997, 1998) instead
of using only one or an average of a few observations to develop the counterfactual as in
nearest neighbor matching. The counterfactual is simply a weighted average of all
observations with weights determined by how close an observation is to the treated
observation. Using a normal density, observations that are the closest to the treated
observation are weighed greater than those farther away. Following Smith and Todd
(2005), I match with replacement which allows for better matching and increases the
standard error, thus reducing the possibility for Type I error in casual inference.
13

The counterfactual observation, using kernel smoothing, is:
E(y|w = 0) =
∑i:Wi=w yi · φ
(Xi−x
h
)∑i:Wi=wφ
(Xi−x
h
) , (2)
where φ is the standard normal distribution, Xi is the control observation for which the
weight is being calculated, x is the treated observation that the researcher is comparing,
and h is the chosen bandwidth.
One matching algorithm is not optimal for all circumstances (Imbens 2004), there
are tradeoffs for using one method over another. For example, the variance of the nearest
neighbor estimator is smaller than the variance in the kernel estimator, but the kernel
estimator uses all available data to form the counterfactual to reduce the probability of a
bad match (Heckman et al. 1997; Abadie and Imbens 2006). Also, a tighter bandwidth
creates a smoother estimate, but reduces the number of observations taken into
consideration. The literature is divided regarding optimal bandwidth (Imbens 2004), so I
use 0.06 as the bandwidth; which is common in other studies (e.g. Heckman et al. 1997). I
check this bandwidth selection by repeating the routine using bandwidths of 0.03 and 0.10
and find that the alternative bandwidths do not significantly affect the results.
4 Results
4.1 Results from Probit Models
Understanding which personal, academic, and institutional characteristics affect a student’s
decision to complete FAFSA is important to policymakers because financial aid affects a
myriad of education outcomes. Since cost of attendance and Expected Family Contribution
are the only variables that directly affect aid eligibility, if students have perfect information
then all other variables should not be statistically significant. Table 4 displays the partial
14

effects from the estimated probit models for both the full sample (columns 1 and 2) and
the sub-sample comprised of only Pell eligible students (columns 3 and 4). Included with
the covariates discussed in Section 3.1, columns 2 and 4 show models that include state
effects to estimate if results are robust even across unobserved characteristics of the various
states. These fixed effects should also control for particular state financial aid programs
that require students to complete FAFSA to gain access to aid.
Demographic and family characteristics have considerable influence over the choice
to complete FAFSA. In accordance with the descriptive statistics in Section 3.2, the probit
model indicates that the probability that a student completes FAFSA declines as income
increases, but the magnitude of the effect is surprising. An increase in a student’s own or
family income by $10,000 decreases the probability of FAFSA completion by 3.29
percentage points. This decline in FAFSA completion is concerning because many low or
moderate middle income households still would be eligible for some amount of Pell Grant
or subsidized student loan.
Other student characteristics influence FAFSA completion. Probably as a result of
extensive outreach programs at both highs schools and universities (Alon 2007; Boschung
et al. 1998, Fenske, Porter, and DuBrock 2000; and St. John and Noell 1989), black and
Hispanic students are, on average, 12.5 and 7 percentage points more likely to complete
FAFSA than their white classmates. For the sample of only Pell eligible students, blacks
are around 10 percentage points and Hispanics are around 6 percentage points more likely
to complete FAFSA than whites.11 Females who are eligible for aid are also 1.8 percentage
points more likely to complete FAFSA. While these increases are beneficial for
underrepresented students, white students may erroneously believe that minority status is
required for aid eligibility. Also, dependent students are 8.16 percentage points more likely
11Recall that the NPSAS contains observation of only individuals who matriculate into college. Theseresults may be different if the data included both students and those who never attend college.
15

to complete FAFSA than independent students. All results are robust when state fixed
effects are added (columns 3 and 4). However when students who are not Pell eligible are
omitted from the sample, many characteristics that do not directly affect aid eligibility
become statistically insignificant. This result is probably because students who are eligible
for a Pell Grant have a sufficiently low EFC and may have benefited from college and high
school counselor outreach.
4.2 Results from Multinomial Logit Model
The complexity of the FAFSA form may prevent students who would be otherwise eligible
for a Pell Grant or subsidized student loans from completing FAFSA. To understand which
institutional, personal, and academic characteristics are associated with non-application, I
estimate a multinomial logit model with the following categories: eligible and applied, not
eligible but applied, not eligible and did not apply, and eligible but did not apply. I sort
observed students into one of these three categories by subtracting each student’s EFC
from the cost of attendance of the college the student attends. Then using the indicator in
the NPSAS for whether a student completed FAFSA, I sort students into the four
categories described above. The students of interest are eligible for aid but do not complete
FAFSA and thus were denied financial aid.
Figure 4 plots financial need (meaning cost of attendance net EFC) against parent
or student income for students who did not complete FAFSA and thus forgo any federal
financial aid. I limit this figure to students whose own or parent’s income is less than
$100,000. Any student whose need is greater than the minimum Pell Grant12 would have
been eligible for federal aid. While the number of eligible students declines with income,
there still is a significant number of eligible students who are not completing FAFSA. One
surprising result from this figure is how many students are still eligible for financial aid
12During the 2007-2008 school year, the minimum Pell Grant amount was $400.
16
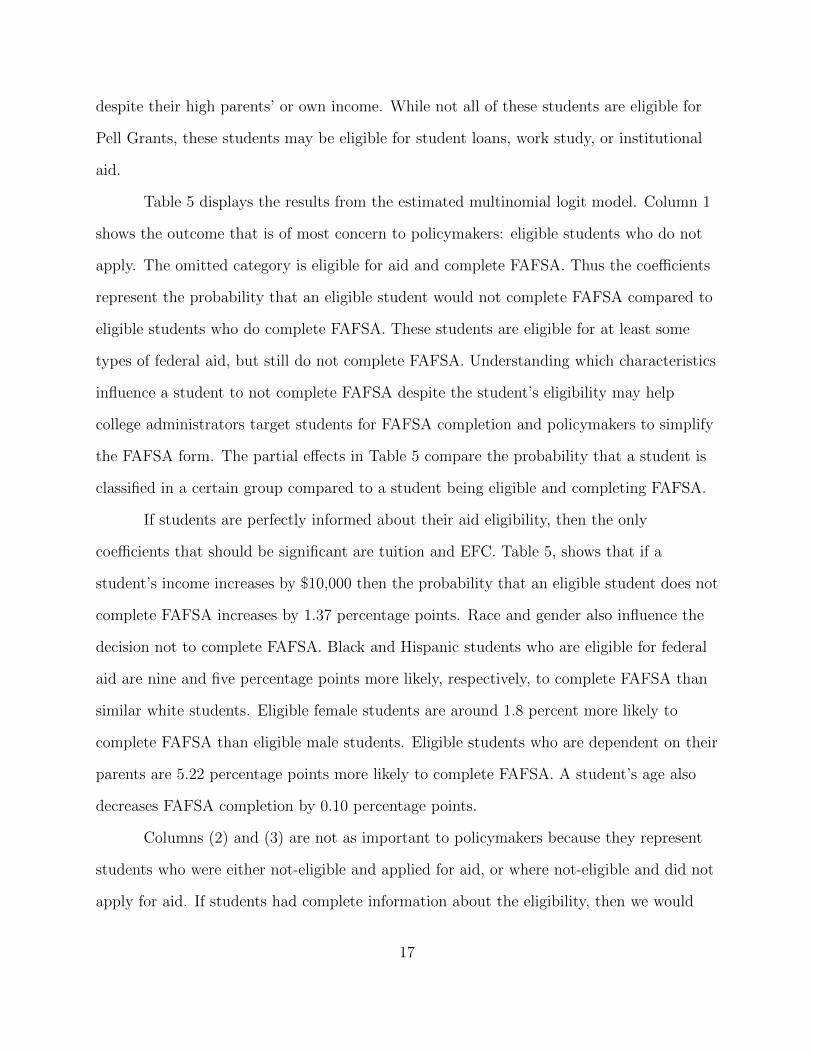
despite their high parents’ or own income. While not all of these students are eligible for
Pell Grants, these students may be eligible for student loans, work study, or institutional
aid.
Table 5 displays the results from the estimated multinomial logit model. Column 1
shows the outcome that is of most concern to policymakers: eligible students who do not
apply. The omitted category is eligible for aid and complete FAFSA. Thus the coefficients
represent the probability that an eligible student would not complete FAFSA compared to
eligible students who do complete FAFSA. These students are eligible for at least some
types of federal aid, but still do not complete FAFSA. Understanding which characteristics
influence a student to not complete FAFSA despite the student’s eligibility may help
college administrators target students for FAFSA completion and policymakers to simplify
the FAFSA form. The partial effects in Table 5 compare the probability that a student is
classified in a certain group compared to a student being eligible and completing FAFSA.
If students are perfectly informed about their aid eligibility, then the only
coefficients that should be significant are tuition and EFC. Table 5, shows that if a
student’s income increases by $10,000 then the probability that an eligible student does not
complete FAFSA increases by 1.37 percentage points. Race and gender also influence the
decision not to complete FAFSA. Black and Hispanic students who are eligible for federal
aid are nine and five percentage points more likely, respectively, to complete FAFSA than
similar white students. Eligible female students are around 1.8 percent more likely to
complete FAFSA than eligible male students. Eligible students who are dependent on their
parents are 5.22 percentage points more likely to complete FAFSA. A student’s age also
decreases FAFSA completion by 0.10 percentage points.
Columns (2) and (3) are not as important to policymakers because they represent
students who were either not-eligible and applied for aid, or where not-eligible and did not
apply for aid. If students had complete information about the eligibility, then we would
17

expect the situation in column (3) to prevail for all non-eligible students, but not column
(2). Tuition rates and EFC in both columns conform to expectations. If a student
matriculates into a college with a higher tuition rate, then the probability that a student
will not be eligible for aid declines (0.659 percentage points for not eligible and did apply
and 2.40 for not eligible and did not apply). Females are less likely to find themselves in
either category. Also students are dependent or black are 5.23 and 2.58 percentage points
respectively more likely to complete FAFSA when they are not eligible.
4.3 Results from Propensity Score Matching
Finally, I use propensity score matching to measure the magnitude of the financial aid gap
between FAFSA applicants and non-applicants. One of the primary conditions for
propensity score matching is that the data must provide a region of common support
(Bryson et al. 2002); meaning that the distributions of the estimated propensity scores for
the treated and untreated must overlap and thus provide enough data to construct a
counterfactual. Figure 5 displays a histogram of the propensity scores for federal aid
applicants and non-applicants. The distributions of propensity scores for both categories
overlap over the majority of propensity scores. The possibility of a non-match does exist
however at the extreme ends, but for students on the margin of completing FAFSA this
should not be of concern. I also estimate the financial aid gap for Pell-eligible students
only, but I only estimate the gap by income level up to $50,000 to $60,000 a year because
higher income levels do not have enough observations for the kernel matching.
First, I measure the total financial aid gap. This gap includes all forms of financial
aid (both loans and grants) from all sources (private donors, institutions of higher
education, state and federal governments). Table 6 contains the results from the propensity
score matching that show that there is a large and significant gap between students who
complete FAFSA and those who do not. Figure 6 also plots these results over income for
18

each wave of the data over household income. While the gap is the largest for very poor
students, the gap still exists across income levels.
The most interesting result is the extent of the financial aid gap. The results from
the propensity score matching show that even students who have high incomes lose
considerable amounts of financial aid when they do not complete FAFSA. For example, for
students making over $100,000, the financial aid gap from the pooled sample is $9,150.22
per year. The large gap may be a result of private, institutional, and state aid programs
that are merit based but require the student to complete FAFSA. The gap also closes while
student income increases, but has remained somewhat constant over time.
The total aid variable cannot measure how the composition of the financial aid
package changes as income increases. For example, as income increases many students will
not receive Pell Grant aid but the Federal Government may offer them a subsidized student
loan. Also many higher income students may earn more merit aid if they attend a
university with more financial resources. To better understand how the financial aid gap
changes when income changes, I conduct the same propensity score matching technique on
Pell Grants and subsidized Stafford Loans.
Table 7 shows results from the propensity score matching for Pell Grants. Unlike
the total aid results, the financial aid gap is only positive for students whose income is less
than $60,000. While the gap is statistically significant at all levels, the minimum Pell
Grant was around $400 for all of the time period represented by the data. This result
implies that lower and lower-middle income households forgo significant amounts of aid (for
example, $1,732.04 for households with incomes between $30,000 to $40,000). For the very
poor, the effects of not completing FAFSA are very large. Households making less than
$10,000 forgo over $3,000 in Pell Grant aid. The accompanying Figure 7 plots these results
and shows how the stark downward trend of the financial aid gap for Pell Grants. Also
since the federal government has expanded the Pell program over the last decade, the
19

amount of Pell Grant aid that a non-applicant forgoes increased with each wave of the
data.The Pell aid gap almost doubles when only Pell eligible students are considered. The
average Pell grant forgone across time and income is $2,721.28, but even students whose
families make between $50,000 and $60,000 and are eligible for Pell (probably because they
come from a family with many dependents and few financial assets) forgo $1,357.63
Table 8 displays results for the financial aid gap for subsidized student loans. The
results are similar to those for Pell Grants except that it the financial aid gap is bigger
across income levels. While loans need to be repaid, they are valuable because the student
does not pay while in school and the Federal Government subsidizes the interest rate after
graduation. These results reflect the balance of the student loan and does not account for
the interest paid by the federal government on the student’s behalf but reflects the amount
of payments postponed and lower interest rate the student could have paid on that balance.
Even high income students lose out on significant amounts of subsidized student
loans by not completing FAFSA. Students whose families make more than $100,000 forgo
$1,125 while students with family/own income around $50,000 forgo almost $3,300. The
financial aid gap for subsidized student loans is consistent across each wave of the data.
Figure 8 plots the financial aid gap across income levels. The downward trend reflects the
need-based method of allocating subsidized student loans.
Table 9 displays results for unsubsidized student loan gap. These loans are offered
by the federal government and accumulate interest while the student attends school. The
amount of unsubsidized loans is determined by the university to fund the cost of
attendance after other forms of financial aid. Students do not need to demonstrate
financial need to receive unsubsidized loans, but students still must complete FAFSA to
access these loans. The average balance of unsubsidized loans forgone by non-applicants is
$1,986.65. Figure 9 shows how the unsubsidized loan gap changes with income. Unlike the
Pell Grant and subsidized student loan gaps, the amounts of forgone unsubsidized loans
20

increases as household income increases. Poorer households are eligible for other types of
aid and thus do not need unsubsidized loans, so richer households are more likely to use
these loans. For example the average amount of unsubsidized loan that a very poor
(income less than $10,000) forgoes is $1,610.02, but a household making more than
$100,000 will lose $3,303.61. Interestingly, being Pell eligible decreases the amount of
unsubsidized student loans that a non-applicant household forgoes, probably because these
loans are substituted with Pell Grants.
Table 10 displays results for the institutional aid gap. These results are not as clear
as the previous categories because institutions vary widely on the amounts of aid that they
are willing and able to allocate to students. As opposed to the previous aid categories
where all estimates were statistically significant at the 99% level, some estimates of the
institutional aid gap are not statistically significant. The the average aid gap across the
waves of the data and income is statistically significant and estimated to be $1,016.04.
Figure 12 shows the aid gap across household income. While there is a clear trend like in
previous categories, it does show that students regardless of income forgo significant
amounts of institutional aid when they do not complete FAFSA.
Table 11 shows results for the total grant aid gap. While FAFSA completion is not
required for all types of aid, many institutions and states do require a student to complete
FAFSA even when the aid eligibility for a particular program is not based on financial need.
Thus these results may help test the hypothesis that students to fail to complete FAFSA
do so because they already have sufficient grant aid that is not tied to the form. However,
these propensity score matching results indicate that students who do not complete FAFSA
forgo large amounts of grant aid which may include aid funded by the federal government,
state governments, and institutions. This total grand aid gap ranges from $5,464.45 for
family/student incomes less than $10,000 to $1,784.43 for families or individuals making
more than $100,000. The average forgone aid across years and income levels is $3,254.87.
21

The aid gap for only students who are Pell eligible is not significantly higher than the
general student population. Thus institutions may be substituting Pell Grant funds for
institutionally based financial aid. Figure 11 plots the total aid gap over income levels.
One possible reason that students may not complete FAFSA is that they could
already be receiving sufficient amounts of financial aid from their employer. Particularly
for non-traditional working students, employer funded tuition assistance can be an
important part of the financial aid package. Table 12 shows propensity score matching
results for students receiving employer aid across income levels, NPSAS waves, and Pell
Grant eligibility. I find that students who do not complete FAFSA do receive more
employer aid however, in some cases, the gap is neither statistically nor economically
significant. While some point estimates are significant, there is no discernible trend across
income levels that gives evidence to the idea that employer aid is influencing the FAFSA
completion decision for a significant number of students. There is also no difference
between the amount of aid between Pell Eligible and the complete sample of students.
Figure 12 plots the employer aid gap across income levels.
The propensity score matching results confirm that it is important that low-income
students complete FAFSA, but also suggest that lower middle and middle income students
lose significant financial aid if they do not complete FAFSA. Thus while focus is still
needed on lower income students, policymakers and educators should encourage middle
income students to complete FAFSA.
5 Conclusion
Since the creation of the Federal Pell Grant Program, federal need-based aid has become a
major portion of university tuition revenue (McPherson and Schapiro 1991). There is
considerable evidence that financial aid increases access to higher education, the quality of
22

match between the student and college, and the probability that a student persists to
graduation. However, little is known about the types of people who apply for federal
financial aid, the characteristics that influence this decision, and the amount of financial
aid that a student forgoes by not applying.
The results from this study show that parents’ or student’s own income reduces the
probability that a given student completes FAFSA. Many eligible, lower to middle income
students do not complete FAFSA and forgo significant amounts of financial aid. Also,
female and minority students are more likely to complete FAFSA. Whites, males,
independent students, residents and upperclassmen are less likely to apply for aid even
when they are eligible. These results are conditional on attending college and may not be
reflect the general population. Data including observations of people who chose not to
attend college may yield different results. The results in this study are helpful because
students who forgo financial aid may reduce the probability of persisting to graduation and
may have a higher student loan burden.
Finally, I use prosperity score matching to measure the amount of forgone financial
aid for non-applicants. I find that there is a large and statistically significant aid gap that
may have a substantial effect on education outcomes. Overall, the average financial aid gap
for all types of aid is $9,741.05. While this gap is declining in income, it is surprising that
even upper middle and high income students lose significant amounts of aid when they do
not complete FAFSA. The financial aid gap is also significant for Pell Grants, subsidized
student loans, unsubsidized student loans, and, in most cases, institutional aid. For Pell
Grants the financial aid gap is very large for poor students, but even students whose
families make around $40,000 lose $1,1730 in aid, while most students forgo large amounts
of subsidized student loans including very generous interest and repayment benefits. The
balance of unsubsidized loans increases with income. While unsubsidized loans do not
come with the same benefits as subsidized loans, students who do not complete FAFSA will
23

have to find other ways to pay their tuition including using credit cards or private loan
sources that have higher interest rates than unsubsidized loans. There is no clear pattern
with institutional aid, but the gap does trend upwards with regards to income. Not all
institutions require FAFSA completion to access aid, but the average student could forgo
$1,016 by not completing FAFSA.
These findings are significant because many studies show that financial aid is
important in school choice, enrollment, and persistence to graduation. The complexity of
the FAFSA or lack of knowledge of federal financial aid programs deprive students of
important resources that can help to succeed in college. Simplifying the FAFSA form and
promoting FAFSA completion may be effective policies to to boost the number of college
graduates.
24

6 Works Cited
Abadie, Alberto, and Guido W. Imbens. 2006. “Large Sample Properties of Matching
Estimators for Average Treatment Effects.” Econometrica 74, no. 1: 235-267.
Alon, Signal. 2007. “The Influence of Financial Aid in Leveling Group Differences in
Graduating from Elite Institutions.” Economics of Education Review 26, no. 3:
296-311.
—. 2011. “Who Benefits Most from Financial Aid? The Heterogeneous Effect of
Need-Based Grants on Students’ College Persistence.” Social Science Quarterly 40,
no. 6: 1494-1505.
Avery, Christopher, and Caroline M. Hoxby. 2004. “Do and Should Financial Aid Packages
Affect Students’ College Choices?” In College Choices: The Economics of Where to
Go, When to Go, and How to Pay for It. ed. Caroline M. Hoxby, 239-303. Chicago,
Illinois: The University of Chicago Press.
Avery, Christopher, and Thomas J. Kane. 2004. “Student Perceptions of College
Opportunities: The Boston COACH Program.” In College Choices: The Economics
of Where to Go, When to Go, and How to Pay for It. ed. Caroline M. Hoxby,
355-394. Chicago, Illinois: The University of Chicago Press.
Bell, Angela D., Heather T. Rowan-Kenyon, and Laura W. Perna. 2009. “College
Knowledge of 9th and 11th Grade Students: Variation by School and State
Context.” Journal of Higher Education 80, no. 6: 663-685.
Bettinger, Eric P. 2004. “How Financial Aid Affects Persistence.” In College Choices: The
Economics of Where to Go, When to Go, and How to Pay for It. ed. Caroline M.
Hoxby, 207-239. Chicago, Illinois: The University of Chicago Press.
Bettinger, Eric P., Bridget Terry Long, Philip Oreopoulos, and Lisa Sanbonmatsu. 2012.
“The Role of Application Assistance and Information in College Decisions: Results
25

from the H & R Block FAFSA Experiment.” The Quarterly Journal of Economics
127, no. 3: 1205-1242.
Booij, Adam S., Edwin Leuven, and Hessel Oosterbeek. 2012. “The Role of Information in
the Take-up of Student Loans.” Economics of Education Review 31, no. 1: 33-44.
Boschung, Milla D., Deanna L. Sharpe, and Mohamed Abdel-Ghany. 1998. “Racial,
Ethnic, and Gender Differences in Postsecondary Financial Aid Awards.”
Economics of Education Review 17, no. 2: 219-222.
Bruce, Donald J., and Celeste K. Carruthers. 2014. “Jackpot? The Impact of Lottery
Scholarships on Enrollment in Tennessee. Journal of Urban Economics, 81.
Bryson, Alex, Richard Dorsett, and Susan Purdon. 2002. “The Use of Propensity Score
Matching in the Evaluation of Active Labour Market Policies.” Department for
Work and Pensions Working Paper no 4.
Caliendo, Marco, and Sabine Kopeinig. 2008. “Some Practical Guidance for the
Implementation of Propensity Score Matching.” Journal of Economic Surveys 22,
no. 1: 31-72.
Cornwell, Christopher, David B. Mustard, and Deepa J. Sridhar. 2006. “The Enrollment
Effects of Merit-Based Financial Aid: Evidence from Georgia’s HOPE Program.”
Journal of Labor Economics 24, no. 4: 761-786.
Dee, Thomas S. 2004. “Are There Civic Returns to Education?” Journal of Public
Economics 88, no. 9-10: 1697-1720.
Deming, David, and Susan Dynarski. 2009. “Into College, Out of Poverty? Policies to
Increase the Postsecondary Attainment of the Poor.” National Bureau of Economic
Research Working Paper, no. 15387.
Dynarski, Susan. 2000. “Hope for Whom? Financial Aid for the Middle Class and Its
Impact on College Attendance.” National Tax Journal 53, no. 3: 629-661.
—. 2008. “Building the Stock of College-Educated Labor” Journal of Human Resources
26

43, no. 3: 576-610.
Dynarski, Susan, and Judith Scott-Clayton. 2006. “The Cost of Complexity in Federal
Student Aid: Lessons from Optimal Tax Theory and Behavioral Economics.”
National Tax Journal 59, no. 2: 319-356.
Eide, Eric R., and Mark H. Showalter. 2011. “Estimating the Relation Between Health
and Education: What Do We Know and What Do We Need to Know?” Economics
of Education Review 30, no. 5: 778-791.
Fenske, Robert H., John D. Porter, and Caryl P. DuBrock. 2000. “Tracking Financial Aid
and Persistence of Women, Minority, and Needy Students in Science, Engineering,
and Mathematics.” Research in Higher Education 41, no. 1: 67-94.
Fuller, Winship C., Charles F. Manski, and David A. Wise. 1982. “New Evidence on the
Economic Determinants of Postsecondary Schooling Choices.” The Journal of
Human Resources 17, no. 4: 477-498.
Heckman, James J., Hidehiko Ichimura, and Petra E. Todd. 1997. “Matching as an
Econometric Evaluation Estimator: Evidence from Evaluating a Training
Programme.” The Review of Economic Studies 64, no. 4: 605-654.
—. 1998. “Matching as an Econometric Evaluation Estimator.” The Review of Economic
Studies 65, no. 2: 261-294.
Imbens, Guido W. 2004. “Nonparametric Estimation of Average Treatment Effects under
Exogeneity: A Review.” The Review of Economics and Statistics 86, no. 1: 4-29.
Kim, Dongbin. 2004. “The Effect of Financial Aid on Students’ College Choice:
Differences by Racial Groups” Research in Higher Education 45, no. 1: 43-70.
King, Jacqueline E. 2004 “Missed Opportunities: Students who do not Apply for Financial
Aid.” American Council on Education Issue Brief.
Leslie, Larry L., and Paul T. Brinkman. 1987. “Student Price Response in Higher
27

Education.” Journal of Higher Education 58, no. 2: 181-204.
Lovenheim, Michael F., and Emily G. Owens. 2014. “Does Federal Financial Aid Affect
College Enrollment?: Evidence from Drug Offenders and the Higher Education Act
of 1998.” Journal of Urban Economics, 81.
McKinney, Lyle, and Heather Novak. 2013. “The Relationship Between FAFSA Filing and
Persistence Among First-Year Community College Students.” Community College
Review 41, no. 1: 63-85.
McPherson, Michael S., and Morton Owen Schapiro. 1991. “Does Student Aid Affect
College Enrollment? New Evidence on a Persistent Controversy.” The American
Economic Review 81, no. 1: 309-318.
Novak, Heather, and Lyle McKinney. 2011. “The Consequences of Leaving Money on the
Table: Examining Persistence among Students Who Do Not File a FAFSA.”
Journal of Student Financial Aid 41, no. 3: 5- 23.
Roy, A. D.. 1951. “Some Thoughts on the Distribution of Earnings” Oxford Economic
Papers 3, no. 2: 135-146.
Rudin, Donald B. 1974. “Estimating Causal Effects of Treatments in Randomized and
Nonrandomized Studies.” Journal of Educational Psychology 66, no. 5: 688-701.
Scott-Clayton, Judith. 2012. “Information Barriers and Financial Aid Policy.” National
Bureau of Economic Research Working Paper, no. 17811.
Singell, Larry D. 2004. “Come and Stay Awhile: Does Financial Aid Effect Retention
Conditioned on Enrollment at a Large Public University.” Economics of Education
Review 23, no. 5: 459-471.
Smith, Jeffery A., and Petra E. Todd. 2005. “Does Matching Overcome LaLondes Critique
of Nonexperimental Estimators?” Journal of Econometrics 125, no. 1-2: 305-353.
St. John, Edward P., and Jay Noell. 1989. “The Effects of Student Financial Aid on
Access to Higher Education: An Analysis of Progress with Special Consideration of
28

Minority Enrollment.” Research in Higher Education 30, no. 6: 563-581.
van der Klaauw, Wilbert. 2002. “Estimating the Effect of Financial Aid Offers on College
Enrollment: A Regression-Discontinuity Approach.” International Economic Review
43, no. 3: 1249-1287.
29

A Construction of Expected Family Contribution
For a student to be eligible for federal, need based financial aid, she must first complete the
Free Application for Federal Student Aid (FAFSA). The government uses the information
gathered from the FAFSA to calculate the Expected Family Contribution (EFC) that
measures how much she or her family could potentially contribute to her education.
Colleges and universities use the EFC to determine student need which is the difference
between cost of attendance and the EFC.
This section will describe in detail how the government calculates the EFC
including the formula and the variables that the government uses. Also, this section will
explain rules that the Department of Education proscribes to individual colleges and
universities who calculate the cost of attendance for their college.
The EFC is a summation of two types of financial assets: income and savings. The
Department of Education requires colleges to take into account income when calculating
the EFC for all applicants. For a student’s savings and assets to be exempted from
inclusion in the EFC, the student (or her parents) must either have an adjusted gross
income (AGI) less than $50,000, not be required to file an IRS Form 1040, be a dislocated
worker, or received a means-tested federal benefit.
To calculate the income component of EFC, the student must report her and her
parents’ (if dependent) AGI from the previous year tax form. The federal government then
allows the following to be deducted from the reported AGI: federal taxes paid, state taxes
paid, Social Security allowance for both parents, and the income protection allowance. The
income protection allowance is a function of total family members and the number of
college students in the household. The difference between AGI and the exceptions equals
the portion of income that counts towards the EFC. If the student is a dependent, then
this process is used for both student and parent income and the sum of the two equals the
30
portion of the EFC from income. If the student is an independent then the parents’
contribution is considered to be zero.
If a student does not qualify for the simplified EFC formula (income only), then the
government adjusts the EFC for student’s and family’s savings and net worth. The federal
government considers the student’s and family’s cash savings (including college savings),
investments (not including 401k or pension funds, annuities, non-education IRA, or the
value of a home), and net worth of a family own business or investment farm. This sum
equals the student’s and family’s net worth. Finally, the government allows an adjustment
for education savings and asset protection. This allowance depends on the age of the oldest
parent and is increasing with age. Subtracting the asset protection allowance from the
family’s net worth yields the family’s discretionary net worth. Students are not allowed to
adjust their net worth for asset protection.
Finally, to calculate the student’s and family’s contribution from assets, the
government multiplies the student’s net worth by .20 and the family’s discretionary net
worth by .12. To calculate the final EFC, the government sums the contributions from
income and the contributions from assets.
31

Table 1: Summary Statistics for Overall Sample
Variable Observations Mean Std. Dev. Min MaxFinancial Aid
Completed FAFSA 83,600 0.672 0.470 0 1Total Aid 83,600 8,140 8,690 0 58,540Pell Grant 83,600 760 1,380 0 4,620Sub. Student Loans 83,600 1,600 2,250 0 10,830
Personal CharacteristicsEFC 83,600 10,640 13,690 0 127,210Income 83,600 60,260 54,090 0 611,640GPA 83,060 3.01 67.86 0 4.00
Dependent 83,600 0.652 0.476 0 1Female 83,600 0.569 0.495 0 1Asian 83,600 0.053 0.223 0 1Black 83,600 0.109 0.311 0 1Hispanic 83,600 0.082 0.274 0 1Age 83,600 23.73 6.90 15 65Father’s Education 83,600 12.68 5.18 0 20Resident 83,600 0.834 0.372 0 1
Freshman 83,600 0.196 0.400 0 1Sophomore 83,600 0.150 0.359 0 1Junior 83.600 0.152 0.358 0 1Senior 83,600 0.436 0.496 0 1Fifth Year 83,600 0.048 0.214 0 1Other Class 83,600 0.019 0.138 0 1
Institutional CharacteristicsTuition 72,380 7,490 7,510 100 45,110Enrollment (000) 83,370 14,580 12,150 120 54,090Public 83,600 0.716 0.451 0 1
Note: All summary statistics are rounded to the nearest ten to comply with NPSASrestricted-use license agreement.
32

Table 2: Summary Statistics of Key Variables by Eligibility and FAFSACompletion-Total Sample
(1) (2) (3) (4)VARIABLES E, A E, NA NE, A NE, NA
Financial AidTotal Aid 11,820 2,300 8,690 1,210
(8,720) (4,880) (6,710) (2,900)Pell Grant 1,290 0 0 0
(1,590) (0) (0) (0)Sub. Student Loans 2,720 0 0 0
(2,360) (0) (0) (0)Individual Characteristics
EFC 5,410 10,640 29,980 23,360(7,450) (10,060) (18,740) (16,590)
Income 43,290 56,720 120,150 102,730(38,770) (45,920) (65,300) (64,910)
GPA 2.99 3.06 3.01 3.02(67.46) (65.75) (67.17) (72.49)
Dependent 0.646 0.589 0.896 0.619(0.478) (0.492) (0.306) (0.486)
Female 0.586 0.540 0.564 0.541(0.493) (0.498) (0.500) (0.498)
Asian 0.053 0.065 0.033 0.047(0.223) (0.246) (0.180) (0.211)
Black 0.142 0.061 0.066 0.057(0.350) (0.239) (0.247) (0.233)
Hispanic 0.097 0.063 0.050 0.060(0.297) (0.243) (0.218) (0.237)
Age 23.25 24.54 21.47 26.05(6.13) (7.53) (5.18) (8.99)
Institutional CharacteristicsTuition 8,390 7,810 7,170 3,970
(7,700) (8,220) (6,800) (4,860)Observations 49,240 16,180 6,930 11,250% of Observations 58.90 19.35 8.29 13.46
Note: E represents eligible students, while NE represents non-eligible stu-dents. A represents applicants, while NA represents non-applicants. Otherdemographic and institutional characteristics such as father’s education, resi-dent, class, enrollment and institutional control were not significantly differentacross categories. All summary statistics are rounded to the nearest ten tocomply with NPSAS restricted-use license agreement.
33

Table 3: Summary Statistics of Key Variables by Eli-gibility and FAFSA Completion-Only Pell-Eligible Stu-dents
(1) (2)VARIABLES E, A E, NA
Financial AidTotal Aid 12,080 1,780
(8,460) (4,190)Pell Grant 2,200 0
(1,520) (0)Subsidized Student Loans 2,960 0
(2,360) (0)Individual Characteristics
EFC 1,080 1,180(1,260) (1,360)
Income 21,970 21,920(18,180) (20,130)
GPA 2.96 2.97(0.693) (0.693)
Dependent 0.525 0.356(0.499) (0.479)
Female 0.589 0.511(0.492) (0.500)
Asian 0.063 0.078(0.243) (0.268)
Black 0.184 0.091(0.388) (0.287)
Hispanic 0.123 0.084(0.328) (0.279)
Age 24.02 25.40(6.46) (7.59)
Institutional CharacteristicsTuition 7,050 4,800
(6,720) (5,580)Observations 28,950 5,310
Note: E represents eligible students, while NE rep-resents non-eligible students. A represents applicants,while NA represents non-applicants. Other demographicand institutional characteristics such as father’s educa-tion, resident, class, enrollment and institutional controlwere not significantly different across categories. Allsummary statistics are rounded to the nearest ten tocomply with NPSAS restricted-use license agreement.
34

Figure 1: Percent of Independent/Dependent Students who Completed FAFSA by Par-ents’/Own Income (2008 dollars)
0%
10%
20%
30%
40%
50%
60%
70%
80%
90%
100%
0 10000 20000 30000 40000 50000 60000 70000 80000 90000 100000 110000 120000 130000 140000 >150000
% C
om
ple
ted
FA
FS
A
Income (2008 Dollars)
Dependent Independent
Note: Data drawn from the 1999-2000, 2003-2004, and 2007-2008 waves of the NPSAS.Income expressed in 2008 dollars.
35

Figure 2: Percent Completed FAFSA by Financial Need or (Tuition-EFC)
0%
10%
20%
30%
40%
50%
60%
70%
80%
90%
100%
-70000 -60000 -50000 -40000 -30000 -20000 -10000 0 10000 20000 30000 40000 50000 60000
% C
om
ple
ted
FA
FS
A
Financial Need (Cost of Attendance-EFC)
Dependent Independent Perfect Information
Note: Data drawn from the 1999-2000, 2003-2004, and 2007-2008 waves of the NPSAS.Income expressed in 2008 dollars.
36

Figure 3: Percent of Students who Completed FAFSA by GPA (by quantile)
0%
10%
20%
30%
40%
50%
60%
70%
80%
0% 10% 20% 30% 40% 50% 60% 70% 80% 90%
% C
om
ple
ted
FA
FS
A
GPA by Percentile
Dependent Independent
Note: Data drawn from the 1999-2000, 2003-2004, and 2007-2008 waves of the NPSAS.
37

Table 4: Probit Model Estimating FAFSA Completion (Marginal Effects)
(1) (2) (3) (4)VARIABLES Probit Probit Probit ProbitTuition ($000) 0.00997*** 0.00843*** 0.00997*** 0.00964***
(3.436e-4) (5.071e-4) (3.680e-4) (5.469e-4)EFC ($000) -0.00340*** -0.00789*** -0.00333*** -0.00697***
(1.951e-4) (0.00188) (1.946e-4) (0.00187)Income ($000) -0.00329*** -8.798e-4*** -0.00326*** -9.19e-4***
(8.450e-5) (2.102e-4) (8.440e-5) (2.103e-4)Income2 ($000) 7.83e-09*** 7.53e-10 7.72e-09*** 1.04e-09
(2.21e-10) (1.37e-09) (2.21e-10) (1.38e-09)GPA 0.0685*** 0.00678 0.0666*** 0.00638
(0.0122) (0.0146) (0.0121) (0.0146)GPA2 -1.05e-06*** 3.87e-08 -1.02e-06*** 2.68e-08
(2.20e-07) (8.53e-07) (2.20e-07) (2.69e-07)Dependent 0.107*** 0.0821*** 0.101*** 0.0816***
(0.00523) (0.00570) (0.00524) (0.00572)Female 0.0281*** 0.0232*** 0.0277*** 0.0256***
(0.00324) (0.00412) (0.00320) (0.00411)Asian -0.0293*** - 0.00494 -0.0257*** -0.00149
(0.00717) (0.00825) (0.00730) (0.00844)Black 0.127*** 0.0930*** 0.132*** 0.100***
(0.00592) (0.00646) (0.00603) (0.00666)Hispanic 0.0577*** 0.0595*** 0.0712*** 0.0650***
(0.00625) (0.00702) (0.00649) (0.00751)Age -0.00541*** -1.329e-4 -0.00539*** 1.313e-4
(3.253e-4) (3.736e-4) (3.258e-4) (3.754e-4)State FE NO NO YES YESYear FE YES YES YES YESOnly Pell Eligible NO YES NO YES
Observations 71,700 29,600 71,660 29,590
Standard errors in parentheses*** p < 0.01, ** p < 0.05, * p < 0.1
Note: Demographic controls include father’s education, resident, class, enroll-ment and institutional control.
38

Figure 4: Financial Need for Students who Did Not Complete FAFSA
39

Table 5: Multinomial Logit Results for Eligible Non-applicant Students
(1) (2) (3)VARIABLES E, NA NE, A NE, NA
Tuition ($000) 0.0221*** -0.00659*** -0.0240***(3.345e-4) (2.650e-4) (3.299e-4)
EFC ($000) -0.0235*** 0.00888 0.0139***(3.024e-4) (1.160e-4) (1.426e-4)
Income ($000) 0.00137*** -0.0005285*** -1.267e-4**(1.251e-4) (5.07e-5) (6.140-5)
Income2 -9.53e-09*** 8.68e-10*** 1.20e-09***(6.82e-10) (1.34e-10) (1.88e-10)
GPA -0.01581*** 0.01052*** -0.03168***(1.048e-4) (0.00651) (0.00673)
GPA2 2.90e-07 -1.12e-07 3.96e-07***(1.89e-7) (-1.19e-7) (1.24e-7)
Dependent -0.0522*** 0.0523*** -0.0579***(0.00442) (0.00401) (0.00392)
Female -0.0180*** -0.00735*** -0.00863***(0.00268) (0.00179) (0.00198)
Asian 0.0141** -0.0111** 0.0128**(0.00572) (0.00482) (0.00502)
Black -0.0916*** 0.0258*** -0.0260***(0.00534) (0.00372) (0.00415)
Hispanic -0.0543*** 0.00114 -0.00382(0.00558) (.00402) (0.004268)
Age 0.001534*** -0.00111*** 0.00207***(2.727e-4) (2.428e-4) (0.00221)
Observations 71,660 71,660 71,660
Standard errors in parentheses*** p < 0.01, ** p < 0.05, * p < 0.1
Note: E represents eligible students, while NE represents non-eligible students. A represents applicants, while NA representsnon-applicants. Demographic controls include father’s educa-tion, resident, class, enrollment, and institutional control.
40

Figure 5: Overlap or area of common support for propensity scores for students who did ordid not complete FAFSA
0.5
11.
52
2.5
Den
sity
0 .2 .4 .6 .8 1Propensity Score
P-Score w/ FAFSA P-Score w/o FAFSA
Note: This figure shows the distribution of propensity scores associated with completingFAFSA. Propensity score matching requires that a signification amount of the two distribu-tions overlap so that there is enough data to construct a counterfactual.
41

Tab
le6:
Tot
alA
idG
apby
Inco
me
Fu
llS
amp
leP
ell-
Eli
gib
le(1
)(2
)(3
)(4
)(5
)(6
)(7
)(8
)In
com
eP
ool
ed20
07-2
008
2003
-200
419
99-2
000
Pool
ed20
07-2
008
2003
-200
419
99-2
000
Ove
rall
9,74
1.05
9,31
2.67
10,3
58.3
98,
275.
3911
,780
.59
11,2
12,0
111
,143
.31
12,5
00.6
1(1
00.6
2)(1
26.7
4)(1
73.8
9)(1
55.8
4)(1
09.5
8)(1
96.8
7)(2
76.0
8)(1
70.3
6)<
10,0
0010
,610
.37
11,6
39.7
510
,729
.69
13,2
44.5
412
,414
.80
11,6
81.1
210
,724
.54
13,2
46.8
3(2
26.9
1)(3
01.8
5)(5
96.4
2)(2
85.9
5)(1
81.9
4)(3
13.0
4)(6
12.8
3)(2
94.4
3)10
,000
to20
,000
9,93
9.78
10,6
14.5
010
,467
.30
11,5
29.1
711
,410
.56
10,8
68.7
810
,867
.22
11,7
95.1
2(2
49.7
4)(3
22.2
9)(6
57.3
3)(2
76.0
1)(2
12.1
8)(3
49.7
9)(7
14.4
0)(3
35.5
5)20
,000
to30
,000
10,1
11.2
68,
646.
1411
,215
.34
10,4
50.2
711
,560
.51
10,2
31.1
012
,031
.89
12,0
00.8
2(2
62.4
9)(5
22.3
6)(6
84.6
3)(4
12.5
5)(3
37.7
2)(7
93.9
4)(1
,003
.31)
(595
.35)
30,0
00to
40,0
0010
,545
.58
9,44
0.36
10,5
24.4
010
,981
.73
12,0
96.5
310
,966
.81
11,7
03.0
013
,282
.05
(223
.12)
(487
.84)
(709
.58)
(324
.61)
(362
.36)
(827
.11)
(908
.81)
(640
.08)
40,0
00to
50,0
0010
,253
.71
9,71
9.38
9,99
3.10
10,0
39.1
611
,252
.38
10,3
41.0
610
,023
.97
11,7
93.3
4(2
45.7
0)(4
38.5
3)(5
70.0
0)(4
01.2
9)(4
35.7
2)(9
13.9
0)(8
43.9
2)(1
,016
.71)
50,0
00to
60,0
009,
610.
008,
927.
489,
464.
939,
778.
4412
,789
.67
12,3
94.1
614
,594
.57
13,0
71.9
0(2
53.4
5)(4
46.5
7)(5
50.7
8)(4
15.9
0)(7
13.7
0)(2
,156
.69)
(1,4
35.1
4)(2
,474
.84)
60,0
00to
70,0
009,
670.
087,
542.
909,
996.
289,
838.
74(2
77.0
8)(5
70.6
2)(6
40.9
8)(4
18.0
0)70
,000
to80
,000
9,04
8.08
7,58
3.63
10,4
38.4
59,
914.
46(2
58.8
9)(4
72.2
4)(5
56.2
8)(4
36.7
5)80
,000
to90
,000
)9,
063.
489,
035.
629,
005.
927,
764.
89(3
00.1
9)(4
78.6
8)(6
51.9
1)(5
83.8
9)90
,000
to10
0,00
09,
115.
308,
181.
237,
810.
649,
731.
38(3
18.6
9)(4
35.7
7)(7
89.8
0)(6
05.9
2)>
100,
000
9,15
0.22
8,07
9.11
9,28
7.27
9,85
2.85
(143
.95)
(235
.89)
(285
.23)
(257
.76)
Not
e:C
ontr
ols
incl
ude
tuit
ion,
EF
C,
inco
me,
GP
A,
dep
enden
t,ge
nder
,ra
ce,
age
fath
er’s
educa
tion
,re
siden
t,cl
ass,
dis
tance
,en
rollm
ent
and
inst
ituti
onal
contr
ol.
Sta
ndar
der
rors
inpar
enth
eses
.A
lles
tim
ates
are
stat
isti
cally
sign
ifica
nt
at99
%le
vel.
All
valu
esex
pre
ssed
in20
08dol
lars
.P
ell-
Eligi
ble
capp
edat
$60,
000
bec
ause
ofla
ckof
obse
rvat
ions.
42

Figure 6: Total Aid Gap by Income
0.00
2,000.00
4,000.00
6,000.00
8,000.00
10,000.00
12,000.00
14,000.00
10000 20000 30000 40000 50000 60000 70000 80000 90000 100000 >100000
Tota
l A
id G
ap
(2008 d
oll
ars
)
Income (2008 dollars)
Pooled
2007-2008
2003-2004
1999-2000
Note: I use kernel matching with a bandwidth of 0.06 to construct the total aid gap. Totalaid includes all forms of assistance to the student including grants, loans, and work-study.Income and aid amounts are expressed in 2008 dollars.
43

Tab
le7:
Pel
lG
rant
Gap
by
Inco
me
Full
Sam
ple
Pel
l-E
ligi
ble
(1)
(2)
(3)
(4)
(5)
(6)
(7)
(8)
Inco
me
Pool
ed20
07-2
008
2003
-200
419
99-2
000
Pool
ed20
07-2
008
2003
-200
419
99-2
000
Ove
rall
1,28
1.36
1,40
3.04
1,08
1.03
920.
182,
721.
282,
662.
972,
834.
942,
719.
55(1
0.54
)(1
3.34
)(1
7.02
)(1
1.67
)(1
0.46
)(1
5.15
)(2
2.69
)(1
8.19
)<
1000
03,
313.
983,
287.
403,
517.
233,
273.
183,
684.
903,
326.
753,
558.
443,
347.
80(1
8.66
)(2
5.34
)(4
7.79
)(3
2.16
)(3
6.62
)(2
4.80
)(4
7.01
)(3
1.55
)10
000
to20
000
2,53
8.30
2,62
6.76
3,03
3.91
2,22
2.60
2,83
2.49
2,82
1.84
3,24
1.44
2,64
1.46
(23.
28)
(32.
87)
(56.
51)
(38.
99)
(22.
86)
(31.
81)
(53.
98)
(40.
12)
20,0
00to
30,0
002,
303.
812,
120.
652,
676.
022,
272.
302,
978.
402,
685.
043,
310.
103,
059.
85(2
4.96
)(3
5.74
)(5
6.38
)(4
2.46
)(2
3.83
)(3
3.44
)(5
1.12
)(4
2.35
)30
,000
to40
,000
1,73
1.79
1,54
9.80
2,11
4.40
1,65
6.06
2,38
8.55
2,09
0.85
2,71
0.34
2,49
3.54
(23.
01)
(33.
75)
(50.
62)
(38.
53)
(23.
26)
(34.
61)
(48.
99)
(43.
41)
40,0
00to
50,0
0097
7.66
895.
121,
186.
7890
8.01
1,65
9.41
1,50
3.61
1,80
9.08
1,69
6.70
(19.
96)
(30.
47)
(43.
48)
(32.
96)
(25.
52)
(40.
28)
(52.
70)
(48.
33)
50,0
00to
60,0
0044
7.72
464.
5054
2.07
375.
851,
357.
631,
327.
171,
532.
851,
346.
76(1
5.40
)(2
6.01
)(3
3.19
)(2
3.42
)(3
3.84
)(5
5.49
)(7
0.27
)(6
9.81
)60
,000
to70
,000
159.
6513
5.14
219.
6213
6.91
(10.
21)
(16.
25)
(21.
74)
(16.
02)
70,0
00to
80,0
0063
.04
91.4
853
.21
50.1
1(7
.33)
(17.
85)
(10.
77)
(9.7
1)80
,000
to90
,000
43.1
746
.53
25.6
852
.71
(7.4
0)(1
3.57
)(9
.11)
(13.
86)
90,0
00to
100,
000
9.88
26.1
41.
400.
00(3
.80)
(10.
44)
(0.9
9)0.
00>
1000
006.
2320
.78
0.00
0.00
(1.5
5)(5
.16)
0.00
0.00
Not
e:C
ontr
ols
incl
ude
tuit
ion,
EF
C,
inco
me,
GP
A,
dep
enden
t,ge
nder
,ra
ce,
age
fath
er’s
educa
tion
,re
siden
t,cl
ass,
dis
tance
,en
rollm
ent
and
inst
ituti
onal
contr
ol.
Sta
ndar
der
rors
inpar
enth
eses
.A
lles
tim
ates
are
stat
isti
cally
sign
ifica
nt
at99
%le
vel.
All
valu
esex
pre
ssed
in20
08dol
lars
.P
ell-
Eligi
ble
capp
edat
$60,
000
bec
ause
ofla
ckof
obse
rvat
ions.
44

Figure 7: Pell Grant Gap by Income
0.00
500.00
1,000.00
1,500.00
2,000.00
2,500.00
3,000.00
3,500.00
4,000.00
10,000 20,000 30,000 40,000 50,000 60,000 70,000 80,000 90,000 100,000 >100000
Pel
l G
ran
t G
ap
(2008 d
oll
ars
)
Income (2008 dollars)
Pooled
2007-2008
2003-2004
1999-2000
Note: I use kernel matching with a bandwidth of 0.06 to construct the Pell grant gap.The federal government requires students to complete FAFSA to determine financial need.Students to not need to repay Pell Grants. Income and aid amounts are expressed in 2008dollars.
45

Tab
le8:
Subsi
diz
edStu
den
tL
oan
Gap
by
Inco
me
Full
Sam
ple
Pel
l-E
ligi
ble
(1)
(2)
(3)
(4)
(5)
(6)
(7)
(8)
Inco
me
Pool
ed20
07-2
008
2003
-200
419
99-2
000
Pool
ed20
07-2
008
2003
-200
419
99-2
000
Ove
rall
2,87
5.32
2,62
8.71
2,29
2.40
3,48
9.01
3,52
1.36
3,15
7.28
3,01
8.17
4,18
6.69
(13.
27)
(18.
60)
(22.
53)
(25.
03)
(19.
07)
(25.
20)
(35.
98)
(36.
02)
<10
,000
3,17
6.09
3096
.74
3,12
4.82
3,31
4.49
3,68
4.90
3,18
9.74
3,03
6.37
4,42
3.80
(39.
66)
(48.
73)
(117
.01)
(86.
27)
(36.
62)
(45.
44)
(81.
35)
(66.
87)
10,0
00to
20,0
003,
085.
532,
944.
493,
009.
913,
451.
873,
024.
662,
790.
854,
207.
13(4
2.02
)(5
2.17
)(1
23.1
3)(9
1.39
)(4
0.26
)(5
0.62
)(8
6.90
)(7
5.71
)20
,000
to30
,000
3,09
6.93
3,02
7.12
3,02
5.63
3,22
4.82
3,30
4.49
3,01
3.50
2,91
6.27
3,79
5.09
(42.
92)
(57.
01)
(98.
43)
(93.
90)
(45.
09)
(62.
33)
(86.
63)
(86.
19)
30,0
00to
40,0
003,
215.
373,
198.
133,
029.
233,
291.
463,
473.
013,
159.
302,
917.
423,
992.
92(4
5.71
)(6
3.76
)(9
8.33
)(9
5.65
)(5
0.36
)(7
1.96
)(9
3.93
)(1
04.8
5)40
,000
to50
,000
3,29
6.93
3,26
8.52
3,18
7.41
3,39
1.95
3,62
3.17
3,46
0.92
3,04
3.22
4,20
9.95
(48.
64)
(70.
66)
(98.
06)
(101
.60)
(61.
54)
(92.
66)
(106
.43)
(130
.11)
50,0
00to
60,0
003,
146.
563,
077.
313,
083.
503,
310.
343,
555.
253,
443.
343,
324.
943,
986.
82(5
1.30
)(7
7.12
)(9
7.94
)(1
00.1
3)(8
7.34
)(1
40.3
1)(1
66.5
4)(1
87.2
1)60
,000
to70
,000
2,88
8.37
2,75
9.88
2,62
4.33
3,37
1.92
(50.
84)
(78.
86)
(93.
85)
(96.
03)
70,0
00to
80,0
002,
494.
642,
371.
672,
296.
922,
807.
79(5
1.36
)(8
1.56
)(9
0.05
)(9
9.11
)80
,000
to90
,000
2,25
5.38
1,92
8.25
2,03
6.87
2,74
9.45
(54.
25)
(78.
65)
(102
.42)
(109
.19)
90,0
00to
100,
000
1,87
2.01
1,52
9.33
1,50
0.89
2,60
5.94
(53.
21)
(79.
4)(9
0.31
)(1
05.4
3)>
100,
000
1,12
5.01
914.
2890
1.61
1,44
7.84
(22.
37)
(35.
93)
(36.
94)
(39.
79)
Not
e:C
ontr
ols
incl
ude
tuit
ion,
EF
C,
inco
me,
GP
A,
dep
enden
t,ge
nder
,ra
ce,
age
fath
er’s
educa
tion
,re
siden
t,cl
ass,
dis
tance
,en
rollm
ent
and
inst
ituti
onal
contr
ol.
Sta
ndar
der
rors
inpar
enth
eses
.A
lles
tim
ates
are
stat
isti
cally
sign
ifica
nt
at99
%le
vel.
All
valu
esex
pre
ssed
in20
08dol
lars
.P
ell-
Eligi
ble
capp
edat
$60,
000
bec
ause
ofla
ckof
obse
rvat
ions.
46

Figure 8: Subsidized Loan Gap by Income
0
500
1000
1500
2000
2500
3000
3500
10,000 20,000 30,000 40,000 50,000 60,000 70,000 80,000 90,000 100,000 >100,000
Su
bsi
diz
ed S
tud
ent
Lo
an
Ga
p (
20
08 d
oll
ars
)
Income (2008 dollars)
Pooled
2007-2008
2003-2004
1999-2000
Note: I use kernel matching with a bandwidth of 0.06 to construct the subsidized student loangap. The federal government requires students to complete FAFSA to determine financialneed. The government does not charge interest and students do not need to repay the loanuntil they graduate. Income and aid amounts are expressed in 2008 dollars.
47

Tab
le9:
Unsu
bsi
diz
edStu
den
tL
oan
Gap
by
Inco
me
Full
Sam
ple
Pel
l-E
ligi
ble
(1)
(2)
(3)
(4)
(5)
(6)
(7)
(8)
Inco
me
Pool
ed20
07-2
008
2003
-200
419
99-2
000
Pool
ed20
07-2
008
2003
-200
419
99-2
000
Ove
rall
1,98
6.65
2,80
1.15
1,26
4.28
1.67
1.18
1,33
2.45
1,51
4.41
951.
651,
180.
06(2
3.63
)(6
9.63
)(1
8.94
)(1
9.47
)(3
8.90
)(1
15.4
7)(2
6.05
)(2
3.36
)<
1000
01,
610.
021,
626.
561,
340.
581,
489.
591,
577.
281,
533.
821,
338.
681,
468.
64(7
1.01
)(2
09.0
9)(6
6.25
)(4
5.49
)(7
3.16
)(2
18.8
4)(6
6.61
)(4
5.70
)10
000
to20
000
1,59
1.14
1,74
9.98
1,15
5.51
1,56
0.55
1,48
8.72
1,68
7.34
1,06
5.28
1,37
0.82
(58.
00)
(184
.06)
(65.
34)
(50.
22)
(68.
47)
(207
.52)
(65.
68)
(52.
32)
20,0
00to
30,0
001,
440.
161,
906.
961,
094.
751,
224.
821,
177.
291,
633.
5379
9.19
906.
45(8
4.64
)(3
00.7
1)(6
2.33
)(4
9.65
)(1
21.8
2)(4
43.1
5)(5
8.63
)(5
0.63
)30
,000
to40
,000
1,34
6.02
1,74
9.81
919.
931,
245.
7797
3.36
615.
8072
0.03
872.
34(6
9.97
)(2
59.6
7)(5
7.42
)(5
8.94
)(1
30.0
1)(4
46.0
7)(5
6.94
)(6
4.65
)40
,000
to50
,000
1,60
2.66
2,63
4.69
838.
521,
201.
491,
386.
642,
485.
8469
4.20
909.
01(7
5.43
)(2
40.4
3)(6
1.86
)(6
1.50
)(1
09.3
8)(3
84.3
0)(6
6.45
)(7
4.10
)50
,000
to60
,000
1,52
9.10
2,31
6.46
860.
091,
375.
261,
103.
991,
116.
5764
9.73
754.
95(8
6.56
)(2
90.1
5)(6
7.83
)(7
1.22
)(2
88.2
3)(1
,494
.03)
(104
.68)
(104
.01)
60,0
00to
70,0
001,
930.
073,
734.
2383
9.75
1,32
8.19
(98.
31)
(347
.11)
(61.
62)
(68.
41)
70,0
00to
80,0
002,
081.
944,
110.
791,
109.
561,
795.
66(1
03.6
0)(1
09.1
2)(6
8.92
)(9
6.90
)80
,000
to90
,000
2,75
7.62
4,27
1.83
1,36
3.02
2,16
1.62
(120
.37)
(129
.42)
(83.
29)
(93.
72)
90,0
00to
100,
000
3,35
8.21
4,57
0.67
1,58
4.03
2,41
5.68
(127
.79)
(131
.20)
(88.
94)
(114
.71)
>10
0,00
03,
303.
613,
749.
631,
753.
532,
689.
51(6
0.64
)(5
9.55
)(4
1.09
)(5
6.54
)
Not
e:C
ontr
ols
incl
ude
tuit
ion,
EF
C,
inco
me,
GP
A,
dep
enden
t,ge
nder
,ra
ce,
age
fath
er’s
educa
tion
,re
siden
t,cl
ass,
dis
tance
,en
rollm
ent
and
inst
ituti
onal
contr
ol.
Sta
ndar
der
rors
inpar
enth
eses
.A
lles
tim
ates
are
stat
isti
cally
sign
ifica
nt
at99
%le
vel.
All
valu
esex
pre
ssed
in20
08dol
lars
.P
ell-
Eligi
ble
capp
edat
$60,
000
bec
ause
ofla
ckof
obse
rvat
ions.
48

Figure 9: Unsubsidized Loan Gap by Income
0.00
500.00
1,000.00
1,500.00
2,000.00
2,500.00
3,000.00
3,500.00
4,000.00
4,500.00
5,000.00
10,000 20,000 30,000 40,000 50,000 60,000 70,000 80,000 90,000 100,000 >100000
Un
sub
did
ized
Lo
an
Ga
p (
20
08 d
oll
ars
)
Income (2008 dollars)
Pooled
2007-2008
2003-2004
1999-2000
Note: I use kernel matching with a bandwidth of 0.06 to construct the unsubsidized studentloan gap . The federal government requires students to complete FAFSA to access unsubsi-dized loans, but demonstrated financial need is not required. The government does chargeinterest while students are in school, but students can defer loan payments until graduation.Income and aid amounts are expressed in 2008 dollars.
49

Tab
le10
:In
stit
uti
onal
Aid
Gap
by
Inco
me
Full
Sam
ple
Pel
l-E
ligi
ble
(1)
(2)
(3)
(4)
(5)
(6)
(7)
(8)
Inco
me
Pool
ed20
07-2
008
2003
-200
419
99-2
000
Pool
ed20
07-2
008
2003
-200
419
99-2
000
Ove
rall
1,01
6.04
***
551.
29**
*1,
827.
67**
*1,
420.
21**
*1,
154.
23**
*1,
221.
40**
*1,
394.
38**
*87
7.55
***
(38.
72)
(66.
43)
(102
.34)
(51.
98)
(63.
78)
(100
.57)
(201
.90)
(91.
20)
<10
000
762.
35**
*97
1.38
***
580.
3738
9.65
**76
1.19
***
1,06
4.98
***
493.
4231
9.73
*(9
9.03
)(1
31.9
1)(3
71.9
1)(1
66.4
4)(1
01.1
0)(1
33.7
7)(3
73.6
6)(1
73.2
3)10
000
to20
000
725.
77**
*81
9.92
***
1,03
3.87
***
300.
68**
894.
53**
*83
0.73
***
1,38
9.70
***
435.
78**
*(1
05.3
9)(1
78.0
3)(3
71.9
3)(1
35.9
8)(1
24.4
2)(1
96.2
1)(4
38.4
8)(1
86.2
7)20
,000
to30
,000
471.
92**
*-3
37.4
61,
355.
68**
327.
531,
106.
19**
*46
0.54
1,81
8.42
**81
6.78
***
(142
.70)
(310
.21)
(610
.65)
(176
.55)
(201
.88)
(470
.09)
(944
.74)
(250
.76)
30,0
00to
40,0
001,
100.
08**
*63
2.40
**1,
244.
29**
851.
16**
*1,
836.
84**
*2,
304.
89**
*1,
871.
48**
*1,
884.
96**
*(1
28.9
8)(2
91.9
5)(5
57.1
3)(1
57.0
2)(2
09.6
8)(4
61.8
3)(7
17.6
2)(2
24.9
6)40
,000
to50
,000
1,03
7.23
***
835.
28**
*1,
300.
13**
*28
5.40
1,41
0.24
***
2,08
5.17
***
893.
881,
129.
03(1
50.6
2)(2
68.8
9)(4
11.2
7)(2
28.4
8)(2
85.3
4)(4
81.4
1)(6
09.1
2)(7
09.2
1)50
,000
to60
,000
1,31
3.85
***
1,00
8.10
***
1,58
1.14
***
686.
30**
*2,
857.
62**
*2,
599.
54**
*4,
152.
20**
*2,
213.
09(1
46.7
8)(2
57.7
5)(3
73.4
4)(2
23.2
9)(3
78.1
9)(8
96.7
7)(1
,076
.88)
(1,3
56.3
5)60
,000
to70
,000
1,62
4.96
***
726.
91**
*2,
228.
75**
*1,
598.
84**
*(1
58.1
1)(3
11.5
9)(4
43.3
5)(2
19.5
2)70
,000
to80
,000
1,47
3.73
***
576.
96**
2,96
3.28
***
1,46
3.93
***
(148
.41)
(267
.22)
(396
.95)
(222
.09)
80,0
00to
90,0
001,
374.
70**
*1,
151.
11**
*1,
680.
74**
*-2
2.15
(163
.93)
(260
.40)
(460
.14)
(268
.74)
90,0
00to
100,
000
1,08
4.58
***
230.
761,
389.
53**
*1,
278.
31**
*(1
87.1
4)(2
63.1
2)(5
03.9
1)(3
32.2
2)>
100,
000
1,54
4.82
***
678.
52**
*2,
449.
68**
*1,
244.
47**
*(8
1.02
)(1
31.9
4)(1
72.2
5)(1
26.4
1)
Sta
ndar
der
rors
inpar
enth
eses
***
p<
0.01
,**
p<
0.05
,*
p<
0.1
Not
e:C
ontr
ols
incl
ude
tuit
ion,
EF
C,
inco
me,
GP
A,
dep
enden
t,ge
nder
,ra
ce,
age
fath
er’s
educa
tion
,re
siden
t,cl
ass,
dis
tance
,en
rollm
ent
and
inst
ituti
onal
contr
ol.
All
valu
esex
pre
ssed
in20
08dol
lars
.P
ell-
Eligi
ble
capp
edat
$60,
000
bec
ause
ofla
ckof
obse
rvat
ions.
All
valu
esex
pre
ssed
in20
08dol
lars
.P
ell-
Eligi
ble
capp
edat
$60,
000
bec
ause
ofla
ckof
obse
rvat
ions.
50
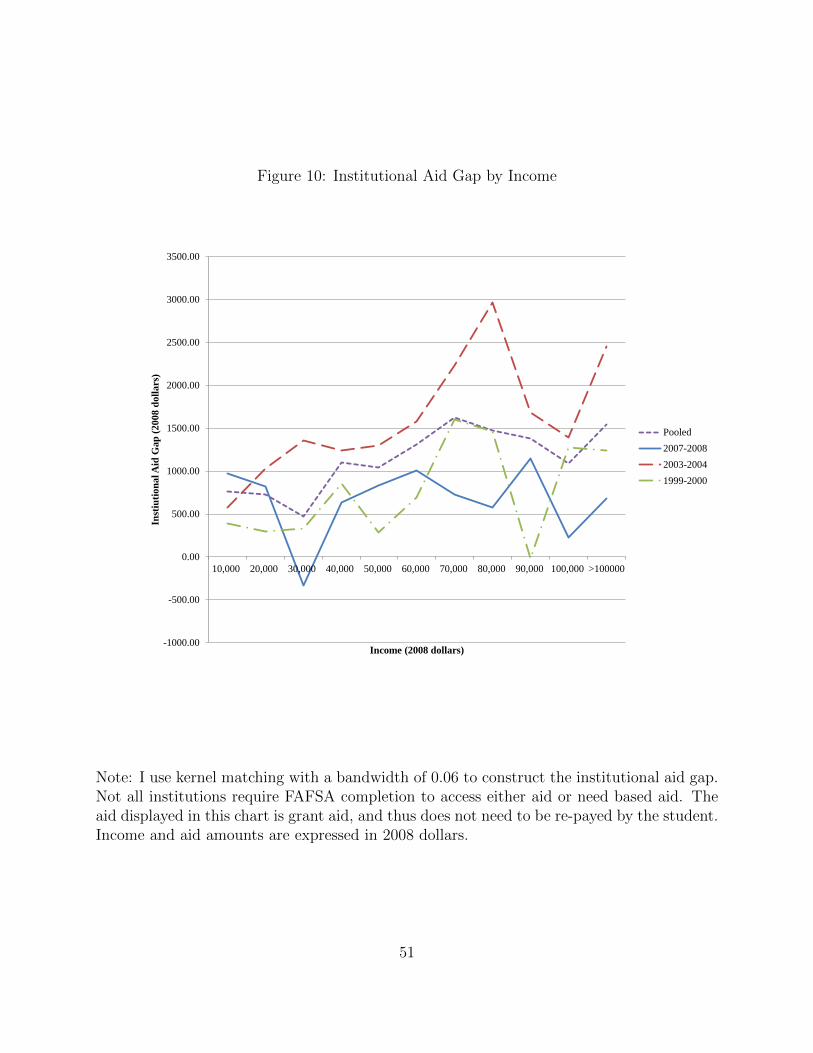
Figure 10: Institutional Aid Gap by Income
-1000.00
-500.00
0.00
500.00
1000.00
1500.00
2000.00
2500.00
3000.00
3500.00
10,000 20,000 30,000 40,000 50,000 60,000 70,000 80,000 90,000 100,000 >100000
Inst
iuti
on
al A
id G
ap
(2
00
8 d
oll
ars
)
Income (2008 dollars)
Pooled
2007-2008
2003-2004
1999-2000
Note: I use kernel matching with a bandwidth of 0.06 to construct the institutional aid gap.Not all institutions require FAFSA completion to access either aid or need based aid. Theaid displayed in this chart is grant aid, and thus does not need to be re-payed by the student.Income and aid amounts are expressed in 2008 dollars.
51
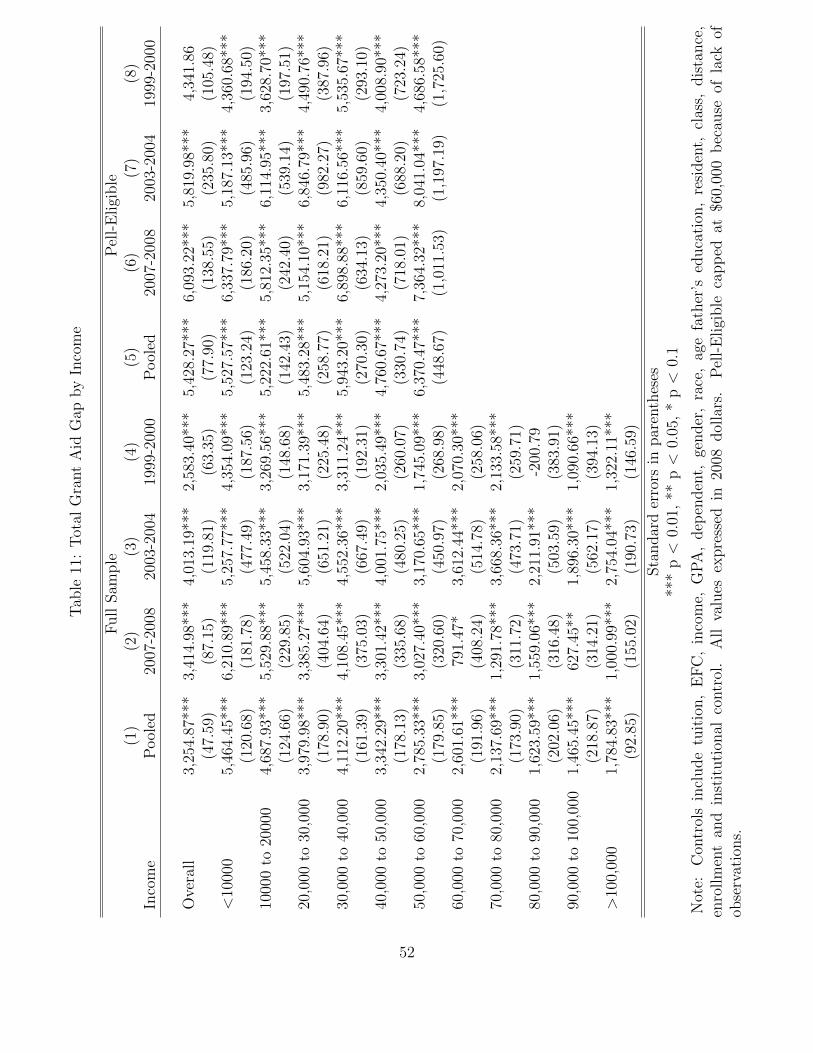
Tab
le11
:T
otal
Gra
nt
Aid
Gap
by
Inco
me
Full
Sam
ple
Pel
l-E
ligi
ble
(1)
(2)
(3)
(4)
(5)
(6)
(7)
(8)
Inco
me
Pool
ed20
07-2
008
2003
-200
419
99-2
000
Pool
ed20
07-2
008
2003
-200
419
99-2
000
Ove
rall
3,25
4.87
***
3,41
4.98
***
4,01
3.19
***
2,58
3.40
***
5,42
8.27
***
6,09
3.22
***
5,81
9.98
***
4,34
1.86
(47.
59)
(87.
15)
(119
.81)
(63.
35)
(77.
90)
(138
.55)
(235
.80)
(105
.48)
<10
000
5,46
4.45
***
6,21
0.89
***
5,25
7.77
***
4,35
4.09
***
5,52
7.57
***
6,33
7.79
***
5,18
7.13
***
4,36
0.68
***
(120
.68)
(181
.78)
(477
.49)
(187
.56)
(123
.24)
(186
.20)
(485
.96)
(194
.50)
1000
0to
2000
04,
687.
93**
*5,
529.
88**
*5,
458.
33**
*3,
269.
56**
*5,
222.
61**
*5,
812.
35**
*6,
114.
95**
*3,
628.
70**
*(1
24.6
6)(2
29.8
5)(5
22.0
4)(1
48.6
8)(1
42.4
3)(2
42.4
0)(5
39.1
4)(1
97.5
1)20
,000
to30
,000
3,97
9.98
***
3,38
5.27
***
5,60
4.93
***
3,17
1.39
***
5,48
3.28
***
5,15
4.10
***
6,84
6.79
***
4,49
0.76
***
(178
.90)
(404
.64)
(651
.21)
(225
.48)
(258
.77)
(618
.21)
(982
.27)
(387
.96)
30,0
00to
40,0
004,
112.
20**
*4,
108.
45**
*4,
552.
36**
*3,
311.
24**
*5,
943.
20**
*6,
898.
88**
*6,
116.
56**
*5,
535.
67**
*(1
61.3
9)(3
75.0
3)(6
67.4
9)(1
92.3
1)(2
70.3
0)(6
34.1
3)(8
59.6
0)(2
93.1
0)40
,000
to50
,000
3,34
2.29
***
3,30
1.42
***
4,00
1.75
***
2,03
5.49
***
4,76
0.67
***
4,27
3.20
***
4,35
0.40
***
4,00
8.90
***
(178
.13)
(335
.68)
(480
.25)
(260
.07)
(330
.74)
(718
.01)
(688
.20)
(723
.24)
50,0
00to
60,0
002,
785.
33**
*3,
027.
40**
*3,
170.
65**
*1,
745.
09**
*6,
370.
47**
*7,
364.
32**
*8,
041.
04**
*4,
686.
58**
*(1
79.8
5)(3
20.6
0)(4
50.9
7)(2
68.9
8)(4
48.6
7)(1
,011
.53)
(1,1
97.1
9)(1
,725
.60)
60,0
00to
70,0
002,
601.
61**
*79
1.47
*3,
612.
44**
*2,
070.
30**
*(1
91.9
6)(4
08.2
4)(5
14.7
8)(2
58.0
6)70
,000
to80
,000
2,13
7.69
***
1,29
1.78
***
3,66
8.36
***
2,13
3.58
***
(173
.90)
(311
.72)
(473
.71)
(259
.71)
80,0
00to
90,0
001,
623.
59**
*1,
559.
06**
*2,
211.
91**
*-2
00.7
9(2
02.0
6)(3
16.4
8)(5
03.5
9)(3
83.9
1)90
,000
to10
0,00
01,
465.
45**
*62
7.45
**1,
896.
30**
*1,
090.
66**
*(2
18.8
7)(3
14.2
1)(5
62.1
7)(3
94.1
3)>
100,
000
1,78
4.83
***
1,00
0.99
***
2,75
4.04
***
1,32
2.11
***
(92.
85)
(155
.02)
(190
.73)
(146
.59)
Sta
ndar
der
rors
inpar
enth
eses
***
p<
0.01
,**
p<
0.05
,*
p<
0.1
Not
e:C
ontr
ols
incl
ude
tuit
ion,
EF
C,
inco
me,
GP
A,
dep
enden
t,ge
nder
,ra
ce,
age
fath
er’s
educa
tion
,re
siden
t,cl
ass,
dis
tance
,en
rollm
ent
and
inst
ituti
onal
contr
ol.
All
valu
esex
pre
ssed
in20
08dol
lars
.P
ell-
Eligi
ble
capp
edat
$60,
000
bec
ause
ofla
ckof
obse
rvat
ions.
52

Figure 11: Total Grant Aid Gap by Income
-1000
0
1000
2000
3000
4000
5000
6000
7000
10,000 20,000 30,000 40,000 50,000 60,000 70,000 80,000 90,000 100,000 >100,000
To
tal
Gra
nt
Aid
(2
00
8 D
oll
ars
)
Income (2008 Dollars)
Pooled
2007-2008
2003-2004
1999-2000
Note: I use kernel matching with a bandwidth of 0.06 to construct the total grant aid gap.Not all institutions require FAFSA completion to access either aid or need based aid. Theaid displayed in this chart is grant aid, and thus does not need to be re-payed by the student.Income and aid amounts are expressed in 2008 dollars.
53

Tab
le12
:E
mplo
yer
Gra
nt
Aid
Gap
by
Inco
me
Full
Sam
ple
Pel
l-E
ligi
ble
(1)
(2)
(3)
(4)
(5)
(6)
(7)
(8)
Inco
me
Pool
ed20
07-2
008
2003
-200
419
99-2
000
Pool
ed20
07-2
008
2003
-200
419
99-2
000
Ove
rall
-209
.52*
**-1
90.2
6***
-260
.18*
**-1
88.6
2***
-172
.97*
**-1
65.1
3***
-358
.23*
**-8
4.83
***
(17.
03)
(35.
88)
(46.
87)
(20.
31)
(29.
68)
(54.
46)
(125
.34)
(27.
17)
¡100
00-1
02.9
9***
-67.
37-6
55.7
1***
-17.
96-1
08.9
0***
-73.
42-6
87.4
9***
-25.
07(4
1.10
)(6
9.73
)(2
81.5
6)(3
3.73
)(4
2.63
)(7
2.97
)(2
95.6
5)(3
5.22
)10
000
to20
000
-95.
36**
*-8
9.75
-26.
58-7
7.16
***
-128
.40*
**-9
1.15
-47.
38-1
39.4
4***
(33.
58)
(95.
53)
(83.
26)
(32.
85)
(34.
97)
(80.
75)
(97.
94)
(45.
53)
20,0
00to
30,0
00-3
93.5
8***
-698
.24*
**-3
08.1
6-4
39.8
0***
-477
.48*
**-3
69.4
0-2
45.2
9-2
62.2
0(6
9.80
)(1
73.8
2)(3
44.9
5)(7
0.47
)(1
14.8
1)(2
42.5
1)(5
87.5
9)(1
66.1
3)30
,000
to40
,000
-238
.13*
**-5
29.1
5***
-591
.47*
**-2
97.3
7***
-104
.46
-101
.39
-488
.63
65.7
3(6
7.31
)(1
76.3
1)(2
88.6
8)(7
5.84
)(1
04.8
3)(2
33.7
4)(3
54.7
7)(1
40.1
4)40
,000
to50
,000
-175
.79*
**-1
21.7
5-5
73.8
0***
-49.
60-1
24.5
8-7
55.2
8***
-1,2
24.7
1***
88.1
6(6
1.12
)(1
26.8
6)(2
36.2
5)(7
7.09
)(1
11.2
1)(2
76.2
0)(3
15.2
0)(1
18.2
8)50
,000
to60
,000
-233
.77*
**-1
22.9
3-4
67.7
9***
-164
.40
96.1
781
.78
117.
9232
4.08
***
(67.
02)
(126
.39)
(178
.52)
(103
.38)
(117
.04)
(519
.48)
(165
.48)
(118
.81)
60,0
00to
70,0
00-2
52.6
1***
58.5
3-6
78.4
8***
-229
.31*
**(8
1.12
)(1
72.3
2)(2
77.9
5)(9
8.46
)70
,000
to80
,000
-57.
26-2
72.9
2***
203.
72**
*-1
36.9
2(5
9.79
)(1
20.8
3)(9
4.60
)(1
05.2
7)80
,000
to90
,000
-197
.97*
**-1
80.8
5-1
96.2
3-2
17.3
7(7
5.19
)(1
54.8
9)(1
24.1
4)(1
56.7
9)90
,000
to10
0,00
0-1
67.2
7***
92.9
3-7
37.0
4***
-60.
67(8
2.50
)(1
18.4
1)(3
05.7
1)(1
33.7
8)¿1
0000
0-9
1.32
***
-177
.65*
**-5
9.18
-78.
31(3
0.50
)(6
2.91
)(6
7.10
)(4
1.56
)
Sta
ndar
der
rors
inpar
enth
eses
***
p<
0.01
,**
p<
0.05
,*
p<
0.1
Not
e:C
ontr
ols
incl
ude
tuit
ion,
EF
C,
inco
me,
GP
A,
dep
enden
t,ge
nder
,ra
ce,
age
fath
er’s
educa
tion
,re
siden
t,cl
ass,
dis
tance
,en
rollm
ent
and
inst
ituti
onal
contr
ol.
All
valu
esex
pre
ssed
in20
08dol
lars
.P
ell-
Eligi
ble
capp
edat
$60,
000
bec
ause
ofla
ckof
obse
rvat
ions.
54

Figure 12: Employer Grant Aid Aid Gap by Income
-800.00
-600.00
-400.00
-200.00
0.00
200.00
400.00
Em
plo
yer
Aid
Ga
p (
20
08 d
oll
ars
)
Income (2008 dollars)
Pooled
2007-2008
2003-2004
1999-2000
Note: I use kernel matching with a bandwidth of 0.06 to construct the employer grant aidgap. Not all institutions require FAFSA completion to access either aid or need based aid.The aid displayed in this chart is grant aid, and thus does not need to be re-payed by thestudent. Income and aid amounts are expressed in 2008 dollars.
55