tne 1 tele norte leste participaÇÕes s.a. morgan stanley dean witter global communications...
TRANSCRIPT
1
TNE
TELE NORTE LESTE TELE NORTE LESTE PARTICIPAÇÕES S.A.PARTICIPAÇÕES S.A.
Morgan Stanley Dean Witter Morgan Stanley Dean Witter Global Communications ConferenceGlobal Communications Conference
March, 2001March, 2001
The information included herein has already been filed with SEC and CVM (Brazil) and is also available at www.telemar.com.br
2
TNE
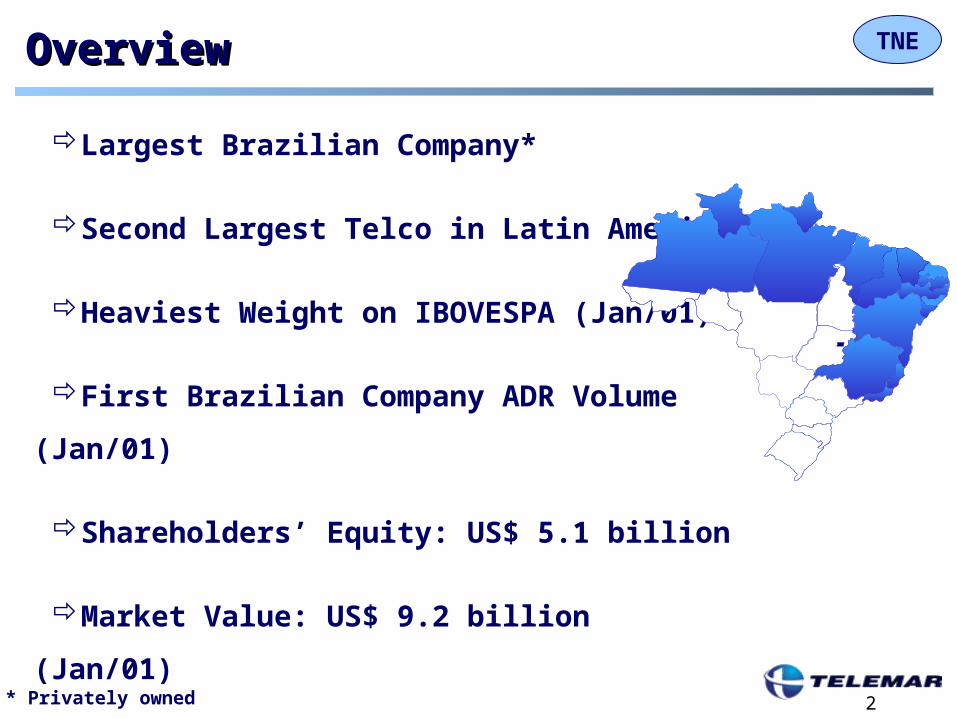
Largest Brazilian Company*
Second Largest Telco in Latin America
Heaviest Weight on IBOVESPA (Jan/01)
First Brazilian Company ADR Volume (Jan/01)
Shareholders’ Equity: US$ 5.1 billion
Market Value: US$ 9.2 billion (Jan/01)
Free Float: 82% of Total Shares
OverviewOverview
* Privately owned

3
TNE
Covers 65% of Brazilian Territory
Reaches 93 million people
Over 20 million households
12.2 million Fixed Lines in Service (Feb/01)
13% Penetration Rate (Brazil: 21%)
560 Lines in Service/Employee
OverviewOverview

4
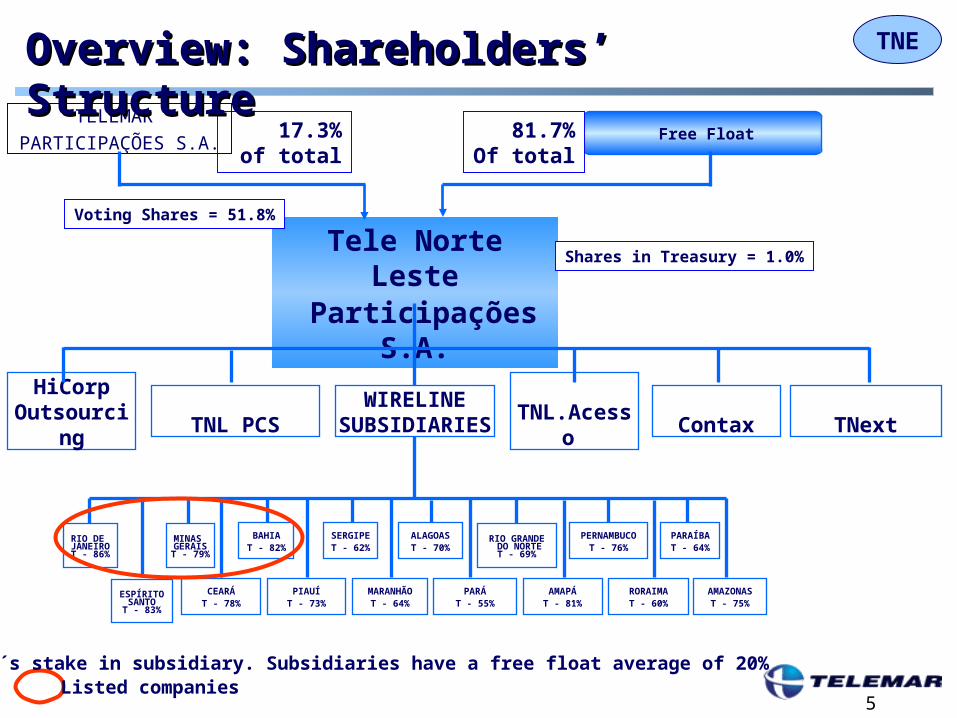
TNEOverview: Shareholders’ StructureOverview: Shareholders’ Structure
Tele Norte Leste Participações S.A.
Free Float
CEARÁ
T - 78%
PIAUÍ
T - 73%
MARANHÃO
T - 64%
AMAPÁ
T - 81%
AMAZONAS
T - 75%
RORAIMA
T - 60%
PARÁ
T - 55%
ALAGOAS
T - 70%
PERNAMBUCO
T - 76%
PARAÍBA
T - 64%
RIO GRANDE DO NORTE
T - 69%
RIO DE JANEIROT - 86%
ESPÍRITOSANTOT - 83%
MINAS GERAIST - 79%
BAHIA
T - 82%
SERGIPE
T - 62%
Preferred Shares -----99.5% Brazil ------ 52% ADR ------- 48%
Common Shares ------- 46.0%
81.7%17.3%
Common Shares = 51.8%
TELEMAR PARTICIPAÇÕES S.A.
Total Shares: 373,577 millionPreferred: 249,051 millionCommon: 124,526 million
Shares in Treasury = 1.0%
T= TNE´s stake in subsidiary. Subsidiaries have a free float average of 20%
Listed companies
TOTAL CAPITALBNDESParFiagoAG TelecomASSECA ParticipaçõesLexpart Part.L. F. Tel BrasilCapBrasilVeículos
25.0%19.9%11.3%11.3%11.3%11.3%
5.0%5.0%
5
TNE
Tele Norte Leste Participações S.A.
Free Float 81.7%Of total
17.3% of total
Voting Shares = 51.8%
TELEMAR
PARTICIPAÇÕES S.A.
T= TNE´s stake in subsidiary. Subsidiaries have a free float average of 20%Listed companies
CEARÁT - 78%
PIAUÍT - 73%
MARANHÃOT - 64%
AMAPÁT - 81%
AMAZONAST - 75%
RORAIMAT - 60%
PARÁT - 55%
ALAGOAST - 70%
PERNAMBUCOT - 76%
PARAÍBAT - 64%
RIO GRANDE DO NORTE
T - 69%
RIO DE JANEIROT - 86%
ESPÍRITOSANTOT - 83%
MINAS GERAIST - 79%
BAHIAT - 82%
SERGIPET - 62%
WIRELINESUBSIDIARIES
HiCorpOutsourcing TNL PCS Contax TNext
Shares in Treasury = 1.0%
TNL.Acesso
Overview: Shareholders’ StructureOverview: Shareholders’ Structure

6
TNERecent Developments: HighlightsRecent Developments: Highlights
Main Drivers (Revenues) – Dec/00
Line growth: 2.1 million in 2000
Fixed-to-Mobile traffic
Tariff increase – July/00
•14% Local Service/Interconnection
•11.9% DLD
•9.5% Fixed-tp-Mobile (VC1) – Feb/01
Revenue Growth: 31% (00/99)
EBITDA Margin: 49.6% (12M00)
+21.7%
over65%

7
TNERecent Developments: HighlightsRecent Developments: Highlights
Main Drivers (Costs)
Cost Savings (R$ 113 million YoY/Ex-interconnection)
•Integration (Data Processing, Network Management
and Call Centers)
•Shared Services Center (Back Office Functions: SAP
and PeopleSoft)
Improving Efficiencies (network upgrade, systems and
processes)
Revenue Growth: 31% (00/99)
EBITDA Margin: 49.6% (12M00)
8
TNE
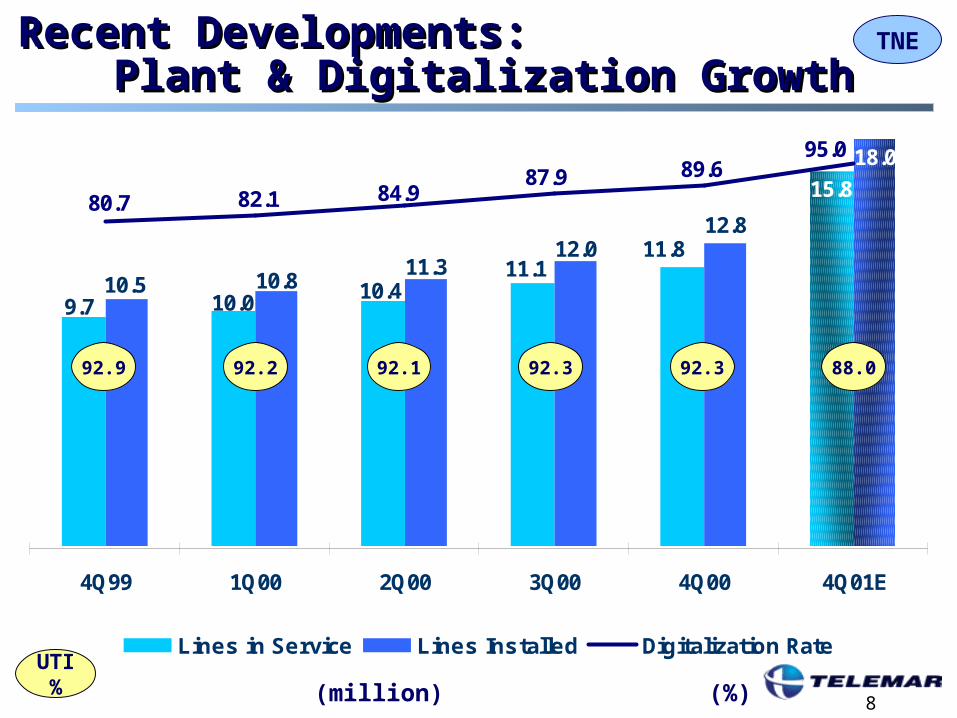
15.8
11.811.1
10.410.09.7
18.0
12.812.0
11.310.810.5
95.089.687.9
84.982.180.7
4Q99 1Q00 2Q00 3Q00 4Q00 4Q01E
Lines in Service Lines Installed Digitalization Rate
(million) (%)
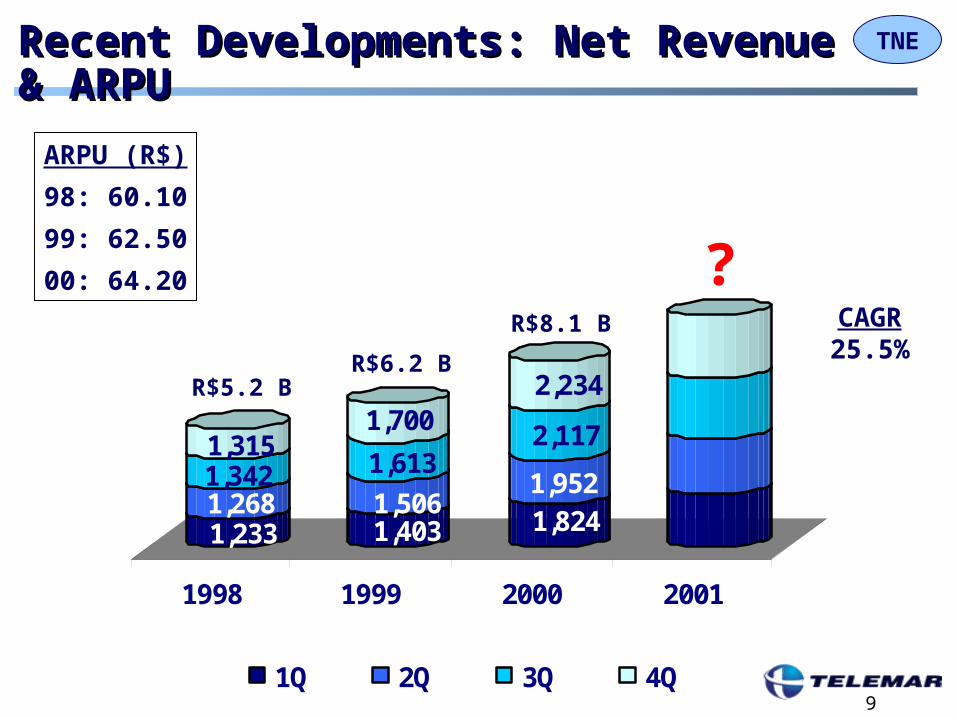
Recent Developments:Recent Developments:Plant & Digitalization GrowthPlant & Digitalization Growth
UTI%
92.9 92.2 92.1 92.3 92.3 88.0
TNE
9
1,2331,2681,3421,315
1,4031,506
1,613
1,700
1,8241,952
2,117
2,234
1998 1999 2000 2001
1Q 2Q 3Q 4Q
CAGR25.5%
Recent Developments: Net Revenue & ARPURecent Developments: Net Revenue & ARPU
R$5.2 BR$6.2 B
R$8.1 B
ARPU (R$)
98: 60.10
99: 62.50
00: 64.20 ?

10
TNE
45%
20%
12%
11%
12%
44%
23%
12%
9%
12%
4Q99 4Q00
Recent Developments: Main ServicesRecent Developments: Main Services
Data 5%
DLD
67%
65%
Network Use
Fixed to Mobile
Local
GrossRevenue
R$2,288 mm R$2,996 mm
Other

11
TNERecent Developments: EBITDARecent Developments: EBITDA
1,090
1,149
965
829
599
49%
54%
49%
35%
45%
56%
64%67%
61%
43%
4Q99 1Q00 2Q00 3Q00 4Q00
EBITDA (R$ million) EBITDA Margin (%) Margin ex-interconnection costs (%)
Reduced by R$135
MM
12
TNE
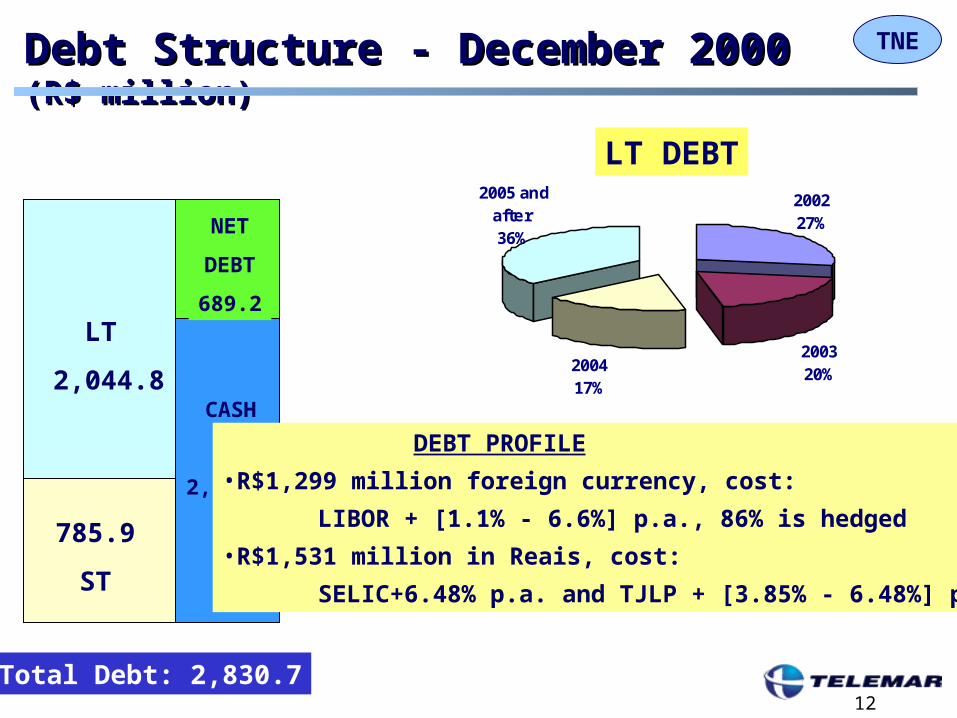
785.9
ST
LT
2,044.8
NET
DEBT
689.2
CASH
2,141.5
Total Debt: 2,830.7
LT DEBT
Debt Structure - December 2000Debt Structure - December 2000 (R$ million) (R$ million)
200320%2004
17%
200227%
2005 and after36%
DEBT PROFILE
•R$1,299 million foreign currency, cost:
LIBOR + [1.1% - 6.6%] p.a., 86% is hedged
•R$1,531 million in Reais, cost:
SELIC+6.48% p.a. and TJLP + [3.85% - 6.48%] p.a.

13
TNE
World Class - Global Operator
Class A - Mobility
Class B - National Coverage
2000 20022001 2003
Class C - National Corporate Excellence
Class D - Regional Excellence
Steps to Maximize ValueSteps to Maximize Value
Telemar shall increase its value as the company incorporates broader strategies.
14
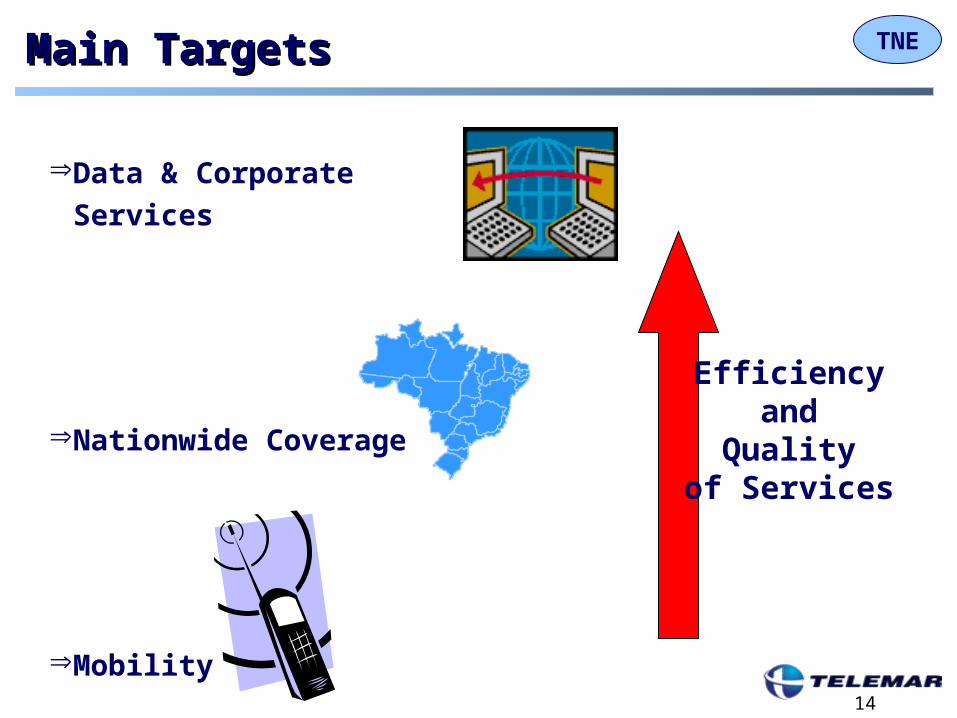
TNEMain TargetsMain Targets
Data & Corporate Services
Nationwide Coverage
Mobility
Efficiencyand
Qualityof Services

15
TNE
MAIN PRIORITY
Fulfill all 2003 Universalization Targets
Nationwide CoverageNationwide Coverage
16
TNE
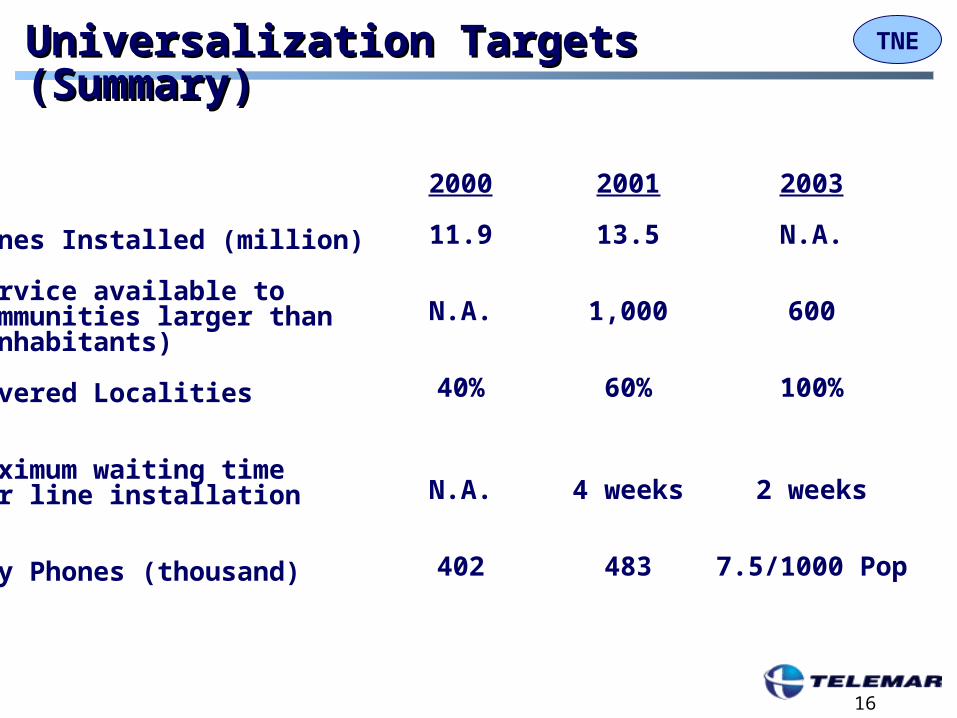
Lines Installed (million)
Service available tocommunities larger than(inhabitants)
Covered Localities
Maximum waiting timefor line installation
Pay Phones (thousand)
2000
11.9
N.A.
40%
N.A.
402
2001
13.5
1,000
60%
4 weeks
483
2003
N.A.
600
100%
2 weeks
7.5/1000 Pop
Universalization Targets (Summary)Universalization Targets (Summary)

17
TNENationwide Coverage Nationwide Coverage
DECEMBER 2000
TNE had 12.8 million Lines Installed
DECEMBER 2001TNE will have
18.0 million Lines Installed*
* Including Public Phones and WLL
2001 CAPEX : R$ 8.4 Billion
+5.2 MM
Rio24%
Minas19%
Bahia12%
Ceará12%
Pernambuco11%
Holding22%
Communication Systems
4%
IT Structure2%
Oper./Maint.8%
Universalization Targets
46%
Quality Targets5%
PCS Business18%
Data Transmission
17%
(PCS license included)

18
TNENationwide CoverageNationwide Coverage
Mission
TO BECOME A NATIONAL OPERATOR FROM 2002 ON
DLDData
Services
Challenge
Fulfill and anticipate 2003 Goals
established by Anatel

19
TNENationwide Coverage Nationwide Coverage DLD Traffic Distribution – 2000DLD Traffic Distribution – 2000EE
2% 3%
28%
20%
25%
5%9%
5%
3%
Brazil:40.5 billion
minutes
Region IOriginates 35% Receives 40%
Region IIIOriginates 39% Receives 33%
Region IIOriginates 26%
Receives 27%
Source: Telemar and Mckinsey Co. estimates

20
TNE
151016
34
22
38
2000 2005
3.1
1.9
3.0
4.2
2.7
4.6
2000 2005
Nationwide CoverageNationwide CoverageBrazilian Market Trends (DLD and ILD)Brazilian Market Trends (DLD and ILD)EE
94
41
Region I
Region IIRegion III
Region I
Region II
Region III
Volumebillion minutes/year
RevenueR$ billion/year
8.0
11.5
CAGR18%
CAGR7.5%
Source: Telemar and Mckinsey Co. estimates

21
TNENationwide CoverageNationwide CoverageTelemar LD Market Share – 2005Telemar LD Market Share – 2005EE
47
17
36
23
18.5
58.5
2000 2005
0
100
15
85
2000 2005
National International
Player A
Telemar
Other
Telemar
Other
9441 0.71 1.56
Billion minutesSource: Telemar and Mckinsey Co. estimates

22
TNEData ServicesData Services
Mission
TO BECOME THE LEADER IN NATIONAL DATA MARKET
BY 2005

23
TNEData Services: Market ShareData Services: Market Share
1,973 7,866US$ million
CAGR: 31.9%
2000 2005
16.1%21%
Refers to 3 basic steps of value chain (Traditional and IP Transport and Advanced Services)

24
TNEData Services: Value ChainData Services: Value Chain
B2B commerce through portals and related infrastructure
Complex applications withCustomization and integration
Co-location and hosting services Application and software hosting
Value added servicesVoIP, security, management and other
IP ConnectivityDial-up and broadband connection
Traditional data communication servicesAccess to IP backbone
Description New BusinessesE-market
Place
ASP
Hosting
AdvancedServices
IPTransport
TraditionalTransport
25
TNE
MobilityMobility

26
TNEIntroductionIntroductionMain MessagesMain Messages
Quick DecisionsOpportunities Competitive
Advantages
• Operating synergies
• Commercial Synergies and fixed-to-mobile complement
• Opportunity to buy license at low price
Coverage
• Need for capillarity
• Network quality linked to number of cell sites
• R$ 2 billion CAPEX in 3 years, vendor financing
• Market growing quickly
• High Value Consumers
• New applications due to rapid technological development –GPRS
• Aggressive competitors already established
• Aggressive Targets:
• Subscribers
• Revenue
• Largest roll-out in the world
Cellular telephony operations represent an excellent opportunity for Telemar, and the company is prepared for the challenges involved.

27
TNEThe Cellular Market Opportunity The Cellular Market Opportunity 2.5G/GPRS Advantages and Benefits for the Client2.5G/GPRS Advantages and Benefits for the Client
Larger data transmission capacity 14 - 40 kbps initially: according to the network and equipment transmission, vs. 9.6 GSM
No need to dial-up (packet switching)
Better network utilization, leading to smaller transmission costs than the previous system (circuit-switched).
Open to IP and Internet
Faster access to data
Enables the visualization of complex information (charts, tables, figures, etc.)
Billing connected to effective information transmission
Possibility of permanent connection
GPRS 2.5G Technology Advantages Benefits for the client
Telemar will be able to offer more advanced data transmission than its competitors since the first day of operations, on its way to 3G.

28
TNE
US$ / POP
Note: Total price of 2G licenseSource: Merrill Lynch November 2000, Anatel, DiamondCluster.
Telemar’s Competitive AdvantagesTelemar’s Competitive AdvantagesComparing License PricesComparing License Prices
Telemar: US$ 6/inhabitant
Telemar bought the D Band license at a low cost when compared to other prices paid.

29
TNE
Operating Synergies
Telemar’s Competitive AdvantagesTelemar’s Competitive AdvantagesSynergies between Fixed and Cellular OperationsSynergies between Fixed and Cellular Operations
• Network structure:– Some WLL sites can be shared with PCS
operations– Maintenance costs can be shared
between both operations
• Customer care and billing can be shared with Telemar’s fixed operations
• Backbone
Commercial Synergies
• Sales structure of Telemar Fixed– Own stores– Direct sales force
• Brand recognition– Reduced efforts required to insert a new
brand
• Customer base– 12 million Telemar customers (data
base)
• National “31 code”
Telemar shall take advantage of its significant synergies to leverage its position in the Brazilian telecommunications market.

30
TNE““Safe Harbor” StatementSafe Harbor” Statement
This presentation contains forward-looking statements. Statements that are
not historical facts, including statements about our beliefs and expectations,
are forward-looking statements and involve inherent risks and uncertainties.
These statements are based on current plans, estimates and projections, and
therefore you should not place undue reliance on them. Forward-looking
statements speak only as of the date they are made, and we undertake no
obligation to update publicly any of them in light of new information or future
events.

31
TNE
Investor Relations
Rua Lauro Müller, 116 / 22º andar - Botafogo
Rio de Janeiro -RJ
Phone: ( 55 21) 279-3220/ 279-3221
Fax: (55 21) 279-3229
E-mail: [email protected]
Visit our website: http://www.telemar.com.br