tmt value creators 2016: unleashing technology, media ......cloud computing. this ecosystem is...
TRANSCRIPT
The 2016 TMT Value Creators Report
Unleashing Technology, Media, and Telecom with Digital Transformation
The Boston Consulting Group (BCG) is a global management consulting firm and the world’s leading advisor on business strategy. We partner with clients from the private, public, and not-for-profit sectors in all regions to identify their highest-value opportunities, address their most critical challenges, and transform their enterprises. Our customized approach combines deep in sight into the dynamics of companies and markets with close collaboration at all levels of the client organization. This ensures that our clients achieve sustainable compet itive advantage, build more capable organizations, and secure lasting results. Founded in 1963, BCG is a private company with 85 offices in 48 countries. For more information, please visit bcg.com.
October 2016 | The Boston Consulting Group
Unleashing Technology, MeDia, anD TelecoM wiTh DigiTal TransforMaTion
SimOn BamBerGer
WOlFGanG BOCk
PaTriCk FOrTh
anna Green
Derek kenneDy
FreDrik linD
Tim nOlan
neal ZuCkerman
The 2016 TmT Value Creators report
2 | Unleashing Technology, Media, and Telecom with Digital Transformation
conTenTs
3 Value Creation in the era of DisruptionHow TMT Companies Created Value During the Past Five YearsFuture Opportunities for TMT Value CreationThe Current Imperative: Digital Transformation
11 riDing the WaVes of innoVation in the teChnology inDustry
Past PerformanceFuture Growth AreasTransforming the Value Chain
18 MeDia’s future: reinVent or failValue Creation in the Media IndustryRewriting the Future
25 the paraDoxes of teleCoM Value CreationHow Value Was CreatedSuccess Over the Next Five Years
32 the tMt Digital transforMation JourneyDriving Digital TransformationQuestions to Ponder
37 for further reaDing
38 note to the reaDer
The Boston Consulting Group | 3
This is an era of disruption. technology innovation, the intensifying march of
digitization, and the cumulative effect of the “big exponentials”—the laws of accelerating growth governing processing power, storage, and bandwidth—are shattering, reshaping, and redefining economics in and across industries.
Value creation remains the best metric of strategy, trans-formation, and execution.
Companies in the technology, media, and telecommunications (tMt) sectors are in the vanguard, bringing these new opportunities to market—even as their legacy businesses are threatened by them. tMt companies have begun to digitize their core businesses and enter new disruptive businesses, often through M&a and partnerships. still, they are subject to massive dislocation and attack.
in this age of exponential growth, value cre-ation remains the best metric of superior strat-egy, transformation, and execution. tMt com-panies have done a good job of rewarding their shareholders in the first half of this dis-ruptive decade. still, the gap between winners and losers remains large, and speed is critical.
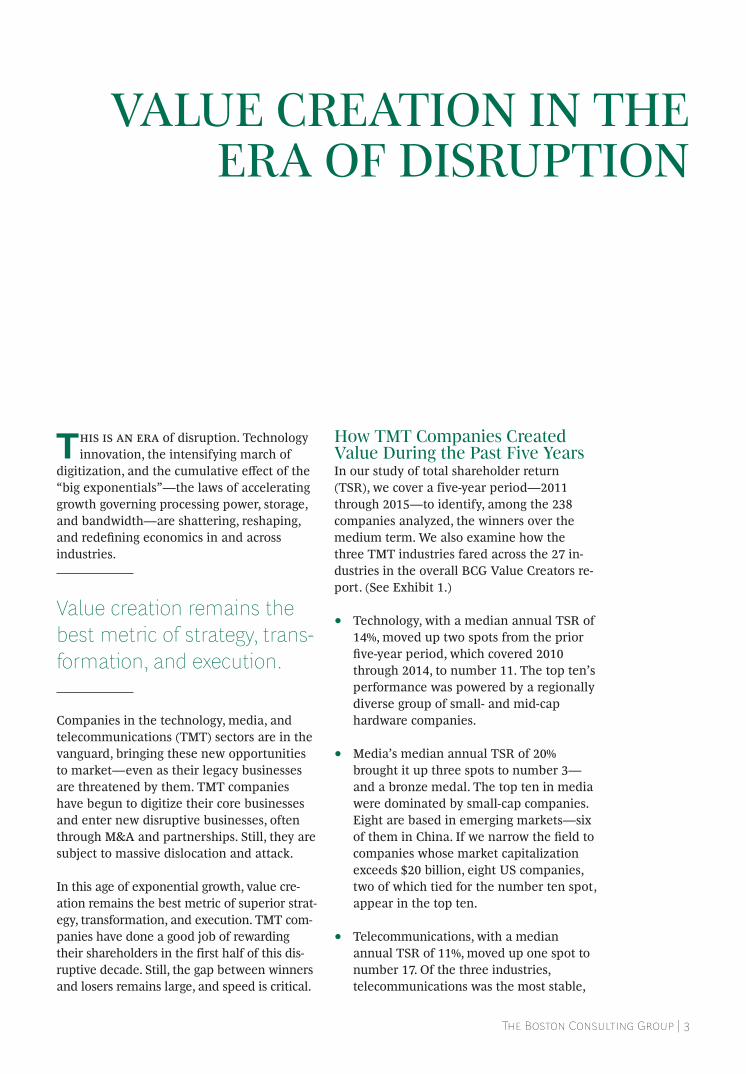
how TMT companies created Value During the Past five yearsin our study of total shareholder return (tsr), we cover a five-year period—2011 through 2015—to identify, among the 238 companies analyzed, the winners over the medium term. We also examine how the three tMt industries fared across the 27 in-dustries in the overall BCg Value Creators re-port. (see exhibit 1.)
• technology, with a median annual tsr of 14%, moved up two spots from the prior five-year period, which covered 2010 through 2014, to number 11. the top ten’s performance was powered by a regionally diverse group of small- and mid-cap hardware companies.
• Media’s median annual tsr of 20% brought it up three spots to number 3—and a bronze medal. the top ten in media were dominated by small-cap companies. eight are based in emerging markets—six of them in China. If we narrow the field to companies whose market capitalization exceeds $20 billion, eight us companies, two of which tied for the number ten spot, appear in the top ten.
• telecommunications, with a median annual tsr of 11%, moved up one spot to number 17. of the three industries, telecommunications was the most stable,
ValUe creaTion in The era of DisrUPTion
4 | Unleashing Technology, Media, and Telecom with Digital Transformation
with six companies retaining their top-ten spots from the 2010–2014 ranking. inte-grated operators and cable companies that offer customers triple- and quadruple-play services dominated the top ten. in addi-tion, nine of the top ten are from mature markets, and the market capitalization of five of the companies topped $50 billion, signaling that scale and incumbency matter in telecommunications.
While small- and mid-cap stocks drove the performance of technology’s and media’s top ten, the performance of the largest compa-nies overall was stronger. across all three tMt industries, the median annual return for companies with market caps exceeding $50 billion was 18%, compared with 14.9% for smaller companies.
as in the past, a few companies generated out-size shareholder returns. only ten companies were responsible for 37% of the $5.3 trillion in value created by the tMt companies analyzed.
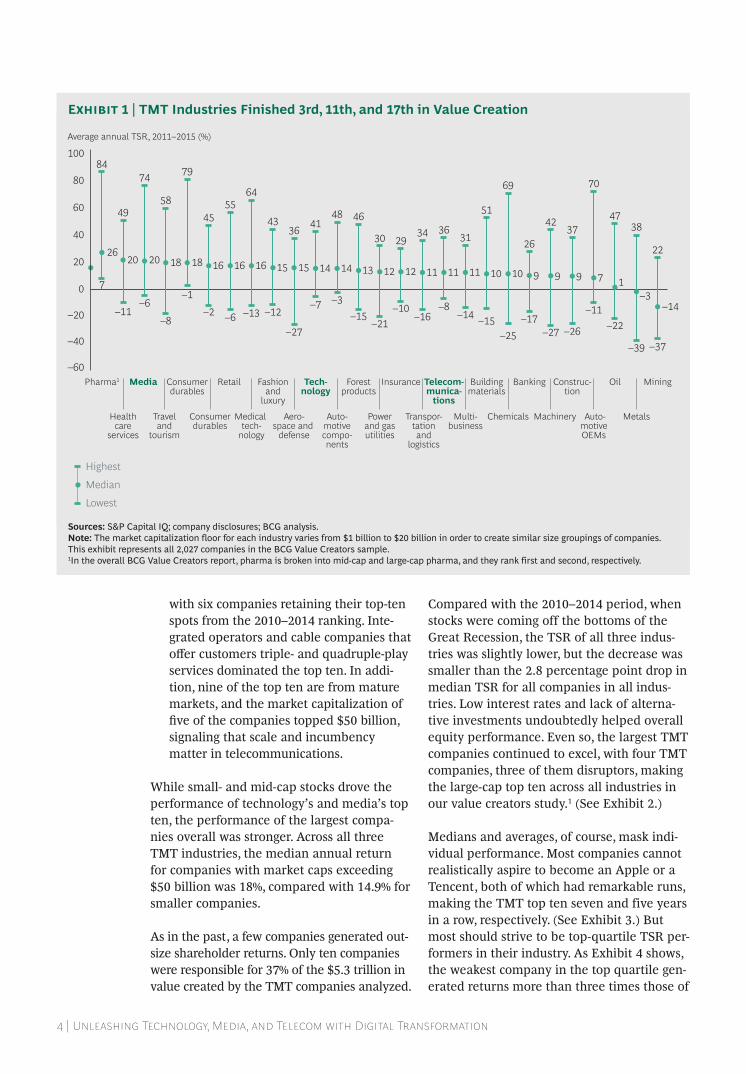
Compared with the 2010–2014 period, when stocks were coming off the bottoms of the great recession, the tsr of all three indus-tries was slightly lower, but the decrease was smaller than the 2.8 percentage point drop in median tsr for all companies in all indus-tries. low interest rates and lack of alterna-tive investments undoubtedly helped overall equity performance. Even so, the largest TMT companies continued to excel, with four tMt companies, three of them disruptors, making the large-cap top ten across all industries in our value creators study.1 (see exhibit 2.)
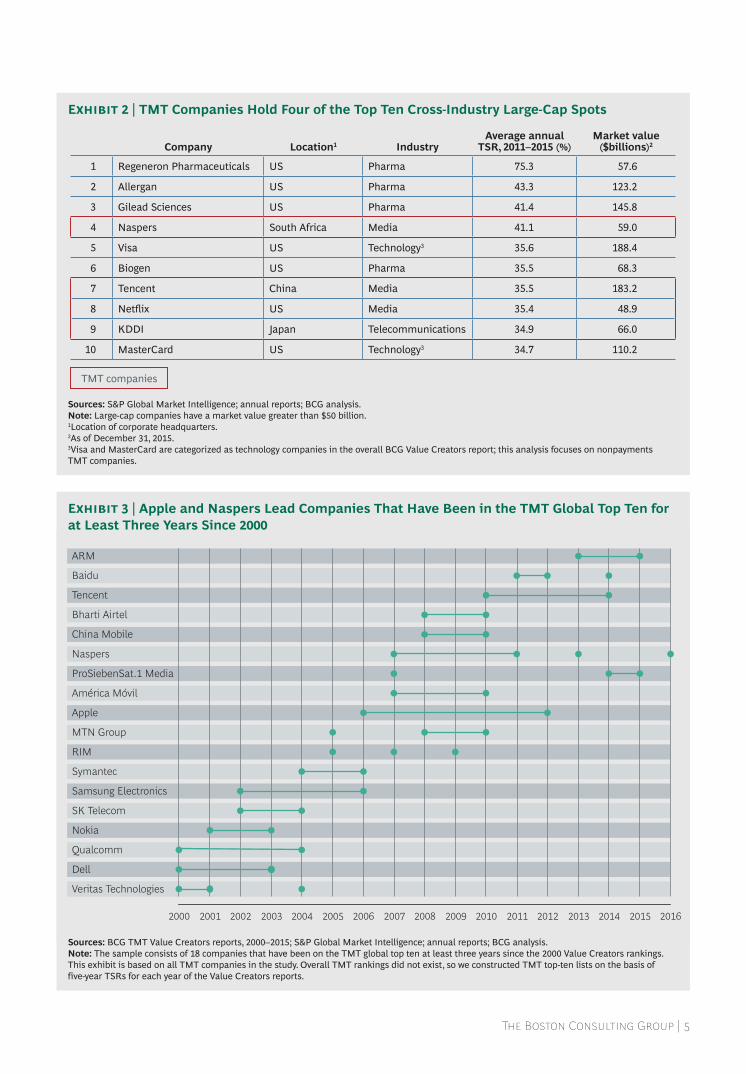
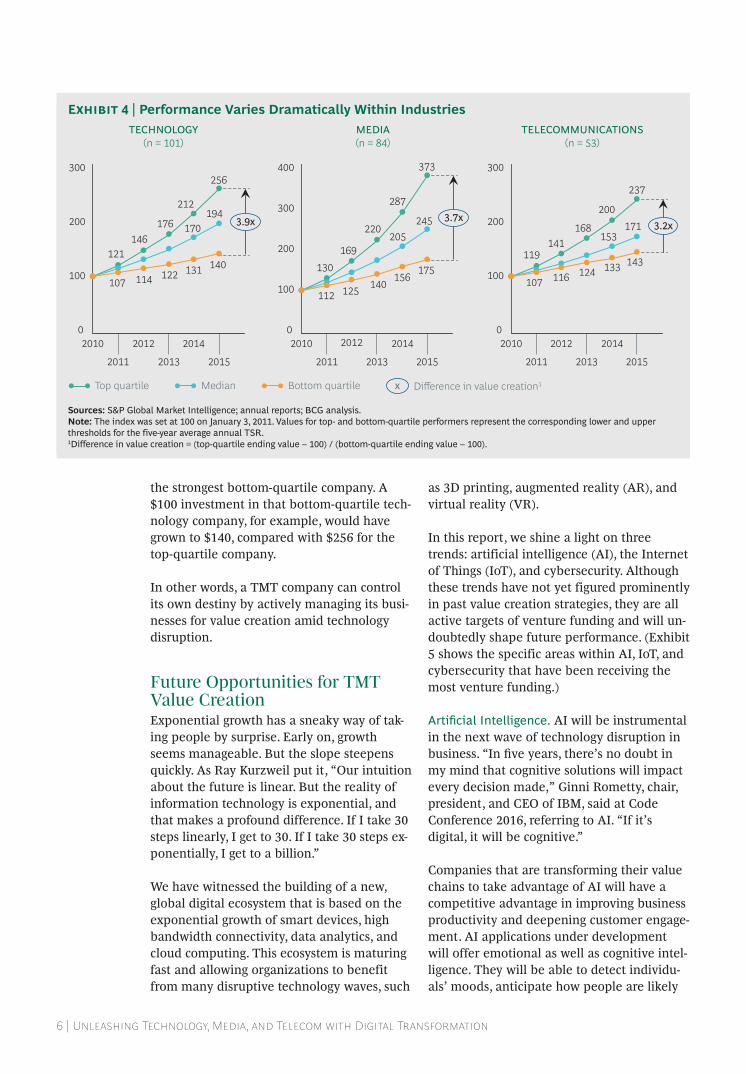
Medians and averages, of course, mask indi-vidual performance. Most companies cannot realistically aspire to become an apple or a tencent, both of which had remarkable runs, making the tMt top ten seven and five years in a row, respectively. (see exhibit 3.) But most should strive to be top-quartile TSR per-formers in their industry. as exhibit 4 shows, the weakest company in the top quartile gen-erated returns more than three times those of
84
49
74
58
79
4555
64
4336 41
48 46
30 2934 36
31
51
69
26
4237
70
4738
222620 20 18 18 16 16 16 15 15 14 14 13 12 12 11 11 11 10 10 9 9 9 7 1
–3–14
7
–11–6
–8
–1
–2 –6 –13 –12
–27
–7 –3–15
–21–10
–16–8
–14 –15–25
–17–27 –26
–11–22
–39 –37
–60
–40
–20
0
20
40
60
80
100Average annual TSR, 2011–2015 (%)
Highest
Lowest
Median
Auto-motivecompo-nents
Machinery Auto-motiveOEMs
Healthcare
services
Powerand gasutilities
Fashionand
luxury
Tech-nology
Pharma1 Media
Medical tech-
nology
Construc-tion
Consumerdurables
Transpor-tationand
logistics
Chemicals
Retail Buildingmaterials
Consumerdurables
Forestproducts
Insurance Telecom-munica-tions
Oil
Multi-business
Banking
Aero-space and
defense
Traveland
tourism
Mining
Metals
Sources: S&P Capital iQ; company disclosures; BCG analysis.Note: The market capitalization floor for each industry varies from $1 billion to $20 billion in order to create similar size groupings of companies. This exhibit represents all 2,027 companies in the BCG Value Creators sample.1in the overall BCG Value Creators report, pharma is broken into mid-cap and large-cap pharma, and they rank first and second, respectively.
Exhibit 1 | TMT Industries Finished 3rd, 11th, and 17th in Value Creation
The Boston Consulting Group | 5
ARM
Baidu
Tencent
Bharti Airtel
China Mobile
Naspers
ProSiebenSat.1 Media
América Móvil
Apple
MTN Group
RIM
Symantec
Samsung Electronics
SK Telecom
Nokia
Qualcomm
Dell
Veritas Technologies
2000 2001 2002 2003 2004 2005 2006 2007 2008 2009 2010 2011 2012 2013 2014 2015 2016
Sources: S&P Global market intelligence; annual reports; BCG analysis.Note: large-cap companies have a market value greater than $50 billion.1location of corporate headquarters.2as of December 31, 2015.3Visa and masterCard are categorized as technology companies in the overall BCG Value Creators report; this analysis focuses on nonpayments TmT companies.
Sources: BCG TmT Value Creators reports, 2000–2015; S&P Global market intelligence; annual reports; BCG analysis.Note: The sample consists of 18 companies that have been on the TmT global top ten at least three years since the 2000 Value Creators rankings. This exhibit is based on all TmT companies in the study. Overall TmT rankings did not exist, so we constructed TmT top-ten lists on the basis of five-year TSrs for each year of the Value Creators reports.
Exhibit 2 | TMT Companies Hold Four of the Top Ten Cross-Industry Large-Cap Spots
Exhibit 3 | Apple and Naspers Lead Companies That Have Been in the TMT Global Top Ten for at Least Three Years Since 2000
Company Location1 IndustryAverage annual
TSR, 2011–2015 (%)Market value
($billions)2
1 regeneron Pharmaceuticals uS Pharma 75.3 57.6
2 allergan uS Pharma 43.3 123.2
3 Gilead Sciences uS Pharma 41.4 145.8
4 naspers South africa media 41.1 59.0
5 Visa uS Technology3 35.6 188.4
6 Biogen uS Pharma 35.5 68.3
7 Tencent China media 35.5 183.2
8 netflix uS media 35.4 48.9
9 kDDi Japan Telecommunications 34.9 66.0
10 masterCard uS Technology3 34.7 110.2
TMT companies
6 | Unleashing Technology, Media, and Telecom with Digital Transformation
the strongest bottom-quartile company. A $100 investment in that bottom-quartile tech-nology company, for example, would have grown to $140, compared with $256 for the top-quartile company.
in other words, a tMt company can control its own destiny by actively managing its busi-nesses for value creation amid technology disruption.
future opportunities for TMT Value creationexponential growth has a sneaky way of tak-ing people by surprise. early on, growth seems manageable. But the slope steepens quickly. As Ray Kurzweil put it, “Our intuition about the future is linear. But the reality of information technology is exponential, and that makes a profound difference. if i take 30 steps linearly, i get to 30. if i take 30 steps ex-ponentially, i get to a billion.”
We have witnessed the building of a new, global digital ecosystem that is based on the exponential growth of smart devices, high bandwidth connectivity, data analytics, and cloud computing. this ecosystem is maturing fast and allowing organizations to benefit from many disruptive technology waves, such
as 3D printing, augmented reality (ar), and virtual reality (Vr).
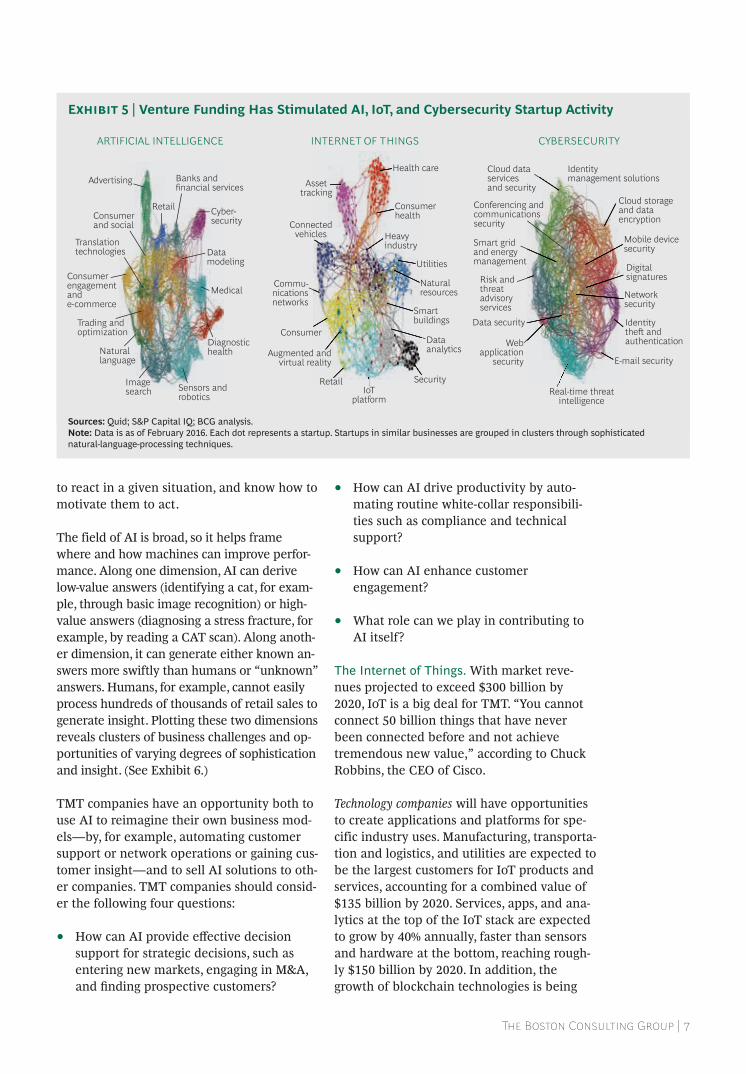
in this report, we shine a light on three trends: artificial intelligence (ai), the internet of things (iot), and cybersecurity. although these trends have not yet figured prominently in past value creation strategies, they are all active targets of venture funding and will un-doubtedly shape future performance. (exhibit 5 shows the specific areas within ai, iot, and cybersecurity that have been receiving the most venture funding.)
artificial intelligence. ai will be instrumental in the next wave of technology disruption in business. “In five years, there’s no doubt in my mind that cognitive solutions will impact every decision made,” ginni rometty, chair, president, and Ceo of iBM, said at Code Conference 2016, referring to ai. “if it’s digital, it will be cognitive.”
Companies that are transforming their value chains to take advantage of ai will have a competitive advantage in improving business productivity and deepening customer engage-ment. ai applications under development will offer emotional as well as cognitive intel-ligence. they will be able to detect individu-als’ moods, anticipate how people are likely
x
212
176146
256
121
194170
140131122114107
0
100
200
300
3.9x
TECHNOLOGYn = 101
MEDIAn = 84
TELECOMMUNICATIONSn = 53
169
373
220
130
245205
175156
140125112
0
100
200
300
400
2873.7x
237
200
168141
119
171153
143133124116107
0
100
200
300
3.2x
Top quartile Median Bottom quartile Difference in value creation1
2010
2011
2012
2013
2014
2015
2010
2011
2012
2013
2014
2015
2010
2011
2012
2013
2014
2015
Sources: S&P Global market intelligence; annual reports; BCG analysis.Note: The index was set at 100 on January 3, 2011. Values for top- and bottom-quartile performers represent the corresponding lower and upper thresholds for the five-year average annual TSr.1Difference in value creation = (top-quartile ending value – 100) / (bottom-quartile ending value – 100).
Exhibit 4 | Performance Varies Dramatically Within Industries
The Boston Consulting Group | 7
to react in a given situation, and know how to motivate them to act.
the field of ai is broad, so it helps frame where and how machines can improve perfor-mance. along one dimension, ai can derive low-value answers (identifying a cat, for exam-ple, through basic image recognition) or high- value answers (diagnosing a stress fracture, for example, by reading a Cat scan). along anoth-er dimension, it can generate either known an-swers more swiftly than humans or “unknown” answers. humans, for example, cannot easily process hundreds of thousands of retail sales to generate insight. plotting these two dimensions reveals clusters of business challenges and op-portunities of varying degrees of sophistication and insight. (see exhibit 6.)
tMt companies have an opportunity both to use ai to reimagine their own business mod-els—by, for example, automating customer support or network operations or gaining cus-tomer insight—and to sell ai solutions to oth-er companies. tMt companies should consid-er the following four questions:
• How can AI provide effective decision support for strategic decisions, such as entering new markets, engaging in M&a, and finding prospective customers?
• how can ai drive productivity by auto-mating routine white-collar responsibili-ties such as compliance and technical support?
• how can ai enhance customer engagement?
• What role can we play in contributing to AI itself?
The internet of Things. With market reve-nues projected to exceed $300 billion by 2020, iot is a big deal for tMt. “you cannot connect 50 billion things that have never been connected before and not achieve tremendous new value,” according to Chuck robbins, the Ceo of Cisco.
Technology companies will have opportunities to create applications and platforms for spe-cific industry uses. Manufacturing, transporta-tion and logistics, and utilities are expected to be the largest customers for iot products and services, accounting for a combined value of $135 billion by 2020. services, apps, and ana-lytics at the top of the iot stack are expected to grow by 40% annually, faster than sensors and hardware at the bottom, reaching rough-ly $150 billion by 2020. in addition, the growth of blockchain technologies is being
CYBERSECURITY
Cloud dataservicesand security
Identitymanagement solutions
Identitythe and authentication
Real-time threatintelligence
E-mail security
Mobile devicesecurity
Networksecurity
Digitalsignatures
Data security
Webapplication
security
Risk andthreatadvisoryservices
Cloud storageand dataencryption
Smart grid and energy management
Conferencing andcommunicationssecurity
Assettracking
Health care
Consumerhealth
Connectedvehicles Heavy
industry
Utilities
Commu-nicationsnetworks
Natural resources
Consumer
RetailIoT
platform
Dataanalytics
Security
Smart buildings
Augmented andvirtual reality
INTERNET OF THINGSARTIFICIAL INTELLIGENCE
Diagnostic health
Medical
Datamodeling
Cyber-security
Advertising
Imagesearch Sensors and
robotics
Naturallanguage
Consumerengagementand e-commerce
Trading andoptimization
RetailConsumerand social
Translationtechnologies
Banks and financial services
Sources: Quid; S&P Capital iQ; BCG analysis.Note: Data is as of February 2016. each dot represents a startup. Startups in similar businesses are grouped in clusters through sophisticated natural-language-processing techniques.
Exhibit 5 | Venture Funding Has Stimulated AI, IoT, and Cybersecurity Startup Activity

8 | Unleashing Technology, Media, and Telecom with Digital Transformation
propelled in part by the opportunity to be-come the ledger for iot transactions.
iot has the potential to widen media compa-nies’ content distribution so that many more devices and surfaces—such as refrigerators and tables—can display digital content. iot can also enhance storytelling through ar and Vr.
the rollout of 5g infrastructure in the next five or so years offers telecommunications oper-ators the chance to embed their networks with more intelligence and help facilitate the development of services built around ar and Vr, the tactile internet, and connected cars. Verizon’s hum service, for example, provides speed alerts and vehicle location, monitors vehicle diagnostics, and can connect with live mechanics.
tMt companies should consider the follow-ing four questions:
• given the developments in iot, to what extent are we at risk of disruption?
• Do we have a product or service we can leverage to capitalize on IoT? In which areas of the stack should we play, given our assets and strengths?
• Do we have the infrastructure in place to succeed? Where do we need to partner, and what do we want to own?
• Which services should we monetize, and which should we give away or subsidize?
Cybersecurity. Barely a week goes by without a news report of yet another security breach at a major company or government agency. these breaches damage credibility, brand, and trust. More than 4.8 billion records have been lost or stolen since 2013, so security breaches represent an existential threat to all companies.
given the reach of the new digital ecosystem, cybersecurity is growing ever more critical, and companies from many industries are rushing to enter the field. Private equity firms and other companies have also gone on buy-
Low High
VALUE OF ANSWER
Established
New
TYPE OF ANSWER
INSIGHT
RECOGNITION
BREAKTHROUGH
JUDGMENT
• Customer microsegmentation• Offer recommendation
• Biotech discovery
• Language translation• Image recognition
• Call center automation• Medical diagnostics
Source: BCG analysis.
Exhibit 6 | A Mapping of AI Value Creation
The Boston Consulting Group | 9
ing sprees, and companies have been “snapped up for the technology or in-demand security engineers,” according to the Finan-cial Times. With their global reach and vast stores of customer data, tMt companies are especially vulnerable to such breaches, but they can also help provide the solutions that will fortify their networks, protect their cus-tomers, and generate value and competitive advantage.
Cybersecurity is an important organizational issue.
Symantec’s acquisition of Blue Coat, for ex-ample, drove symantec’s share price from $17.30 prior to the announcement to nearly $20 within a week and to more than $21 with-in a month—a stark contrast to the sinking stock performance of many acquiring compa-nies. in this case, investors were betting on the improved long-term growth potential of the combined company, which enhances symantec’s security offering in the cloud.
tMt companies face several critical challeng-es related to cybersecurity:
• Talent. Companies need to develop strategies for building and retaining critical and scarce cybersecurity skills— by, for example, making acquisitions, hiring outside talent, training existing staff, partnering, and outsourcing.
• Vendor Ecosystems. Many products and services—a mobile base station, for example—are created using components from other companies. the security of an end product is only as strong as its weakest part.
• Culture. finally, cybersecurity is an important organizational issue. Compa-nies need to train their people to deal with these risks, and they have to build a culture and a mindset that are grounded in accountability, prevention, recognition, and responsiveness. (see “Cybersecurity
Meets it risk Management,” BCg article, september 2014.)
The following questions can help TMT com-panies assess their cybersecurity readiness:
• Do we have a structured approach to identifying, prioritizing, and mitigating cybersecurity risks?
• is our senior leadership team actively engaged in cybersecurity issues—not just as participants in meetings but as key decision makers and doers?
• how do we manage for both speed to market and security?
• how much of our revenues do we stand to lose as a result of brand damage if the company suffers a public data breach?
• how preventive are our cybersecurity systems? For example, are our employees able to recognize “phishing” attacks and prevent accidental disclosures of confiden-tial information?
The current imperative: Digital TransformationtMt companies must simultaneously man-age the low-growth cash flows of their legacy businesses and build businesses with explo-sive growth in new, unfamiliar areas.
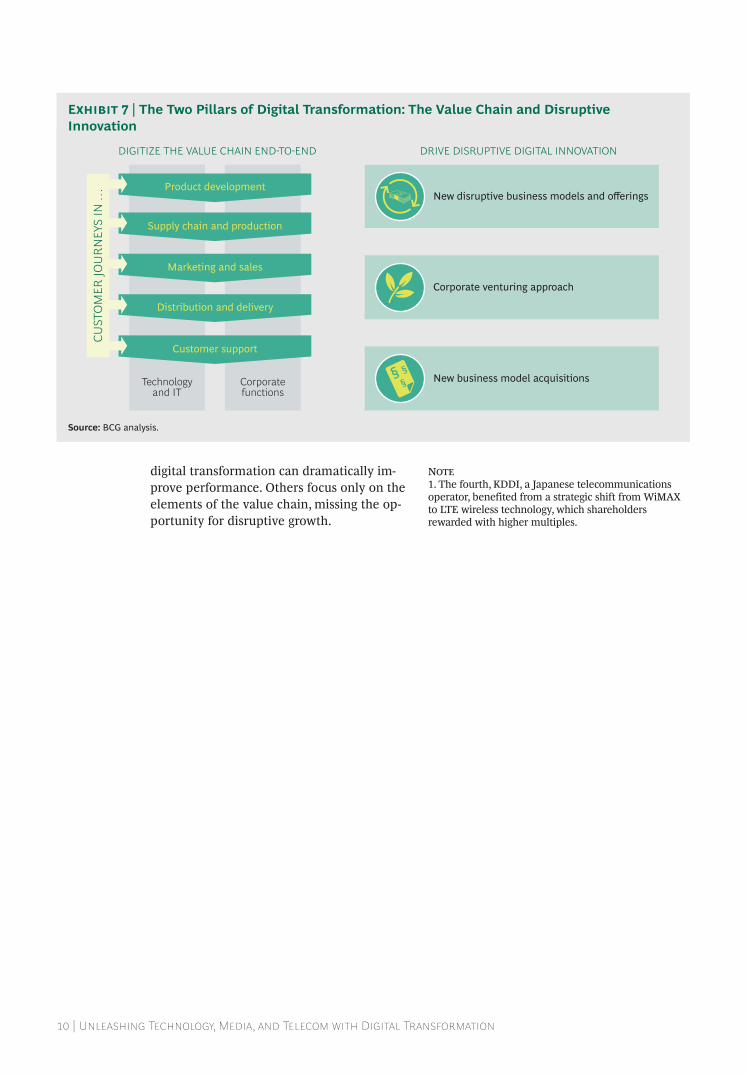
the best way for a company to do this is to engage in an end-to-end digital transforma- tion of its value chain while creating new and disruptive digital businesses. (see exhibit 7.) the end-to-end digital transformation will ge-nerate greater productivity and growth from the existing organization, and digital disrup- tion will create fresh growth. Both paths themselves will require the use of advanced digital tools.
this is not an either-or choice. some compa-nies err on the side of new digital businesses at the expense of digitizing their existing businesses. this is a mistake: legacy busi- nesses have valuable assets, such as brands and customers, that need to be nurtured, and
10 | Unleashing Technology, Media, and Telecom with Digital Transformation
digital transformation can dramatically im-prove performance. others focus only on the elements of the value chain, missing the op-portunity for disruptive growth.
Note1. The fourth, KDDI, a Japanese telecommunications operator, benefited from a strategic shift from WiMax to lte wireless technology, which shareholders rewarded with higher multiples.
Technologyand IT
Corporatefunctions
DIGITIZE THE VALUE CHAIN ENDTOEND DRIVE DISRUPTIVE DIGITAL INNOVATION
New disruptive business models and offeringsProduct development
Supply chain and production
Marketing and sales
Distribution and delivery
Customer support
Corporate venturing approach
New business model acquisitions
CUST
OM
ER JO
UR
NEY
S IN
…
Source: BCG analysis.
Exhibit 7 | The Two Pillars of Digital Transformation: The Value Chain and Disruptive Innovation
The Boston Consulting Group | 11
Five years is an eternity in the technology industry—the business world equivalent
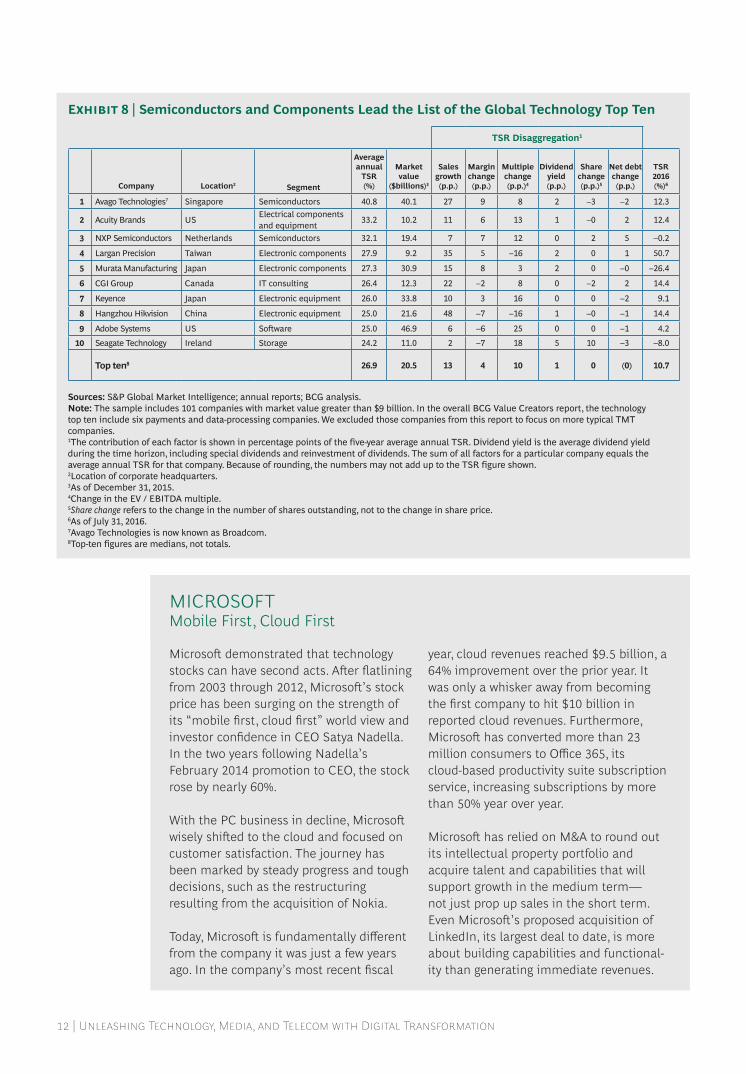
of a “dog year”—compared with other, less volatile and tumultuous industries. so it is a great accomplishment for a company in the industry to achieve a top-ten tsr ranking over five years (2011–2015) and an even greater achievement to do so in back-to-back five-year periods. Avago Technologies, now known as Broadcom, as well as acuity Brands, largan precision, and seagate technology did just that. All four were also top-ten finishers in the 2010–2014 rankings. (see exhibit 8.)
Several companies made smart moves into growth areas, such as IoT.
a five-year time frame obscures other impres-sive achievements of companies that have fundamentally changed their business trajec-tories. Microsoft, for example, did not break into the five-year top ten but recorded annual tsr exceeding 30% from 2013 through 2015 on the strength of a fundamental business model transformation. (see the sidebar “Microsoft: Mobile first, Cloud first.”)
likewise, after its stock fell sharply starting in mid-2014, Qualcomm generated sharehold-
er returns exceeding 40% from its lows in 2016. this spike reflects investor confidence in the recovery of Qualcomm’s core mobile business and its transformation, which will streamline costs and expand its business into growth areas such as iot and connect- ed cars.
Past Performance the top ten generated outsize sales growth and multiple expansion, and six of the ten squeezed out margin improvement, too. As we explore later in this chapter, several companies made smart moves into iot and other growth areas, improving both sales and multiples.
over the five years analyzed in this report, other factors were also at play. several com-panies benefited from the growth in connec-tivity. others relied on M&a for value cre-ation.
Smartphone and Connectivity Suppliers. from 2011 through 2015, revenues from smartphone sales grew by 27% annually, and technologies such as near-field communica-tions started to take off. Four of the top ten—avago technologies, nxp semiconduc-tors, largan precision, and Murata Manufac-turing—benefited from this growth by making the parts that enable connectivity and smartphone features.
riDing The waVes of innoVaTion in The
Technology inDUsTry
12 | Unleashing Technology, Media, and Telecom with Digital Transformation
Sources: S&P Global market intelligence; annual reports; BCG analysis.Note: The sample includes 101 companies with market value greater than $9 billion. in the overall BCG Value Creators report, the technology top ten include six payments and data-processing companies. We excluded those companies from this report to focus on more typical TmT companies. 1The contribution of each factor is shown in percentage points of the five-year average annual TSr. Dividend yield is the average dividend yield during the time horizon, including special dividends and reinvestment of dividends. The sum of all factors for a particular company equals the average annual TSr for that company. Because of rounding, the numbers may not add up to the TSr figure shown. 2location of corporate headquarters.3as of December 31, 2015.4Change in the eV / eBiTDa multiple.5Share change refers to the change in the number of shares outstanding, not to the change in share price.6as of July 31, 2016.7avago Technologies is now known as Broadcom.8Top-ten figures are medians, not totals.
Exhibit 8 | Semiconductors and Components Lead the List of the Global Technology Top Ten
Microsoft demonstrated that technology stocks can have second acts. After flatlining from 2003 through 2012, Microsoft’s stock price has been surging on the strength of its “mobile first, cloud first” world view and investor confidence in CEO Satya Nadella. In the two years following Nadella’s February 2014 promotion to CEO, the stock rose by nearly 60%.
With the PC business in decline, Microsoft wisely shifted to the cloud and focused on customer satisfaction. The journey has been marked by steady progress and tough decisions, such as the restructuring resulting from the acquisition of Nokia.
Today, Microsoft is fundamentally different from the company it was just a few years ago. In the company’s most recent fiscal
year, cloud revenues reached $9.5 billion, a 64% improvement over the prior year. It was only a whisker away from becoming the first company to hit $10 billion in reported cloud revenues. Furthermore, Microsoft has converted more than 23 million consumers to Office 365, its cloud-based productivity suite subscription service, increasing subscriptions by more than 50% year over year.
Microsoft has relied on M&A to round out its intellectual property portfolio and acquire talent and capabilities that will support growth in the medium term— not just prop up sales in the short term. Even Microsoft’s proposed acquisition of LinkedIn, its largest deal to date, is more about building capabilities and functional-ity than generating immediate revenues.
MICROSOFTMobile First, Cloud First
TSR Disaggregation1
Company Location2 Segment
Average annual
TSR
(%)
Market value
($billions)3
Sales growth (p.p.)
Margin change (p.p.)
Multiple change (p.p.)4
Dividend yield (p.p.)
Share change (p.p.)5
Net debt change (p.p.)
TSR2016 (%)6
1 avago Technologies7 Singapore Semiconductors 40.8 40.1 27 9 8 2 –3 –2 12.3
2 acuity Brands uS electrical components and equipment
33.2 10.2 11 6 13 1 –0 2 12.4
3 nXP Semiconductors netherlands Semiconductors 32.1 19.4 7 7 12 0 2 5 –0.2
4 largan Precision Taiwan electronic components 27.9 9.2 35 5 –16 2 0 1 50.7
5 murata manufacturing Japan electronic components 27.3 30.9 15 8 3 2 0 –0 –26.4
6 CGI Group Canada IT consulting 26.4 12.3 22 –2 8 0 –2 2 14.4
7 keyence Japan electronic equipment 26.0 33.8 10 3 16 0 0 –2 9.1
8 hangzhou hikvision China electronic equipment 25.0 21.6 48 –7 –16 1 –0 –1 14.4
9 adobe Systems uS Software 25.0 46.9 6 –6 25 0 0 –1 4.2
10 Seagate Technology ireland Storage 24.2 11.0 2 –7 18 5 10 –3 –8.0
Top ten8 26.9 20.5 13 4 10 1 0 (0) 10.7
The Boston Consulting Group | 13
the history of the technology industry shows that favorable tailwinds don’t last long. the challenge for these companies over the next five years will be to pivot into adjacent or new businesses as smartphone sales growth flattens.
Successful Strategic m&a. M&A often has a bad rap as an approach that destroys value. recently, however, investors have started to gain confidence in deal making. Indeed, several of the top technology value creators are showing that M&a can provide entry into new markets, sources of growth, and access to innovation and new talent pools.
• avago technologies’ meteoric growth was powered by organic growth, as well as serial acquisitions into areas such as optical chips, power amplifiers, and control networks and storage for data centers. in february 2016, the company bought Broadcom for $37 billion, assum-ing the acquired company’s name and entering new growth markets (network switches and also communication chips that are used in tablets and smartphones). at the time, the deal was the largest technology acquisition ever completed.
• Third-ranked NXP solidified its position in the auto industry with its 2015 acquisition of freescale for $11.8 billion. With its
emphasis on automated-driving features and the digital driving experience, the auto industry is clearly a hotspot for chip maker growth.
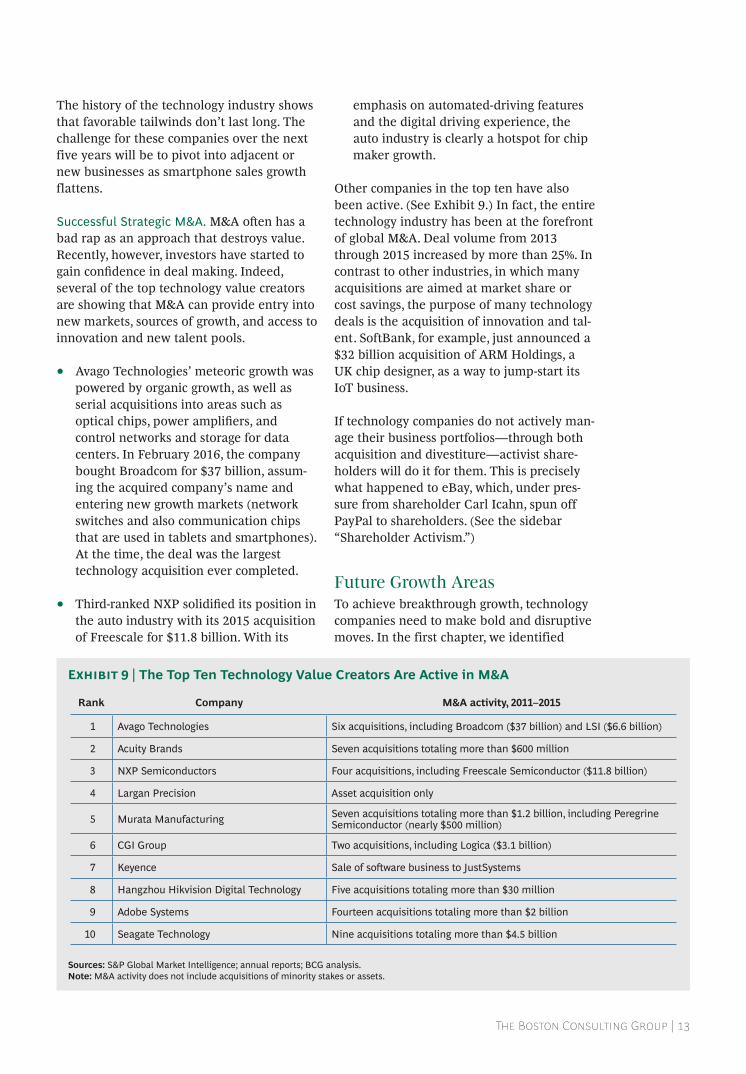
other companies in the top ten have also been active. (see exhibit 9.) in fact, the entire technology industry has been at the forefront of global M&a. Deal volume from 2013 through 2015 increased by more than 25%. in contrast to other industries, in which many acquisitions are aimed at market share or cost savings, the purpose of many technology deals is the acquisition of innovation and tal-ent. softBank, for example, just announced a $32 billion acquisition of ARM Holdings, a UK chip designer, as a way to jump-start its iot business.
if technology companies do not actively man-age their business portfolios—through both acquisition and divestiture—activist share-holders will do it for them. this is precisely what happened to eBay, which, under pres-sure from shareholder Carl icahn, spun off paypal to shareholders. (see the sidebar “shareholder activism.”)
future growth areasto achieve breakthrough growth, technology companies need to make bold and disruptive moves. in the first chapter, we identified
Sources: S&P Global market intelligence; annual reports; BCG analysis.Note: m&a activity does not include acquisitions of minority stakes or assets.
Exhibit 9 | The Top Ten Technology Value Creators Are Active in M&A
Rank Company M&A activity, 2011–2015
1 avago Technologies Six acquisitions, including Broadcom ($37 billion) and lSi ($6.6 billion)
2 acuity Brands Seven acquisitions totaling more than $600 million
3 nXP Semiconductors Four acquisitions, including Freescale Semiconductor ($11.8 billion)
4 largan Precision asset acquisition only
5 murata manufacturing Seven acquisitions totaling more than $1.2 billion, including Peregrine Semiconductor (nearly $500 million)
6 CGI Group Two acquisitions, including logica ($3.1 billion)
7 keyence Sale of software business to JustSystems
8 hangzhou hikvision Digital Technology Five acquisitions totaling more than $30 million
9 adobe Systems Fourteen acquisitions totaling more than $2 billion
10 Seagate Technology nine acquisitions totaling more than $4.5 billion
14 | Unleashing Technology, Media, and Telecom with Digital Transformation
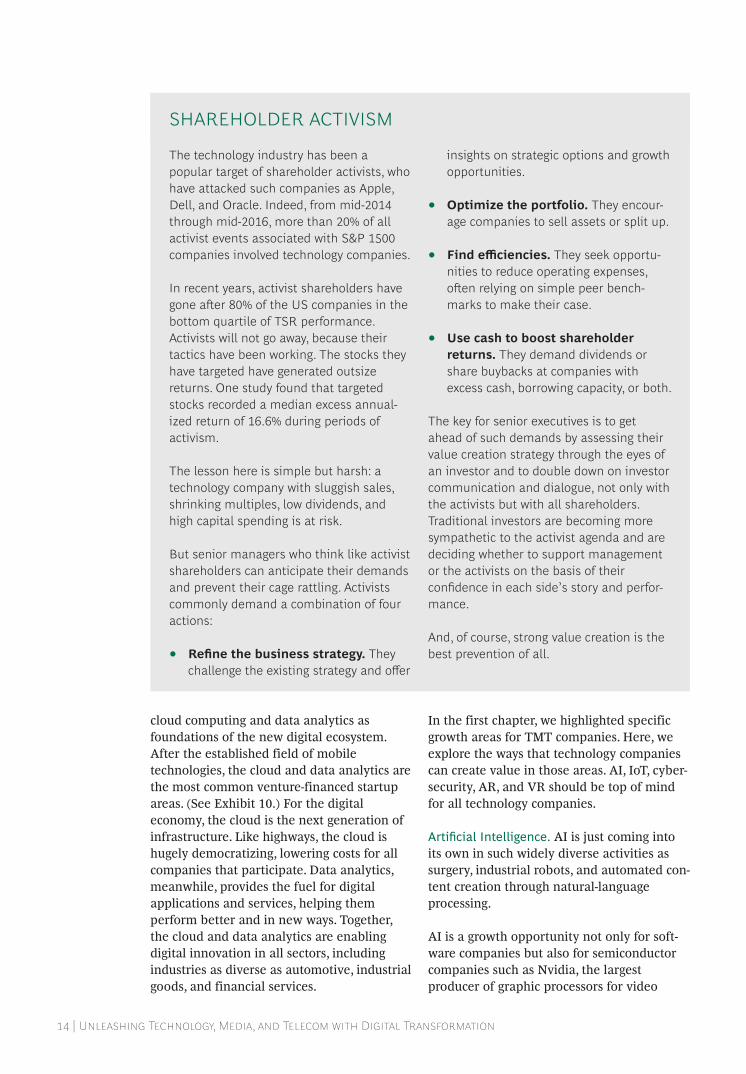
cloud computing and data analytics as foundations of the new digital ecosystem. after the established field of mobile technologies, the cloud and data analytics are the most common venture-financed startup areas. (see exhibit 10.) for the digital economy, the cloud is the next generation of infrastructure. like highways, the cloud is hugely democratizing, lowering costs for all companies that participate. Data analytics, meanwhile, provides the fuel for digital applications and services, helping them perform better and in new ways. together, the cloud and data analytics are enabling digital innovation in all sectors, including industries as diverse as automotive, industrial goods, and financial services.
in the first chapter, we highlighted specific growth areas for tMt companies. here, we explore the ways that technology companies can create value in those areas. ai, iot, cyber-security, ar, and Vr should be top of mind for all technology companies.
artificial intelligence. ai is just coming into its own in such widely diverse activities as surgery, industrial robots, and automated con-tent creation through natural-language processing.
ai is a growth opportunity not only for soft-ware companies but also for semiconductor companies such as nvidia, the largest producer of graphic processors for video
The technology industry has been a popular target of shareholder activists, who have attacked such companies as Apple, Dell, and Oracle. Indeed, from mid-2014 through mid-2016, more than 20% of all activist events associated with S&P 1500 companies involved technology companies.
In recent years, activist shareholders have gone after 80% of the US companies in the bottom quartile of TSR performance. Activists will not go away, because their tactics have been working. The stocks they have targeted have generated outsize returns. One study found that targeted stocks recorded a median excess annual-ized return of 16.6% during periods of activism.
The lesson here is simple but harsh: a technology company with sluggish sales, shrinking multiples, low dividends, and high capital spending is at risk.
But senior managers who think like activist shareholders can anticipate their demands and prevent their cage rattling. Activists commonly demand a combination of four actions:
• Refine the business strategy. They challenge the existing strategy and offer
insights on strategic options and growth opportunities.
• Optimize the portfolio. They encour-age companies to sell assets or split up.
• Find efficiencies. They seek opportu-nities to reduce operating expenses, often relying on simple peer bench-marks to make their case.
• Use cash to boost shareholder returns. They demand dividends or share buybacks at companies with excess cash, borrowing capacity, or both.
The key for senior executives is to get ahead of such demands by assessing their value creation strategy through the eyes of an investor and to double down on investor communication and dialogue, not only with the activists but with all shareholders. Traditional investors are becoming more sympathetic to the activist agenda and are deciding whether to support management or the activists on the basis of their confidence in each side’s story and perfor-mance.
And, of course, strong value creation is the best prevention of all.
ShArEhOldEr ACTIvISM
The Boston Consulting Group | 15
games. the ability of these processors to compute many tasks in parallel can significantly accelerate complex deep-learning applications. nvidia, whose stock has risen more than 30% annually since 2012, recently invested $2 billion in a new chip designed specifically for ai.
The internet of Things. IoT is here, offering immediate opportunities for technology companies to sell devices—and, more import-ant, services and software—to a wide range of companies and consumers. according to the 2016 Vodafone IoT Barometer, “28% of organizations already use iot. a further 35% are less than a year away from launch-ing their own projects, and more than three-quarters of businesses say that IoT will be ‘critical’ for the future success.”1
Cybersecurity. this poses both an opportuni-ty and a threat for technology companies. they are in a prime position to protect their customers—but only if they first fortify their own defenses. if people lose trust in the cloud or the protection of data, they will not adopt newer waves of innovation.
augmented reality and Virtual reality. a range of consumer and commercial ar
and VR products, such as Microsoft’s high- definition holographic headsets, are just now coming on line. While consumer applications such as pokémon go are receiving the most attention, the B2B sector is perhaps more commercially relevant in the short term. professional sports teams have begun to introduce Vr into training sessions, automak-ers are considering ways to improve the passenger experience, and the construction industry and architects are starting to rely on ar renderings to reduce errors in reading blueprints on the job site.
Transforming the Value chainthe success of technology companies de-pends not just on seizing these disruptive op-portunities but also on managing their exist-ing businesses for productivity and growth. With technology companies’ shift to services, digitally enabled value chains are critical to achieving better margins and sales growth.
it is not surprising that software companies have taken the lead in digitizing their value chains. as they move to the cloud, their mar-gins shrink, so their core business of writing code needs to be efficient. even at software companies, however, many other elements of
110
128
129
428
878
6,0004,0002,0000
Mobile technologies 5,877
3D printing
Drones andautonomous vehicles
Crypto-currency
IoT 1,434
Data analytics 3,838
Cloud 4,724
Robotics
Genetics
AI 1,226
KEY CLUSTERS OF THE STARTUP LANDSCAPE, 2015 NUMBER OF STARTUPS, BY TECHNOLOGY
Medical15%
Supply chain3%
Enterprise IT7%
Security2%
HR andeducation
5%
Communications4%
Components5%
Energy andenvironment
9%
Wellness2%
Health caremanagement
5%
E-commerceand retail
14%
Finance9%
Entertainment14%
Advertising9%
Sources: Quid; S&P Capital iQ; BCG analysis.Note: about 29,000 startups are shown. each dot represents a startup. Startups in similar businesses are grouped in clusters through sophisticated natural-language-processing techniques. Because of rounding, percentages do not total 100.
Exhibit 10 | The Cloud and Data Analytics Are Popular Venture-Financed Startup Areas
16 | Unleashing Technology, Media, and Telecom with Digital Transformation
the value chain, such as sales and customer service, are not yet on the cutting edge. in fact, technology companies need to innovate all elements of their value chain:
• Product Development. ar and Vr collectively provide possibilities for device companies to engage in advanced market research. rather than building prototypes, companies can give consumers Vr head- sets that will allow them to envision a product. ar and Vr can also be combined with 3D printing and CAD software to accelerate prototyping. in the cloud, blockchain could prove to be a massive source of disruption and growth.
• Supply Chain and Production. Compa-nies now have an unparalleled opportuni-ty to rebuild core logistical and produc- tion processes, leveraging ar, Vr, and self-learning robots, for example.
Technology companies need to innovate all elements of their value chain.
• Marketing and Sales. Just as the retail and banking sectors have embraced connected channel strategies, technology companies must also shed old-school sales models. Companies can drive personal-ized digital engagement, create frictionless transactions, and build data-driven sales and marketing tools. Companies such as Microsoft and Cisco are moving in this direction.
• Distribution and Delivery. the move to subscription services and away from one-time purchases is in full swing at many companies. (adobe’s Creative Cloud is described on the next page.) Companies are changing not only their pricing but also their product release schedules and partnership and ecosystem strategies. in a cloud-based world, software must inte-grate with other services and work seamlessly across laptops, handsets, tablets, and even wristwatches.
• Customer Support. technology compa-nies need to provide sophisticated custom-er support options that take advantage of data analytics and ai. these preemptively solve potential problems, and they enable frictionless, fully aware, and efficient interactions.
More broadly, two of the most prevalent transformations in the technology industry are those that involve hardware to software and software to software-as-a-service (saas).
hardware to Software Transformation. this is not a new story—we titled the 2013 edition of this report The Great Software Transforma-tion: How to Win as Technology Changes the World—but it remains highly relevant for hardware companies that aim to create greater value for themselves and their customers. iBM, for example, increased the share of its revenues from software sales and licensing from 14% in 2000 to 28% in 2015 and increased margins from 12% to 22% in the same time frame.
Compared with hardware, software offers greater flexibility, ease of customization, and ability to upgrade. one reason why nvidia enjoys a 76% share of the market for graphic processing units is that its investments in software development allow it to frequently release new drivers and updates geared to-ward specific games and apps, catering to the needs of ai and game developers.
the transition, however, is not easy. in the software industry, the barriers to entry are low, so market shares can shift dramatically. in addition, a hardware to software transfor-mation has profound implications across the entire value chain.
Companies that have made the transition em-brace agile software development, create new sales and support approaches, and modify their talent requirements and partner rela- tionships. these companies recognize how software, data, and connectivity can create value for specific customer segments, because they understand their customers’ experien-ces, pain points, and needs. finally, they use metrics appropriate for software businesses to measure success and enable growth.
The Boston Consulting Group | 17
Software to Software-as-a-Service Transforma-tion. saas is both a blessing and a curse for traditional software companies. The SaaS market is growing at nine times the speed of the broader software market. Despite their lower margins, pure-play saas companies generally have higher multiples than their more traditional competitors. at the same time, the SaaS model requires radically different engineering, marketing, and selling skills.
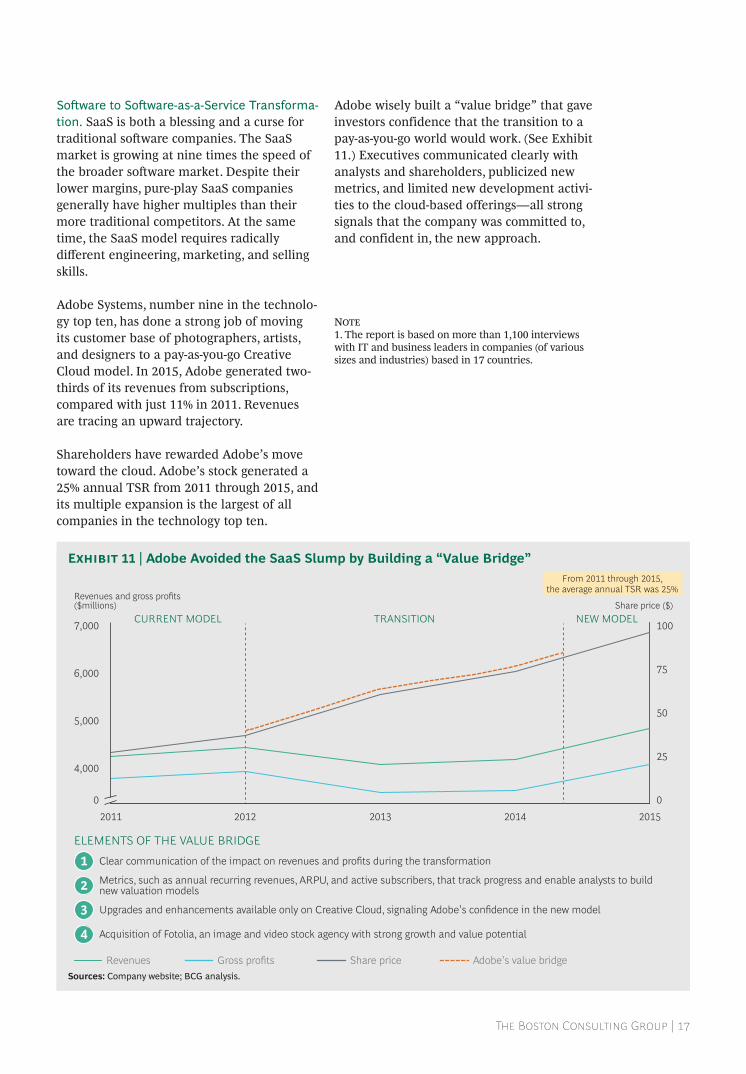
adobe systems, number nine in the technolo-gy top ten, has done a strong job of moving its customer base of photographers, artists, and designers to a pay-as-you-go Creative Cloud model. in 2015, adobe generated two-thirds of its revenues from subscriptions, compared with just 11% in 2011. revenues are tracing an upward trajectory.
shareholders have rewarded adobe’s move toward the cloud. adobe’s stock generated a 25% annual tsr from 2011 through 2015, and its multiple expansion is the largest of all companies in the technology top ten.
adobe wisely built a “value bridge” that gave investors confidence that the transition to a pay-as-you-go world would work. (see exhibit 11.) executives communicated clearly with analysts and shareholders, publicized new metrics, and limited new development activi-ties to the cloud-based offerings—all strong signals that the company was committed to, and confident in, the new approach.
Note1. the report is based on more than 1,100 interviews with it and business leaders in companies (of various sizes and industries) based in 17 countries.
2011 2012 2013 2014 20150
25
50
75
100
0
4,000
7,000
6,000
5,000
TRANSITIONCURRENT MODEL NEW MODEL
Revenues and gross profits($millions) Share price ($)
From 2011 through 2015,the average annual TSR was 25%
Adobe’s value bridge
ELEMENTS OF THE VALUE BRIDGE
1
2
3
4
Revenues Gross profits Share price
Metrics, such as annual recurring revenues, ARPU, and active subscribers, that track progress and enable analysts to buildnew valuation models
Clear communication of the impact on revenues and profits during the transformation
Upgrades and enhancements available only on Creative Cloud, signaling Adobe’s confidence in the new model
Acquisition of Fotolia, an image and video stock agency with strong growth and value potential
Sources: Company website; BCG analysis.
Exhibit 11 | Adobe Avoided the SaaS Slump by Building a “Value Bridge”
18 | Unleashing Technology, Media, and Telecom with Digital Transformation
MeDia’s fUTUreReInVenT OR FaIl
Value creation in the media industry depends on one’s perspective. in China,
small-cap companies are the shooting stars, feeding that nation’s appetite for online activ-ities and entertainment. at the same time, the us internet giants are driving massive value creation. in the traditional media space, however, companies are addressing declines in their legacy businesses and the need for transformation with varying levels of urgency.
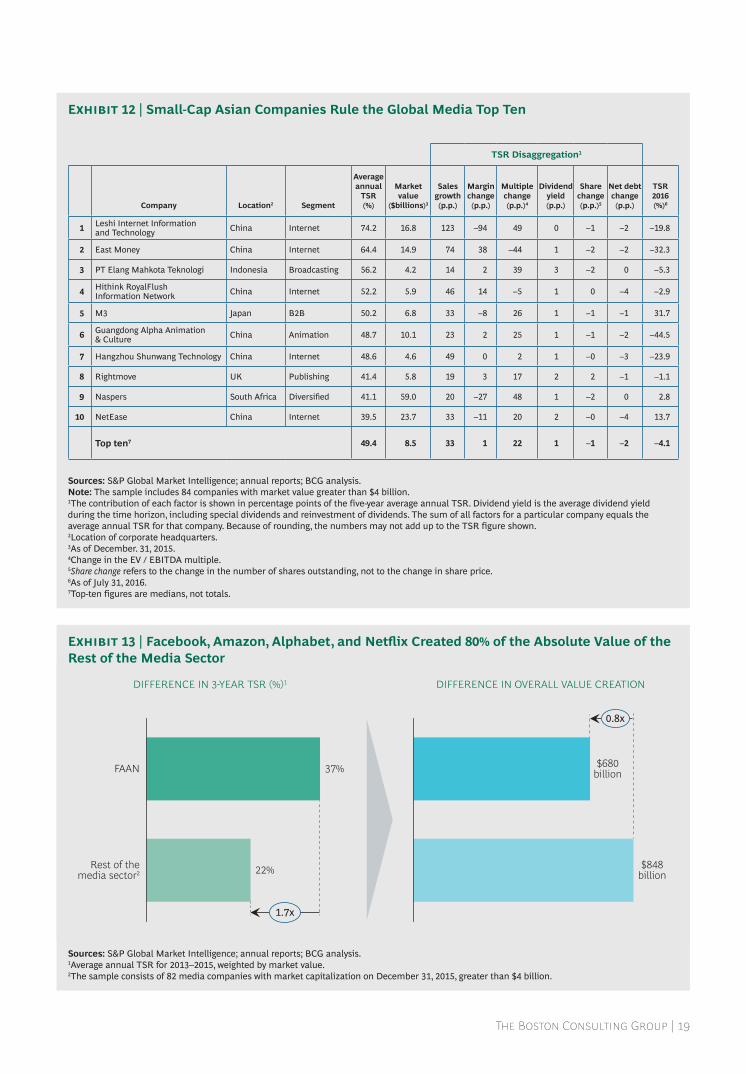
Value creation in the Media industryChinese companies hold six of the top ten spots in the media industry’s league table for the pe-riod from 2011 through 2015. (see exhibit 12.) these predominantly small-cap stocks have benefited from the rapid rise in online penetra-tion, mobile usage, and consumer adoption. number one, leshi internet information and technology, has aggressively expanded into on-line content, applications, and devices, launch-ing a brand of fast-selling smartphones in 2015. number two, east Money, and number four, hithink royalflush information network, pro-viders of online financial and trading informa-tion, have profited from the growth of the mid-dle class and investor sophistication. for seven of the top ten companies, sales growth was the largest contributor to tsr.
these winners are at the tail end of the easy-growth era for Chinese internet companies.
Companies such as tencent and Baidu have generated tremendous shareholder value, but, as growth in internet penetration and mobile phone sales slows, they all need a new playbook.
large-Cap leaders. Despite the success of these smaller asian companies, the epicenter of fundamental and disruptive value creation has been internet companies in mature markets. the four so-called faan stocks (Facebook, Amazon, Alphabet, and Netflix) collectively generated nearly 1.7 times the tsr of the 82 other media companies in our sample and created nearly as much absolute value.1 (see exhibit 13.)
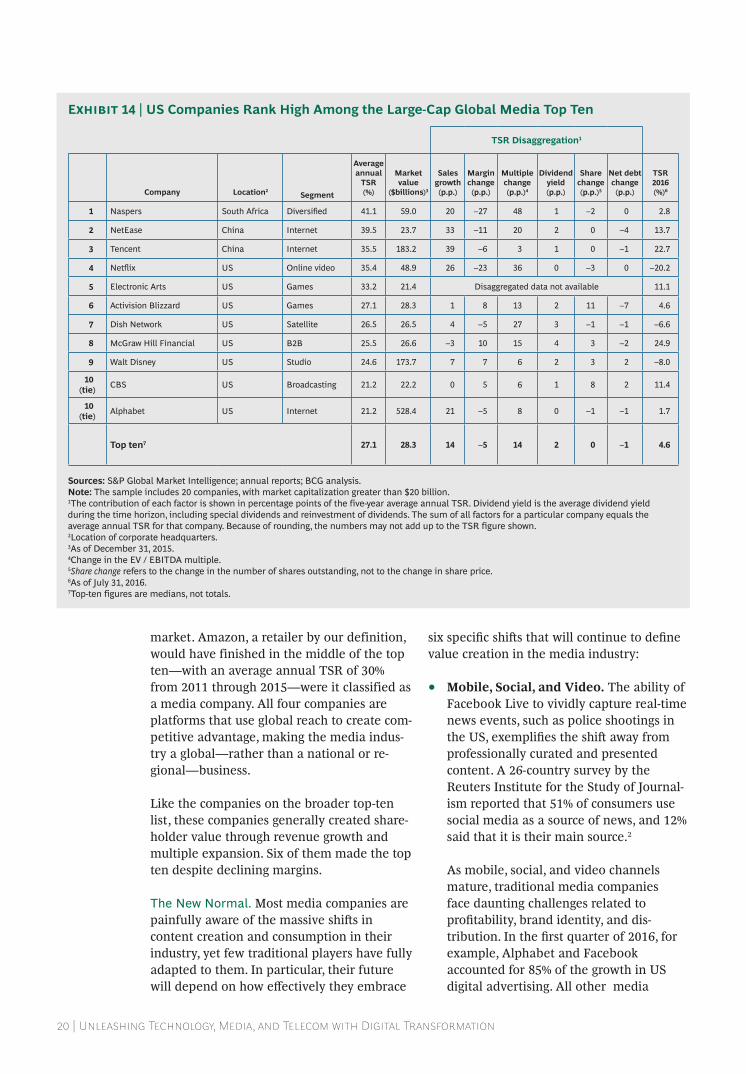
in order to highlight the performance of larger media companies, we created a second league table consisting of companies with market capitalization of at least $20 billion. (see ex-hibit 14.) among large-cap companies, the per-formance of the faan stocks stands out.
number four, netflix, exemplifies the over-the-top (ott) services that bring content di-rectly to consumers, bypassing the broadcast-ing and cable gatekeepers. tied for number ten, google’s parent, alphabet, has mastered automated advertising built around search terms. along with facebook, an honorary member of this top-ten group by virtue of its three-year tsr of nearly 60%, alphabet es-sentially owns the us mobile advertising
The Boston Consulting Group | 19
1.7x
Rest of themedia sector2
FAAN
22%
37% $680billion
0.8x
$848billion
DIFFERENCE IN 3YEAR TSR %1 DIFFERENCE IN OVERALL VALUE CREATION
Exhibit 12 | Small-Cap Asian Companies Rule the Global Media Top Ten
Exhibit 13 | Facebook, Amazon, Alphabet, and Netflix Created 80% of the Absolute Value of the Rest of the Media Sector
Sources: S&P Global market intelligence; annual reports; BCG analysis.Note: The sample includes 84 companies with market value greater than $4 billion.1The contribution of each factor is shown in percentage points of the five-year average annual TSr. Dividend yield is the average dividend yield during the time horizon, including special dividends and reinvestment of dividends. The sum of all factors for a particular company equals the average annual TSr for that company. Because of rounding, the numbers may not add up to the TSr figure shown. 2location of corporate headquarters.3as of December. 31, 2015. 4Change in the eV / eBiTDa multiple.5Share change refers to the change in the number of shares outstanding, not to the change in share price.6as of July 31, 2016.7Top-ten figures are medians, not totals.
Sources: S&P Global market intelligence; annual reports; BCG analysis.1average annual TSr for 2013–2015, weighted by market value. 2The sample consists of 82 media companies with market capitalization on December 31, 2015, greater than $4 billion.
TSR Disaggregation1
Company Location2 Segment
Average annual
TSR
(%)
Market value
($billions)3
Sales growth (p.p.)
Margin change (p.p.)
Multiple change (p.p.)4
Dividend yield (p.p.)
Share change (p.p.)5
Net debt change (p.p.)
TSR2016 (%)6
1 leshi internet information and Technology China Internet 74.2 16.8 123 –94 49 0 –1 –2 –19.8
2 east money China Internet 64.4 14.9 74 38 –44 1 –2 –2 –32.3
3 PT elang mahkota Teknologi indonesia Broadcasting 56.2 4.2 14 2 39 3 –2 0 –5.3
4 hithink royalFlush information network China Internet 52.2 5.9 46 14 –5 1 0 –4 –2.9
5 m3 Japan B2B 50.2 6.8 33 –8 26 1 –1 –1 31.7
6 Guangdong alpha animation & Culture China animation 48.7 10.1 23 2 25 1 –1 –2 –44.5
7 hangzhou Shunwang Technology China Internet 48.6 4.6 49 0 2 1 –0 –3 –23.9
8 rightmove uk Publishing 41.4 5.8 19 3 17 2 2 –1 –1.1
9 naspers South africa Diversified 41.1 59.0 20 –27 48 1 –2 0 2.8
10 netease China Internet 39.5 23.7 33 –11 20 2 –0 –4 13.7
Top ten7 49.4 8.5 33 1 22 1 –1 –2 –4.1
20 | Unleashing Technology, Media, and Telecom with Digital Transformation
market. amazon, a retailer by our definition, would have finished in the middle of the top ten—with an average annual tsr of 30% from 2011 through 2015—were it classified as a media company. all four companies are platforms that use global reach to create com-petitive advantage, making the media indus-try a global—rather than a national or re-gional—business.
like the companies on the broader top-ten list, these companies generally created share-holder value through revenue growth and multiple expansion. six of them made the top ten despite declining margins.
The new normal. Most media companies are painfully aware of the massive shifts in content creation and consumption in their industry, yet few traditional players have fully adapted to them. in particular, their future will depend on how effectively they embrace
six specific shifts that will continue to define value creation in the media industry:
• Mobile, Social, and Video. the ability of facebook live to vividly capture real-time news events, such as police shootings in the US, exemplifies the shift away from professionally curated and presented content. a 26-country survey by the reuters institute for the study of Journal-ism reported that 51% of consumers use social media as a source of news, and 12% said that it is their main source.2
as mobile, social, and video channels mature, traditional media companies face daunting challenges related to profitability, brand identity, and dis-tribution. In the first quarter of 2016, for example, alphabet and facebook accounted for 85% of the growth in us digital advertising. all other media
Exhibit 14 | US Companies Rank High Among the Large-Cap Global Media Top Ten
Sources: S&P Global market intelligence; annual reports; BCG analysis.Note: The sample includes 20 companies, with market capitalization greater than $20 billion.1The contribution of each factor is shown in percentage points of the five-year average annual TSr. Dividend yield is the average dividend yield during the time horizon, including special dividends and reinvestment of dividends. The sum of all factors for a particular company equals the average annual TSr for that company. Because of rounding, the numbers may not add up to the TSr figure shown. 2location of corporate headquarters.3as of December 31, 2015. 4Change in the eV / eBiTDa multiple.5Share change refers to the change in the number of shares outstanding, not to the change in share price.6as of July 31, 2016.7Top-ten figures are medians, not totals.
TSR Disaggregation1
Company Location2Segment
Average annual
TSR
(%)
Market value
($billions)3
Sales growth (p.p.)
Margin change (p.p.)
Multiple change (p.p.)4
Dividend yield (p.p.)
Share change (p.p.)5
Net debt change (p.p.)
TSR2016 (%)6
1 naspers South africa Diversified 41.1 59.0 20 –27 48 1 –2 0 2.8
2 netease China Internet 39.5 23.7 33 –11 20 2 0 –4 13.7
3 Tencent China Internet 35.5 183.2 39 –6 3 1 0 –1 22.7
4 netflix uS Online video 35.4 48.9 26 –23 36 0 –3 0 –20.2
5 electronic arts uS Games 33.2 21.4 Disaggregated data not available 11.1
6 activision Blizzard uS Games 27.1 28.3 1 8 13 2 11 –7 4.6
7 Dish network uS Satellite 26.5 26.5 4 –5 27 3 –1 –1 –6.6
8 mcGraw hill Financial uS B2B 25.5 26.6 –3 10 15 4 3 –2 24.9
9 Walt Disney uS Studio 24.6 173.7 7 7 6 2 3 2 –8.0
10 (tie) CBS uS Broadcasting 21.2 22.2 0 5 6 1 8 2 11.4
10 (tie) alphabet uS Internet 21.2 528.4 21 –5 8 0 –1 –1 1.7
Top ten7 27.1 28.3 14 –5 14 2 0 –1 4.6
The Boston Consulting Group | 21
companies are fighting for the remaining 15% of revenues and mind share.
traditional media companies must also learn how to create small-format, short-form, mobile-friendly content for consum-ers whose first phone was a smartphone and whose first television experience was not in the family living room. traditional tV viewership is down, but, for example, online users streamed 1.86 billion min-utes of nBC’s rio olympic games cover-age—more than the combined streaming of all previous games.
in this new era, traditional media companies must manage distribution channels that they own and operate along with distributed platforms such as facebook and even instant-messaging platforms. in the us and China, snapchat and WeChat, respectively, have become major content channels. traditional media companies that fail to figure out how to work with them will not achieve the necessary levels of reach, engagement, and brand awareness.
• Generational Shifts. in the good old days of cathode-ray-tube televisions and rotary-dial telephones, media companies could comfortably address an under-30 age segment with reasonable confidence that these consumers shared common viewing, reading, and listening habits. those days are gone. Many 30-year-olds are surprised at how out of touch they feel with younger consumers (let’s say, 18- to 24-year-olds), who grew up with smart-phones and find Facebook stodgy. The surging popularity of snapchat in this age group underlines how important it is for traditional media companies and even “older” platform companies, such as facebook, to be responsive.
• Live Events. the popularity of streaming the rio olympics demonstrates that live events continue to create and engage huge audiences. it’s no wonder that the com-bined cost of broadcasting the big-five european football leagues has tripled since 2010 or that the annual cost to broadcast national football league games
in the us more than doubled in the last auction in 2014. Broadcasters already face competition from telecom operators for these rights. In the UK, BT Group has the rights to premier league matches. it would not be surprising to see one or more of the global platform companies bid for these rights in the future.
• Personalization. facebook, google, and other digitally native companies are ex- tremely sophisticated in tailoring advertis-ing, marketing, and content to individuals. their wealth of user data gives them the ability to understand and address consum-er preferences much more effectively than most legacy companies. furthermore, many traditional companies do not have direct relationships with their customers. and even those that do lack such a trove of data. one short-term advantage of trad- itional media companies is their ability to sell advertisers “context.” advertisers know exactly where their ads will be seen.
The shift to OTT services is radically changing the environment.
• Over-the-Top Services. The shift to OTT services, especially among the young, is radically changing the environment. Most of the focus has been on the effect that cord cutting will have on cable operators. But broadcasters also lose their ability to build momentum and audience for new shows through programming and schedul-ing. Meanwhile, binge watching and short-season series such as hBo’s eight-episode The Night Of are redefining the customer experience.
these trends are likely to accelerate as the generation that grew up on smartphones and tablets enters adulthood. in response, media companies have created “skinny packages”—slimmed-down offerings of popular programming. in the us, for example, CBs, which shared the number ten spot among large-cap media compa-
22 | Unleashing Technology, Media, and Telecom with Digital Transformation
nies, streams shows and live TV for a flat monthly fee. not only do these packages appeal to cost-conscious consumers, but, for the first time, they also allow broad-casters to create a direct relationship with their customers and restore their curatori-al powers.
• Data Analytics. Digital attackers such as Netflix and Spotify have long used data analytics to influence programming, playlists, recommendations, and other curatorial decisions. But the pace of disruption is accelerating. for example, Affectiva is helping companies create more compelling advertising and commercial messages, using in-device video cameras to analyze facial expressions of emotion. “a machine will win a Pulitzer one day,” Kris hammond, the chief scientist of narrative science, a “natural language generation” company, told the Guardian earlier this year. “We can tell the stories hidden in data.”
rewriting the futureMedia companies have been transforming—or not transforming and failing—for up to two decades. But there is more to do. here is what it takes.
a Cultural Shift. the core strength of media companies is storytelling. Media companies still know how to tell stories more successful-ly than most technology companies. But almost everything else about media compa-nies needs to change.
the success of digital transformation ulti-mately rests with people and leaders: the willingness of current staff to embrace change and of executives to integrate fresh blood and insight into the organization.
the winning culture values speed, experi-mentation, calculated risk taking, adaptation, and learning from failure. the winners un-derstand how to track, measure, and improve consumer engagement; develop content for mobile and even virtual channels; and create new distribution capabilities.
regional players may need to go global or play outside their comfort zone. (see the sidebar “axel springer goes Digital” for an example of a regional media company that is undergoing a global and cultural transformation.)
end-to-end Value Chain Transformation. in today’s era of platforms, high-quality content
Few traditional print publishers have made the transition to digital as success-fully as Axel Springer, Germany’s largest newspaper publisher. With circulation and ad revenues of the print business declin-ing, Axel Springer placed bets on online content, online classified and marketplac-es, and digital marketing. The publisher, for example, bought Business Insider, a US online news outlet, and eMarketer, a media analytics firm, and acquired minori-ty stakes in Thrillist Media, a lifestyle digital outlet for millennials, and in Airbnb. To help pay for these acquisi- tions, the company sold off regional newspapers and magazines and re- structured. Also, it has relied on predic- tive analytics to control costs and manage sales risk.
The digital portion of Axel Springer’s revenues climbed to 62% in 2015, and its stock price has risen by around 40% since 2013.
Culturally, Axel Springer has eliminated the operational distinction between digital and print and encouraged executives to take more risks—and be willing to fail. In 2012, Mathias Döpfner, chief executive, sent three senior executives to live in Silicon Valley for nine months to learn from its startup culture.
AxEl SPrINGEr GOES dIGITAl
The Boston Consulting Group | 23
remains important, but the entire value chain matters more than ever. Media executives, however, tend not to speak about value chains. in the newspaper business, it has long been understood that editorial “did its own thing” while the business side managed revenues. a similar divide has existed in movie studios, broadcasters, and other creative companies. this separation prevents organizations from working closely together.
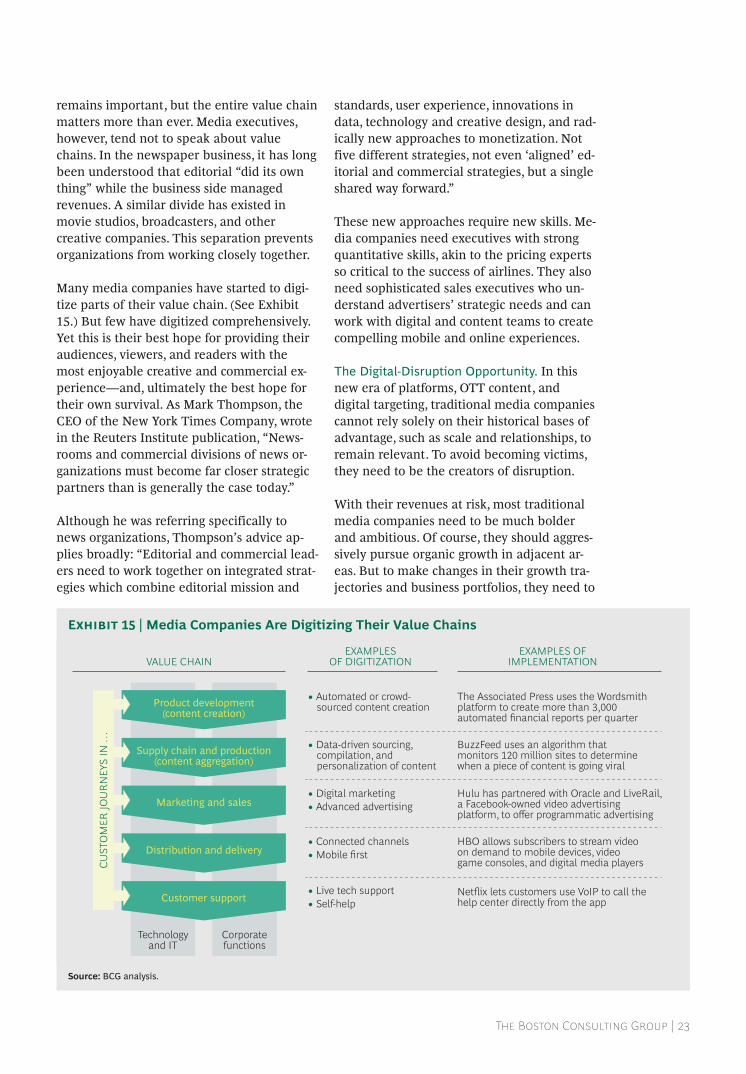
Many media companies have started to digi-tize parts of their value chain. (see exhibit 15.) But few have digitized comprehensively. yet this is their best hope for providing their audiences, viewers, and readers with the most enjoyable creative and commercial ex-perience—and, ultimately the best hope for their own survival. as Mark thompson, the Ceo of the new york times Company, wrote in the reuters institute publication, “news-rooms and commercial divisions of news or-ganizations must become far closer strategic partners than is generally the case today.”
although he was referring specifically to news organizations, thompson’s advice ap-plies broadly: “editorial and commercial lead-ers need to work together on integrated strat-egies which combine editorial mission and
standards, user experience, innovations in data, technology and creative design, and rad-ically new approaches to monetization. not five different strategies, not even ‘aligned’ ed-itorial and commercial strategies, but a single shared way forward.”
These new approaches require new skills. Me-dia companies need executives with strong quantitative skills, akin to the pricing experts so critical to the success of airlines. they also need sophisticated sales executives who un-derstand advertisers’ strategic needs and can work with digital and content teams to create compelling mobile and online experiences.
The Digital-Disruption Opportunity. in this new era of platforms, ott content, and digital targeting, traditional media companies cannot rely solely on their historical bases of advantage, such as scale and relationships, to remain relevant. to avoid becoming victims, they need to be the creators of disruption.
With their revenues at risk, most traditional media companies need to be much bolder and ambitious. of course, they should aggres-sively pursue organic growth in adjacent ar-eas. But to make changes in their growth tra-jectories and business portfolios, they need to
• Automated or crowd-sourced content creation
The Associated Press uses the Wordsmith platform to create more than 3,000 automated financial reports per quarter
BuzzFeed uses an algorithm that monitors 120 million sites to determine when a piece of content is going viral
Hulu has partnered with Oracle and LiveRail, a Facebook-owned video advertising platform, to offer programmatic advertising
HBO allows subscribers to stream video on demand to mobile devices, video game consoles, and digital media players
Netflix lets customers use VoIP to call the help center directly from the app
• Data-driven sourcing, compilation, and personalization of content
• Digital marketing• Advanced advertising
• Connected channels• Mobile first
• Live tech support• Self-help
VALUE CHAINEXAMPLES
OF DIGITIZATIONEXAMPLES OF
IMPLEMENTATION
Technologyand IT
Corporatefunctions
Product development(content creation)
Supply chain and production(content aggregation)
Marketing and sales
Distribution and delivery
Customer support
CUST
OM
ER JO
UR
NEY
S IN
…
Exhibit 15 | Media Companies Are Digitizing Their Value Chains
Source: BCG analysis.
24 | Unleashing Technology, Media, and Telecom with Digital Transformation
engage in M&a, partnering, and other exter-nal moves that integrate them into a wider innovation ecosystem. in video, for example, new studios such as new form Digital and all Def Digital are creating online stories that resonate with younger generations and niche audiences.
as the incumbent social media player, face-book has not taken its perch for granted. it has expanded into hot areas by acquiring instagram, Whatsapp, and oculus. Mean-while, the flash popularity of pokémon go suggests the existence of pent-up demand for ar and Vr.
amazon has more than 1,000 people working on its alexa and echo voice-enabled ecosys-tems. It acquired Twitch, an online social vid-eo channel for game players. facebook is building Deeptext, an ai-based technology that can understand the intended meaning of a user’s post—not just recognize keywords—and can make recommendations or take ac-tions as a result. google’s commitment to ai, for example with its acquisition of DeepMind technologies, is well-known. few traditional media companies have made similar bold moves into these fields.
it’s too early to tell how these developments will affect the business models of traditional media companies. But these companies have already proved that they know how to disrupt the media industry. Media executives need to counterpunch with something radical and far-reaching.
This is a high-stakes assignment. tradi-tional media companies are competing
against digital attackers that are focused on user growth first and monetization later—a strategy that investors tend to reward. Most traditional media companies, however, are evaluated on the basis of their cash flow. they don’t get credit for expanding their user base unless that also brings in cash. even
when they build new businesses, a dollar of digital revenues is not equivalent to a dollar of analog revenues. Margins are lower even if multiples are higher. Most digital revenues are from advertising rather than recurring subscriptions or revenue streams such as re-transmission fees. therefore, in addition to preserving legacy cash flows through cost cut-ting and building new businesses, executives need to create carefully crafted portfolio, tsr, and investor relations strategies. they need to tell a better story about their reinven-tion. (see “Creating shareholder Value at Me-dia Companies,” BCg article, october 2012.)
some companies get the challenge. early on, south africa’s naspers recognized that its print business was lagging behind, so it bought stakes in digital companies—such as tencent in China and Mail.ru in russia—and expanded into pay television. in the us, gan-nett split its publishing and broadcast assets into separate companies, providing focus and investor transparency.
it’s too early to declare winners. But the los-ers will certainly be those companies that treat reinvention as an option rather than an imperative.
Notes1. the index was originally known as fang—facebook, amazon, netflix, and google—before google changed its name to alphabet. amazon is classified as a retail stock but could just as easily be a technology stock on the basis of its cloud business, or a media stock because of its streaming-video service. facebook was ineligible for ranking because it had not been public for the full five years under analysis. 2. reuters institute for the study of Journalism. Reuters Institute Digital News Report 2016.
The Boston Consulting Group | 25
Two paradoxes surround value creation in the telecommunications
industry. first, value is generally migrating toward the top of the stack where content and communities reside (think Netflix and Facebook). But companies such as Netflix depend on broadband and mobile connectivi-ty and, therefore, on operators that have the financial resources to expand their networks.
the connectivity of the entire stack, in other words, depends on the health of telecommu-nications operators. and operators continue to face regulatory scrutiny, especially in eu-rope, as well as pricing pressure everywhere and challenges relating to network modern-ization and the overall customer experience.
Mobile-only operators are struggling to create value.
second, the world is going mobile, but mobile-only operators are struggling to create value. for example, in the five-year period from 2007 through 2011, the top three value creators (and four of the top five) in the in-dustry were mobile. But most recently, from 2011 through 2015, only one mobile-only op-erator broke into the top ten—at ninth place.
it’s not going to get easier. the mobile up-grade costs of integrated operators are sub-stantially lower than those of mobile-only op-erators, which, in many cases, must lay new backhaul fiber to accommodate the higher bandwidth.
the resolution of the second paradox is easi-er than the first. for the foreseeable future, we will live in a hybrid fixed-mobile world, and operators that serve the highly competi-tive mobile-only side must find ways to offer fixed services, or they will suffer. this ex-plains why, from 2011 through 2015, the cable industry and integrated operators outper-formed their mobile-only peers.1 (and it’s not just mobile operators that are underperform-ing but also the companies that lease towers and other mobile infrastructure to operators. Quite recently—in our 2008–2012 ranking—three of these companies were in the top ten in telecommunications value creation. how-ever, none of them is in the top ten this year.)
finding a value-creating way through the first paradox is more demanding. how can opera-tors prevent all the value in the stack from being sucked upward to companies that ride on their infrastructure? In markets where reg-ulation is restraining investment, operators need to seek relief. (see the sidebar “the im-portance of regulation.”) But that will not be enough. they also need to fundamentally dig-itize their networks to remain cost-effective
The ParaDoxes of TelecoM ValUe
creaTion

26 | Unleashing Technology, Media, and Telecom with Digital Transformation
and to build platforms on which they can cre-ate new growth businesses.
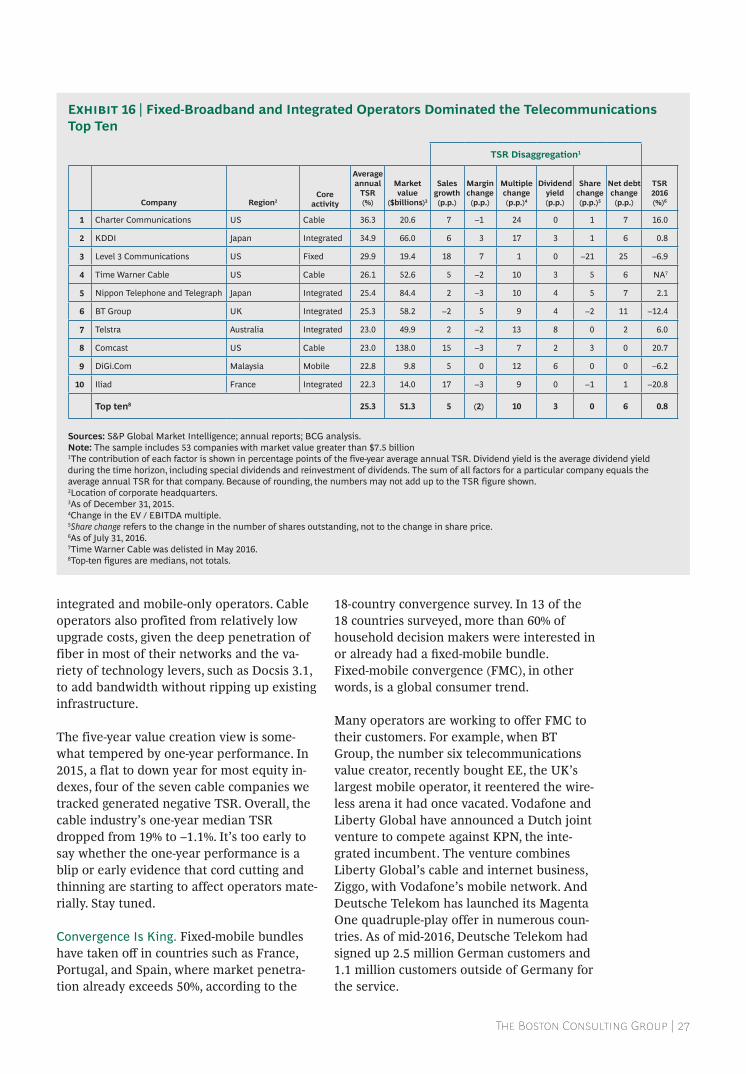
how Value was createdthe median of the top ten performers’ aver-age annual tsr from 2011 through 2015 was 25%. (see exhibit 16.) Multiple expansion was the largest driver of tsr—a sign that inves-tors support companies’ strategic and opera-tional moves. But this occurred in a low- interest-rate environment. if rates rise, many operators will have a more difficult time boosting tsr through multiple expansion.
Margins of six of the top ten declined over the five-year period, and sales growth contrib-uted 5 of the 25 percentage points of average annual tsr.
Dividends contributed just 3 percentage points to average annual tsr. this suggests that the best telecommunications operators have discovered how to create value in ways other than simply returning cash to share-holders, which was a popular default strategy in the industry not so long ago. in the 2008–2012 period, dividends underpinned one-third of the top ten’s 16.1% annual tsr.
Speed, Speed, Speed. in a survey of consum-ers in 18 countries, high fixed download speeds ranked as the most important fixed-mobile feature in 11 countries and among the top three in 16 countries. in particular, cable companies benefited from this insatiable demand for fixed-broadband speed. the industry’s five-year annual tsr was 19.1% compared with 10.6% for both
Even within restrictive regulatory environ-ments, operators can outperform their peers. So regulation should not be an excuse that operators use to avoid making all the strategic and operational moves at their disposal.
Still, the regulatory environment does matter. Europe and South America general-ly are playing catchup with North America and Asia in creating a digital market that will facilitate commercial activity. (See Five Priorities for Achieving Europe’s Digital Single Market, BCG report, October 2015.) Despite challenges related to the “digital divide,” cord cutting and thinning, and network neutrality, the US regulatory environment has several positive features, related, for example, to spectrum and local-loop competition.
In our view, the following are priorities for national regulations:
• Ensuring consistent standards across digital services and a level playing field for operators and OTT companies
• Facilitating investment by reducing market fragmentation, allowing for
economies of scale, and creating incentives
• Rethinking wholesale market regula-tions—especially the requirement in many countries that operators resell network capacity to direct competitors
• Modernizing spectrum policies by allowing licenses of unlimited duration and the ability to trade
• Enabling specialized services to drive innovation
• In fast-moving technology areas, encouraging greater use of remedial government regulation rather than anticipatory government intervention: ex post versus ex ante action, in technical terms
• Acting openly and transparently when the governmental goal is inclusion or some other social good
ThE IMPOrTANCE OF rEGUlATION
The Boston Consulting Group | 27
integrated and mobile-only operators. Cable operators also profited from relatively low upgrade costs, given the deep penetration of fiber in most of their networks and the va- riety of technology levers, such as Docsis 3.1, to add bandwidth without ripping up existing infrastructure.
the five-year value creation view is some-what tempered by one-year performance. in 2015, a flat to down year for most equity in-dexes, four of the seven cable companies we tracked generated negative tsr. overall, the cable industry’s one-year median tsr dropped from 19% to –1.1%. it’s too early to say whether the one-year performance is a blip or early evidence that cord cutting and thinning are starting to affect operators mate-rially. stay tuned.
Convergence is king. fixed-mobile bundles have taken off in countries such as France, portugal, and spain, where market penetra-tion already exceeds 50%, according to the
18-country convergence survey. in 13 of the 18 countries surveyed, more than 60% of household decision makers were interested in or already had a fixed-mobile bundle. fixed-mobile convergence (fMC), in other words, is a global consumer trend.
Many operators are working to offer fMC to their customers. for example, when Bt group, the number six telecommunications value creator, recently bought EE, the UK’s largest mobile operator, it reentered the wire-less arena it had once vacated. Vodafone and liberty global have announced a Dutch joint venture to compete against KPN, the inte- grated incumbent. the venture combines liberty global’s cable and internet business, Ziggo, with Vodafone’s mobile network. and Deutsche telekom has launched its Magenta One quadruple-play offer in numerous coun-tries. as of mid-2016, Deutsche telekom had signed up 2.5 million german customers and 1.1 million customers outside of germany for the service.
Exhibit 16 | Fixed-Broadband and Integrated Operators Dominated the Telecommunications Top Ten
Sources: S&P Global market intelligence; annual reports; BCG analysis.Note: The sample includes 53 companies with market value greater than $7.5 billion1The contribution of each factor is shown in percentage points of the five-year average annual TSr. Dividend yield is the average dividend yield during the time horizon, including special dividends and reinvestment of dividends. The sum of all factors for a particular company equals the average annual TSr for that company. Because of rounding, the numbers may not add up to the TSr figure shown. 2location of corporate headquarters.3as of December 31, 2015. 4Change in the eV / eBiTDa multiple.5Share change refers to the change in the number of shares outstanding, not to the change in share price.6as of July 31, 2016.7Time Warner Cable was delisted in may 2016.8Top-ten figures are medians, not totals.
TSR Disaggregation1
Company Region2Core
activity
Average annual
TSR
(%)
Market value
($billions)3
Sales growth (p.p.)
Margin change (p.p.)
Multiple change (p.p.)4
Dividend yield (p.p.)
Share change (p.p.)5
Net debt change (p.p.)
TSR2016 (%)6
1 Charter Communications uS Cable 36.3 20.6 7 –1 24 0 1 7 16.0
2 kDDi Japan integrated 34.9 66.0 6 3 17 3 1 6 0.8
3 level 3 Communications uS Fixed 29.9 19.4 18 7 1 0 –21 25 –6.9
4 Time Warner Cable uS Cable 26.1 52.6 5 –2 10 3 5 6 na7
5 nippon Telephone and Telegraph Japan integrated 25.4 84.4 2 –3 10 4 5 7 2.1
6 BT Group uk integrated 25.3 58.2 –2 5 9 4 –2 11 –12.4
7 Telstra australia integrated 23.0 49.9 2 –2 13 8 0 2 6.0
8 Comcast uS Cable 23.0 138.0 15 –3 7 2 3 0 20.7
9 DiGi.Com malaysia Mobile 22.8 9.8 5 0 12 6 0 0 –6.2
10 iliad France integrated 22.3 14.0 17 –3 9 0 –1 1 –20.8
Top ten8 25.3 51.3 5 (2) 10 3 0 6 0.8
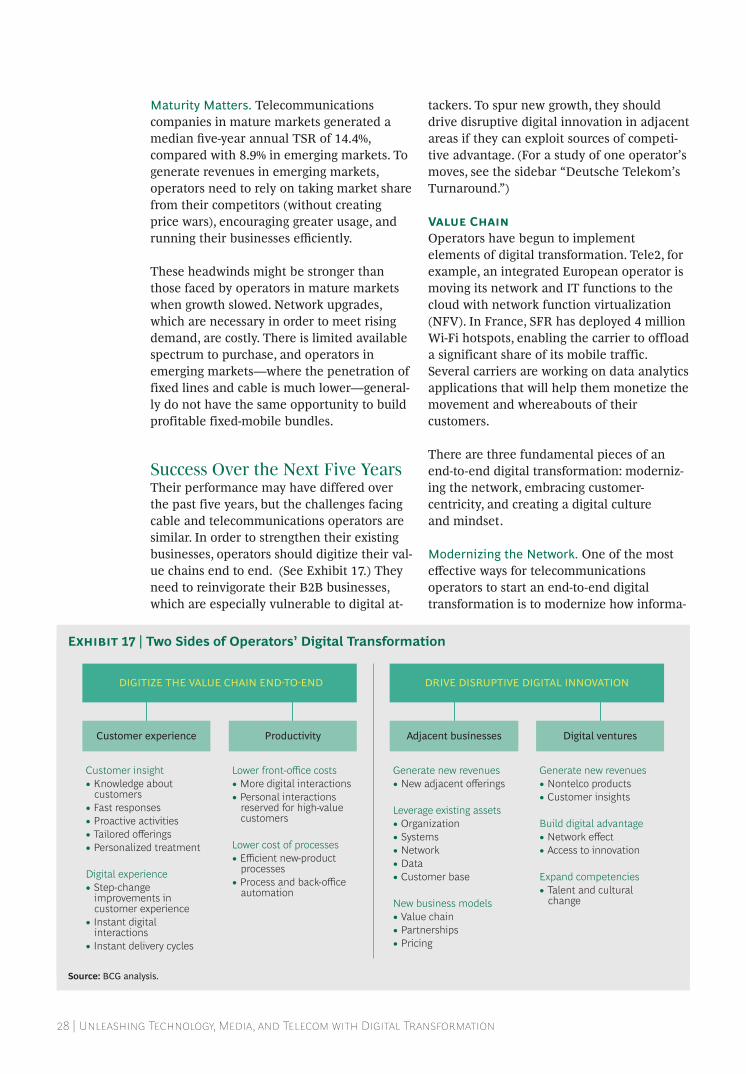
28 | Unleashing Technology, Media, and Telecom with Digital Transformation
maturity matters. telecommunications companies in mature markets generated a median five-year annual TSR of 14.4%, compared with 8.9% in emerging markets. to generate revenues in emerging markets, operators need to rely on taking market share from their competitors (without creating price wars), encouraging greater usage, and running their businesses efficiently.
these headwinds might be stronger than those faced by operators in mature markets when growth slowed. network upgrades, which are necessary in order to meet rising demand, are costly. there is limited available spectrum to purchase, and operators in emerging markets—where the penetration of fixed lines and cable is much lower—general-ly do not have the same opportunity to build profitable fixed-mobile bundles.
success over the next five yearstheir performance may have differed over the past five years, but the challenges facing cable and telecommunications operators are similar. in order to strengthen their existing businesses, operators should digitize their val-ue chains end to end. (see exhibit 17.) they need to reinvigorate their B2B businesses, which are especially vulnerable to digital at-
tackers. to spur new growth, they should drive disruptive digital innovation in adjacent areas if they can exploit sources of competi-tive advantage. (for a study of one operator’s moves, see the sidebar “Deutsche telekom’s turnaround.”)
Value Chainoperators have begun to implement elements of digital transformation. tele2, for example, an integrated european operator is moving its network and it functions to the cloud with network function virtualization (nfV). in france, sfr has deployed 4 million Wi-fi hotspots, enabling the carrier to offload a significant share of its mobile traffic. several carriers are working on data analytics applications that will help them monetize the movement and whereabouts of their customers.
there are three fundamental pieces of an end-to-end digital transformation: moderniz-ing the network, embracing customer- centricity, and creating a digital culture and mindset.
modernizing the network. one of the most effective ways for telecommunications operators to start an end-to-end digital transformation is to modernize how informa-
Customer insight• Knowledge about
customers• Fast responses• Proactive activities• Tailored offerings • Personalized treatment
Digital experience• Step-change
improvements in customer experience
• Instant digital interactions
• Instant delivery cycles
Lower front-office costs• More digital interactions• Personal interactions
reserved for high-value customers
Lower cost of processes• Efficient new-product
processes• Process and back-office
automation
DIGITIZE THE VALUE CHAIN ENDTOEND
Customer experience Productivity
Generate new revenues• New adjacent offerings
Leverage existing assets• Organization• Systems• Network• Data• Customer base
New business models• Value chain• Partnerships• Pricing
Generate new revenues• Nontelco products• Customer insights
Build digital advantage• Network effect• Access to innovation
Expand competencies• Talent and cultural
change
DRIVE DISRUPTIVE DIGITAL INNOVATION
Adjacent businesses Digital ventures
Exhibit 17 | Two Sides of Operators’ Digital Transformation
Source: BCG analysis.
The Boston Consulting Group | 29
tion is transmitted over networks and how networks operate.
• How Information Is Transmitted. for fixed networks, a variety of new technolo-gies, such as Docsis 3.1 and xg-fast, are improving transmission. similar advances, such as 5g, lte in unlicensed spectrum, license assisted access, and next-genera-tion Wi-fi, are becoming part of mobile communications. and in the transit area, advances in microwave and multiplexing technologies are occurring rapidly.
• The Way Networks Operate. together, software-defined networks (SDN) and NFV are fundamentally changing network oper- ations. sDn and nfV are two sides of the same coin; we refer to their collective use as software-defined virtualized networking (sVn). sVn can not only reduce networks’ capital and operating costs but also im-prove their flexibility and scalability. Its open-source architecture also fosters great- er agility and innovation. (see “telecom’s
Twin Peaks: Software-Defined and Virtual-ized networks,” BCg article, June 2016.)
early sVn adopters expect to save 30% to 50% on capital and operating costs over five years. AT&T, for example, plans to have 75% of its networks virtualized by 2020. a word of caution: the transforma-tion to sVn is a multiyear journey. it rarely makes sense to rip out equipment that still has several years of operating life.
other innovations in network operations in-clude small cells, automation (such as self- optimizing networks), and data analytics that dynamically manage network traffic.
embracing Customer-Centricity. retailers do it. airlines do it. hotels do it. even banks do it. yet most telecommunications operators struggle with it—or worse, do not even have a clear view of how to make it happen.
We are talking about creating compelling cus-tomer journeys and offering customers a
For Deutsche Telekom, 2012 was a dark year. revenues, profits, the number of fixed lines, and the share price were all falling. The operator made several difficult deci-sions, such as eliminating jobs and reduc-ing overhead, but simultaneously began to work on modernizing its front and back ends and turning around its mobile business.
Since 2012, net revenues have grown by 6% annually, the number of TV subscribers has increased 35% overall, and 28 million consumers, most of them in the US, have signed up for mobile service. Deutsche Telekom’s stock has risen 10% annually since the end of 2012.
A cornerstone of this transformation was a series of bold moves. On the revenue side, the company’s Un-carrier strategy and its bold and relentless execution in the US have contributed to growth and value creation. In Germany, regaining mobile
market leadership and launching con-verged fixed-mobile bundles have been important factors. On the cost side, Deutsche Telekom expects eventually to save about €1.2 billion annually by creating an all-IP pan-European network—which it calls its “superior production model.” The model is replacing hundreds of legacy platforms with virtualized and centralized network functions and is built on digital, customer-centric, and efficient processes. This new model will enable Deutsche Telekom to launch new products that take advantage of its integrated mobile- and fiber-network strategy. In addition, it has ongoing efficiency initiatives in operations and support functions.
Deutsche Telekom is also building cloud, security, and smart-home businesses and is creating a digital connected-channel experience for consumers.
dEUTSChE TElEkOM’S TUrNArOUNd
30 | Unleashing Technology, Media, and Telecom with Digital Transformation
connected-channel approach. telecommuni-cations operators are competing against digi-tal attackers, such as Whatsapp and snap-chat, that understand, engage with, and delight their customers.
Customer-centricity requires active change management. Connected-channel retailing, for example, requires technical skills to man-age an online and mobile presence, data ana-lytics skills to understand customer behavior, automation capabilities to create seamless service, and inventory management capabili-ties to ensure the availability of “click and collect” purchases.
soft skills are needed, too. the best connected- channel retailers train their store and call center personnel to perform a full range of sales, service, and follow-through activities. they also create common metrics so chan- nels are not fighting one another for revenue credit.
The success of an end-to-end digital transformation rests with leadership.
the payoff for operators is tangible. strong connected-channel performance can yield revenue increases of 3% to 5%, reductions in churn of 2% to 4% and in cost to serve of 15% to 30%, and improvements in customer satis-faction scores of 15% to 30%.
Creating a Digital Culture. the success of an end-to-end digital transformation rests more with leadership and people than with hard-ware and software. Leaders must be comfort-able changing the core of their organizations, and they must play an active role in leading the change.
at the same time, operators need new ways of working. for example, sVn technologies require changes to organizational structure, capabilities, and behavior that reach across the value chain. Virtual development and op-erations teams need to work seamlessly across organizational boundaries. open-
source architecture teams and joint commer-cial and technical teams need to move cus-tomers systematically to new offerings.
the it function must play a critical role in fa-cilitating this transition. it needs to embrace greater technological openness and flexibility by creating accessible application program-ming interfaces, or apis, by allowing greater integration into the network, by storing infor-mation in data lakes, and by encouraging ag-ile development. along the way, the it func-tion needs to start viewing itself as a source of value rather than a cost center.
B2B Reinventionnowhere is the need for customer-centricity more apparent than in the B2B market. to succeed with business customers, it will not be enough just to offer connectivity. revenues from connectivity are generally flat or declin-ing. Meanwhile, amazon Web services has started to offer network functionality as a ser-vice, providing load balancing, firewalls, and routers on the cloud. even B2B customers that are not yet comfortable with cloud-based net-work services have much higher expectations of the telecommunications operators than they did five years ago. at the same time, the procurement staffs of large commercial cus-tomers have become much savvier negotiators.
operators can play a highly valuable role in B2B—especially with midsize companies—but only by transforming their operations so that they can compete against ott and cloud companies able to create a compelling cus-tomer experience. the back end of operators often suffers from inflexible legacy infrastruc-ture, while on the customer-facing front end, their user interface, pricing, and sales skills often lag behind the market.
Disruptive Digital Innovationthe goals of disruptive digital innovation are to create new revenue streams, barriers to en-try, and sources of value creation. it’s a game of disrupt or be disrupted.
operators seek these goals in different ways: acquisitions, partnerships, incubation, and cor-porate venturing. they need to embrace a strategy of open innovation to tap into the pos-itive powers of disruption. executives should
The Boston Consulting Group | 31
think broadly about how they can leverage their assets and strengths to create a new growth trajectory for their business. (see the sidebar “finding adjacent and new growth.”)
Note1. Because BT Group acquired EE, a mobile operator, in January 2016, Bt is classified as an integrated operator under its current business model. iliad is also classified as an integrated operator, because it provides both fixed and mobile services.
Where can cable companies and telecom-munications operators find sources of adjacent and new growth? Outside of Japan and South korea, operators have had only modest success expanding into new lines of business. But to drive top-quartile returns, operators typically need to gener-ate more top-line growth than that afforded by the core business. Consequently, they need to find adjacent businesses to enter. In so doing, they need to leverage at least one of the following assets:
• Network Quality. Many digital services are dependent on quality of service or are data intensive. Operators are uniquely positioned to offer—as a standalone service, in partnership, or as a new business—varying levels of quality, data throughput, and pricing. This approach challenges some views on network neutrality, but network neutrality needs to be addressed if services such as self-driving vehicles and mobile medical monitoring are to take hold.
• Customer Relationships. Operators’ long-standing relationships with customers offer a chance to cross-sell new disruptive services, such as mobile payments, energy consumption man-agement, and event ticketing.
• Customer Data. Operators possess a wealth of customer data that can provide the bedrock for services related to, for example, digital identity, travel offerings, and navigational assistance.
• Brand and Distribution Power. Operators have strong brand and distribution capabilities in their home and in major markets that can be leveraged to introduce services other than their traditional mobile, fixed, and video offerings.
• Payment Relationship. In emerging and some other markets, because of lack of trust or infrastructure con-straints, digital services cannot always establish direct-payment relationships with customers. In such cases, the operator can act as an intermediary or a partner.
• Local Disruption. Silicon Valley startups are generally looking to create global services or platforms, a choice that leaves an opening for local and, in many cases, native-language services.
FINdING AdjACENT ANd NEW GrOWTh
32 | Unleashing Technology, Media, and Telecom with Digital Transformation
The TMT DigiTal TransforMaTion JoUrney
Our main message in this report is that tMt companies need to transform. tMt
incumbents are competing against companies born in the digital and mobile era. unless they become more like these new competi-tors, incumbents will be unable to ride sub- sequent waves of disruption, including AI, iot, and cybersecurity.
Digital and mobile are not just forms of technology but also mindsets.
it is important to note that digital and mobile are not just forms of technology but also mindsets. the greatest shortages at most tMt companies today do not always involve technological know-how. instead, the short- comings are in leadership, the resolve to change, and the skills needed to reshape the organization around new approaches such as agile.
tMt companies may have been dealing with disruption for longer than most other compa-nies, but they are not necessarily further along in their own transformative journeys. in our experience, many companies view dig-ital transformation too narrowly. they incre-mentally experiment with disruptive busi-
nesses and business models, or they digitize discrete processes. for example, they may be-come adept at digital marketing but not at digital customer support.
at the other extreme, some companies initi-ate enterprise-wide digital transformations, but they lack focus and accountability. Many leaders of businesses and functions lack the technical skills and digital expertise to imple-ment the transformation within their teams. and many of them lack an overarching vi-sion, too.
instead, companies need to approach dig- ital transformation in two parallel and self- reinforcing ways:
• Digitize the company’s value chain end to end in order to unlock efficiency, free up cash, and improve performance.
• adopt a comprehensive approach to disruptive digital innovation that focuses on creating new products and business models.
Driving Digital TransformationDigital transformation is, in other words, an all-encompassing activity. anything less ambi-tious is a signal to your employees, your com-petitors, and your customers that you are not embracing the future.
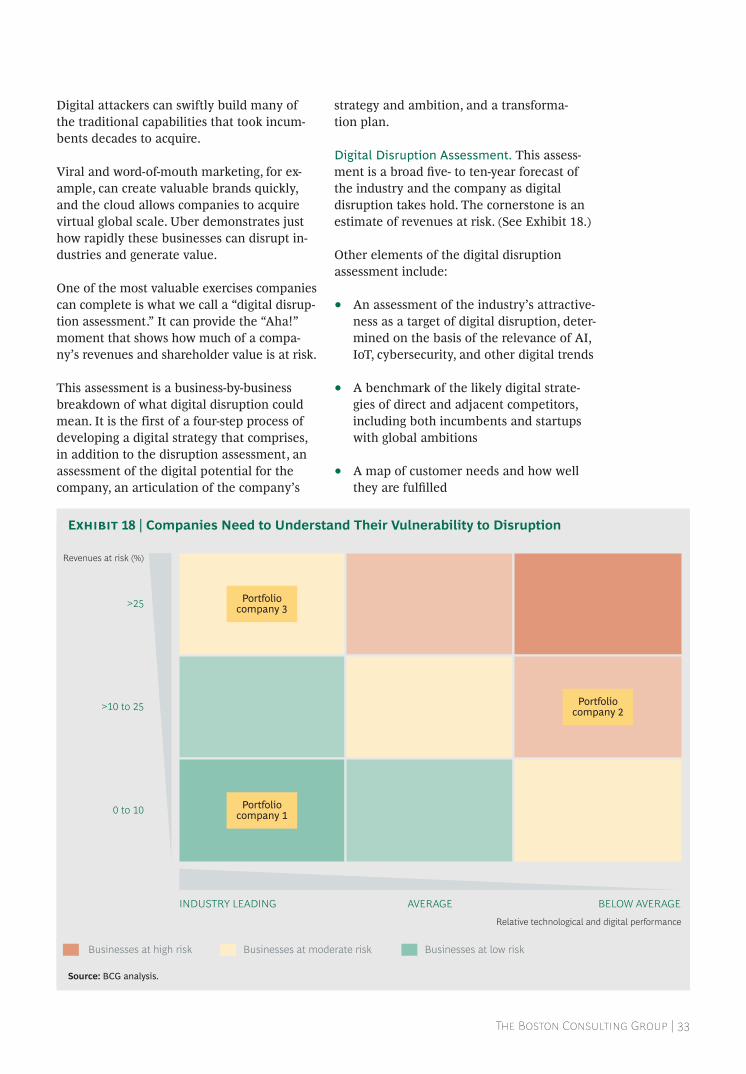
The Boston Consulting Group | 33
Digital attackers can swiftly build many of the traditional capabilities that took incum-bents decades to acquire.
Viral and word-of-mouth marketing, for ex-ample, can create valuable brands quickly, and the cloud allows companies to acquire virtual global scale. uber demonstrates just how rapidly these businesses can disrupt in-dustries and generate value.
one of the most valuable exercises companies can complete is what we call a “digital disrup-tion assessment.” it can provide the “aha!” moment that shows how much of a compa-ny’s revenues and shareholder value is at risk.
this assessment is a business-by-business breakdown of what digital disruption could mean. it is the first of a four-step process of developing a digital strategy that comprises, in addition to the disruption assessment, an assessment of the digital potential for the company, an articulation of the company’s
strategy and ambition, and a transforma- tion plan.
Digital Disruption assessment. this assess-ment is a broad five- to ten-year forecast of the industry and the company as digital disruption takes hold. the cornerstone is an estimate of revenues at risk. (see exhibit 18.)
other elements of the digital disruption assessment include:
• an assessment of the industry’s attractive-ness as a target of digital disruption, deter-mined on the basis of the relevance of ai, iot, cybersecurity, and other digital trends
• a benchmark of the likely digital strate-gies of direct and adjacent competitors, including both incumbents and startups with global ambitions
• a map of customer needs and how well they are fulfilled
Revenues at risk (%)
Relative technological and digital performance
0 to 10
>10 to 25
>25
INDUSTRY LEADING AVERAGE BELOW AVERAGE
Portfoliocompany 1
Portfoliocompany 2
Portfoliocompany 3
Businesses at high risk Businesses at moderate risk Businesses at low risk
Exhibit 18 | Companies Need to Understand Their Vulnerability to Disruption
Source: BCG analysis.
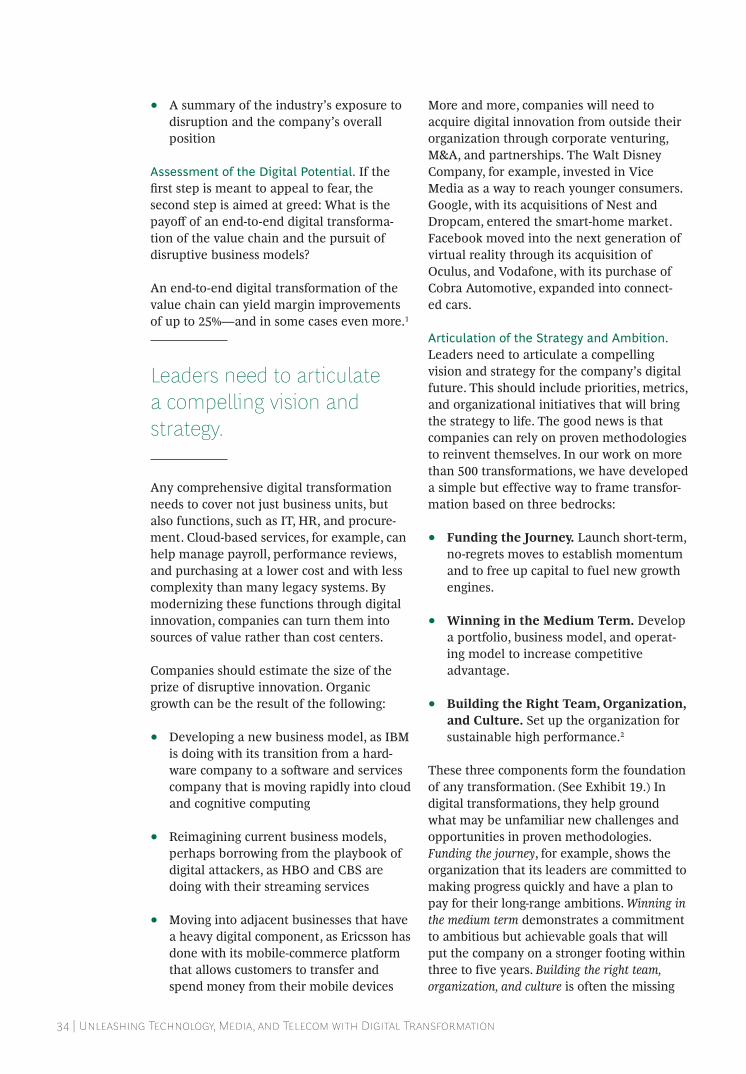
34 | Unleashing Technology, Media, and Telecom with Digital Transformation
• a summary of the industry’s exposure to disruption and the company’s overall position
assessment of the Digital Potential. if the first step is meant to appeal to fear, the second step is aimed at greed: What is the payoff of an end-to-end digital transforma-tion of the value chain and the pursuit of disruptive business models?
an end-to-end digital transformation of the value chain can yield margin improvements of up to 25%—and in some cases even more.1
leaders need to articulate a compelling vision and strategy.
any comprehensive digital transformation needs to cover not just business units, but also functions, such as it, hr, and procure-ment. Cloud-based services, for example, can help manage payroll, performance reviews, and purchasing at a lower cost and with less complexity than many legacy systems. By modernizing these functions through digital innovation, companies can turn them into sources of value rather than cost centers.
Companies should estimate the size of the prize of disruptive innovation. organic growth can be the result of the following:
• Developing a new business model, as iBM is doing with its transition from a hard-ware company to a software and services company that is moving rapidly into cloud and cognitive computing
• reimagining current business models, perhaps borrowing from the playbook of digital attackers, as hBo and CBs are doing with their streaming services
• Moving into adjacent businesses that have a heavy digital component, as ericsson has done with its mobile-commerce platform that allows customers to transfer and spend money from their mobile devices
More and more, companies will need to acquire digital innovation from outside their organization through corporate venturing, M&a, and partnerships. the Walt Disney Company, for example, invested in Vice Media as a way to reach younger consumers. Google, with its acquisitions of Nest and Dropcam, entered the smart-home market. facebook moved into the next generation of virtual reality through its acquisition of oculus, and Vodafone, with its purchase of Cobra automotive, expanded into connect- ed cars.
articulation of the Strategy and ambition. leaders need to articulate a compelling vision and strategy for the company’s digital future. this should include priorities, metrics, and organizational initiatives that will bring the strategy to life. the good news is that companies can rely on proven methodologies to reinvent themselves. in our work on more than 500 transformations, we have developed a simple but effective way to frame transfor-mation based on three bedrocks:
• Funding the Journey. launch short-term, no-regrets moves to establish momentum and to free up capital to fuel new growth engines.
• Winning in the Medium Term. Develop a portfolio, business model, and operat-ing model to increase competitive advantage.
• Building the Right Team, Organization, and Culture. set up the organization for sustainable high performance.2
these three components form the foundation of any transformation. (see exhibit 19.) in digital transformations, they help ground what may be unfamiliar new challenges and opportunities in proven methodologies. Funding the journey, for example, shows the organization that its leaders are committed to making progress quickly and have a plan to pay for their long-range ambitions. Winning in the medium term demonstrates a commitment to ambitious but achievable goals that will put the company on a stronger footing within three to five years. Building the right team, organization, and culture is often the missing
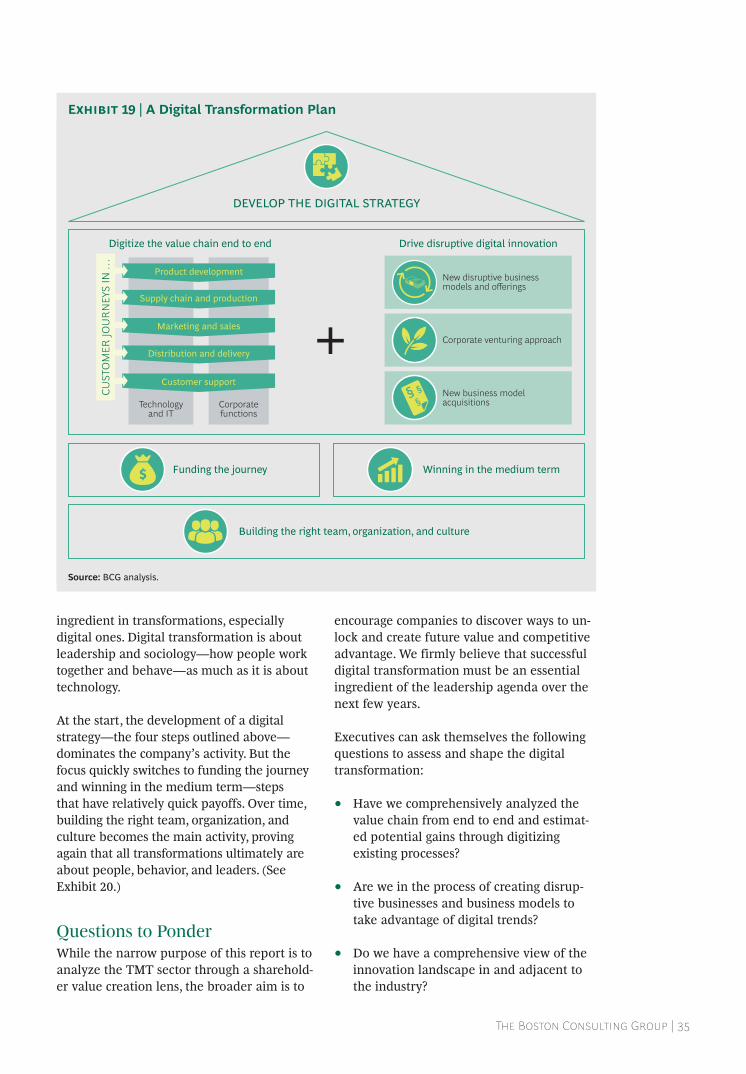
The Boston Consulting Group | 35
ingredient in transformations, especially digital ones. Digital transformation is about leadership and sociology—how people work together and behave—as much as it is about technology.
at the start, the development of a digital strategy—the four steps outlined above—dominates the company’s activity. But the focus quickly switches to funding the journey and winning in the medium term—steps that have relatively quick payoffs. Over time, building the right team, organization, and culture becomes the main activity, proving again that all transformations ultimately are about people, behavior, and leaders. (see exhibit 20.)
Questions to PonderWhile the narrow purpose of this report is to analyze the tMt sector through a sharehold-er value creation lens, the broader aim is to
encourage companies to discover ways to un-lock and create future value and competitive advantage. We firmly believe that successful digital transformation must be an essential ingredient of the leadership agenda over the next few years.
executives can ask themselves the following questions to assess and shape the digital transformation:
• have we comprehensively analyzed the value chain from end to end and estimat-ed potential gains through digitizing existing processes?
• are we in the process of creating disrup-tive businesses and business models to take advantage of digital trends?
• Do we have a comprehensive view of the innovation landscape in and adjacent to the industry?
DEVELOP THE DIGITAL STRATEGY
Drive disruptive digital innovationDigitize the value chain end to end
New disruptive businessmodels and offerings
Corporate venturing approach
New business modelacquisitionsTechnology
and ITCorporatefunctions
Product development
Supply chain and production
Marketing and sales
Distribution and delivery
Customer support
Building the right team, organization, and culture
Funding the journey Winning in the medium term
CUST
OM
ER JO
UR
NEY
S IN
…Exhibit 19 | A Digital Transformation Plan
Source: BCG analysis.
36 | Unleashing Technology, Media, and Telecom with Digital Transformation
• Do we have a clear strategy for approach-ing potential partners, acquisition targets, and collaborators?
• are our leaders and people ready, willing, and able to digitally transform the organization?
If the answer to any of these questions is no, it’s time to get to work.
Notes1. george Westerman, Didier Bonnet, and andrew Mcafee, Leading Digital: Turning Technology into Business Transformation (Boston: harvard Business review press, 2014).2. in BCg’s overall transformation framework, we call this set of activities “Build the right team, organiza-tion, technology, and Culture.” given the subject matter of this report, to avoid redundancy, we are not talking about technology here.
Reimagination of the business model and acquisitions of new businesses
Digitaldisruption
assessment
Digitalpotential
Strategyand ambition
Digital organizationand capabilities
Corporate functions
Product development andsupply chain optimization
Digital and data-drivenofferings; sales and marketing
Developing the digital strategy Winning in the medium termFunding the journey Building the right team, organization, and culture
Ongoing execution ofthe winning initiative
Ongoing execution ofthe funding initiative
(define thestarting point)
(agree on strategyand priorities)
(proceed with agiledevelopment and pilots)
(deploy acrossthe corporation)
EDUCATE CRYSTALLIZE ACCELERATE SCALE UP AND TRANSFORM
Anchoring and managingthe digital transformation
End-to-endvalue chain
optimization
Capability build-up
Digital transformationaccelerators
Disruptive digitalinnovation
opportunities
Transformationplan
Exhibit 20 | The Digital Transformation Journey
Source: BCG analysis.
The Boston Consulting Group | 37
The following publications by The Boston Consulting Group will help readers explore several of the topics in this report more closely.
Acting on the Digital Imperativean article by The Boston Consulting Group, September 2016
Transforming Media Core Technology to Meet Digital Demandsan article by The Boston Consulting Group, September 2016
AI Is the Talk of Technology Leaders at Code Conference 2016an article by The Boston Consulting Group, July 2016
How Telcos Can Put Their Money Where Their Customers Are a Focus by The Boston Consulting Group, July 2016
The New News on Print Media Transformationan article by The Boston Consulting Group, June 2016
Telecom’s Twin Peaks: Software-Defined and Virtualized Networksan article by The Boston Consulting Group, June 2016
Digital Technologies Raise the Stakes in Customer Servicea Focus by The Boston Consulting Group, may 2016
How Hardware Makers Can Win in the Software Worldan article by The Boston Consulting Group, may 2016
Five Selling Secrets of Today’s Digital B2B Leadersan article by The Boston Consulting Group, april 2016
The Digital Revolution Is Disrupting the TV Industrya Focus by The Boston Consulting Group, march 2016
Can Your Network Deliver the Potential of the Cloud?an article by The Boston Consulting Group, February 2016
for fUrTher reaDing
38 | Unleashing Technology, Media, and Telecom with Digital Transformation
noTe To The reaDer
This is BCG’s sixth report in the Technology, media & Telecommuni-cations Value Creators series. Our main purpose is to help clients un-derstand the dynamics of share-holder growth in these dynamic in-dustries. more than ever before, your success will be defined by your ability to achieve digital transforma-tion, as outlined in this report.
About the AuthorsSimon Bamberger is a principal in the los angeles office of The Boston Consulting Group and has served major technology, media, and telecommunications com-panies in the uS and europe. Wolfgang Bock is a senior partner and managing director in the firm’s munich office and the global leader of the telecommunications sector. Patrick Forth is a senior partner and managing director in BCG’s Sydney office and the global leader of the Technology, media & Tele-communications practice. Anna Green is a partner and managing director in the firm’s Sydney office and global coleader of the media sector. Derek Kennedy is a partner and managing director in BCG’s San Francisco office and the global leader of the technology sector. Fredrik Lind is a senior partner and managing director in the firm’s Stockholm office, the leader of the Technology, media & Telecom-munications practice in Sweden, and the practice’s marketing partner. Tim Nolan is a partner and managing director in BCG’s new york office. he has helped numerous TmT clients develop value creation strategies. Neal Zuckerman is a partner and managing director in the firm’s new york office and global coleader of the media sector.
AcknowledgmentsThe authors would like to thank the dozens of colleagues around the globe who assisted with the re-search and analysis for this report. Several partners, consultants, and knowledge team members made contributions. The authors would especially like to thank alex asen, Christian Bartosch, Julio Bezerra, akash Bhatia, Walter Bohmayr, Jeff Bowden, Joseph Brilando, alexander Dahlke, Stefan Deutscher, hady Farag, Jody Foldesy, Billy hart, mohamed hashem, nicolas hunke, martin link, Qiang liu, Scott maier, ryan mckenzie, roger Premo, mickie rosen, Semyon Schetinin, Barbara Schloss, Sunny Sood, Dharmesh Syal, Sebastian ullrich, raj Varadarajan, antonio Varas, maikel Wilms, and Shoaib yousuf for their insights; amanda Provost for marketing; and mark Voorhees for writing assistance. The authors would also like to thank katherine andrews, Gary Callahan, elyse Friedman, kim Friedman, abby Garland, and Sara Strassenreiter for their editorial and production support.
For Further Contactif you would like to discuss this re-port, please contact one of the au-thors.
Simon BambergerPrincipalBCG los angeles+1 213 621 [email protected]
Wolfgang BockSenior Partner and Managing DirectorBCG Munich+49 89 231 [email protected]
Patrick ForthSenior Partner and Managing DirectorBCG Sydney +61 2 9323 [email protected]
Anna GreenPartner and Managing DirectorBCG Sydney+61 2 9323 [email protected]
Derek KennedyPartner and Managing DirectorBCG San Francisco+1 415 732 [email protected]
Fredrik LindSenior Partner and Managing DirectorBCG Stockholm+46 8 402 44 [email protected]
Tim NolanPartner and Managing DirectorBCG new york+1 212 446 [email protected]
Neal ZuckermanPartner and Managing DirectorBCG new york+1 212 446 [email protected]

© The Boston Consulting Group, inc. 2016. all rights reserved.
For information or permission to reprint, please contact BCG at:e-mail: [email protected]: +1 617 850 3901, attention BCG/Permissionsmail: BCG/Permissions The Boston Consulting Group, inc. One Beacon Street Boston, ma 02108 uSa
To find the latest BCG content and register to receive e-alerts on this topic or others, please visit bcgperspectives.com.
Follow bcg.perspectives on Facebook and Twitter.
10/16

Abu DhabiAmsterdamAthensAtlantaAucklandBangkokBarcelonaBeijingBerlinBogotáBostonBrusselsBudapestBuenos AiresCalgaryCanberraCasablancaChennai
ChicagoCologneCopenhagenDallasDenverDetroitDubaiDüsseldorfFrankfurtGenevaHamburgHelsinkiHo Chi Minh CityHong KongHoustonIstanbulJakartaJohannesburg
KievKuala LumpurLagosLimaLisbonLondonLos AngelesLuandaMadridMelbourneMexico CityMiamiMilanMinneapolisMonterreyMontréalMoscowMumbai
MunichNagoyaNew DelhiNew JerseyNew YorkOsloParisPerthPhiladelphiaPragueRio de JaneiroRiyadhRomeSan FranciscoSantiagoSão PauloSeattleSeoul
ShanghaiSingaporeStockholmStuttgartSydneyTaipeiTel AvivTokyoTorontoViennaWarsawWashingtonZurich
bcg.com | bcgperspectives.com
Un
leashin
g Techn
ology, Media, an
d Telecom w
ith D
igital Transform
ation