tmdl investigation for bacteria in corpus … · tmdl investigation for bacteria in corpus christi...
TRANSCRIPT
TMDL INVESTIGATION FOR BACTERIA IN CORPUS CHRISTI BAY BEACHES INTERIM MONITORING REPORT FISCAL YEAR 2011 (YEAR-ONE)
Prepared for:
Texas Commission on Environmental Quality Total Maximum Daily Load Program
P.O. Box 13087 Austin, Texas 78711-3087
Performed as part of Contract No. 582-11-90501
Prepared by:
Brien A. Nicolau Erin M. Hill
Center for Coastal Studies Texas A&M University-Corpus Christi
Natural Resources Center 6300 Ocean Drive, Suite 3200 Corpus Christi, Texas 78412
December 2011
TAMU-CC-1202-CCS

ii
CONTACT INFORMATION
Principal Investigator
Brien A. Nicolau
Center for Coastal Studies Texas A&M University-Corpus Christi
Natural Resources Center 6300 Ocean Drive, Suite 3200 Corpus Christi, Texas 78412
Phone: 361.825.5807 Fax: 361.825.2770
Co-Principal Investigator
Erin M. Hill
Center for Coastal Studies Texas A&M University-Corpus Christi
Natural Resources Center 6300 Ocean Drive, Suite 3200 Corpus Christi, Texas 78412
Phone: 361.825.5791 Fax: 361.825.2770

iii
TABLE OF CONTENTS Page
TABLE OF CONTENTS ......................................................................................................... iii
LIST OF FIGURES ................................................................................................................. iv
LIST OF TABLES .................................................................................................................. vii
1.0 INTRODUCTION ........................................................................................................... 1.1
1.1 Background .......................................................................................................... 1.1
1.2 Water Quality Standards ...................................................................................... 1.1
1.3 Project Objectives ................................................................................................ 1.3
2.0 STUDY AREA DESCRIPTION ..................................................................................... 2.1
2.1 Corpus Christi ...................................................................................................... 2.1
2.2 Climate ................................................................................................................. 2.1
3.0 METHODS ...................................................................................................................... 3.1
3.1 Sampling Process Design and Frequency ............................................................ 3.1
3.2 Sampling Methods ............................................................................................. 3.11
4.0 INTERIM DATA RESULTS ........................................................................................... 4.1
4.1 Field Data (Non-rainfall events) .......................................................................... 4.1
4.2 Precipitation ......................................................................................................... 4.7
4.3 Field Data (Rainfall events) ................................................................................. 4.9
4.4 Enterococcus concentrations in water (all events) ............................................. 4.14
4.5 Enterococcus concentrations in sediment .......................................................... 4.26
4.6 Park Use by Location ......................................................................................... 4.27
4.7 Avian Use by Location....................................................................................... 4.28
4.8 Beach Debris by Location .................................................................................. 4.29
5.0 REFERENCES ................................................................................................................. 5.1

iv
LIST OF FIGURES Page
Fig. 3.1. Aerial photo depicting Corpus Christi Bay Beaches TMDL sampling
locations and three major drainage ditches at Louisiana Parkway, Brawner Parkway, and Carmel Parkway. Retrieved on 4/5/2011 from Google Earth. ....................................................................................................... 3.3
Fig. 3.2. Aerial photo depicting the four Corpus Christi Beach (North Beach) sampling locations. Retrieved on 4/5/2011 from Google Earth. ......................... 3.4
Fig. 3.3. Aerial photo depicting the four McGee Beach (20940, 20941, 20942, and 21048) and four Emerald Beach sampling locations. Retrieved on 4/5/2011 from Google Earth. ............................................................................... 3.5
Fig. 3.4. Aerial photo depicting the four Cole Park sampling locations (16 stations). Retrieved on 4/5/2011 from Google Earth. .......................................... 3.6
Fig. 3.5. Aerial photo depicting the four Ropes Park sampling locations. Retrieved on 4/5/2011 from Google Earth........................................................... 3.7
Fig. 3.6. Aerial photo depicting the four Poenisch Park sampling locations. Retrieved on 4/5/2011 from Google Earth........................................................... 3.8
Fig. 3.7. Aerial photo depicting the four University Beach sampling locations. Retrieved on 4/5/2011 from Google Earth........................................................... 3.9
Fig. 4.1. Aerial photo depicting shoreline area being sampled (red) and location of gauged rainfall station (yellow) in relation to Ropes Park (white) used for obtaining precipitation data. Retrieved on 12/1/2011 from Google Earth. ....................................................................................................... 4.7
Fig. 4.2. The geometric mean of all Enterococcus concentrations (MPN/100 ml) at each sampling location in May 2011. ............................................................ 4.17
Fig. 4.3. The geometric mean of all Enterococcus concentrations (MPN/100 ml) at each sampling location in June 2011. ............................................................ 4.17
Fig. 4.4. The geometric mean of all Enterococcus concentrations (MPN/100 ml) at each sampling location in July 2011. ............................................................. 4.18
Fig. 4.5. The geometric mean of all Enterococcus concentrations (MPN/100 ml) at each sampling location in August 2011. ........................................................ 4.18
Fig. 4.6. The geometric mean of all Enterococcus concentrations (MPN/100 ml) at each sampling location from 5/4/2011 through 8/27/2011. ........................... 4.19

v
Page Fig. 4.7. Number of all exceedances (n=1470 or 147 per location) of the single
sample criteria of 104 MPN/100 ml at each location (Cole Park locations combined). .......................................................................................... 4.19
Fig. 4.8. Percentage of samples (n=1470 or 147 per location) exceeding the single sample Enterococcus criteria of 104 MPN/100 ml at each location from 5/4/2011 through 8/27/2011. ....................................................... 4.20
Fig. 4.9. Percentage of advisory days issued at each location (Cole Park combined) from 5/4/2011 through 8/27/2011. ................................................... 4.20
Fig. 4.10. Enterococcus concentrations (MPN/100 ml) at Corpus Christi Beach at Surfside Park nearshore stations from 5/4/2011 through 8/27/2011. ................ 4.21
Fig. 4.11. Enterococcus concentrations (MPN/100 ml) at McGee Beach nearshore stations from 5/4/2011 through 8/27/2011. ........................................................ 4.21
Fig. 4.12. Enterococcus concentrations (MPN/100 ml) at Emerald Beach nearshore stations from 5/4/2011 through 8/27/2011. ....................................... 4.22
Fig. 4.13. Enterococcus concentrations at (MPN/100 ml) Cole Park North nearshore stations from 5/4/2011 through 8/27/2011. ....................................... 4.22
Fig. 4.14. Enterococcus concentrations (MPN/100 ml) Cole Park Pier nearshore stations from 5/4/2011 through 8/27/2011. ........................................................ 4.23
Fig. 4.15. Enterococcus concentrations (MPN/100 ml) at Cole Park Louisiana nearshore stations from 5/4/2011 through 8/27/2011. ....................................... 4.23
Fig. 4.16. Enterococcus concentrations (MPN/100 ml) at Cole Park Oleander Point nearshore stations from 5/4/2011 through 8/27/2011. .............................. 4.24
Fig. 4.17. Enterococcus concentrations (MPN/100 ml) at Ropes Park nearshore stations from 5/4/2011 through 8/27/2011. ........................................................ 4.24
Fig. 4.18. Enterococcus concentrations (MPN/100 ml) at Poenisch Park nearshore stations from 5/4/2011 through 8/27/2011. ........................................................ 4.25
Fig. 4.19. Enterococcus concentrations (MPN/100 ml) at University Beach nearshore stations from 5/4/2011 through 8/27/2011. ....................................... 4.25
Fig. 4.20. Total number and location of people observed at each beach location from 5/4/2011 through 8/27/2011. ..................................................................... 4.27
Fig. 4.21. Total number of birds and bird activity observed at each beach location from 5/4/2011 through 8/27/2011. ..................................................................... 4.28

vi
Page Fig. 4.22. Percent of debris observed at each location from 5/4/2011 through
8/27/2011. .......................................................................................................... 4.29
Fig. 4.23. Wrack line debris observed at Cole Park following the rainfall event of 6/23/2011. .......................................................................................................... 4.30

vii
LIST OF TABLES Page
Table 3.1. Parameters analyzed for the Corpus Christi Bay Beaches TMDL
project. ............................................................................................................. 3.10
Table 4.1. Water Temperature (°C) descriptive statistics for all 30 nearshore (May – August 2011) and 10 offshore (August 2011) Corpus Christi Bay Beaches TMDL stations sampled. ............................................................. 4.2
Table 4.2. Dissolved Oxygen (mg/L) descriptive statistics for all 30 nearshore (May – August 2011) and 10 offshore (August 2011) Corpus Christi Bay Beaches TMDL stations sampled. ............................................................. 4.3
Table 4.3. Salinity (PSU) descriptive statistics for all 30 nearshore (May – August 2011) and 10 offshore (August 2011) Corpus Christi Bay Beaches TMDL stations sampled. ..................................................................... 4.4
Table 4.4. pH (s.u.) descriptive statistics for all 30 nearshore (May – August 2011) and 10 offshore (August 2011) Corpus Christi Bay Beaches TMDL stations sampled. ................................................................................... 4.5
Table 4.5. Turbidity (NTU) descriptive statistics for all 30 nearshore (May – August 2011) and 10 offshore (August 2011) Corpus Christi Bay Beaches TMDL stations sampled. ..................................................................... 4.6
Table 4.6. Station location information for gauged rainfall stations with individual station rainfall amounts (inches) and a mean of all stations combined for the three rainfall events. ................................................. 4.8
Table 4.7. Water Temperature (°C) for all 30 nearshore Corpus Christi Bay Beaches TMDL stations sampled during rainfall events. .................................. 4.9
Table 4.8. Dissolved Oxygen (mg/L) for all 30 nearshore Corpus Christi Bay Beaches TMDL stations sampled during rainfall events. ................................ 4.10
Table 4.9. Salinity (PSU) for all 30 nearshore Corpus Christi Bay Beaches TMDL stations sampled during rainfall events. .............................................. 4.11
Table 4.10. pH (s.u.) for all 30 nearshore Corpus Christi Bay Beaches TMDL stations sampled during rainfall events. .......................................................... 4.12
Table 4.11. Turbidity (NTU) for all 30 nearshore Corpus Christi Bay Beaches TMDL stations sampled during rainfall events. .............................................. 4.13
Table 4.12. Enterococcus concentrations (MPN/100 ml) for all 30 nearshore (May – August 2011) and 10 offshore (August 2011) Corpus Christi Bay Beaches TMDL stations sampled during all events. ................................ 4.15

viii
Page Table 4.13. Enterococcus concentrations (MPN/100 ml) for all 30 nearshore
Corpus Christi Bay Beaches TMDL stations sampled after rainfall events. .............................................................................................................. 4.16
Table 4.14. Enterococcus sediment bacteria concentrations (MPN/100 ml) at all sampling locations for the Corpus Christi Bay Beaches TMDL. .................... 4.26

ix
ACKNOWLEDGEMENTS
This project was funded through grants from the Texas Commission on Environmental Quality (Contract No. 582-11-90501) and the U.S. Environmental Protection Agency – FY 2009-2011 Clean Water Act Section 106 Categorical Grant, Federal Grant #98665305 and State USAS Grant #998810. We wish to thank Aaron S. Baxter and Robert “Bobby” Duke from the Center for Coastal Studies for field assistance above and beyond the call of duty. We appreciate their enthusiasm and energy in assisting with all aspects of the project. Without their dedication and strong work ethic, this project would not have been possible. In addition, we also want to thank the entire staff at the Center for Coastal Studies for administrative support.

1.1
1.0 INTRODUCTION 1.1 Background Disease causing microorganisms, or pathogens, can adversely affect human health in estuarine systems. Densities of these microorganisms when considered unsafe often result in adverse effects to human health. Microbial pathogens are transmitted to humans typically during recreational use involving primary contact with water (i.e., wading, swimming, fishing, etc.) (Heilman et al. 2000; USEPA 2002; Nicolau and Nunez 2004). While protecting public health is the primary concern, potential loss of recreational beach use from swimming advisories and beach closures, results in lost economic opportunities to coastal communities (TCEQ 2008). Typically, high pathogen concentrations in the water column result from sources such as polluted stormwater runoff, wastewater overflows, boating wastes, and malfunctioning septic systems that carry microorganisms from fecal material into the environment. Besides humans, it may indicate contamination by fecal matter originating from other warm-blooded animals (i.e. domestic dogs, birds, etc.). While it is not possible to monitor all pathogens present in recreational waters, The Texas Commission on Environmental Quality (TCEQ) analyzes concentrations of three organisms to determine support of the Primary Contact Recreation (PCR) criteria: fecal coliform and Escherichia coli in freshwater, and Enterococcus in tidal water. TCEQ guidance stresses that full support of the PCR does not necessarily guarantee that freshwater or tidal waters are completely free of disease causing organisms. However, TCEQ addresses this type of water quality impairment through 303(d) listing and the TMDL process (TCEQ 2008). In 2008, based on data collected under the Texas Beach Watch Program, EPA took action to list Corpus Christi Bay (Segment 2481) on the 303(d) List of Impaired Waters for bacteria and subsequently listed the entire water body in Category 5a, meaning a TMDL will be scheduled. Upon request by TCEQ, EPA reconsidered listing the entire Corpus Christi Bay segment and changed the listing to include only the beaches at Cole Park and Ropes Park, and designated them into separate assessment units (Segment 2481CB_03 and 2481CB_04, respectively). In addition, the listing category changed to 5c, meaning additional bacteria data were needed before a TMDL is conducted. These actions have resulted in establishment and funding for the current project, “TMDL Investigation for Bacteria in Corpus Christi Bay Beaches.” 1.2 Water Quality Standards Goals to maintain surface water quality that supports public health, protects aquatic life, and are consistent with sustainable economic development are defined in the Texas Surface Water Quality Standards. These standards identify appropriate uses, including aquatic life, recreation, and public water supply (or drinking water) sources. Criteria for evaluating use support include dissolved oxygen, temperature, pH, dissolved minerals, toxic substances, and bacteria. Primarily, comparison of individual parameter values to either numerical criteria or screening levels determines the number of values exceeded. Based on number of exceedances, the assessment classifies a segment as either being in full support, partial support, or not supportive of the official designated use. Statewide water quality standards are revised on a triennial basis.

1.2
TCEQ analyzes concentrations of E. coli and fecal coliform in freshwater, and Enterococcus in marine or tidal water to determine PCR support. Presence of these naturally occurring organisms in high numbers within the water column indicates contamination by fecal matter originating from warm-blooded animals, including humans. TCEQ 2010 Guidance for Assessing and Reporting Surface Water Quality in Texas stresses that full PCR support does not necessarily guarantee that waters are completely free of disease causing organisms. Depending on the analytical test performed, results are reported as colony forming units (CFU) or most probable number (MPN). The membrane filtration test (EPA Method 1600) counts actual colonies (CFU) of bacteria and the newer defined substrate tests such as Enterolert® is a statistical representation of the MPN of enterococci likely present in a sample. Both methods are used and considered interchangeable by regulatory agencies. Support of the TCEQ PCR utilizes a 10-sample minimum per individual site taken over the assessment period (two to seven years). For routinely monitored bacteria data, the geometric mean for enterococci is 35 CFU or MPN/100 ml in tidal water. For individual samples in tidal water and recreational beaches, the old criterion of 89 CFU or MPN/100 ml has been revised to 104 CFU or MPN/100 ml, which is the same as the national EPA Beach Watch Program that monitors Texas beaches for enterococci concentrations to determine closures based on elevated bacterial concentrations. The following information was obtained from the Draft 2010 Guidance for Assessing and Reporting Surface Water Quality in Texas. In 2010, the assessment method considered recreational beaches a sub-category of the recreation use. According to the Beaches Environmental Assessment and Coastal Health (BEACH) Act of 2000, states are required to participate with EPA in monitoring coastal recreation waters adjacent to public bathing beaches for pathogens and pathogen indicators. The Act requires public notification when water quality standards are exceeded for bacteria. Currently, the Texas General Land Office (GLO) administers the Texas Beach Watch Program (TBWP) and collects water samples from 163 stations along the Texas coast in Aransas, Brazoria, Cameron, Galveston, Jefferson, Kleberg, Matagorda, Nueces, and San Patricio Counties. Sample collection occurs weekly (one time at each station) during the peak beach season from May through September and bi-weekly from October through April with water samples collected 0.6 m (2 ft.) from the surface or at knee depth. The GLO maintains a website at Texas Beach Watch where maps and bacteria water quality information are available. Bacteria results are updated each time sample data are entered into the TBWP database. Local government entities typically post Beach Watch advisory signs at beach access points and issue advisories that warn the public not to swim in affected waters when bacterial levels are exceeded. TBWP advisories are issued when the average of two samples exceed EPA’s recommended single sample maximum density (SSMD) criteria of 104 CFU or MPN/100 ml. Once issued, that beach is subject to continued monitoring every 24 hours until bacteria levels fall to <104 CFU or MPN/100 ml. Advisories last for 24 hours, and are extended if bacteria levels continue to exceed SSMD recommended levels. All samples are collected under a QAPP

1.3
consistent with TCEQ bacteria collection and analysis protocols and analyzed for enterococci bacteria using EPA’s Method 1600 or the IDEXX Enterolert® system. TCEQ is provided with a compilation of all beach data collected by GLO under the TBWP. Based on total number of samples for each beach and the number of days each beach is under an advisory, TCEQ assesses each individual year within the multi-year assessment period of record. For all available data, the total number of advisory days are divided by the total number of samples collected. If there are numerous sites monitored at one beach area, only one advisory is counted per beach per day. TCEQ includes TBWP information in the 303(d)/305(b) assessment process in order to protect human health by identifying beaches with persistent advisories. Assessment consists of identifying the percentage of days each beach has an advisory. The recreation use is not supported if the geometric mean of the samples collected over the assessment period exceeds the criterion (35 CFU or MPN/100 ml) or if the criteria for individual samples (104 CFU or MPN/100) ml are exceeded greater than 25% of the time. Beach advisories <25% of the time—Fully Supporting Beach advisories 20-25% of the time—Concern and Fully Supporting Beach advisories < 20% of the time—Delisted and Fully Supporting Beach advisories ≥ 25% of the time—Not Supporting
1.3 Project Objectives The Center for Coastal Studies (CCS) at Texas A&M University was contracted to provide support to TCEQ and future Total Maximum Daily Load (TMDL) development for Enterococcus bacteria concerns at beaches along Corpus Christi Bay (Segment 2481). Project goals require the collection of supplementary Enterococcus data in Corpus Christi Bay. Data collection specifically targets beaches at Cole Park (Segment 2481CB_03), Ropes Park (Segment 2481CB_04), Emerald Beach (Segment 2481CB_07), McGee Beach (Segment 2481CB_05), Poenisch Park (Segment 2481CB_06), Corpus Christi Beach (Segment 2481CB_02), and University Beach (Segment 2481CB_08). Public and stakeholder meetings will be hosted as necessary to support the TCEQ TMDL Team. To ensure that data generated for the purposes described herein are scientifically valid and legally defensible, this project is being conducted under a TCEQ approved Quality Assurance Project Plan (QAPP). This ensures that data submitted to the TCEQ Surface Water Quality Monitoring Information System database have been collected and analyzed in a way that guarantees its reliability.

2.1
2.0 STUDY AREA DESCRIPTION 2.1 Corpus Christi According to data obtained from the City of Corpus Christi Department of Developmental Services, the total area within the city limits is 1060.6 km2 (409.5 mi2). Land represents 409.7 km2 (158.2 mi2) with water and right-of-way easements contributing 526.3 km2 (230.2 mi2) and 54.6 km2 (21.1 mi2), respectively. The population was 305,215 at the 2010 census making it the eighth-largest city in Texas. The population of the Corpus Christi Metropolitan Statistical Area, which consists of Nueces, Aransas, and San Patricio Counties, was 428,185. Corpus Christi is a popular tourist destination and the Corpus Christi Convention and Visitors Bureau actively promotes coastal living and area beaches as a premier attraction. 2.2 Climate Corpus Christi is located between a humid subtropical region to the northeast and a semiarid region to the west and southwest of the city. Summers are hot and humid, with June through August high temperatures exceeding 32.2 °C (90.0 °F) 83.0% of the time with an average morning humidity of 93.0% (National Climatic Data Center 2010). Moderate winters, where the average high in January is 18.3 °C (65.0 °F) and the low is 7.2 °C (45.0 °F), may occasionally produce a freeze following the passage of strong northerly high-pressure fronts (Jones 1975; Chabreck 1990). December through February low temperatures are below freezing only 11% of the time (National Climatic Data Center 2010). Mean annual precipitation recorded at Corpus Christi International Airport is approximately 77.6 cm yr-1 (30.6 in yr-1) (NOAA 2010). This is offset by evaporation rates ranging from 90 to 115 cm yr-1 (35.4 to 45.3 in yr-1) but may reach as high as 150 cm yr-1 (TWC 1991). Peak rainfall months are from May to September with the winter months being the driest season. Southeasterly prevailing winds serve as a primary source of atmospheric moisture. The hurricane season runs from June to November (peak months are August and September), with tropical storms and hurricanes occasionally yielding substantial amounts of rainfall during late summer and early fall (Armstrong 1987).

3.1
3.0 METHODS 3.1 Sampling Process Design and Frequency The sample design for this study is based on program requirements of the Total Maximum Daily Load Program. These requirements involve collection of sufficient quantity and quality of data to characterize water quality under varied conditions, identify the presence or absence of impairments, and to support water quality modeling, load allocation development, and other TMDL information needs for Enterococcus concerns at several beaches along Corpus Christi Bay. Due to the public health nature of this TMDL, sites were selected based on the presence of established beaches or public access points to the water with additional sites selected in the offshore waters of Corpus Christi Bay (Fig. 3.1) for comparison of enterococci concentrations between nearshore and offshore locations. As the beaches at Cole Park and Ropes Park are listed on the 303(d) List of Impaired Waters for bacteria these beaches were the primary focus for this intensive data collection effort. After discussions with the TMDL team, additional locations were added along the Corpus Christi Bay shoreline to obtain sufficient spatial comparison information of aquatic bacteria concentrations within this urban watershed. The areas chosen along Corpus Christi Bay (Fig. 3.1) represent 10 urban beach/public access sampling locations (Figs. 3.2 through 3.11) that also coincide with existing stations sampled by the Texas Beach Watch Program. Due to the size of Cole Park, four locations were established for Enterococcus sampling. However, for advisory and assessment purposes Cole Park is treated as one single location regardless of the number of exceedances on a given day (i.e. if four samples exceed the 104 MPN/100 ml criteria that day only one advisory is issued for Cole Park). Four stations were established at each of the 10 sampling locations (three nearshore and one offshore) for a total of 30 nearshore sampling stations and 10 offshore sampling locations (Figs. 3.2 through 3.11). Samples collected at each nearshore location were collected along a transect line starting at the beach and continuing offshore. While the distance from the beach varied at each of the 30 nearshore stations, the total depth to the bottom at each point a sample was collected will be approximately at 0.6 m, 1.0 m, and 1.5 m, with the actual sample being collected at the standard 0.3 m depth in the water column. These samples are considered representative of ambient water quality conditions at the “knee,” “waist,” and “chest” high depths often encountered by the public in the water at these public access locations. In order to document the fate and transport of Enterococcus, the fourth station was located along each transect line in the deeper waters (>3.0 m) of Corpus Christi Bay. Samples were collected from a boat at the appropriate depth from the surface (0.3 m). The intent of data collection at varying distances from the shoreline is to determine if bacteria concentrations are similar or if concentrations decrease as distance from shore increases. To supplement the water quality sampling, sediment samples were collected at shoreline locations for analysis of bacteria in the swash zone, or zone of wave interaction. These data were collected for background and supporting information purposes to better understand the extent of bacterial concentrations that exist in the sediment layer at these urban beach/public access locations. Additional rainfall collection events occurred at the 30 nearshore locations

3.2
within 24 and 48 hours following a rainfall event to collect data on bacterial concentrations entering the bay from stormwater runoff. This effort involved the collection of field and microbiological data as described in the QAPP and listed in Table 3.1. Sampling took place from 5/4/2011 through 8/27/2011 to correspond with the Texas Beach Watch “Beach Season” (5/1 through 9/30) when beach use by the public is high. Sampling occurred a minimum of two times per week at the 10 urban beach/public access sampling locations (30 total nearshore stations) with offshore (10 stations), rain event (30 nearshore stations), and sediment (10 beach locations) sampling occurring at a reduced frequency. During the four-month period, the 30 nearshore stations were sampled 49 times (43 non-rainfall and six rainfall) and the 10 offshore stations were sampled three times. In addition, sediment sampling took place four times at the 10 beach locations. All data underwent quality assurance checks and complied with TCEQ Data Management protocol. Data will be available to the public and stored in the TCEQ SWQMIS database to be utilized for TMDL development.

3.3
Fig. 3.1. Aerial photo depicting Corpus Christi Bay Beaches TMDL sampling locations and three major drainage ditches at Louisiana
Parkway, Brawner Parkway, and Carmel Parkway. Retrieved on 4/5/2011 from Google Earth.
Corpus Christi Beach
Poenisch Park
University Beach
Ropes Park
McGee Beach Emerald Beach
Cole Park (4 locations)
N

3.4
Fig. 3.2. Aerial photo depicting the four Corpus Christi Beach (North Beach) sampling locations. Retrieved on 4/5/2011 from Google
Earth.

3.5
Fig. 3.3. Aerial photo depicting the four McGee Beach (20940, 20941, 20942, and 21048) and four Emerald Beach sampling locations.
Retrieved on 4/5/2011 from Google Earth.

3.6
Fig. 3.4. Aerial photo depicting the four Cole Park sampling locations (16 stations). Retrieved on 4/5/2011 from Google Earth.

3.7
Fig. 3.5. Aerial photo depicting the four Ropes Park sampling locations. Retrieved on 4/5/2011 from Google Earth.

3.8
Fig. 3.6. Aerial photo depicting the four Poenisch Park sampling locations. Retrieved on 4/5/2011 from Google Earth.

3.9
Fig. 3.7. Aerial photo depicting the four University Beach sampling locations. Retrieved on 4/5/2011 from Google Earth.

3.10
Table 3.1. Parameters analyzed for the Corpus Christi Bay Beaches TMDL project.
Routine Field Parameters Units Parameter Codes* Depth of Bottom of Water Body at Site Meters 82903 Depth of Measurement Meters 13850 Sediment core sample, Upper Depth Inches 81900 Temperature, Water (Grab) °C 00010 Dissolved Oxygen (Grab) mg/L 00300 Dissolved Oxygen (Grab) % Saturation 00301 Salinity (Grab) ppt (psu) 00480 Specific Conductance (Grab) μS/cm 00094 PH (Grab) s.u. 00400 Turbidity NTU 82078 Days Since Last Significant Precipitation Days 72053
Routine Field Observations Air Temperature °C 00020 Present Weather Visual Assessment 89966 Wind Intensity MPH 89965 Wind Direction Compass Direction 89010 Tide Stage Meters 89972 Water Surface Visual Assessment 89968 Current/Wind Direction Onshore/Offshore 70224 Density of People in Park Number 89960 Bather Density in Water Number 89964 Bather Density on Shoreline Number 89967 Boats (within 500 meters of sampling area) Number 89970 Number Live Animals on Beach/Shore Number 89897 Number Dead Animals on Beach/Shore Number 89898 Area of Beach Clean Percent 89886 Debris found on beach, aquatic vegetation Percent 89887 Debris found on beach, aluminum/metal Percent 89889 Debris found on beach, glass Percent 89890 Debris found on beach, animal waste Percent 89892 Debris found on beach, paper/cardboard Percent 89893 Debris found on beach, plastic/Styrofoam Percent 89894 Debris found on beach, medical waste Percent 89895 Debris found on beach, wood Percent 89896

3.11
Table 3.1. (continued).
Microbiological Enterococci, Enterolert, Water, IDEXX MPN/100 ml 31701 Enterococci, Sediment, IDEXX Enterolert, WetWt MPN/100 ml 31703
Sediment Grain Size Sediment Particle Size Class < 0.0039 Clay % dry weight 82009 Sediment Particle Size Class 0.0039 –0.0625 Silt % dry weight 82008 Sediment Particle Size Class, Sand 0.0625 – 2.00 mm % dry weight 89991
Sediment Particle Size Class > 2.0 mm Gravel % dry weight 80256
Sediment Conventionals
Total Organic Carbon, NPOC (TOC) mg/kg dry weight 81951 Solids in Sediment % dry weight 81373
3.2 Sampling Methods
The CCS followed sampling procedures as documented in the TCEQ-approved QAPP for this project. A three-person field crew conducted water and sediment sampling on a weekly basis either from shore or by boat. At each sampling site, field crews collected a core set of water quality and field parameters following methods and protocols described in the TCEQ Surface Water Quality Monitoring Procedures Volume 1: Physical and Chemical Monitoring Methods for Water, Sediment and Tissue (TCEQ RG-415), and the QAPP. Core water quality and field parameters included those specified in Table 3.1 with additional or modified procedures for field sampling clarified in detail below. 3.2.1. Field Parameter Measurements The first activities conducted upon arriving onsite were routine field observations such as ambient weather, water conditions, and beach survey information (see Table 3.1 Routine Field Observations). 3.2.2. Hydrographic Profile Water column profiles were conducted at each station to measure routine water quality parameters (see Table 3.1 Routine Field Parameters) using a YSI multiparameter water quality instrument with a cable connection to a hand held display. Hydrographic profiles were conducted according to the TCEQ Surface Water Quality Monitoring Procedures Volume 1: Physical and Chemical Monitoring Methods for Water, Sediment, and Tissue (December 2003) requirements for vertical depth profiles. 3.2.3. Microbiological Samples - Water Before sample collection, sampling sites and date were written on the bottle label and on the field log sheet. In order to reduce possible contamination before collecting samples from a

3.12
station, all field personnel washed hands and arms with alcohol wipes or a disinfectant lotion to reduce exposure to potentially harmful bacteria or other microorganisms. After drying washed areas, all field personnel wore latex gloves while performing sample collection. Personnel removed the protective seal from the sterile collection bottles just before obtaining each sample and protected them from contamination by not touching the inside of the bottle itself or the inside of the lid. While collecting the surface water sample, personnel avoided disturbing the bottom sediment at the sampling station and positioned the bottle upstream of any water current to avoid sample contamination. The bottle mouth was positioned into the current away from the hand of the personnel and pushed downward into the water to avoid introducing surface scum. Sampling depth was 0.3 m below the water surface at all locations. Upon removing the bottle from the water, the sample was inspected for any debris, contaminants, or excessive sediment/sand. If the personnel felt the sample might have been contaminated, a new bottle was used to take a new sample. Upon taking a successful sample, the lid was tightly closed and the bottle labeled with the time the sample was collected. Samples were immediately placed on ice at < 6 °C for transport to the laboratory. Care was taken to ensure sample bottles were not immersed in melt water during storage or transit to the laboratory. After collecting samples from a station, personnel washed hands and arms with alcohol wipes or a disinfectant lotion and dried affected areas to reduce exposure to potentially harmful bacteria or other microorganisms. 3.2.4. Microbiological Samples - Sediment Microbiological sediment samples followed all applicable procedures mentioned above for microbiological sampling in water regarding prevention of contamination and sample bottle labeling. As no established microbiological sediment sampling procedures exist, this sampling method deviates from established TCEQ protocols. Sampling occurred in the swash zone, or zone of wave action, depending on the water level at the beach during time of sampling. The surficial sediment layer (2 cm) was collected by pushing the sampling container in a direction parallel to the beach face until full. If water was collected along with the sediment sample, the water was poured off. All samples were placed on ice at < 6 °C during transit to the laboratory and care was taken to ensure sample bottles were not totally immersed in melt water during transit or storage. 3.2.5. Total Organic Carbon, Sediment Grain Size, Percent Solids As a companion to sampling sediment for microbiological organisms, the standard TCEQ sediment conventionals were also collected for analysis. As it is impractical to use a sediment dredge sampler, collection methods did deviate from TCEQ protocols. As with microbiological sediment sampling procedures outlined above, the surficial sediment layer (2 cm) in the swash zone was collected by spatula or scoop and composited (minimum of 12 scoops) to provide adequate sediment for the analyses of total organic carbon (TOC), grain size, and percent solids. Approximately 114 g of sediment was placed into two clean, pre-labeled, wide-mouth glass jars and all samples were placed on ice at < 6 °C during transit to the laboratory with care taken to ensure sample bottles were not totally immersed in melt water during transit or storage.

4.1
4.0 INTERIM DATA RESULTS This report represents data for the first year of this multi-year project. Until sufficient data is collected, data interpretation will be minimal and no conclusions will be drawn. 4.1 Field Data (Non-rainfall events) Descriptive statistics for Water Temperature (°C), Dissolved Oxygen (mg/L), Salinity (PSU), pH (s.u.), and Turbidity (NTU) for all 30 nearshore stations sampled May through August 2011 and the 10 offshore stations sampled in August 2011 are provided in Tables 4.1 through 4.5. As the 10 offshore stations were only sampled in August, the discussion will be primarily on the 30 nearshore stations sampled for the duration of the project. During year-one, water temperature was consistent with water temperatures for the region based on the season sampling occurred. Water temperature ranged from 19.14 °C to 33.07 °C with both low and high recorded at Station 20964 at University Beach (Table 4.1). Water temperature increased from May 2011 through the summer months with mean temperatures relatively consistent for all stations sampled. Dissolved oxygen (DO) ranged from 4.79 mg/L at Station 20964 at University Beach to 10.99 mg/L at Station 20958 at Ropes Park (Table 4.2). Mean DO was greatest at Station 20958 at Ropes Park and of the 1290 DO readings recorded at the 30 nearshore stations, only three fell below the 5.00 mg/L exceptional aquatic life criteria established for Corpus Christi Bay. Salinity ranged from 21.91 PSU at Station 20952 at Cole Park (Louisiana) to 44.06 PSU at Station 20965 at University Beach (Table 4.3). Mean salinity of all stations combined was 37.49 PSU. Continued lack of significant rainfall intensified the existing drought throughout Texas. As a result, Corpus Christi Bay had a 10 PSU increase in salinity by August. pH ranged from 7.53 at Station 20937 at Corpus Christi Beach-Surfside Park to 8.41 at Station 20958 at Ropes Park (Table 4.4). Mean pH of all stations combined was 8.18 over the course of the four-month sampling period. Turbidity is a measurement of water clarity by measuring the amount of suspended particles resulting from such sources as natural sediment erosion (clay, silt, and sand particles), organic decay, plankton, and other microscopic organisms. Due to the consistent action of wind and waves on the shoreline where sampling occurred, turbidity fluctuations were the greatest of all parameters during the study. Turbidity ranged from 0.90 NTU at Station 20946 at Cole Park (North) to 1862.40 NTU at Station 20953 at Cole Park (Louisiana) (Table 4.5). Mean turbidity for all stations combined was 30.00 NTU over the course of the four-month sampling period. Lowest turbidity occurred during the summer months when wind speeds typically are lower compared to other times of the year.

4.2
Table 4.1. Water Temperature (°C) descriptive statistics for all 30 nearshore (May – August 2011) and 10 offshore (August 2011) Corpus Christi Bay Beaches TMDL stations sampled.
Station ID Sampling Location n Min Max Mean 20937 CC Beach Surfside Park 43 21.93 32.60 29.23 20938 43 21.98 32.33 29.51 20939 43 21.99 32.16 29.58 21047 3 30.26 31.03 30.72
20940 McGee Beach 43 22.09 32.84 29.76
20941 43 22.15 32.43 29.73 20942 43 22.39 31.85 29.71 21048 3 30.49 31.77 31.06
20943 Emerald Beach 43 22.20 32.23 29.87 20944 43 22.07 31.70 29.67 20945 43 22.30 31.68 29.64 21049 3 30.37 31.61 31.01
20946 Cole Park North 43 21.81 32.28 29.73 20947 43 21.66 32.06 29.68 20948 43 21.58 32.13 29.71 21050 3 30.49 31.34 30.94
20949 Cole Park Pier 43 21.74 31.94 29.44 20950 43 21.96 31.51 29.47 20951 43 22.17 31.57 29.46 21051 3 30.57 31.28 31.02
20952 Cole Park Louisiana 43 21.83 32.12 29.37 20953 43 21.87 32.05 29.34 20954 43 21.62 31.92 29.36 21052 3 30.58 31.28 31.02
20955 Cole Park Oleander Point 43 21.34 31.60 29.25 20956 43 21.46 31.56 29.18 20957 43 21.64 31.67 29.25 21053 3 30.61 31.14 30.94
20958 Ropes Park 43 21.18 31.96 29.57 20959 43 21.29 31.87 29.45 20960 43 21.42 31.60 29.36 21054 3 30.36 31.29 30.75
20961 Poenisch Park 43 20.03 32.56 29.69 20962 43 20.05 32.17 29.47 20963 43 20.58 32.01 29.41 21055 3 30.34 30.90 30.68
20964 University Beach 43 19.14 33.07 28.79 20965 43 19.79 32.14 28.76 20966 43 19.92 31.57 28.88 21056 3 30.35 30.72 30.57

4.3
Table 4.2. Dissolved Oxygen (mg/L) descriptive statistics for all 30 nearshore (May – August 2011) and 10 offshore (August 2011) Corpus Christi Bay Beaches TMDL stations sampled.
Station ID Sampling Location n Min Max Mean 20937 Corpus Christi Beach Surfside Park 43 5.59 9.09 7.44 20938 43 5.59 9.58 7.31 20939 43 5.52 10.10 7.25 21047 3 7.19 7.62 7.41
20940 McGee Beach 43 5.32 8.63 7.31 20941 43 5.40 8.60 7.23 20942 43 5.16 8.71 7.15 21048 3 6.91 7.54 7.19
20943 Emerald Beach 43 5.62 9.03 7.17 20944 43 5.70 9.03 7.03 20945 43 5.81 9.04 6.89 21049 3 6.80 7.55 7.12
20946 Cole Park North 43 5.62 9.23 7.43 20947 43 6.21 8.78 7.32 20948 43 6.13 8.70 7.28 21050 3 6.91 7.39 7.16
20949 Cole Park Pier 43 5.25 8.44 6.80 20950 43 6.01 8.48 7.16 20951 43 5.85 8.33 7.06 21051 3 6.90 7.48 7.13
20952 Cole Park Louisiana 43 6.05 9.84 7.65 20953 43 5.89 9.59 7.32 20954 43 5.77 8.98 7.20 21052 3 6.87 7.22 7.00
20955 Cole Park Oleander Point 43 5.94 10.11 7.73 20956 43 5.81 9.38 7.25 20957 43 5.81 9.22 7.22 21053 3 6.84 7.23 6.98
20958 Ropes Park 43 5.64 10.99 8.39 20959 43 5.32 10.58 7.87 20960 43 5.15 9.30 7.21 21054 3 6.77 7.26 7.08
20961 Poenisch Park 43 5.95 10.47 7.95 20962 43 5.62 9.68 7.47 20963 43 5.48 9.41 7.35 21055 3 6.76 7.14 6.90
20964 University Beach 43 4.79 9.19 6.80 20965 43 4.98 9.23 6.59 20966 43 5.12 8.60 6.57 21056 3 6.73 7.54 7.15

4.4
Table 4.3. Salinity (PSU) descriptive statistics for all 30 nearshore (May – August 2011) and 10 offshore (August 2011) Corpus Christi Bay Beaches TMDL stations sampled.
Station ID Sampling Location n Min Max Mean 20937 CC Beach Surfside Park 43 32.87 41.61 36.82 20938 43 29.89 41.63 36.71 20939 43 32.93 41.60 36.86 21047 3 39.70 40.49 40.11
20940 McGee Beach 43 33.58 41.32 37.22 20941 43 30.66 41.38 37.05 20942 43 33.61 41.41 37.20 21048 3 39.15 41.05 40.06
20943 Emerald Beach 43 32.48 41.32 37.17 20944 43 33.61 41.32 37.23 20945 43 33.60 41.32 37.22 21049 3 39.10 41.02 40.06
20946 Cole Park North 43 29.91 41.20 37.24 20947 43 33.72 41.26 37.34 20948 43 30.18 41.26 37.24 21050 3 39.21 40.95 40.08
20949 Cole Park Pier 43 26.23 41.17 36.86 20950 43 33.81 41.15 37.26 20951 43 33.82 41.19 37.27 21051 3 39.23 40.91 40.10
20952 Cole Park Louisiana 43 21.91 41.16 37.20 20953 43 33.78 41.22 37.52 20954 43 30.88 41.19 37.41 21052 3 39.40 40.90 40.17
20955 Cole Park Oleander Point 43 33.45 41.33 37.62 20956 43 33.79 41.35 37.60 20957 43 29.92 41.26 37.45 21053 3 39.39 40.86 40.15
20958 Ropes Park 43 33.65 41.61 37.59 20959 43 33.80 41.61 37.61 20960 43 33.86 41.58 37.59 21054 3 39.28 40.91 40.08
20961 Poenisch Park 43 33.10 41.69 38.01 20962 43 33.47 41.72 38.02 20963 43 33.21 41.67 37.97 21055 3 39.49 41.08 40.31
20964 University Beach 43 31.30 44.05 38.95 20965 43 33.82 44.06 38.99 20966 43 29.06 43.02 38.59 21056 3 39.76 41.28 40.56

4.5
Table 4.4. pH (s.u.) descriptive statistics for all 30 nearshore (May – August 2011) and 10 offshore (August 2011) Corpus Christi Bay Beaches TMDL stations sampled.
Station ID Sampling Location n Min Max Mean 20937 CC Beach Surfside Park 43 7.53 8.25 8.03 20938 43 8.00 8.29 8.12 20939 43 8.04 8.30 8.15 21047 3 8.18 8.24 8.21
20940 McGee Beach 43 7.86 8.32 8.17 20941 43 8.11 8.33 8.20 20942 43 8.07 8.32 8.19 21048 3 8.23 8.25 8.24
20943 Emerald Beach 43 8.02 8.29 8.17 20944 43 8.02 8.29 8.18 20945 43 8.04 8.29 8.18 21049 3 8.21 8.24 8.23
20946 Cole Park North 43 8.10 8.34 8.19 20947 43 8.04 8.32 8.19 20948 43 8.10 8.32 8.20 21050 3 8.19 8.25 8.23
20949 Cole Park Pier 43 7.90 8.29 8.15 20950 43 8.07 8.31 8.18 20951 43 8.01 8.31 8.17 21051 3 8.23 8.25 8.24
20952 Cole Park Louisiana 43 7.83 8.31 8.18 20953 43 7.93 8.31 8.20 20954 43 7.98 8.34 8.21 21052 3 8.24 8.26 8.25
20955 Cole Park Oleander Point 43 7.86 8.35 8.18 20956 43 8.05 8.35 8.20 20957 43 8.02 8.35 8.20 21053 3 8.23 8.23 8.23
20958 Ropes Park 43 7.90 8.41 8.21 20959 43 8.00 8.35 8.21 20960 43 8.01 8.31 8.20 21054 3 8.21 8.23 8.22
20961 Poenisch Park 43 7.93 8.38 8.21 20962 43 8.04 8.32 8.20 20963 43 8.09 8.33 8.21 21055 3 8.21 8.24 8.23
20964 University Beach 43 7.74 8.30 8.12 20965 43 7.99 8.32 8.19 20966 43 8.05 8.36 8.21 21056 3 8.21 8.25 8.24

4.6
Table 4.5. Turbidity (NTU) descriptive statistics for all 30 nearshore (May – August 2011) and 10 offshore (August 2011) Corpus Christi Bay Beaches TMDL stations sampled.
Station ID Sampling Location n Min Max Mean 20937 CC Beach Surfside Park 42 1.90 83.50 23.39 20938 42 1.70 70.20 20.45 20939 42 1.40 68.50 20.65 21047 3 3.10 10.30 5.93
20940 McGee Beach 42 3.00 52.70 17.03 20941 42 4.20 54.50 16.76 20942 42 4.00 55.90 16.55 21048 3 5.30 10.30 7.03
20943 Emerald Beach 42 1.30 108.60 21.57 20944 42 3.70 59.30 18.80 20945 42 3.00 58.40 16.90 21049 3 5.20 9.30 6.87
20946 Cole Park North 42 0.90 1132.20 58.47 20947 42 2.40 1138.80 47.04 20948 42 2.10 1132.10 45.68 21050 3 4.60 12.80 7.37
20949 Cole Park Pier 42 1.80 58.50 16.38 20950 42 3.00 62.60 15.61 20951 42 2.40 96.60 17.88 21051 3 4.50 8.20 6.10
20952 Cole Park Louisiana 42 2.20 1861.60 71.63 20953 42 3.70 1862.40 68.58 20954 42 3.70 1854.90 65.59 21052 3 4.70 9.20 7.10
20955 Cole Park Oleander Point 42 2.10 422.20 41.18 20956 42 3.00 361.90 31.62 20957 42 2.80 371.70 30.81 21053 3 5.00 7.30 6.20
20958 Ropes Park 42 2.00 89.40 21.10 20959 42 2.00 66.70 18.38 20960 42 3.50 59.90 19.23 21054 3 4.20 7.30 5.63
20961 Poenisch Park 42 1.70 141.80 24.55 20962 42 2.50 61.60 22.58 20963 42 2.40 69.80 20.96 21055 3 4.20 8.30 5.93
20964 University Beach 42 3.60 117.80 35.87 20965 42 3.90 115.90 30.01 20966 42 3.50 128.80 24.65 21056 3 3.10 4.20 3.60

4.7
4.2 Precipitation To determine precipitation for the study area, four locations were used to determine approximate amounts of rainfall preceding a rainfall sampling event. The four stations were: KTXINGLE6 located at the Air Liquide Plant in Ingleside, Texas, KTCORPU19 located at King Estates, KNGP located at Naval Air Station-Corpus Christi, and KCRP located at Corpus Christi International Airport (Fig. 4.1). Using Ropes Park as the approximate center point of the shoreline being sampled, these four locations were used since no rain gauge instrumentation exists in close proximity to the sampling stations. Table 4.6 gives station information and individual rainfall amounts recorded prior to, and during, rainfall event sampling. The greatest amount of rainfall occurred during the first rainfall event in May 2011. Rainfall amounts declined in subsequent events as the drought progressed through the summer months (Table 4.6 and Fig. 4.2).
Fig. 4.1. Aerial photo depicting shoreline area being sampled (red) and location of gauged
rainfall station (yellow) in relation to Ropes Park (white) used for obtaining precipitation data. Retrieved on 12/1/2011 from Google Earth.

4.8
Table 4.6. Station location information for gauged rainfall stations with individual station rainfall amounts (inches) and a mean of all stations combined for the three rainfall events. Note: PWS = Personal Weather Station and NWS = National Weather Service.
Station Call Sign KTXINGLE6 KNGP KTXCORPU19 KCRP Station Name Air Liquide NAS-CC King Estates CC Int. Airport Station Type PWS NWS PWS NWS Miles to Ropes Park 12 to NE 7 to ESE 7.5 to S 7.5 to W Date Mean 5/12/2011 1.01 1.22 1.28 1.90 1.35 5/13/2011 0.01 <0.01 5/14/2011 6/22/2011 0.38 0.21 0.81 0.37 0.44 6/23/2011 0.05 0.13 0.63 0.20 6/24/2011 8/25/2011 0.77 0.05 0.25 0.28 0.34 8/26/2011 0.04 0.01 8/27/2011
Fig. 4.2. Mean rainfall calculated from the four weather stations from 5/1/2011 through
8/31/2011.

4.9
4.3 Field Data (Rainfall events) Data is provided in Tables 4.7 through 4.11 for Water Temperature (°C), Dissolved Oxygen (mg/L), Salinity (PSU), pH (s.u.), and Turbidity (NTU) for all 30 nearshore stations sampled during rainfall events (see Table 4.6 for rainfall amounts). Except for turbidity, where readings fluctuated the greatest, data collected for all other parameters was consistent with data obtained during non-rainfall events. Table 4.7. Water Temperature (°C) for all 30 nearshore Corpus Christi Bay Beaches TMDL stations sampled during rainfall events. Station ID Sampling Location 5/13/11 5/14/11 6/23/11 6/24/11 8/26/11 8/27/11 20937 CC Beach Surfside Park 26.39 26.93 30.25 31.53 31.36 31.38 20938 26.13 26.75 29.80 31.26 31.25 31.58 20939 26.01 26.99 29.32 30.89 31.37 31.62 20940 McGee Beach 26.46 26.77 28.82 31.66 31.67 32.00 20941 26.17 26.71 28.73 30.38 31.34 31.92 20942 25.94 26.83 28.48 30.30 31.91 31.92 20943 Emerald Beach 26.33 26.70 28.59 30.10 31.32 31.75 20944 26.04 26.74 28.63 29.88 31.25 31.77 20945 26.10 26.67 28.69 29.86 31.26 31.63 20946 Cole Park North 26.24 26.97 28.17 30.23 31.59 31.80 20947 25.80 27.06 27.78 29.63 31.49 31.65 20948 25.84 27.09 28.17 30.02 31.42 31.68 20949 Cole Park Pier 25.63 26.37 28.04 29.68 30.79 31.22 20950 25.45 26.77 28.36 29.41 31.13 31.50 20951 25.44 26.77 28.50 29.62 31.21 31.42 20952 Cole Park Louisiana 25.73 26.13 27.90 29.82 30.48 31.76 20953 25.58 26.12 27.59 29.37 30.55 31.45 20954 25.32 26.24 28.21 29.28 30.81 31.44 20955 Cole Park Oleander Point 24.82 25.55 27.74 29.45 29.82 29.88 20956 24.71 25.75 27.76 29.18 29.97 30.28 20957 25.10 25.84 27.82 29.26 30.11 30.26 20958 Ropes Park 24.98 25.49 27.91 28.92 30.66 30.94 20959 24.98 25.57 27.91 28.81 30.59 30.93 20960 24.96 25.72 27.88 28.71 30.51 30.99 20961 Poenisch Park 24.51 24.17 27.26 29.03 30.12 30.57 20962 24.45 24.17 27.40 28.92 30.04 30.69 20963 24.27 24.16 27.42 28.98 30.19 30.77 20964 University Beach 24.18 23.70 26.95 28.73 29.60 29.49 20965 24.33 23.91 27.11 28.55 30.07 29.92 20966 24.61 24.34 27.51 28.69 30.41 30.44

4.10
Table 4.8. Dissolved Oxygen (mg/L) for all 30 nearshore Corpus Christi Bay Beaches TMDL stations sampled during rainfall events.
Station ID Sampling Location 5/13/11 5/14/11 6/23/11 6/24/11 8/26/11 8/27/11 20937 CC Beach Surfside Park 6.96 8.05 8.57 7.84 7.60 7.78 20938 7.29 8.33 8.20 9.11 7.56 7.35 20939 6.76 8.53 8.05 9.99 7.30 7.09 20940 McGee Beach 7.11 7.51 8.70 9.11 6.47 7.71 20941 6.94 7.79 8.70 10.57 6.21 6.31 20942 6.31 8.14 8.43 10.61 6.53 5.96 20943 Emerald Beach 7.05 7.21 8.47 10.50 7.36 7.92 20944 6.78 7.02 8.39 10.30 6.91 6.91 20945 6.29 7.47 8.13 10.30 6.92 6.66 20946 Cole Park North 6.82 6.77 8.29 10.26 7.19 7.68 20947 6.52 6.46 7.65 9.44 6.66 7.46 20948 6.51 6.31 8.18 9.97 6.26 7.21 20949 Cole Park Pier 7.09 7.71 7.24 9.62 5.28 5.40 20950 6.64 7.78 8.09 9.11 6.91 6.90 20951 6.55 6.41 8.11 8.12 6.94 7.22 20952 Cole Park Louisiana 6.31 7.54 8.12 10.20 5.87 6.15 20953 6.25 7.39 7.44 9.27 5.70 6.60 20954 6.16 7.50 8.20 9.45 5.93 6.54 20955 Cole Park Oleander Point 6.60 7.43 7.69 10.31 6.09 6.27 20956 6.21 7.49 7.70 9.08 5.75 6.40 20957 6.09 7.43 7.81 9.00 5.98 6.38 20958 Ropes Park 6.14 7.67 7.52 8.26 5.81 7.29 20959 5.82 7.19 7.48 7.77 5.47 5.85 20960 5.73 6.99 7.32 7.84 4.96 5.70 20961 Poenisch Park 7.02 7.32 7.33 8.80 7.02 6.82 20962 6.57 7.16 6.82 8.04 6.50 6.71 20963 6.38 7.12 7.40 8.18 6.36 6.78 20964 University Beach 7.32 7.51 7.10 7.38 6.37 5.47 20965 6.27 7.43 7.10 7.84 6.06 5.82 20966 5.92 6.56 6.59 7.54 6.23 5.74

4.11
Table 4.9. Salinity (PSU) for all 30 nearshore Corpus Christi Bay Beaches TMDL stations sampled during rainfall events.
Station ID Sampling Location 5/13/11 5/14/11 6/23/11 6/24/11 8/26/11 8/27/11 20937 CC Beach Surfside Park 33.93 33.06 34.53 35.10 40.78 40.15 20938 34.11 29.33 34.56 34.98 40.71 40.26 20939 34.17 32.98 34.92 34.96 40.57 40.30 20940 McGee Beach 35.82 33.25 34.80 34.79 39.97 40.38 20941 35.22 30.43 34.76 34.77 40.04 40.47 20942 34.91 33.25 34.67 34.77 40.35 40.53 20943 Emerald Beach 35.63 33.26 34.86 34.79 39.94 40.25 20944 35.85 33.18 34.79 34.78 40.09 40.29 20945 35.83 33.18 34.73 34.78 40.09 40.31 20946 Cole Park North 35.44 26.23 34.68 34.47 39.62 40.49 20947 35.47 33.25 34.75 34.92 40.14 40.48 20948 35.62 32.98 35.02 34.93 40.11 40.50 20949 Cole Park Pier 35.55 33.22 34.82 34.95 39.27 40.42 20950 35.56 33.20 35.08 35.06 40.38 40.58 20951 35.46 33.31 35.04 35.07 40.43 40.60 20952 Cole Park Louisiana 35.78 33.59 34.94 33.68 38.33 40.52 20953 35.93 33.44 35.39 35.18 39.65 40.54 20954 35.92 33.31 35.26 35.21 40.16 40.54 20955 Cole Park Oleander Point 35.93 33.52 35.16 35.05 38.29 39.87 20956 35.87 33.64 35.42 35.28 38.77 40.16 20957 35.87 33.61 35.53 35.27 38.85 40.15 20958 Ropes Park 35.53 34.04 35.89 36.00 40.25 40.67 20959 35.55 34.06 35.89 35.97 40.28 40.71 20960 35.54 34.05 35.84 35.91 40.33 40.69 20961 Poenisch Park 34.68 33.76 37.86 37.15 41.47 41.46 20962 34.80 33.81 37.82 37.10 41.49 41.45 20963 34.98 33.82 37.88 37.05 41.49 41.45 20964 University Beach 34.81 34.24 38.93 38.15 42.02 42.04 20965 34.89 27.57 39.03 38.25 41.87 42.01 20966 34.88 33.96 38.52 38.08 41.77 41.93

4.12
Table 4.10. pH (s.u.) for all 30 nearshore Corpus Christi Bay Beaches TMDL stations sampled during rainfall events.
Station ID Sampling Location 5/13/11 5/14/11 6/23/11 6/24/11 8/26/11 8/27/11 20937 CC Beach Surfside Park 8.03 8.14 8.11 8.17 8.25 8.21 20938 8.03 8.14 8.08 8.24 8.25 8.20 20939 8.03 8.14 8.05 8.26 8.25 8.20 20940 McGee Beach 8.16 8.16 8.12 8.24 8.13 8.19 20941 8.13 8.16 8.13 8.26 8.17 8.15 20942 8.12 8.19 8.12 8.27 8.21 8.17 20943 Emerald Beach 8.13 8.14 8.11 8.26 8.18 8.15 20944 8.14 8.16 8.13 8.26 8.22 8.16 20945 8.14 8.17 8.12 8.26 8.23 8.18 20946 Cole Park North 8.12 8.17 8.10 8.27 8.19 8.20 20947 8.13 8.15 8.10 8.26 8.20 8.21 20948 8.15 8.16 8.14 8.27 8.20 8.21 20949 Cole Park Pier 8.16 8.17 8.08 8.23 8.14 8.12 20950 8.13 8.16 8.13 8.24 8.23 8.19 20951 8.14 8.16 8.14 8.25 8.25 8.20 20952 Cole Park Louisiana 8.10 8.11 8.05 8.20 8.17 8.14 20953 8.13 8.10 8.11 8.24 8.19 8.19 20954 8.14 8.11 8.16 8.25 8.21 8.18 20955 Cole Park Oleander Point 8.07 8.09 8.07 8.24 8.12 8.18 20956 8.10 8.13 8.14 8.25 8.17 8.18 20957 8.13 8.16 8.16 8.25 8.20 8.18 20958 Ropes Park 8.03 8.06 8.07 8.24 8.11 8.11 20959 8.04 8.07 8.10 8.24 8.12 8.14 20960 8.05 8.10 8.14 8.24 8.16 8.17 20961 Poenisch Park 8.04 8.02 8.04 8.26 8.23 8.21 20962 8.05 8.04 8.15 8.27 8.25 8.23 20963 8.06 8.05 8.20 8.29 8.27 8.25 20964 University Beach 7.92 7.92 8.05 8.27 8.15 8.16 20965 7.97 8.02 8.14 8.24 8.25 8.23 20966 8.03 8.08 8.16 8.30 8.29 8.25

4.13
Table 4.11. Turbidity (NTU) for all 30 nearshore Corpus Christi Bay Beaches TMDL stations sampled during rainfall events.
Station ID Sampling Location 5/13/11 5/14/11 6/23/11 6/24/11 8/26/11 8/27/11 20937 CC Beach Surfside Park 32.40 25.80 16.60 7.60 1.20 4.70 20938 27.70 25.10 17.60 11.30 2.90 6.60 20939 25.10 24.00 30.90 6.30 4.60 6.90 20940 McGee Beach 23.00 22.90 10.50 9.30 3.20 4.30 20941 22.70 28.10 9.50 7.20 4.30 7.70 20942 19.10 22.36 8.00 7.80 3.70 7.40 20943 Emerald Beach 35.80 83.90 13.30 6.20 10.20 11.70 20944 23.20 27.50 10.20 6.80 15.00 7.40 20945 22.30 25.30 10.70 5.50 4.20 5.80 20946 Cole Park North 29.80 39.80 86.90 12.30 16.30 5.50 20947 21.00 37.30 79.50 8.20 15.90 10.80 20948 18.90 38.40 45.30 6.80 7.80 9.10 20949 Cole Park Pier 18.00 25.30 20.00 3.60 8.50 5.70 20950 19.10 23.80 19.10 12.90 3.60 5.40 20951 19.40 20.60 18.90 4.50 3.50 4.00 20952 Cole Park Louisiana 37.20 44.10 188.00 13.60 17.80 10.60 20953 24.60 43.10 121.40 14.10 9.40 9.70 20954 28.70 43.10 188.90 12.70 10.80 9.00 20955 Cole Park Oleander Point 39.10 763.00 55.00 7.20 29.80 10.70 20956 30.40 774.80 31.50 7.10 12.80 12.50 20957 21.30 784.50 54.80 6.10 9.30 14.30 20958 Ropes Park 50.20 45.10 115.50 9.00 33.10 3.80 20959 28.70 43.10 135.30 5.60 29.70 5.10 20960 28.10 42.80 117.00 4.90 13.40 6.10 20961 Poenisch Park 32.80 59.50 61.20 3.20 23.70 10.00 20962 28.90 95.00 69.10 5.10 14.30 7.60 20963 26.30 95.00 69.40 4.70 8.00 7.70 20964 University Beach 29.60 20.00 103.30 8.90 113.90 21.20 20965 26.20 99.70 117.60 10.60 14.40 49.60 20966 26.40 59.00 121.60 7.40 13.60 14.80

4.14
4.4 Enterococcus concentrations in water (all events) Data results from 147 bacteria samples (129 non-rainfall and 18 rainfall) collected from 5/4/2011 through 8/27/2011 were used to characterize these Corpus Christi Bay urban beach locations. Information presented in this section provides a summary of data collected to date, with the first station listed as closest to shore and subsequent station numbers progressing offshore as shown in Figs. 3.2 through 3.7. As the 10 offshore stations were only sampled in August, and all values were <10 MPN/100 ml, the discussion will focus on the 30 nearshore stations sampled for the duration of the project. Enterococcus values ranged from <10 MPN/100 ml to >24,196 MPN/100 ml with the largest concentrations recorded after rainfall events at locations near storm water outfalls. Some of the highest Enterococcus values occurred in August 2011, which corresponded with the lowest rainfall recorded (Table 4.13). Concentrations recorded throughout the study typically declined the farther from shore the samples were taken (Tables 4.12 and 4.13). When analyzed on a month-by-month basis, data indicates that Enterococcus concentrations increase as you move closer to Cole and Ropes Parks. A strong correlation in May (r2=0.78) (Fig. 4.3) decreased during the summer months (Figs. 4.4 through 4.6) but the trend was still evident when all samples collected from 5/4/2011 through 8/27/2011 are evaluated (Fig. 4.7). Out of 1470 Enterococcus samples collected (49 at each station or 147 per location), the single sample criteria of 104 MPN/100 ml was exceeded 87 times, or 5.9%. May was highest month with 36 exceedances followed by 27, zero, and 24 exceedances in June, July, and August, respectively with Cole Park (stations combined) and Ropes Park having the highest number of exceedances (Fig. 4.8). When viewed by individual location, Ropes Park had the highest percentage of exceedances followed by Cole Park Oleander Point and Cole Park Louisiana (Fig. 4.9). There were no exceedances at McGee Beach, which is the most utilized public beach in the downtown area. Evaluating the data based on the rating scheme utilized by the Texas Beach Watch Program showed that 88.4% of the samples were <35 MPN/100 ml, 5.6% were >35 MPN/100 ml but <104 MPN/100 ml, and 5.9% were >104 MPN/100 ml. As previously stated, based on exceedances of the >104 MPN/100 ml criterion, the Texas Beach Watch Program will issue an advisory day for that location. If multiple samples are collected at a location such as at Cole Park, then only one advisory day is listed regardless of how many samples may have exceeded the criterion. For assessment purposes, the TCEQ Surface Water Quality Monitoring Program in turn calculates the percentage of days that resulted in advisories by dividing the number of advisory days by the number of sampling days. An assessment in this manner shows that Cole Park, as expected, had the highest percentage of advisory days followed by Ropes Park and University Beach (Fig. 4.10). Based on proposed Recreational Beach Assessment methods the number of beach advisories for Cole Park is between 20% and 25% indicating “concern but fully supporting” the Recreational Beach. A time series of all nearshore samples collected for a location is shown in Figs. 4.11 through 4.20. There were some random spikes in elevated bacteria concentrations at some locations, especially when rainfall occurred.

4.15
Table 4.12. Enterococcus concentrations (MPN/100 ml) for all 30 nearshore (May – August 2011) and 10 offshore (August 2011) Corpus Christi Bay Beaches TMDL stations sampled during all events.
Station ID Sampling Location n Min Max Geometric mean
(all events) Geometric mean (no rain events)
20937 CC Beach Surfside Park 49 10 230 12.2 12.5 20938 49 10 63 11.1 10.8 20939 49 10 52 10.3 10.4 21047 3 10 10 10.0
20940 McGee Beach 49 10 41 11.0 10.8 20941 49 10 52 11.9 11.2 20942 49 10 75 11.8 11.5 21048 3 10 10 10.0
20943 Emerald Beach 49 10 110 11.9 11.5 20944 49 10 110 11.3 10.7 20945 49 10 84 11.3 10.7 21049 3 10 10 10.0
20946 Cole Park North 49 10 650 15.1 12.1 20947 49 10 390 13.4 11.0 20948 49 10 220 12.4 10.7 21050 3 10 10 10.0
20949 Cole Park Pier 49 10 860 18.7 14.2 20950 49 10 1200 13.2 11.2 20951 49 10 120 12.4 10.8 21051 3 10 10 10.0
20952 Cole Park Louisiana 49 10 10,000 20.9 12.8 20953 49 10 2900 15.8 11.6 20954 49 10 2700 14.6 10.6 21052 3 10 10 10.0
20955 Cole Park Oleander Point 49 10 6900 22.4 14.4 20956 49 10 7700 17.3 11.9 20957 49 10 3900 14.3 10.3 21053 3 10 10 10.0
20958 Ropes Park 49 10 >24,196 26.4 15.9 20959 49 10 5800 22.4 15.1 20960 49 10 4100 19.5 13.6 21054 3 10 10 10.0
20961 Poenisch Park 49 10 210 15.2 13.1 20962 49 10 520 13.6 11.0 20963 49 10 280 12.8 11.1 21055 3 10 10 10.0
20964 University Beach 49 10 740 19.1 16.3 20965 49 10 400 16.1 14.1 20966 49 10 180 15.0 14.5 21056 3 10 10 10.0

4.16
Table 4.13. Enterococcus concentrations (MPN/100 ml) for all 30 nearshore Corpus Christi Bay Beaches TMDL stations sampled after rainfall events. Mean rainfall (inches) for the day preceding the sampling event were May 1.35, June 0.44, and August 0.34.
Station ID Sampling Location 5/13/11 5/14/11 6/23/11 6/24/11 8/26/11 8/27/11 20937 CC Beach Surfside Park 10 10 10 10 10 10 20938 10 10 63 10 10 10 20939 10 10 10 10 10 10 20940 McGee Beach 10 20 20 10 10 10 20941 31 10 41 10 30 10 20942 10 10 10 10 75 10 20943 Emerald Beach 10 10 10 10 110 10 20944 20 10 10 10 110 10 20945 20 10 10 10 84 10 20946 Cole Park North 250 10 490 20 650 10 20947 75 20 390 10 160 31 20948 30 10 220 20 170 10 20949 Cole Park Pier 140 84 860 30 570 30 20950 75 30 140 10 180 10 20951 110 10 92 10 120 10 20952 Cole Park Louisiana 670 1100 1300 120 10,000 98 20953 63 450 210 10 2900 63 20954 96 260 130 10 2700 100 20955 Cole Park Oleander Point 370 860 560 75 6900 230 20956 160 640 130 10 7700 240 20957 130 130 140 10 3900 98 20958 Ropes Park 1100 260 8200 400 >24,196 52 20959 330 160 5800 85 2700 41 20960 270 130 4100 10 910 260 20961 Poenisch Park 74 210 41 10 150 10 20962 41 300 75 10 520 10 20963 30 280 31 10 63 10 20964 University Beach 140 740 41 10 63 20 20965 20 400 84 10 63 10 20966 31 74 20 10 10 10

4.17
Fig. 4.3. The geometric mean of all Enterococcus concentrations (MPN/100 ml) at each
sampling location in May 2011.
Fig. 4.4. The geometric mean of all Enterococcus concentrations (MPN/100 ml) at each
sampling location in June 2011.

4.18
Fig. 4.5. The geometric mean of all Enterococcus concentrations (MPN/100 ml) at each
sampling location in July 2011.
Fig. 4.6. The geometric mean of all Enterococcus concentrations (MPN/100 ml) at each
sampling location in August 2011.

4.19
Fig. 4.7. The geometric mean of all Enterococcus concentrations (MPN/100 ml) at each
sampling location from 5/4/2011 through 8/27/2011.
Fig. 4.8. Number of all exceedances (n=1470 or 147 per location) of the single sample
criteria of 104 MPN/100 ml at each location (Cole Park locations combined).

4.20
Fig. 4.9. Percentage of samples (n=1470 or 147 per location) exceeding the single sample
Enterococcus criteria of 104 MPN/100 ml at each location from 5/4/2011 through 8/27/2011.
Fig. 4.10. Percentage of advisory days issued at each location (Cole Park combined) from
5/4/2011 through 8/27/2011.

4.21
Fig. 4.11. Enterococcus concentrations (MPN/100 ml) at Corpus Christi Beach at Surfside
Park nearshore stations from 5/4/2011 through 8/27/2011. Numbers indicate rainfall (inches) the day preceding the rainfall sampling events of 5/13/2011, 6/23/2011, and 8/26/2011.
Fig. 4.12. Enterococcus concentrations (MPN/100 ml) at McGee Beach nearshore stations
from 5/4/2011 through 8/27/2011. Numbers indicate rainfall (inches) the day preceding the rainfall sampling events of 5/13/2011, 6/23/2011, and 8/26/2011.

4.22
Fig. 4.13. Enterococcus concentrations (MPN/100 ml) at Emerald Beach nearshore stations
from 5/4/2011 through 8/27/2011. Numbers indicate rainfall (inches) the day preceding the rainfall sampling events of 5/13/2011, 6/23/2011, and 8/26/2011.
Fig. 4.14. Enterococcus concentrations at (MPN/100 ml) Cole Park North nearshore
stations from 5/4/2011 through 8/27/2011. Numbers indicate rainfall (inches) the day preceding the rainfall sampling events of 5/13/2011, 6/23/2011, and 8/26/2011.

4.23
Fig. 4.15. Enterococcus concentrations (MPN/100 ml) Cole Park Pier nearshore stations
from 5/4/2011 through 8/27/2011. Numbers indicate rainfall (inches) the day preceding the rainfall sampling events of 5/13/2011, 6/23/2011, and 8/26/2011.
Fig. 4.16. Enterococcus concentrations (MPN/100 ml) at Cole Park Louisiana nearshore
stations from 5/4/2011 through 8/27/2011. Numbers indicate rainfall (inches) the day preceding the rainfall sampling events of 5/13/2011, 6/23/2011, and 8/26/2011.

4.24
Fig. 4.17. Enterococcus concentrations (MPN/100 ml) at Cole Park Oleander Point
nearshore stations from 5/4/2011 through 8/27/2011. Numbers indicate rainfall (inches) the day preceding the rainfall sampling events of 5/13/2011, 6/23/2011, and 8/26/2011.
Fig. 4.18. Enterococcus concentrations (MPN/100 ml) at Ropes Park nearshore stations
from 5/4/2011 through 8/27/2011. Numbers indicate rainfall (inches) the day preceding the rainfall sampling events of 5/13/2011, 6/23/2011, and 8/26/2011.
4.25
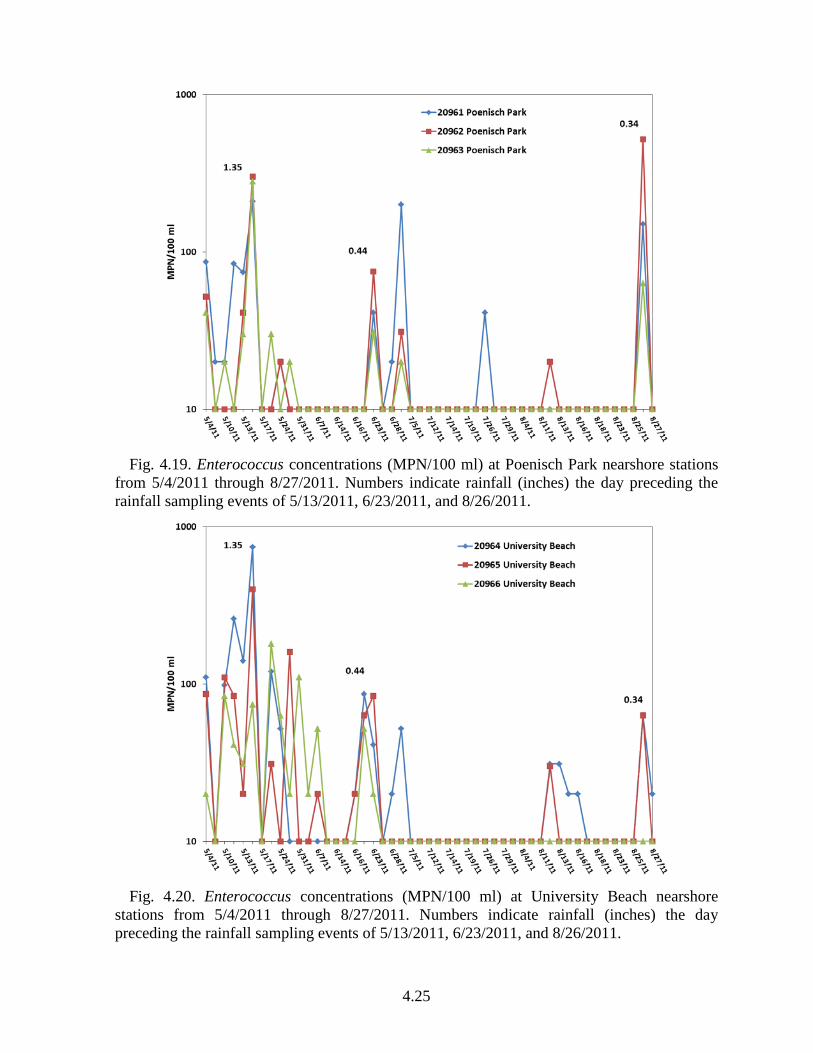
Fig. 4.19. Enterococcus concentrations (MPN/100 ml) at Poenisch Park nearshore stations
from 5/4/2011 through 8/27/2011. Numbers indicate rainfall (inches) the day preceding the rainfall sampling events of 5/13/2011, 6/23/2011, and 8/26/2011.
Fig. 4.20. Enterococcus concentrations (MPN/100 ml) at University Beach nearshore
stations from 5/4/2011 through 8/27/2011. Numbers indicate rainfall (inches) the day preceding the rainfall sampling events of 5/13/2011, 6/23/2011, and 8/26/2011.

4.26
4.5 Enterococcus concentrations in sediment As previously stated, water quality sampling was supplemented by the collection of sediment samples at all shoreline locations for analysis of bacteria in the swash zone, or zone of wave interaction. These data were collected for background and supporting information purposes to better understand the extent of bacterial concentrations that exist in the sediment layer at these urban beach/public access locations. Thirty-seven sediment samples were collected from 5/4/2011 through 8/27/201. In June 2011, collections ceased at the Cole Park Pier location, as no beach exists at the location and obtaining a valid sample was difficult in this area due to wave refraction along the seawall. Sediment sampling showed very little Enterococcus bacteria in the sediments at these locations. Except for one sample collected at Emerald Beach and Cole Park at Oleander Point on 8/5/2011 all concentrations were <10 MPN/100 ml (Table 4.14). The higher concentration at Emerald Beach could not be correlated with any known event. Bacteria concentrations were not elevated in the water column on the day of sampling or during previous events that week. There is a high degree of variability seen in sediment bacteria concentrations, which are influenced by such sources as enteric shedding from adults and children on the beach or in the water, the deposition of dog feces along the shoreline or high avian activity. Further sampling may point directly to possible sources but at this point, no conclusion can be made. However, it does indicate that changes in sediment Enterococcus concentrations can occur rapidly and that sediment sampling of beaches may provide valuable information concerning Enterococcus concentrations found at recreational beaches. Table 4.14. Enterococcus sediment bacteria concentrations (MPN/100 ml) at all sampling locations for the Corpus Christi Bay Beaches TMDL.
Station ID Sampling Location 5/12/2011 6/15/2011 7/13/2011 8/5/2011
20937 CC Beach Surfside Park <10 <10 <10 <10
20940 McGee Beach <10 30 <10 <10
20943 Emerald Beach <10 <10 <10 385
20946 Cole Park North <10 <10 <10 <10
20949 Cole Park Pier <10
20952 Cole Park Louisiana <10 <10 <10 <10
20955 Cole Park Oleander Point <10 <10 <10 27
20958 Ropes Park <10 <10 <10 <10
20961 Poenisch Park <10 <10 <10 <10
20964 University Beach <10 <10 <10 <10

4.27
4.6 Park Use by Location In addition to bacteria sampling, beach survey information was collected to document the number of people who visited each location and categorized their activity in the park, beach, and water. Data indicated the three public beach areas (Corpus Christi Beach Surfside Park, McGee Beach, and Emerald Beach) had the highest number of people observed on the beach and in the water (Fig. 4.21). As these are the three areas where entering the water for swimming and other water activities are actively encouraged it is good to note that these three areas had the lowest number of exceedances of the single sample Enterococcus criteria of >104 MPN/100 ml during the sampling conducted for this project (see Fig. 4.8).
Fig. 4.21. Total number and location of people observed at each beach location from
5/4/2011 through 8/27/2011.

4.28
4.7 Avian Use by Location As stated in the Historical Data Review for this project (Nicolau et al. 2011), the contribution of bacteria from wildlife in TMDL development for this project is important. Fecal matter deposited on the land may be carried into the municipal storm water drainage system, or directly into Corpus Christi Bay. Currently the lack of sufficient data to estimate avian populations and spatial distribution makes assessment difficult at these urban locations. To provide these data, avian surveys were conducted during each sampling event. Preliminary data analysis identified that birds preferred the University Beach location as the incidence of resting was highest at this location and was the only location where active nesting occurred by Least Terns (Fig. 4.22). However, high numbers of birds observed at University Beach did not correlate with increased concentrations of bacteria in the water.
Fig. 4.22. Total number of birds and bird activity observed at each beach location from
5/4/2011 through 8/27/2011.

4.29
4.8 Beach Debris by Location The final component of beach survey data collected for this project was on debris present along the shoreline at each location during each sampling event. Organic debris deposited on a beach either by direct stormwater drain discharge or by littering provides an area where bacteria can survive and reproduce. Field investigations in California showed the wrack line acted as a bacterial reservoir that can affect receiving water quality (Martin and Gruber 2005). Excluding Cole Park Louisiana, which has no actual beach, the least amount of debris on beaches were those routinely cleaned by City of Corpus Christi Park Department employees or hotel personnel in the case of Emerald Beach (Fig. 4.23). All locations had some debris from the nine categories listed. With the most common types of debris being algae/seaweed, wood, plastic/Styrofoam, and grass clippings. The high volume of debris deposited from stormwater drain discharge after rainfall events was most notable at Cole Park (Fig. 4.24).
Fig. 4.23. Percent of debris observed at each location from 5/4/2011 through 8/27/2011.

4.30
Fig. 4.24. Wrack line debris observed at Cole Park following the rainfall event of
6/23/2011.

5.1
5.0 REFERENCES
Armstrong, N.E. 1987. The ecology of open-bay bottoms of Texas: A community profile. U.S. Fish and Wildlife Service Biological Report 85 (7.12). 104 pp.
Chabreck, R.H. 1990. Creation, restoration, and enhancement of marshes of the northcentral Gulf coast, p. 125-142. In Kusler, J.A. and M.E. Kentula (eds.). Wetland creation and restoration: The status of the science. Island Press. California. 594 pp.
Heilman, S., J.B. Mott, and B.A. Nicolau. 2000. Fecal Coliforms, Enterococci, E. coli, and Total Coliforms as Indicators of Water Quality in Oso Bay, Corpus Christi, Texas. Texas A&M University-Corpus Christi, Center for Coastal Studies Technical Report No. TAMUCC-0001-CCS. 67 pp.
Jones, F.B. 1975. Flora of the Texas Coastal Bend. Welder Wildlife Foundation. Sinton, Texas. 262 pp.
Martin, A. and S. Gruber. 2005. Amplification of Indicator Bacteria in Organic Debris on Southern California Beaches. StormCon 2005, Technical Paper #0507. Orlando, Florida. 6 pp.
National Climatic Data Center. 2010. Asheville, North Carolina
Nicolau, B.A. E.M. Hill, A.S. Baxter, and R.F Duke 2011. Historical Data Review and Site Assessment on TMDL Investigation for Bacteria in Corpus Christi Bay Beaches. Texas A&M University-Corpus Christi, Center for Coastal Studies Technical Report No. TAMU-CC-1104-CCS, Corpus Christi, Texas, USA. 66 pp.
Nicolau, B.A. and A.X. Nuñez. 2004. Coastal Bend Bays and Estuaries Program Regional Coastal Assessment Program (RCAP): RCAP 2001 and RCAP 2002 annual report. Texas A&M University-Corpus Christi, Center for Coastal Studies Technical Report No. TAMU-CC-0406-CCS, Corpus Christi, Texas, USA. 246 pp.
TCEQ. 2008. Guidance for Screening and Assessing Texas Surface and Finished Drinking
Water Quality Data (March 19, 2008). TCEQ. 2010. Guidance for Assessing and Reporting Surface Water Quality in Texas (August
25, 2010). USEPA. 2002. Draft Implementation Guidance for Ambient Water Quality Criteria for
Bacteria. EPA-823-B-02-003. Office of Water. Washington, D.C. 101 pp.