tm view™ software user manual · tm view standard tm view enterprise plug-in whenever we mean...
TRANSCRIPT

TM View™ Software User Manual
www.serveron.com 810-1864-08 REV A
TM View™ Software User Manual
October 2017
Document ID: 810-1864-08 Rev A

Legal
www.serveron.com Page ii of 189 810-1864-08 REV A
For more information, contact your nearest Serveron Representative
Serveron® Corporation 20325 NW Von Neumann Drive, Suite 120 Beaverton, OR 97006 USA Office: +1 (800) 880-2552 Fax: +1 (503) 924-3290 Technical Support: +1 (866) 273-7763 E-mail: [email protected] http://www.serveron.com/
© 2014 Serveron® Corporation. All rights reserved. QUALITROL is a registered trademark of Qualitrol Company LLC. SERVERON, LOADGUIDE, TRUEGAS as well as TM1, TM2, TM3 and TM8 are trademarks of Serveron® Corporation. Microsoft, Microsoft Internet Explorer, Microsoft .NET and Windows are either registered trademarks or trademarks of Microsoft Corporation in the United States and/or other countries. FreeWave is a registered trademark of FreeWave Technologies. Unicode is a registered trademark of the Unicode Consortium. All other trademarks, registered trademarks, service marks, and trade names are the property of their respective owners.
Information in this document is subject to change without notice. This document is provided to purchasers of Serveron® products for use in the installation, operation and servicing of such products. No other use, nor any reproduction, distribution or the making of any derivatives of this document is authorized, without the express prior written permission of Serveron® Corporation.
Serveron® endeavors to ensure the accuracy and quality of its published materials; however, no warranty, expressed or implied, is provided. Serveron® disclaims any responsibility or liability for any direct or indirect damages resulting from the use of the information in this manual or products described in it. Mention of any product or brand does not constitute an endorsement by Serveron® of that product or brand.
This document was originally composed in English and was subsequently translated into other languages. The fidelity of subsequent translations cannot be guaranteed. In case of conflict between the English version and another language version, the English version takes precedence.
Table of Contents
www.serveron.com Page iii of 189 810-1864-08 REV A
This page intentionally left blank.
Table of Contents
www.serveron.com Page iv of 189 810-1864-08 REV A
Overview .................................................................................................................. 15
Scope .................................................................................................................... 15
Operating System Support .................................................................................... 17
TM View Feature Overview ................................................................................... 17
Installing TM View .................................................................................................... 19
System Requirements ........................................................................................... 19
Choosing an Installation Configuration.................................................................. 19
Installation Procedure ........................................................................................... 21
Using TM View ......................................................................................................... 23
Starting TM View ................................................................................................... 23
Creating New Monitors .......................................................................................... 23
Opening and importing Files ................................................................................. 24
Navigating to Region, Substation, Assets and Monitors ........................................ 25
Navigation Pane Icons and Notification................................................................. 26
Searching .............................................................................................................. 27
Working with Files .................................................................................................... 27
Using TGH Files .................................................................................................... 27
Corrupt or Invalid Files .......................................................................................... 28
Using XML Files .................................................................................................... 28
Using Commands ..................................................................................................... 28
Using Tabs ............................................................................................................... 29
Using the Monitor Status Tab ................................................................................ 30
Using the Graphs .................................................................................................. 31
Graph Toolbar .................................................................................................... 33
Automatic Scheduled Polling Option ........................................................................ 34
TM View Reference .................................................................................................. 36
Navigation Tree ..................................................................................................... 37
Context Menus ...................................................................................................... 38
Monitor Context Menu........................................................................................ 38
Export Data ...................................................................................................... 40
Enter Manual DGA Data .................................................................................. 41
Import Manual Data from CSV File .................................................................. 41
Hide Monitor .................................................................................................... 41

Table of Contents
www.serveron.com Page v of 189 810-1864-08 REV A
Edit Monitor Info............................................................................................... 41
Replace Monitor............................................................................................... 41
Delete Monitor ................................................................................................. 42
Poll Now .......................................................................................................... 42
Send Monitor Diagnostics ................................................................................ 42
Set Monitor Date and Time .............................................................................. 43
Change Monitor Password .............................................................................. 43
New Verification Gas Cylinder ......................................................................... 43
Start Sampling Run .......................................................................................... 43
Start Verification Run & Start Calibration Run ................................................. 44
Update Limits ................................................................................................... 44
Set Alarm Confirmation .................................................................................... 45
Edit Sampling Schedule ................................................................................... 45
Sample Hourly ................................................................................................. 46
Edit Communications ....................................................................................... 46
Check Communications ................................................................................... 46
Transformer Menu ............................................................................................. 46
Edit Transformer Info ....................................................................................... 46
Substation Menu ................................................................................................ 46
Region/Root Menu ............................................................................................. 47
Tool bar ................................................................................................................. 47
Date Range Slider ............................................................................................. 47
Search Control ................................................................................................... 48
Viewing Pane ........................................................................................................... 49
Monitor Asset Tabs: DGA Monitors ........................................................................ 49
Status Tab .......................................................................................................... 49
Gas in Oil Tab .................................................................................................... 51
Values below the Lower Detection Limit (LDL) ................................................ 52
Displaying Manual DGA Data .......................................................................... 53
Limits Tab ........................................................................................................... 53
Percent of Alarm Tab .......................................................................................... 53
Rate of Change Tab ........................................................................................... 54
Duval Triangle Tab ............................................................................................. 54

Table of Contents
www.serveron.com Page vi of 189 810-1864-08 REV A
IEEE C57.104 Tab ............................................................................................. 54
IEC 60599 Tab ................................................................................................... 55
TMFlex Web Pages Tab ..................................................................................... 56
Sensor Data Tab ................................................................................................ 56
TMF Internal Data Tab ....................................................................................... 56
Extractor Data Tab ............................................................................................. 57
Gas-in-Gas tab .................................................................................................. 57
Retention Time Tab ............................................................................................ 57
Verification Data Tab .......................................................................................... 57
Sampling Schedule Tab ..................................................................................... 57
Communications Tab ......................................................................................... 58
Transformer Specific Tabs ..................................................................................... 58
Status Tab .......................................................................................................... 58
Substation Specific Tabs ....................................................................................... 59
Status Tab .......................................................................................................... 59
Region Specific Tabs ............................................................................................. 60
Welcome Tab ..................................................................................................... 60
Polling Tab ......................................................................................................... 60
Polling Tab Context Menu .................................................................................. 61
Poller Settings ................................................................................................. 61
Toggle Auto-Poll ............................................................................................... 62
Poll Now .......................................................................................................... 62
View Polling Log .............................................................................................. 62
Menu Commands ..................................................................................................... 64
File Menu .............................................................................................................. 64
File New Asset… ........................................................................................... 64
File Open… ................................................................................................... 67
File Export….................................................................................................. 67
File Show Hidden Monitors ........................................................................... 68
File Print…..................................................................................................... 68
File Print Preview .......................................................................................... 69
File Exit ......................................................................................................... 69

Table of Contents
www.serveron.com Page vii of 189 810-1864-08 REV A
Tools menu ............................................................................................................ 69
Tools Select Modem ...................................................................................... 69
Tools Send Program Diagnostics .................................................................. 69
Tools Backup Database… ............................................................................. 69
Tools Pause Polling ....................................................................................... 70
Tools Edit Notification Rules .......................................................................... 70
Tools Edit ODBC Configuration ..................................................................... 70
Tools Import TM1 from USB Key… ............................................................... 71
Tools Configuration Options .......................................................................... 72
Context Menus ...................................................................................................... 74
[Region Context] Rename Region… ............................................................. 75
[Region/Root Context] View Polling Log… .................................................... 75
[Substation Context] Rename Substation… .................................................. 75
[Transformer Context] Edit Transformer Info… .............................................. 75
[Monitor Context] Export Data… .................................................................... 76
[Monitor Context] Hide Monitor ...................................................................... 76
[Monitor Context] Edit Monitor Info ................................................................ 76
[Monitor Context] Poll Now ............................................................................ 77
[Monitor Context] Set Monitor Date and Time ............................................... 77
[Monitor Context] Replace Monitor ................................................................ 78
[Monitor Context] Set Alarm Confirmation ..................................................... 78
[Monitor Context] Change Monitor Password… ............................................ 78
[Monitor Context] Enter Manual DGA…(not for TM1) .................................... 79
[Monitor Context] Import Manual Data from CSV File…(not for TM1) ........... 79
[Monitor Context] Start Sampling Run (not for TM1) ..................................... 80
[Monitor Context] Update Limits .................................................................... 80
[Monitor Context] Start Verification Run (not for TM1) ................................... 80
[Monitor Context] Start Calibration Run (not for TM1) ................................... 80
[Monitor Context] Sample Hourly (not for TM1) ............................................. 81
[Monitor Context] Check Communications .................................................... 82
[Monitor Context] Edit Communications ........................................................ 82
View Menu ............................................................................................................ 82
View Refresh (F5) ......................................................................................... 82
Table of Contents
www.serveron.com Page viii of 189 810-1864-08 REV A
View Auto Refresh ......................................................................................... 82
View Show Service Tabs ............................................................................... 82
View Show Administrative Tabs ..................................................................... 83
Help Menu ............................................................................................................. 83
Help Documentation ...................................................................................... 83
Help About TM View ...................................................................................... 83
Table of Contents
www.serveron.com Page ix of 189 810-1864-08 REV A
Using the Duval Triangle .......................................................................................... 84
Overview ............................................................................................................... 84
Interpretation of regions ........................................................................................ 84
Interpretation of the Triangle ................................................................................. 85
Multiple data points ............................................................................................... 85
Manually Entered DGA data .................................................................................. 86
Special Features ................................................................................................... 86
Use of Triangles 4 and 5 ....................................................................................... 86
Use of the Pentagons............................................................................................ 90
Summary ............................................................................................................... 92
Using the TM View Rogers Ratio Viewer .................................................................. 93
Overview ............................................................................................................... 93
Interpretation of Regions ....................................................................................... 94
Interpreting the Graphical View ............................................................................. 95
Summary ............................................................................................................... 96
Maintaining TM View Installations ............................................................................ 97
Configuring Communications ................................................................................... 97
Introduction ........................................................................................................... 97
Local Area Network (LAN) ..................................................................................... 98
RS-485 .................................................................................................................. 99
Telephone Modem ................................................................................................ 99
RS-232 ................................................................................................................ 100
RS-232 with radio (FreeWave®) ......................................................................... 100
Telephone Modem with radio (FreeWave®) ........................................................ 100
Configuring Modems .............................................................................................. 101
Modem Initialization ............................................................................................ 101
Advanced Dialing Strings .................................................................................... 102
Overview .......................................................................................................... 102
Send/Expect Protocol ...................................................................................... 102

Table of Contents
www.serveron.com Page x of 189 810-1864-08 REV A
Configuring TAPI Modem .................................................................................... 103
Troubleshooting ...................................................................................................... 107
Menu Items Unavailable (“Grayed Out”) ............................................................. 107
Theory of Operations .............................................................................................. 107
Overview ............................................................................................................. 107
Viewer Component .............................................................................................. 108
Poller Component ............................................................................................... 108
Poller Outputs .................................................................................................. 108
OPC Overview ....................................................................................................... 110
Intended Audience .............................................................................................. 110
OPC Definition .................................................................................................... 111
References .......................................................................................................... 112
System Configuration ............................................................................................. 113
Install the OPC Plugin ......................................................................................... 113
Register the OPC server ..................................................................................... 113
Verify the OPC registration .................................................................................. 113
Restart the System .......................................................................................... 115
Troubleshooting .................................................................................................. 115
Directions ......................................................................................................... 115
Configure System-wide DCOM settings ........................................................ 115
Configure the Poller OPC Server ................................................................... 119
References ...................................................................................................... 120
Interface Definition .............................................................................................. 122
Poller Interface ................................................................................................. 122
TMx Monitor Mapping ...................................................................................... 122
OPC Map Schema .............................................................................................. 123
OPC Tags for DGA Monitors ............................................................................ 123
ODBC Overview ..................................................................................................... 127
Intended Audience .............................................................................................. 127
ODBC Definition .................................................................................................. 128
ODBC Functionality Overview ............................................................................. 129
References ...................................................................................................... 130

Table of Contents
www.serveron.com Page xi of 189 810-1864-08 REV A
System Configuration ............................................................................................. 131
Configure a Data Source ..................................................................................... 131
Create/Modify ODBC Clients .............................................................................. 132
Configuring an Excel Client .............................................................................. 133
Configuring an MS-SQL Client ......................................................................... 133
Configuring an MS-Access Client .................................................................... 134
Create/Modify ODBC Entries .............................................................................. 134
Entry Type ........................................................................................................ 136
Procedure ...................................................................................................... 136
Table .............................................................................................................. 137
Columns/Parameters ..................................................................................... 137
Name of Data ................................................................................................ 139
Origin of Data ................................................................................................ 139
Data Item Definitions for Origin = Polling Information .................................... 139
DGA Data Item Definitions for Origin =Sample .............................................. 140
DGA Data Item definition for Origin = Sub-Sample ........................................ 141
PPM Record data items ................................................................................... 142
ROC Record data items ................................................................................... 142
External Sensors Record data items ............................................................... 142
ODBC Tutorial: Introduction ................................................................................... 144
Intended Audience .............................................................................................. 144
References .......................................................................................................... 144
System Configuration ............................................................................................. 145
Data Flow ............................................................................................................... 145
Configure a Data Source ........................................................................................ 146
Configure an Excel Data source. ........................................................................ 146
Configuring an MS-Access data source .............................................................. 147
Configure an MS-SQL data source, SQL Server ................................................. 148
Create/Modify ODBC Clients .............................................................................. 149
Configuring an Excel Client .............................................................................. 151
Configuring an MS-SQL Client ......................................................................... 151
Configuring an MS-Access Client .................................................................... 151
Table of Contents
www.serveron.com Page xii of 189 810-1864-08 REV A
Create/Modify ODBC Entries .............................................................................. 151
Notifications Overview ............................................................................................ 159
Intended Audience .............................................................................................. 159
Rule Configuration.................................................................................................. 159
Rule Application .................................................................................................. 160
Create a Rule ...................................................................................................... 161
Enable/Disable the rule .................................................................................... 161
Select Criteria .................................................................................................. 161
Apply rules to monitors ........................................................................................ 163
Clone and Delete Rules ...................................................................................... 163
Create Notification Messages ............................................................................. 164
Recipients ........................................................................................................ 165
Payload ............................................................................................................ 166
Monitor information ........................................................................................ 166
Sampling Data ............................................................................................... 166
Testing the message ........................................................................................ 167
Show Message Text button ............................................................................ 167
Send Test Message to Myself button ............................................................. 168
Send Test Message to All Recipients ............................................................. 168
Email Configuration ............................................................................................. 169
Configure the Mail Server ................................................................................ 170
Mail Relaying ................................................................................................. 170
Drilldown: Overview................................................................................................ 171
Asset Hierarchy ................................................................................................... 171
Using the DrillDown Client ...................................................................................... 171
TOAN Overview ..................................................................................................... 177
Analysis Data Flow.............................................................................................. 177
User Interface ..................................................................................................... 180
TOAN Preferences ........................................................................................... 180
TOAN License Manager .................................................................................. 182
TOAN Summary............................................................................................... 183
Table of Contents
www.serveron.com Page xiii of 189 810-1864-08 REV A
TOAN Results Details ......................................................................................... 184
Email Notification ................................................................................................ 186
Licensing ............................................................................................................. 187


Overview
www.serveron.com Page 15 of 189 810-1864-08 REV A
Overview This user’s manual provides the information that you need to install, setup and use the Serveron® TM View™ software to monitor and diagnose the state of your transformer assets. It applies to TM View Standard versions 5.4 and above and TM View Enterprise 2.4 and above.
The manual is organized into chapters of increasing depth and detail. The chapters Installing TM View and Using TM View are informal user guides. The TM View Reference chapter provides detailed descriptions of all parts of the user interface. Finally, the chapter titled Maintaining TM View Installations provides additional information.
Note: This manual assumes you have basic familiarity with the operating principles of your Serveron Online Transformer Monitor. If you require
information regarding the features, operation, and installation of a Serveron transformer monitor please review the technical documentation
available at the Serveron® website www.serveron.com or contact your local distributor. Current contact information for authorized distributors and
technical support is published on the Serveron website.
Scope
This manual covers all editions of the TM View software: TM View Enterprise Edition and TM View Standard.
When a section describes a feature not supported in one or more editions, a note will call out the editions supporting this feature. These notes will appear as the cartridge below. Whenever a feature is supported in all editions of TM View™, the cartridge will be omitted.
<feature name>
TM View Standard
TM View Enterprise
Plug-in
Whenever we mean “all editions of TM View™,” the manual will just say “TM View.”
Whenever a specific edition is concerned, that edition’s name will be called out, as in “TM View Enterprise.”
TM View is a software application for Windows®-compatible PCs. It is used to retrieve, change settings and display data that has been collected by supported on-line

Overview
www.serveron.com Page 16 of 189 810-1864-08 REV A
transformer monitors. TM View does not measure gas-in-oil levels; the DGA monitor makes those measurements. TM View retrieves these measurements from the monitor and displays them in a variety of formats. Monitors measure, record and report the status of fault gases in transformer insulating oil.
TM View supports collecting data from all Serveron TMx Series DGA monitors: TM1, TM2, TM3 and TM8.
TM View consists of two applications working together, using a common database, to collect and display monitor data.
One of these applications is the Serveron Extended Poller. The poller connects to all the monitors mapped into the system, then collects and stores the data in a database. The poller is configured by a special instance of the second application, the TM View Viewer. It is special because it is installed on the same computer as the Poller. This viewer is also called the “administrative viewer”. It is the only viewer from which monitors can be added, deleted and from which any activity involving connecting to the monitor can be initiated.
There can be many viewers installed for a single database and a single poller installation. All the viewers will view the same collection of Serveron DGA monitors. A typical installation diagram is shown below.
TM View Poller Server
(Poller and Viewer)
SQL
TM View Workstations
(read-only) SQLSQL
TMX DGA
LAN
Substation X
TMView SQL Database
TMX DGA
Ethernet
Substation Y
Modem TMX DGA
Figure 1 - Typical TM View installation
The Serveron Extended Poller requires an Ethernet connection, dial-up, direct serial or radio link from the PC to the monitor in order to retrieve measurements and change
Overview
www.serveron.com Page 17 of 189 810-1864-08 REV A
settings. Transformer data retrieved by the Serveron Extended Poller is stored in the designated database.
Retrieving data does not cause the monitor to lose or delete its internal measurement history. This allows more than one computer running the Serveron Extended Poller to remotely retrieve data from a single monitor.
“TMx” is used to refer to all TM Series monitors (TM1, TM2, TM3 and TM8).
Note: Starting with TM View 5.4 (Enterprise 2.4), the poller has multitasking capability: all Ethernet connections can be run in
parallel. Serial and modem connection are still constrained to the unique facility used by the media, so they cannot run in parallel.
However, a serial connection can be polled at the same time as an Ethernet connection.
Operating System Support
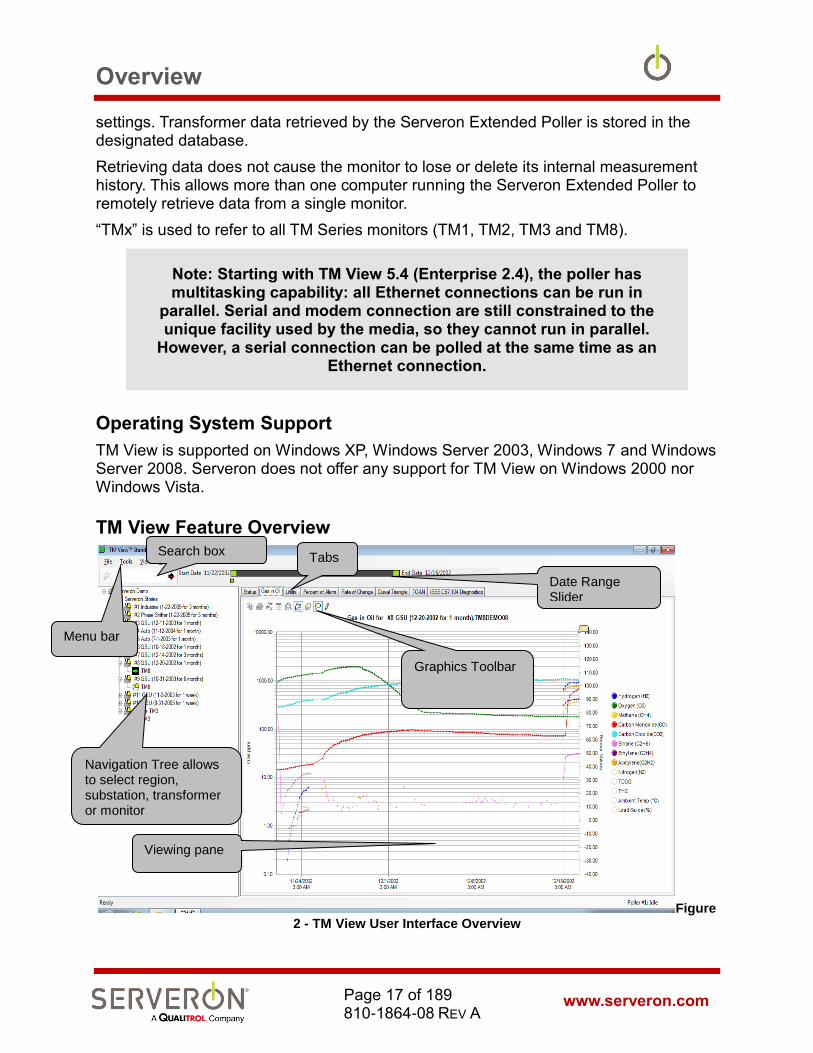
TM View is supported on Windows XP, Windows Server 2003, Windows 7 and Windows Server 2008. Serveron does not offer any support for TM View on Windows 2000 nor Windows Vista.
TM View Feature Overview
Figure 2 - TM View User Interface Overview
Navigation Tree allows to select region, substation, transformer or monitor
Menu bar
Viewing pane
Date Range Slider
Tabs
Graphics Toolbar
Search box
Overview
www.serveron.com Page 18 of 189 810-1864-08 REV A
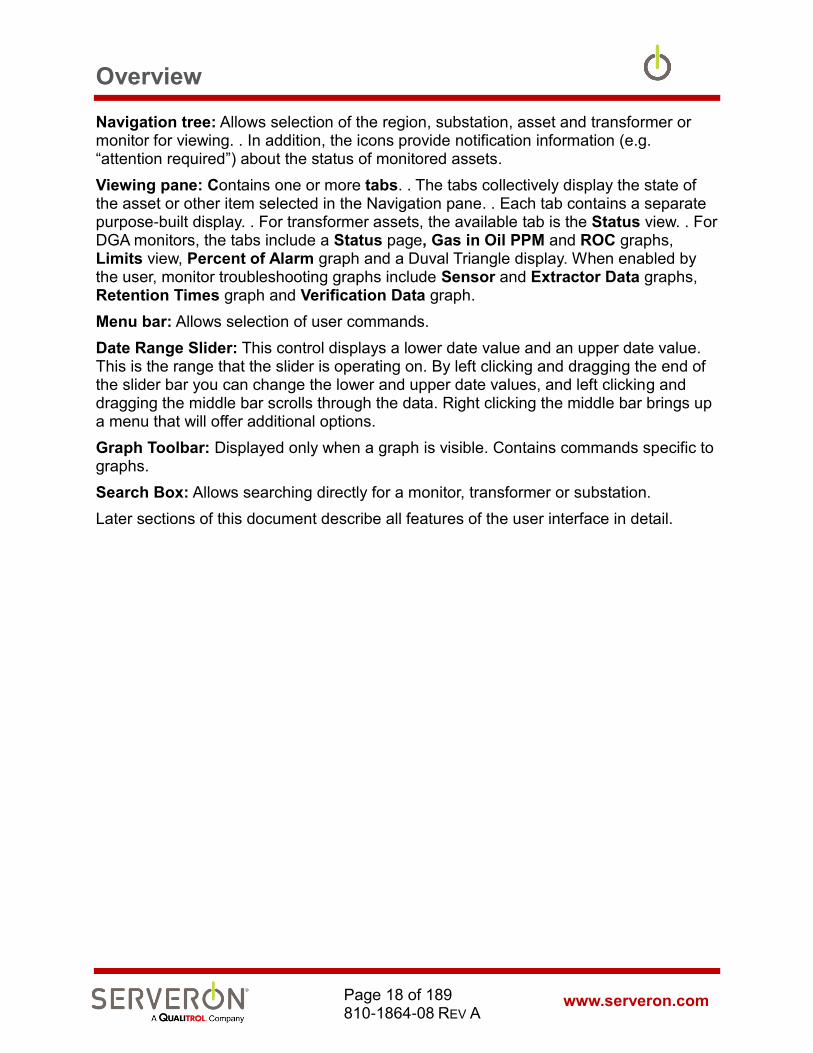
Navigation tree: Allows selection of the region, substation, asset and transformer or monitor for viewing. . In addition, the icons provide notification information (e.g. “attention required”) about the status of monitored assets.
Viewing pane: Contains one or more tabs. . The tabs collectively display the state of the asset or other item selected in the Navigation pane. . Each tab contains a separate purpose-built display. . For transformer assets, the available tab is the Status view. . For DGA monitors, the tabs include a Status page, Gas in Oil PPM and ROC graphs, Limits view, Percent of Alarm graph and a Duval Triangle display. When enabled by the user, monitor troubleshooting graphs include Sensor and Extractor Data graphs, Retention Times graph and Verification Data graph.
Menu bar: Allows selection of user commands.
Date Range Slider: This control displays a lower date value and an upper date value. This is the range that the slider is operating on. By left clicking and dragging the end of the slider bar you can change the lower and upper date values, and left clicking and dragging the middle bar scrolls through the data. Right clicking the middle bar brings up a menu that will offer additional options.
Graph Toolbar: Displayed only when a graph is visible. Contains commands specific to graphs.
Search Box: Allows searching directly for a monitor, transformer or substation.
Later sections of this document describe all features of the user interface in detail.
Installing TM View
www.serveron.com Page 19 of 189 810-1864-08 REV A
Installing TM View
This section offers a quick-start guide to installing TM View. Depending on which edition of TM View you are installing, some additional steps may be required. Please refer to the TM View Installation Manual for full details.
System Requirements
Serveron TM View requires a computer with a recent (post-2005) 2 GHz or higher processor (dual-core, at least, is strongly recommended: i5 or i7 preferred) with a minimum of 1 GB memory. For a system running the poller, a minimum of 4GB is recommended.
A screen resolution of 1024x768 or higher is required. Serveron recommends using the highest resolution available on the system. The video system must be configured to display at least 256 colors. Serveron strongly recommends using the highest color mode available from your display subsystem. This may be called “high color”, “true color”, “24-bit color” or “32-bit color”, depending on your vendor.
Installation requires approximately 800MB of hard disk space. At least 250MB of additional space should be available for normal use. Actual disk usage varies with the number of monitored assets.
TM View is a Windows®-based application. This product works with Windows XP, Windows Server 2003, Windows 7 and Windows Server 2008 operating systems. Windows 98, Windows 2000 and any Windows version earlier than Windows XP are not supported. Microsoft Windows Vista® is not supported.
The Installer for TM View requires Microsoft .NET 3.5 SP1 and the Microsoft Visual C++ 2008 Redistributable to be installed on your computer prior to installation. The TM View installer installs these pre-requisites.
Choosing an Installation Configuration
TM View may be installed in one of two configurations: Viewer Only or Server. In order to choose the configuration that best meets your needs, it is helpful to know a little about the internal organization of TM View software.
TM View is made up of three major components, the Database, the Viewer and the Poller.
The Database contains all the data needed by the poller and the viewer.
The Viewer is the application you see and interact with. The Poller works "behind the scenes,” communicating with your Serveron monitor(s) and saving the data they gather in the database.
The Database must be hosted on a Microsoft SQL Server 2005 or 2008 instance. By default, TM View is shipped with Microsoft SQL Server EXPRESS 2008. The user has

Installing TM View
www.serveron.com Page 20 of 189 810-1864-08 REV A
the option to install this separately from the TM View software, or to provide, instead, another instance of SQL Server.
In the Viewer Only configuration, as the name implies, the Poller component is not installed. Viewer Only installations are limited to accessing data retrieved and stored in the database by a Server installation. This configuration is appropriate in a workgroup setting where some users access transformer data but do not have the need or the ability to communicate directly with monitors from their computer. Each viewer installation requires a connection string for the SQL Server instance used.
The TM View Server configuration is the counterpart of the Viewer configuration. It functions as the point of communication with your monitors. A Server installation can receive monitor data when no user is logged in. Server installations are particularly appropriate when the host computer operates continuously and has ongoing access to the necessary communications resources (modems, network adapters, etc.) Server installations are frequently unattended and may be expected to operate “24x7” for long periods of time.
The Server installation stores all the data collected from the monitors in the database designated by the connection string which defines the SQL Server instance used by the system.
The user installing any version of TM View must have administrative privileges on the computer on which the software is installed.
One installation of the Server is necessary for the TM View system to function. The typical system high-level view is as follows.
Note that the SQL Server instance can also reside on the same computer as the poller.
Multiple instances of the Poller server can be installed in a given system (multiple pollers).
This is desirable, for example, when a company implements different, un-connected networks for their assets. In that case, a poller will collect data from all assets connected to one network, and another poller will collect data from the monitors connected to another network. The two pollers reside on different machines, of course.
All the viewers can see all assets, but each poller can only collect data from monitors assigned to that poller.
Each poller is known by its poller ID, which is an integer value between 1 and 99, assigned in the configuration file of the poller during installation.
Each monitor needs to be assigned to a given poller, by giving it a poller ID.

Installing TM View
www.serveron.com Page 21 of 189 810-1864-08 REV A
The Poller ID for each monitor can be set when creating the asset/monitor or by using the Poller Settings dialog from the Polling Task.
TM View
Server
TM View
Admin Viewer
Polling Server #1
IED
(DGA)
IED
(TBM)
IED
(TMS)
User workstations
Running
TM View viewers
TM View
Viewer
Workstation
SQL SQL
Corporate Network
TM View database
SQL Server
DNP3, Telnet
TM View
Server
TM View Admin
Viewer
Polling Server #2
IED
(DGA)
IED
(TBM)
IED
(TMS)
DNP3, Telnet
SQL SQL
Figure 3 – TM View Configuration
Installation Procedure
Note: Administrative privilege is required to install the software.
The TM View installation begins with the installation of the .NET framework, if it is not already installed on the computer. It then follows with the database installation. This will install the version of Microsoft SQL Server EXPRESS 2008 that is shipping with TM
Installing TM View
www.serveron.com Page 22 of 189 810-1864-08 REV A
View. The TM View installer will proceed to install MS SQL Server EXPRESS in an instance called ‘TMVIEWSQL’, with all the default settings required by TM View.
Please refer to the installation manual for your version of TM View for more details. TM View Enterprise Installation is not automated in this manner, and requires additional manual steps.
The installation will require occasionally rebooting the computer.
Serveron recommends that you use Windows Update to check for any recent updates to Microsoft components after installing TM View on your computer.
When installation is complete, you may start TM View using either the Start menu or the Desktop icon.
Using TM View
www.serveron.com Page 23 of 189 810-1864-08 REV A
Using TM View This chapter contains an informal guide to the features of TM View. Details of each part of the user interface appear in the TM View Reference chapter later in this manual.
Starting TM View
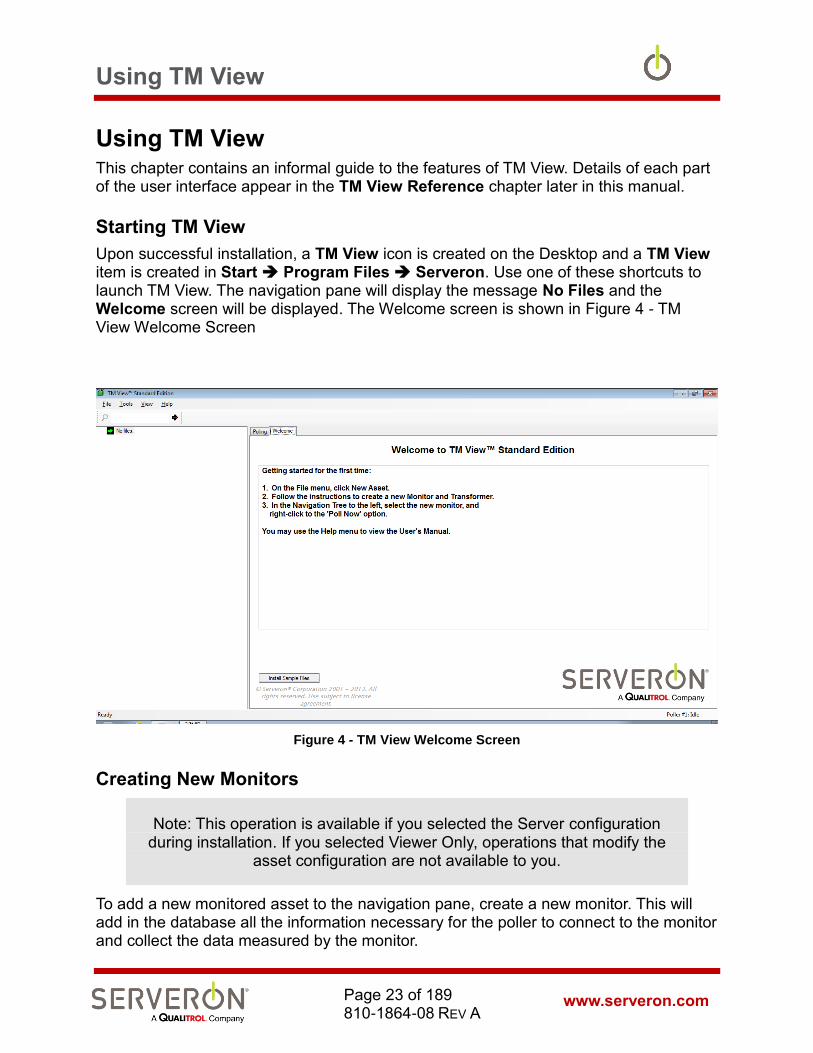
Upon successful installation, a TM View icon is created on the Desktop and a TM View item is created in Start Program Files Serveron. Use one of these shortcuts to launch TM View. The navigation pane will display the message No Files and the Welcome screen will be displayed. The Welcome screen is shown in Figure 4 - TM View Welcome Screen
Figure 4 - TM View Welcome Screen
Creating New Monitors
Note: This operation is available if you selected the Server configuration during installation. If you selected Viewer Only, operations that modify the
asset configuration are not available to you.
To add a new monitored asset to the navigation pane, create a new monitor. This will add in the database all the information necessary for the poller to connect to the monitor and collect the data measured by the monitor.
Using TM View
www.serveron.com Page 24 of 189 810-1864-08 REV A
Monitors are assumed to be attached to Assets (transformers). Assets are grouped in Substations, and substations are grouped in Regions.
To create a new asset/monitor:
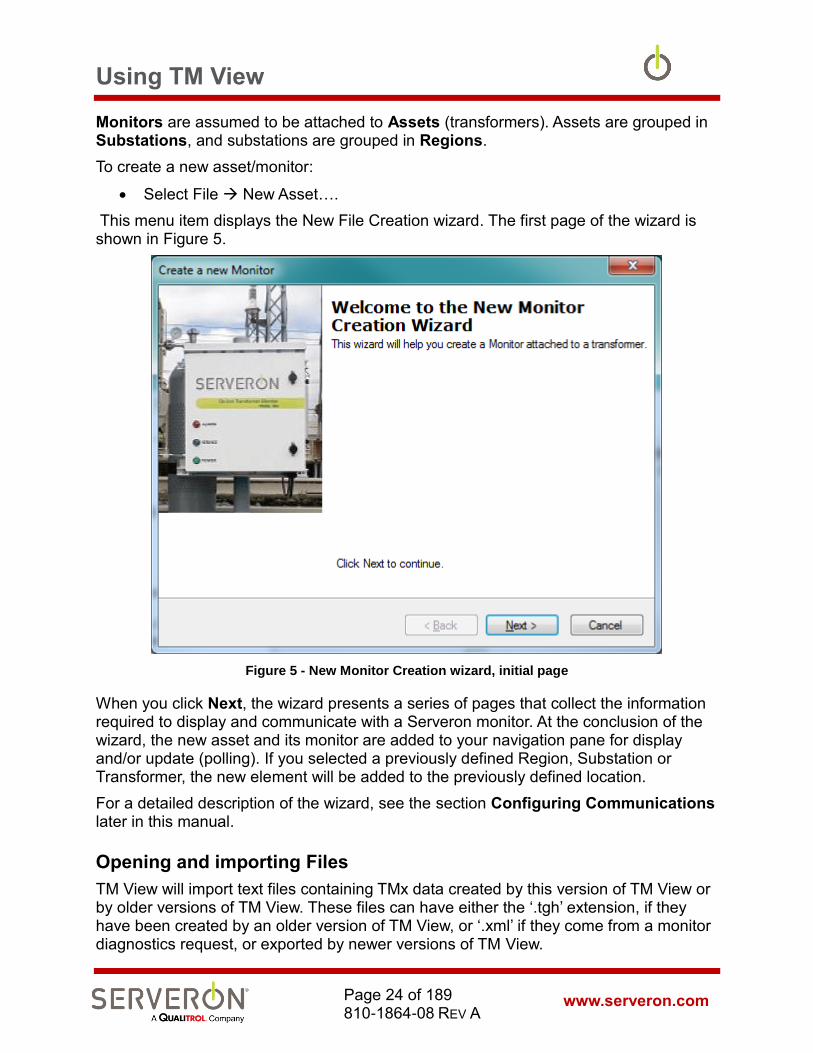
• Select File New Asset….
This menu item displays the New File Creation wizard. The first page of the wizard is shown in Figure 5.
Figure 5 - New Monitor Creation wizard, initial page
When you click Next, the wizard presents a series of pages that collect the information required to display and communicate with a Serveron monitor. At the conclusion of the wizard, the new asset and its monitor are added to your navigation pane for display and/or update (polling). If you selected a previously defined Region, Substation or Transformer, the new element will be added to the previously defined location.
For a detailed description of the wizard, see the section Configuring Communications later in this manual.
Opening and importing Files
TM View will import text files containing TMx data created by this version of TM View or by older versions of TM View. These files can have either the ‘.tgh’ extension, if they have been created by an older version of TM View, or ‘.xml’ if they come from a monitor diagnostics request, or exported by newer versions of TM View.
Using TM View
www.serveron.com Page 25 of 189 810-1864-08 REV A
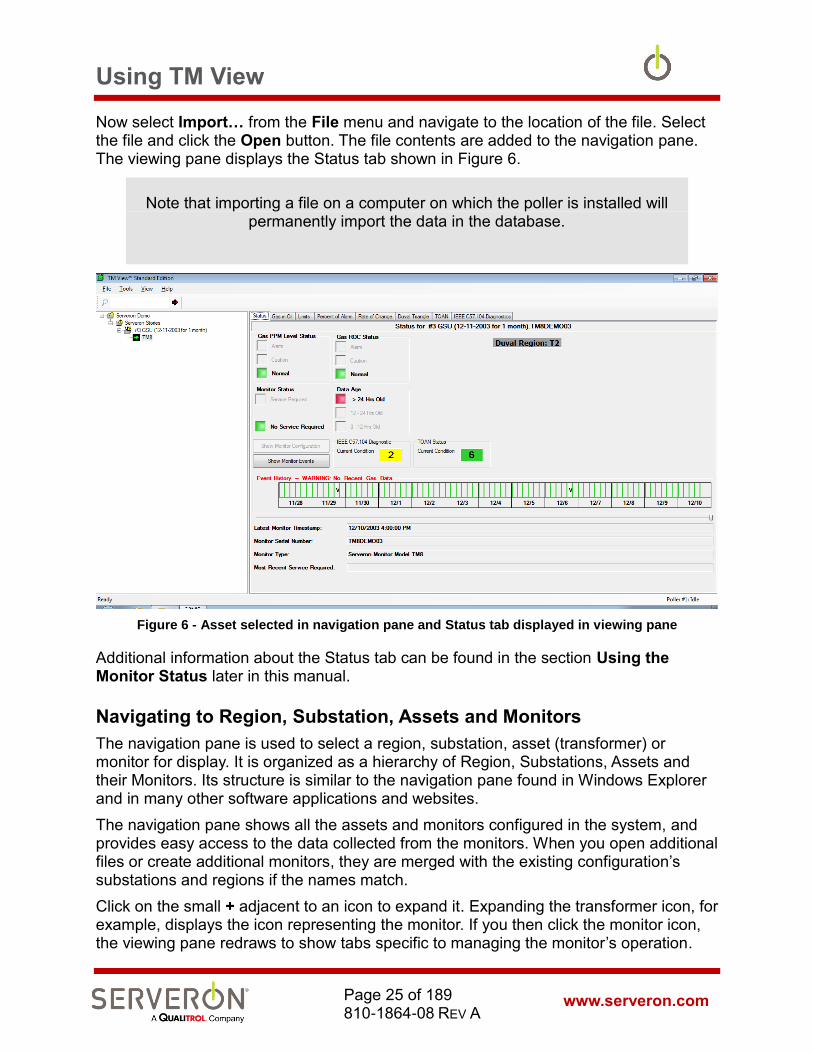
Now select Import… from the File menu and navigate to the location of the file. Select the file and click the Open button. The file contents are added to the navigation pane. The viewing pane displays the Status tab shown in Figure 6.
Note that importing a file on a computer on which the poller is installed will permanently import the data in the database.
Figure 6 - Asset selected in navigation pane and Status tab displayed in viewing pane
Additional information about the Status tab can be found in the section Using the Monitor Status later in this manual.
Navigating to Region, Substation, Assets and Monitors
The navigation pane is used to select a region, substation, asset (transformer) or monitor for display. It is organized as a hierarchy of Region, Substations, Assets and their Monitors. Its structure is similar to the navigation pane found in Windows Explorer and in many other software applications and websites.
The navigation pane shows all the assets and monitors configured in the system, and provides easy access to the data collected from the monitors. When you open additional files or create additional monitors, they are merged with the existing configuration’s substations and regions if the names match.
Click on the small + adjacent to an icon to expand it. Expanding the transformer icon, for example, displays the icon representing the monitor. If you then click the monitor icon, the viewing pane redraws to show tabs specific to managing the monitor’s operation.
Using TM View
www.serveron.com Page 26 of 189 810-1864-08 REV A
Navigation Pane Icons and Notification
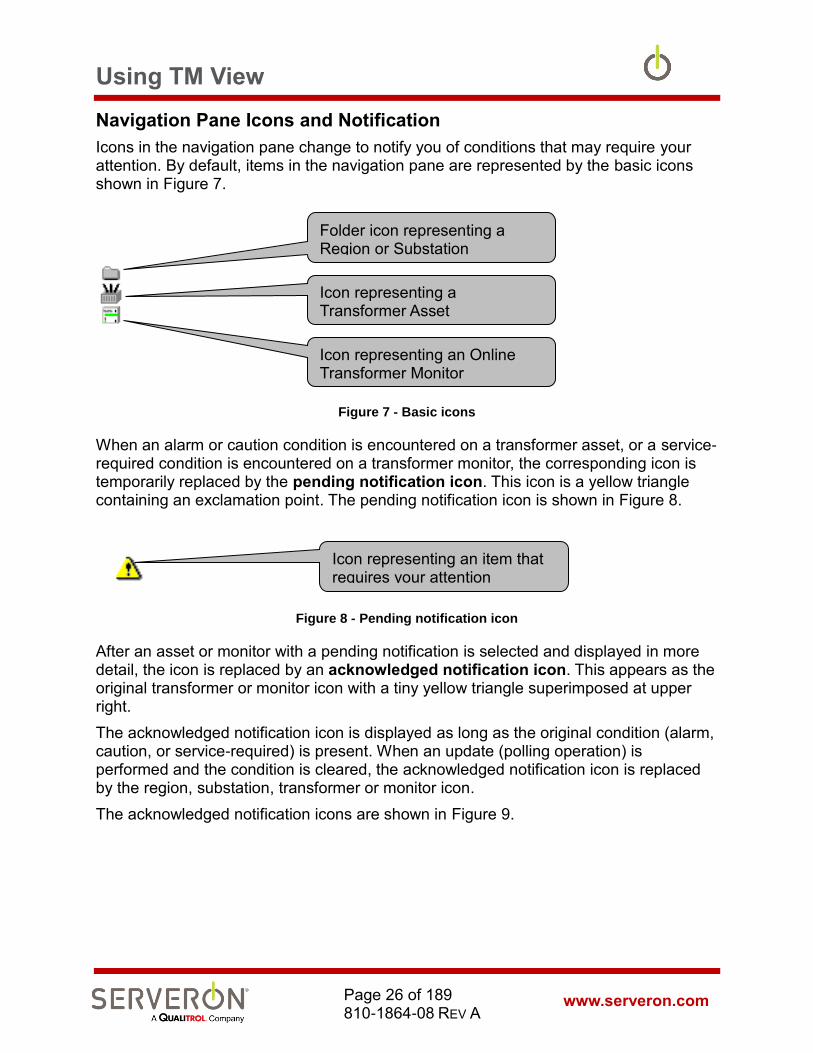
Icons in the navigation pane change to notify you of conditions that may require your attention. By default, items in the navigation pane are represented by the basic icons shown in Figure 7.
Figure 7 - Basic icons
When an alarm or caution condition is encountered on a transformer asset, or a service-required condition is encountered on a transformer monitor, the corresponding icon is temporarily replaced by the pending notification icon. This icon is a yellow triangle containing an exclamation point. The pending notification icon is shown in Figure 8.
Figure 8 - Pending notification icon
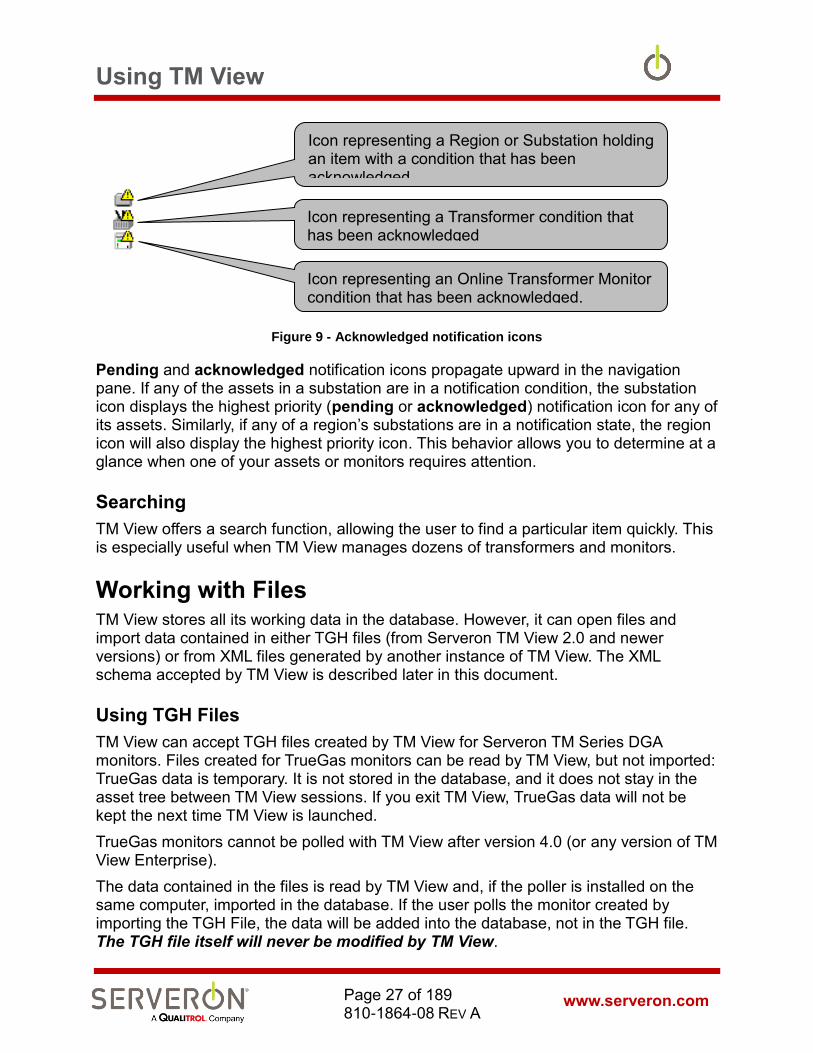
After an asset or monitor with a pending notification is selected and displayed in more detail, the icon is replaced by an acknowledged notification icon. This appears as the original transformer or monitor icon with a tiny yellow triangle superimposed at upper right.
The acknowledged notification icon is displayed as long as the original condition (alarm, caution, or service-required) is present. When an update (polling operation) is performed and the condition is cleared, the acknowledged notification icon is replaced by the region, substation, transformer or monitor icon.
The acknowledged notification icons are shown in Figure 9.
Folder icon representing a Region or Substation
Icon representing a Transformer Asset
Icon representing an Online Transformer Monitor
Icon representing an item that requires your attention
Using TM View
www.serveron.com Page 27 of 189 810-1864-08 REV A
Figure 9 - Acknowledged notification icons
Pending and acknowledged notification icons propagate upward in the navigation pane. If any of the assets in a substation are in a notification condition, the substation icon displays the highest priority (pending or acknowledged) notification icon for any of its assets. Similarly, if any of a region’s substations are in a notification state, the region icon will also display the highest priority icon. This behavior allows you to determine at a glance when one of your assets or monitors requires attention.
Searching
TM View offers a search function, allowing the user to find a particular item quickly. This is especially useful when TM View manages dozens of transformers and monitors.
Working with Files TM View stores all its working data in the database. However, it can open files and import data contained in either TGH files (from Serveron TM View 2.0 and newer versions) or from XML files generated by another instance of TM View. The XML schema accepted by TM View is described later in this document.
Using TGH Files
TM View can accept TGH files created by TM View for Serveron TM Series DGA monitors. Files created for TrueGas monitors can be read by TM View, but not imported: TrueGas data is temporary. It is not stored in the database, and it does not stay in the asset tree between TM View sessions. If you exit TM View, TrueGas data will not be kept the next time TM View is launched.
TrueGas monitors cannot be polled with TM View after version 4.0 (or any version of TM View Enterprise).
The data contained in the files is read by TM View and, if the poller is installed on the same computer, imported in the database. If the user polls the monitor created by importing the TGH File, the data will be added into the database, not in the TGH file. The TGH file itself will never be modified by TM View.
Icon representing a Region or Substation holding an item with a condition that has been acknowledged
Icon representing a Transformer condition that has been acknowledged
Icon representing an Online Transformer Monitor condition that has been acknowledged.

Using TM View
www.serveron.com Page 28 of 189 810-1864-08 REV A
Corrupt or Invalid Files
TM View detects and refuses to open corrupt or invalid files.
If you encounter a Corrupt or Invalid message when opening a legacy file, please see the Troubleshooting section of this manual or contact Serveron or your Serveron representative for assistance. In most cases, corrupt or invalid files can be repaired without loss of data.
Using XML Files
TM View can generate XML files containing the data for a given monitor. The “Export Data…” option allows creating a file containing the data from a monitor within the selected date range. For DGA monitors, the contents of the XML file are identical to that of a TGH file, but the XML format is much more versatile and universal than the TGH file format. In particular, it does not require specialized code to interpret.
Using Commands Commands (user actions) appear in context menus created by TM View according to the navigation item currently selected. Context menus are accessed by a Right-Click action on the navigation item of interest. Sometimes, the item must be selected before executing the right-click.
Some of the context menu items are also available on the menu bar. In the menu bar, menu items are unavailable (“grayed out”) when they do not apply to the current selection. For example, the File Export… menu item is available only when the navigation item selected is a monitor. Otherwise, it is grayed out.
Note: If your TM View installation is a Viewer Only configuration, all commands that update or modify data are unavailable to you. These
commands must be performed from a Server configuration.
The contents of the context menu change according to the currently selected navigation item and tab. The command to Export Data…, for example, is only available when a monitor is selected in the navigation tree. It does not appear in the context menu when a transformer, substation or region is selected.

Using TM View
www.serveron.com Page 29 of 189 810-1864-08 REV A
Figure 10 - Context Menus for Monitor (left) and Transformer (right)
All TM View commands are described in the Menu Commands section of the TM View Reference section of this manual.
Note: the TOAN license menu item will only get shown if the TOAN plugin
has been installed.
Using Tabs This section provides an overview of the status and graphing tabs.

Using TM View
www.serveron.com Page 30 of 189 810-1864-08 REV A
Using the Monitor Status Tab
When a monitor is selected, the default (leftmost) tab presents a dashboard-like status overview. The tab contains colored status indicators and other information pertinent to the type of monitor selected. For DGA monitors, an Alarm History display is available. The tab is shown in Figure 11 – Status Tab.
Figure 11 – Status Tab
For DGA monitors, the groups of colored indicators on the upper left show:
• The state of the gas PPM level alarm.
• The state of the gas rate of change (ROC).
• The status of the monitor.
• The data age (an indication of whether data has recently been obtained from the monitor).
• The Duval Triangle region for the latest sample collected from the monitor. The region is “n/a” if the gas levels are too low for the Duval Triangle to be relevant.
Note: TM1 monitors do not monitor the gases used in the Duval
triangle.
• A button “Show Monitor Configuration” allows viewing the monitor’s configuration. That button is disabled until the first time the monitor is polled successfully.

Using TM View
www.serveron.com Page 31 of 189 810-1864-08 REV A
For TMx monitors, the configuration is shown as it would appear in a terminal session with the monitor. For TMFlex monitors, the configuration appears as XML text.
• A button “Show Monitor Events” allows viewing a list of the monitor’s system events, most recent first. That button is disabled until the first time TM View polls the monitor and collects events.
The Event History section shows the status reported by the selected monitor over the previous several days. This display expands to fill the available screen width. The colored vertical bars represent the outcome of sample runs and other significant monitoring events. Bars that represent successful sample runs are colored green, yellow or red to indicate the most urgent condition detected by that sample run (normal, caution, or alarm). Black bars are displayed to indicate that the monitor aborted a run due to an error and blue bars indicate that the monitor encountered a Service Required condition. If the most recent data is more than about 48 hours old, the Event History label displays WARNING: No Recent Gas Data in red.
Note: for more information about sample runs, Service Required conditions, and other Serveron Online Transformer Monitor principles of operation, please consult the documentation that was provided with your
monitor or visit http://www.serveron.com.
To obtain details of a particular day’s runs and other significant monitor events, move the mouse pointer over the rectangle (tile) representing that day and click. A small dialog box will be shown containing details of that day’s activity. Click OK to clear the dialog.
Using the Graphs
The Gas in Oil PPM, Rate of Change, and Percent of Alarm graph tabs share several key features. (The Rate of Change graph is available for Serveron model TM8 and TM3 monitors only).
The content of a typical graph tab is shown in Figure 12.

Using TM View
www.serveron.com Page 32 of 189 810-1864-08 REV A
Figure 12 - Graph tab components
These graphs display two vertical (Y) axes, one at the left and the other at the right. The values of gases are always displayed relative to the left or primary axis, which may be either logarithmic or linear. Sensor readings (LoadGuide, Ambient Temperature, etc.) are displayed relative to the right or secondary axis, which always displays a linear scale.
A graph legend indicating the color of each gas or sensor data series appears to the right of the graph area. The graph legend relates colors to measured values. Carbon Monoxide (CO), for example, is always shown in red. When a graph is first displayed, measured gas values are shown while computed values and sensor values are hidden. The colored circle adjacent to each series names in the legend is a control button. To display or hide a particular gas or sensor data series, click the appropriate button.
Tips:
A single left-click on a series button in the legend box will hide or show the data for that series.
A single right-click on a series button will turn off all other series and only show that series.
A double-click (left button) on any button in the legend box will reset the series display to its original defaults.
Serveron TM series DGA monitors support configurable labeling for external sensors. For these models, the external sensor labels are taken from information stored in the
Graph Toolbar
Secondary (sensor) Y axis
DGA
Graph Legend
X axis (time)
Primary Y axis
Primary Y axis label
Graph title

Using TM View
www.serveron.com Page 33 of 189 810-1864-08 REV A
transformer monitor itself. The labels are normally configured when the monitor is installed. TM View does not support the ability to change the configured labels.
The legend information at extreme upper right indicates that one or more manual dissolved gas analysis (DGA) readings are currently being displayed on the graph. This legend block appears only when manual DGA readings are being shown. On the graph surface, manual DGA data appears as small x markers in the color of the corresponding gas data series. To see the numerical values of DGA data, simply slide the mouse over the area of the DGA.
For more information about the Gas in Oil PPM, Rate of Change, and Percent of Alarm tabs, including instructions for entering manual DGA readings, see the corresponding section in the TM View Reference chapter later in this manual.
Graph Toolbar
Graph tabs contain their own toolbar. It is distinct from the Application Toolbar that contains the End Date and Range controls. The graph toolbar is detailed in Figure 13.
Figure 13 - Graph Toolbar
Copy to Clipboard. This button allows the graph contents to be transferred to the Windows Clipboard in one of three formats: bitmap, metafile, and text. Bitmap and metafile are image formats compatible with many other applications. Text format allows the graph data to be copied. In most cases, better results can be achieved with the File Export menu item, which is described in the TM View Menu Commands section of this manual.
Print. This button allows the graph contents to be printed. Its behavior is identical to the File Print menu item, also described in the Menu Commands section.
Copy to Clipboard
Toggle: Point Labels
Toggle: Zoom
Toggle: Primary Y axis log/linear
Toggle: Data Table
Display Rogers Ratio Viewer
Toggle: Annotations
Annotate

Using TM View
www.serveron.com Page 34 of 189 810-1864-08 REV A
Point Labels. This button allows point labels to be displayed or hidden. Point labels are most useful when only a limited number of points are displayed (for example, a 3-day view).
Data Table. TM View can display a data table which provides a tabular data view of the data that is linked to the graph contents. The Data Table button allows the data table to be displayed or hidden. When the mouse is moved over Data Table cells, the corresponding point in the graph series is highlighted. When the mouse is moved over a point in the graph series, the Data Table is automatically scrolled to display the corresponding cell and that cell is highlighted.
Zoom. The zoom button enables or disables “zooming” the graph. With zoom enabled, you can click in the graph area at the upper left corner of the area you wish to enlarge and drag the mouse down and to the right to define the area you wish to display. When you release the mouse button the selected area expands to fill the entire graph region and sliders (similar to scroll bars) are displayed to allow the graph to be repositioned. You may zoom repeatedly to magnify smaller areas or click the toggle again to restore the original resolution.
Log Scale. The log/linear button change the primary Y axis from a log scale to a linear scale and back. Display of sensor values is not affected. Sensor values are displayed relative to the secondary Y axis, which is always linear and displays a fixed range suitable for sensors supported by Serveron.
Display Rogers Ratio Viewer. Clicking this button displays the Rogers Ratio Viewer, a graphical transformer diagnostic display. For more information about the Rogers Ratio Viewer, see Using the TM View Rogers Ratio.
Toggle Annotations. This button toggles the display of graph annotation markers. Annotations are notes attached to particular points in time on the graph while their markers are cartoon-style “thought bubbles.” To see the annotation contents, move the mouse over the marker or click within the bubble.
Annotate. Clicking this button displays the Annotate dialog box, which allows you to enter annotations (notes) that are associated with a point in time on the graph.
Automatic Scheduled Polling Option To use automatic polling, select the root or a Region node in the navigator and click the Polling tab. The viewing pane should show a list of monitors. Click on a monitor (row) to select it and then right-click Poller Settings… in the context menu.
The Update Automatic Polling Status dialog box appears.
Automated polling for a monitor is enabled by checking Automatically poll this monitor in the Update Automatic Polling Status dialog. A shortcut is provided in the context menu to toggle the Auto-Poll attribute of a monitor. This allows quickly turning on or off the automatic polling for that monitor.
Pause AutoPolling

Using TM View
www.serveron.com Page 35 of 189 810-1864-08 REV A
TM View Standard
TM View Enterprise X
To help troubleshooting polling of a particular monitor, TM View Enterprise allows to temporarily pause the Automatic Polling feature of TM View. In the Tools menu, select “Pause Polling” – this will toggle between pausing and resuming polling.
Note: If you leave the system in Paused polling, it will automatically resume auto-polling after 4 hours.
Viewing Pane and Tabs
www.serveron.com Page 36 of 189 810-1864-08 REV A
TM View Reference This chapter contains details of every tab and menu command in the TM View user interface. The next section describes the navigation pane. The tabs are discussed in the Viewing Pane section. Menu items are documented in the

TM View Reference
www.serveron.com Page 37 of 189 810-1864-08 REV A
Menu Commands section that follows. For reference, the user interface overview is shown in Figure 14.
Figure 14 - TM View User Interface Overview
Navigation Tree
The navigation pane contains a hierarchical list (called a tree) showing the regions, substations, assets and monitors defined in all the monitors you have opened or created. Each item in the navigation pane is identified by an icon. The icons are shown in Figure 15.
Figure 15 - Navigation Pane Icons
Navigation Tree allows to select region, substation, transformer or monitor
Menu bar
Viewing pane
Date Range Slider
Tabs
Graphics Toolbar
Search box
TM View Reference
www.serveron.com Page 38 of 189 810-1864-08 REV A
To expand an icon, displaying the items it contains, click the + (plus) adjacent to a collapsed icon. To collapse the icon, hiding the items it contains, click the – (minus) adjacent to an expanded icon.
When you select an icon by clicking on it, the viewing pane is redrawn with tabs that are appropriate to display information about the selected item.
Icons in the navigation pane change to notify you of conditions that may require your attention. For details of the alternative icons used for notification, please refer to Navigation Pane Icons and Notification.
To add to the navigation pane, click New Asset… or Open… in the File menu. For detailed descriptions of this command, please see the Menu Commands section later in this manual.
Context Menus
The context menus, as their name implies, vary according to the context, i.e. to the navigation item currently selected and the tab currently selected in the viewing pane. Context menus can be obtained by clicking on the right mouse button when the mouse pointer is over the selection.
The item selected in the navigation pane determines a ‘fixed’ set of commands in the context menu. The tab selected in the viewing pane determines which, if any, additional commands will be appended to the context menu. This section describes the fixed parts of the context menu for each type of selectable item in the navigation pane.
Monitor Context Menu
The context menu for TM2, TM3 and TM8 monitors always contains the items shown in Figure 16.
The context menu is identical regardless of which tab is selected, but the result of some context menu actions are only visible in some tabs.

TM View Reference
www.serveron.com Page 39 of 189 810-1864-08 REV A
Figure 16 - Monitor Context Menu
The context menu for a TM1 monitor is as shown in the figure below.
For all the monitor context menu entries below, we will use a table like this
TM1 TM2 TM3 TM8
N Y Y Y
to indicate which type of monitor the command applies to. If a command applies to all monitor types, the table may be omitted.
TM View Reference
www.serveron.com Page 40 of 189 810-1864-08 REV A
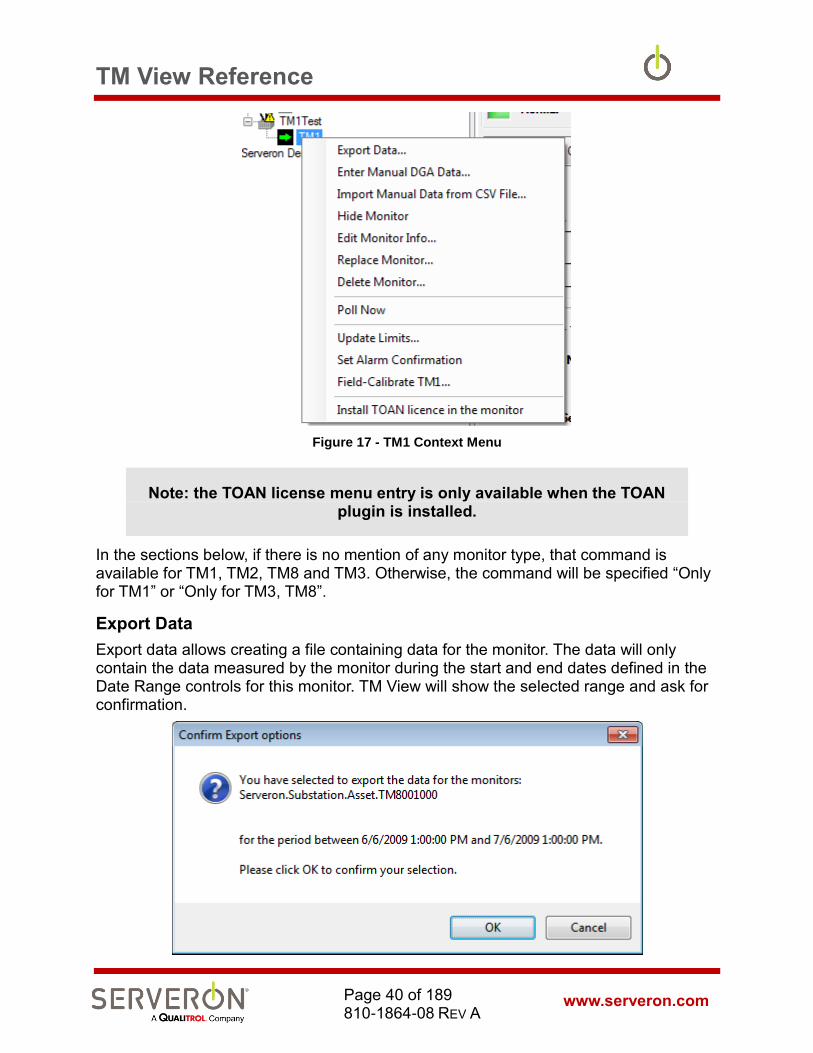
Figure 17 - TM1 Context Menu
Note: the TOAN license menu entry is only available when the TOAN plugin is installed.
In the sections below, if there is no mention of any monitor type, that command is available for TM1, TM2, TM8 and TM3. Otherwise, the command will be specified “Only for TM1” or “Only for TM3, TM8”.
Export Data
Export data allows creating a file containing data for the monitor. The data will only contain the data measured by the monitor during the start and end dates defined in the Date Range controls for this monitor. TM View will show the selected range and ask for confirmation.

TM View Reference
www.serveron.com Page 41 of 189 810-1864-08 REV A
Figure 18 – Export Data
The format of the file is either CSV, XML, TOA4 (a variant of CSV) and TGH.
See the Exporting Data section for more details.
Enter Manual DGA Data
TM1 TM2 TM3 TM8
N Y Y Y
Selecting Enter Manual DGA Data… displays the Enter DGA Data dialog box, which contains a simple spreadsheet-like data editor. Set the date of your manual DGA report in the Record Time field and enter the values for the nine supported gases. You may enter multiple rows or correct existing entries. When you click OK, the DGA data is saved and displayed on the graph.
This feature is only available for the “Server” installations of TM View.
Import Manual Data from CSV File
TM1 TM2 TM3 TM8
N Y Y Y
Selecting Import Manual Data from CSV File allows selecting a CSV file and importing the data it contains as if it were manual DGA data. This data would be shown as manual data, and can even be edited using the Enter Manual DGA Data… option.
This feature is only available for the “Server” installations of TM View, and is not available for the TM1.
Hide Monitor
This option allows you to hide the monitor from the navigation tree and all the data ever collected from that monitor.
This feature is only available for the “Server” installations of TM View.
Edit Monitor Info
This option allows editing some monitor attributes: serial number, monitor asset tag and poller ID.
This feature is only available for the “Server” installations of TM View. It also allows editing the “Remarks” property of a monitor. The Remarks are any text that the user wants to attach to a monitor (maintenance memos, etc.). They are then listed on the Fleet Reports (from the Fleet Reports plugins.)
Replace Monitor
This option allows you to replace this monitor with another one, which results in a new serial number. When this is done, Serveron technicians usually transfer all the data to the new monitor and the only thing that changes for TM View is the serial number. In that case, the user can use the “Edit Monitor Info” to just change the serial number. If the data has not been transferred, and the new monitor has no data, then this option
TM View Reference
www.serveron.com Page 42 of 189 810-1864-08 REV A
must be used because it is the only one that allows resetting the run counter maintained by TM View, which allows the user to poll the monitor starting from the last record polled. Otherwise, polling this monitor will not be possible.
This feature is only available for the “Server” installations of TM View.
Delete Monitor
When enabled, this option allows deleting a monitor from the database. The user has the option of deleting only the data from the monitor (allowing to poll it again), or deleting both the monitor and all its data. THIS OPERATION IS NOT REVERSIBLE!!!. To enable the option, a special entry must be added to the configuration file. Add a line like this to the <appSettings> section of the configuration file:
<add key=”AllowDeleteMonitor” value=”true” />
Poll Now
This option allows the user to immediately poll the monitor, if the poller is also installed on the same computer. The monitor will be polled regardless of its normal polling schedule, if it is automatically polled.
This feature is only available for the “Server” installations of TM View.
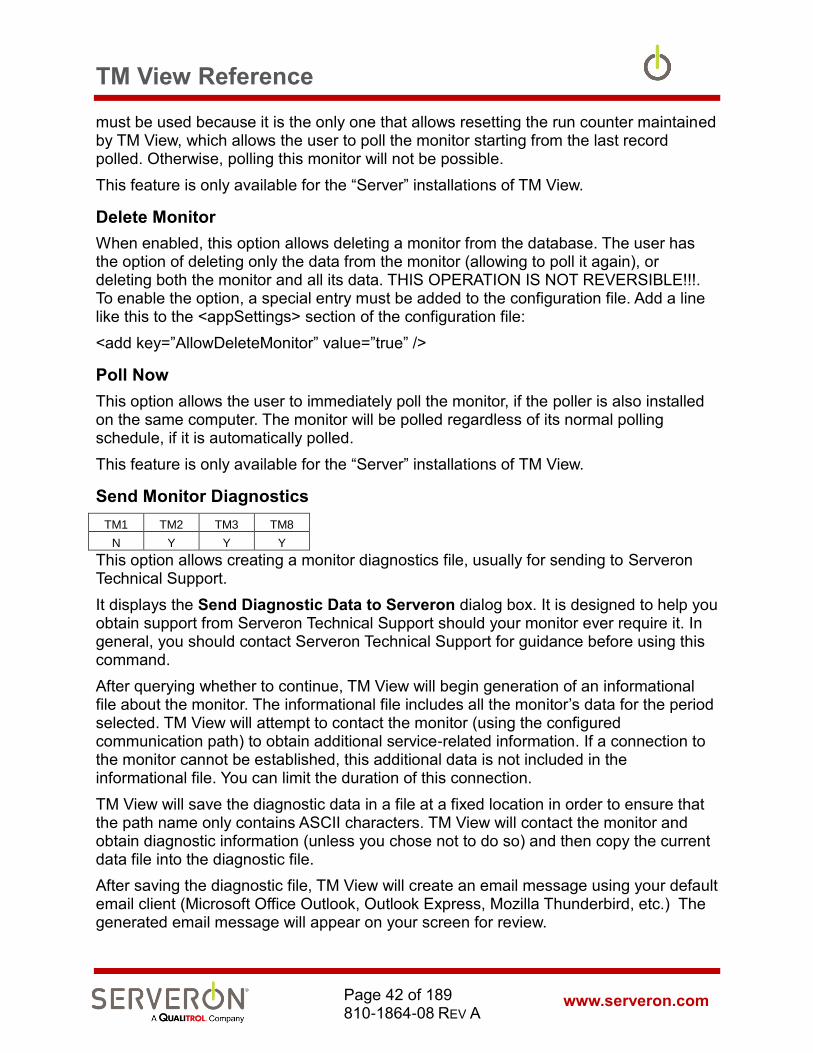
Send Monitor Diagnostics
TM1 TM2 TM3 TM8
N Y Y Y
This option allows creating a monitor diagnostics file, usually for sending to Serveron Technical Support.
It displays the Send Diagnostic Data to Serveron dialog box. It is designed to help you obtain support from Serveron Technical Support should your monitor ever require it. In general, you should contact Serveron Technical Support for guidance before using this command.
After querying whether to continue, TM View will begin generation of an informational file about the monitor. The informational file includes all the monitor’s data for the period selected. TM View will attempt to contact the monitor (using the configured communication path) to obtain additional service-related information. If a connection to the monitor cannot be established, this additional data is not included in the informational file. You can limit the duration of this connection.
TM View will save the diagnostic data in a file at a fixed location in order to ensure that the path name only contains ASCII characters. TM View will contact the monitor and obtain diagnostic information (unless you chose not to do so) and then copy the current data file into the diagnostic file.
After saving the diagnostic file, TM View will create an email message using your default email client (Microsoft Office Outlook, Outlook Express, Mozilla Thunderbird, etc.) The generated email message will appear on your screen for review.

TM View Reference
www.serveron.com Page 43 of 189 810-1864-08 REV A
You must attach the informational file to the generated email message using the commands provided by your email client. Instructions for locating the file appear within the generated email message itself.
Note: TM View only prepares data for transmission to Serveron Customer Service. TM View will never, under any circumstances, send data of any
kind to Serveron. You must send the email that was generated in TM View, like you would any other email, if you wish to communicate the diagnostic information to Serveron. The message is not sent until the user clicks on
the “Send” button of the mail client available on the system.
This feature is only available for the “Server” installations of TM View.
Set Monitor Date and Time
TM1 TM2 TM3 TM8
N Y Y Y
This option allows setting the date and time on the monitor. Some monitors do not allow this action.
This feature is only available for the “Server” installations of TM View.
Change Monitor Password
TM1 TM2 TM3 TM8
N Y Y Y
This option allows changing the password on a DGA monitor.
This feature is only available for the “Server” installations of TM View.
New Verification Gas Cylinder
TM1 TM2 TM3 TM8
N Y Y Y
Selecting this option will display a dialog prompting the user for the actual gas levels of the calibration tank being installed, and the expiration date for the tank. If the user clicks OK out of that dialog, the monitor will be contacted and the gas levels set for the calibration tank, along with the expiration date.
Start Sampling Run
TM1 TM2 TM3 TM8
N Y Y Y
Selecting Start Sampling Run immediately contacts the monitor to begin a sampling run. Since sampling runs are scheduled automatically by the monitor, use of this command is rarely required.
This feature is only available for the “Server” installations of TM View.

TM View Reference
www.serveron.com Page 44 of 189 810-1864-08 REV A
Note: To adjust the monitor’s sampling schedule, right-click the monitor icon in the navigation pane, then select Edit Sampling Schedule… in the Context menu. TM View displays the Update Sampling Schedule dialog box. When you click OK, TM View immediately contacts the monitor and
updates the schedule you have defined.
Start Verification Run & Start Calibration Run
TM1 TM2 TM3 TM8
N Y Y Y
Selecting Start Verification Run immediately contacts the monitor to begin a verification run. Since verification runs are scheduled automatically by the monitor, use of this command is rarely required.
Note: To adjust the monitor’s verification schedule, right-click the monitor icon in the navigation pane, then select Update Sampling… in the
Context menu. TM View displays the Update Sample Schedule dialog box. When you click OK, TM View immediately contacts the monitor and
updates the schedule you have defined.
Selecting Start Calibration Run immediately contacts the monitor to begin a calibration run.
Note: Serveron monitors contain an auto-calibration feature. Manual calibration runs should only be performed when instructed by Technical
Support personnel.
Update Limits
To change the limits, right-click the monitor icon in the navigation tree and select Update Limits… in the context menu. This displays the Update Alarm and Caution Limits dialog box. To change a limit, click in the desired cell and type the new value. When you click OK, the monitor is immediately updated. The viewing pane is refreshed when the update is complete.
This feature is only available for the “Server” installations of TM View.
Note: To turn a caution or alarm limit OFF, set the value to 0 (zero). TM View’s behavior in that regard will be as follows:
• If the caution level is 0 and the alarm level is 0 then all alarms and cautions are turned OFF for this gas

TM View Reference
www.serveron.com Page 45 of 189 810-1864-08 REV A
• If the caution level is 0 and the alarm level is not 0, then the caution level will be set equal to the alarm level
• If neither the caution level or the alarm level are 0, then they are set as specified by the user
• ROC results can be negative: however, a caution or alarm level that is less or equal to zero will be interpreted as 0.
Set Alarm Confirmation
This command allows setting up the alarm confirmation feature of the monitor’s firmware. This works as preventive filter against false positive alarms: by default the monitor raises an alarm as soon as it detects a gas level or rate of change above the limit set for that gas. When the alarm confirmation feature is set, the monitor will wait to get a given number of runs with a value above the limit before raising the alarm.
Figure 19 - Alarm Confirmation dialog
The options for this feature include:
- Enable alarm confirmation: enable or disable the feature.
- Consecutive Runs: the number of runs with the value above the limit before the TMx raises an alarm
- Enable Accelerated Runs (TM8 and TM3 only): when enabled, the monitor will start the confirmation sampling run immediately, instead of waiting for the scheduled sampling time.
Edit Sampling Schedule
TM1 TM2 TM3 TM8
N Y Y Y
To change the monitor’s sampling or verification schedules, click Edit Sampling Schedule… on the context menu while this tab is displayed. The Update Sampling Schedule dialog is displayed. When you click OK in the dialog box, TM View immediately contacts the monitor and updates the monitor’s sampling schedule.
TM View Reference
www.serveron.com Page 46 of 189 810-1864-08 REV A
Sample Hourly
TM1 TM2 TM3 TM8
N Y Y Y
The Sample Hourly command causes TM View to connect to the transformer monitor and establish a temporary sampling schedule within the monitor. The temporary schedule continues for 24 hours and specifies that sample runs should be performed once per hour.
Edit Communications
The Edit Communications command allows changing the connection parameters for the monitor. It brings up the Communications wizard, which guides the user through the options for connecting the poller to a monitor. This feature is only available for the “Server” installations of TM View.
Check Communications
The Check Communications command causes the poller to connect to the monitor and check the monitor time. This test confirms that the connection parameters are correct. This feature is only available for the “Server” installations of TM View.
Transformer Menu
The context menu for transformers never changes with the selected tab. It always contains the options pictured below.
Figure 20 - Transformer Context Menu
Edit Transformer Info
This option allows entering and modifying maintenance information about the transformer. This information is not operational for TM View: TM View only stores it and displays it as entered. This feature is only available for the “Server” installations of TM View.
Substation Menu
The only action allowed when a substation is selected in the navigation pane is to rename the substation.
Figure 21 - Substation Context Menu
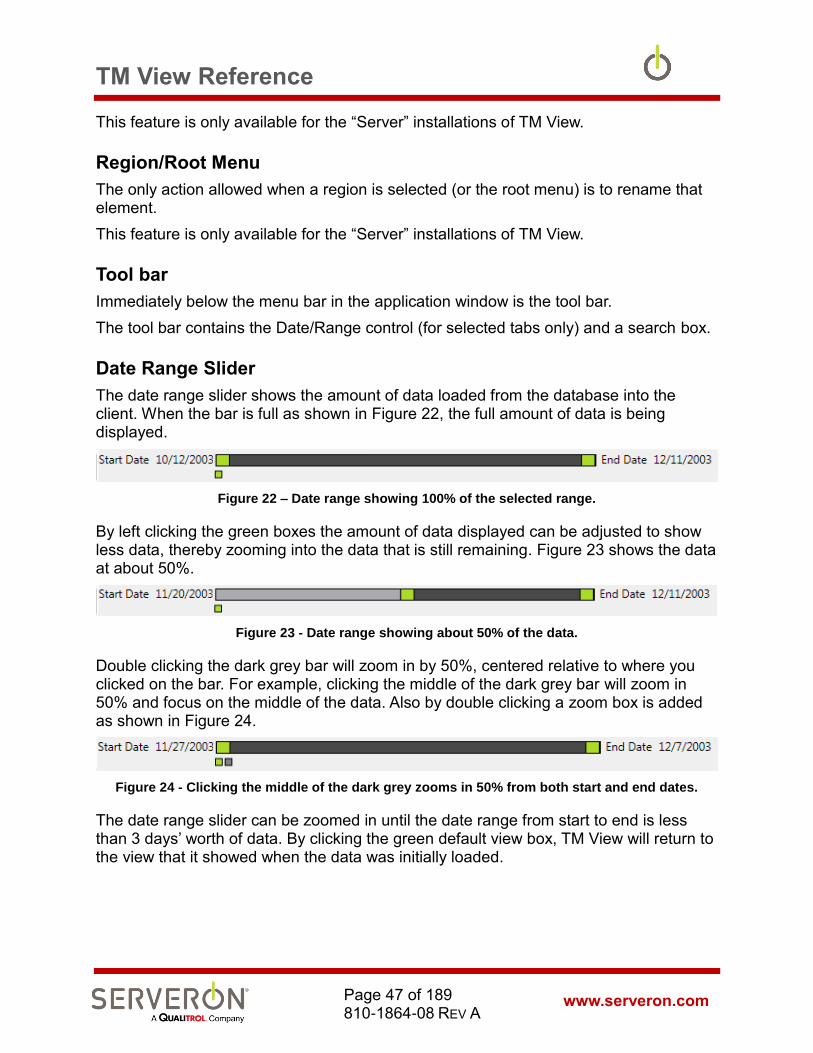
TM View Reference
www.serveron.com Page 47 of 189 810-1864-08 REV A
This feature is only available for the “Server” installations of TM View.
Region/Root Menu
The only action allowed when a region is selected (or the root menu) is to rename that element.
This feature is only available for the “Server” installations of TM View.
Tool bar
Immediately below the menu bar in the application window is the tool bar.
The tool bar contains the Date/Range control (for selected tabs only) and a search box.
Date Range Slider
The date range slider shows the amount of data loaded from the database into the client. When the bar is full as shown in Figure 22, the full amount of data is being displayed.
Figure 22 – Date range showing 100% of the selected range.
By left clicking the green boxes the amount of data displayed can be adjusted to show less data, thereby zooming into the data that is still remaining. Figure 23 shows the data at about 50%.
Figure 23 - Date range showing about 50% of the data.
Double clicking the dark grey bar will zoom in by 50%, centered relative to where you clicked on the bar. For example, clicking the middle of the dark grey bar will zoom in 50% and focus on the middle of the data. Also by double clicking a zoom box is added as shown in Figure 24.
Figure 24 - Clicking the middle of the dark grey zooms in 50% from both start and end dates.
The date range slider can be zoomed in until the date range from start to end is less than 3 days’ worth of data. By clicking the green default view box, TM View will return to the view that it showed when the data was initially loaded.
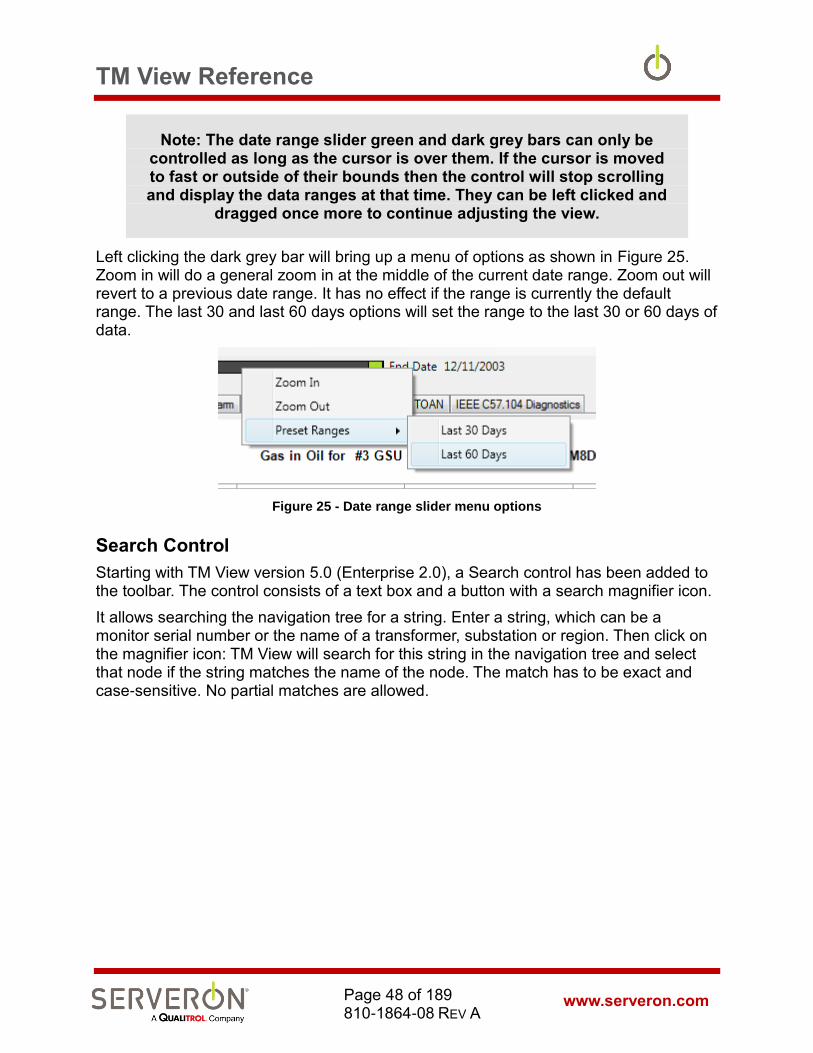
TM View Reference
www.serveron.com Page 48 of 189 810-1864-08 REV A
Note: The date range slider green and dark grey bars can only be controlled as long as the cursor is over them. If the cursor is moved to fast or outside of their bounds then the control will stop scrolling and display the data ranges at that time. They can be left clicked and
dragged once more to continue adjusting the view.
Left clicking the dark grey bar will bring up a menu of options as shown in Figure 25. Zoom in will do a general zoom in at the middle of the current date range. Zoom out will revert to a previous date range. It has no effect if the range is currently the default range. The last 30 and last 60 days options will set the range to the last 30 or 60 days of data.
Figure 25 - Date range slider menu options
Search Control
Starting with TM View version 5.0 (Enterprise 2.0), a Search control has been added to the toolbar. The control consists of a text box and a button with a search magnifier icon.
It allows searching the navigation tree for a string. Enter a string, which can be a monitor serial number or the name of a transformer, substation or region. Then click on the magnifier icon: TM View will search for this string in the navigation tree and select that node if the string matches the name of the node. The match has to be exact and case-sensitive. No partial matches are allowed.

Viewing Pane and Tabs
www.serveron.com Page 49 of 189 810-1864-08 REV A
Viewing Pane This section contains additional details about the tabs that appear in the viewing pane. The current selection in the navigation pane determines which tabs appear in the viewing pane.
Monitor Asset Tabs: DGA Monitors
This section discusses the tabs that appear when an on-line monitor is selected in the navigation pane.
Status Tab
The Status tab is the default view when a DGA monitor is selected. It displays a dashboard-like display of the status of the selected monitor. The following indicators are provided:
Gas PPM Level Status and Gas ROC Status - These three-level indicators show the results of the most recent sample obtained from the monitor. They display alarm (red) to indicate that the monitor encountered a gas alarm condition on the most recent sample run or caution (yellow) to indicate a gas caution condition. If no cautions or warnings were detected on the most recent sample run, both indicators display normal (green). If no readings have ever been received, all three indicators display background gray.
Monitor Status - This two-level indicator displays Service-Required (blue) to indicate that the monitor has encountered a service-required condition. The blue indicator mimics the blue service-required lamp on the front panel of the monitor itself. The indicator displays normal (green) to indicate a healthy monitor. If no data has ever been received from the monitor, both indicators display background gray.
Data Age - This three-level indicator shows whether gas-in-oil data from the monitor is up to date or needs to be refreshed by polling the monitor.
- 0 – 8 Hours Old (green) indicates that the timestamp of the most recently-received sample run is from 0 to approximately 8 hours old.
- 8 – 24 Hours Old (yellow) indicates the most recent sample is more than about 8 hours old but no older than about 24 hours.
- 24 Hours or Older (red) indicates that the most recent sample is more than about 24 hours old.
- If no sample data has ever been received from the monitor, all three indicators display background gray.
Event History This horizontal region shows the monitor’s activity over recent days. Each rectangular block or tile displays one day’s activities with the most recent day’s activity appearing at right.
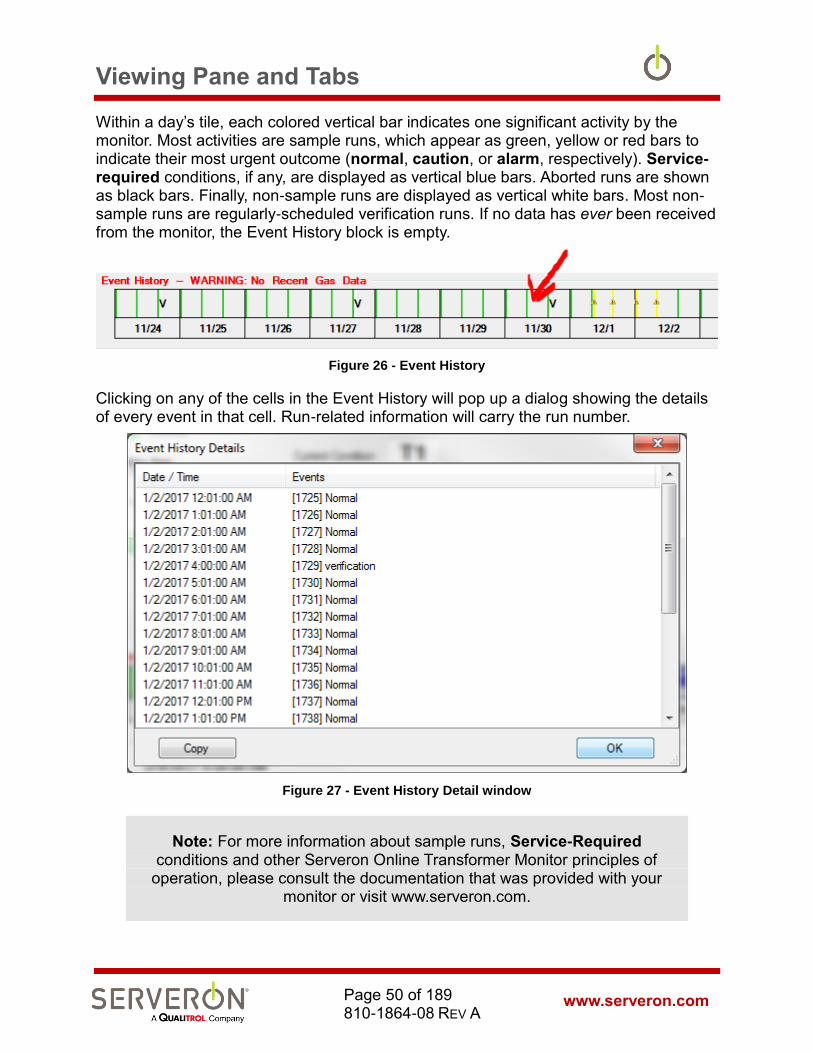
Viewing Pane and Tabs
www.serveron.com Page 50 of 189 810-1864-08 REV A
Within a day’s tile, each colored vertical bar indicates one significant activity by the monitor. Most activities are sample runs, which appear as green, yellow or red bars to indicate their most urgent outcome (normal, caution, or alarm, respectively). Service-required conditions, if any, are displayed as vertical blue bars. Aborted runs are shown as black bars. Finally, non-sample runs are displayed as vertical white bars. Most non-sample runs are regularly-scheduled verification runs. If no data has ever been received from the monitor, the Event History block is empty.
Figure 26 - Event History
Clicking on any of the cells in the Event History will pop up a dialog showing the details of every event in that cell. Run-related information will carry the run number.
Figure 27 - Event History Detail window
Note: For more information about sample runs, Service-Required conditions and other Serveron Online Transformer Monitor principles of
operation, please consult the documentation that was provided with your monitor or visit www.serveron.com.
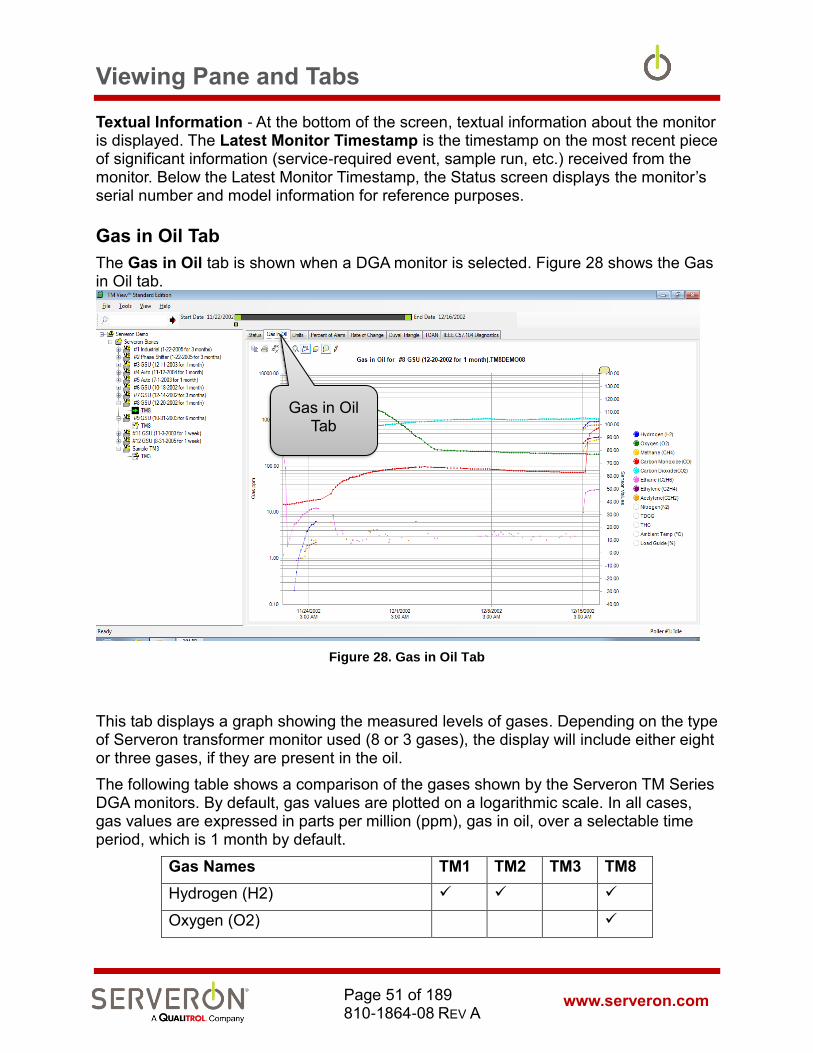
Viewing Pane and Tabs
www.serveron.com Page 51 of 189 810-1864-08 REV A
Textual Information - At the bottom of the screen, textual information about the monitor is displayed. The Latest Monitor Timestamp is the timestamp on the most recent piece of significant information (service-required event, sample run, etc.) received from the monitor. Below the Latest Monitor Timestamp, the Status screen displays the monitor’s serial number and model information for reference purposes.
Gas in Oil Tab
The Gas in Oil tab is shown when a DGA monitor is selected. Figure 28 shows the Gas in Oil tab.
Figure 28. Gas in Oil Tab
This tab displays a graph showing the measured levels of gases. Depending on the type of Serveron transformer monitor used (8 or 3 gases), the display will include either eight or three gases, if they are present in the oil.
The following table shows a comparison of the gases shown by the Serveron TM Series DGA monitors. By default, gas values are plotted on a logarithmic scale. In all cases, gas values are expressed in parts per million (ppm), gas in oil, over a selectable time period, which is 1 month by default.
Gas Names TM1 TM2 TM3 TM8
Hydrogen (H2) ✓ ✓ ✓
Oxygen (O2) ✓
Gas in Oil Tab
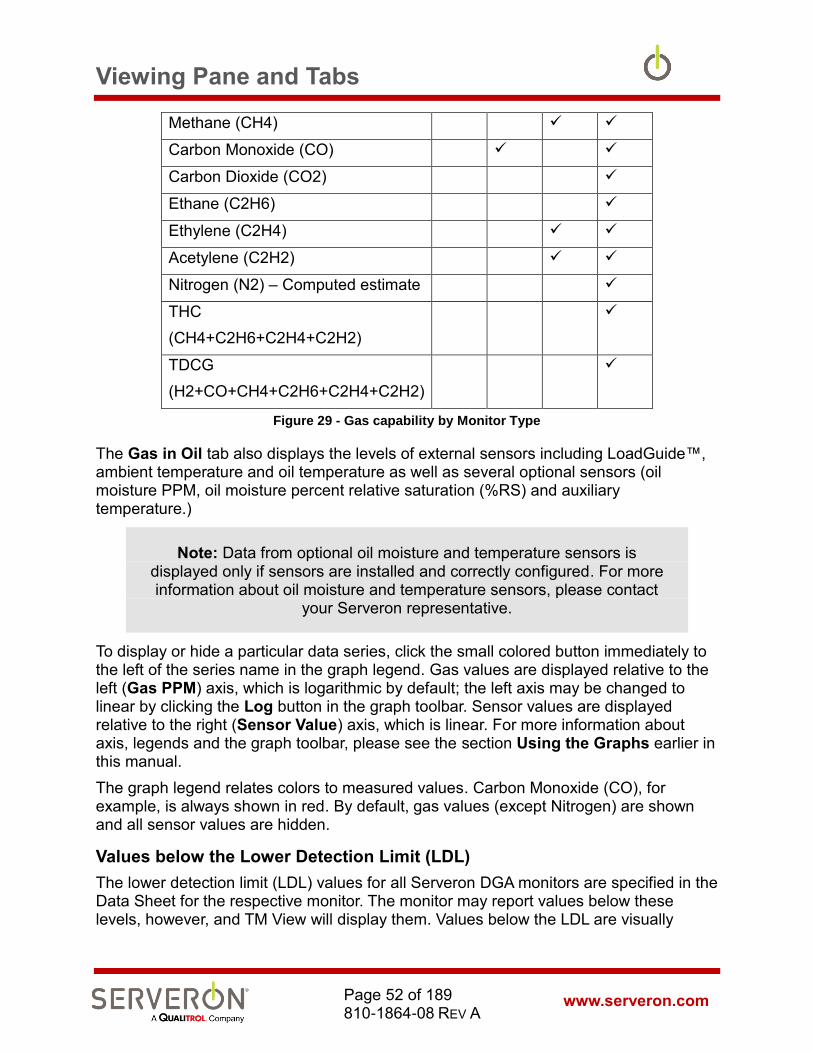
Viewing Pane and Tabs
www.serveron.com Page 52 of 189 810-1864-08 REV A
Methane (CH4) ✓ ✓
Carbon Monoxide (CO) ✓ ✓
Carbon Dioxide (CO2) ✓
Ethane (C2H6) ✓
Ethylene (C2H4) ✓ ✓
Acetylene (C2H2) ✓ ✓
Nitrogen (N2) – Computed estimate ✓
THC
(CH4+C2H6+C2H4+C2H2)
✓
TDCG
(H2+CO+CH4+C2H6+C2H4+C2H2)
✓
Figure 29 - Gas capability by Monitor Type
The Gas in Oil tab also displays the levels of external sensors including LoadGuide™, ambient temperature and oil temperature as well as several optional sensors (oil moisture PPM, oil moisture percent relative saturation (%RS) and auxiliary temperature.)
Note: Data from optional oil moisture and temperature sensors is displayed only if sensors are installed and correctly configured. For more information about oil moisture and temperature sensors, please contact
your Serveron representative.
To display or hide a particular data series, click the small colored button immediately to the left of the series name in the graph legend. Gas values are displayed relative to the left (Gas PPM) axis, which is logarithmic by default; the left axis may be changed to linear by clicking the Log button in the graph toolbar. Sensor values are displayed relative to the right (Sensor Value) axis, which is linear. For more information about axis, legends and the graph toolbar, please see the section Using the Graphs earlier in this manual.
The graph legend relates colors to measured values. Carbon Monoxide (CO), for example, is always shown in red. By default, gas values (except Nitrogen) are shown and all sensor values are hidden.
Values below the Lower Detection Limit (LDL)
The lower detection limit (LDL) values for all Serveron DGA monitors are specified in the Data Sheet for the respective monitor. The monitor may report values below these levels, however, and TM View will display them. Values below the LDL are visually

Viewing Pane and Tabs
www.serveron.com Page 53 of 189 810-1864-08 REV A
distinguished by their pale translucent color. This pale color serves as a visual reminder that uncertainty is associated with the measurement.
Displaying Manual DGA Data
Manual DGA data is displayed as one or more small colored x markers on the Gas in
Oil graph and on the Duval Triangle graph.
On the Gas in Oil graph, the colors match the corresponding data series, i.e. CO is displayed in red, H2 in blue, etc.
On the Duval Triangle graph, all manual entry data is shown in various shades of green, depending on the age of the data point.
Moving the mouse pointer near a DGA reading on the graph surface displays a pop-up window showing the exact numerical value of each of the DGA measurements.
Note: If you have a Serveron model TM3 monitor, only the TM3 gases (CH4, C2H2, and C2H4) are displayed on the graph. You may enter values for all 9 fields in the dialog box, however. When you move the
mouse over the DGA sample area, all 9 gas in oil values are shown in the pop-up window.
Disabling a data series by clicking in the graph legend also disables the corresponding DGA value from appearing on the graph.
When DGA data is visible on the graph, a small DGA legend appears at the upper right corner of the screen to indicate the meaning of the display.
Limits Tab
The Limits tab is shown when a transformer asset is selected. It displays caution (warning) and alarm limits for the gases measured by the monitor being selected. Limits are displayed for both gas in oil PPM level and gas in oil rate of change (ROC, reported in PPM/day). This tab also displays the most recently measured values reported by the monitor for gas in oil, rate of change and goodness of fit (a quality metric for the current ROC value).
Percent of Alarm Tab
The Percent of Alarm tab is shown when a transformer asset is selected. It displays measured gas values and TDCG normalized to their individual alarm or caution limit values.
Example: suppose the alarm limit for H2 is 50 PPM and the alarm limit for C2H4 is 120 PPM. Further, suppose the measured value for H2 is 40 PPM and the measured value for C2H4 is 60 PPM. Then the displayed value for H2 will be 80 (40 PPM is 80% of the limit value, 50 PPM) and the displayed value for C2H4 will be 50 (60 PPM is 50% of 120).

Viewing Pane and Tabs
www.serveron.com Page 54 of 189 810-1864-08 REV A
Values may be displayed relative to their caution limits instead of their alarm limits by clicking one of the buttons at lower right. Sensor values (LoadGuide, Ambient Temp, etc.) do not have alarm or caution limits. Their actual values are shown relative to the right axis for reference purposes.
Rate of Change Tab
The Rate of Change tab is shown when a transformer asset is selected and the transformer monitor is a Serveron model TM8, TM2 or TM3.
This tab displays the smoothed rate of change (ROC) of gas in oil values expressed in PPM per day. ROC is not computed for sensor values (LoadGuide, Ambient Temp, etc.). Their actual values are shown relative to the right axis for reference purposes.
Duval Triangle Tab
The Duval Triangle is an analytical tool developed by Dr. Michel Duval of IREQ (Hydro Quebec), Canada. The Triangle presents DGA (dissolved gas analysis) results in a graphical form by sorting them according to a list of faults as codified by IEC Publication 60599, "Mineral oil-impregnated electrical equipment in service- Guide to the interpretation of dissolved and free gases analysis," March 1999.
The Duval triangle is only available for the TM3 and the TM8.
For more information about the Triangle, see Using the Duval Triangle.
IEEE C57.104 Tab
This tab is a new addition for TM View 5.0: it shows the status of the transformer according to the rules published in the IEEE guide C57.104 – 2008. This guide establishes thresholds for different gas levels in the transformer’s oil and defines 4 different conditions according to the gas levels and/or the TDCG Rate of Change. The conditions go from condition 1 (no issue) to condition 4 (severe alarm). The screen shows the current gas levels (as of the last time the monitor was polled) and the condition of the transformer according to the IEEE guide. If the condition is not 1, TM View highlights the columns that cause the condition, as well as the row corresponding to the current condition.
A second grid shows the Doernenburg ratios for the most recent sampling run of this monitor. Doernenburg ratios allow diagnosing 3 possible conditions: thermal faults, low energy discharge (or corona discharge) and high-energy discharge (arcing). These 3 diagnostics are represented by a checkbox which is checked if the condition has been detected due to the Doernenburg ratios. The lower part of the screen shows the rate of change for the TDCG from the monitor. Two rates of change are displayed: a 7-day rate of change (still expressed in ppm/day) and the 30-day rate of change. These are calculated by subtracting the TDCG in ppm at 7-day intervals or at 30-day intervals. This is why the graphs start a little to the right of the left edge of the time range.
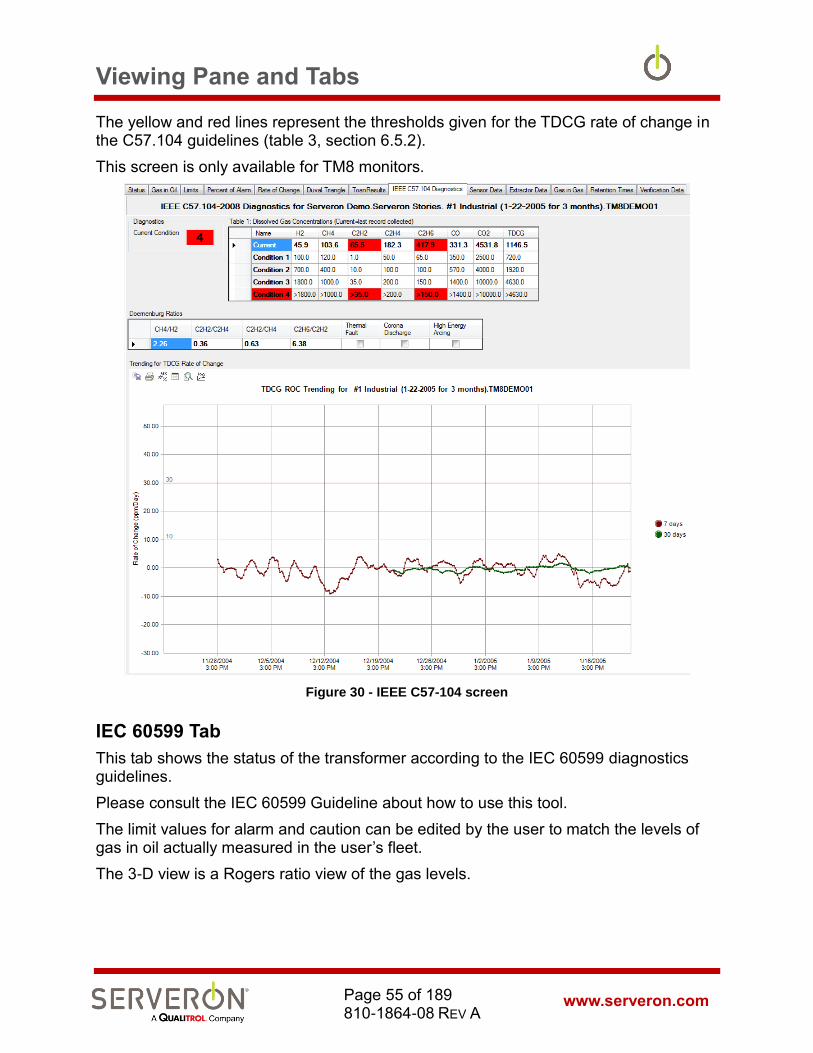
Viewing Pane and Tabs
www.serveron.com Page 55 of 189 810-1864-08 REV A
The yellow and red lines represent the thresholds given for the TDCG rate of change in the C57.104 guidelines (table 3, section 6.5.2).
This screen is only available for TM8 monitors.
Figure 30 - IEEE C57-104 screen
IEC 60599 Tab
This tab shows the status of the transformer according to the IEC 60599 diagnostics guidelines.
Please consult the IEC 60599 Guideline about how to use this tool.
The limit values for alarm and caution can be edited by the user to match the levels of gas in oil actually measured in the user’s fleet.
The 3-D view is a Rogers ratio view of the gas levels.
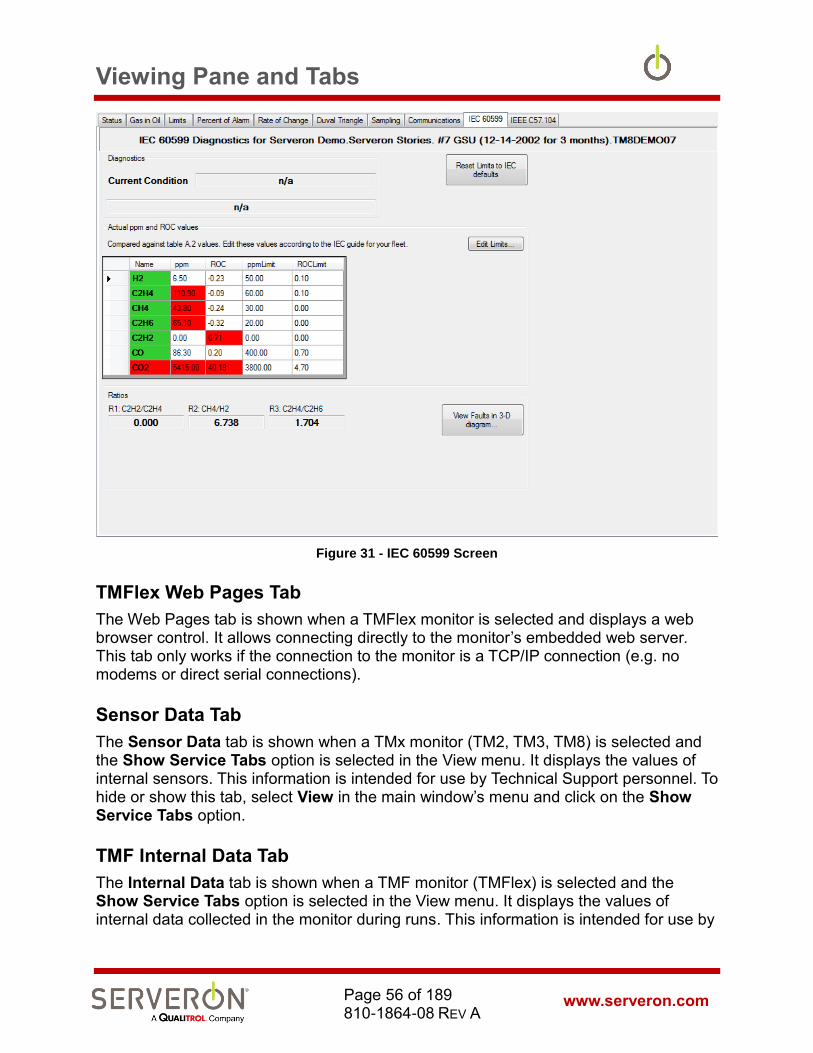
Viewing Pane and Tabs
www.serveron.com Page 56 of 189 810-1864-08 REV A
Figure 31 - IEC 60599 Screen
TMFlex Web Pages Tab
The Web Pages tab is shown when a TMFlex monitor is selected and displays a web browser control. It allows connecting directly to the monitor’s embedded web server. This tab only works if the connection to the monitor is a TCP/IP connection (e.g. no modems or direct serial connections).
Sensor Data Tab
The Sensor Data tab is shown when a TMx monitor (TM2, TM3, TM8) is selected and the Show Service Tabs option is selected in the View menu. It displays the values of internal sensors. This information is intended for use by Technical Support personnel. To hide or show this tab, select View in the main window’s menu and click on the Show Service Tabs option.
TMF Internal Data Tab
The Internal Data tab is shown when a TMF monitor (TMFlex) is selected and the Show Service Tabs option is selected in the View menu. It displays the values of internal data collected in the monitor during runs. This information is intended for use by

Viewing Pane and Tabs
www.serveron.com Page 57 of 189 810-1864-08 REV A
Technical Support personnel. To hide or show this tab, select View in the main window’s menu and click on the Show Service Tabs option.
Extractor Data Tab
The Extractor Data tab is shown when a monitor is selected and the Show Service Tabs option is selected in the View menu. This tab displays the status of internal sensors related to the transformer monitor’s gas extractor subsystem. This information is intended for use by Technical Support personnel. To hide or show this tab, select View in the main window’s menu and click on the Show Service Tabs option.
Gas-in-Gas tab
The Gas-in-Gas tab shows the ppm levels for the gas-in-gas measurements. This is an internal value useful for Serveron technicians attempting to diagnose and troubleshoot monitors. To hide or show this tab, select View in the main window’s menu and click on the Show Service Tabs option.
Retention Time Tab
The Retention Time tab is shown when a monitor is selected and the Show Service Tabs option is selected in the View menu. The tab displays internal information about the status of the chromatography subsystem. This information is intended for use by Technical Support personnel. To hide or show this tab, select View in the main window’s menu and click on the Show Service Tabs option.
Verification Data Tab
The Verification Data tab is shown when a monitor is selected and the Show Service Tabs option is selected in the View menu. It displays the results of all verification runs performed in the selected time interval. Verification runs measure gas levels from reference gas contained in the monitor’s calibration bottle instead of sample gas from the transformer asset being monitored. To hide or show this tab, select View in the main window’s menu and click on the Show Service Tabs option.
Sensor data is not displayed on the Verification Data graph.
Sampling Schedule Tab
The Sampling tab is shown when a monitor icon is selected in the navigation pane and the Administrative tabs are shown. Use this tab to review the monitor’s sampling and verification schedules.
Use the View/Show Administrative Tabs command on the main menu to control whether the administrative tabs are shown.
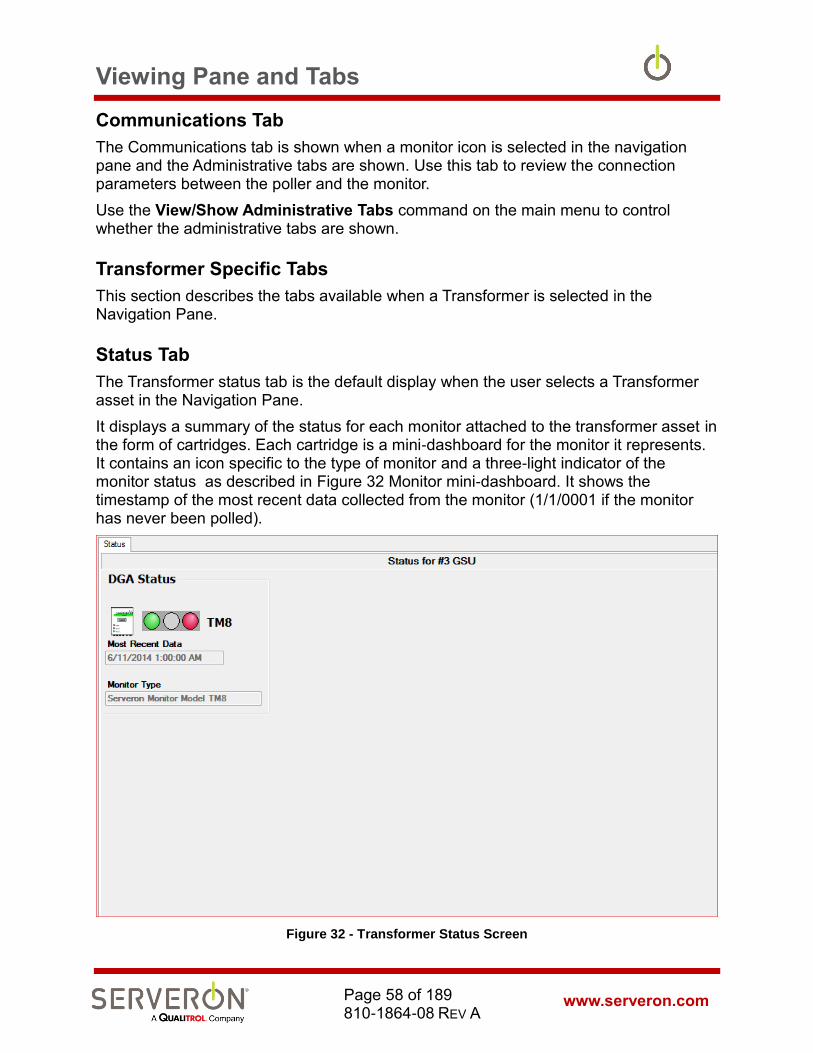
Viewing Pane and Tabs
www.serveron.com Page 58 of 189 810-1864-08 REV A
Communications Tab
The Communications tab is shown when a monitor icon is selected in the navigation pane and the Administrative tabs are shown. Use this tab to review the connection parameters between the poller and the monitor.
Use the View/Show Administrative Tabs command on the main menu to control whether the administrative tabs are shown.
Transformer Specific Tabs
This section describes the tabs available when a Transformer is selected in the Navigation Pane.
Status Tab
The Transformer status tab is the default display when the user selects a Transformer asset in the Navigation Pane.
It displays a summary of the status for each monitor attached to the transformer asset in the form of cartridges. Each cartridge is a mini-dashboard for the monitor it represents. It contains an icon specific to the type of monitor and a three-light indicator of the monitor status as described in Figure 32 Monitor mini-dashboard. It shows the timestamp of the most recent data collected from the monitor (1/1/0001 if the monitor has never been polled).
Figure 32 - Transformer Status Screen

Viewing Pane and Tabs
www.serveron.com Page 59 of 189 810-1864-08 REV A
The screen shows a mini-dashboard giving the status of the monitor.
TOA4 Tab
Substation Specific Tabs
This section describes the tabs that appear when you select a substation icon in the navigation pane.
Status Tab
The Status tab is shown when one of your organization’s substations is selected in the navigation pane. The Status tab displays a dashboard of the substation, showing a quick view of all the transformers in the substation. For all transformers, a mini-dashboard shows the status of all the monitors attached to the transformer.
Monitor Type Data Status (PPM, ROC, other measures)
Service Required (DGA only)
Data Age
Figure 33 - Monitor mini-dashboard
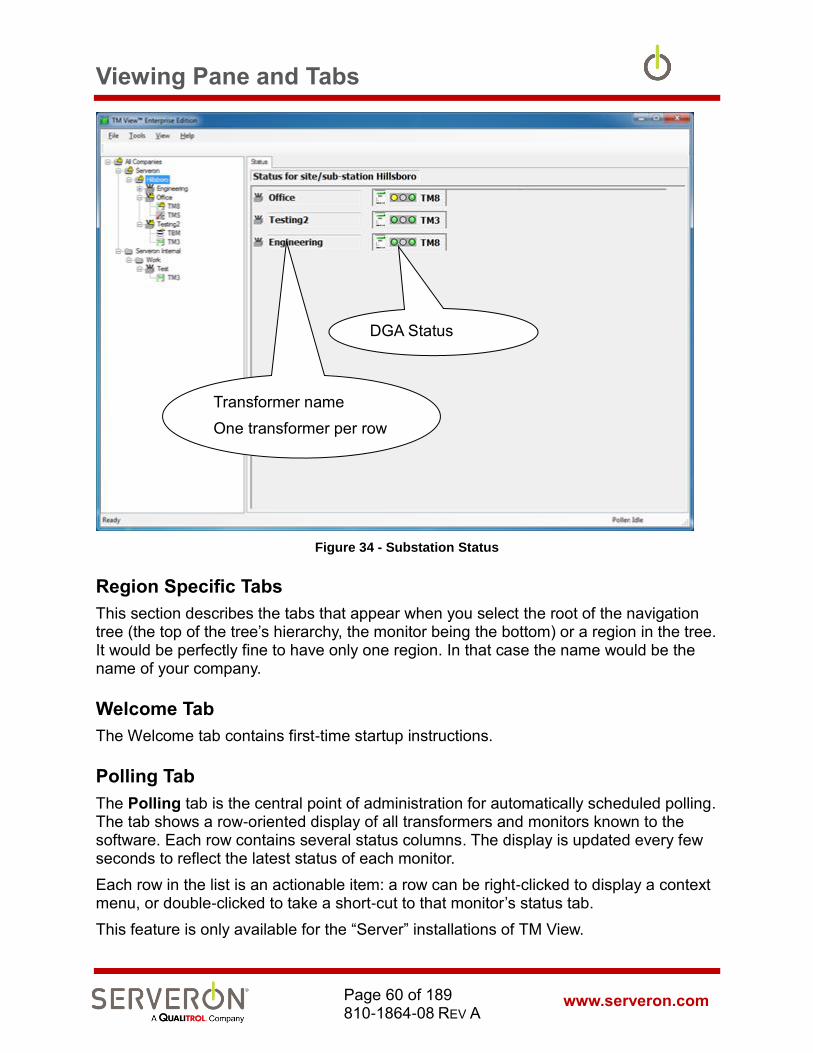
Viewing Pane and Tabs
www.serveron.com Page 60 of 189 810-1864-08 REV A
Figure 34 - Substation Status
Region Specific Tabs
This section describes the tabs that appear when you select the root of the navigation tree (the top of the tree’s hierarchy, the monitor being the bottom) or a region in the tree. It would be perfectly fine to have only one region. In that case the name would be the name of your company.
Welcome Tab
The Welcome tab contains first-time startup instructions.
Polling Tab
The Polling tab is the central point of administration for automatically scheduled polling. The tab shows a row-oriented display of all transformers and monitors known to the software. Each row contains several status columns. The display is updated every few seconds to reflect the latest status of each monitor.
Each row in the list is an actionable item: a row can be right-clicked to display a context menu, or double-clicked to take a short-cut to that monitor’s status tab.
This feature is only available for the “Server” installations of TM View.
DGA Status
Transformer name
One transformer per row
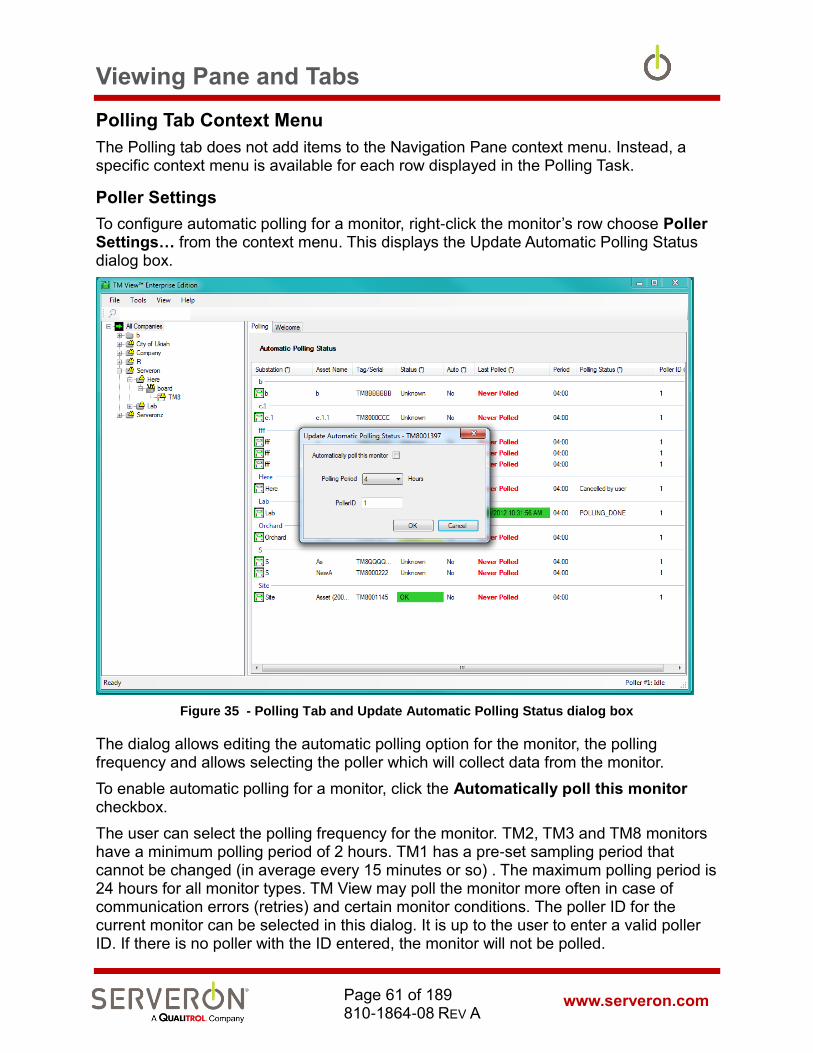
Viewing Pane and Tabs
www.serveron.com Page 61 of 189 810-1864-08 REV A
Polling Tab Context Menu
The Polling tab does not add items to the Navigation Pane context menu. Instead, a specific context menu is available for each row displayed in the Polling Task.
Poller Settings
To configure automatic polling for a monitor, right-click the monitor’s row choose Poller Settings… from the context menu. This displays the Update Automatic Polling Status dialog box.
Figure 35 - Polling Tab and Update Automatic Polling Status dialog box
The dialog allows editing the automatic polling option for the monitor, the polling frequency and allows selecting the poller which will collect data from the monitor.
To enable automatic polling for a monitor, click the Automatically poll this monitor checkbox.
The user can select the polling frequency for the monitor. TM2, TM3 and TM8 monitors have a minimum polling period of 2 hours. TM1 has a pre-set sampling period that cannot be changed (in average every 15 minutes or so) . The maximum polling period is 24 hours for all monitor types. TM View may poll the monitor more often in case of communication errors (retries) and certain monitor conditions. The poller ID for the current monitor can be selected in this dialog. It is up to the user to enter a valid poller ID. If there is no poller with the ID entered, the monitor will not be polled.
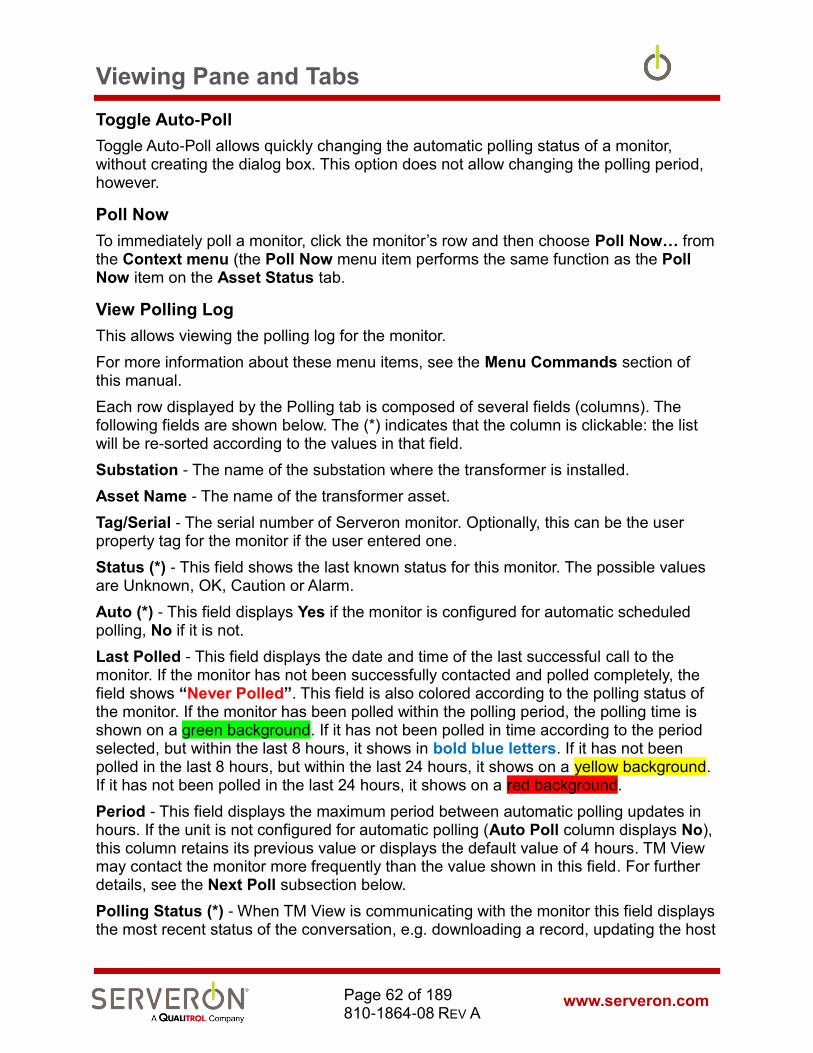
Viewing Pane and Tabs
www.serveron.com Page 62 of 189 810-1864-08 REV A
Toggle Auto-Poll
Toggle Auto-Poll allows quickly changing the automatic polling status of a monitor, without creating the dialog box. This option does not allow changing the polling period, however.
Poll Now
To immediately poll a monitor, click the monitor’s row and then choose Poll Now… from the Context menu (the Poll Now menu item performs the same function as the Poll Now item on the Asset Status tab.
View Polling Log
This allows viewing the polling log for the monitor.
For more information about these menu items, see the Menu Commands section of this manual.
Each row displayed by the Polling tab is composed of several fields (columns). The following fields are shown below. The (*) indicates that the column is clickable: the list will be re-sorted according to the values in that field.
Substation - The name of the substation where the transformer is installed.
Asset Name - The name of the transformer asset.
Tag/Serial - The serial number of Serveron monitor. Optionally, this can be the user property tag for the monitor if the user entered one.
Status (*) - This field shows the last known status for this monitor. The possible values are Unknown, OK, Caution or Alarm.
Auto (*) - This field displays Yes if the monitor is configured for automatic scheduled polling, No if it is not.
Last Polled - This field displays the date and time of the last successful call to the monitor. If the monitor has not been successfully contacted and polled completely, the field shows “Never Polled”. This field is also colored according to the polling status of the monitor. If the monitor has been polled within the polling period, the polling time is shown on a green background. If it has not been polled in time according to the period selected, but within the last 8 hours, it shows in bold blue letters. If it has not been polled in the last 8 hours, but within the last 24 hours, it shows on a yellow background. If it has not been polled in the last 24 hours, it shows on a red background.
Period - This field displays the maximum period between automatic polling updates in hours. If the unit is not configured for automatic polling (Auto Poll column displays No), this column retains its previous value or displays the default value of 4 hours. TM View may contact the monitor more frequently than the value shown in this field. For further details, see the Next Poll subsection below.
Polling Status (*) - When TM View is communicating with the monitor this field displays the most recent status of the conversation, e.g. downloading a record, updating the host

Viewing Pane and Tabs
www.serveron.com Page 63 of 189 810-1864-08 REV A
data file, etc. The last status is displayed within parenthesis after the communication is complete.
Poller ID - The ID number of the poller this monitor is connected.

Menu Commands
www.serveron.com Page 64 of 189 810-1864-08 REV A
Menu Commands This section provides an overview of the menu commands available in TM View.
File Menu
File New Asset…
This menu item displays the New Monitor Creation wizard to begin the creation of a new Asset/Monitor combination. Since each transformer asset and its monitor are represented together, this operation is used to add new assets and monitors to your TM View installation.
This feature is only available for the “Server” installations of TM View.
After the initial screen, the wizard displays the Monitor and Transformer Information page shown in Figure 36. Click on the “Edit Transformer Info…” button to edit the transformer information (shown in Figure 36). The transformer information collected is stored for user convenience and could be used for special transformer analytics.
Figure 36 - Monitor and Asset Information Wizard Page

Menu Commands
www.serveron.com Page 65 of 189 810-1864-08 REV A
Figure 37 - Transformer Information Dialog
After entry of the required information (as marked by a red star), the wizard displays the Connection Type page. This page allows you to select the monitor’s communications type from a range of supported alternatives. When you click the Next button, a communications configuration page specific to the selected communications type is displayed.
The Connection Type screen requires that you know something about the way TM View will connect to each monitor from which you will collect data.

Menu Commands
www.serveron.com Page 66 of 189 810-1864-08 REV A
Figure 38 - Connection Type wizard page
Some options are dependent on other choices on this page and the New Monitor Information page.
• LAN connections (Ethernet) are supported for all types of monitors. Some monitors do not themselves support Ethernet, but can be connected with a LAN/Serial adapter.
• RS-485 connections must use the DNP3 protocol: if you select RS-485, the DNP protocol option will be checked on and disabled, so it becomes mandatory.
• DNP3 protocol is only available on DGA Monitors with a firmware application version later or equal to 3.8.
• The option “Make this monitor OPC visible is only visible when the poller has been configured to be an OPC server. In that case, all monitors selected to be OPC visible will expose their data through an OPC interface. The OPC interface will only show the monitors that were configured at the startup of the poller with that option enabled. Please consult the “TM View OPC User Guide” later in this document for more details about enabling OPC support for TM View. OPC support is a functionality that requires integration with Sub-station Automation Services.

Menu Commands
www.serveron.com Page 67 of 189 810-1864-08 REV A
Note: When adding a new monitor with OPC, TM View will remind you that the poller service needs to be restarted after you have finished.
This should only be done by rebooting the computer. It is the responsibility of the user to restart the computer when new OPC
enabled monitors have been added. If this is not carried out, the OPC functionality of the poller will not work properly and the new
monitors will not be visible on the Poller’s OPC interface.
If you selected LAN communication for example, the configuration page supports entry of a LAN (Ethernet) address. If you selected modem communications, the configuration page supports entry of phone number, communications port and related information.
After configuring communications, clicking the Next button will display a textual summary of the information collected by the wizard. When the Finish button is clicked, the new database entry is created and added to the navigator. It will remain in the navigator even if you exit and restart TM View.
File Open…
This item is used to open an existing TGH data file from older versions of TM View. It presents a standard Open File dialog. After the file is opened successfully, it is added to the navigator. It will remain in the navigator even if you exit and restart TM View if you have a Server installation. If you have a Viewer Only installation, it will remain in the navigator only until you exit TM View. This operation does not change or delete the TGH file.
Note: if OPC support is enabled for this configuration of TM View and the monitor is made OPC visible, you will be reminded to restart the system if you have a Server installation. Changes will not be visible
on OPC until the system is restarted.
File Export…
Selecting this item displays a File Save dialog that allows the export of transformer data. The export file will contain the data for the date range currently selected in the Date Range controls in the application toolbar. This menu is only enabled when a monitor is selected in the navigation tree.
Use this command to make data available to other application programs, e.g. Microsoft Office Excel. Exports may be created at any time. Exporting data does not remove it from the database: the data continues to be displayed by TM View after you export it.
Data may be exported in any of these formats:
- Comma-separated value (.CSV): files in this textual format may be loaded directly by Microsoft Excel and many other applications.

Menu Commands
www.serveron.com Page 68 of 189 810-1864-08 REV A
- TOA4: this textual file format is directly compatible with Transformer Oil Analyst Version 4 (TOA-4) software from Delta-X Research. Users can export data to a file of this format, then use the TOA4/MonitorWatch website to upload the data to this service.
- XML: The data will be exported in a file with an XML format, with schema specific for TM View. The file can be later imported in another instance of TM View.
- TGH: the data will be packaged in TGH files to allow backward compatibility.
File Show Hidden Monitors
This item allows seeing the monitors that the user may have previously hidden. A dialog will appear, showing the list of all the monitors marked as hidden in the database. If there are any items in the list, the user can then select a monitor and choose to ‘UnHide’ it. The monitor will appear again in the navigation tree.
Figure 39 - Show Hidden Monitors Dialog
File Print…
This item allows the contents of the viewing pane to be printed. A standard printer dialog is displayed. You may change print settings defined by your printer, if desired, and then click OK to print the viewing pane contents.
Menu Commands
www.serveron.com Page 69 of 189 810-1864-08 REV A
This item is unavailable (“grayed out”) if there is nothing to print.
File Print Preview
A standard Print Preview dialog is displayed. The contents of the viewing pane may be printed from within the preview using the controls at the top.
This item is unavailable (“grayed out”) if there is nothing to print.
File Exit
This item closes the application.
Tools menu
The following menu items are available in the Tools menu. The Tools menu items are fixed in regard to context: they are shown regardless of what items is selected in the application.
Tools Select Modem
This menu item opens the Select Modem dialog box. The dialog allows you to select the TAPI modem used to communicate with Serveron model TMx monitors as well as other connected monitors. This feature is only available for the “Server” installations of TM View.
The Select Modem dialog box displays a drop-down list containing all properly-configured TAPI modems. If your modem is not displayed in the list, click Configure TAPI Modem to display the Add/Remove Hardware Wizard. Follow the prompts to configure your modem. For more information, see Configuring Modems later in this manual.
Tools Send Program Diagnostics
This menu item causes the application to collect and compress various files and data used by the program in its operations and place the compressed archive in the current user’s Documents folder. The application then opens a new Mail window with some pre-programmed content and a destination of [email protected]. It allows the user to add any specific message, then to manually include the file (the file is NOT automatically included in the file – this must be a conscious decision by the user: TM View will never send information without giving the user a full opportunity to inspect that information first).
Tools Backup Database…
This menu item allows backing up the database used by TM View. The user must provide the complete path and name for the backup file. The backup file will more than likely NOT reside on the computer running the current instance of the Client. The only case where the file will be on the same machine is when TM View and the Database

Menu Commands
www.serveron.com Page 70 of 189 810-1864-08 REV A
Server are installed on the same machine. The default location for a backup (just a filename without a path) is the backup folder of your instance of SQL Server. Otherwise, the path name given must be to a public location (for example, the public\downloads folder) for the backup to succeed.
The command will execute a backup of the database on the Database server. If that server is administered by the user’s IT department, it will have to be obtained from the DB Administrator.
This feature is only available for the “Server” installations of TM View.
Tools Pause Polling
Edit Notification Rules
TM View Standard
TM View Enterprise
Plug-in
TM View Enterprise allows the user to temporarily pause automatic polling.
The pause only lasts up to 4 hours or when the Viewer is closed. This feature is meant to allow the user to work on a particular monitor without being impacted by the automatic polling on other monitors. The “Poll Now” feature is still working to allow manual polling of any monitor
Tools Edit Notification Rules
Edit Notification Rules
TM View Standard
TM View Enterprise
Plug-in
TM View allows the user to manage the rules for Alarms Notifications by the Serveron Extended Poller installed with TM View. This feature is only available for the “Server” installations of TM View.
Please refer to the “Notification User Guide” in Appendix D of this document for more information about this feature.
Tools Edit ODBC Configuration
Edit ODBC Configuration
TM View Standard
TM View Enterprise

Menu Commands
www.serveron.com Page 71 of 189 810-1864-08 REV A
Plug-in
This allows managing the ODBC output of the Serveron Extended Poller installed with TM View. This feature is only available for the “Server” installations of TM View.
Please refer to the “ODBC User Guide” and “ODBC Tutorial” in Appendix B and C for more information about this feature.
Tools Import TM1 from USB Key…
This allows temporarily importing TM1 monitor data in the navigation tree from a USB key. Each monitor’s data is visible in the tabs area, showing a Status screen and a Data Graph screen.
If the TM1 monitors whose data is present on the USB drive have been defined already in TM View (by using the File/New Asset… menu option), the monitor data is merged with the data from that monitor in the database. The monitor will be recognized by its serial number.
If the monitor has never been defined in TM View and the serial number is not recognized, the monitor will appear in the new tree node created by TM View to contain all the unknown TM1 monitors.
When the Tool/Import TM1 menu option is selected, TM View will propose a dialog for the user to select which USB drive to read from.
Figure 40 - Select a USB drive to import TM1 data
TM View will create a new navigation root node named “TM1 Region”, containing a fictitious substation named “TM1 Site”. The substation will contain as many ‘transformers’ as there are monitor folders present on the USB key (minus any that have been recognized as already defined in the asset tree).
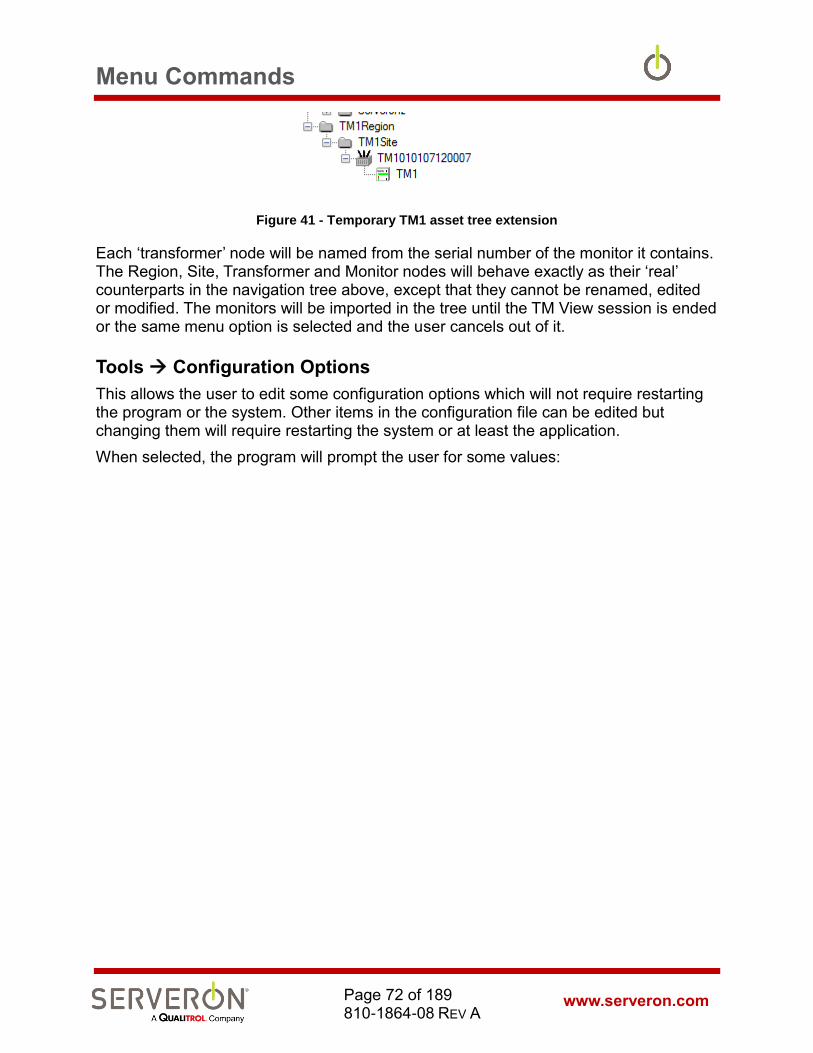
Menu Commands
www.serveron.com Page 72 of 189 810-1864-08 REV A
Figure 41 - Temporary TM1 asset tree extension
Each ‘transformer’ node will be named from the serial number of the monitor it contains. The Region, Site, Transformer and Monitor nodes will behave exactly as their ‘real’ counterparts in the navigation tree above, except that they cannot be renamed, edited or modified. The monitors will be imported in the tree until the TM View session is ended or the same menu option is selected and the user cancels out of it.
Tools Configuration Options
This allows the user to edit some configuration options which will not require restarting the program or the system. Other items in the configuration file can be edited but changing them will require restarting the system or at least the application.
When selected, the program will prompt the user for some values:

Menu Commands
www.serveron.com Page 73 of 189 810-1864-08 REV A
Figure 42 - Configuration Options
The values are used as follows:
• PollingStatusInterval This is relevant only on Server installations of TM View. This is the interval in milliseconds between refreshes for the Polling screen (visible when a region or all regions are selected in the navigation tree).
• PollDetectorPeriod An internal task in the application monitors changes in the database for all monitors being tracked in TM View. When a change occurs, that task will propagate the changes to the relevant parts of the UI displaying status for the corresponding monitor. This parameter is the period in milliseconds between activities
• ConvertAllToLocalTime If true (default), all TMx record times are converted to local time. If false, all TMx record times are left in their normal time zone, which is UTC time.
Menu Commands
www.serveron.com Page 74 of 189 810-1864-08 REV A
• AllowDeleteMonitor This flag, if true, will add to the monitor context menu an option to delete the monitor. If false, users will not see this option.
• DateAgeAlarms This is a string containing two numbers: the first is the number of hours after which a monitor’s data becomes ‘old’: a yellow indicator will be shown in the “Data Age” status for that monitor; the second number is the number of hours after which a monitor’s data becomes ‘very old’ and a red indicator will show in the “Data Age” status for that monitor.
• LowGasAlpha This is the alpha value for the colors of any gas whose concentration is below the minimum detectable level. Increase the value to make the color less transparent.
• DefaultTimeRange This is the default time range shown for every monitor in TM View. It is expressed in days.
• UseDirectModem unused.DefaultCommPort This is the default COM port used by TM View to test modems.
• XXXTimeoutPrompt – XXXTimeoutEcho – XXXTimeoutREsyncFlush – XXXTimeoutResyncRead (where XXX is either empty, PPP, Serial). These are the timeouts for Ethernet connections, PPP connections (modem) and direct serial connections (RS232), respectively. Increase these values if you have problems establishing and maintaining connections to the monitors.
• MailServerName Only relevant for TM View Enterprise and for the Server installation of TM View. It is the name of the mail server used to send email notifications in case of monitor alarms.
• MailSender Only relevant for TM View Enterprise. This is the email alias used to send the email alarm notifications. This can be changed to a valid email user in the customer’s company network.
• MailServerUser and MailServerPassword If required by the mail administrator in the user’s network, this can contain the credentials for a user recognized by the email server.
Context Menus
The remaining menu items in this section are specific to the selection in the navigation pane and the current tab. Example: the Rename Region item appears in the Context menu when you select a Region in the navigation pane and then display the Status tab.

Menu Commands
www.serveron.com Page 75 of 189 810-1864-08 REV A
Depending on which type of item is selected in the Navigation tree, a different context menu is available. The same context menu is displayed regardless of which tab is selected.
[Region Context] Rename Region…
This command displays the Rename Region dialog box which allows the entry of a new name for the currently selected region. When you click OK, one or more files are updated to reflect the change and both the navigation and viewing panes are redrawn.
Note: If OPC support is enabled for this configuration of TM View and the monitor is made OPC visible, you will be prompted to reboot the
system. Changes will not be visible on OPC until the system is restarted.
This feature is only available for the “Server” installations of TM View.
[Region/Root Context] View Polling Log…
This command displays recent activity by the polling/dialing subsystem (“Poller”). For more information about the Poller, see Theory of Operations later in this manual. This feature is only available for the “Server” installations of TM View.
[Substation Context] Rename Substation…
This command displays the Rename Substation dialog box which allows the entry of a new name for the currently selected substation. When you click OK, one or more files are updated to reflect the change and both the navigation and viewing panes are redrawn.
Note: If OPC support is enabled for this configuration of TM View, you will be prompted to reboot the system. Changes will not be
visible on OPC until the system is restarted.
This feature is only available for the “Server” installations of TM View.
[Transformer Context] Edit Transformer Info…
This command allows entering and modifying maintenance information about the transformer. This information is not operational for TM View. TM View only stores it and displays it as entered.
This feature is only available for the “Server” installations of TM View.

Menu Commands
www.serveron.com Page 76 of 189 810-1864-08 REV A
[Monitor Context] Export Data…
Selecting this item displays a File Save dialog that allows the export of transformer data. The export file will contain the data for the date range currently selected in the End Date and Range controls in the application toolbar. This command is identical to File Export.
This feature is only available for the “Server” installations of TM View.
[Monitor Context] Hide Monitor
Selecting this item will hide this monitor from the navigation tree and close any tabs associated with it. The data from that monitor becomes invisible. The data is still stored in the database, but it is ignored by TM View. To view it again, use the File/View Hidden Monitors command.
This feature is only available for the “Server” installations of TM View.
[Monitor Context] Edit Monitor Info
This brings up a modal dialog which allows editing some of the monitor’s parameters. In particular:
- serial number
- monitor asset tag (which is another name for the monitor if the customer uses special asset tracking names)
- Comment text: an area where the user can enter text notes about any subject. The intention here is to allow entering maintenance or other type of information relevant to the users.

Menu Commands
www.serveron.com Page 77 of 189 810-1864-08 REV A
Figure 43 - Edit Monitor Info
Note: For Serveron DGA monitors, the monitor type will be determined again when the monitor is polled and it will pre-empt any option selected on this dialog. This feature is only available for the
“Server” installations of TM View.
[Monitor Context] Poll Now
Causes TM View to connect to the selected asset’s transformer monitor and download all data. The connection attempt uses the current communications settings, which are displayed on the Communications tab when the monitor icon is selected. This feature is only available for the “Server” installations of TM View.
[Monitor Context] Set Monitor Date and Time
This command sets the transformer monitor’s internal date and time to match the local computer. If the monitor is a Serveron model TM32, TM3 or TM8, the time is converted to Coordinated Universal Time (UTC) before being sent to the monitor. This feature is only available for the “Server” installations of TM View.
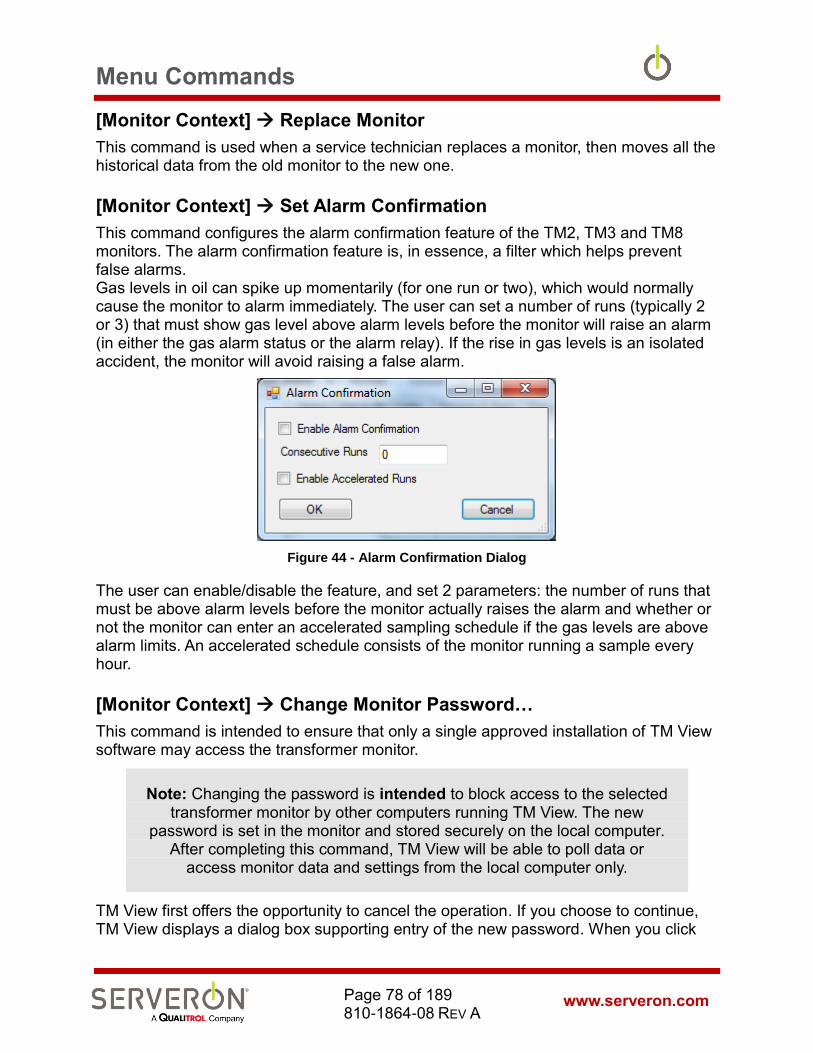
Menu Commands
www.serveron.com Page 78 of 189 810-1864-08 REV A
[Monitor Context] Replace Monitor
This command is used when a service technician replaces a monitor, then moves all the historical data from the old monitor to the new one.
[Monitor Context] Set Alarm Confirmation
This command configures the alarm confirmation feature of the TM2, TM3 and TM8 monitors. The alarm confirmation feature is, in essence, a filter which helps prevent false alarms. Gas levels in oil can spike up momentarily (for one run or two), which would normally cause the monitor to alarm immediately. The user can set a number of runs (typically 2 or 3) that must show gas level above alarm levels before the monitor will raise an alarm (in either the gas alarm status or the alarm relay). If the rise in gas levels is an isolated accident, the monitor will avoid raising a false alarm.
Figure 44 - Alarm Confirmation Dialog
The user can enable/disable the feature, and set 2 parameters: the number of runs that must be above alarm levels before the monitor actually raises the alarm and whether or not the monitor can enter an accelerated sampling schedule if the gas levels are above alarm limits. An accelerated schedule consists of the monitor running a sample every hour.
[Monitor Context] Change Monitor Password…
This command is intended to ensure that only a single approved installation of TM View software may access the transformer monitor.
Note: Changing the password is intended to block access to the selected transformer monitor by other computers running TM View. The new
password is set in the monitor and stored securely on the local computer. After completing this command, TM View will be able to poll data or
access monitor data and settings from the local computer only.
TM View first offers the opportunity to cancel the operation. If you choose to continue, TM View displays a dialog box supporting entry of the new password. When you click

Menu Commands
www.serveron.com Page 79 of 189 810-1864-08 REV A
OK on this dialog box, TM View securely stores the password in the host computer. TM View then displays the Poller Activity dialog and sets the new password in the monitor.
This feature is only available for the “Server” installations of TM View.
[Monitor Context] Enter Manual DGA…(not for TM1)
Displays the Enter DGA Data dialog box, which supports entry of DGA data for display on the Gas in Oil graph. Enter the values from your manual DGA into the cells of the empty row and adjust the date as appropriate. If you need to add additional rows, click the Add Row button to add a new empty row. When you are satisfied, click OK to save your entries.
If you discover an error in a DGA entry, use the dialog box to change the value displayed in the cell and then click OK. To delete a manual DGA, open the dialog box. Click the area to the left of the date and time to highlight the entire row, click the Delete button and then click OK to update the file and graph.
This feature is only available for the “Server” installations of TM View.
[Monitor Context] Import Manual Data from CSV File…(not for TM1)
Displays a File Open dialog, prompting the user to navigate to the CSV file to be imported. The file must match the standard for imported file for TOA4, as described in this document:
http://www.deltaxresearch.com/docs/toa4_data_file_req.pdf,
with some restrictions outlined below. A short version of the format requirements is that the file must be a text file in ANSI format, must begin with a header line (see header requirements below) and that the values must be separated with a comma (‘,’). The decimal separation character is a period (‘.’). The floating point values are in US-English format.
- TM View will import all data found in the file for the transformer/monitor currently selected. The file must contain only data for the same transformer as the one selected.
- TM View looks for a column with the header “sampledate” and the columns with headers carrying the names of gases of interest to TM8 and TM3: H2, O2, CH4, CO, CO2, N2, C2H6, C2H4 and C2H2. The string comparison is not case-sensitive. The import operation will succeed only when there is a “sampledate” column and at least one column with a relevant gas name.
The data imported from a CSV file will be shown as ‘Manual DGA’ data. A CSV import is a convenient way to manually enter many DGA data points at once.
This feature is only available for the “Server” installations of TM View.

Menu Commands
www.serveron.com Page 80 of 189 810-1864-08 REV A
[Monitor Context] Start Sampling Run (not for TM1)
After confirming your choice, this command causes the transformer monitor to immediately start a sampling run. Since sampling runs are scheduled automatically by the monitor, use of this command is rarely required.
This feature is only available for the “Server” installations of TM View.
Note: To adjust the monitor’s sampling schedule, click the monitor icon in the navigation pane, then click the Sampling tab and then click Edit Sampling Schedule… in the Context menu. TM View displays the Update Sample Schedule dialog box. When you click OK, TM View immediately contacts the monitor and updates the schedule you have
defined.
[Monitor Context] Update Limits
Displays the Update Limits dialog box, which supports changes to the gas-in-oil caution and alarm limit values. For Serveron model TM2, TM3 and TM8 monitors, the dialog supports both level and rate of change alarms.
When the OK button is clicked, TM View immediately contacts the monitor to update the limit values.
This feature is only available for the “Server” installations of TM View.
[Monitor Context] Start Verification Run (not for TM1)
After confirming your choice, this command causes the transformer monitor to immediately start a verification run. Since verification runs are scheduled automatically by the monitor, use of this command is rarely required.
This feature is only available for the “Server” installations of TM View.
Note: To adjust the monitor’s verification schedule, click the monitor icon in the navigation pane, then click the Sampling tab and finally click Edit
Sampling Schedule… in the Context menu. TM View displays the Update Sample Schedule dialog box. When you click OK, TM View immediately contacts the monitor and updates the schedule you have
defined.
[Monitor Context] Start Calibration Run (not for TM1)
After confirming your choice, this command causes the transformer monitor to immediately start a calibration run. A calibration run takes about 45 minutes to complete.
This feature is only available for the “Server” installations of TM View.
Menu Commands
www.serveron.com Page 81 of 189 810-1864-08 REV A
Note: Serveron monitors contain an auto-calibration feature. Manual calibration runs should only be performed when advised by Technical
Support personnel.
[Monitor Context] Sample Hourly (not for TM1)
Causes TM View to connect to the transformer monitor and establish a temporary sampling schedule within the monitor. The temporary schedule continues for 24 hours and specifies that sample runs should be performed once per hour.
After the 24-hour period elapses, the monitor reverts to the schedule that was in effect when the Sample Hourly command was given. If you wish to continue hourly sampling, you may issue the command again to enable hourly sampling for another 24-hour period.
The Sample Hourly command is intended to allow you to temporarily accelerate sampling when additional online DGA data is critical, e.g. when a transformer is experiencing a gassing event or other unusual condition.
Note: By increasing the number of sample runs, this command increases the monitor’s consumption of helium carrier gas. Excessive use of this
command may require replacement of the helium cylinder more frequently than stated in the Serveron Transformer Monitor product documentation.
The Sample Hourly command also interacts with the automatic scheduled polling feature of TM View. If the monitor that is sampling hourly is also configured for automatically scheduled polling, the Poller component of TM View will begin polling it at an accelerated rate (hourly) in order to make the data available to you.
Under certain conditions, the Serveron transformer monitor may begin sampling at an accelerated (hourly) rate without any input from you. This form of accelerated sampling occurs when a previously configured Rate of Change (ROC) gas alarm limit is violated within the monitor. ROC accelerated sampling will not occur unless you configure Rate of Change alarm limits. If this form of accelerated sampling does occur at your installation, the Poller component of TM View will notice after several hours and begin polling at an accelerated rate in order to make the data available to you.
A monitor that is performing hourly samples due to an ROC alarm will cease performing accelerated runs and return to its previous schedule approximately 24 hours after the ROC alarm condition is cleared. If ROC does not return to normal on its own, you can clear the condition by increasing the ROC alarm limit value or disabling the alarm for that gas.
Menu Commands
www.serveron.com Page 82 of 189 810-1864-08 REV A
[Monitor Context] Check Communications
This command allows you to check communications by performing a lightweight poll of the monitor without switching tabs. The Poller Activity dialog is displayed just as with Poll Now. Unlike the Poll Now operation, TM View will not attempt to download data from the monitor. Instead, it will update control information (alarm levels, sampling schedule, etc) and then terminate the connection. After communication is complete (or fails), a message box displays the outcome of the test.
This feature is only available for the “Server” installations of TM View.
[Monitor Context] Edit Communications
This command displays the Update Communications Wizard, allowing all communication settings for the selected transformer monitor to be reviewed and optionally updated.
For more information about the Update Communications Wizard, see Configuring Communications later in this document.
This feature is only available for the “Server” installations of TM View.
View Menu
View Refresh (F5)
This command updates the Navigator and all tabs with the latest data.
View Auto Refresh
Enables or disables the automatic refresh feature. If the menu item is checked, TM View will automatically refresh the display with the latest data approximately once per minute. Each automatic refresh is equivalent to manually selecting View Refresh or pressing F5.
If the menu item is not checked, automatic refresh will not occur.
View Show Service Tabs
Enables or disables viewing the service tabs for DGA monitors. The Service tabs are:
- Sensor Data: internal sensors for the Serveron TM Series monitors
- Extractor Data: measurements from the gas extractor in the Serveron TM Series monitors.
- Retention Times: Retention times for Serveron TM Series monitors.
- Verification Data: Verification data for TM Series monitors.
Menu Commands
www.serveron.com Page 83 of 189 810-1864-08 REV A
View Show Administrative Tabs
Enables or disables viewing the administrative tabs for all monitors. The administrative tabs are:
- Sampling Schedule: for Serveron TM Series DGA monitors only. Shows the data sampling schedule of the monitor.
- Communications: for all monitors. Allows reviewing the connection parameters for a monitor.
Help Menu
Help Documentation
This opens a File Open dialog allowing you to open several documents. The default folder that displays for this dialog is in the language your computer is set to use.
This folder contains the TM View Software User’s Manual (this document) in PDF format, a document of Frequently Asked Questions (FAQ), a Readme, and the Release Notes for this version of TM View.
Help About TM View
This item displays the About Box, which shows the detailed version number of TM View and a link to Serveron website.
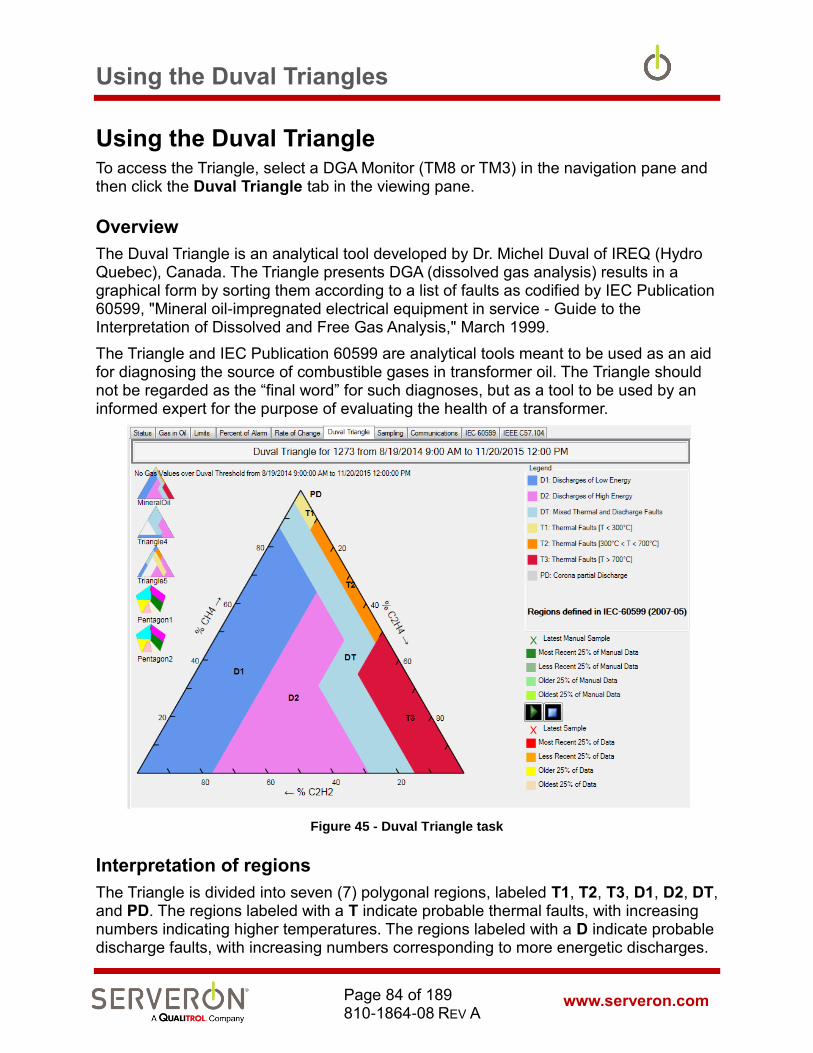
Using the Duval Triangles
www.serveron.com Page 84 of 189 810-1864-08 REV A
Using the Duval Triangle To access the Triangle, select a DGA Monitor (TM8 or TM3) in the navigation pane and then click the Duval Triangle tab in the viewing pane.
Overview
The Duval Triangle is an analytical tool developed by Dr. Michel Duval of IREQ (Hydro Quebec), Canada. The Triangle presents DGA (dissolved gas analysis) results in a graphical form by sorting them according to a list of faults as codified by IEC Publication 60599, "Mineral oil-impregnated electrical equipment in service - Guide to the Interpretation of Dissolved and Free Gas Analysis," March 1999.
The Triangle and IEC Publication 60599 are analytical tools meant to be used as an aid for diagnosing the source of combustible gases in transformer oil. The Triangle should not be regarded as the “final word” for such diagnoses, but as a tool to be used by an informed expert for the purpose of evaluating the health of a transformer.
Figure 45 - Duval Triangle task
Interpretation of regions
The Triangle is divided into seven (7) polygonal regions, labeled T1, T2, T3, D1, D2, DT, and PD. The regions labeled with a T indicate probable thermal faults, with increasing numbers indicating higher temperatures. The regions labeled with a D indicate probable discharge faults, with increasing numbers corresponding to more energetic discharges.
Using the Duval Triangles
www.serveron.com Page 85 of 189 810-1864-08 REV A
The region labeled DT indicates a probable mixture of thermal and discharge faults. Finally, the small region at the apex labeled PD indicates a probable partial discharge (also known as corona) condition.
Specifically, each region is to be interpreted as specified in IEC Publication 60599:
T1 - Thermal faults not exceeding 300°C
T2 - Thermal faults exceeding 300°C but not exceeding 700°C
T3 - Thermal faults exceeding 700°C
D1 - Discharges of low energy
D2 - Discharges of high energy
PD - Partial Discharges
The DT region indicates a probable combination of thermal and discharge faults. It is not discussed in IEC 60599.
Interpretation of the Triangle
Each of the Triangle's three sides forms an axis with a range of 0 to 100%. The Triangle's base is the acetylene (C2H2) axis. The left side is the methane (CH4) axis. The right side is the ethylene (C2H4) axis.
Use of the Triangle begins with a dissolved gas measurement (such as one obtained every few hours from the Serveron on-line transformer monitor) that includes acetylene, methane and ethylene values. The values of the three gases are then normalized to total 100%.
Example: A DGA result might show acetylene at 20 parts per million (PPM), methane at 40 PPM, and ethylene at 40 PPM. The normalized values for these three gases at these concentrations are 20% acetylene, 40% methane and 40% ethylene.
A single data point is plotted at the intersection of the three normalized values by drawing lines across the triangle from each of the appropriate normalized values on the axes. These lines are always drawn parallel to some axis of the graphic, as indicated by the dotted white lines. In order to plot meaningful values, only measurements of methane of at least 28 PPM, Ethylene of at least 26 PPM and Acetylene of at least 1 PPM are plotted on the Triangle.
Multiple data points
The advent of on-line DGA data provided by the Serveron transformer monitor provides new opportunities for use of the Triangle. In particular, the wealth of data provided by the Serveron monitor can be used to quickly assess the health of a transformer by viewing values in the Triangle over a specific range of dates, allowing one to correlate specific fault conditions with transformer loading or extraneous events.
The End Date and Range controls in the application tool bar determine the range of interest for plotting points on the Duval Triangle. The Duval Triangle displays all

Using the Duval Triangles
www.serveron.com Page 86 of 189 810-1864-08 REV A
meaningful samples shown on the corresponding Trend Graph. The relative age of DGA samples are indicated using pale yellow for the oldest to bright yellow, pale orange and bright orange for the most recent samples. The latest sample plotted in the Triangle is distinguished using an X marker contained in a circle. In addition, dotted lines normal to the three graph axes are shown on the graph for the most recent data point only.
Manually Entered DGA data
If the user has entered DGA data manually for this monitor (see Context menu of the Gas in Oil tab), the manual data points are shown in the color specified in the legend on the right of the triangle image.
Special Features
The Duval Triangle implemented in TM View offers several special features: pop-up details and replay and new advanced triangles used to further refine the diagnostics for certain faults in the PD, T1, T2 and T3 regions.
Pop-up Details is a feature that pops up a small window when the mouse hovers over a data point. The window lists the gas levels for that particular point. The window disappears when the mouse leaves the area of the point.
Replay allows the user to replay the time sequence of all the data points represented on the graph, at about 2 to 4 points per second. The date and time at which the sample run was executed for each point is displayed as the sequence is played. The replay can be paused or stopped – if it is stopped, all the points will be displayed. The replay’s pause, start and stop buttons are on the right side of the triangle, about 2/3 of the way down.
Duval Triangle 4 (for low-temperature faults) and Triangle 5 (for medium and high-temperature faults) are accessible by clicking in either the PD/T1 regions or the T2/T3 regions.
In theory, Triangle 4 should be used to refine the diagnostic for low-temperature faults in PD, T1 or T2 and Triangle 5 to refine diagnostics of medium and high-temperature faults in T2 and T3. In TM View, the use of Triangle 4 is accessed by clicking on the PD or T1 region of the normal Duval Triangle and Triangle 5 is accessed by clicking on the T2 or T3 region of the normal triangle. Clicking anywhere on either Triangle 4 or Triangle 5 returns the display to the normal Duval Triangle.
Use of Triangles 4 and 5
As quoted from Michel Duval (July 2011):
- Triangle 4 is used to provide more information about low temperature faults (corona PDs, T1 or T2)
- Triangle 4 should be used only for faults identified first with Triangle 1 as faults PD, T1 or T2, or when there is a high level of H2.

Using the Duval Triangles
www.serveron.com Page 87 of 189 810-1864-08 REV A
- Triangle 5 is used to provide more information about medium to high-temperature faults (T2 and T3).
- Triangle 5 should be used only for faults identified first as thermal faults T1, T2 or T3.
- Both Triangles 4 and 5 are used to determine if the fault involves carbonization of paper or simply stray gassing of oil.
- Sometimes Triangle 4 and 5 do not agree, either because there is a mixture of faults or because of laboratory inaccuracies on some gases (use of DGA monitor eliminates this last cause of conflict).
- Neither Triangle 4 nor Triangle 5 should be used in the case of electrical faults D1 (including sparking PDs) or D2.
Figure 46 below shows a normal Duval Triangle (Triangle 1) with faults in T3. A tooltip appears when the mouse hovers over T2 or T3, indicating that Triangle 5 is available.
Note: Triangle 1 uses CH4, C2H4 and C2H2.
Figure 47 shows the Triangle 5 corresponding to the same date, indicating hot spots in oil very close to the C region (hot spots on paper).
Note: Triangle 5 uses CH4, C2H4 and C2H6.
Figure 48 shows the Triangle 4 for the same data, indicating a possible carbonization of paper.
Note: Triangle 4 uses H2, CH4 and C2H6.
In this case, a combination of these three displays would indicate a probability of hot spots in paper and oil, with possible carbonization of paper.
Note: Due to the mix of gases used for Triangles 4 and 5, this new diagnostic tool is only available for TM8 monitors.
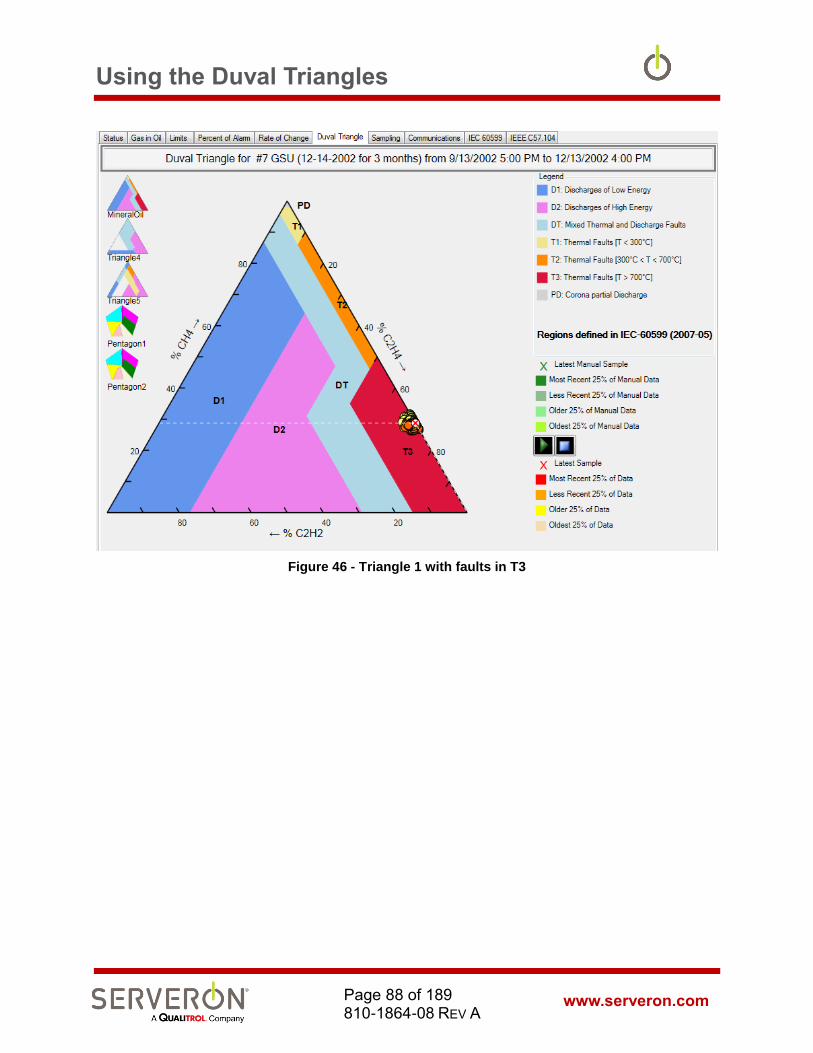
Using the Duval Triangles
www.serveron.com Page 88 of 189 810-1864-08 REV A
Figure 46 - Triangle 1 with faults in T3

Using the Duval Triangles
www.serveron.com Page 89 of 189 810-1864-08 REV A
Figure 47 - Triangle 5 for medium and high-temperature faults
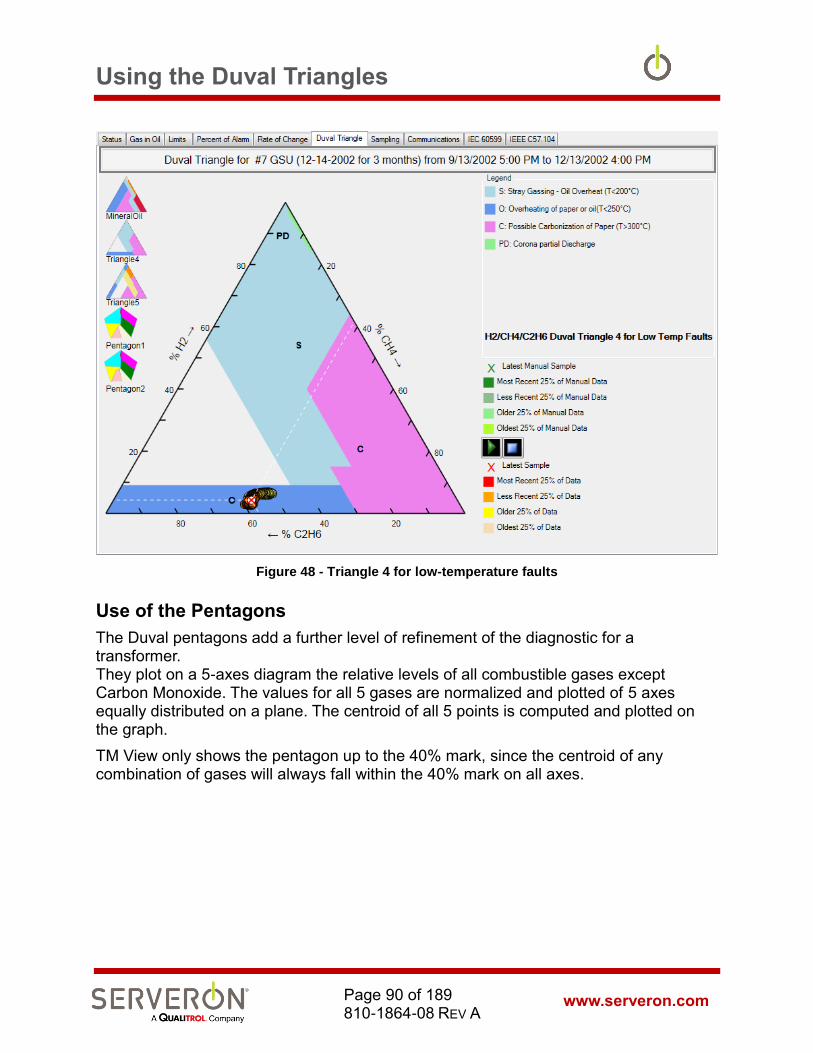
Using the Duval Triangles
www.serveron.com Page 90 of 189 810-1864-08 REV A
Figure 48 - Triangle 4 for low-temperature faults
Use of the Pentagons
The Duval pentagons add a further level of refinement of the diagnostic for a transformer. They plot on a 5-axes diagram the relative levels of all combustible gases except Carbon Monoxide. The values for all 5 gases are normalized and plotted of 5 axes equally distributed on a plane. The centroid of all 5 points is computed and plotted on the graph.
TM View only shows the pentagon up to the 40% mark, since the centroid of any combination of gases will always fall within the 40% mark on all axes.

Using the Duval Triangles
www.serveron.com Page 91 of 189 810-1864-08 REV A
Figure 49 - Duval Pentagon 1
Pentagon 2 is looking at the same data but with different zones of interest, focusing more on high-energy faults.
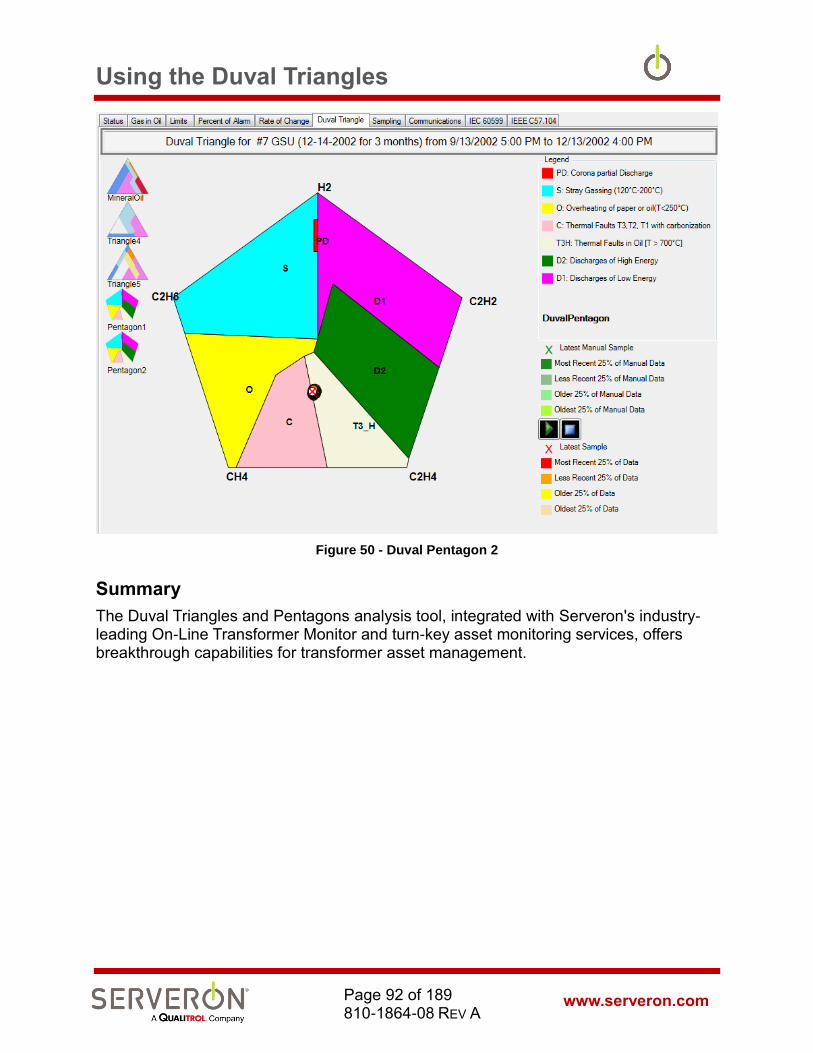
Using the Duval Triangles
www.serveron.com Page 92 of 189 810-1864-08 REV A
Figure 50 - Duval Pentagon 2
Summary
The Duval Triangles and Pentagons analysis tool, integrated with Serveron's industry-leading On-Line Transformer Monitor and turn-key asset monitoring services, offers breakthrough capabilities for transformer asset management.
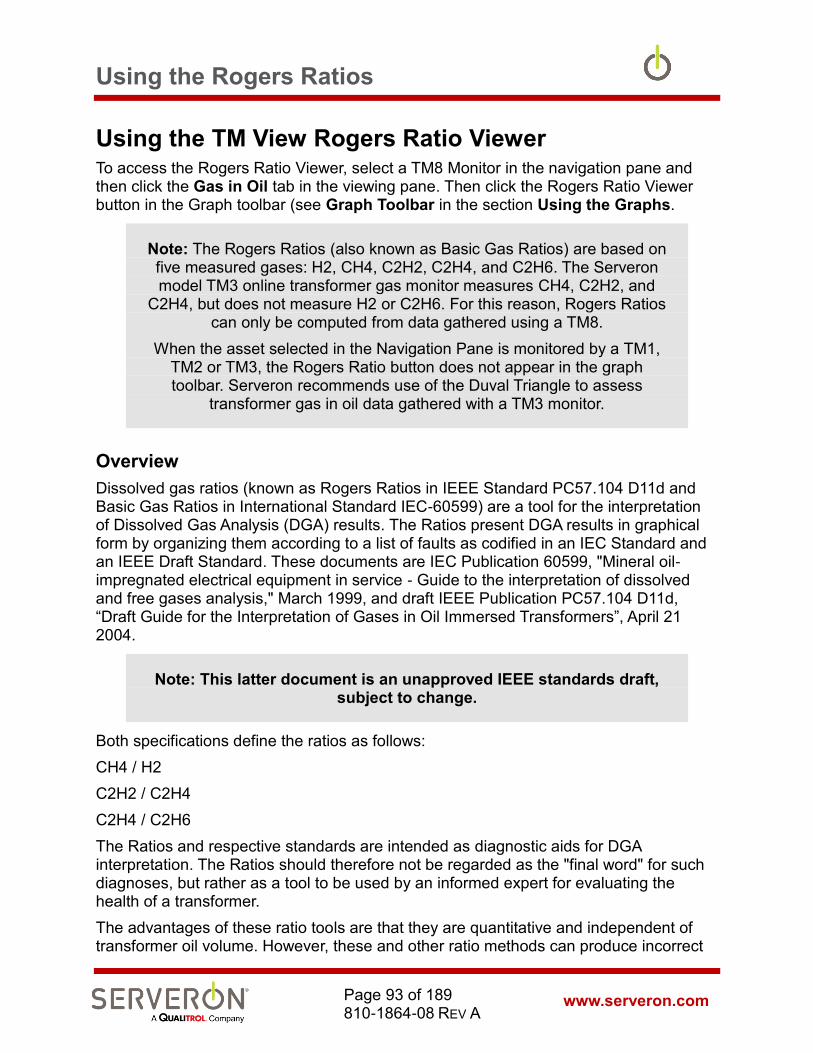
Using the Rogers Ratios
www.serveron.com Page 93 of 189 810-1864-08 REV A
Using the TM View Rogers Ratio Viewer To access the Rogers Ratio Viewer, select a TM8 Monitor in the navigation pane and then click the Gas in Oil tab in the viewing pane. Then click the Rogers Ratio Viewer button in the Graph toolbar (see Graph Toolbar in the section Using the Graphs.
Note: The Rogers Ratios (also known as Basic Gas Ratios) are based on five measured gases: H2, CH4, C2H2, C2H4, and C2H6. The Serveron model TM3 online transformer gas monitor measures CH4, C2H2, and
C2H4, but does not measure H2 or C2H6. For this reason, Rogers Ratios can only be computed from data gathered using a TM8.
When the asset selected in the Navigation Pane is monitored by a TM1, TM2 or TM3, the Rogers Ratio button does not appear in the graph toolbar. Serveron recommends use of the Duval Triangle to assess
transformer gas in oil data gathered with a TM3 monitor.
Overview
Dissolved gas ratios (known as Rogers Ratios in IEEE Standard PC57.104 D11d and Basic Gas Ratios in International Standard IEC-60599) are a tool for the interpretation of Dissolved Gas Analysis (DGA) results. The Ratios present DGA results in graphical form by organizing them according to a list of faults as codified in an IEC Standard and an IEEE Draft Standard. These documents are IEC Publication 60599, "Mineral oil-impregnated electrical equipment in service - Guide to the interpretation of dissolved and free gases analysis," March 1999, and draft IEEE Publication PC57.104 D11d, “Draft Guide for the Interpretation of Gases in Oil Immersed Transformers”, April 21 2004.
Note: This latter document is an unapproved IEEE standards draft, subject to change.
Both specifications define the ratios as follows:
CH4 / H2
C2H2 / C2H4
C2H4 / C2H6
The Ratios and respective standards are intended as diagnostic aids for DGA interpretation. The Ratios should therefore not be regarded as the "final word" for such diagnoses, but rather as a tool to be used by an informed expert for evaluating the health of a transformer.
The advantages of these ratio tools are that they are quantitative and independent of transformer oil volume. However, these and other ratio methods can produce incorrect

Using the Rogers Ratios
www.serveron.com Page 94 of 189 810-1864-08 REV A
interpretations or none at all. Therefore, they should be used in conjunction with other diagnostic tools such as the Duval Triangle. The value of on-line monitoring is that these diagnostic tools can be utilized over time to enable a comprehensive condition-based asset management program.
The TM View Rogers Ratio Viewer is shown in Figure 51.
Figure 51 Rogers Ratio Viewer
The advent of on-line DGA data provided by the Serveron On-Line Transformer Monitor provides new opportunities for use of the Ratios. In particular, the wealth of data provided by the On-Line Transformer Monitor can be used to quickly assess the health of a transformer by viewing ratio values over a specific range of dates, allowing one to correlate specific fault conditions with transformer loading or extraneous events.
Selecting an End Date and Range for the Trend Graph determines the range of interest for plotting points in the Ratio Viewer. The Ratio Viewer displays all meaningful samples shown on the corresponding Trend Graph. The relative age of DGA samples are indicated using pale yellow for the oldest to bright yellow, pale orange and bright orange for the most recent samples. The latest sample plotted in the Viewer is distinguished using a solid red color. In addition, dotted lines normal to the three graph axes are shown on the graph for the most recent data point only.
Interpretation of Regions
The Viewer displays ratios in a three-dimensional volume containing several rectangular solid regions, labeled T1, T2, T3, D1, D2, PD and OK. Note that the region labeled PD appears only in the IEC-60599 ratio definitions while the region labeled OK appears only in the IEEE PC57.104 D11d ratio definitions.

Using the Rogers Ratios
www.serveron.com Page 95 of 189 810-1864-08 REV A
The regions labeled with a T indicate probable thermal faults, with increasing numbers indicating higher temperatures. The regions labeled with a D indicate probable discharge faults, with increasing numbers corresponding to discharges that are more energetic. The region labeled PD indicates a probable partial discharge (also known as corona) condition, while the region labeled OK indicates a presumed absence of faults.
The IEEE PC57.104 D11d and IEC-60599 specifications generally agree on the following detailed region definitions:
OK - Normal Unit
IEEE PC57.104 D11d names this region Case 0. IEC-60599 does not define this region.
PD - Partial Discharges
IEC-60599 defines this region, while IEEE PC57.104 does not.
D1 - Discharges of low energy
This region is named Case 1 in IEEE PC57.104 D11d.
D2 - Discharges of high energy
This region is named Case 2 in IEEE PC57.104 D11d. The extent of this region differs slightly between the IEC-60599 and IEEE PC57.104 D11d definitions.
T1 - Low temperature thermal faults not exceeding 300°C
This region is named Case 3 in IEEE PC57.104 D11d.
T2 - Thermal faults exceeding 300°C but not exceeding 700°C
This region is named Case 4 in IEEE PC57.104 D11d.
T3 - Thermal faults exceeding 700°C
This region is named Case 5 in IEEE PC57.104 D11d.
Interpreting the Graphical View
Each of the Viewer’s three axes is logarithmic with conceptually unlimited range. The "front" axis shows an increasing ratio of Methane (CH4) to Hydrogen (H2), referred to as R1 in the text below. The "up" axis shows an increasing ratio of Acetylene (C2H2) to Ethylene (C2H4), referred to as R2. The "right" axis shows an increasing ratio of Ethylene (C2H4) to Ethane (C2H6), referred to as R3.
Use of the Viewer begins with a dissolved gas measurement (such as one obtained every few hours from the Serveron On-Line Transformer Monitor) that includes non-zero ethylene, ethane and hydrogen values expressed in Parts per Million (PPM). The three ratios are then computed. The resulting values determine the location of a point in 3D-space for display by the Viewer.
Mathematically speaking, a ratio value is not defined if its denominator is zero. Therefore, a sample containing a hydrogen (H2) value of 0.0 PPM causes R1 to be

Using the Rogers Ratios
www.serveron.com Page 96 of 189 810-1864-08 REV A
undefined. Likewise, a sample with an ethylene (C2H4) value of 0.0 PPM causes R2 to be undefined and an ethane (C2H6) value of 0.0 PPM causes R3 to be undefined.
When one or more of the ratios is undefined, the three values R1, R2 and R3 do not determine a point in 3D-space and the Viewer cannot plot the sample. The Viewer displays a count of samples that could not be plotted in the upper-left corner of the display window. The count is labeled Zero Denominator.
As noted above, each axis has conceptually unlimited range. The Viewer is capable of displaying ratio values between 0.01 and 100.0. If a value of R1, R2 or R3 lies outside the range from 0.01 to 100.0, an out-of-range marker is displayed. The marker appears as a small ring with an arrow through it.
The graphical view can be rotated, zoomed and panned using the arrow keys, shift-arrow keys and control-arrow keys, respectively. The display can be cleared and the points re-plotted in time sequence by pressing the Backspace key. For more information, press F1 while the Viewer is active to raise the Help window. In the Help window, press Show Key Help... to display the complete command list for the Viewer.
Summary
The Rogers Ratio Viewer analysis tool, integrated with Serveron's industry-leading On-Line Transformer Monitor and turn-key asset monitoring services, offers breakthrough capabilities for transformer asset management.
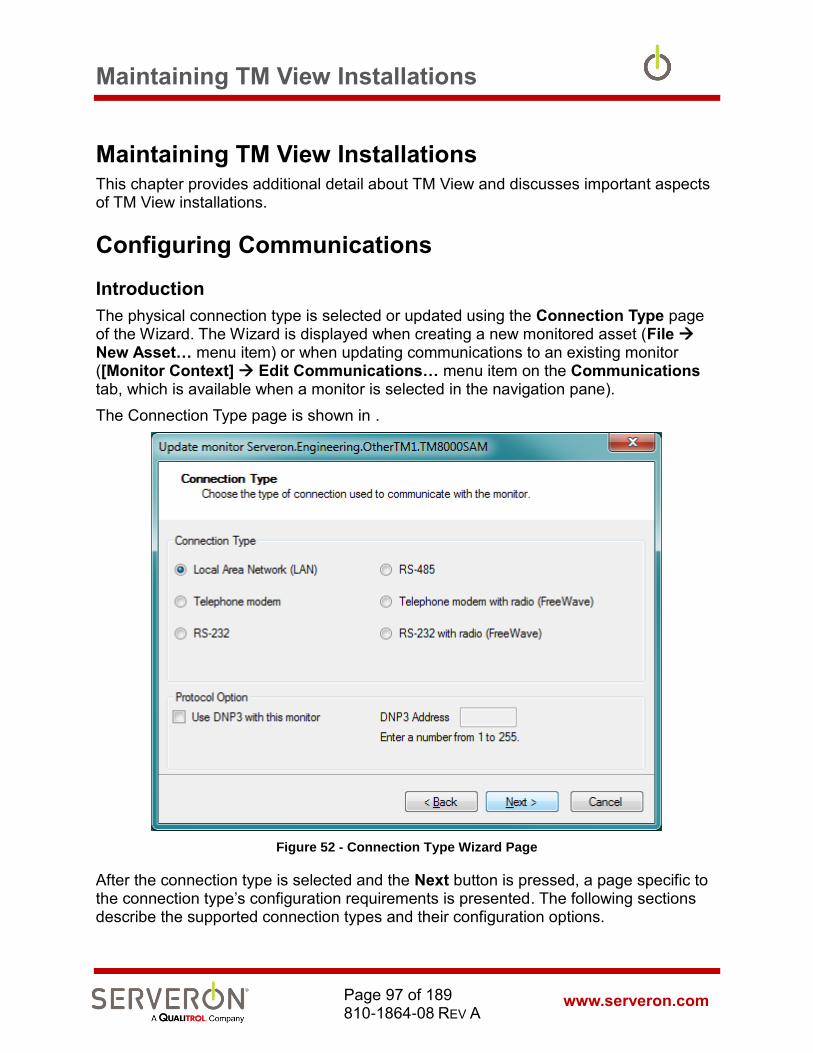
Maintaining TM View Installations
www.serveron.com Page 97 of 189 810-1864-08 REV A
Maintaining TM View Installations This chapter provides additional detail about TM View and discusses important aspects of TM View installations.
Configuring Communications
Introduction
The physical connection type is selected or updated using the Connection Type page of the Wizard. The Wizard is displayed when creating a new monitored asset (File New Asset… menu item) or when updating communications to an existing monitor ([Monitor Context] Edit Communications… menu item on the Communications tab, which is available when a monitor is selected in the navigation pane).
The Connection Type page is shown in .
Figure 52 - Connection Type Wizard Page
After the connection type is selected and the Next button is pressed, a page specific to the connection type’s configuration requirements is presented. The following sections describe the supported connection types and their configuration options.

Maintaining TM View Installations
www.serveron.com Page 98 of 189 810-1864-08 REV A
Local Area Network (LAN)
Direct monitor communication via Ethernet LAN is supported for all monitors. When a monitor itself does not have an Ethernet port, it is possible to use a LAN/Serial adapter to connect to the monitor using Ethernet. When LAN is selected, only a single configuration item, the network (Ethernet) address of the monitor need be supplied.
Note: The timeouts for Ethernet communications in TM View are designed for a short-loop LAN. If the user is using a WAN or polling
through the internet, the timeouts have to be modified.
Here is the procedure to do this, should it be needed:
1. With the TM View Client running, stop the Serveron_Extended_Poller service:
a. Select Start/Control Panel/Administrative Tools
b. Select “Services”
c. Scroll down to the Serveron_Extended_Poller service, and stop it.
d. Do NOT close this window, we’ll need it later.
2. Use the TM View menu item “Tools” and select “Configuration Options…”. This will open a dialog showing a number of options the user can change. We are interested in a set of similar options groups:
Figure 53 - Timeouts Configuration Options
3. The first group of four options (TimeoutPrompt, TimeoutEcho, TimeoutResyncFlush and TimeoutResyncRead) concerns the Ethernet timeouts. Increase these timeouts if you have latency problems on a LAN connection.
4. The second group (PPP- prefixed timeouts) concerns a modem connection timeouts. Increase these timeouts if there are issues connecting to a monitor with a modem.

Maintaining TM View Installations
www.serveron.com Page 99 of 189 810-1864-08 REV A
5. The third group (prefixed Serial-) concern a serial connection timeout.
6. After modifying the timeouts, click OK on that dialog box.
7. The settings are read by the poller when it starts (e.g. when the computer starts). To make them effective, we need to restart the poller. This is why we stopped it earlier. Using the same Services console as in step 3, start the poller service again. If it fails, wait 20 seconds and try again.
8. Once the poller has started, try polling again.
9. If polling fails again, go back to step 1. Try higher values for all timeouts.
RS-485
TM View supports polling monitors connected through an RS-485 network, Point-to-Point or Multi-drop. Some restrictions apply on multi-drop networks: RS-485 requires using the DNP3 protocol with Serveron TM Series DGA monitors. When RS-485 is selected, the next screen will be similar to a simple RS-232 connection and the user will be prompted to specify a COM port and a baud rate.
Point-to-Point RS-485 is actually seen as an RS-232 connection for TM View: if the user requires a point-to-point RS-485 connection, TM View should be configured as for a serial, RS-232 connection, but the Serveron TMx monitor should be configured for RS-485. In this case, using the DNP3 protocol is not mandatory anymore.
Telephone Modem
Plain old telephone system (POTS) and cellular modems are supported for all monitors. Configuration data for the modem is entered on the Configure Modem Connection page. Four items are required to configure a modem connection:
• The phone number, also called the dial string. The dial string may include commas to introduce delays into the dialing sequence. It may also include codes to temporarily disable PBX functionality; in the example, the code ‘*71’ represents a typical command to disable the Call Waiting feature. TM View also supports a send/expect protocol for arbitrarily complex interactions with the modem. This protocol is enabled by the caret (^) character, which can only be entered after checking the Allow advanced dial string checkbox. The send/expect protocol is described in the section Advanced Dialing Strings.
• The modem setup string. This string contains modem initialization commands that should be in effect at all times. The default modem setup string is also described in the section Configuring Modems, below.
• The baud rate which should be used. The baud rate at which the port should be used.
Maintaining TM View Installations
www.serveron.com Page 100 of 189 810-1864-08 REV A
RS-232
Direct RS-232 connectivity is supported for all monitors. Three items are required to configure a direct connection:
• The COM port to which the cable is attached. The number of the COM port on the local computer.
• The baud rate which should be used. The baud rate at which the port should be used.
RS-232 with radio (FreeWave®)
TM View supports a direct serial connection to a short-range radio link, e.g. FreeWave from FreeWave Technologies. Three items are required to configure a direct-to-radio connection:
• The COM port to which the cable is attached. The number of the COM port on the local computer.
• The baud rate which should be used. The baud rate at which the port should be used.
• The unit address of the slave radio. This value is a configuration parameter of the FreeWave.
Telephone Modem with radio (FreeWave®)
TM View supports a modem connection to a short-range radio link, e.g. FreeWave from FreeWave Technologies. Five items are required to configure a modem-to-radio connection:
• The phone number also called the dial string. The dial string may include commas to introduce delays into the dialing sequence. It may also include codes to temporarily disable PBX functionality; in the example, the code *71 represents a typical command to disable the Call Waiting feature. TM View also supports a send/expect protocol for arbitrarily complex interactions with the modem. This protocol is enabled by the caret (^) character, which can only be entered after checking the Allow advanced dial string checkbox. The send/expect protocol is described in the section Advanced Dialing Strings.
• The modem setup string. This string contains modem initialization commands that should be in effect at all times. The default modem setup string is also described in the section Configuring Modems, below.
• The baud rate which should be used. The baud rate at which the port should be used.

Maintaining TM View Installations
www.serveron.com Page 101 of 189 810-1864-08 REV A
• The unit address of the slave radio. This value is a configuration parameter of the FreeWave.
Configuring Modems
Modem Initialization
Before sending any dial string to the modem, TM View will transmit the modem setup string. The default modem setup string is at v1 e0 q0 &d2 x4. This setup string is needed to configure the modem in your PC for proper communication with TM View.
at indicates the start of a modem command string.
v1 tells the modem to send responses that contain alphabetical codes rather than
numeric codes.
e0 turns echo off.
q0 quiets or suppresses response codes from your modem.
&d2 sets the modem to do the following when Data Terminal Ready (DTR) is lost:
hang up
turn off auto answer
return to command mode
x4 sets the modem to display at least these response codes:
extended response set
dial tone
busy signal detection
Below are general definitions of the Hayes-compatible commands used in the example. Your specific modem may require commands in addition to or instead of those shown in
this example. Refer to the documentation that came with your modem for more information.
vN - Displays result codes in short form (numbers) or long form (test).
N = 0: send numeric responses
N = 1: send word responses (default).
eN - Turns the command echo feature on or off.
N = 0: command echo off
N = 1: command echo on (default).
qN - Displays or suppresses (quiets) result codes
N = 0: displays codes (default).
Maintaining TM View Installations
www.serveron.com Page 102 of 189 810-1864-08 REV A
N = 1: suppresses codes.
&dN - Controls data terminal ready (DTR) transition
0 = ignore DTR signal
1 = return to command mode when after losing DTR
2 = hang up, turn off auto answer and return to command mode after losing DTR (default)
3 = reset after losing DTR
xN - Determines which result codes will be displayed following modem operations
N = 0: Basic response set, blind dialing
N = 1: extended response set, blind dialing
N = 2: extended response set, dial tone detection
N = 3: extended response set, blind dialing, and busy signal detection
N = 4: extended response set, dial tone, and busy signal detection (default).
Advanced Dialing Strings
Overview
Occasionally, nonstandard communications configurations may require that you exercise direct control over interaction between the host computer running TM View and the modem (or modem-compatible) device.
TM View supports this unusual but important requirement through advanced dial strings. An advanced dial string is any string containing the caret (^, usually shift-6 on U.S. English keyboards).
Since the presence of caret characters significantly changes the behavior of the dial string, TM View prevents you from entering them by default. To enter an advanced dial string containing carets, you must first check the Allow advanced dial string checkbox. The box is found just below the Phone Number on the Configure Modem Connection page of the New File Creation (or Update Communications) wizard. After checking the box, you may type the advanced dial string in the Phone Number text box.
Send/Expect Protocol
The caret character is used to define a send/expect protocol between the computer running TM View and the modem (or modem-like device) attached to the selected COM port. Carets in properly-formed advanced dial strings always come in pairs. The first member of the pair defines a block of text that TM View will send to the modem. The

Maintaining TM View Installations
www.serveron.com Page 103 of 189 810-1864-08 REV A
second caret defines the response to expect from the modem-like device. Further interactions may be specified by entering a third caret with a send sequence, a matching fourth caret defining an expected response, etc. In principle, there is no limit to the length of the send/expect sequence that may be defined.
Example: the advanced dial string
^AT^OK^ATDT5551212^CONNECTED^AT^OK^ATDT7^CHANNEL 7
Would be executed as follows:
1. TM View opens the COM port and then transmits the string AT to the port.
2. TM View collects response lines from the port until the pattern OK is found.
3. TM View sends the string ATDT5551212 to the port.
4. TM View collects response lines until the pattern CONNECTED is found.
5. TM View transmits the string AT to the port.
6. TM View collects response lines until the pattern OK is found.
7. TM View transmits the string ATDT7 to the port.
8. TM View collects response lines until the pattern CHANNEL 7 is found.
At this point, TM View assumes it is connected to the Serveron transformer monitor and begins communication with the monitor.
Each time TM View transmits a character sequence to the port, it begins interpreting response lines. It continues to collect response lines until the expected response is found or a timeout occurs. The timeout is relatively long (3 minutes). If the timeout occurs, TM View reports that it was unable to connect to the monitor.
Configuring TAPI Modem
TM View uses TAPI, a feature of Microsoft Windows, to access the modem when communicating with Serveron Model TMx monitors. Use of TAPI requires that your analog modem be properly installed as a TAPI modem. If you plan to communicate with model TMx monitors using an analog modem, you must ensure your modem is properly installed and configured for use by TAPI.
Note: On Windows 7, Windows Vista and Windows Server 2008 (both x86 and x64 versions), this action must only be selected when running the TM
View application as an Administrator. Normal users have insufficient privileges, and the action would fail. The user should right-click the TM View icon and select “Run as Administrator…” to launch TM View when
configuring a modem.
Please see the instructions below for TM View about setting up a modem for TM View in Windows 7, Vista or Server 2008.

Maintaining TM View Installations
www.serveron.com Page 104 of 189 810-1864-08 REV A
Setting up a modem in Windows 7, Vista or Server 2008
1. Log-in to your PC as administrator and install your modem and the most recent drivers for your modem on the operating system of your machine. You may have to reboot your PC after installing the modem drivers – the installer will prompt you if that is the case.
2. Use the “Control Panel -> Phone and Modem” applet to cause Windows to discover the modem. This is imperative on Windows Server 2008. On Windows 7 and Vista, the “Configure TAPI modem” button can create the modem entry for you (see #4 below).
3. Run TM View as an Administrator for your machine: right click the start menu option or the desktop icon you use to launch TM View and select “Run as Administrator.
4. Use the menu option Tools->Select Modem, and select the modem you intend to use for TM View dial-out.
5. Using the “Control Panel -> Network and Sharing Center” applet, go to “Change Adapter Settings” and open the properties window for the Serveron modem network adapter.
6. Under the General tab, click on the “Configure…” button: in the modem configuration, make sure all boxes are checked.
Figure 54 - Modem options
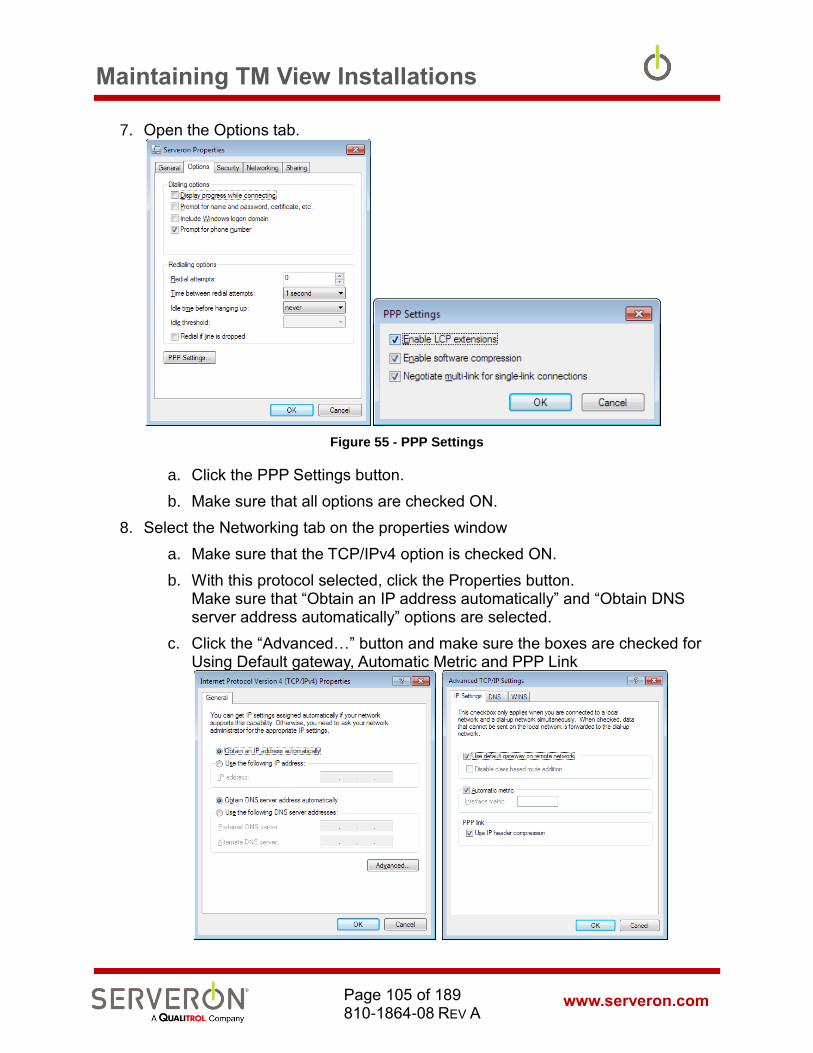
Maintaining TM View Installations
www.serveron.com Page 105 of 189 810-1864-08 REV A
7. Open the Options tab.
Figure 55 - PPP Settings
a. Click the PPP Settings button.
b. Make sure that all options are checked ON.
8. Select the Networking tab on the properties window
a. Make sure that the TCP/IPv4 option is checked ON.
b. With this protocol selected, click the Properties button. Make sure that “Obtain an IP address automatically” and “Obtain DNS server address automatically” options are selected.
c. Click the “Advanced…” button and make sure the boxes are checked for Using Default gateway, Automatic Metric and PPP Link
Maintaining TM View Installations
www.serveron.com Page 106 of 189 810-1864-08 REV A
Figure 56 - TCP/IP options
9. Exit TM View.
You can now run TM View as a normal user – the modem should be installed and ready to use.
Note: if you do not use a modem to communicate with Serveron Model TMx monitors, this section does not apply to your installation.
Setting up a modem in Windows XP
To select the TAPI modem, click Select Modem in the Context menu to display the Select Modem dialog box. The dialog box contains a drop-down list containing all properly-configured TAPI modems. If your modem does not appear in the list, click Configure TAPI Modem to display the Add/Remove Hardware wizard. Follow the prompts in the wizard to configure your modem.
If your modem does not appear in the drop-down list after you complete the Add/Remove Hardware wizard, the following information may be helpful.
To determine whether your analog modem is properly installed for use by TAPI, click Settings in your Start menu, open the Control Panel and then double-click Phone and Modem Options. In the Phone and Modem Options applet, select the Modems tab. Verify that your modem (example: MultiTech MT5600ZDX Play & Play) is shown in the list. If it is not, click the Add... button and use the wizard to properly install and configure your modem for use by TAPI.
TM View will automatically create a phonebook entry named Serveron to manage your modem. If your system does not have a properly configured TAPI modem, TM View may fail to bind or may logically bind to a non-functional device such as the printer port. If your modem is configured for TAPI but you are unable to connect to your model TMx monitor using it, click Settings in your Start menu and then click Network Connections. Right-click and delete the Serveron entry in the list. Ensure your modem is properly installed for use by TAPI as described above and then restart your computer.
When your computer is ready, start TM View and try the connection again. You may then view your Network Connections and verify that the Serveron entry has been recreated.

Troubleshooting
www.serveron.com Page 107 of 189 810-1864-08 REV A
Troubleshooting
Menu Items Unavailable (“Grayed Out”)
Menu items are unavailable (“grayed out”) if the operation they represent is not meaningful or cannot be performed.
If numerous menu items are unavailable (grayed out), check the status information lower right corner of the TM View window. Many menu items require interaction with the TM View Poller component. If your TM View installation configuration is Viewer Only, the status bar will display Poller: None and these menu items are unavailable. They include File New, and most of the contents of the Context menu.
If your installation configuration is Server, the indicator at the lower-right corner of the main TM View window should say Busy or Idle. If it says None, the Viewer and Poller components of TM View are not communicating correctly. For more information about TM View’s components, please see the Theory of Operations section below.
Theory of Operations
Overview
Note: This section assumes general knowledge of Microsoft Windows system administration. Understanding the concepts presented here is not
required to make successful use of the TM View software.
TM View is composed of three components, the Database, the Viewer and the Poller. The latter two components are separate programs and both use the database.
The Viewer is the application you see and interact with. The Poller works “behind the scenes,” communicating with your Serveron monitor(s) and saving the data they gather in the database. The Viewer is always installed and appears in your Start menu under Programs Serveron TM View.
Installation of the Poller depends on the installation configuration you selected.
If the Installation Configuration is…
Then the Poller component is…
Viewer Only Not installed – not present.
Server Installed as a Windows Service.
Troubleshooting
www.serveron.com Page 108 of 189 810-1864-08 REV A
For more information about installation configurations, see the section Choosing an Installation Configuration near the beginning of this manual.
TM View stores region, substation and asset names, the communications configuration in a set of tables in the common database and the information gathered from the monitor in other tables in the database.
Viewer Component
The Viewer provides the entire user interface to TM View. The Viewer accesses the database in order to build the navigation tree and accesses it again when different items are selected to display the status of substations, transformers and monitors.
These actions only involve the Viewer and the database: no connection is made to the monitor for any of these activities. Actions that require connecting to the monitor (like setting the monitor date and time, for example) must go through the Poller. For this reason, all actions requiring connecting to the monitor are not allowed in Viewer Only installations, since the poller is not available then.
Poller Component
The Poller is responsible for all monitor communication and collecting of data, but does not offer a user interface. Since the Poller has no user interface of its own, it must rely on the Viewer to provide one.
The Viewer and Poller often interact as client and server, although neither one requires the presence of the other. The Viewer may be installed without the Poller (Viewer Only installation configuration). The Poller runs whenever the computer is powered on.
The Viewer communicates with the Poller using TCP/IP. The Poller listens on port 8211. The Poller accepts connections only from a single Viewer on the same computer (localhost). This feature is hardwired in the code. Restricting incoming connections to localhost addresses network security concerns associated with the use of TCP.
If you run firewall software locally on the PC, you may be required to configure the firewall to allow the Poller to listen locally on port 8011. As noted above, this should not raise security concerns because the Poller will only accept connections originating from the same computer on which it is running. TM View does not offer any network service(s) available from off-host.
Poller Outputs
The poller output consists of the data stored in the database, as well as several methods of publishing and using the data collected.
Troubleshooting
www.serveron.com Page 109 of 189 810-1864-08 REV A
Note: The functions described below are packaged as plug-in components and they are delivered and installed separately from TM
View. TM View Enterprise includes all these plugins, but TM View Standard does not.
- OPC OPC is a well-established industrial standard for interfacing SCADA devices and computers. The Serveron Extended Poller has OPC server capabilities and can expose on OPC the data for all the monitors that it is configured with. See Appendix A for the OPC maps associated with the Serveron Poller, TM8 and TM3 monitors.
- ODBC ODBC is an open database interface used to connect many types of storage engines (database or other). Examples of external ODBC clients for the Serveron Extended Poller could be text files, Excel files, Oracle databases and any application which supports ODBC.
- Notifications TM View offers a mail notification service, allowing the poller to automatically send email notices when a monitor reports a value over the limit (alarm or caution condition). The content of the message is customizable by the user. Refer to the TM View Notification guide for more details.

Appendix A – OPC User Guide
www.serveron.com Page 110 of 189 810-1864-08 REV A
OPC Overview The OPC functionality of the Serveron Poller is only supported in TM View Enterprise which includes the OPC plugin.
OPC Server
TM View Standard
TM View Enterprise
Plug-in
This document describes the configuration and interoperability information for the OPC interface of the TM View software. This document provides complete information on how to access the data published by the TM View Poller using the OPC connectivity standard.
The TM View application software must be configured to use the OPC interface to insure proper operation.
The Serveron Extended Poller is a component of the TM View application software and is responsible for collecting data from all supported monitors. The Poller stores the acquired data in a central database.
When the OPC interface is enabled, the user has the ability to configure each monitor to be visible from the OPC interface. When this option is set, the data polled from on-line monitors is published by the OPC server interface of the TM View software.
The implementation of the OPC by the TM View application software is fully compliant with OPC DA 3 specification.
IMPORTANT: The OPC interface is a function of the Serveron Extended Poller, which is only installed in the Server configurations of TM View.
Intended Audience
The intended audience for this user guide consists of:
• Software developers with substantial experience with COM, C++, .NET and the Microsoft CLR (Common Language Runtime), who want to develop OPC Client applications using the data exposed by the TM View Poller.
• Integrators with OPC experience who want to set up an OPC Client application using the data exposed by the TM View Poller.

Appendix A – OPC User Guide
www.serveron.com Page 111 of 189 810-1864-08 REV A
OPC Definition
OPC stands for “OLE for Process Control”. It has been a standard for interoperability between various control equipment and computers since the late 1990s.
Please consult the OPC Foundation web site at http://www.opcfoundation.org for further
reference. This manual does not attempt in any way to be a tutorial on OPC.
From the web site:
The use of OPC allows Utility users the ability to develop general client applications to fully utilize the data that is acquired by TM View.
Note: The OPC server functionality is in addition to the current functionality of TM View. In particular, the data published on the OPC
interface is also stored in the database, independently of the OPC server setup.
OPC is open connectivity via open standards. They fill a need in automation like
printer drivers did for Windows.
OPC is a series of standards specifications. The first standard (originally
called simply the OPC Specification and now called the Data Access
Specification) resulted from the collaboration of a number of leading worldwide
automation suppliers working in cooperation with Microsoft. Originally based on
Microsoft's OLE COM (component object model) and DCOM (distributed
component object model) technologies, the specification defined a standard set
of objects, interfaces and methods for use in process control and manufacturing
automation applications to facilitate interoperability. The COM/DCOM
technologies provided the framework for software products to be developed.
There are now hundreds of OPC Data Access servers and clients.

Appendix A – OPC User Guide
www.serveron.com Page 112 of 189 810-1864-08 REV A
AlarmService
Power
SERVERONR
TMx
Poller
AlarmService
Power
SERVERONR
TMx
AlarmService
Power
SERVERONR
TMx
AlarmService
Power
SERVERONR
TMx
……..
IOPCServer
Data from all
monitors
User Application
(OPC Client)
Gas PPM data, Sensors
Figure 57 – OPC server data flow
A user develops an application using the OPC Core Components, which are available from the OPC foundation web site.
This custom user application can access data from the TM View Integrated Poller. Each time a monitor is polled by TM View, the data is published on the OPC interface.
The typical purpose of an application using the OPC interface of TM View is to display or store the data collected from TM series monitors for different applications than the TM View application. Examples of such applications could be SCADA systems or auditing systems.
References
• www.opcfoundation.org - Official web site for the OPC foundation.

Appendix A – OPC User Guide
www.serveron.com Page 113 of 189 810-1864-08 REV A
System Configuration Configuring OPC for a TM View system is done in the following steps:
1. Install the OPC plugin
2. Register the Serveron Poller as an OPC server
3. Restart the System after you add monitors.
Install the OPC Plugin
The OPC functionality is built-in with TM View Enterprise. If you have TM View Enterprise Edition, the OPC plugin is already installed, go to step 2. If you have TM View Standard Edition, the OPC functionality needs to be installed. Run the “OPC Installer.exe” installer application on your computer.
NOTE: administrative privileges are required: you may need, especially on Windows 7, to right-click on the file and select “run as
administrator”).
This will install all the components required to run and test your OPC server.
Register the OPC server
In order for the OPC server to begin to act as such, it needs to be registered. This is the COM/DCOM server registration. This task is carried out by a utility installed along with the OPC plugin, called “OPCRegistration.exe”.
1. Open a CMD window as administrator (Start/All Programs/Accessories/, right-click on Command Prompt and select “Run as administrator”.)
2. Navigate to the folder where TM View is installed: C:\Program Files(x86)\Serveron\TM View\
3. Execute the following command: OPCRegistration.exe –service
4. Verify that there are no error messages and close the CMD window
Verify the OPC registration
Use an OPC client such as MatrikonOPC explorer (available at www.matrikonopc.com) to test the OPC server for TM View. Serveron also makes available a small OPC client that you can use for the same purpose. In the rest of this section, we are using that small client to illustrate the procedure.
When you double-click on that desktop icon (on Windows 7, you may have to right-click and select “run as administrator”), you will see the application main window come up and then a dialog appears over that, prompting the user to select an OPC server. The
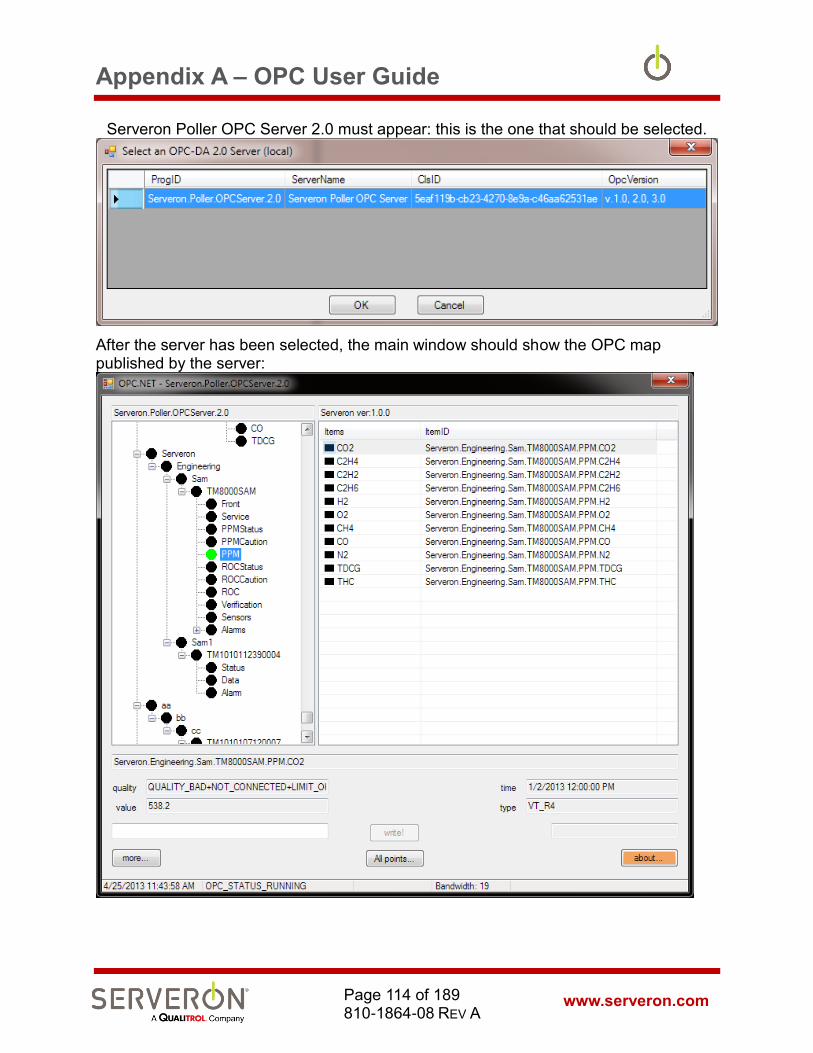
Appendix A – OPC User Guide
www.serveron.com Page 114 of 189 810-1864-08 REV A
Serveron Poller OPC Server 2.0 must appear: this is the one that should be selected.
After the server has been selected, the main window should show the OPC map published by the server:
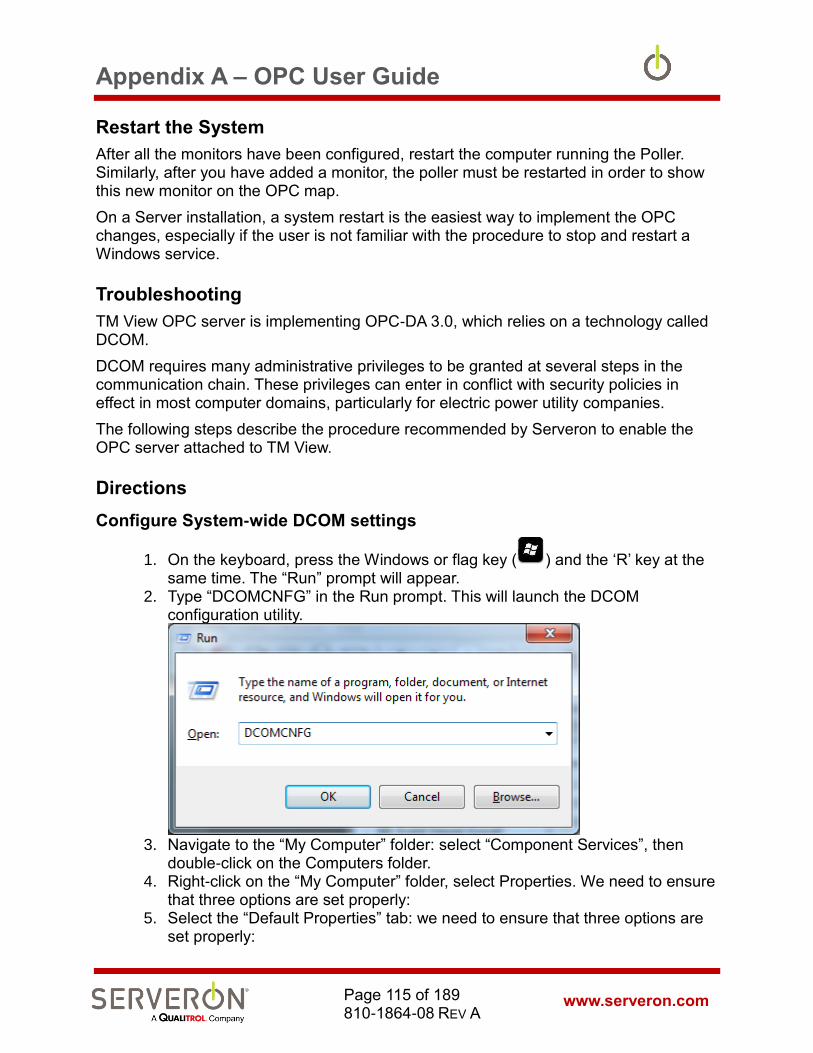
Appendix A – OPC User Guide
www.serveron.com Page 115 of 189 810-1864-08 REV A
Restart the System
After all the monitors have been configured, restart the computer running the Poller. Similarly, after you have added a monitor, the poller must be restarted in order to show this new monitor on the OPC map.
On a Server installation, a system restart is the easiest way to implement the OPC changes, especially if the user is not familiar with the procedure to stop and restart a Windows service.
Troubleshooting
TM View OPC server is implementing OPC-DA 3.0, which relies on a technology called DCOM.
DCOM requires many administrative privileges to be granted at several steps in the communication chain. These privileges can enter in conflict with security policies in effect in most computer domains, particularly for electric power utility companies.
The following steps describe the procedure recommended by Serveron to enable the OPC server attached to TM View.
Directions
Configure System-wide DCOM settings
1. On the keyboard, press the Windows or flag key ( ) and the ‘R’ key at the same time. The “Run” prompt will appear.
2. Type “DCOMCNFG” in the Run prompt. This will launch the DCOM configuration utility.
3. Navigate to the “My Computer” folder: select “Component Services”, then
double-click on the Computers folder. 4. Right-click on the “My Computer” folder, select Properties. We need to ensure
that three options are set properly: 5. Select the “Default Properties” tab: we need to ensure that three options are
set properly:
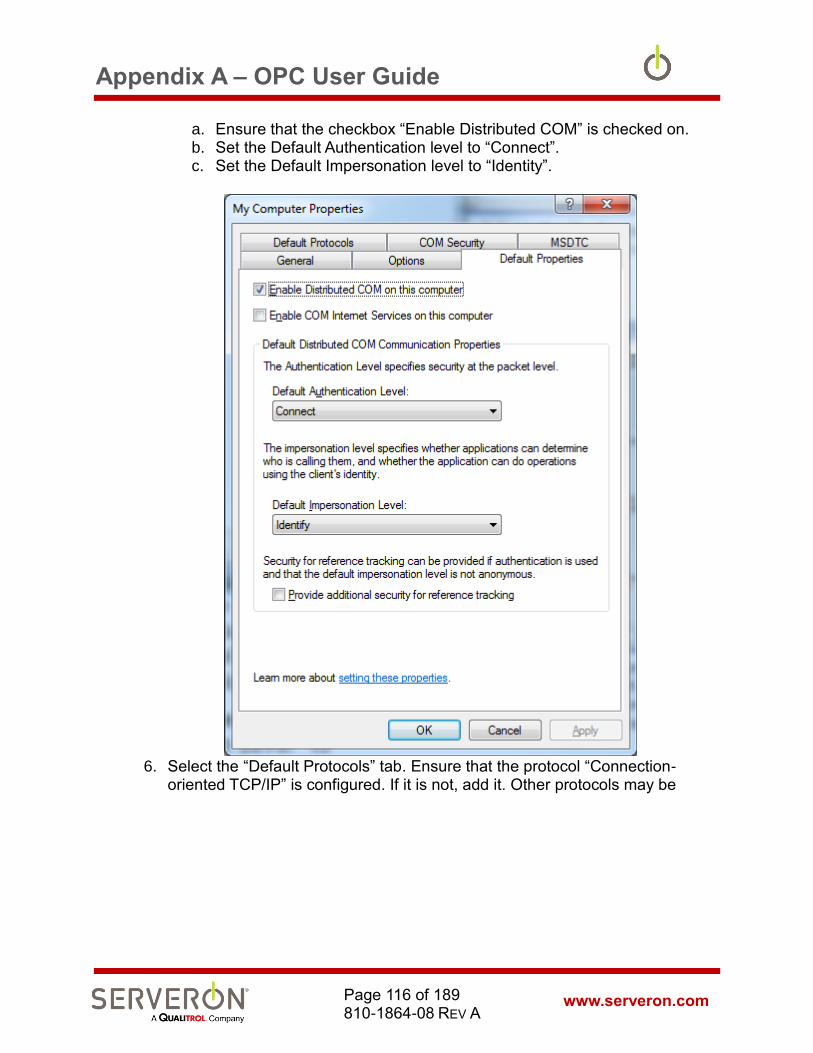
Appendix A – OPC User Guide
www.serveron.com Page 116 of 189 810-1864-08 REV A
a. Ensure that the checkbox “Enable Distributed COM” is checked on. b. Set the Default Authentication level to “Connect”. c. Set the Default Impersonation level to “Identity”.
6. Select the “Default Protocols” tab. Ensure that the protocol “Connection-
oriented TCP/IP” is configured. If it is not, add it. Other protocols may be
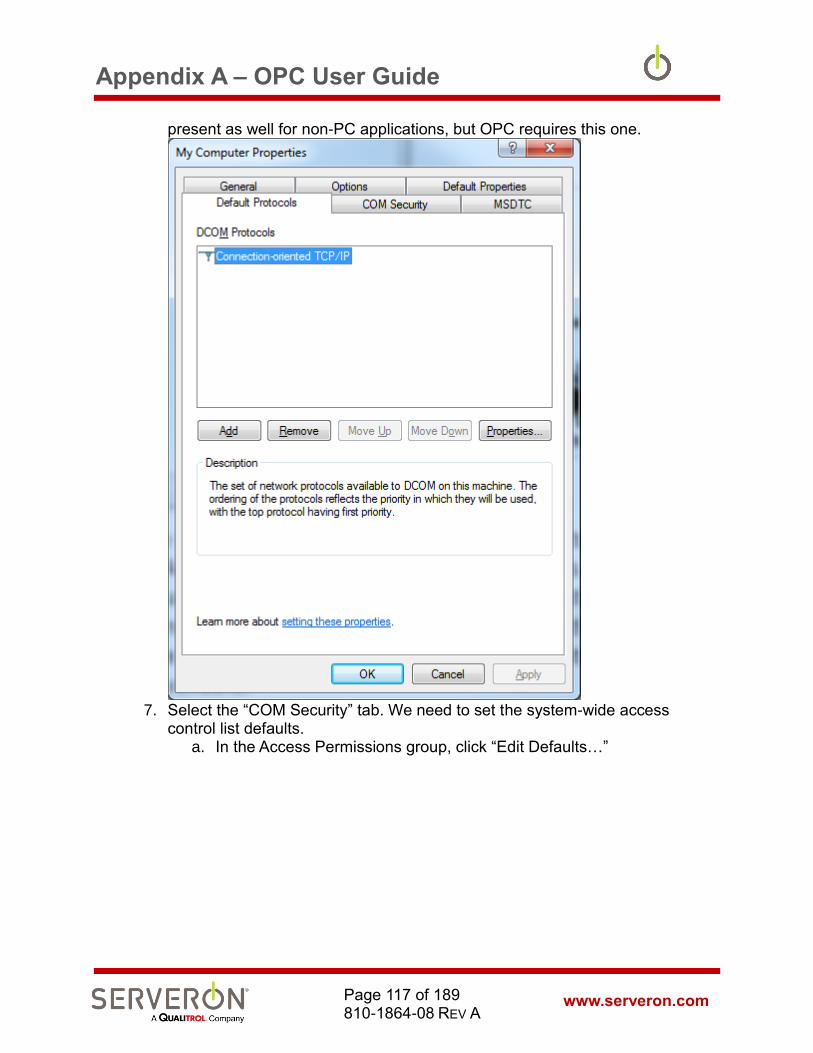
Appendix A – OPC User Guide
www.serveron.com Page 117 of 189 810-1864-08 REV A
present as well for non-PC applications, but OPC requires this one.
7. Select the “COM Security” tab. We need to set the system-wide access
control list defaults. a. In the Access Permissions group, click “Edit Defaults…”

Appendix A – OPC User Guide
www.serveron.com Page 118 of 189 810-1864-08 REV A
i. Add the user “Everyone” and click OK
ii. Add the user “Anonymous” and click OK iii. Ensure that all access rights are enabled (under the “Allow
column” for both of these users, and click OK.
b. In the Launch and Activation Permissions group, click on “Edit
Defaults…”.
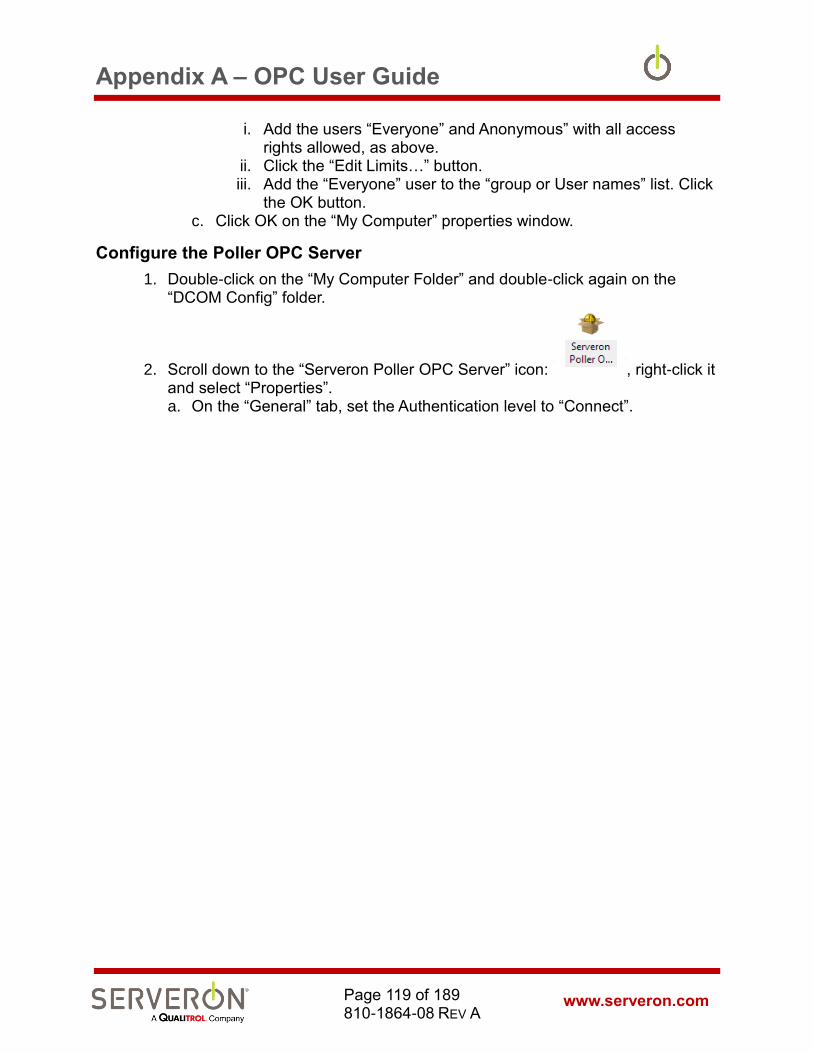
Appendix A – OPC User Guide
www.serveron.com Page 119 of 189 810-1864-08 REV A
i. Add the users “Everyone” and Anonymous” with all access rights allowed, as above.
ii. Click the “Edit Limits…” button. iii. Add the “Everyone” user to the “group or User names” list. Click
the OK button. c. Click OK on the “My Computer” properties window.
Configure the Poller OPC Server
1. Double-click on the “My Computer Folder” and double-click again on the “DCOM Config” folder.
2. Scroll down to the “Serveron Poller OPC Server” icon: , right-click it and select “Properties”. a. On the “General” tab, set the Authentication level to “Connect”.

Appendix A – OPC User Guide
www.serveron.com Page 120 of 189 810-1864-08 REV A
b. On the “Location” tab, set the check boxes as follows:
c. On the Identity tab, make sure that the user is set to “The system account
(services only)”. d. Click OK.
3. Reboot the computer. This will ensure that the system and the Serveron Poller will start with these settings.
4. After restart, run the DirectOPC Client: it should allow selecting the Serveron Poller OPC server, and show the list of data points exposed by the TM View poller.
References
- http://www.opcti.com/Resources/whitepapers/OPC_and_DCOM_Troubleshooting_Quick_Start_Guide.pdf
- http://www.opcti.com/Resources/Documents/0x80070005_DCOM_Error.pdf
Appendix A – OPC User Guide
www.serveron.com Page 121 of 189 810-1864-08 REV A
- http://www.opcti.com/Resources/Documents/OPC_and_DCOM-5_Things_You_Need_to_Know.pdf
- http://ics-cert.us-cert.gov/sites/default/files/recommended_practices/OPC%20Abstract.pdf

Appendix A – OPC User Guide
www.serveron.com Page 122 of 189 810-1864-08 REV A
Interface Definition
The interface definition a client application needs to know consists of the data tags visible for the Poller itself, and the data tags visible for each monitor.
Poller Interface
The Poller interface has a progID of “Serveron.Poller.OPCServer”.
The tags specific to the Poller are:
- NumberOfDGAMonitors: this is the total number of DGA monitors published by the Poller.
- Status: status of the Poller, usually 0 if the Poller is working normally.
The tags will be visible by the client as “Poller.NumberOfDGAMonitors”, etc...
TMx Monitor Mapping
The mapping of the tags for the TM Series monitors (TM8 and TM3) is described by an XML file which follows the schema listed below.
It consists of a list of OPCMapping elements. Each element consists of a tag name and a type. The type is a .NET CLR type name, giving the type of the data being exposed.
The element name is pre-pended by the Company name, the Site name, the Asset name and the serial number, separated by periods ‘.’
For example, in the case where the configuration contains this monitor:
The OPCMapping with name “Front.ServiceLED” will have for tag name: “aa.bbb.CCCP.TM000905. Front.ServiceLED”.
And all remaining tags for this monitor (see tag table below) would be pre-pended with “aa.bbb.CCCP.TM000905”.
For each monitor configured in the system, the whole list of OPC mappings in the XML file will be repeated, with the pre-pended <company>.<site>.<asset>.<serial number> string.

Appendix A – OPC User Guide
www.serveron.com Page 123 of 189 810-1864-08 REV A
OPC Map Schema
The mapping file actually used by the software is an XML file with this schema:
<?xml version="1.0" encoding="utf-8"?>
<xsd:schema xmlns:xsi="http://www.w3.org/2001/XMLSchema-instance"
xmlns:xs="http://www.w3.org/2001/XMLSchema"
xmlns:xsd="http://www.w3.org/2001/XMLSchema" attributeFormDefault="unqualified"
elementFormDefault="qualified">
<xs:element name="OPCMappings">
<xs:complexType>
<xs:sequence>
<xs:element maxOccurs="unbounded" name="OPCMapping">
<xs:complexType>
<xs:sequence>
<xs:choice maxOccurs="unbounded">
<xs:element name="Name" type="xs:string" />
<xs:element name="Type" type="xs:string" />
<xs:element name="IsList" type="xs:boolean" minOccurs="0" />
<xs:element name="Size" type="xs:unsignedByte" minOccurs="0" />
</xs:choice>
</xs:sequence>
</xs:complexType>
</xs:element>
</xs:sequence>
</xs:complexType>
</xs:element>
</xsd:schema>
The “IsList” and “Size” elements go together: they mark an element that is an indexed list of tags. Indexes are zero-based.
The maps themselves are actually XML documents contained in the database. We are giving the contents of these files in tabular format in this manual.
The actual XML file, should it be needed by a user application, can be recreated from the OPCMap field in the MonitorTypes table of the database.
Execute the SQL query
SELECT [OPCMap]
FROM [ServeronDB].[dbo].[MonitorTypes]
WHERE ShortName = 'TM8'
to retrieve the OPC map for the TM8 monitors in the system (all Serveron TMx monitors have the same map).
The following table gives the short names which should be used for different monitor types:
Monitor Type Short name
DGA TM1, TM2, TM3, TM8
OPC Tags for DGA Monitors
Mapping name CLR type Meaning

Appendix A – OPC User Guide
www.serveron.com Page 124 of 189 810-1864-08 REV A
Front.ServiceLED System.Boolean Front Blue light is on (needs service)
Service.CommFailure System.Boolean Repeated communication failure
Service.GCAnalysisFail System.Boolean GC analysis failed
Service.HeliumTankEmpty System.Boolean Helium tank is empty
Service.CalTankEmpty System.Boolean Calibration cal tank is empty
Service.ExtractorShutdown System.Boolean The extractor is shutdown
Service.RotaryValveFailure System.Boolean One of the rotary valves failed
Service.HeaterShutdown System.Boolean Heater is shutdown
Service.HeliumTankLow System.Boolean Helium tank has low pressure
Service.CalTankExpired System.Boolean Calibration gas tank has expired
Service.FanStalled System.Boolean Enclosure fan is stalled
Service.SystemADCReference System.Boolean ADC reference out of range
Service.AnalogADCReference System.Boolean ADC reference out of range
Service.VDC24 System.Boolean 24V DC supply out of range
Service.System5V System.Boolean 5 V DC system supply out of range
Service.VDC6p8 System.Boolean 6.8 V DC supply out of range
Service.VDC15 System.Boolean 15 VDC supply out of range
Service.Analog5V System.Boolean Analog 5 VDC supply out of range
Service.VDC12 System.Boolean 12 VDC supply out of range
Service.SystemDACFeedback System.Boolean DAC feedback out of range
Service.AnalogDACFeedback System.Boolean DAC Feedback out of range
Service.SampleSchedDisabled System.Boolean Sampling schedule is disabled
Service.GCAnalysisOilTemp System.Boolean GC Analysis failure: oil temperature out of range
Service. GCAnalysisOilPressure
System.Boolean GC Analysis failure: oil pressure too high
Service. GCAnalysisOilSampling
System.Boolean GC Analysis failure: oil sampling failure
PPMStatus.CO2 System.Boolean Gas level over limit
PPMStatus.C2H4 System.Boolean Gas level over limit
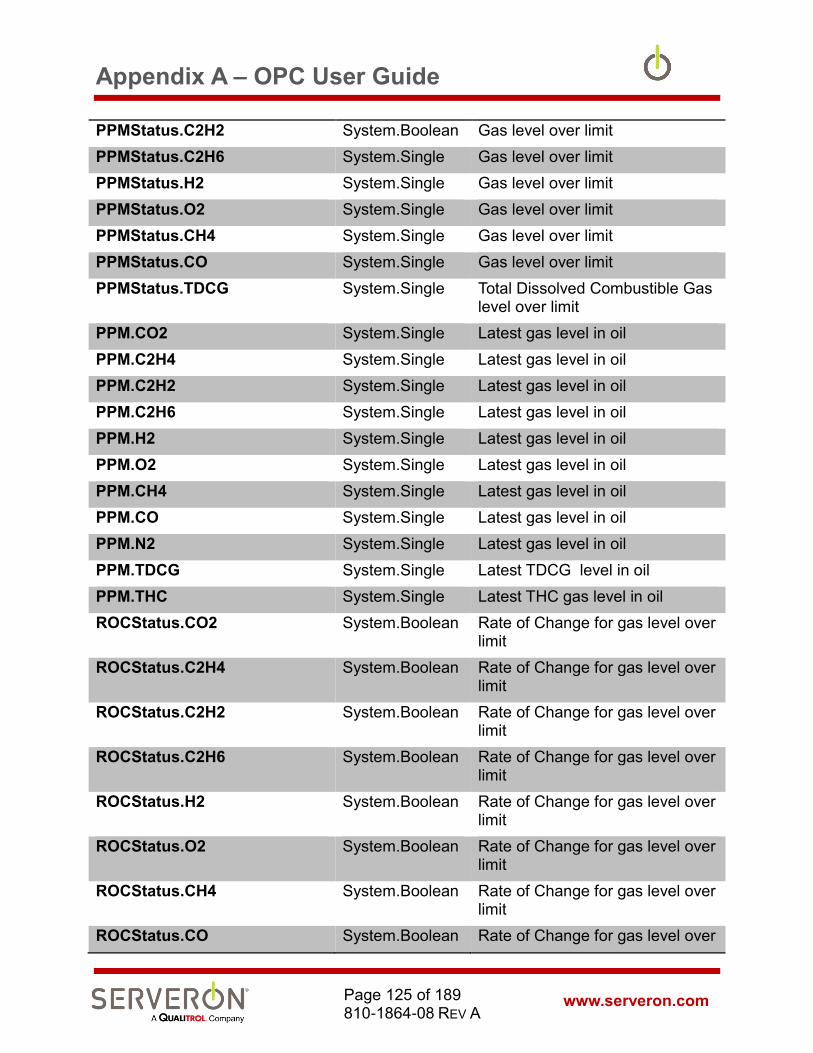
Appendix A – OPC User Guide
www.serveron.com Page 125 of 189 810-1864-08 REV A
PPMStatus.C2H2 System.Boolean Gas level over limit
PPMStatus.C2H6 System.Single Gas level over limit
PPMStatus.H2 System.Single Gas level over limit
PPMStatus.O2 System.Single Gas level over limit
PPMStatus.CH4 System.Single Gas level over limit
PPMStatus.CO System.Single Gas level over limit
PPMStatus.TDCG System.Single Total Dissolved Combustible Gas level over limit
PPM.CO2 System.Single Latest gas level in oil
PPM.C2H4 System.Single Latest gas level in oil
PPM.C2H2 System.Single Latest gas level in oil
PPM.C2H6 System.Single Latest gas level in oil
PPM.H2 System.Single Latest gas level in oil
PPM.O2 System.Single Latest gas level in oil
PPM.CH4 System.Single Latest gas level in oil
PPM.CO System.Single Latest gas level in oil
PPM.N2 System.Single Latest gas level in oil
PPM.TDCG System.Single Latest TDCG level in oil
PPM.THC System.Single Latest THC gas level in oil
ROCStatus.CO2 System.Boolean Rate of Change for gas level over limit
ROCStatus.C2H4 System.Boolean Rate of Change for gas level over limit
ROCStatus.C2H2 System.Boolean Rate of Change for gas level over limit
ROCStatus.C2H6 System.Boolean Rate of Change for gas level over limit
ROCStatus.H2 System.Boolean Rate of Change for gas level over limit
ROCStatus.O2 System.Boolean Rate of Change for gas level over limit
ROCStatus.CH4 System.Boolean Rate of Change for gas level over limit
ROCStatus.CO System.Boolean Rate of Change for gas level over
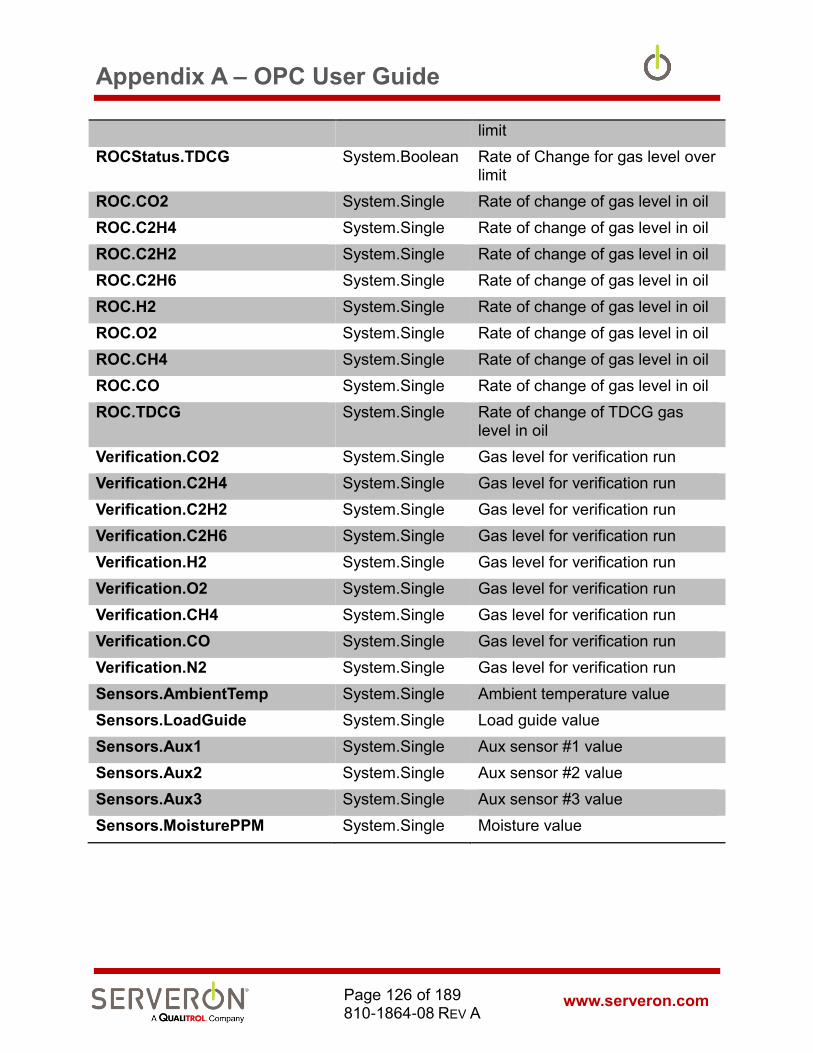
Appendix A – OPC User Guide
www.serveron.com Page 126 of 189 810-1864-08 REV A
limit
ROCStatus.TDCG System.Boolean Rate of Change for gas level over limit
ROC.CO2 System.Single Rate of change of gas level in oil
ROC.C2H4 System.Single Rate of change of gas level in oil
ROC.C2H2 System.Single Rate of change of gas level in oil
ROC.C2H6 System.Single Rate of change of gas level in oil
ROC.H2 System.Single Rate of change of gas level in oil
ROC.O2 System.Single Rate of change of gas level in oil
ROC.CH4 System.Single Rate of change of gas level in oil
ROC.CO System.Single Rate of change of gas level in oil
ROC.TDCG System.Single Rate of change of TDCG gas level in oil
Verification.CO2 System.Single Gas level for verification run
Verification.C2H4 System.Single Gas level for verification run
Verification.C2H2 System.Single Gas level for verification run
Verification.C2H6 System.Single Gas level for verification run
Verification.H2 System.Single Gas level for verification run
Verification.O2 System.Single Gas level for verification run
Verification.CH4 System.Single Gas level for verification run
Verification.CO System.Single Gas level for verification run
Verification.N2 System.Single Gas level for verification run
Sensors.AmbientTemp System.Single Ambient temperature value
Sensors.LoadGuide System.Single Load guide value
Sensors.Aux1 System.Single Aux sensor #1 value
Sensors.Aux2 System.Single Aux sensor #2 value
Sensors.Aux3 System.Single Aux sensor #3 value
Sensors.MoisturePPM System.Single Moisture value

Appendix B – ODBC User Guide
www.serveron.com Page 127 of 189 810-1864-08 REV A
ODBC Overview
ODBC Output
TM View Standard
TM View Enterprise
Plug-in
This document describes how to configure and use the ODBC interface of the TM View software.
This document provides complete information on how to publish data polled from the monitors supported by TM View.
The Serveron Extended Poller is a component of the TM View application software, and is responsible for collecting data from on-line monitors. The Poller stores the acquired data in the central database.
The TM View application software must be configured to export polled data using ODBC. The exported data will only be ‘new’ polling data. If the database already contains monitor data collected before the ODBC configuration is set, that older data will not be published on the ODBC interface.
When a user defines one or more ODBC clients (i.e., an ODBC source accessible to the system hosting the poller and defined by its connection string), the system will export the data obtained by the poller to the clients defined.
Most often, an ODBC source is a database created in an RDBMS (Access, SQL, Oracle, etc..) supporting the ODBC interface, but it can be an Excel file or even a text file.
IMPORTANT: The ODBC interface is a function of the Serveron Extended Poller, which is only installed in the Server configuration of TM View.
Intended Audience
The intended audience for this user guide consists of:
• Software developers with some knowledge of ODBC and SQL, who want to export the data collected by the TM View Poller to an ODBC source.
• Integrators with ODBC experience who want to set up a connection between the Serveron Poller and an ODBC data source that they intend to contain all or some of the data collected by the poller.
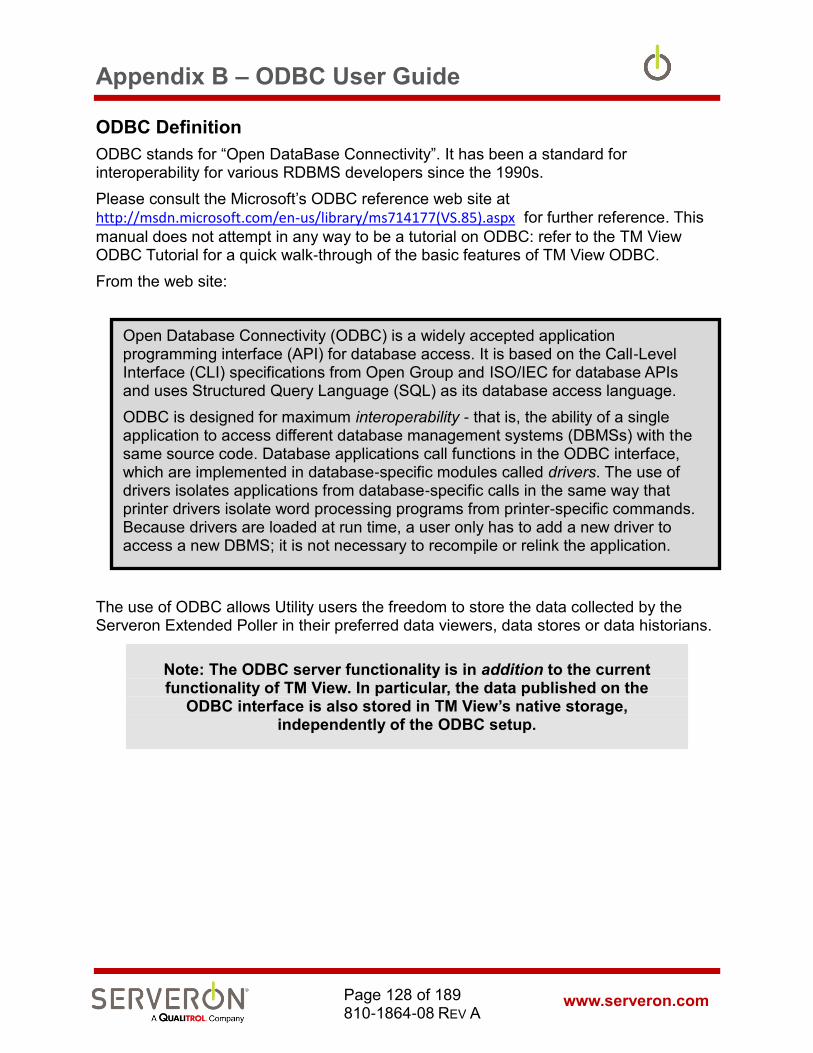
Appendix B – ODBC User Guide
www.serveron.com Page 128 of 189 810-1864-08 REV A
ODBC Definition
ODBC stands for “Open DataBase Connectivity”. It has been a standard for interoperability for various RDBMS developers since the 1990s.
Please consult the Microsoft’s ODBC reference web site at http://msdn.microsoft.com/en-us/library/ms714177(VS.85).aspx for further reference. This
manual does not attempt in any way to be a tutorial on ODBC: refer to the TM View ODBC Tutorial for a quick walk-through of the basic features of TM View ODBC.
From the web site:
The use of ODBC allows Utility users the freedom to store the data collected by the Serveron Extended Poller in their preferred data viewers, data stores or data historians.
Note: The ODBC server functionality is in addition to the current functionality of TM View. In particular, the data published on the
ODBC interface is also stored in TM View’s native storage, independently of the ODBC setup.
Open Database Connectivity (ODBC) is a widely accepted application programming interface (API) for database access. It is based on the Call-Level Interface (CLI) specifications from Open Group and ISO/IEC for database APIs and uses Structured Query Language (SQL) as its database access language.
ODBC is designed for maximum interoperability - that is, the ability of a single application to access different database management systems (DBMSs) with the same source code. Database applications call functions in the ODBC interface, which are implemented in database-specific modules called drivers. The use of drivers isolates applications from database-specific calls in the same way that printer drivers isolate word processing programs from printer-specific commands. Because drivers are loaded at run time, a user only has to add a new driver to access a new DBMS; it is not necessary to recompile or relink the application.

Appendix B – ODBC User Guide
www.serveron.com Page 129 of 189 810-1864-08 REV A
AlarmService
Power
SERVERONR
TMx
Poller
AlarmService
Power
SERVERONR
TMx
AlarmService
Power
SERVERONR
TMx
AlarmService
Power
SERVERONR
TMx
……..
Gas PPM data, Sensors
MS SQL MS Access
Oracle Historian
Speadsheet
Figure 58 – ODBC server data flow
Each time a monitor is polled by TM View, the data is published on the ODBC interface.
The user can define multiple clients, so the data is exported to more than a single ODBC source.
ODBC Functionality Overview
The ODBC output from TM View is intended to allow users saving some specific data items from each sampling run to a data repository of their choice and design, as long as they support the ODBC interface.
TM View’s ODBC interface offers a way by which users can save every sampling run data to any repository supporting ODBC, every time a monitor is polled.
ODBC-compatible repositories can be any of:
- Text files
- MS-Excel (versions 97-2003, 2007) spreadsheets
- MS Access databases
- MS-SQL databases (SQL 2000, SQL 2005 SQL 2008, SQL Express 2005, SQL Express 2008)

Appendix B – ODBC User Guide
www.serveron.com Page 130 of 189 810-1864-08 REV A
- MySQL databases
- PostGresSQL databases
- Oracle databases
- PI Historian. PI Historian is using a specialized database, and knowledge of the PI Historian database layout may be necessary. Contact OSI (“http://www.osisoft.com/”) for more information.
With TM View’s ODBC interface, a user can quickly set up the Serveron Extended Poller to send all new data from on-line monitors to a properly configured ODBC repository.
TM View can output the following information to an ODBC repository:
- Polling information
o Polling time: time (in PC local time) at which the monitor was polled
o Monitor information: serial number, unique identifier
o Asset information: region, substation and transformer names
- Sample records Whole records (in string form) for PPM, Rate of Change, Goodness of Fit and External Sensors. Data from Verification runs is not available.
- Data items from specific records
o Sample time: The exact sample time (in UTC time) at which the oil analysis was done
o PPM values, Rate of Change values, sensor values from any sampling run.
References
• TM View Software User's Manual.pdf
• MSDN ODBC reference at http://msdn.microsoft.com/en-us/library/ms714562(VS.85).aspx
• Google Search for “ODBC Tutorial”
• Google Search for “ODBC Reference”

Appendix B – ODBC User Guide
www.serveron.com Page 131 of 189 810-1864-08 REV A
System Configuration Configuring ODBC for a TM View system is done in 4 steps, only 3 of which are done with TM View.
1. Configure an ODBC data source. This is done outside of TM View. We will only describe here the requirements for the data source in order for TM View to be able to connect to it.
2. Create/Modify the TM View ODBC configuration to manage one or more ODBC clients. An ODBC client is a connection to a distinct ODBC data source which will receive the data collected by TM View.
3. Create/Modify one or more entries for each client. An entry corresponds to a distinct ODBC command which will be sent to the ODBC data source. It can be a table command (SQL syntax: INSERT INTO) or a stored procedure command if the data source supports stored procedures (it may be difficult, if not impossible to get these to execute on an Excel data source). If the user desires to store data in different tables in a data source, the solution is either to send all the data to a stored procedure which will write it in the appropriate tables or to create several entries, each of which will write table to a separate table.
4. Poll monitors. This will export data to the data sources defined.
Note: ODBC sends lists of parameters and column names to the target designated by the user. Some of the parameter values can be
expressed as text, and contain floating point values.
However, various languages use different characters for the list separator and decimal point separator (for example, comma and period, respectively, in English, vs. semi-colon and comma, respectively, in German). Because of this difference, it is imperative that the ODBC client (TM View) and the ODBC server (SQL, Excel, etc..) operate in the same Windows locale and culture. Cross-culture systems are not supported.
For example, if the TM View Poller runs on a system with a German version of Windows, it can only save data to a German version of MS-SQL, running on a German version of Windows. Using a German TM View to save data to MS-SQL running on an English version of Windows will not work.
Configure a Data Source
Data sources can take many forms: Excel, text files, MS-Access, MS-SQL server, Oracle, etc…
Setting up a data source consists in making sure that it can execute the commands that TM View will address to it when ODBC is configured on TM View.
On Excel, it means setting up the table with the columns that the user wants to fill with DGA data.
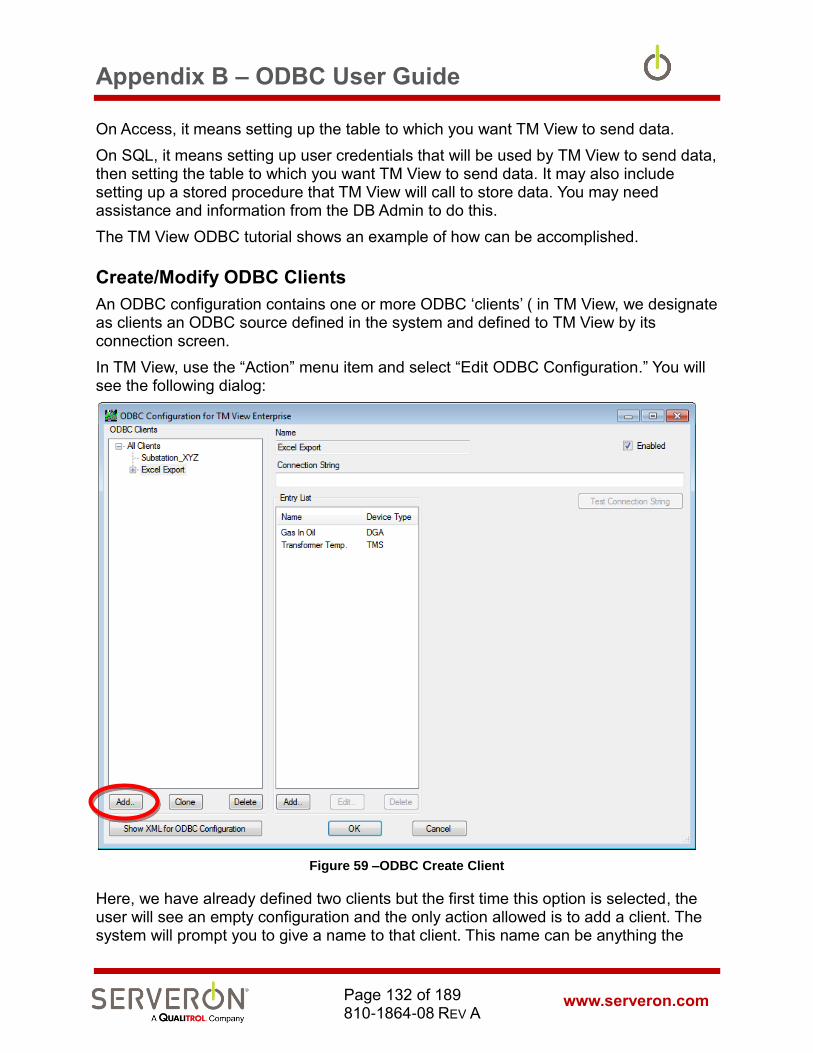
Appendix B – ODBC User Guide
www.serveron.com Page 132 of 189 810-1864-08 REV A
On Access, it means setting up the table to which you want TM View to send data.
On SQL, it means setting up user credentials that will be used by TM View to send data, then setting the table to which you want TM View to send data. It may also include setting up a stored procedure that TM View will call to store data. You may need assistance and information from the DB Admin to do this.
The TM View ODBC tutorial shows an example of how can be accomplished.
Create/Modify ODBC Clients
An ODBC configuration contains one or more ODBC ‘clients’ ( in TM View, we designate as clients an ODBC source defined in the system and defined to TM View by its connection screen.
In TM View, use the “Action” menu item and select “Edit ODBC Configuration.” You will see the following dialog:
Figure 59 –ODBC Create Client
Here, we have already defined two clients but the first time this option is selected, the user will see an empty configuration and the only action allowed is to add a client. The system will prompt you to give a name to that client. This name can be anything the

Appendix B – ODBC User Guide
www.serveron.com Page 133 of 189 810-1864-08 REV A
user wants. The recommendation is to use a sensible name that accurately describes the data source target, such as “Maintenance records – Excel,” for example, if the ODBC client is an Excel spreadsheet.
Figure 60 – Client Name
Once created, the client must be given a connection string. Indeed, it is the connection string which defines the client.
See the sections below for the connection strings corresponding to different types of ODBC clients.
The “Show XML for ODBC configuration” button displays the XML representation of the ODBC configuration. The configuration is stored in a file called “odbc.xml” in the common application data directory. The user can make backups of this file and compare different versions.
Configuring an Excel Client
• Excel 2007 Connection string (for a file with .xlsx extension): Driver={Microsoft Excel Driver (*.xls, *.xlsx, *.xlsm, *.xlsb)};DBQ=C:\OdbcExcel.slxs;Readonly=0;HDR=1
• Excel 97-2007 Connection string (for a file with .xls extension) Driver={Microsoft Excel Driver (*.xls)};DriverId=790;Dbq=C:\OdbcExcel.xls;readonly=false;HDR=1
Users will have to replace the file name “C:\OdbcExcel.xls” (after the DBQ parameter) with the path to their own Excel file.
After entering the connection string, click the “Test Connection String” button to check that TM View can find the data source.
Configuring an MS-SQL Client
The connection string looks like this (replace user name and password with the one you created, if different) for a SQL server instance on a computer with IP address 10.0.2.37 (yours will certainly be different):
Server=10.0.2.37;Database=PowerDB;UId=Serveron;Pwd=Tm3Tm8;Driver={SQL Server};

Appendix B – ODBC User Guide
www.serveron.com Page 134 of 189 810-1864-08 REV A
The name of the database should also be replaced with whenever name is used for your database.
Configuring an MS-Access Client
The connection string is:
• Access 2003 Connection string: Driver={Microsoft Access Driver (*.mdb)};DBQ=C:\MyDatabase.mdb
• Access 2007 Connection string: Driver={Microsoft Access Driver (*.accdb)};DBQ=C:\MyDatabase.mdb
Create/Modify ODBC Entries
Each ODBC client can have more than one entry. Each entry will define a distinct command which will be sent to the ODBC client for execution.
Commands can be seen and managed in the right-hand section of the ODBC editor:
Figure 61 – Create ODBC Entry
Initially, the only action allowed is to Add a client (1).
1 2

Appendix B – ODBC User Guide
www.serveron.com Page 135 of 189 810-1864-08 REV A
The system will prompt for a name for that client. The name must be unique among the ODBC clients.
Once the client has been created, the user must create entries for it (2). First TM View will prompt the user for the type of monitor. All entries can only contain data fields from a single monitor.
Then TM View will prompt the user for an entry name.
The user must enter the same name as the name for the table or stored procedure configured in the data source. Table or Procedure names must not contain spaces, or any other characters than letters, numbers and underscores.
Note that in the tree view on the left, the entries for a client appear as children of the client node:
After creating the entry, the user can double-click on that entry name or click on the “Edit” button to define the entry.
The user can double click of the tree-view child node, or on the entry name in the entries list on the right or single-click on the edit button to edit an entry.
All three actions will result in a new dialog popping up, allowing editing the ODBC entry just created..
The entry editor dialog allows the user managing the details of that ODBC entry:
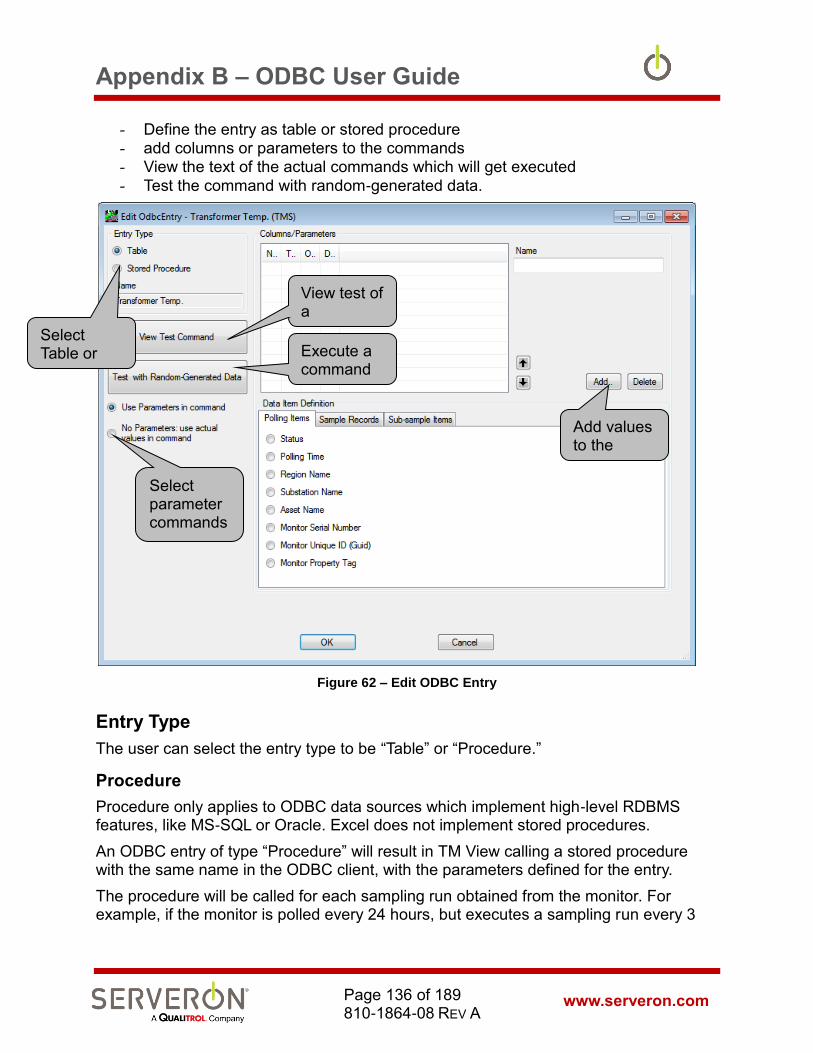
Appendix B – ODBC User Guide
www.serveron.com Page 136 of 189 810-1864-08 REV A
- Define the entry as table or stored procedure - add columns or parameters to the commands - View the text of the actual commands which will get executed
- Test the command with random-generated data.
Figure 62 – Edit ODBC Entry
Entry Type
The user can select the entry type to be “Table” or “Procedure.”
Procedure
Procedure only applies to ODBC data sources which implement high-level RDBMS features, like MS-SQL or Oracle. Excel does not implement stored procedures.
An ODBC entry of type “Procedure” will result in TM View calling a stored procedure with the same name in the ODBC client, with the parameters defined for the entry.
The procedure will be called for each sampling run obtained from the monitor. For example, if the monitor is polled every 24 hours, but executes a sampling run every 3
Select Table or Procedure
View test of a command
Execute a command with ‘fake’
Select parameter commands or actual
Add values to the command
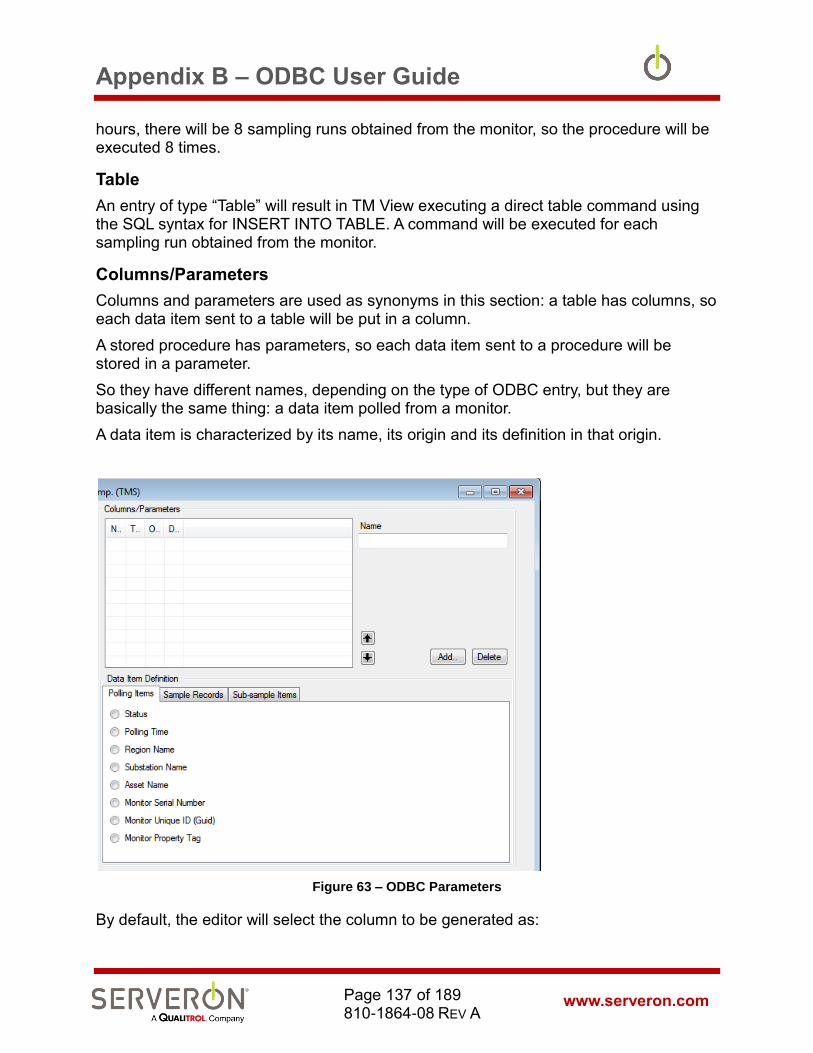
Appendix B – ODBC User Guide
www.serveron.com Page 137 of 189 810-1864-08 REV A
hours, there will be 8 sampling runs obtained from the monitor, so the procedure will be executed 8 times.
Table
An entry of type “Table” will result in TM View executing a direct table command using the SQL syntax for INSERT INTO TABLE. A command will be executed for each sampling run obtained from the monitor.
Columns/Parameters
Columns and parameters are used as synonyms in this section: a table has columns, so each data item sent to a table will be put in a column.
A stored procedure has parameters, so each data item sent to a procedure will be stored in a parameter.
So they have different names, depending on the type of ODBC entry, but they are basically the same thing: a data item polled from a monitor.
A data item is characterized by its name, its origin and its definition in that origin.
Figure 63 – ODBC Parameters
By default, the editor will select the column to be generated as:
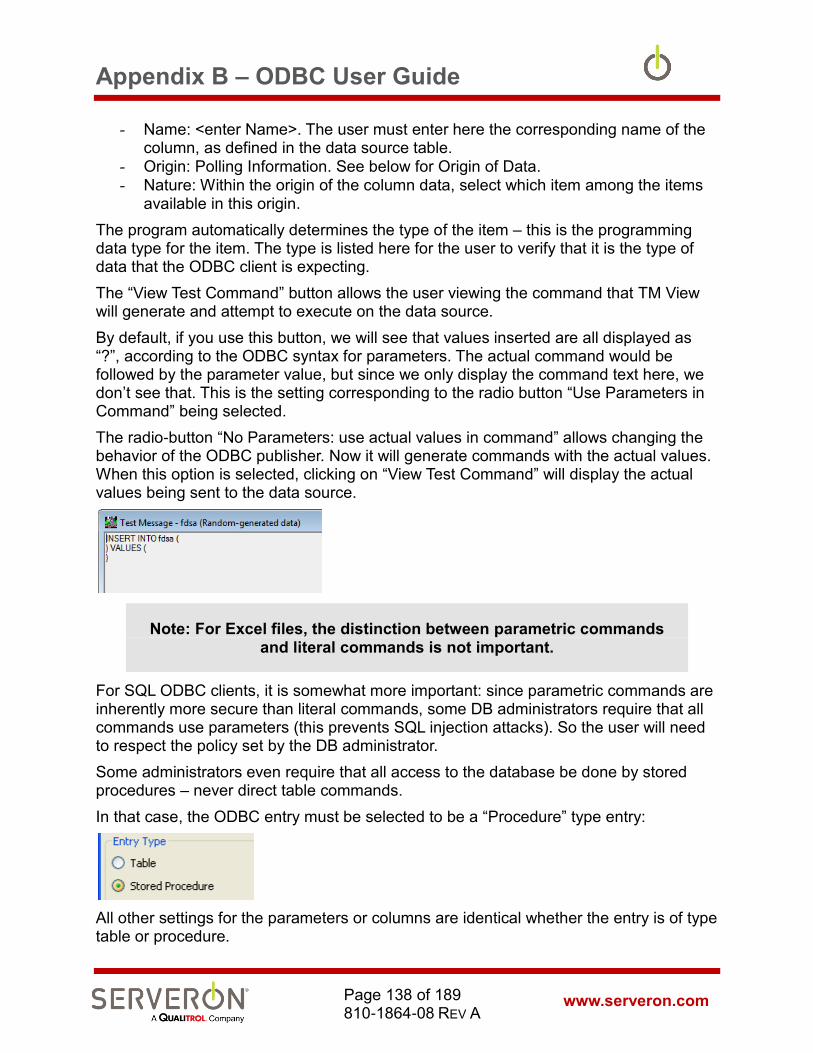
Appendix B – ODBC User Guide
www.serveron.com Page 138 of 189 810-1864-08 REV A
- Name: <enter Name>. The user must enter here the corresponding name of the column, as defined in the data source table.
- Origin: Polling Information. See below for Origin of Data. - Nature: Within the origin of the column data, select which item among the items
available in this origin.
The program automatically determines the type of the item – this is the programming data type for the item. The type is listed here for the user to verify that it is the type of data that the ODBC client is expecting.
The “View Test Command” button allows the user viewing the command that TM View will generate and attempt to execute on the data source.
By default, if you use this button, we will see that values inserted are all displayed as “?”, according to the ODBC syntax for parameters. The actual command would be followed by the parameter value, but since we only display the command text here, we don’t see that. This is the setting corresponding to the radio button “Use Parameters in Command” being selected.
The radio-button “No Parameters: use actual values in command” allows changing the behavior of the ODBC publisher. Now it will generate commands with the actual values. When this option is selected, clicking on “View Test Command” will display the actual values being sent to the data source.
Note: For Excel files, the distinction between parametric commands and literal commands is not important.
For SQL ODBC clients, it is somewhat more important: since parametric commands are inherently more secure than literal commands, some DB administrators require that all commands use parameters (this prevents SQL injection attacks). So the user will need to respect the policy set by the DB administrator.
Some administrators even require that all access to the database be done by stored procedures – never direct table commands.
In that case, the ODBC entry must be selected to be a “Procedure” type entry:
All other settings for the parameters or columns are identical whether the entry is of type table or procedure.
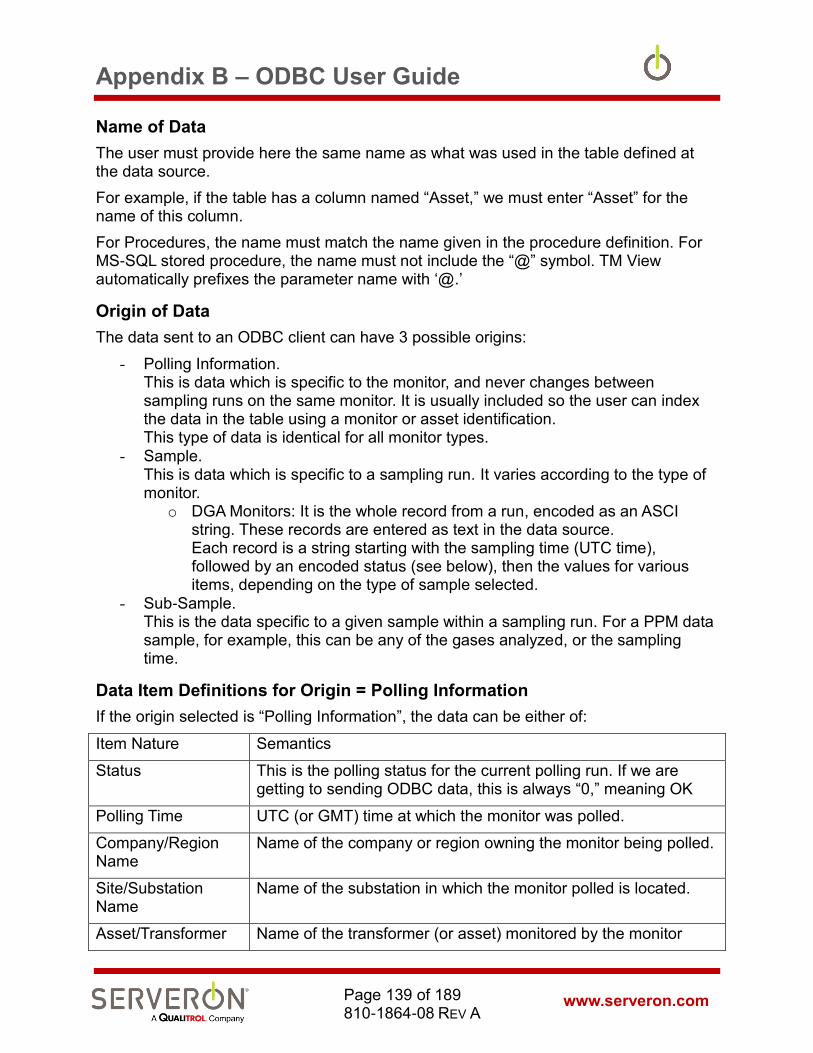
Appendix B – ODBC User Guide
www.serveron.com Page 139 of 189 810-1864-08 REV A
Name of Data
The user must provide here the same name as what was used in the table defined at the data source.
For example, if the table has a column named “Asset,” we must enter “Asset” for the name of this column.
For Procedures, the name must match the name given in the procedure definition. For MS-SQL stored procedure, the name must not include the “@” symbol. TM View automatically prefixes the parameter name with ‘@.’
Origin of Data
The data sent to an ODBC client can have 3 possible origins:
- Polling Information. This is data which is specific to the monitor, and never changes between sampling runs on the same monitor. It is usually included so the user can index the data in the table using a monitor or asset identification. This type of data is identical for all monitor types.
- Sample. This is data which is specific to a sampling run. It varies according to the type of monitor.
o DGA Monitors: It is the whole record from a run, encoded as an ASCI string. These records are entered as text in the data source. Each record is a string starting with the sampling time (UTC time), followed by an encoded status (see below), then the values for various items, depending on the type of sample selected.
- Sub-Sample. This is the data specific to a given sample within a sampling run. For a PPM data sample, for example, this can be any of the gases analyzed, or the sampling time.
Data Item Definitions for Origin = Polling Information
If the origin selected is “Polling Information”, the data can be either of:
Item Nature Semantics
Status This is the polling status for the current polling run. If we are getting to sending ODBC data, this is always “0,” meaning OK
Polling Time UTC (or GMT) time at which the monitor was polled.
Company/Region Name
Name of the company or region owning the monitor being polled.
Site/Substation Name
Name of the substation in which the monitor polled is located.
Asset/Transformer Name of the transformer (or asset) monitored by the monitor

Appendix B – ODBC User Guide
www.serveron.com Page 140 of 189 810-1864-08 REV A
being polled.
Monitor Serial Number
A string designating a monitor, as assigned at the factory when shipping the monitor. It is usually something like “TM8001234” or other such number.
Monitor Unique ID This is a unique identifier, used only within TM View usually, providing a ‘more unique’ identifier than the serial number.
DGA Data Item Definitions for Origin =Sample
If the origin selected is “Sample,” the data can either of:
Item Nature Semantics
PPM Record This is the complete record, in text format, of the GAS ppm in a given sampling run. This contains the gases analyzed by this particular type of monitor, the sampling time, and a status string. For TM1, TM2 and TM3, the fields corresponding to the gases not analyzed by these monitor types will contain the value 0 (zero)
ROC Record Rate of Change Record from the current sampling run. This is the complete record.
External Sensors Record
This is the complete record which contains the values for ambient temperature, load guide, tank pressures and auxiliary 4-20 mA inputs.
The PPM records contain a status string, which is a concatenation of different status words. The only ones with any significance to a normal user are the first four.
They contains in hex format, groups of 4 bits, in which we only care about the values 0 to 6, with the following meaning:
• 0: NO_ALARM;
• 1: HI_ALARM;
• 2: HI_CAUTION;
• 3: LO_CAUTION;
• 4: LO_ALARM;
• 5: INVALID;
• 6: ADMIN_OFF;
In order from the least significant bits of word 0 to most significant bits of word 3, the meanings of each group are:
Word Alarm states
Word 0 H2
O2
CH4

Appendix B – ODBC User Guide
www.serveron.com Page 141 of 189 810-1864-08 REV A
CO
CO2
C2H6
C2H4
C2H2
Word 1 C3H8 (unused)
N2 (unused)
TDCG
H2 ROC
O2 ROC
CH4 ROC
CO ROC
CO2 ROC
Word 2 C2H6 ROC
C2H4 ROC
C2H2 ROC
C3H8 ROC (unused)
N2 ROC (unused)
TDCG ROC
Ambient Temp
Load Guide
Word 3 Aux 1
Aux 2
Aux 3
Moisture ppm
DGA Data Item definition for Origin = Sub-Sample
The Sub-Sample data items can vary in function of which record they are selected from.
They can come from each of the sample record types listed above, and depending on that types, they can be:

Appendix B – ODBC User Guide
www.serveron.com Page 142 of 189 810-1864-08 REV A
Note: Only the data records generated from a monitor’s sampling runs are available. Calibration and Verification runs data is not
available for ODBC output.
Note: All Record Time data items are expressed in Coordinated Universal Time (UTC or GMT).
PPM Record data items
Item Semantics
RecordTime UTC time at which the sample analysis was run
H2-C2H2 Actual ppm value for each gas analyzed
TDCG Ppm value, sum of all combustible gases (C2H2+C2H4+C2H6+Co+CH4+H2)
THC Ppm value, sum of all HydroCarbon gases
Status Multi-word status, format described above.
PPM records are not present for verification runs.
ROC Record data items
Item Semantics
RecordTime UTC time at which the sample analysis was run
H2-C2H2 Actual rate of change value for each gas analyzed, in ppm/day
TDCG ROC value, sum of all combustible gases (C2H2+C2H4+C2H6+Co+CH4+H2)
Status Multi-word status, format described above – validity is unknown for ROC record.
ROC records are not present for verification runs.
External Sensors Record data items
Item Semantics
RecordTime UTC time at which the sample analysis was run
LoadGuide Value for Load Guide, 0-100
AmbientTemp Ambient temperature in the monitor enclosure in Celsius.

Appendix B – ODBC User Guide
www.serveron.com Page 143 of 189 810-1864-08 REV A
Aux1-3 Value of the 4-20 mA inputs of the monitor. The values are scaled between the minimum (4 mA Value) and the maximum (20 mA value) defined when the monitor is configured by the installation technician (using the TM Configuration Utility).
CalTankPres Pressure of the calibration tank in PSI (Pound per Square Inch)
HeliumSupplyPres Pressure in the Helium tank in PSI
MoisturePPM Calculated Moisture in the oil in ppm (when the option is present)
OilTemp Temperature of the oil (when the option is present)
Validity Validity flags for each of the external sensors. This is a mask field. When a bit is set it means that the corresponding external sensor value is valid. A value of 0 means that the sensor value is invalid.
Bit 0: Aux 1
Bit 1: Aux 2
Bit 2: Aux3
Bit 3 : Helium pressure
Bit 4 : Calibration tank pressure
Bit 5 : LoadGuide
Bit 6 : Ambient temp
Bit 7 : Moisture is valid
A validity of 255 means that all sensor values are valid. A value of less than 255 means that some of the external sensors are either not connected or are failing.

Appendix C – ODBC Tutorial
www.serveron.com Page 144 of 189 810-1864-08 REV A
ODBC Tutorial: Introduction
ODBC
TM View Standard
TM View Enterprise
Plug-in
This document provides a guided walk-through of the steps used to configure and use the ODBC interface of the TM View software.
IMPORTANT: The ODBC interface is a function of the Serveron Extended Poller, which is only installed in the Server configurations of TM View. Therefore, the ODBC interface is only available on Server configurations of the TM View application software.
Intended Audience
The intended audience for this tutorial consists of:
• Utility personnel who want to see an example of what the ODBC output of TM View can give them and want to see how to make such an example work for them.
• Software developers with some knowledge and experience with ODBC and SQL, and who want to familiarize themselves with how ODBC works in TM View.
References
• TM View Software User's Manual.pdf
• Microsoft ODBC reference at http://msdn.microsoft.com/en-us/library/ms714562(VS.85).aspx

Appendix C – ODBC Tutorial
www.serveron.com Page 145 of 189 810-1864-08 REV A
System Configuration Configuring ODBC for a TM View system is done in 4 steps, 3 of which are done with TM View.
1. Configure an ODBC data source. This is done outside of TM View. We will only describe here the requirements for the data source in order for TM View to be able to connect to it.
2. Create/Modify the TM View ODBC configuration to manage one or more ODBC clients. An ODBC client is a connection to a distinct ODBC data source which will receive the data collected by TM View.
3. Create/Modify one or more entries for each client. An entry corresponds to a distinct ODBC command which will be sent to the ODBC data source. It can be a table command (SQL syntax: INSERT INTO) or a stored procedure command, if the data source supports stored procedures (it may be difficult, if not impossible to get these to execute on an Excel data source). If the user desires to store data in different tables in a data source, the solution is either to send all the data to a stored procedure which will write it in the appropriate tables, or to create several entries, each of which will write table to a separate table.
4. Poll monitors. This will export data to the data sources defined.
Data Flow The use of ODBC allows Utility users the ability to store the data collected by the Serveron Extended Poller in their own data stores of data historians, so they can use any specific or proprietary application to access this data, should they desire services not offered by the TM View viewer.
Note: The ODBC server functionality is in addition to the current functionality of TM View. In particular, the data published on the
ODBC interface is also stored in TM View’s native storage, independently of the ODBC setup.
In this tutorial, we will cover the steps used to configure TM View to send data to an Excel spreadsheet, then to an MS-Access database, then to a data base implemented in an instance of MS-SQL Server (SQL Server 2005, in this case).

Appendix C – ODBC Tutorial
www.serveron.com Page 146 of 189 810-1864-08 REV A
AlarmService
Power
SERVERONR
TMx
Poller
AlarmService
Power
SERVERONR
TMx
AlarmService
Power
SERVERONR
TMx
AlarmService
Power
SERVERONR
TMx
……..
Gas PPM data, Sensors
MS SQL MS Access
Oracle Historian
Speadsheet
Figure 64 – ODBC server data flow
Each time a monitor is polled by TM View, the data is published on the ODBC interface.
The user can define multiple clients, so the data is exported to more than a single ODBC source.
Configure a Data Source
Configure an Excel Data source.
A data source is simply created by creating a spreadsheet (or workbook) document. The formats supported are Excel 97-2003 (*.xls) and Excel 2007 (*.xlsx).
For our example, we will call this file “OdbcExcel.xls” and locate it at the C: root. The complete path to the file will be “C:\OdbcExcel.xls”.
However, a data source is never just used by itself for ODBC: ODBC commands will be addressed at tables defined within the data source.
To that effect, the user must define tables in the document. These tables will have the same names as the corresponding entries defined in TM View for this particular ODBC client. We will show here an example for one table.

Appendix C – ODBC Tutorial
www.serveron.com Page 147 of 189 810-1864-08 REV A
Defining a table in Excel consists in entering header names for a set of columns in a spreadsheet and assign that range a name.
For example:
Here, we have typed the names for some columns and selected all the names.
Important: Column names should not contain spaces.
The next step is to define a name here (for Excel 2007, select the ‘Formulas’ tab, then “Define Name”)
In this case, we are defining a table called “MyTable” which has 12 columns for asset name, monitor serial number, the sample time (time at which a sampling run was done), 8 DGA gases and the Total Dissolved Combustible Gas value.
Note: Table names should not contain spaces.
Then close the file – that’s it! It is ready to receive some data created or collected by TM View.
Configuring an MS-Access data source
This assumes that you have installed MS Access on your system.

Appendix C – ODBC Tutorial
www.serveron.com Page 148 of 189 810-1864-08 REV A
1. Create or open an Access 2003 or Access 2007 database and create a table in it, naming the table “MyTable.” Table names should not contain spaces. Column names should not contain spaces or any characters other than letter, underscore and numbers.
2. Open the table in Design View and add all the columns required. Column names should not contain spaces. In our case we will add the same columns we added to Excel, with types defined as below:
Column Name Type Description
Asset Text Transformer Name
Monitor Text Monitor serial number
SampleTime Date/Time Time at which the sampling run was made
H2 Number Hydrogen ppm
O2 Number Oxygen ppm
CH4 Number Methane ppm
CO Number Carbon monoxide ppm
CO2 Number Carbon dioxide ppm
C2H6 Number Ethane ppm
C2H4 Number Ethylene ppm
C2H2 Number Acetylene ppm
TDCG Number Total Dissolved Combustible gases ppm
Note: Record Sampling times are expressed in Coordinated
Universal Time (UTC, or GMT).
3. Save the table and the database - that’s all that’s needed to set up the data source.
Configure an MS-SQL data source, SQL Server
In order to complete this step, you must have DB Admin access to an instance of MS-SQL Server, or you can submit a script to the DB Admin to create the table.
1. Create or open a SQL database and create a table in it. The table name will be “MyTable.” Table names should not contain spaces. Column names should not contain spaces or any characters other than letter, underscore and numbers.

Appendix C – ODBC Tutorial
www.serveron.com Page 149 of 189 810-1864-08 REV A
The table columns will be as follows (Column names should not contain spaces):
Column Name Type Description
Asset VarChar(128) Transformer Name
Monitor VarChar(128) Monitor serial number
SampleTime Datetime Time at which the sampling run was made
H2 Float Hydrogen ppm
O2 Float Oxygen ppm
CH4 Float Methane ppm
CO Float Carbon monoxide ppm
CO2 Float Carbon dioxide ppm
C2H6 Float Ethane ppm
C2H4 Float Ethylene ppm
C2H2 Float Acetylene ppm
TDCG Float Total Dissolved Combustible gases ppm
TDCG Number Total Dissolved Combustible gases ppm
Note: Record Sampling times are expressed in Coordinated
Universal Time (UTC, or GMT).
2. For SQL server, you will also have to decide on a security model: trusted domain or SQL authentication. In this example we will define a SQL authentication: define a user called “Serveron”, with a password “Tm8Tm3.” Create a user with these credentials in the database instance. Add this user to the users list of your database, then to ‘public’ role of the database. Make sure that the ‘public’ role has access to the table you created,
3. That’s it – you have setup the SQL data source.
Create/Modify ODBC Clients
An ODBC configuration for TM View contains one or more ODBC ‘clients’ (in TM View, we designate as clients an ODBC source defined in the system and defined to TM View by its connection string).

Appendix C – ODBC Tutorial
www.serveron.com Page 150 of 189 810-1864-08 REV A
In TM View, use the “Tools” menu item and select “Edit ODBC Configuration”. You will see the following dialog:
Here we have already defined two clients, but the first time this option is selected, the user will see an empty configuration and the only action allowed is to add a client. The system will prompt you to give a name to that client. This name can be anything the user wants. The recommendation is to use a sensible name that accurately describes the data source target, such as “Maintenance records – Excel” for example, if the ODBC client is an Excel spreadsheet.
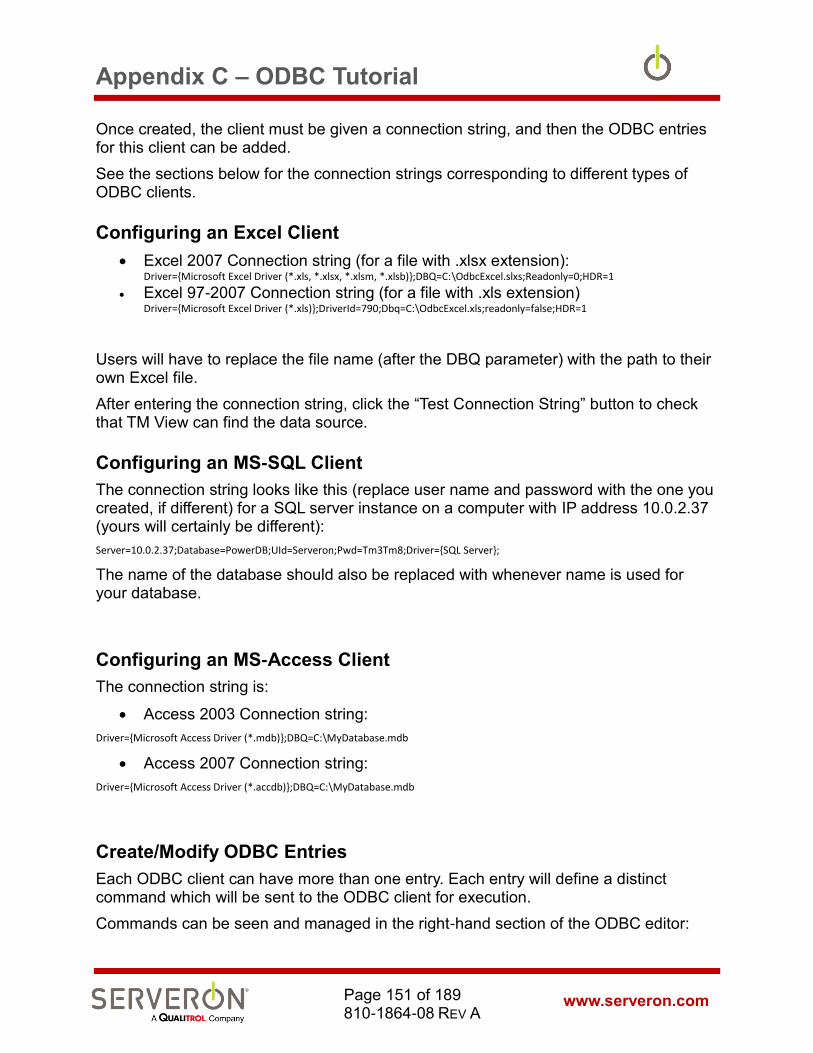
Appendix C – ODBC Tutorial
www.serveron.com Page 151 of 189 810-1864-08 REV A
Once created, the client must be given a connection string, and then the ODBC entries for this client can be added.
See the sections below for the connection strings corresponding to different types of ODBC clients.
Configuring an Excel Client
• Excel 2007 Connection string (for a file with .xlsx extension): Driver={Microsoft Excel Driver (*.xls, *.xlsx, *.xlsm, *.xlsb)};DBQ=C:\OdbcExcel.slxs;Readonly=0;HDR=1
• Excel 97-2007 Connection string (for a file with .xls extension) Driver={Microsoft Excel Driver (*.xls)};DriverId=790;Dbq=C:\OdbcExcel.xls;readonly=false;HDR=1
Users will have to replace the file name (after the DBQ parameter) with the path to their own Excel file.
After entering the connection string, click the “Test Connection String” button to check that TM View can find the data source.
Configuring an MS-SQL Client
The connection string looks like this (replace user name and password with the one you created, if different) for a SQL server instance on a computer with IP address 10.0.2.37 (yours will certainly be different):
Server=10.0.2.37;Database=PowerDB;UId=Serveron;Pwd=Tm3Tm8;Driver={SQL Server};
The name of the database should also be replaced with whenever name is used for your database.
Configuring an MS-Access Client
The connection string is:
• Access 2003 Connection string:
Driver={Microsoft Access Driver (*.mdb)};DBQ=C:\MyDatabase.mdb
• Access 2007 Connection string:
Driver={Microsoft Access Driver (*.accdb)};DBQ=C:\MyDatabase.mdb
Create/Modify ODBC Entries
Each ODBC client can have more than one entry. Each entry will define a distinct command which will be sent to the ODBC client for execution.
Commands can be seen and managed in the right-hand section of the ODBC editor:

Appendix C – ODBC Tutorial
www.serveron.com Page 152 of 189 810-1864-08 REV A
Initially, the only action allowed is to Add an entry.
The system will prompt for a name for that entry. The user must enter the same name as the name for the table or stored procedure configured in the data source. In our case, the name is “MyTable”:
Now that it has been created, double-click on the entry name in the Entries list or in the ODBC Client tree to edit it.
We will add all the columns we setup in our data source: for each parameter, we click on the “Add” button and setup the properties for the column.

Appendix C – ODBC Tutorial
www.serveron.com Page 153 of 189 810-1864-08 REV A
1. Add the parameter by clicking “Add” as shown above. 2. Enter the name of the column. 3. Select the Origin of the column according to the table below. 4. Select the Data Item definition according to the table below.
Column Name Origin Data Item Definition
Asset Polling Information
Asset Name
Monitor Polling Information
Monitor Serial Number
SampleTime Sub-Sample: record detail
PPM Record
Field Name: PpmData.RecordTime
H2 Sub-Sample: record detail
PPM Record
Field Name: PpmData.H2

Appendix C – ODBC Tutorial
www.serveron.com Page 154 of 189 810-1864-08 REV A
O2 Sub-Sample: record detail
PPM Record
Field Name: PpmData.O2
CH4 Sub-Sample: record detail
PPM Record
Field Name: PpmData.CH4
CO Sub-Sample: record detail
PPM Record
Field Name: PpmData.CO
CO2 Sub-Sample: record detail
PPM Record
Field Name: PpmData.CO2
C2H6 Sub-Sample: record detail
PPM Record
Field Name: PpmData.C2H6
C2H4 Sub-Sample: record detail
PPM Record
Field Name: PpmData.C2H4
C2H2 Sub-Sample: record detail
PPM Record
Field Name: PpmData.C2H2
TDCG Sub-Sample: record detail
PPM Record
Field Name: PpmData.TDCG
Note: Record Sampling times are expressed in Coordinated
Universal Time (UTC, or GMT).
After we’re done, the screen should look like this:
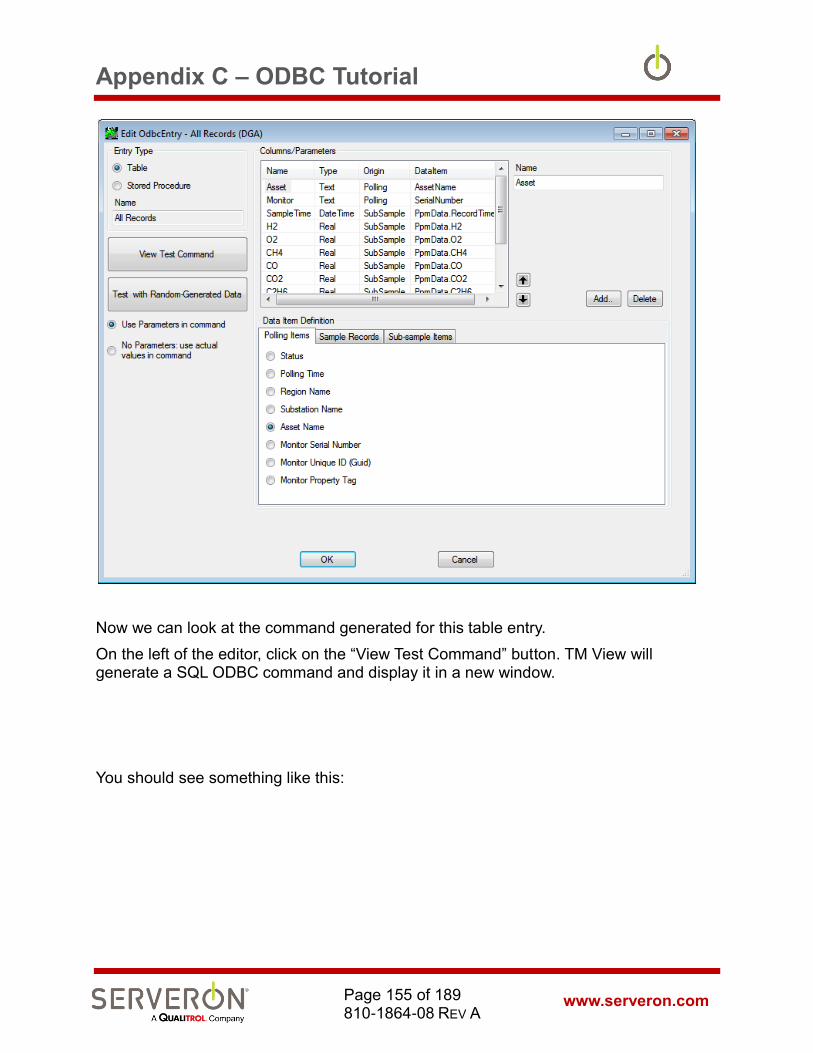
Appendix C – ODBC Tutorial
www.serveron.com Page 155 of 189 810-1864-08 REV A
Now we can look at the command generated for this table entry.
On the left of the editor, click on the “View Test Command” button. TM View will generate a SQL ODBC command and display it in a new window.
You should see something like this:
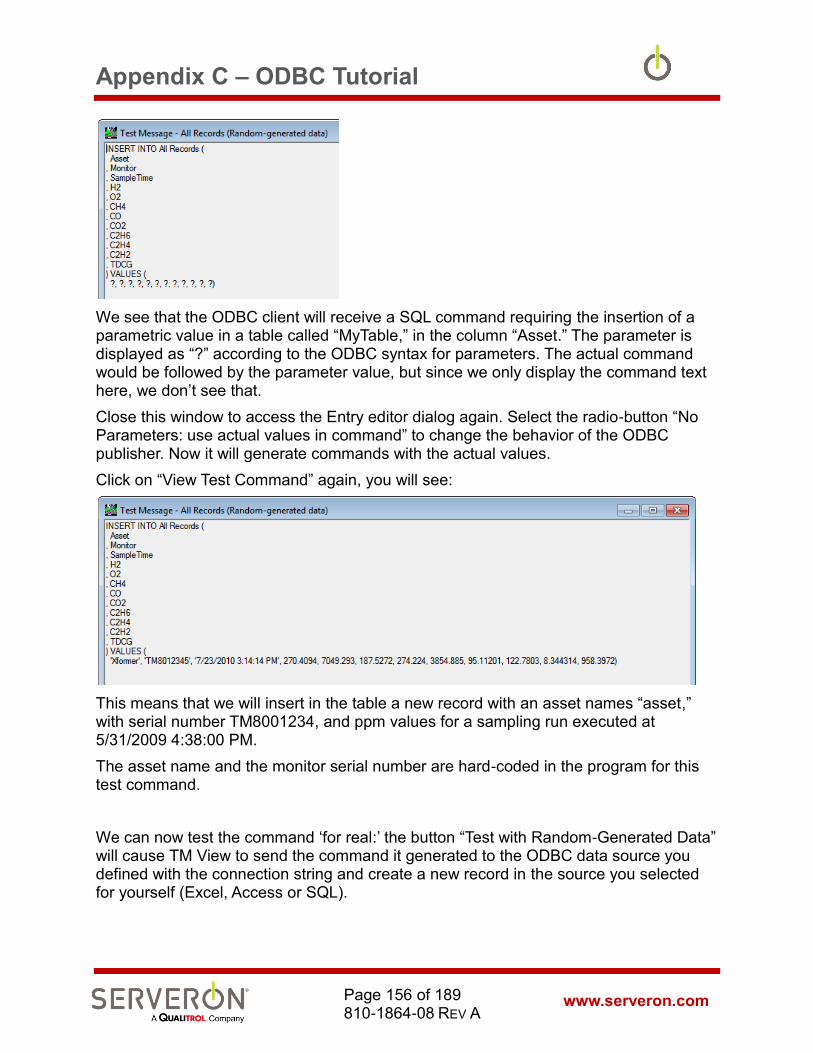
Appendix C – ODBC Tutorial
www.serveron.com Page 156 of 189 810-1864-08 REV A
We see that the ODBC client will receive a SQL command requiring the insertion of a parametric value in a table called “MyTable,” in the column “Asset.” The parameter is displayed as “?” according to the ODBC syntax for parameters. The actual command would be followed by the parameter value, but since we only display the command text here, we don’t see that.
Close this window to access the Entry editor dialog again. Select the radio-button “No Parameters: use actual values in command” to change the behavior of the ODBC publisher. Now it will generate commands with the actual values.
Click on “View Test Command” again, you will see:
This means that we will insert in the table a new record with an asset names “asset,” with serial number TM8001234, and ppm values for a sampling run executed at 5/31/2009 4:38:00 PM.
The asset name and the monitor serial number are hard-coded in the program for this test command.
We can now test the command ‘for real:’ the button “Test with Random-Generated Data” will cause TM View to send the command it generated to the ODBC data source you defined with the connection string and create a new record in the source you selected for yourself (Excel, Access or SQL).

Appendix C – ODBC Tutorial
www.serveron.com Page 157 of 189 810-1864-08 REV A
Note: For Excel, it is important to leave the Excel spreadsheet closed before executing a test command - otherwise there will be an access conflict accessing the file and TM View will not be able to write to the
spreadsheet.
For Access and SQL, you can leave open a view of the table.
If you wish, click the “Test with Random-Generated Data” button on the left. If there is an error, you will see a message box describing the exception. Unfortunately the ODBC exception reports are not very descriptive and a variety of different causes can result in the same error message. Check the connection string, then the name of the columns (they must match between the spreadsheet and the ODBC data items).
If the command succeeded you will see the following message box:
Open the spreadsheet, and you should see data like this where you defined the table “MyTable:”
Notice the little triangles at the top left of each numeric cell: it is an error notification from Excel telling us that the number was entered as a string.
A quick way around this problem is to select all the numeric columns (H2 to TDCG) and correct the error by telling Excel to convert them to number:
Appendix C – ODBC Tutorial
www.serveron.com Page 158 of 189 810-1864-08 REV A
Click on the yellow diamond with the exclamation mark ‘!’ under ‘SampleTime” and select “Convert to Number.” Before saving the file and exiting Excel, we should do the same thing to the SampleTime column: you will notice that the text for this first row begins with an apostrophe. ‘This marks this column as text. Remove the apostrophe and then save the file and exit.
Now send a 2nd test sample by clicking on the same button in TM View. You should get the same success report and if you open the spreadsheet you will see a 2nd row with all numbers and the SampleTime column will be in the DateTime format.
For Access and SQL, you can open a view of data table and refresh it after you execute a Test command – you should see the new row inserted in the table by TM View.
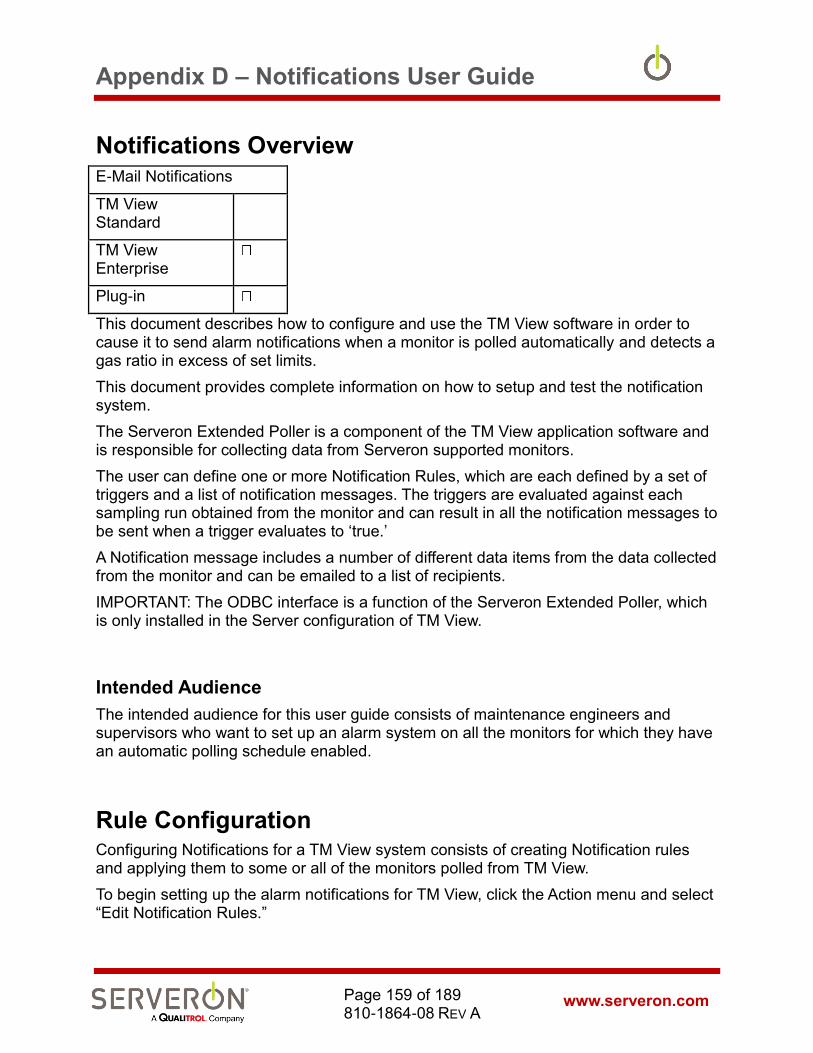
Appendix D – Notifications User Guide
www.serveron.com Page 159 of 189 810-1864-08 REV A
Notifications Overview
E-Mail Notifications
TM View Standard
TM View Enterprise
Plug-in
This document describes how to configure and use the TM View software in order to cause it to send alarm notifications when a monitor is polled automatically and detects a gas ratio in excess of set limits.
This document provides complete information on how to setup and test the notification system.
The Serveron Extended Poller is a component of the TM View application software and is responsible for collecting data from Serveron supported monitors.
The user can define one or more Notification Rules, which are each defined by a set of triggers and a list of notification messages. The triggers are evaluated against each sampling run obtained from the monitor and can result in all the notification messages to be sent when a trigger evaluates to ‘true.’
A Notification message includes a number of different data items from the data collected from the monitor and can be emailed to a list of recipients.
IMPORTANT: The ODBC interface is a function of the Serveron Extended Poller, which is only installed in the Server configuration of TM View.
Intended Audience
The intended audience for this user guide consists of maintenance engineers and supervisors who want to set up an alarm system on all the monitors for which they have an automatic polling schedule enabled.
Rule Configuration Configuring Notifications for a TM View system consists of creating Notification rules and applying them to some or all of the monitors polled from TM View.
To begin setting up the alarm notifications for TM View, click the Action menu and select “Edit Notification Rules.”
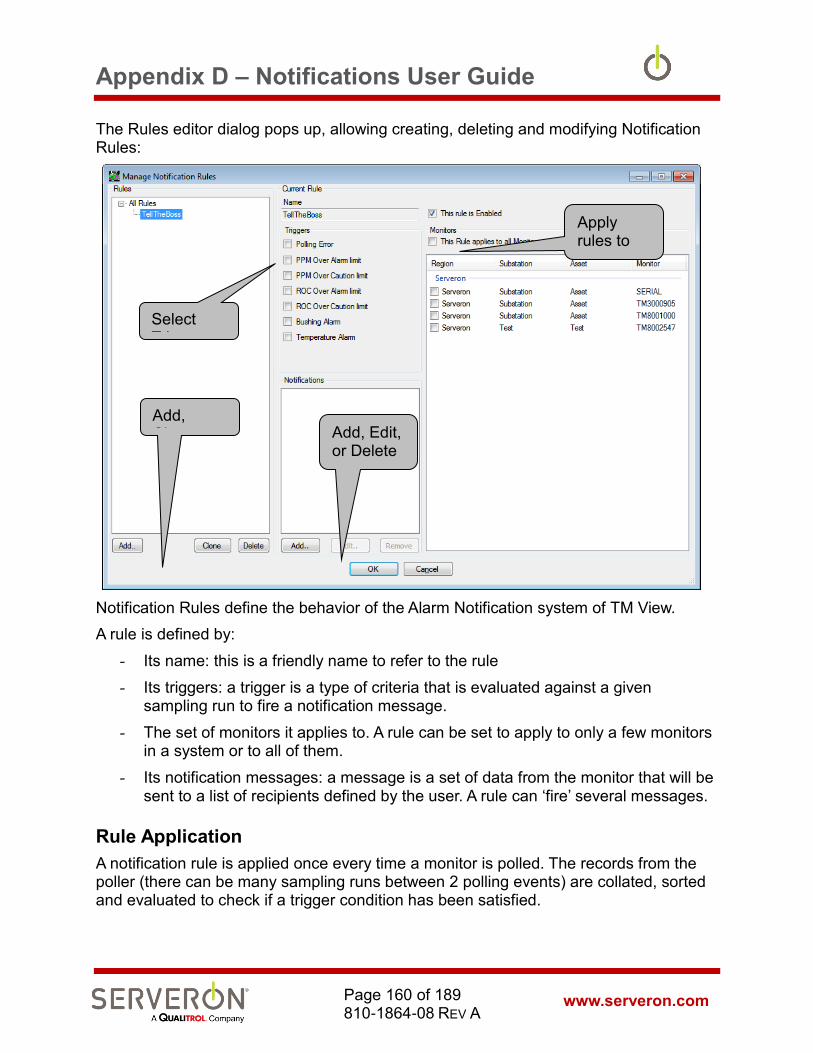
Appendix D – Notifications User Guide
www.serveron.com Page 160 of 189 810-1864-08 REV A
The Rules editor dialog pops up, allowing creating, deleting and modifying Notification Rules:
Notification Rules define the behavior of the Alarm Notification system of TM View.
A rule is defined by:
- Its name: this is a friendly name to refer to the rule
- Its triggers: a trigger is a type of criteria that is evaluated against a given sampling run to fire a notification message.
- The set of monitors it applies to. A rule can be set to apply to only a few monitors in a system or to all of them.
- Its notification messages: a message is a set of data from the monitor that will be sent to a list of recipients defined by the user. A rule can ‘fire’ several messages.
Rule Application
A notification rule is applied once every time a monitor is polled. The records from the poller (there can be many sampling runs between 2 polling events) are collated, sorted and evaluated to check if a trigger condition has been satisfied.
Select Triggers
Add, Clone, or delete rules
Add, Edit, or Delete Messages
Apply rules to the selected monitors.

Appendix D – Notifications User Guide
www.serveron.com Page 161 of 189 810-1864-08 REV A
For example, if a monitor is set up to run a gas analysis every 4 hours, a verification run every 3 days, and polled once a day, then every polling event will yield 6 sample runs and a verification run twice a week.
But the notification rules will be evaluated only once a day, when the monitor is polled.
The records are collated such that if a trigger condition is met by more than one sampling run, there will be only one evaluation of the rule: this is to avoid ‘spamming’ the recipients and ensures that a given recipient for a notification message will never receive two messages for the same monitor for the same polling event.
Create a Rule
By default, there are no notification rules in the system: the editor shows up empty. The only action allowed is to add a rule, done by clicking the “Add…” button at the lower left.
The program prompts the user for a name to refer to that rule – that is the name that will be displayed in the rules tree on the left. The user can enter any name desired. We recommend a sensible name that would help the user remember what are the intentions behind that rule.
Enable/Disable the rule
When a rule is created, it is enabled by default, but has no notification messages defined and applies to no monitor.
Usually, rules apply to all monitors, but it is conceivable that a rule may be created especially to pay close attention to a single monitor, with different criteria and messages than for all the monitors in a system. The special rule may be disabled when not in use, without having to delete it.
Select Criteria
The criteria for a rule can be any combination of:

Appendix D – Notifications User Guide
www.serveron.com Page 162 of 189 810-1864-08 REV A
• Polling Error. The notification will be sent when there is no data because of an error in the poller itself.
• PPM over Alarm Limit. There is at least one gas in one of the sampling runs collected for which the gas ppm exceeded the alarm limit for this gas.
• PPM over Caution Limit. There is at least one gas in one of the sampling runs collected for which the gas ppm exceeded the caution limit for this gas. Note that if the alarm limit was exceeded, the caution limit will not even be checked, but the trigger will still fire the rule.
• ROC over Alarm Limit. There is at least one gas in one of the sampling runs collected for which the Rate of Change (in ppm/day) exceeded the alarm limit for this gas.
• ROC over Caution Limit. There is at least one gas in one of the sampling runs collected for which the rate of change (in ppm/day) exceeded the caution limit for this gas. Note that if the alarm limit was exceeded, the caution limit will not even be checked, but the trigger will still fire the rule.
Figure 65 – Notifications Rules
Apply rules to the selected monitors.
Add a notification message.
Appendix D – Notifications User Guide
www.serveron.com Page 163 of 189 810-1864-08 REV A
Apply rules to monitors
By default, a rule applies to no monitors.
The possible options are:
- Apply to all Monitors. The rule is evaluated when any monitor in the tree is polled (even for manual polls). Check the “This Rule applies to all Monitors” check box.
- Apply to some selected monitors. The rule is evaluated only for the selected monitors (automatic or manual polls). Uncheck the “All Monitors” check box and check the check box for the individual monitors selected.
The “Company” and “Site” columns in the list of monitors are selectable, causing a sort of all the monitors in the list, grouping them by company or by site, allowing a quick selection of all monitors in a sub-station, for example.
Clone and Delete Rules
A rule can be deleted – this will cause the loss of all details entered for its definition, including the notification messages.
A rule can also be cloned: this will create a copy of the selected rule. The copy can then be modified: this option is useful if the user wants to create two rules that are very similar but differ by some small details.

Appendix D – Notifications User Guide
www.serveron.com Page 164 of 189 810-1864-08 REV A
Create Notification Messages
Once the rule has been created, its target monitors selected and its triggers defined, the user can define the notification messages for the rule.
More than one notification message can be created for a given rule. For example, a notification message can be built to be sent to supervisors and backup personnel when an alarm occurs and a second message built to be sent to active maintenance personnel. The two messages can have very different ‘payloads:’ a short summary for the supervisor and a fully detailed message to maintenance technicians.
By default, a rule has no message defined. The only action allowed is to add a message, using the “Add...” button under the Notifications list.
The program will prompt the user for a name for the new notification. The name must be unique within the scope of the rule, but it can be anything the user wants to call it within this limitation: we recommend a sensible name that is a good mnemonic for what the message represents.
Once a message is created, the user can either click the “Edit” button to edit the message, or double-click the notification name, or double the notification name that appears under the rule name in the tree-view on the left side of the rule editor. Either of these actions will pop up the Message Editor:

Appendix D – Notifications User Guide
www.serveron.com Page 165 of 189 810-1864-08 REV A
Figure 66 – Notifications Parameters
The message is defined by its payload and its recipients.
Recipients
The recipients are the destination email addresses to which the message will be sent when the rule triggers ‘fire.’ Only valid email addresses (including cell-phone texting and pager addresses) are accepted, separated by new line character, space, comma or semi-colon.
IMPORTANT NOTE ABOUT MESSAGE LENGTH:

Appendix D – Notifications User Guide
www.serveron.com Page 166 of 189 810-1864-08 REV A
Most cell phone carriers (and pagers) impose limitations over the length of the message. This limit is usually either 140 characters or 255 characters. TM View makes no check about the message length.
It is possible to build a notification that will be too long to be read entirely by some TEXT or pager recipients. It is up to the user to
verify that the message won’t be too long.
TM View offers a way to test the message using random-generated ‘fake’ data.
Payload
The payload is the content of the message: it will constitute the body of the email.
Two kinds of information can be included in the message body: Monitor Information and Sampling Data.
Monitor information
Monitor information can be any combination of
- Company/Region name: the company or region under which the substation is configured.
- Site/Substation Name: the name of the substation in which the transformer is located
- Asset Name: the name of the transformer on which the monitor is installed - Serial Number: the serial number of the monitor. - Status of Monitor: this will be a list of the triggers which fired to cause the
message to be sent. Example: “PPMAlarm, RocCaution” - A non-variable text (when enabled): this is a note entered by the user, which will
always be included in the message.
Sampling Data
Sampling Data can be any combination of the items below.
All notification data items will always include the time and date of the sampling run in which the event occurred.
The gas results displayed in a message will always be formatted as Comma-Separated values. This is a way that allows easy copying of the text in a text file. Use the .CSV extension with the file and import it in Excel if needed.
- All ppm results If any trigger condition is satisfied, ALL the ppm records from all the sampling runs collected in this polling event will be included in the message. This feature was included for completeness, but is not extremely useful, since it can be difficult to read all this text for one or two numbers over the limit.
- All Rate of Change results If any trigger condition is satisfied, ALL the ROC records from all the sampling

Appendix D – Notifications User Guide
www.serveron.com Page 167 of 189 810-1864-08 REV A
runs collected in this polling event will be included in the message. This feature was included for completeness, but is not extremely useful, since it can be difficult to read all this text for one or two numbers over the limit.
- Full ppm results with any gas over Alarm limits If any gas in a ppm record exceeds the alarm limit, the complete ppm record (just in this sampling run) will be included in the message. This allows getting the value of all gas ppm in the sampling run when the rule fires.
- Full ppm results with any gas over Caution limits If any gas in a ppm record exceeds the caution limit, the complete ppm record (just in this sampling run) will be included in the message. This allows getting the value of all gas ppm in the sampling run when the rule fires.
Note that if the ppm of any gas exceeds the alarm limit, the caution
limits will not be checked, but the rule will still fire.
- Full ROC results with any gas over Alarm limits If any gas in a ROC record exceeds the alarm limit, the complete ROC record (just in this sampling run) will be included in the message. This allows getting the value of all gas ROC in the sampling run when the rule fires.
- Full ppm results with any gas over Caution limits If any gas in a ROC record exceeds the caution limit, the complete ROC record (just in this sampling run) will be included in the message. This allows getting the value of all gas ROC in the sampling run when the rule fires.
Note that if the ROC of any gas exceeds the alarm limit, the caution
limits will not be checked, but the rule will still fire.
- Only Gas ppm over Alarm limits This is the most compact notification that can be sent: it will include only the name of the gas which exceeded the limit, the limit itself and the ppm value.
- Only Gas ROC over Alarm limits This will include the name of the gas whose ROC exceed the limit, the limit itself and the ROC value.
Testing the message
TM View offers three ways to check that the message matches the user requirements for a notification.
Show Message Text button
The user can generate a test message and view it as text.

Appendix D – Notifications User Guide
www.serveron.com Page 168 of 189 810-1864-08 REV A
The program generates a ‘fake’ polling record with 5 sampling runs and evaluates it against the rule, generating a random notification. The text of the message is displayed in a pop-up text window:
This example corresponds to a message payload with Site name, asset name, and ‘Only Gas ppm over Alarm limits.’
Send Test Message to Myself button
The user can generate a message as above, but will also be prompted to provide an email address (or cell phone TEXT email address). The message will be actually sent to that email address (instead of all the recipients).
This is the easiest way to check if a message is too long for text messages to pagers or cell phones.
Send Test Message to All Recipients
The user can generate a message as above and send it to all the recipients listed in the recipients list.
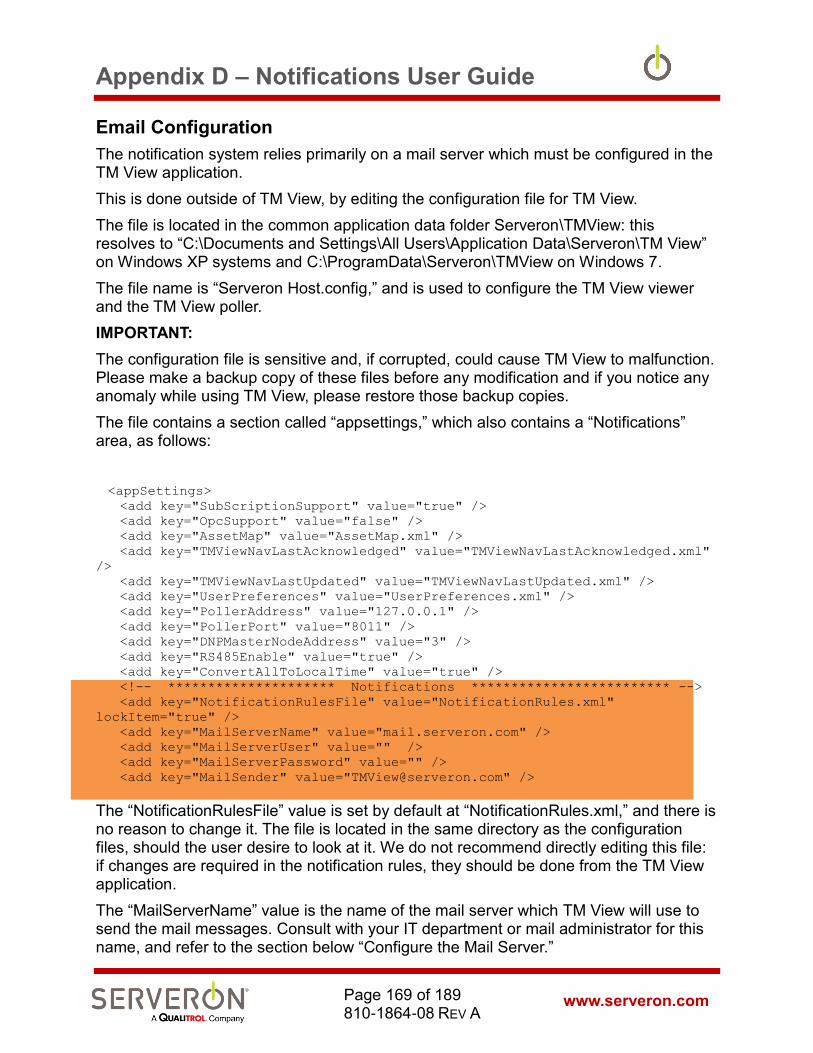
Appendix D – Notifications User Guide
www.serveron.com Page 169 of 189 810-1864-08 REV A
Email Configuration
The notification system relies primarily on a mail server which must be configured in the TM View application.
This is done outside of TM View, by editing the configuration file for TM View.
The file is located in the common application data folder Serveron\TMView: this resolves to “C:\Documents and Settings\All Users\Application Data\Serveron\TM View” on Windows XP systems and C:\ProgramData\Serveron\TMView on Windows 7.
The file name is “Serveron Host.config,” and is used to configure the TM View viewer and the TM View poller.
IMPORTANT:
The configuration file is sensitive and, if corrupted, could cause TM View to malfunction. Please make a backup copy of these files before any modification and if you notice any anomaly while using TM View, please restore those backup copies.
The file contains a section called “appsettings,” which also contains a “Notifications” area, as follows:
<appSettings>
<add key="SubScriptionSupport" value="true" />
<add key="OpcSupport" value="false" />
<add key="AssetMap" value="AssetMap.xml" />
<add key="TMViewNavLastAcknowledged" value="TMViewNavLastAcknowledged.xml"
/>
<add key="TMViewNavLastUpdated" value="TMViewNavLastUpdated.xml" />
<add key="UserPreferences" value="UserPreferences.xml" />
<add key="PollerAddress" value="127.0.0.1" />
<add key="PollerPort" value="8011" />
<add key="DNPMasterNodeAddress" value="3" />
<add key="RS485Enable" value="true" />
<add key="ConvertAllToLocalTime" value="true" />
<!-- ********************* Notifications ************************* -->
<add key="NotificationRulesFile" value="NotificationRules.xml"
lockItem="true" />
<add key="MailServerName" value="mail.serveron.com" />
<add key="MailServerUser" value="" />
<add key="MailServerPassword" value="" />
<add key="MailSender" value="[email protected]" />
The “NotificationRulesFile” value is set by default at “NotificationRules.xml,” and there is no reason to change it. The file is located in the same directory as the configuration files, should the user desire to look at it. We do not recommend directly editing this file: if changes are required in the notification rules, they should be done from the TM View application.
The “MailServerName” value is the name of the mail server which TM View will use to send the mail messages. Consult with your IT department or mail administrator for this name, and refer to the section below “Configure the Mail Server.”
Appendix D – Notifications User Guide
www.serveron.com Page 170 of 189 810-1864-08 REV A
The “MailSender” is the name which will appear in the “From” field of all notification messages. You can use any name that makes sense, but some restriction may apply if the mail server does not allow relaying messages. See below.
The MailServerUser and MailServerPassword are the credentials used by TM View to authenticate to the mail server, if necessary.
Configure the Mail Server
Consult with the email administrator for your company to get the name of the mail server. This is almost always the same server configured in the email client of any computer user in the company.
When you are using TM View to send test notifications, the program uses your credentials to access the mail server.
When TM View is in “Service” mode (i.e. no user logged on but the TM View Poller service is active), the messages will be sent with the poller using the credentials defined by MailServerUser and MailServerPassword.
Mail Relaying
If the mail server does not allow relaying email messages, the “MailSender” must be the same user defined for the mail server.
If the mail server allows mail relaying, then the “MailSender” value may be any name that makes sense to the user configuring the system, including [email protected]
(the default value).

Appendix E – Drilldown Client User Guide
www.serveron.com Page 171 of 189 810-1864-08 REV A
Drilldown Client
TM View Standard
TM View Enterprise
Plug-in
The Drilldown client is only supported in the TM View Enterprise Edition.
Drilldown: Overview The Drilldown client is a front-end to TM View Enterprise, allowing easy hierarchical navigation between the assets monitored by TM View. The intent is to look first at the corporate level, and enable the user to zero in quickly on the assets needing attention.
Asset Hierarchy
The assets in TM View are organized hierarchically: at the bottom there are the monitors, from which the TM View Poller collects data.
The monitors are attached to transformer assets and the transformers are grouped by substations.
The substations are contained within units called ‘regions’ or ‘companies.’ The result is that the users can organize the assets in TM View within geographic entities (regions and substations), then by functional entities within each substation (an entity being represented by a transformer).
Using the DrillDown Client When the program starts it displays a splash screen for a few seconds. Then the Drilldown client presents a view of the highest levels of the asset hierarchy (regions).
For example, let us assume that the asset configuration in TM View looks as follows:

Appendix E – Drilldown Client User Guide
www.serveron.com Page 172 of 189 810-1864-08 REV A
Figure 67 - Asset Configuration (TM View)
The Drilldown client original display will be as follows:
Figure 68 - DrillDown regional view

Appendix E – Drilldown Client User Guide
www.serveron.com Page 173 of 189 810-1864-08 REV A
Figure 69 - Regional view with issues
Figure 69 shows that there are monitors in the Northwest counties that have not been polled in over 24 hours, and at least one monitor has values over the alarm limits in the Southern region.
Each of the rectangles representing a region is an interactive display: The three disks imitate LEDs and represent an aspect of the status for all the monitors contained in the

Appendix E – Drilldown Client User Guide
www.serveron.com Page 174 of 189 810-1864-08 REV A
geographic entity represented by the button (region or substation). When the mouse hovers above the disks, a tool tip appears, giving an explanation of what the disk represents.
From left to right, the disks represent
- A compounded alarm/caution status of the DGA analysis: Green means all OK, Yellow means that some results are above the caution limit and Red means that some results are above the alarm limits.
- A compounded “Service Status” for all the monitors in that geographic entity. Only DGA monitors have a Service Status flag. Green means that all the monitors are working; blue means that some monitor(s) require service or maintenance.
- A compounded ‘data age’ status for all the monitors. Green means that all the monitors have been polled within the last 8 hours. Yellow means that some monitors have not been polled within 8 hours, but still within the last 24 hours. Red means that some monitors have not been polled in over 24 hours.
For all LED displays, a pale gray color means that there is no data and the status is unknown.
The whole rectangle is also a clickable object: if the user clicks anywhere within that rectangle, the view changes to a detail of just the entity represented by that button.
For example, if the user clicks on the “Southern” button, the view changes to the substation defined in that region:
Figure 70 - Southern Region view
In this case, the Dixie substation has some results above the alarm limits. Again, if the user clicks on one of the substation rectangles, the view will switch to showing the status for all transformers in that substation:

Appendix E – Drilldown Client User Guide
www.serveron.com Page 175 of 189 810-1864-08 REV A
Figure 71 - View of the Dixie substation
If the user clicks on a rectangle representing a transformer asset (for example, Dixie T1B, which has alarms), the view will change to a detailed view of that transformers with all the monitors attached to it represented:

Appendix E – Drilldown Client User Guide
www.serveron.com Page 176 of 189 810-1864-08 REV A
Figure 72 - Transformer Detailed View
This transformer is equipped with a Serveron TM8 DGA monitor (TM8000SAM.
When the user clicks on the numbers for a given result, a small call-out window appears, showing the alarm and caution limits for that gas.
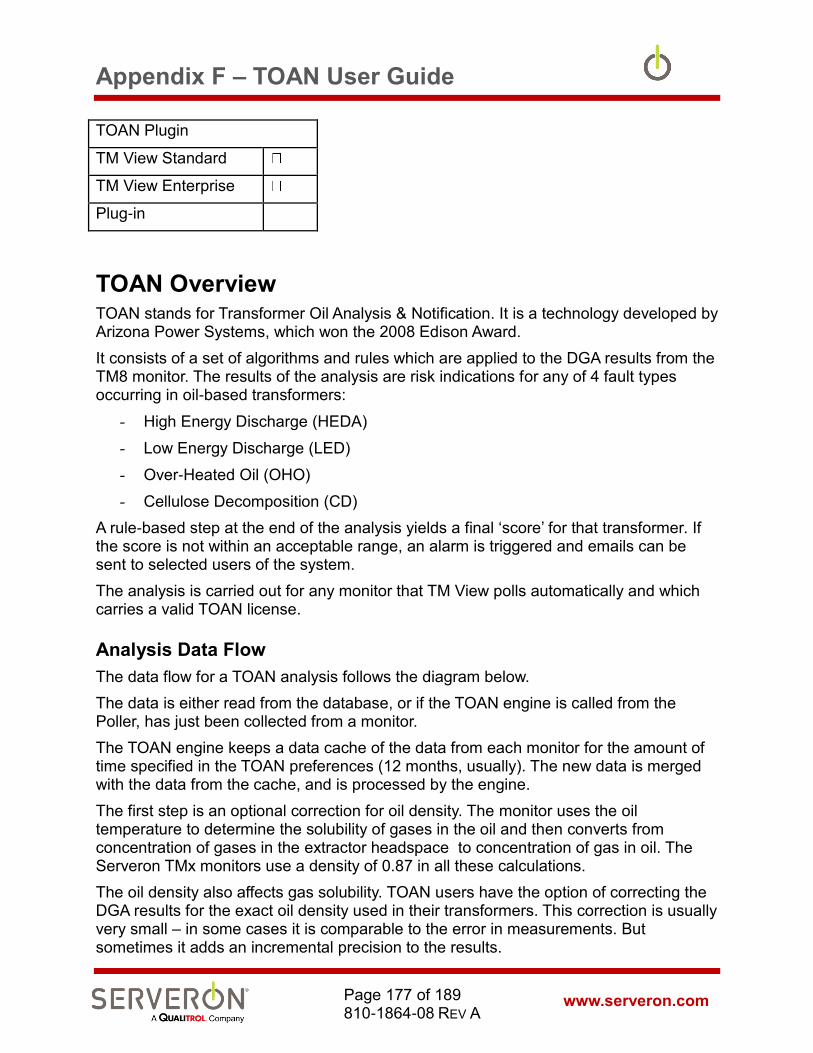
Appendix F – TOAN User Guide
www.serveron.com Page 177 of 189 810-1864-08 REV A
TOAN Plugin
TM View Standard
TM View Enterprise
Plug-in
TOAN Overview TOAN stands for Transformer Oil Analysis & Notification. It is a technology developed by Arizona Power Systems, which won the 2008 Edison Award.
It consists of a set of algorithms and rules which are applied to the DGA results from the TM8 monitor. The results of the analysis are risk indications for any of 4 fault types occurring in oil-based transformers:
- High Energy Discharge (HEDA)
- Low Energy Discharge (LED)
- Over-Heated Oil (OHO)
- Cellulose Decomposition (CD)
A rule-based step at the end of the analysis yields a final ‘score’ for that transformer. If the score is not within an acceptable range, an alarm is triggered and emails can be sent to selected users of the system.
The analysis is carried out for any monitor that TM View polls automatically and which carries a valid TOAN license.
Analysis Data Flow
The data flow for a TOAN analysis follows the diagram below.
The data is either read from the database, or if the TOAN engine is called from the Poller, has just been collected from a monitor.
The TOAN engine keeps a data cache of the data from each monitor for the amount of time specified in the TOAN preferences (12 months, usually). The new data is merged with the data from the cache, and is processed by the engine.
The first step is an optional correction for oil density. The monitor uses the oil temperature to determine the solubility of gases in the oil and then converts from concentration of gases in the extractor headspace to concentration of gas in oil. The Serveron TMx monitors use a density of 0.87 in all these calculations.
The oil density also affects gas solubility. TOAN users have the option of correcting the DGA results for the exact oil density used in their transformers. This correction is usually very small – in some cases it is comparable to the error in measurements. But sometimes it adds an incremental precision to the results.

Appendix F – TOAN User Guide
www.serveron.com Page 178 of 189 810-1864-08 REV A
The second step is an optional correction of the CO and CO2 concentrations for seasonal and daily variations. This correction is done using a harmonic regression over the last X months (by default, 12 months) of data from the monitor.
The next step is to calculate an accurate gassing rate, using the results of the previous 30 days and running a piece-wise linear regression on all gas concentrations.
The gassing rates and the gas concentrations are then used to compute a score for each of the faults being considered.
The gas concentrations are used in a neural network analysis to determine the relevancy of the score computed in the previous step.
Special rules are then applied to determine a final score for the transformer.

Appendix F – TOAN User Guide
www.serveron.com Page 179 of 189 810-1864-08 REV A
Serveron Poller
Monitors ServeronDB
ASTM Correction
Harmonic Regression for
CO, CO2
Use ASTM Correction?
No
Yes
Use Harmonic
Regression CO2?
No
Yes
Determine gassing rates
Run neural nets for each fault
type
Run Rule-based expert system
Combine all decisions
Fuzzy Logic
Is there an alarm?
NoENDEND
Yes
Send email to all recipients
Figure 73 - TOAN data flow (TOAN engine in red)
The user can then use the final score and the individual fault scores to assess the status of the transformer. The supporting data is presented on a specific TOAN result screen for each transformer.
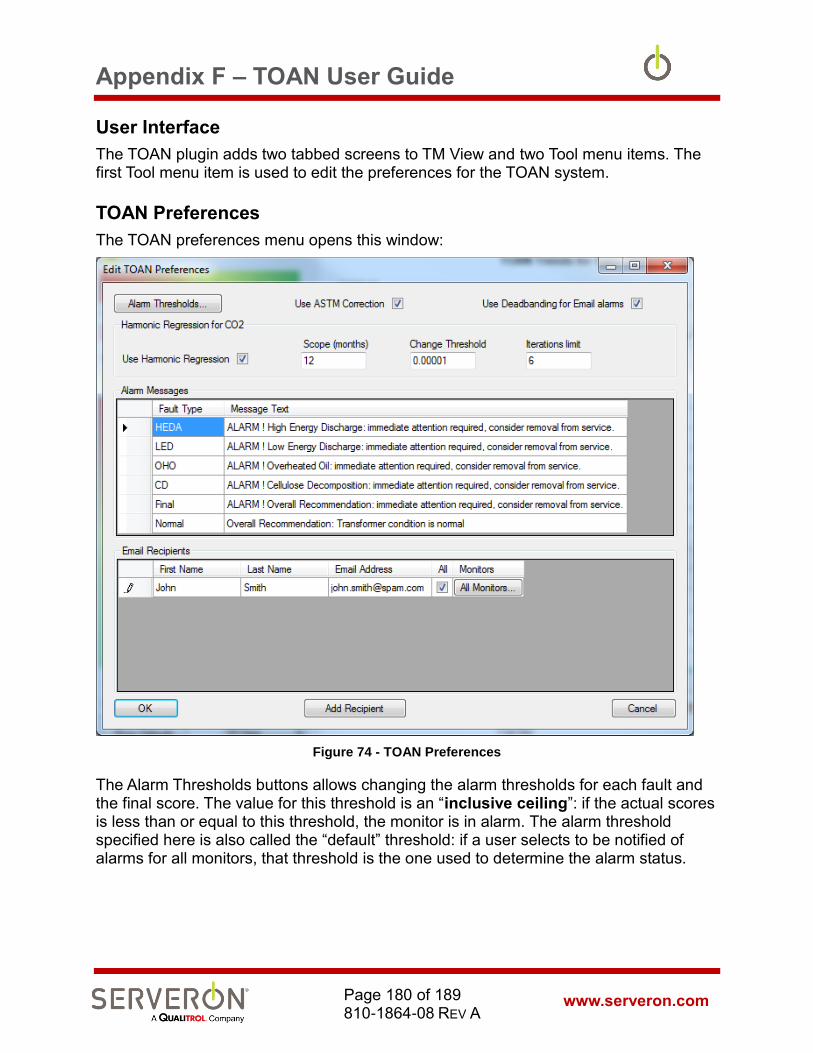
Appendix F – TOAN User Guide
www.serveron.com Page 180 of 189 810-1864-08 REV A
User Interface
The TOAN plugin adds two tabbed screens to TM View and two Tool menu items. The first Tool menu item is used to edit the preferences for the TOAN system.
TOAN Preferences
The TOAN preferences menu opens this window:
Figure 74 - TOAN Preferences
The Alarm Thresholds buttons allows changing the alarm thresholds for each fault and the final score. The value for this threshold is an “inclusive ceiling”: if the actual scores is less than or equal to this threshold, the monitor is in alarm. The alarm threshold specified here is also called the “default” threshold: if a user selects to be notified of alarms for all monitors, that threshold is the one used to determine the alarm status.

Appendix F – TOAN User Guide
www.serveron.com Page 181 of 189 810-1864-08 REV A
Figure 75 - TOAN Thresholds
The other preferences are:
- Use ASTM Correction: check this box ON to correct the gas concentration results for a different oil density. The Oil Density is entered in the “Edit Transformer Info” dialog (right-click on a transformer node and select “Edit Transformer Info”.
- Message for normal condition: the user can specify here what TOAN should display if there are no alarms.
- Harmonic Regression: Scope (months) is the number of months of data that TOAN will use for the harmonic regression algorithm. If TM View does not have that much data, it will use as much as it has.
- Harmonic Regression: Change Threshold. The harmonic regression algorithm iterates through the data a number of times, computing a corrected data set and an overall score at each iteration. The iteration cycle stops when two consecutive iterations differ in the score by less than this threshold.
- Harmonic Regression: Iterations limit. This is the maximum number of iterations done for the harmonic regression, regardless of the score.
- Alarm Messages: This grid allows the user to edit the alarm messages for each fault type. The message edited here will be displayed when there is an alarm of that type.
- Email Recipients: this grid allows the user to enter all the recipients who will be receiving alarm emails from the TOAN system. For each recipient, the user has the option to send an alarm for all monitors (the “all monitors” checkbox is checked), or to specify which monitors this recipient would be notified for alarms. If “All Monitors” is checked, the alarm threshold is specified in the general alarm thresholds, as defined above. Otherwise, the user can define for each monitor, whether the recipient will be notified and at which threshold the user would be notified for each monitor: in the figure below, 2 monitors are selected and one is using a higher threshold than the default alarm threshold.

Appendix F – TOAN User Guide
www.serveron.com Page 182 of 189 810-1864-08 REV A
Figure 76 - Select which monitors a user will be notified for
TOAN License Manager
The second Tool menu option allows reviewing the TOAN licenses for all monitors in the system. It will show a grid with the serial number of each monitor, the text for its TOAN license, if it has one, the expiration date and the validity of the license (is it valid, is it active?).
Figure 77 - TOAN License Manager
Each row in the grid is color coded:
- White (or window background) colored rows indicate a monitor that has no license and has never had any TOAN license.
- Red colored rows indicate monitors that have an expired license, or whose license will expire in less than 7 days
- Dark Gold colored rows indicate monitors whose license will expire in less than 30 days

Appendix F – TOAN User Guide
www.serveron.com Page 183 of 189 810-1864-08 REV A
- Light Gold colored rows indicate a monitor whose license will expire in less than 60 days
- Yellow colored rows indicate a monitor whose license will expire in less than 90 days
- Green colored rows indicate monitors whose license is good for at least the next 90 days.
The action buttons on this dialog allow to, respectively:
1. Export Summary This action will create an XML file with the location and name specified by the user. The file will contain the information necessary to order number of TOAN licenses at the same time (see licensing). That XML file should be emailed to the user by a Serveron representative; it is the supporting documentation to order new TOAN licenses. After the licenses have been ordered, Serveron personnel will create a similar file containing new valid licenses for all the monitors. That file will need to be imported and installed, as described below.
2. Print Summary This action will create an HTML version of the grid presented in the license manager and print it to the printer selected by the user.
3. Import licenses This action allows importing at once, all the licenses ordered in bulk as described in the “Export Summary” action. The licenses will be imported to the database, but will not be installed on the monitors.
4. Install Bulk Licenses (WARNING: This is a very lengthy operation!) This action will connect to all the monitors in the list with an active license (presumably after importing these licenses) and install the license in each of these monitors. After installation, each monitor with a valid license can be polled by any TM View installation using a different database. Those other TM View installations will be able to detect a valid TOAN license and run TOAN diagnostics on this monitor. If the licenses are not installed on the monitors, then only this installation of TM View will be able to run TOAN diagnostics on these monitors.
TOAN Summary
The first tabbed screen is added when a node of type root, region or substation is selected in the navigation tree. This tabbed screen shows a list of the monitors in the entity selected, with a summary of the TOAN analysis for each monitor. The data of the latest collected sample is shown – in regular colors if the sample is recent, on purple background if the sample is more than 24 hours old. Each row is shown on a red background if the monitor is in alarm.
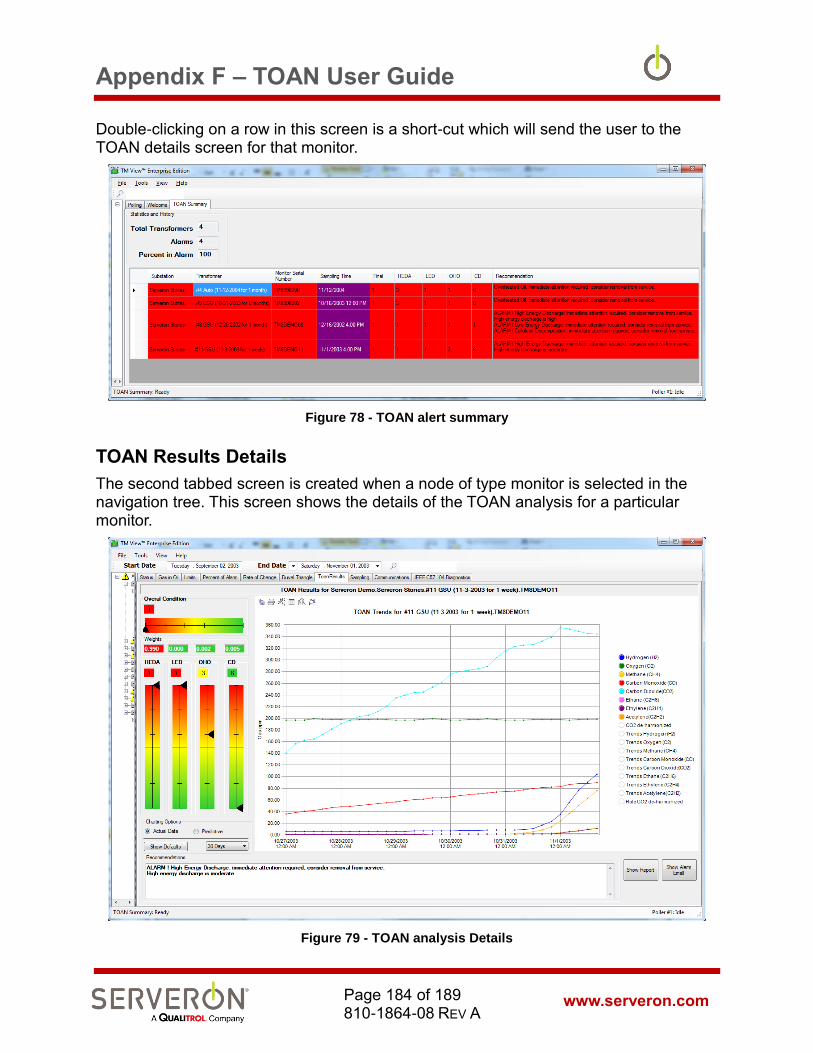
Appendix F – TOAN User Guide
www.serveron.com Page 184 of 189 810-1864-08 REV A
Double-clicking on a row in this screen is a short-cut which will send the user to the TOAN details screen for that monitor.
Figure 78 - TOAN alert summary
TOAN Results Details
The second tabbed screen is created when a node of type monitor is selected in the navigation tree. This screen shows the details of the TOAN analysis for a particular monitor.
Figure 79 - TOAN analysis Details

Appendix F – TOAN User Guide
www.serveron.com Page 185 of 189 810-1864-08 REV A
The screen shows on the upper left the final score and recommendation for the monitor, then the individual scores for each fault types.
The gauges are color coded from red (alarm) to green (no alarm), going through shades of red-orange and yellow-green in the middle. A value of 1 is the worst possible score (be very alarmed!) and a value of 6 means ‘no issue’.
The weight values represent the ANN scores for each fault type. These values are between 0 and 1 and represent likeliness for that type of fault, as determined by the neural network analysis. The weight can explain why a very bad score for a given fault can be downgraded by a low ANN weight. For example, a score of 2 can be ignored if the ANN weight is below 0.4.
The graph is a graph of the gas concentrations in PPM for the usual time range for that monitor (same as the ‘gas-in-oil’ graph). In addition, it shows the latest trend line for each gas, in the same color as the gas itself. For example, below we can see a close-up of the methane values and the most recent trend line for that gas.
Figure 80 – Gas ppm and trend line detail
Right-Click on data point on the chart
It may be useful to go back in time and look at the TOAN results for a monitor at a point in time before the current state. The users can right-click on a data point to cause a recalculation and display of the TOAN scores at that point in time. The data point can be selected on the chart itself, but it may be difficult to select the desired data point: the best method is to bring up the chart’s Data Editor table and select the column with the date and time desired. Right-clicking on that column will cause the calculation of the

Appendix F – TOAN User Guide
www.serveron.com Page 186 of 189 810-1864-08 REV A
TOAN scores up to that point and will change the display of the gauges and values (the chart will not change). The “Show Defaults” button will restore the display to the latest current data.
A pair of radio buttons at the lower left allow selecting to see the actual data, or a predictive trend for all gases. The predictive trend will show an interpolation of the current trend for each gas, projected in the future for the specified amount of time (as selected in the combo box below the ‘predictive’ button).
Finally, the user can click on the gauges for each fault type: this will highlight that gauge in blue and will set the graphic chart to only display the gases that are relevant for that fault type: these are the gases used for the risk score computed for each fault type. The image below shows the gases used for the HEDA fault (H2 and C2H2), and their trends. The “Show Defaults” button will restore the display to a normal state.
Figure 81 – Selecting a fault type gauge to show the associated gases
The text box at the bottom will show the text recommendation for that monitor. It is either the normal condition message or one or more of the alarm messages.
Two buttons at the lower right allow to see either a printable report for this analysis (without charts), or an example of email that would be sent out if the monitor was in alarm.
Email Notification
The TOAN plugin features an automatic email alarm system.
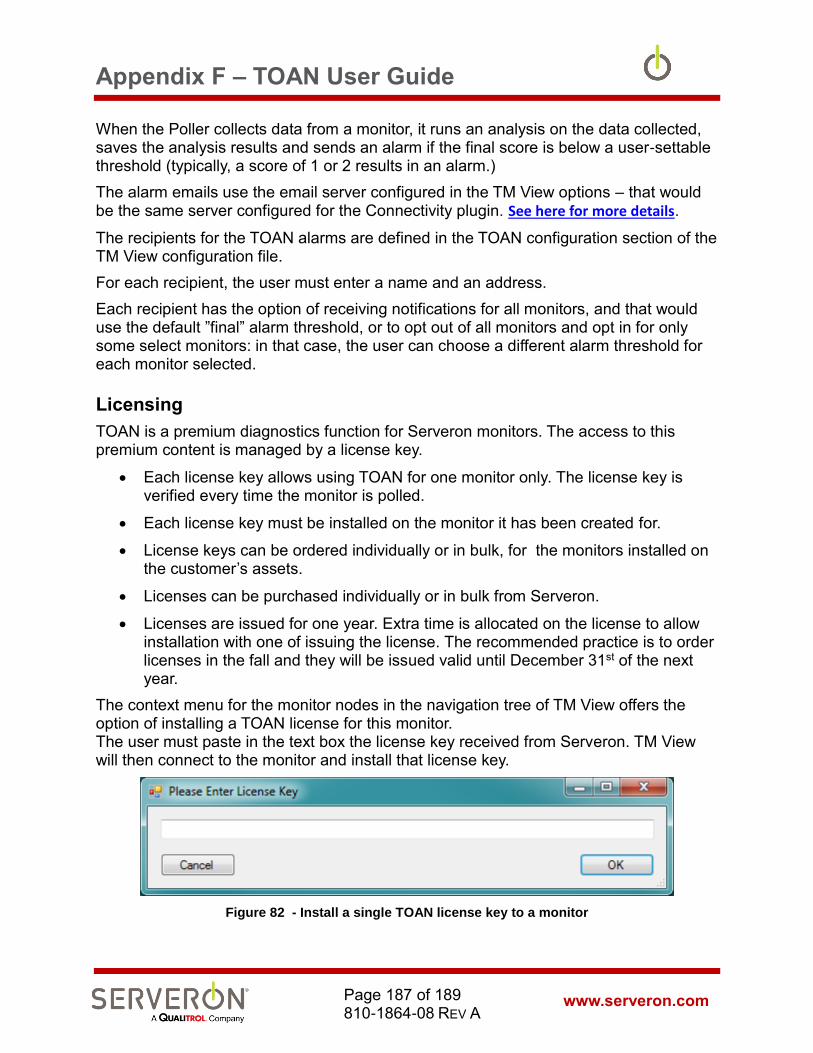
Appendix F – TOAN User Guide
www.serveron.com Page 187 of 189 810-1864-08 REV A
When the Poller collects data from a monitor, it runs an analysis on the data collected, saves the analysis results and sends an alarm if the final score is below a user-settable threshold (typically, a score of 1 or 2 results in an alarm.)
The alarm emails use the email server configured in the TM View options – that would be the same server configured for the Connectivity plugin. See here for more details.
The recipients for the TOAN alarms are defined in the TOAN configuration section of the TM View configuration file.
For each recipient, the user must enter a name and an address.
Each recipient has the option of receiving notifications for all monitors, and that would use the default ”final” alarm threshold, or to opt out of all monitors and opt in for only some select monitors: in that case, the user can choose a different alarm threshold for each monitor selected.
Licensing
TOAN is a premium diagnostics function for Serveron monitors. The access to this premium content is managed by a license key.
• Each license key allows using TOAN for one monitor only. The license key is verified every time the monitor is polled.
• Each license key must be installed on the monitor it has been created for.
• License keys can be ordered individually or in bulk, for the monitors installed on the customer’s assets.
• Licenses can be purchased individually or in bulk from Serveron.
• Licenses are issued for one year. Extra time is allocated on the license to allow installation with one of issuing the license. The recommended practice is to order licenses in the fall and they will be issued valid until December 31st of the next year.
The context menu for the monitor nodes in the navigation tree of TM View offers the option of installing a TOAN license for this monitor. The user must paste in the text box the license key received from Serveron. TM View will then connect to the monitor and install that license key.
Figure 82 - Install a single TOAN license key to a monitor

Appendix F – TOAN User Guide
www.serveron.com Page 188 of 189 810-1864-08 REV A
The License Manager dialog will create the supporting documentation which will allow ordering TOAN licenses in bulk for all the Serveron monitors installed on the customer’s assets.
The user should follow the steps below:
1. Export the summary of TOAN licenses. This will create a file containing the information necessary to create a license for each monitor in the fleet.
2. Using this file, the user should contact their Serveron representative and order TOAN licenses for all monitors needing a license (we recommend having TOAN licenses for ALL your DGA monitors).
3. Serveron personnel will generate licenses for all these monitors and send them in the form of a file. That file should be used to Import the licenses (see License Manager: Importing Licenses).
4. The next step is to install each of the newly acquired licenses to their respective monitors: this is done using the “Install Bulk Licenses” in the License Manager dialog.
1
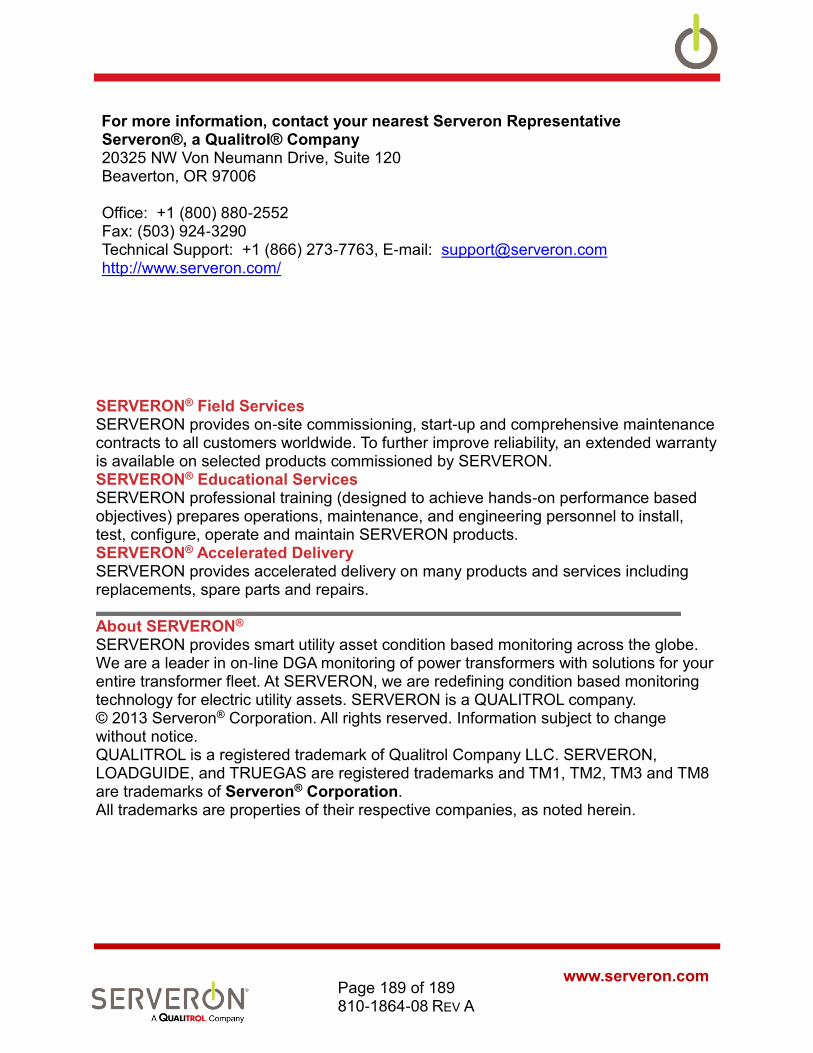
www.serveron.com Page 189 of 189 810-1864-08 REV A
For more information, contact your nearest Serveron Representative Serveron®, a Qualitrol® Company 20325 NW Von Neumann Drive, Suite 120 Beaverton, OR 97006 Office: +1 (800) 880-2552 Fax: (503) 924-3290 Technical Support: +1 (866) 273-7763, E-mail: [email protected] http://www.serveron.com/
SERVERON® Field Services SERVERON provides on-site commissioning, start-up and comprehensive maintenance contracts to all customers worldwide. To further improve reliability, an extended warranty is available on selected products commissioned by SERVERON. SERVERON® Educational Services SERVERON professional training (designed to achieve hands-on performance based objectives) prepares operations, maintenance, and engineering personnel to install, test, configure, operate and maintain SERVERON products. SERVERON® Accelerated Delivery SERVERON provides accelerated delivery on many products and services including replacements, spare parts and repairs.
About SERVERON® SERVERON provides smart utility asset condition based monitoring across the globe. We are a leader in on-line DGA monitoring of power transformers with solutions for your entire transformer fleet. At SERVERON, we are redefining condition based monitoring technology for electric utility assets. SERVERON is a QUALITROL company. © 2013 Serveron® Corporation. All rights reserved. Information subject to change without notice. QUALITROL is a registered trademark of Qualitrol Company LLC. SERVERON, LOADGUIDE, and TRUEGAS are registered trademarks and TM1, TM2, TM3 and TM8 are trademarks of Serveron® Corporation. All trademarks are properties of their respective companies, as noted herein.