tm analysis of aggregates and additives in antibody drugstm technical article tm column eluent flow...
TRANSCRIPT

ShodexTM Technical Article No.001 Page 001
No. 001
Fig. 1. Chromatograms of polyclonal IgG
Next, monoclonal IgG was analyzed by injecting 20 µL of 1-mg/mL sample (Fig. 2). Similar to polyclonal IgG analysis,monomer as well as dimer, trimer, and even largeraggregates were detected. The resolutions between monomerand dimer and between dimer and trimer obtained by LW-803was superior than that of columns from other company.
Refer to Fig. 1. for the analytical condition used.
Fig. 2. Chromatograms of monoclonal IgG
© SHOWA DENKO K.K. All Right Reserved
Analysis of Aggregates and Additives in Antibody Drugs
TM Technical Article
TM
Column
Eluent
Flow rateDetectorColumn temp.
: Shodex PROTEIN LW-803 (8.0 mm I.D. × 300 mm, 3 µm) Shodex PROTEIN KW-803 (8.0 mm I.D. × 300 mm, 5 µm) Column A from other company (7.8 mm I.D. × 300 mm, 4 µm) Column B from other company (7.8 mm I.D. × 300 mm, 2.7 µm): 50 mM Sodium phosphate buffer (pH 7.0) + 0.3 M NaCl : 1.0 mL/min: UV (280 nm): Ambient
Introduction Antibody drugs are important potent therapeutic drugs. Since antibody drugs specifically target the cancer cells, they can cause less side effects. However, it is known that they may aggregate to form dimers and other larger aggregates during manufacturing process and/or during storage period. There are concerns that those larger aggregates may produce antibodies or become immunogenic conjugates that have properties of eliciting cell immune responses inside the body, which can lead to side effects.. This may lead to cause side effects. Therefore, monitoring of such aggregates is an important quality control (QC) criteria. Silica-based aqueous size exclusion chromatography (SEC) columns are generally used for the separation of aggregates. Shodex™ PROTEIN LW-803 is one of them and it has high separation capability for the purpose. This application demonstrates the effectiveness of LW-803 by comparing it to similar columns from other companies. IgG (molecular weight (MW) about 150,000) and Bovine serum albumin (BSA, MW 66,000) were analyzed for the comparison. The effects of injection volume for the analysis of polyclonal IgG was also tested. During the production of antibody drugs, small amounts of surfactants may be added to solubilize or stabilize IgG, and thus management of surfactants’ concentrations is also important QC criteria. Quantification of surfactants can be difficult, as they exist as complex matrixes and have low UV absorption. In this application, we developed a rapid LC/MS method with a use of polymer-based column, Shodex™ ODP2 HP-2D, for the quantification of polysorbate (Tween) in the presence of IgG and NaCl as matrixes. The method does not require sample pretreatment prior to the injection.
2. Comparison of SEC columns2.1 Analysis of IgG
The test samples were prepared by dissolving polyclonal IgG from human serum or monoclonal IgG from recombinant CHO cell in the eluent. Figure 1 shows the chromatograms of polyclonal IgG by injecting 5 µL of 10-mg/mL sample. The monomer as well as dimer and even larger aggregates were detected. It can be seen that LW-803 demonstrated a superior separation efficiency between monomer and dimer compared to that of KW-803 and a column from another company, which is recommended for the analysis of antibodies.
1. Aggregates2. Trimer3. Dimer4. Monomer
LW-803
Column A
Column B
min
Resolutionmonomer dimer /dimer /trimer
2.1 2.6
2.5 2.4
2.6 3.4
1. Aggregates2. Dimer3. Monomer
Column A
LW-803
KW-803
Resolutionmonomer/dimer
min

Theoretical plate number (TPN) and resolution (Rs) between the monomer and dimer for each column are summarized in Table 1. It demonstrated that LW-803 achieved the highest resolution among the three columns studied.
Table 1. TPN and Rs (monomer/dimer) for the analysis of BSA
2.3 Effects of sample injection volume Effects of sample injection volume for the analysis of IgG was studied. The volume between 1 and 100 µL of 10-mg/mL polyclonal IgG was injected to a LW-803. Figure 5 shows the chromatograms and a graph presenting the relationships between the injection volume and TPN and resolutions between monomer and dimer.
Refer to Fig. 3. for the analytical condition used.
Fig. 5. The effects of sample injection volume
The separation efficiency was consistent among all injection volumes in the 1 - 20 µL range. It also demonstrated the method’s capability for handling larger injection volume (100 µL, absolute sample loading of 1 mg) as there was no significant decrease in its separation efficiency (Rs larger than 1.5). The Rs obtained in this experiment was lower than the data obtained in experiment 2.1. This is due to the differences in the analytic systems used. Thus, it is worth noting that the system’s dead volume may affect the resolution.
ShodexTM Technical Article No.001 Page 002
No. 011Technical Article�� No. 001Technical Article��
2.2 Analysis of BSA Figure 3 shows the chromatograms of BSA obtained by injecting 5 µL of 2-mg/mL sample. The monomer as well as dimer and trimer were detected.
Fig. 3. Chromatograms of BSA
Figure 4 is a superimposed chromatograms of the above three analysis by aligning the BSA monomer peaks.
Refer to Fig. 3. for the analytical condition used.
Fig. 4. Superimposed chromatograms of BSA
Column
Eluent
Flow rateDetectorColumn temp.
: Shodex PROTEIN LW-803 (8.0 mm I.D. × 300 mm, 3 µm) Column C from other company (7.8 mm I.D. × 300 mm, 3 µm) Column D from other company (7.8 mm I.D. × 300 mm, 5 µm): 50 mM Sodium phosphate buffer (pH 7.0) + 0.3 M NaCl : 1.0 mL/min: UV (280 nm): 25 oC
RT (min)9.308.598.56
TPN17,47814,9868,594
Rs (M/D)2.332.072.07
LW-803Column CColumn D

→
No. 011Technical Article��
3. Analysis of surfactants in antibody drugsODP2 HP-2D is packed with polyhydroxy methacrylate
gels. Unlike regular ODS columns, ODP2 HP is highly hydrophilic and this prevents proteins to be retained inside the column. Hydrophobic interaction which is the cause of protein retention can be suppressed almost to none by using alkaline eluent. Also, ODP2 HP’s small pore size (40 Å) adds a size exclusion effect that helps proteins to eluting at V0. By well-controlling those features, the ODP2 HP column completely separates IgG from surfactants. The surfactants are retained by reverse phase mode. In order to prevent IgG from entering the MS, a flow-switching valve was placed after the UV detector. By using the valve, the column eluate obtained between 0 and 5 minutes is collected in a waste bottle and the eluate obtained after 5 minutes is injected into the MS. Tween is typically used as an additive in antibody drugs, thus we selected it as a test surfactant in this application. Tween consists of a sorbitan backbone, polymers of ethylene oxide (EO), and long chain fatty acids connected by ester bonding (Fig. 6).
Fig. 6. Structure of Tween
Tween does not exist as a single compound, but exists in several different forms. The most abundant component was selected by pre-scanning the sample. Quantification curve was prepared using the result obtained by an MS (SIM mode) by measuring selected ions. Among the available Tween standards, Tween 20 and Tween 80 were analyzed. As a test sample, a mixture containing 50-mg/L Tween 20 or Tween 80, 1-g/L polyclonal IgG, and 0.3-mol/L NaCl was prepared. Injection volume used was 2 µL throughout the experiment.
ShodexTM Technical Article No.001 Page 003
3.1 Analysis of Tween 20 Figure 7 (blue line) shows the SIM chromatogram of Tween 20. The eluent used was ammonim water. Ion at m/z 735.7 was monitored. This ion is assumed to be a divalent ion consisting of a sorbitan backbone, 20 or more EO units, glycerol diesters (MW 1435) of C14 and C12 with either one of them having a double bond, and two ammonium ions. Two chromatograms, one includes IgG and NaCl (Fig. 7(a)) and the other without IgG and NaCl (Fig. 7(b)) demonstrated very similar results, showing that there was minimum ion-suppression effect. Also, a good linearity was obtained for the calibration curve of Tween 20.
Fig. 7. Analysis of Tween 20. Chromatograms of (a) without and (b) with 1-g/L IgG and 0.3-mol/L NaCl. (c) calibration curve
No. 001Technical Article��
Column
Eluent
Flow rateDetector
Column temp.
: Shodex ODP2 HP-2D (2.0 mm I.D. × 150 mm, 5 µm): (A) 0.1 % Ammonia aq./(B) CH3CNLinear gradient 20 % B (0 - 5 min) → 20 to 90 % B (5 - 19 min)
→ 90 % B (19 - 24 min) → 90 to 20 % B (24 - 25 min): 0.2 mL/min: UV (280 nm) ESI-MS SIM(+): 40 oC
w + x + y + z ~ 20Tween 20: R = H or C11H23COTween 80: R = H or C17H33CO
O
O
OO
O
R
R
OO
ROO
R w x
y
z
(c)
(b)(a)
No. 001Technical Article��
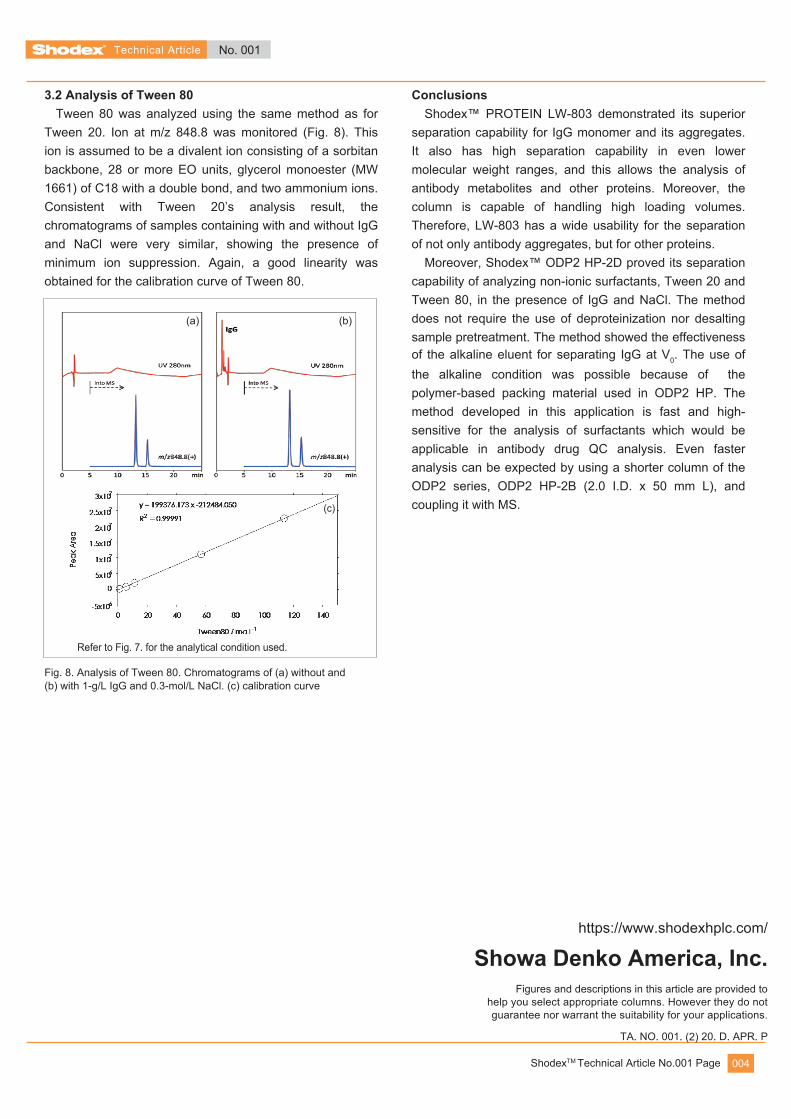
3.2 Analysis of Tween 80 Tween 80 was analyzed using the same method as for Tween 20. Ion at m/z 848.8 was monitored (Fig. 8). This ion is assumed to be a divalent ion consisting of a sorbitan backbone, 28 or more EO units, glycerol monoester (MW 1661) of C18 with a double bond, and two ammonium ions. Consistent with Tween 20’s analysis result, the chromatograms of samples containing with and without IgG and NaCl were very similar, showing the presence of minimum ion suppression. Again, a good linearity was obtained for the calibration curve of Tween 80.
Refer to Fig. 7. for the analytical condition used.
Fig. 8. Analysis of Tween 80. Chromatograms of (a) without and (b) with 1-g/L IgG and 0.3-mol/L NaCl. (c) calibration curve
ShodexTM Technical Article No.001 Page 004
Figures and descriptions in this article are provided to help you select appropriate columns. However they do not guarantee nor warrant the suitability for your applications.
TA.NO.001.(2) 20.D.APR.P
https://www.shodexhplc.com/
Showa Denko America, Inc.
ConclusionsShodex™ PROTEIN LW-803 demonstrated its superior
separation capability for IgG monomer and its aggregates. It also has high separation capability in even lower molecular weight ranges, and this allows the analysis of antibody metabolites and other proteins. Moreover, the column is capable of handling high loading volumes. Therefore, LW-803 has a wide usability for the separation of not only antibody aggregates, but for other proteins. Moreover, Shodex™ ODP2 HP-2D proved its separation capability of analyzing non-ionic surfactants, Tween 20 and Tween 80, in the presence of IgG and NaCl. The method does not require the use of deproteinization nor desalting sample pretreatment. The method showed the effectiveness of the alkaline eluent for separating IgG at V0. The use of the alkaline condition was possible because of the polymer-based packing material used in ODP2 HP. The method developed in this application is fast and high-sensitive for the analysis of surfactants which would be applicable in antibody drug QC analysis. Even faster analysis can be expected by using a shorter column of the ODP2 series, ODP2 HP-2B (2.0 I.D. x 50 mm L), and coupling it with MS. (c)
(a) (b)