title: the effects of fish oil on texture, color, and ... · malee smith al asher title: the...
TRANSCRIPT
Malee Smith Al Asher
Title: The effects of fish oil on texture, color, and palatability of brownies Abstract: Omega-3 fatty acids help aid in lowering the risk for major diseases and conditions such
as cardiovascular diseases. They are present in both fish as well as some plants. However,
the vegetable derivative found in some plants has been shown to be less beneficial
compared to omega-3 fatty acids in fish oils. Unfortunately, the majority of the
population does not consume the recommended amounts of fish per week in order to
obtain adequate omega-3 fatty acids. Adding or replacing vegetable oils with fish oils in
popular snack foods may give the population an alternate way to obtain omega-3 fatty
acids without having to consume fish. The purpose of this experiment was to investigate
the effects fish oil would have on the texture, color, and taste of low-fat chocolate
brownies. The hypothesis for this investigation was that the replacement of cooking oil
with Omega-3 fish oils will not have an effect on the texture or palatability of brownies.
Three trials were preformed during which three variables were evaluated for texture,
color, and overall taste, smell, and appearance. The three variables included a control
(variable number 217) made using the standard recipe, variable 425 with half vegetable
oil and half apricot flavored cod liver oil, and variable 319 which was full apricot
flavored cod liver oil. A texture analyzer was used to assess any effects on texture, a
color analysis to pick up any effects on color, as well as a sensory panel to assess overall
desirability and palatability of the final products. Results indicate that the use of cod fish
oil as a fat replacement has little to no affect on appearance. It has also been shown that
taste, smell, and texture may be adversely affected and force the product to be less
desirable than the original.

Malee Smith Al Asher
Introduction:
According to the Center for Disease Control, cardiovascular disease is the major
cause of death in the United States. Cardiovascular diseases can be attributed to a
decrease in physical activity, an increase in consumption of unhealthy foods, and a
decrease in consumption of foods healthy foods that promote cardiovascular health,
especially foods that contain omega-3 fatty acids. Omega-3 fatty acids help aid in
lowering the risk for major diseases and conditions such as cardiovascular diseases,
hypertension, arthritis, and inflammation. They are present in both fish as well as some
plants but the fish oil derivative proves more effective in lowering cardiovascular risks
(Berslow 2006). These oils are found in large amounts in cold-water fish, and therefore
can be obtained by consumption of these types of fish. It is therefore recommended that
fish containing omega-3 fatty acids be consumed at least twice a week in order to fully
reap the benefits. For those individuals who do not enjoy consuming fish, supplements
made from the fish oils are also available (Chan and Cho 2009).
The entire purpose of this project is based off the principle that consuming
omega-3 fatty acids can improve health conditions and lower risks for disease and that
these fatty acids should be added to commonly eaten and popular foods so that more
people can benefit from their consumption. By adding omega-3 fatty acids in the form of
fish oil to a popular snack food, a somewhat unhealthy, guilty pleasure for some
individuals now allows them to meet their daily omega-3 fatty acid recommendations
without having to consume fish directly.
However, replacing regular oil with fish oil may not always yield a perfect
product. This is why certain precautions must be made. According to a former study,

Malee Smith Al Asher
performed by Caceres et al., the utilization of a fish oil product to food caused some
noticeably sensory changes in color. Caceres et al. attribute this mainly to the decrease in
the amount of fat used during the cooking process (Caceres et al. 2008). However, this
should not be a major area of concern in the proposed study of fish oil in brownies
because the same amount of fat will be there, it will only be replaced with the fish oil
product. However, an objective analysis of color as well as a subjective sensory panel
analysis will still be performed to investigate any changes in color and appearance to the
end product.
Changes in fat content can also have an effect on the overall texture of a product
as well. If the product has an increase in fat content from the addition or replacement of
fish oil then the end product will show a decrease in texture (the product is much softer).
On the reverse side, if there is a decrease if fat content, the product can become much
harder as was the case in Caceres et al. (2009). This happens as a result of the pre-
emulsification that is used to prepare the fish oil. This is definitely a factor to consider
when preparing fish oil brownies, as the textural component of a brownie is extremely
important in consumer satisfaction. After an initial trial, if texture analysis, as well as
sensory response, shows a significant change in texture another fat product may need to
be added to resolve the problem. The fat product could include anything from milk to
margarine. All of these tests need to be performed in order to ensure that the end result is
a product that will actually be satisfying to consumers.
The main purpose of this project is to determine the maximum amount of fish oil
that can be used in brownies to increase the healthiness of the product without a
Malee Smith Al Asher
significant change in texture, appearance (color) and overall consumer palatability and
satisfaction.
Methods:
For the experiment, 3 different variables of brownies were made: a control
(variable 217), which followed the basic low fat brownie recipe, variable 425 which
contained half the amount of fat as vegetable oil and the other half as apricot flavored cod
liver oil, and variable 319 which contained all apricot flavored liver oil. A texture
analyzer was used to assess any effects on texture, a color analysis to pick up any effects
on color, as well as a sensory panel to assess overall desirability and palatability of the
final products. A total of three trials were performed. In order to standardize each
variable the same procedure was used during each variable test trial.
The following recipe for Betty Crocker Low Fat Fudge Brownies was utilized: 1 Box of Betty Crocker Low Fat Fudge Brownie mix 118 g of water (½ cup) 57g of egg (1 full egg) 14 g of oil (1 tablespoon)*
*Oil type is dependent on variable Ovens were preheated to 350 F (176.67 C) and the brownie mix was emptied
into a large mixing bowl. The water, egg, and oil were then added and a whisk was used
to mix all the ingredients together for a total of 50 turns around the bowl. This procedure
was repeated for the remaining 2 variables. A standard cooking spray (Pam) was used
with the same spraying technique and pattern to ensure that each baking pan was covered
with relatively the same amount. Each variable was then poured into the baking pan and
placed on the middle baking rack of the oven and baked at 350 F (176.67 C) . After 35
minutes, the brownies were checked for doneness by inserting a toothpick into the center
Malee Smith Al Asher
of the brownies and pulled out. If there were large amounts of brownie mix on the
toothpick when removed, they continued baking. Doneness was then checked every 1-3
minutes (depending on first initial trial) with a new toothpick until no brownie mix was
found on the toothpick. The brownies were then immediately removed from the oven and
placed on a baking sheet to cool for 10 minutes before being portioned. The brownies
were portioned into 9 equally sized squares—1 portion for texture analyzer analysis, 1
portion for color analysis, and 7 portions for the sensory panel (one portion for each panel
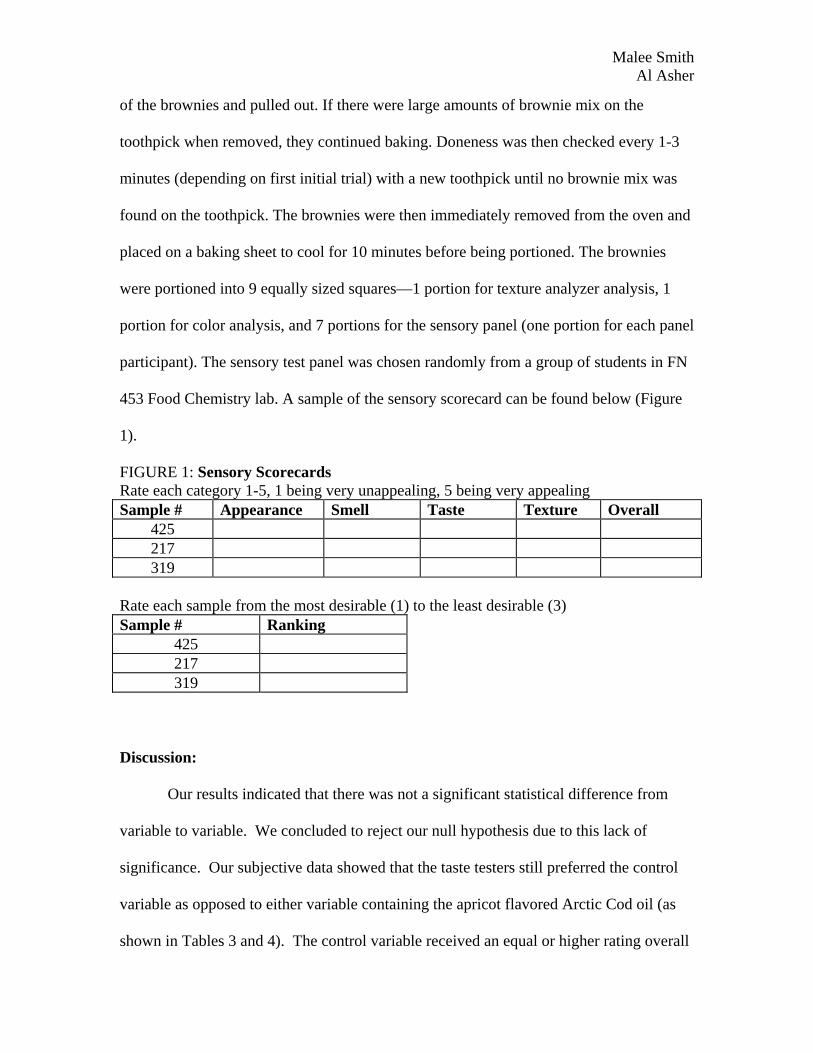
participant). The sensory test panel was chosen randomly from a group of students in FN
453 Food Chemistry lab. A sample of the sensory scorecard can be found below (Figure
1).
FIGURE 1: Sensory Scorecards Rate each category 1-5, 1 being very unappealing, 5 being very appealing Sample # Appearance Smell Taste Texture Overall
425 217 319
Rate each sample from the most desirable (1) to the least desirable (3) Sample # Ranking
425 217 319
Discussion: Our results indicated that there was not a significant statistical difference from
variable to variable. We concluded to reject our null hypothesis due to this lack of
significance. Our subjective data showed that the taste testers still preferred the control
variable as opposed to either variable containing the apricot flavored Arctic Cod oil (as
shown in Tables 3 and 4). The control variable received an equal or higher rating overall
Malee Smith Al Asher
as well as for appearance, texture, taste, and smell as compared to the variables
containing the arctic cod oil. For taste, the control was rated the highest with variable
319 barely rating higher than variable 425. Feedback was fairly mixed concerning both
variables. The apricot flavor itself was cited as being unpleasant, which could serve as a
source for bias and may be a source of error. For smell, the control was rated the highest
with variable 319 barely rating higher than variable 425. For texture, the control was
rated the highest with variable 425 barely rating higher than variable 319. Overall, the
control was rated the highest of the variables (shown in Table 3). Variable 425 rated
significantly higher overall than variable 319, implying that the use of fish oil as a fat
substitute in brownies does not improve product appeal or palatability, as far as
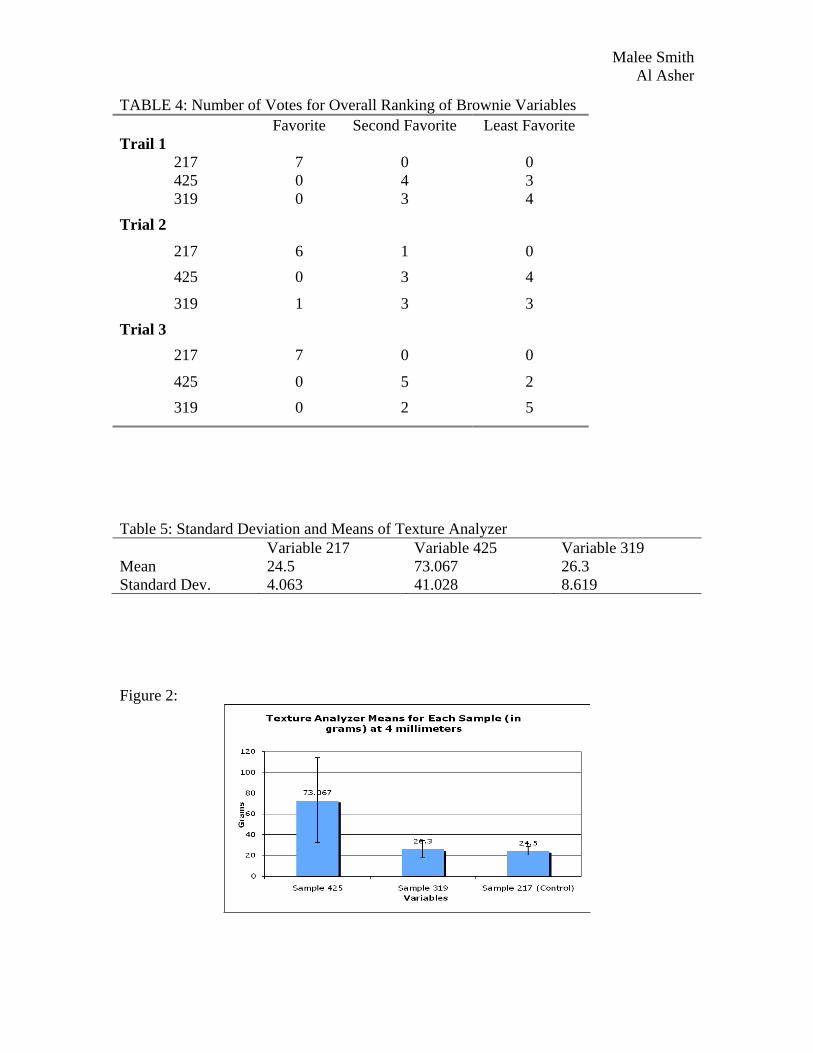
subjective measurements are concerned. The texture analysis of the variables showed
that the control remained the softest and required the least amount of force in the texture
analyzer. Variable 425 was the toughest variable while variable 319 compared similarly
to the control (shown in Table 1 and Figure 2). The increased toughness could be due to
the sample being analyzed not coming from the same location on each respective
brownie. The closer to the edge of the pan, the tougher the brownie tended to be. This
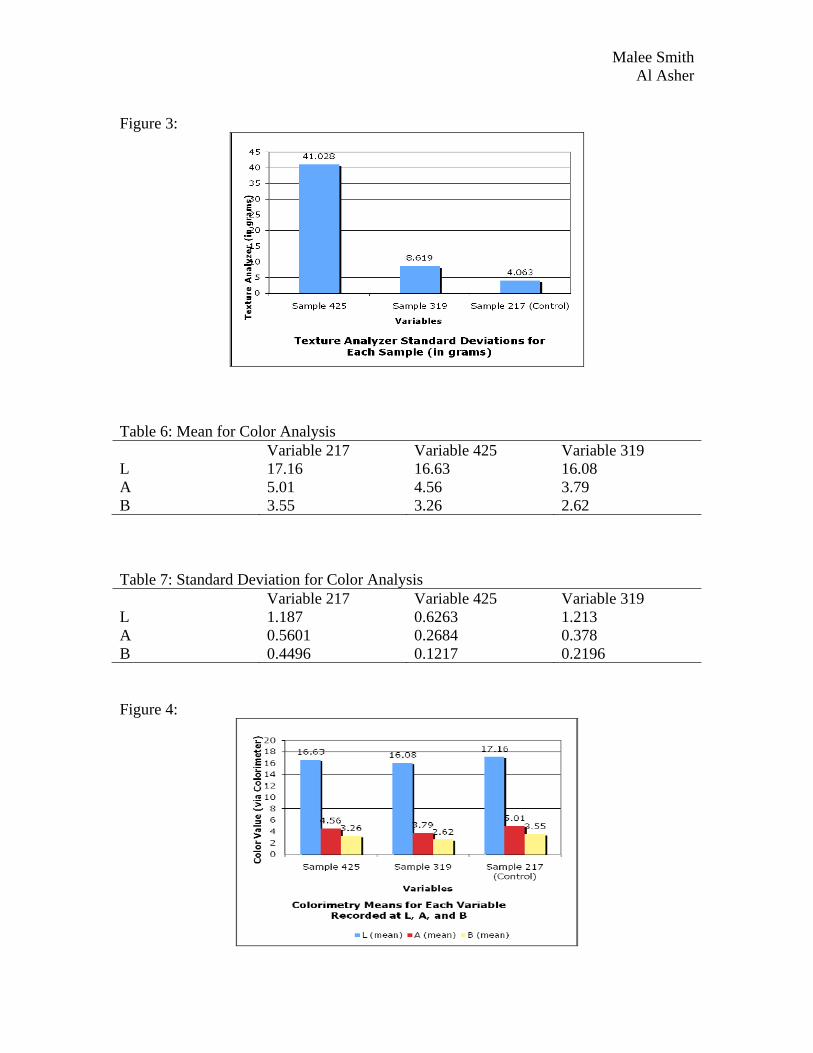
could also be treated as a possible source of error. The color analysis showed that the
variables became slightly lighter in color (as shown in Table 4 and Figure 6). Variable
425 was shown to be slightly lighter than the control at L, A, and B readings. Variable
319 was shown to be the darkest. As shown by the subjective data, the slight color
changes did not seem to affect the appeal of each variable’s appearance.
Malee Smith Al Asher
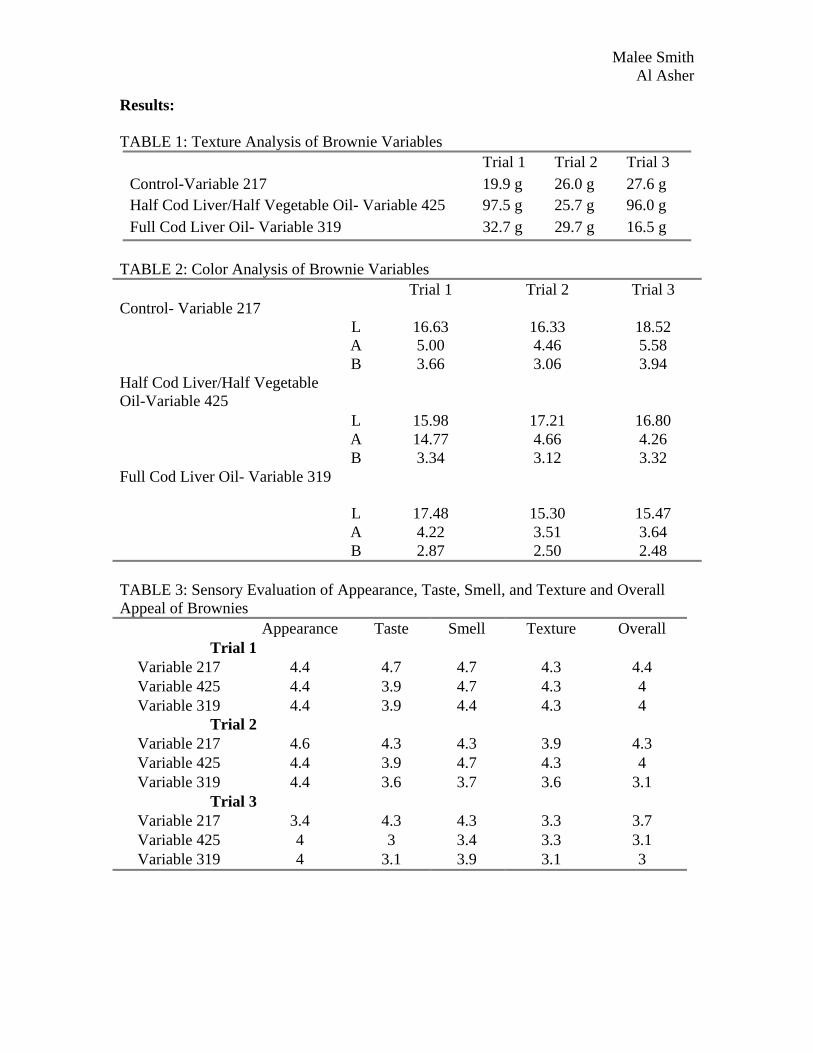
Results: TABLE 1: Texture Analysis of Brownie Variables
Trial 1 Trial 2 Trial 3 Control-Variable 217 19.9 g 26.0 g 27.6 g Half Cod Liver/Half Vegetable Oil- Variable 425 97.5 g 25.7 g 96.0 g Full Cod Liver Oil- Variable 319 32.7 g 29.7 g 16.5 g
TABLE 2: Color Analysis of Brownie Variables
Trial 1 Trial 2 Trial 3 Control- Variable 217
L 16.63 16.33 18.52 A 5.00 4.46 5.58 B 3.66 3.06 3.94
Half Cod Liver/Half Vegetable Oil-Variable 425
L 15.98 17.21 16.80 A 14.77 4.66 4.26 B 3.34 3.12 3.32
Full Cod Liver Oil- Variable 319
L 17.48 15.30
15.47 A 4.22 3.51 3.64 B 2.87 2.50 2.48
TABLE 3: Sensory Evaluation of Appearance, Taste, Smell, and Texture and Overall Appeal of Brownies
Appearance Taste Smell Texture Overall Trial 1
Variable 217 4.4 4.7 4.7 4.3 4.4 Variable 425 4.4 3.9 4.7 4.3 4 Variable 319 4.4 3.9 4.4 4.3 4
Trial 2 Variable 217 4.6 4.3 4.3 3.9 4.3 Variable 425 4.4 3.9 4.7 4.3 4 Variable 319 4.4 3.6 3.7 3.6 3.1
Trial 3 Variable 217 3.4 4.3 4.3 3.3 3.7 Variable 425 4 3 3.4 3.3 3.1 Variable 319 4 3.1 3.9 3.1 3
Malee Smith Al Asher
TABLE 4: Number of Votes for Overall Ranking of Brownie Variables Favorite Second Favorite Least Favorite Trail 1
217 7 0 0 425 0 4 3 319 0 3 4
Trial 2
217 6 1 0
425 0 3 4
319 1 3 3
Trial 3
217 7 0 0
425 0 5 2
319 0 2 5
Table 5: Standard Deviation and Means of Texture Analyzer Variable 217 Variable 425 Variable 319 Mean 24.5 73.067 26.3 Standard Dev. 4.063 41.028 8.619 Figure 2:
Malee Smith Al Asher
Figure 3:
Table 6: Mean for Color Analysis Variable 217 Variable 425 Variable 319 L 17.16 16.63 16.08 A 5.01 4.56 3.79 B 3.55 3.26 2.62 Table 7: Standard Deviation for Color Analysis Variable 217 Variable 425 Variable 319 L 1.187 0.6263 1.213 A 0.5601 0.2684 0.378 B 0.4496 0.1217 0.2196 Figure 4:
Malee Smith Al Asher
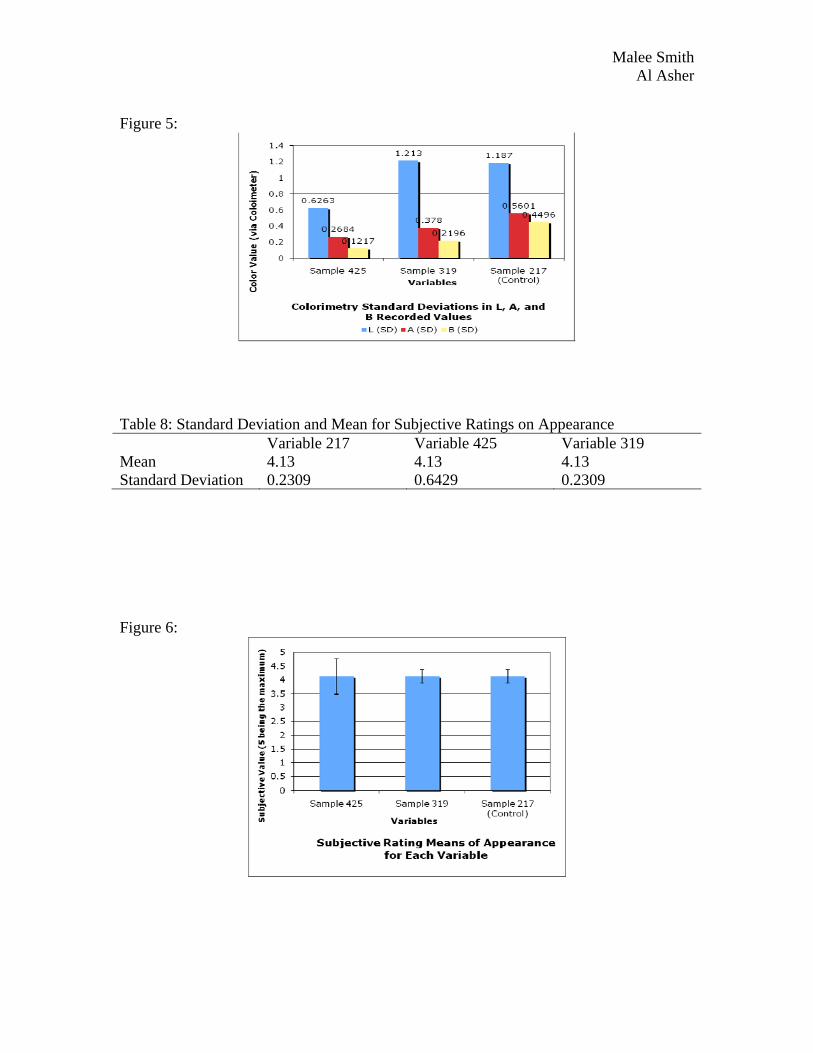
Figure 5:
Table 8: Standard Deviation and Mean for Subjective Ratings on Appearance Variable 217 Variable 425 Variable 319 Mean 4.13 4.13 4.13 Standard Deviation 0.2309 0.6429 0.2309
Figure 6:
Malee Smith Al Asher
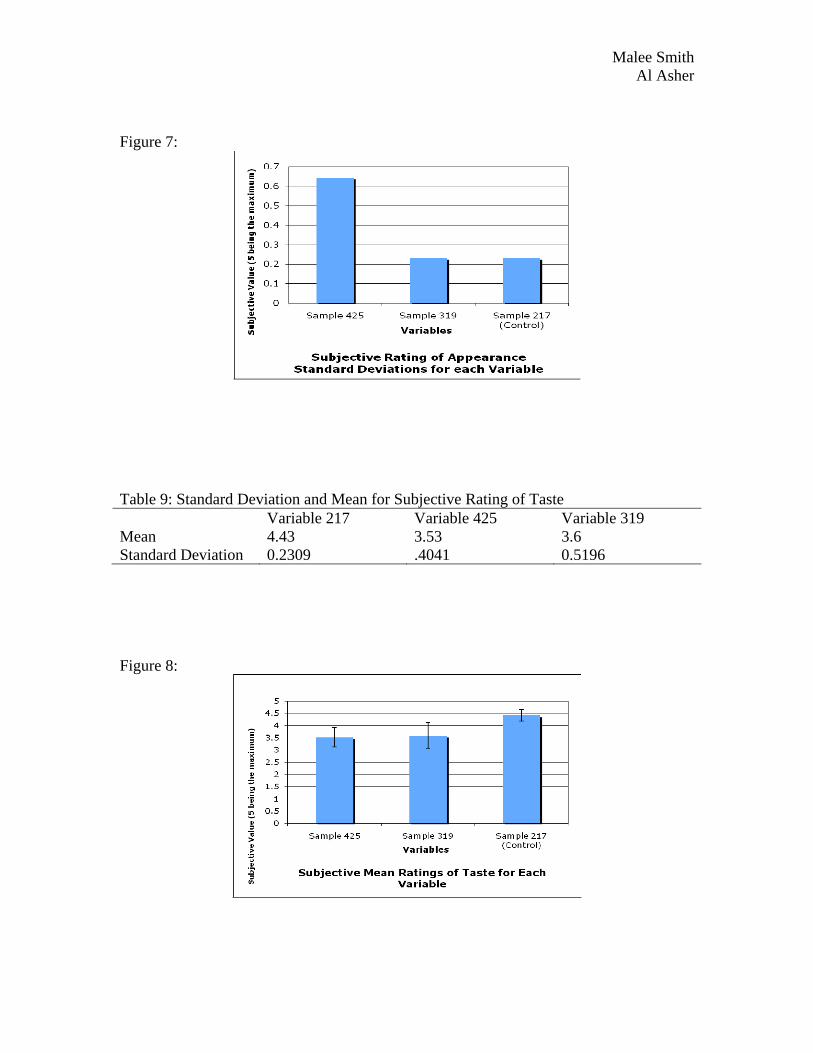
Figure 7:
Table 9: Standard Deviation and Mean for Subjective Rating of Taste Variable 217 Variable 425 Variable 319 Mean 4.43 3.53 3.6 Standard Deviation 0.2309 .4041 0.5196 Figure 8:
Malee Smith Al Asher
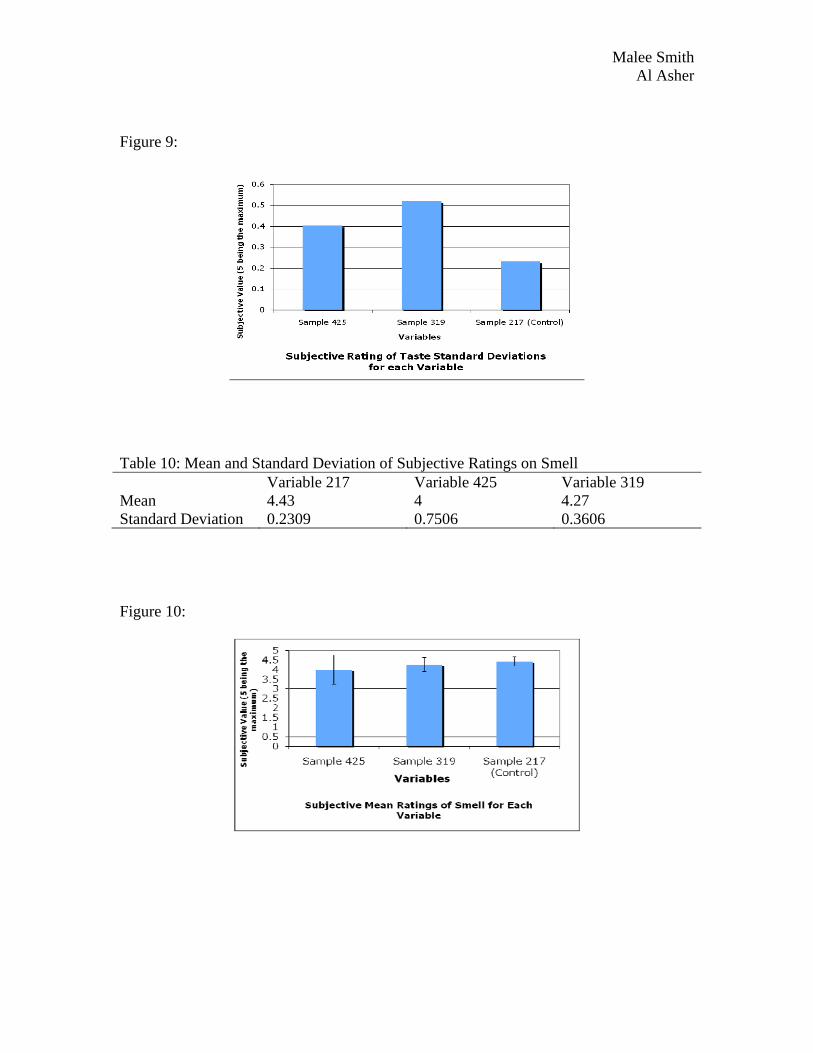
Figure 9:
Table 10: Mean and Standard Deviation of Subjective Ratings on Smell Variable 217 Variable 425 Variable 319 Mean 4.43 4 4.27 Standard Deviation 0.2309 0.7506 0.3606 Figure 10:
Malee Smith Al Asher
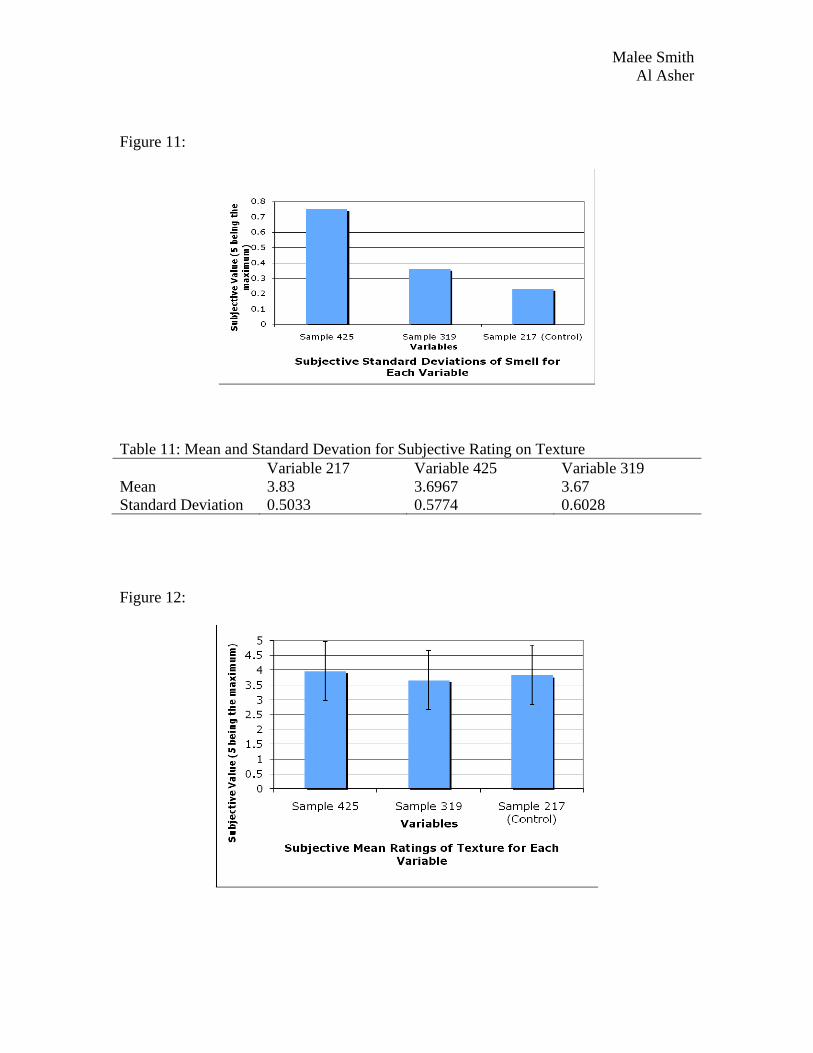
Figure 11:
Table 11: Mean and Standard Devation for Subjective Rating on Texture Variable 217 Variable 425 Variable 319 Mean 3.83 3.6967 3.67 Standard Deviation 0.5033 0.5774 0.6028 Figure 12:
Malee Smith Al Asher
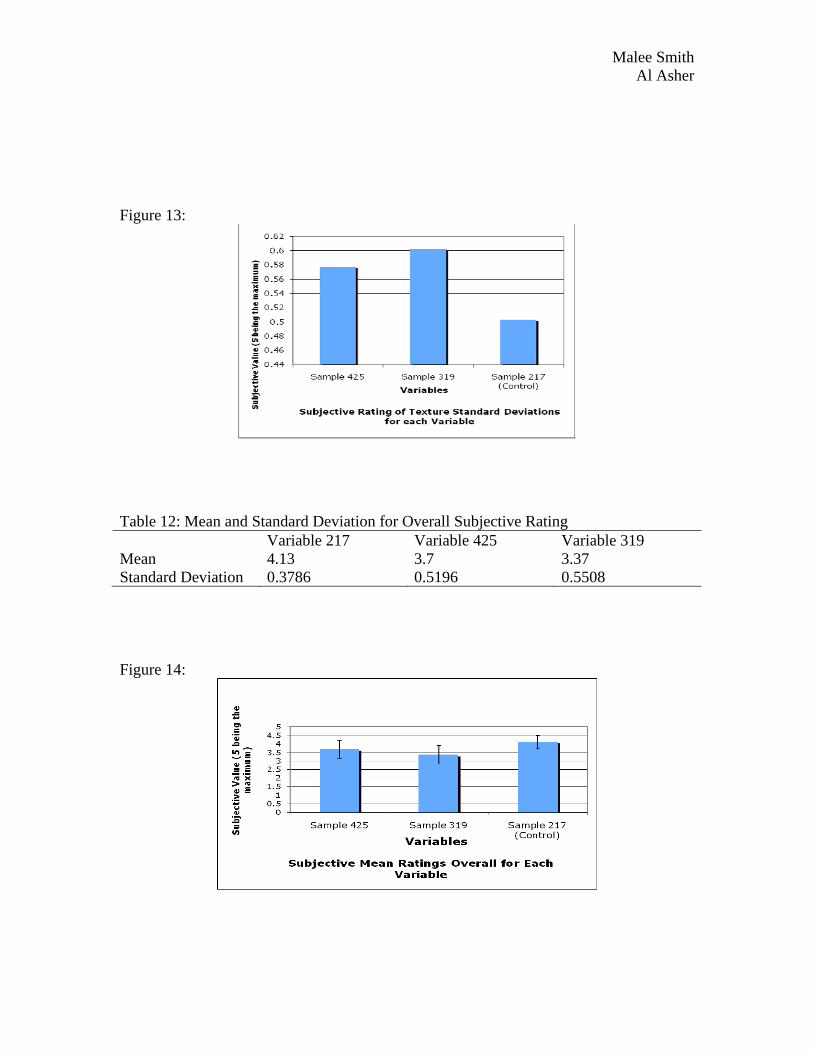
Figure 13:
Table 12: Mean and Standard Deviation for Overall Subjective Rating Variable 217 Variable 425 Variable 319 Mean 4.13 3.7 3.37 Standard Deviation 0.3786 0.5196 0.5508
Figure 14:
Malee Smith Al Asher
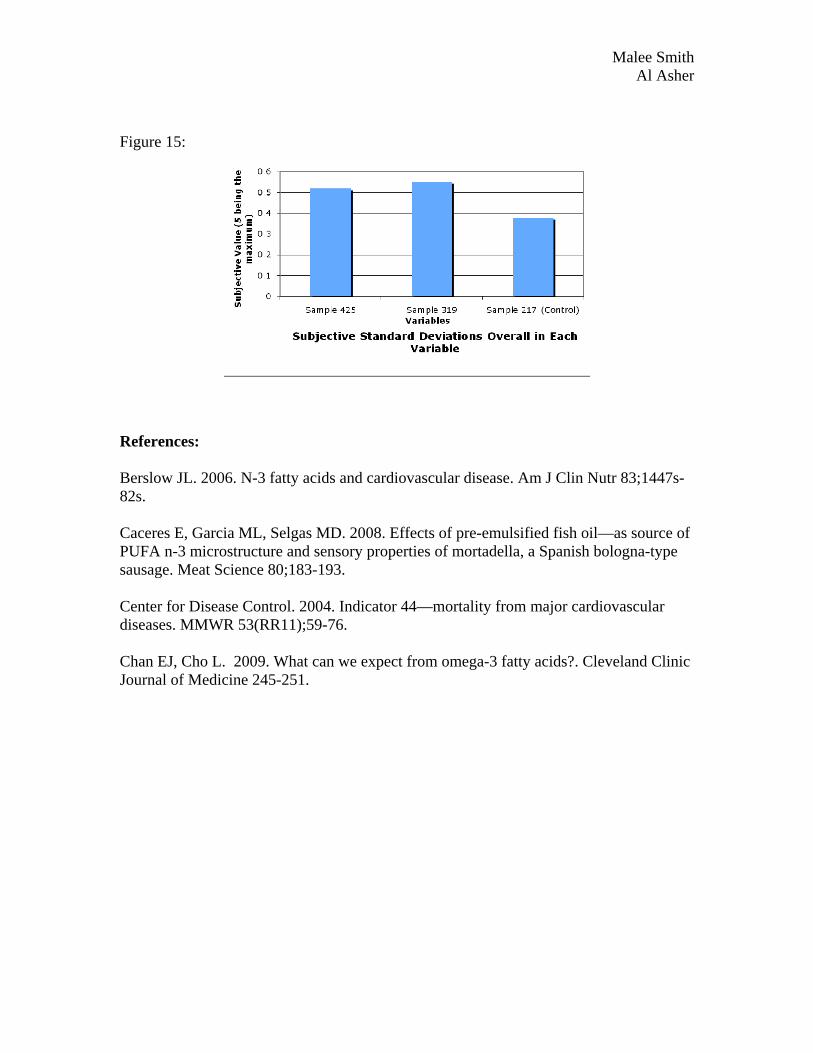
Figure 15:
References: Berslow JL. 2006. N-3 fatty acids and cardiovascular disease. Am J Clin Nutr 83;1447s-82s. Caceres E, Garcia ML, Selgas MD. 2008. Effects of pre-emulsified fish oil—as source of PUFA n-3 microstructure and sensory properties of mortadella, a Spanish bologna-type sausage. Meat Science 80;183-193. Center for Disease Control. 2004. Indicator 44—mortality from major cardiovascular diseases. MMWR 53(RR11);59-76. Chan EJ, Cho L. 2009. What can we expect from omega-3 fatty acids?. Cleveland Clinic Journal of Medicine 245-251.