title slide - gray balancing energy efficiency & resiliency
TRANSCRIPT

Title Slide - Gray
BALANCING ENERGY EFFICIENCY & RESILIENCY Wisconsin Energy Efficiency Expo | May 17, 2018
Rick Hombsch | PE, LEED AP
© 2018 HGA
1

Agenda Slide - Gray
1. Why Plan for Resiliency
2. How to Plan for Resiliency
3. Balancing Resiliency Planning with Energy Efficiency
4. MetroHealth - Case Study
Blank
Wisconsin Energy Efficiency Expo | May 17, 2018 © 2018 HGA
Big Statement - Gray
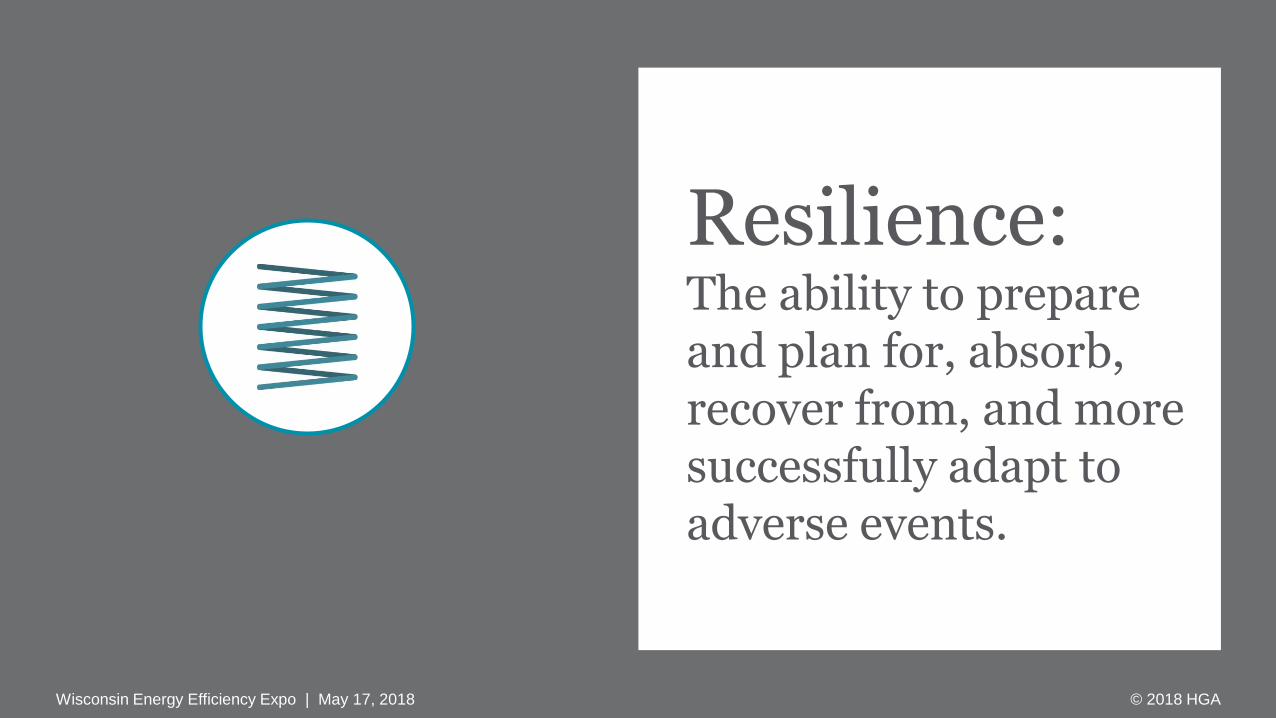
Resilience: The ability to prepare and plan for, absorb, recover from, and more successfully adapt to adverse events.
Wisconsin Energy Efficiency Expo | May 17, 2018 © 2018 HGA
Big Statement - Gray
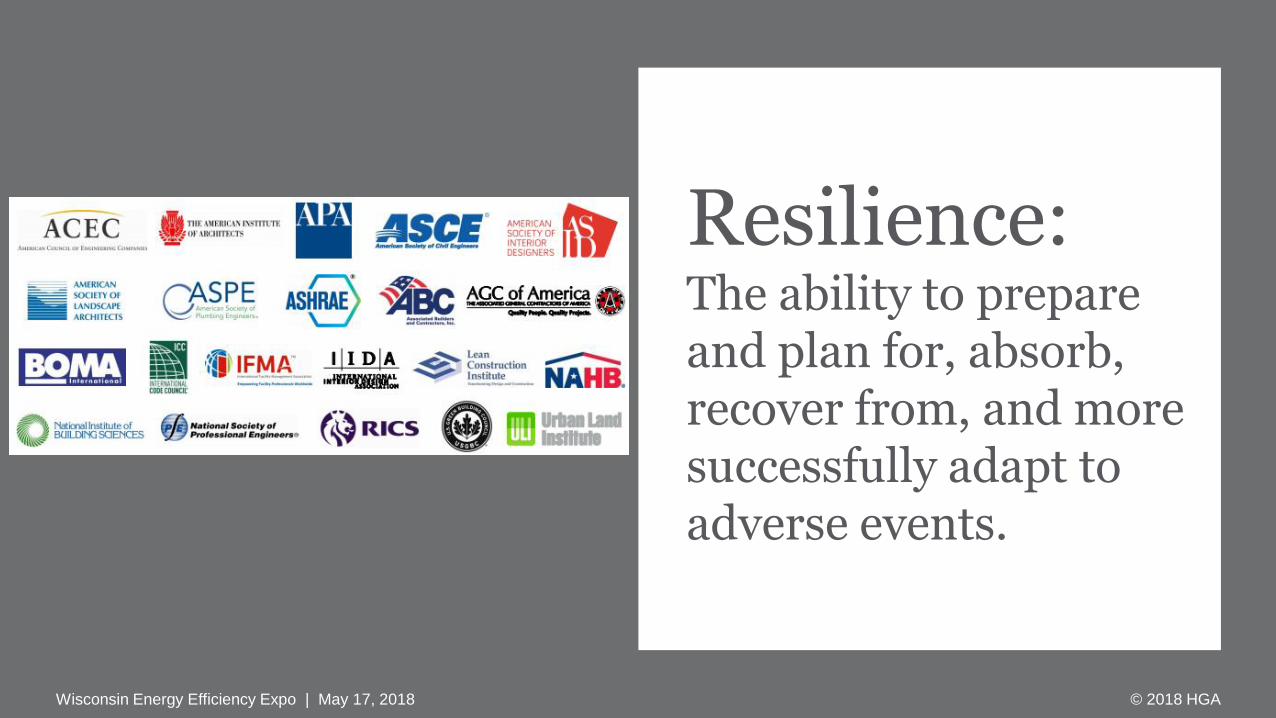
Resilience: The ability to prepare and plan for, absorb, recover from, and more successfully adapt to adverse events.
Wisconsin Energy Efficiency Expo | May 17, 2018 © 2018 HGA
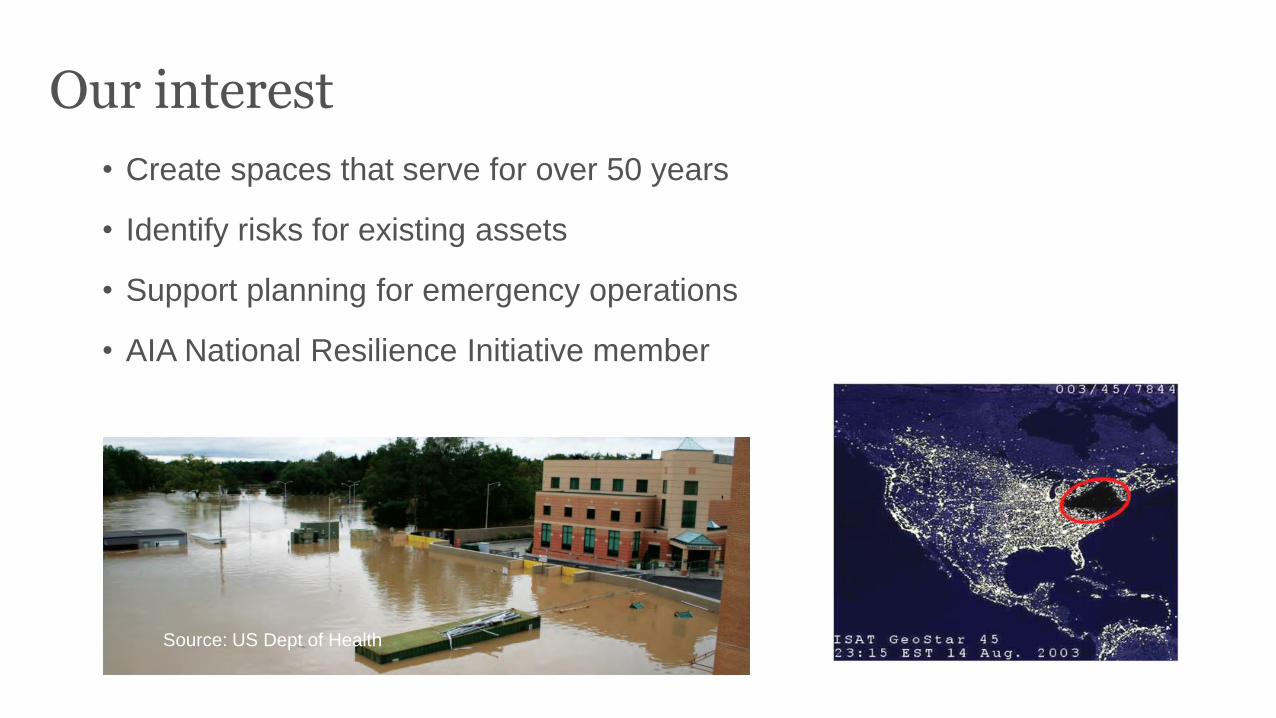
Our interest
• Create spaces that serve for over 50 years
• Identify risks for existing assets
• Support planning for emergency operations
• AIA National Resilience Initiative member
Source: US Dept of Health
Source: ISAT GeoStar 45
Single Photo
Wisconsin Energy Efficiency Expo | May 17, 2018
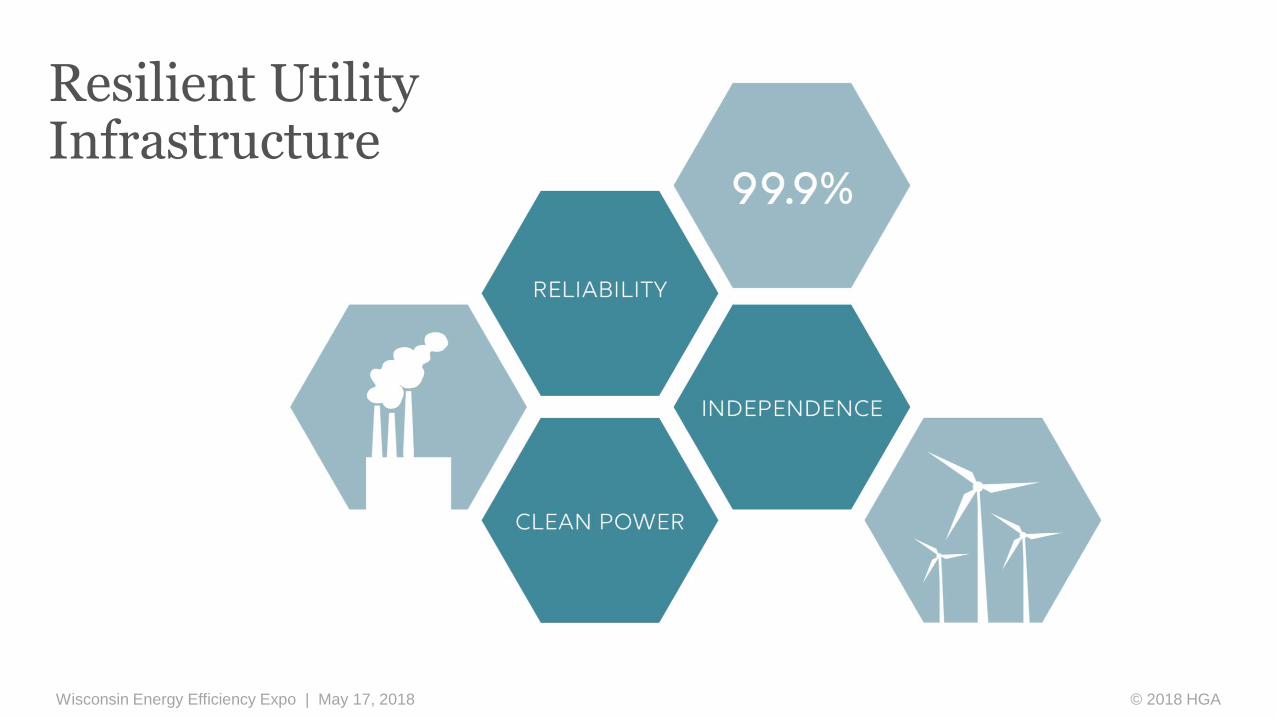
Resilient Utility Infrastructure
© 2018 HGA
Single Photo
Wisconsin Energy Efficiency Expo | May 17, 2018
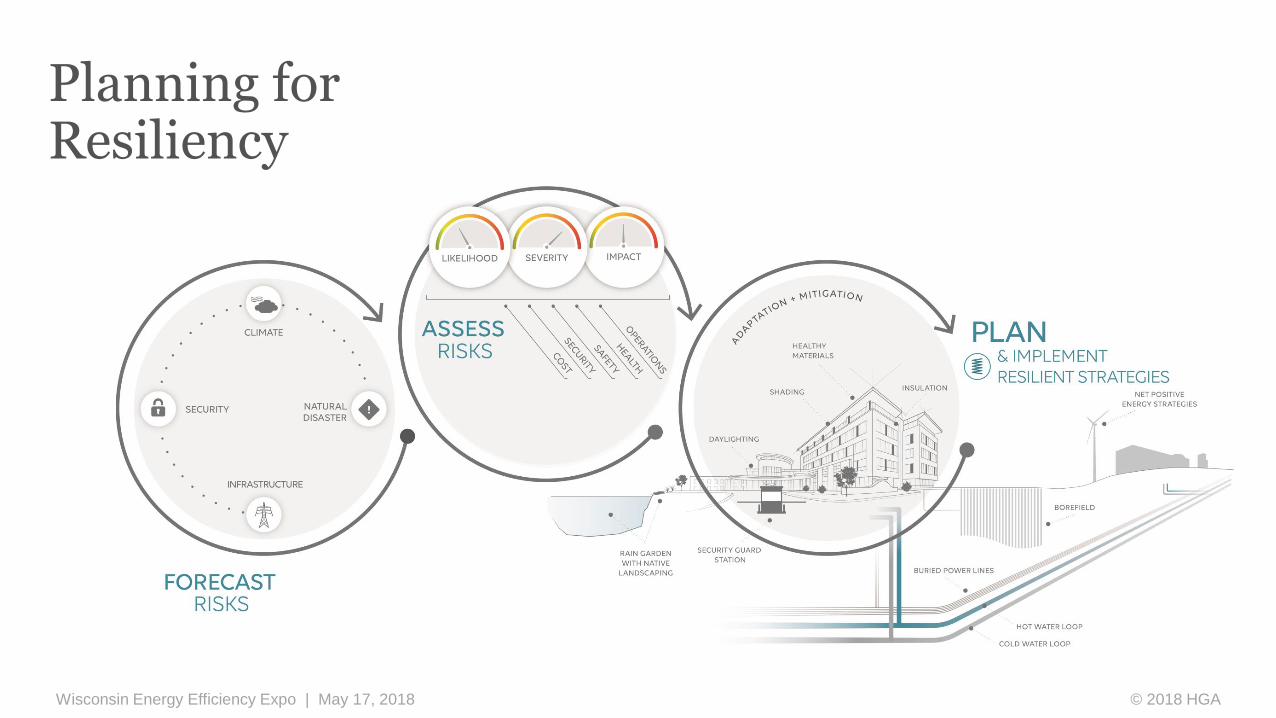
Planning for Resiliency
© 2018 HGA
Blank
Wisconsin Energy Efficiency Expo | May 17, 2018
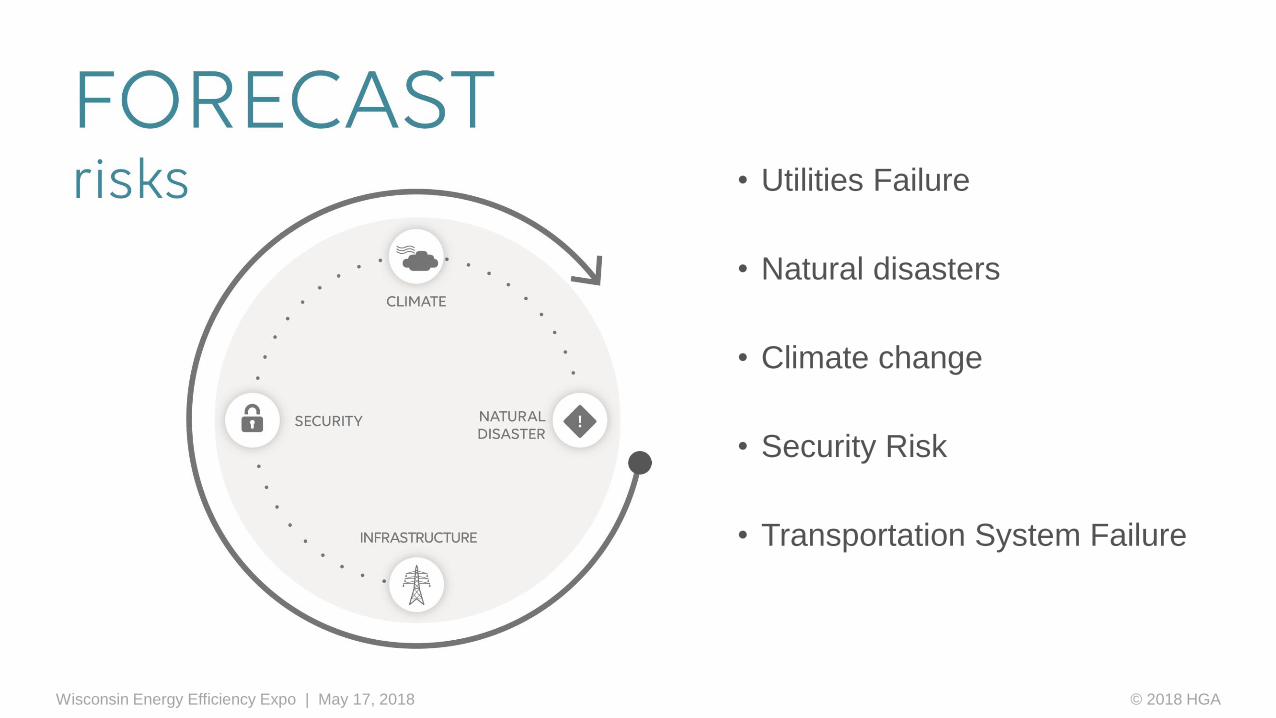
• Utilities Failure
• Natural disasters
• Climate change
• Security Risk
• Transportation System Failure
© 2018 HGA
Short title, content & photo
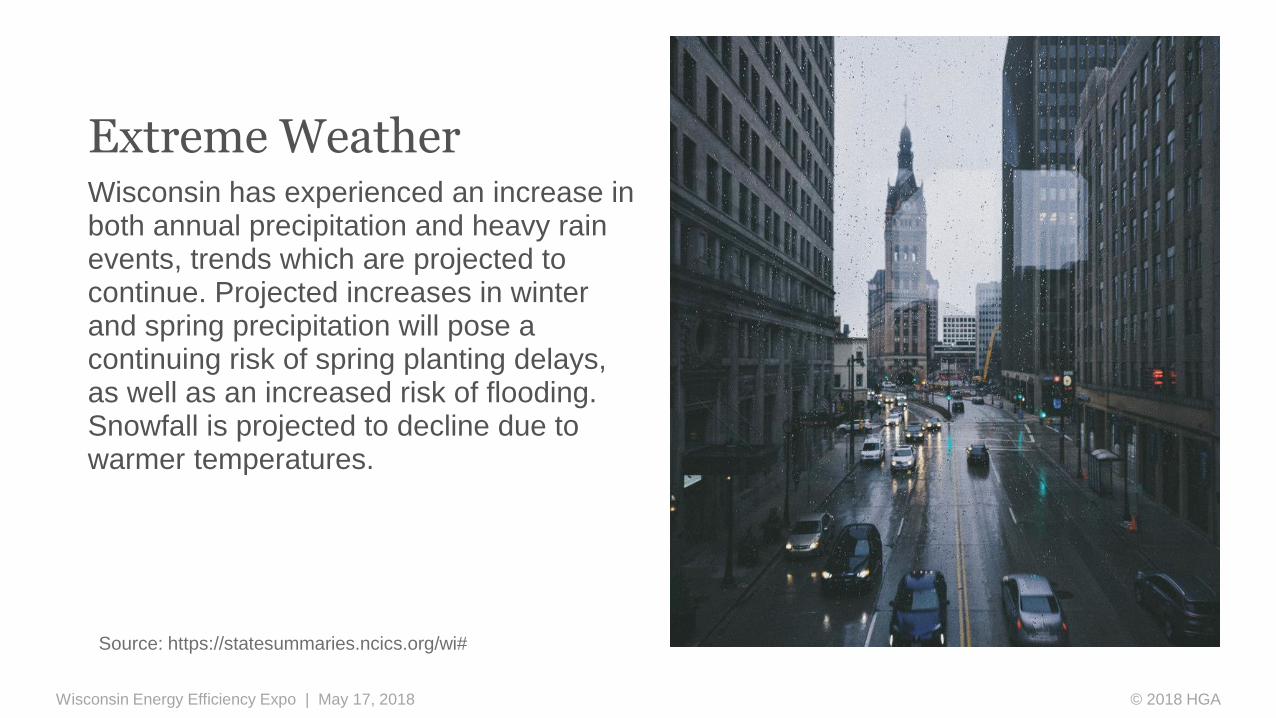
Extreme Weather Wisconsin has experienced an increase in both annual precipitation and heavy rain events, trends which are projected to continue. Projected increases in winter and spring precipitation will pose a continuing risk of spring planting delays, as well as an increased risk of flooding. Snowfall is projected to decline due to warmer temperatures.
Wisconsin Energy Efficiency Expo | May 17, 2018 © 2018 HGA
Source: https://statesummaries.ncics.org/wi#

Single Photo
Wisconsin Energy Efficiency Expo | May 17, 2018 © 2018 HGA
Short title, content & photo
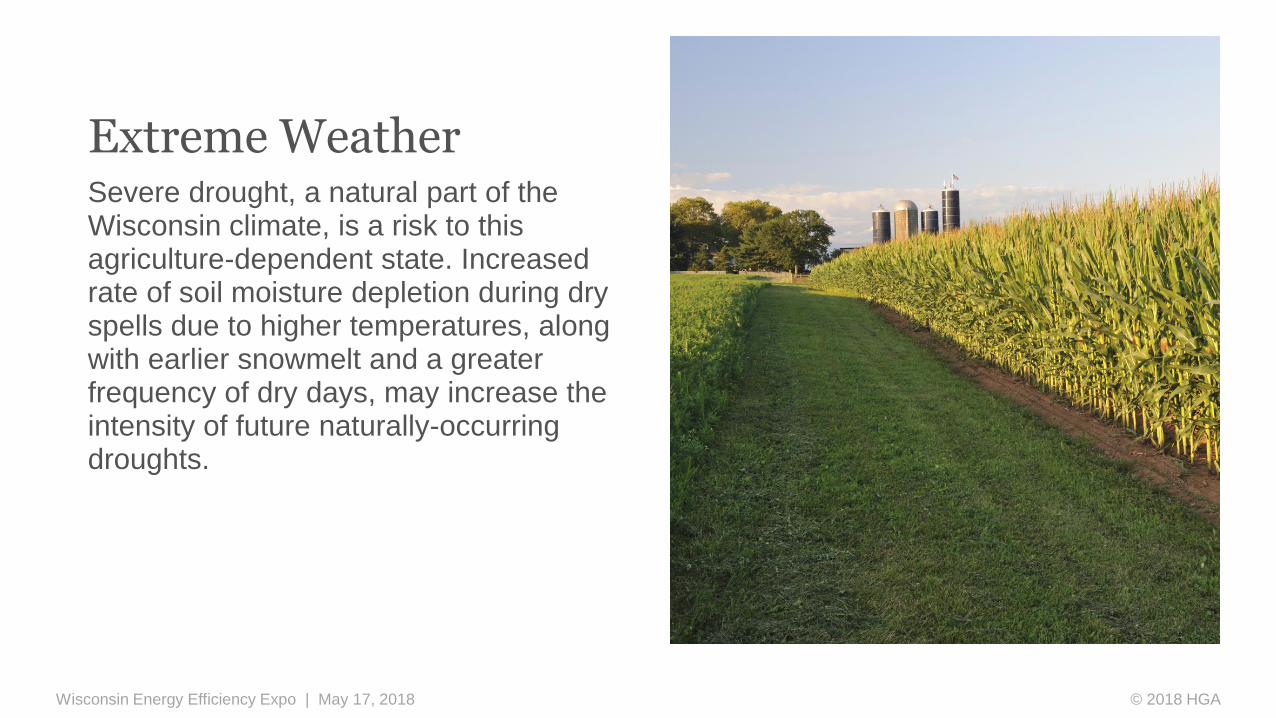
Severe drought, a natural part of the Wisconsin climate, is a risk to this agriculture-dependent state. Increased rate of soil moisture depletion during dry spells due to higher temperatures, along with earlier snowmelt and a greater frequency of dry days, may increase the intensity of future naturally-occurring droughts.
Wisconsin Energy Efficiency Expo | May 17, 2018 © 2018 HGA
Extreme Weather

Short title, content & photo
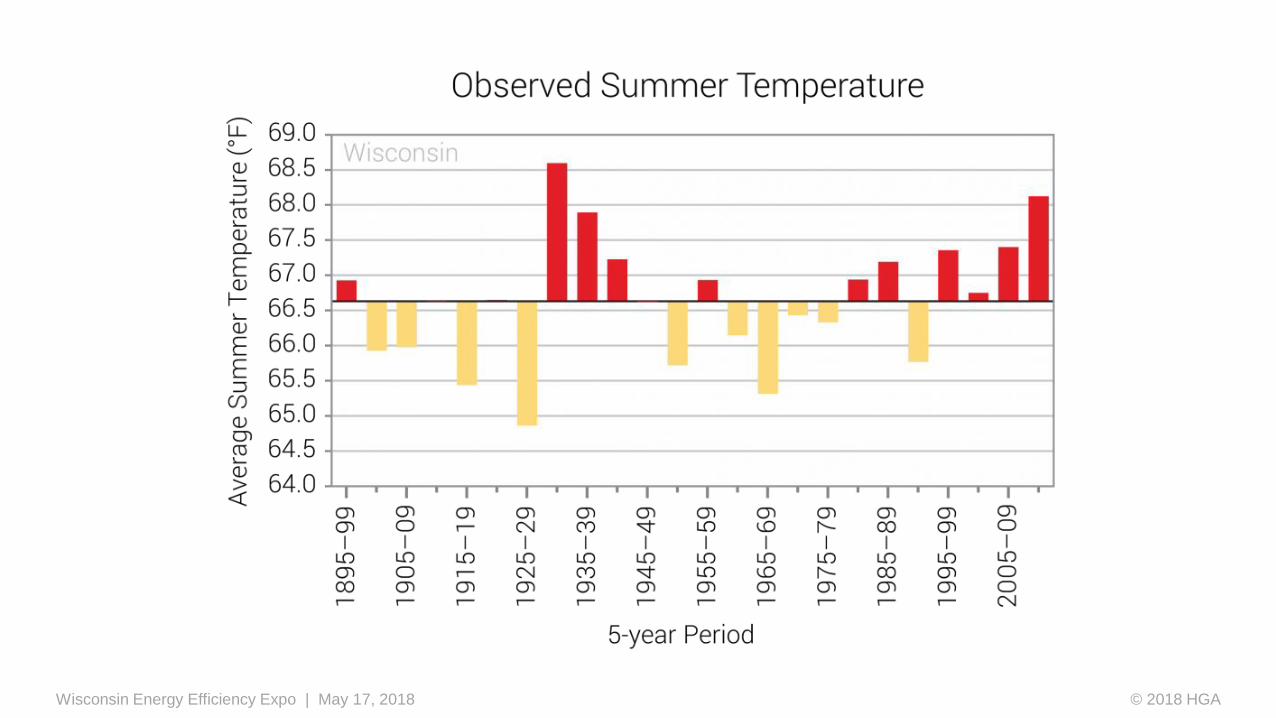
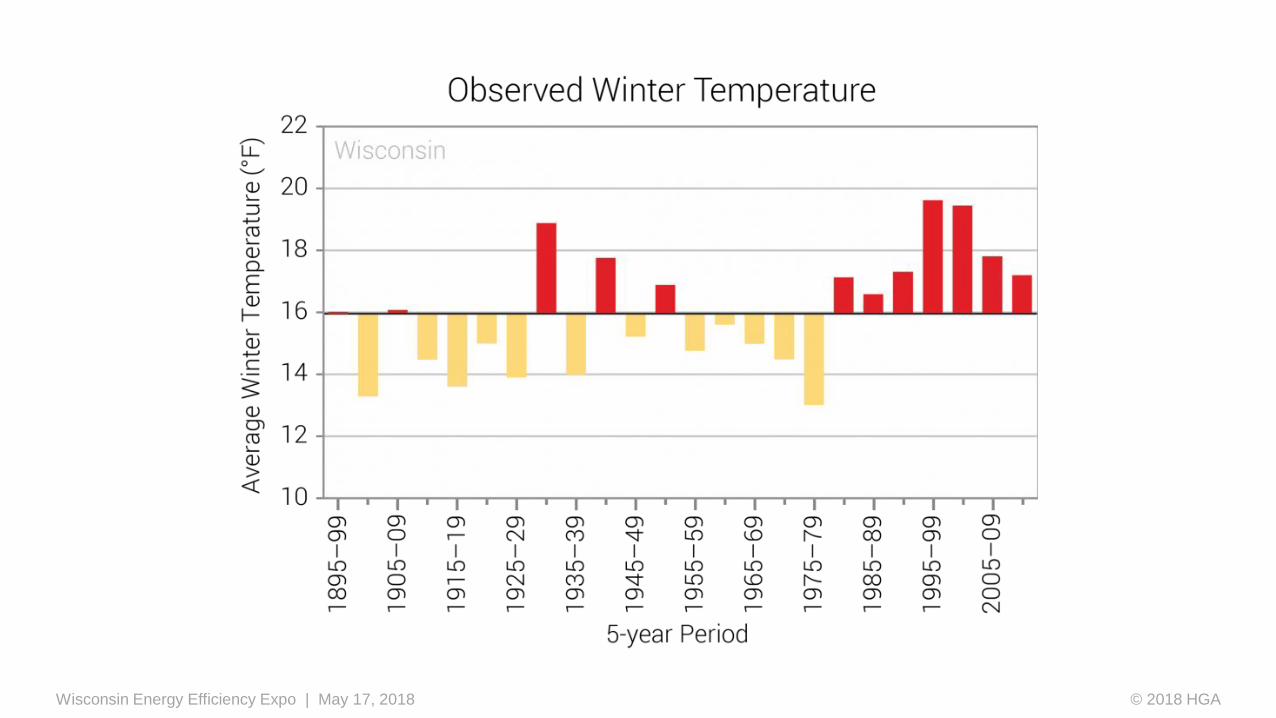
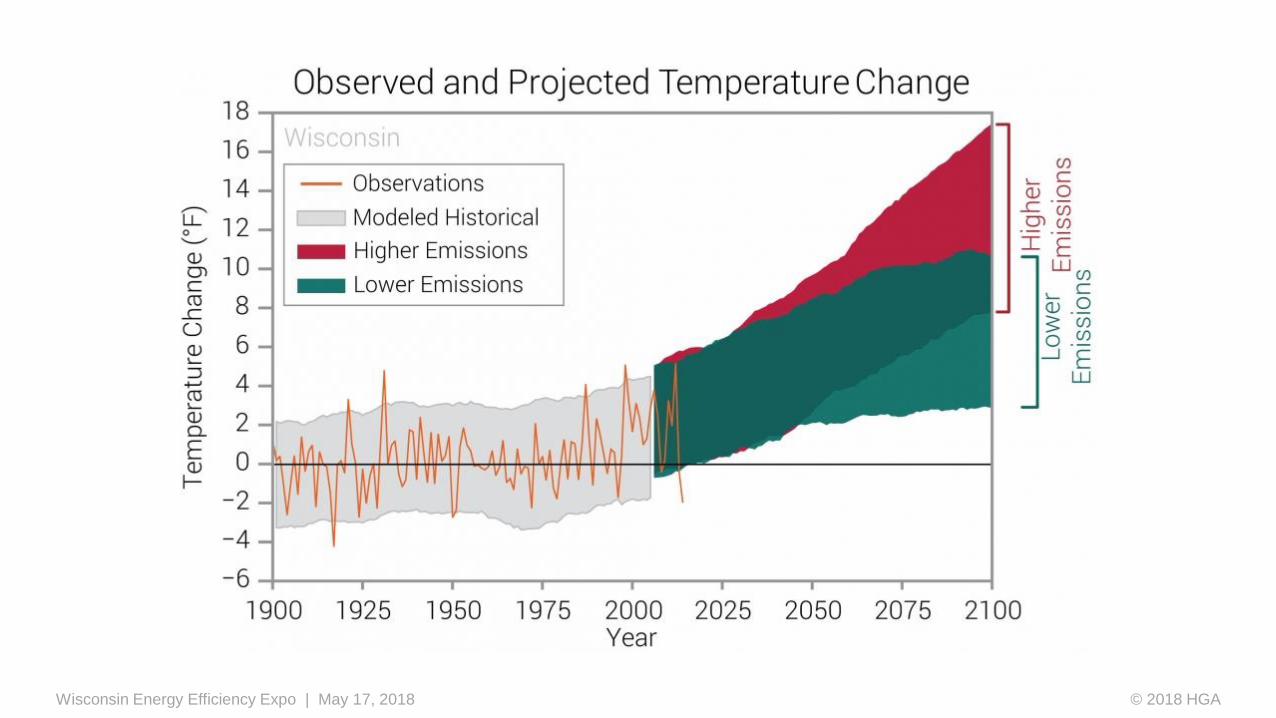
Climate Change Average annual temperature has warmed about 2°F since the beginning of the 20th century. Under a higher emissions pathway, historically unprecedented warming is projected by the end of the 21st century. Extreme heat is of particular concern for densely populated urban areas like Milwaukee, where high temperatures and high humidity can cause dangerous conditions.
Wisconsin Energy Efficiency Expo | May 17, 2018 © 2018 HGA
Source: https://statesummaries.ncics.org/wi#
Single Photo
Wisconsin Energy Efficiency Expo | May 17, 2018 © 2018 HGA
Single Photo
Wisconsin Energy Efficiency Expo | May 17, 2018 © 2018 HGA

https://statesummaries.ncics.org/wi
Title and subhead
Wisconsin Energy Efficiency Expo | May 17, 2018
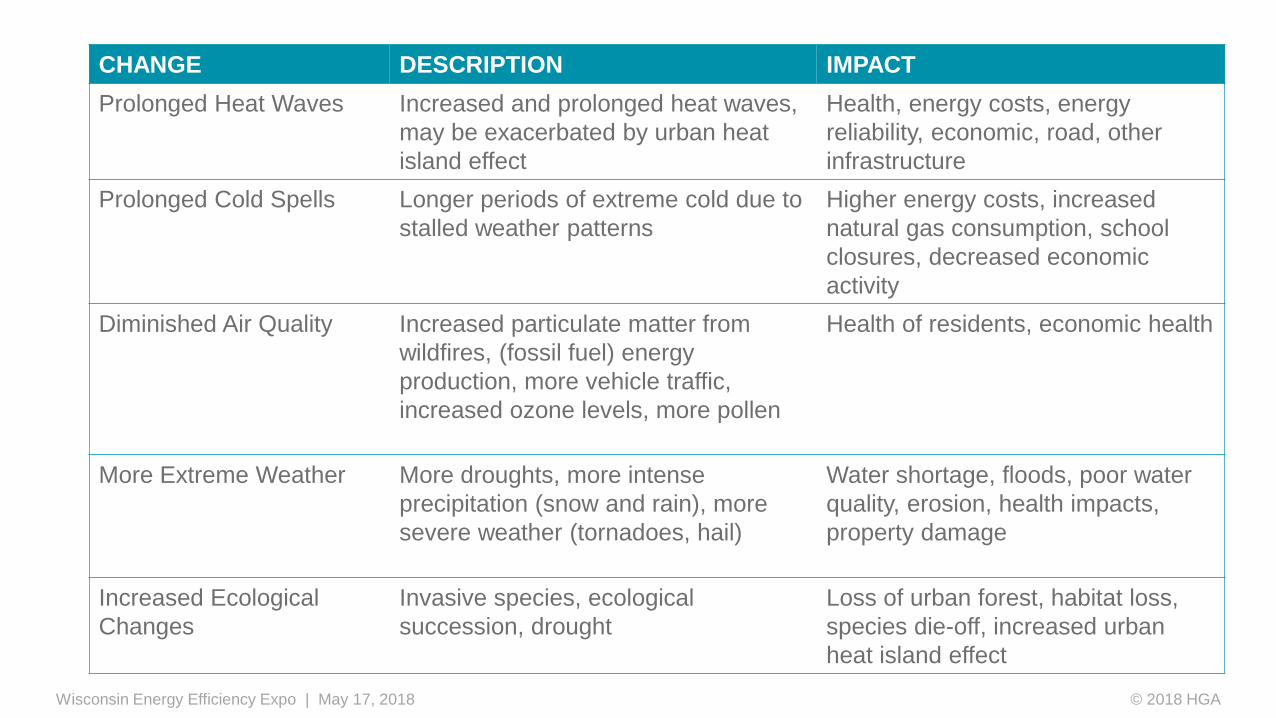
CHANGE DESCRIPTION IMPACT
Prolonged Heat Waves Increased and prolonged heat waves,
may be exacerbated by urban heat
island effect
Health, energy costs, energy
reliability, economic, road, other
infrastructure
Prolonged Cold Spells Longer periods of extreme cold due to
stalled weather patterns
Higher energy costs, increased
natural gas consumption, school
closures, decreased economic
activity
Diminished Air Quality Increased particulate matter from
wildfires, (fossil fuel) energy
production, more vehicle traffic,
increased ozone levels, more pollen
Health of residents, economic health
More Extreme Weather More droughts, more intense
precipitation (snow and rain), more
severe weather (tornadoes, hail)
Water shortage, floods, poor water
quality, erosion, health impacts,
property damage
Increased Ecological
Changes
Invasive species, ecological
succession, drought
Loss of urban forest, habitat loss,
species die-off, increased urban
heat island effect
© 2018 HGA
Single Photo
Wisconsin Energy Efficiency Expo | May 17, 2018 © 2018 HGA
Blank
Wisconsin Energy Efficiency Expo | May 17, 2018
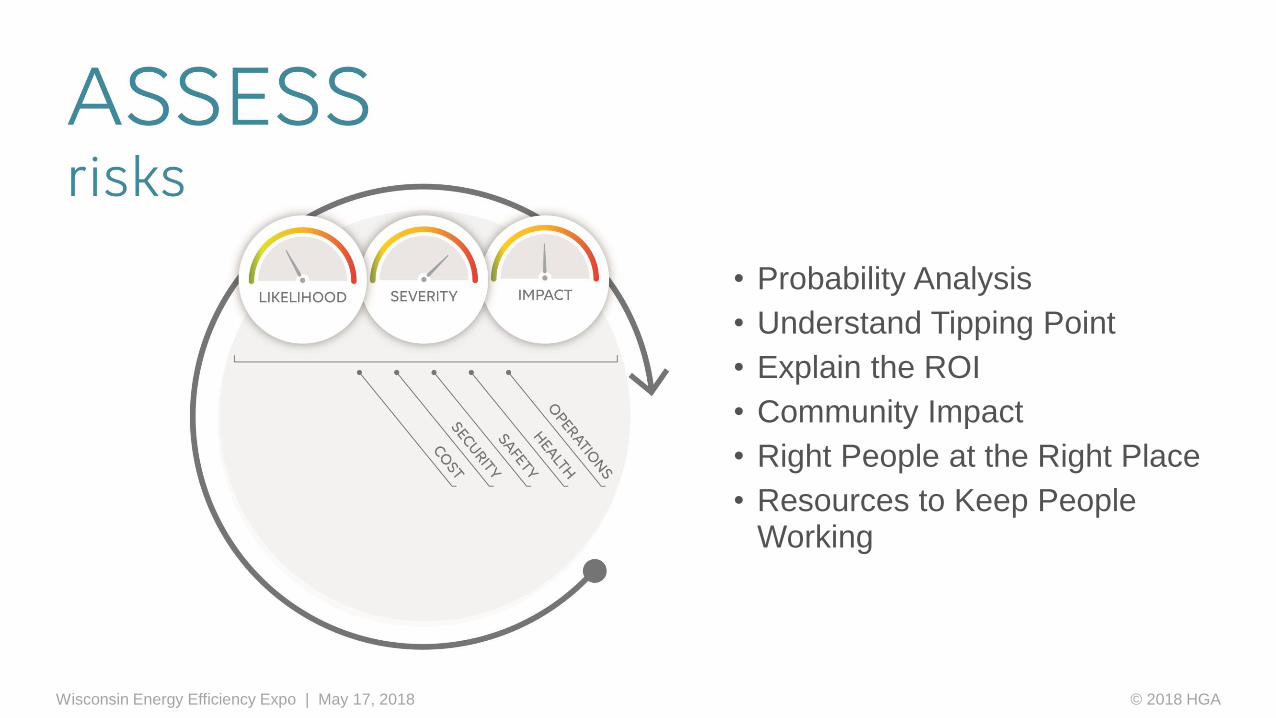
• Probability Analysis
• Understand Tipping Point
• Explain the ROI
• Community Impact
• Right People at the Right Place
• Resources to Keep People Working
© 2018 HGA
Single Photo
Wisconsin Energy Efficiency Expo | May 17, 2018 © 2018 HGA

Single Photo
Wisconsin Energy Efficiency Expo | May 17, 2018 © 2018 HGA

Big Statement - Gray
What risks have you identified as critical to your business? How are you planning for those risks?
Wisconsin Energy Efficiency Expo | May 17, 2018 © 2018 HGA

Single Photo
Wisconsin Energy Efficiency Expo | May 17, 2018 © 2018 HGA

Big Statement - Gray
Aligning Energy Efficiency and Reliability
Wisconsin Energy Efficiency Expo | May 17, 2018 © 2018 HGA

Single Photo
Wisconsin Energy Efficiency Expo | May 17, 2018 © 2018 HGA
Single Photo
Wisconsin Energy Efficiency Expo | May 17, 2018
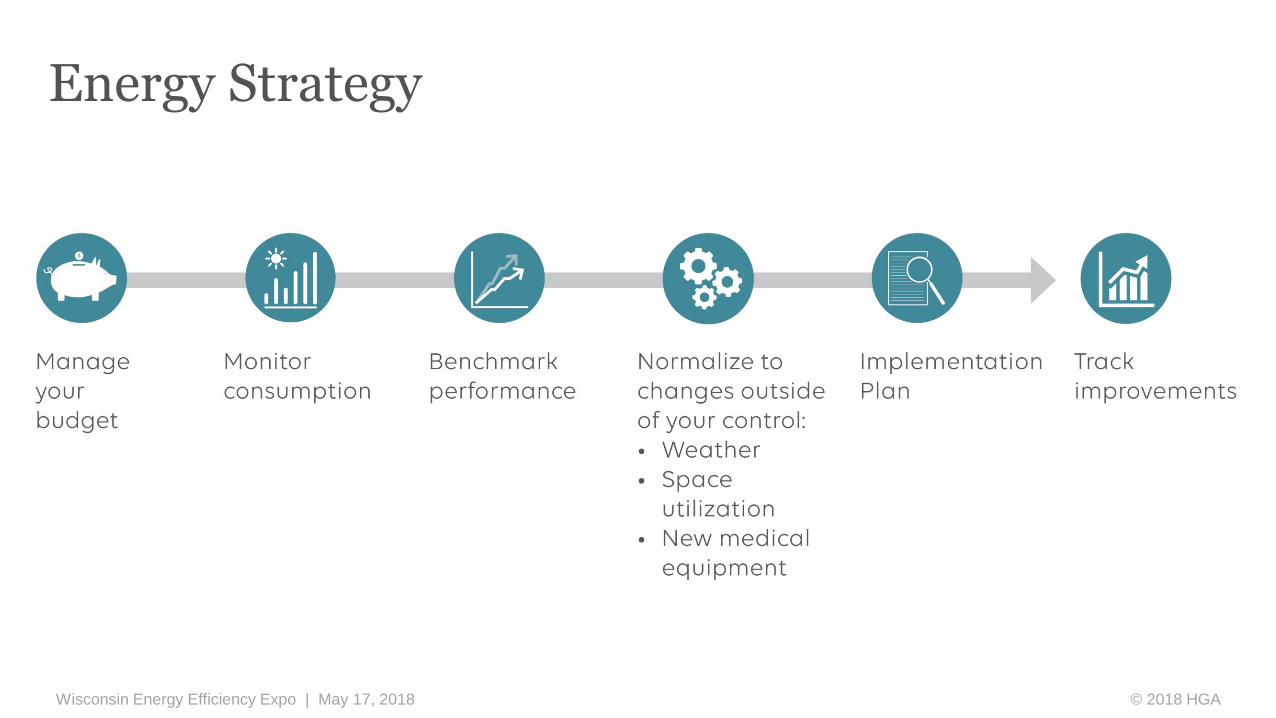
Energy Strategy
© 2018 HGA
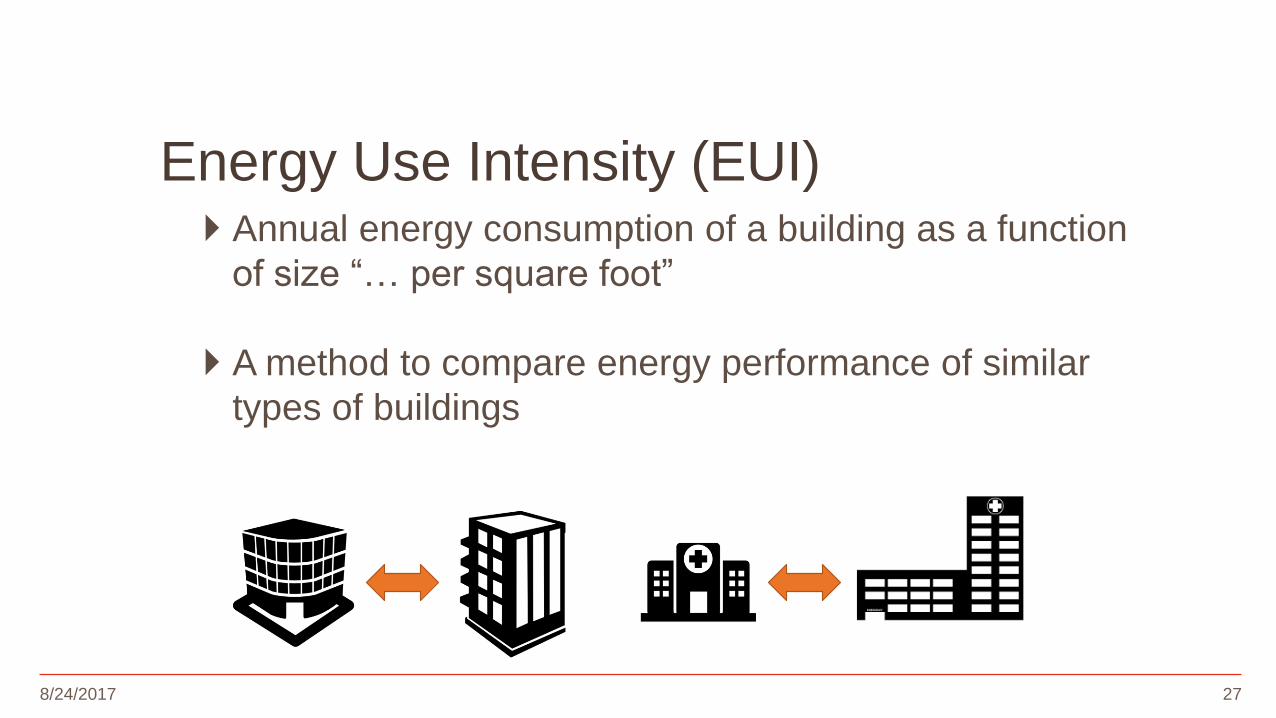
Energy Use Intensity (EUI)
8/24/2017 27
Annual energy consumption of a building as a function
of size “… per square foot”
A method to compare energy performance of similar
types of buildings
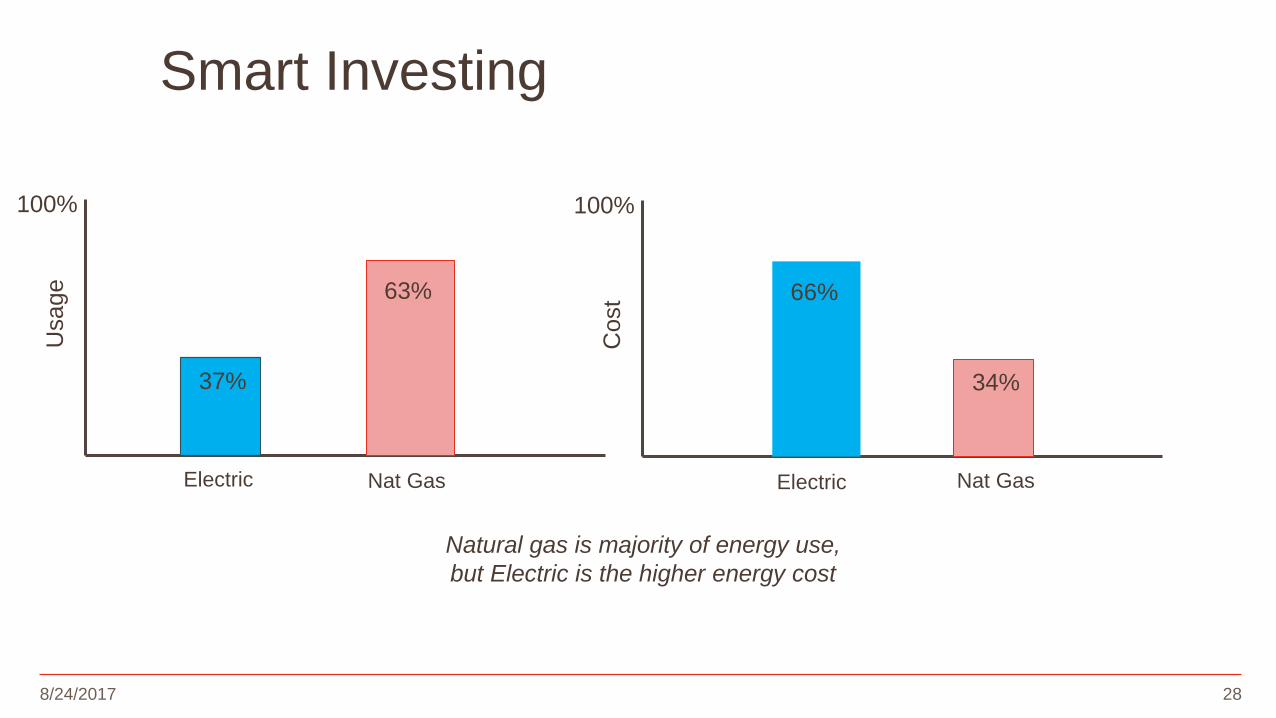
Usage
100%
37%
63%
Electric Nat Gas
Cost
100%
34%
66%
Nat Gas Electric
Smart Investing
Natural gas is majority of energy use,
but Electric is the higher energy cost
8/24/2017 28

Short title, content & photo
Implementation
• Understand parameters
• Evaluate risk
• Utilize decision making tools
• Set log
• A3
• Forced ranking
• Build consensus
Wisconsin Energy Efficiency Expo | May 17, 2018
PRIORITIZE
© 2018 HGA

Big Statement - Gray
CASE STUDY: Metro Health Hospital
Wisconsin Energy Efficiency Expo | May 17, 2018 © 2018 HGA

Short title, content & photo
• The oldest health system in Cleveland, and one of the largest and most comprehensive health systems in Northeast Ohio
• MetroHealth is a center for research and education, an important community anchor, and a provider of world-class care.
• Serves approximately 1.4M patients per year.
• Currently undergoing $950M campus transformation.
• Transformation project includes a new 650,000 SF, 300-bed main hospital to replace two existing towers, a new central utility plant, and loading dock and logistics building
• Target State: 21st Century Process Neutral medical building.
Wisconsin Energy Efficiency Expo | May 17, 2018
METROHEALTH SYSTEM | CLEVELAND, OHIO
© 2018 HGA

Single Photo
Wisconsin Energy Efficiency Expo | May 17, 2018
Planning for Resiliency
© 2018 HGA

Blank
33
HAZARD AND VULNERABILITY ASSESSMENT TOOL
MetroHealth Medical Center "Top 10"
SEVERITY = (MAGNITUDE - MITIGATION)
EVENT
PROBABILITY HUMAN
IMPACT
PROPERTY
IMPACT
BUSINESS
IMPACT
PREPARED-
NESS
INTERNAL
RESPONSE
EXTERNAL
RESPONSE
RISK
Likelihood this
will occur
Possibility of
death or injury
Physical losses
and damages
Interruption of
servicesPreplanning
Time,
effectiveness,
resources
Community/
Mutual Aid staff
and supplies
Relative threat*
SCORE
0 = N/A
1 = Low
2 = M oderate
3 = High
0 = N/A
1 = Low
2 = M oderate
3 = High
0 = N/A
1 = Low
2 = M oderate
3 = High
0 = N/A
1 = Low
2 = M oderate
3 = High
0 = N/A
1 = High
2 = M oderate
3 = Low or none
0 = N/A
1 = High
2 = M oderate
3 = Low or none
0 = N/A
1 = High
2 = M oderate
3 = Low or none
0 - 100%
Information Systems Failure 2.4 1.3 1.3 2.5 2.0 1.0 3.0 49.3%
Severe Thunderstorm 2.9 1.3 1.9 1.5 1.4 1.5 1.5 48.9%
Electrical Failure 2.5 1.0 1.5 2.5 1.7 1.5 1.7 45.8%
Water Failure 2.0 1.4 2.0 2.5 1.8 2.0 1.5 41.5%
Civil Disturbance 2.0 2.0 1.5 2.0 2.0 1.8 1.8 41.2%
Heating, ventilation, and air
conditioning (HVAC) Failure2.5 1.3 2.0 1.5 1.4 1.5 1.2 41.2%
Flood, Internal 2.5 1.0 2.1 2.0 1.3 1.2 1.2 40.7%
Ice Storm 2.0 1.6 2.1 2.2 1.5 1.6 2.0 40.6%
Cold (severe) 2.5 1.6 1.6 1.6 1.0 1.0 1.6 38.9%
Heat (severe) 2.3 1.9 1.3 1.2 1.7 1.3 1.3 36.9%
Protected Information Pursuant to Ohio Revised Code: §§ 2305.24; 2305.252; 2305.253
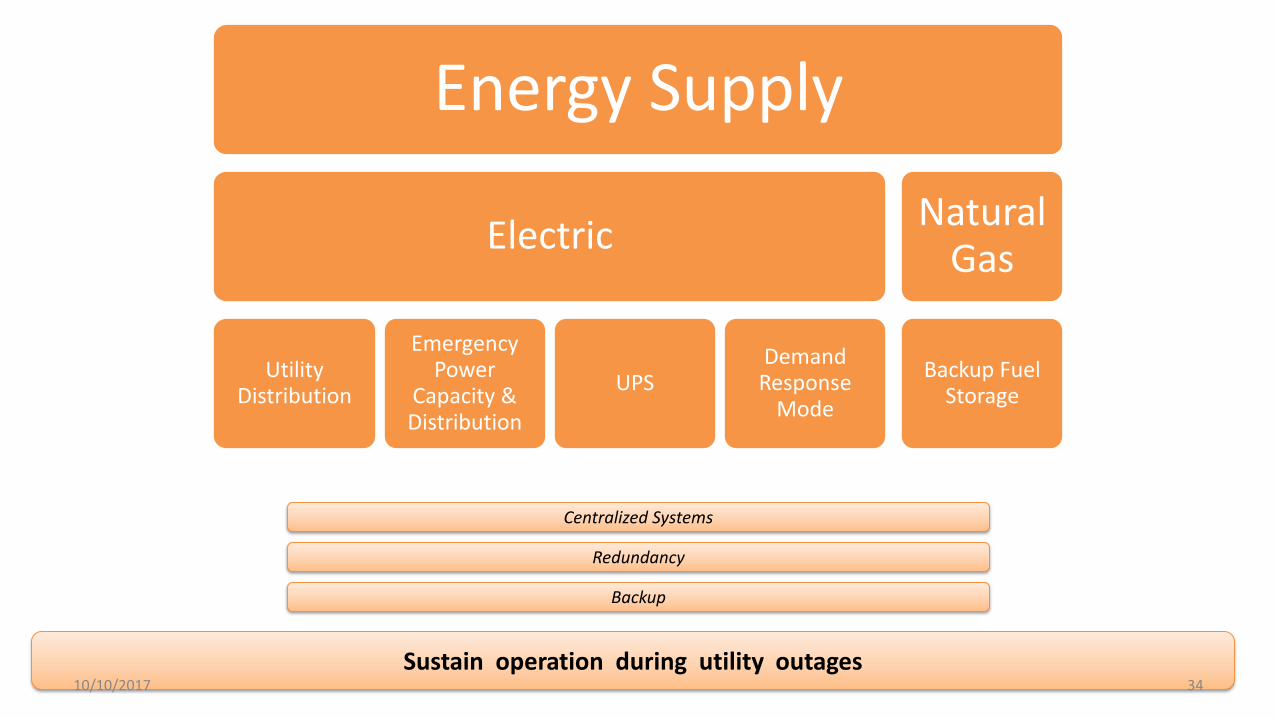
Energy Supply
Electric
Utility Distribution
Emergency Power
Capacity & Distribution
UPS Demand Response
Mode
Natural Gas
Backup Fuel Storage
Centralized Systems
Sustain operation during utility outages
Redundancy
Backup
10/10/2017 34
•
•
•
•
•
•
•
•
•
•
•
•
•
•
•
•
•
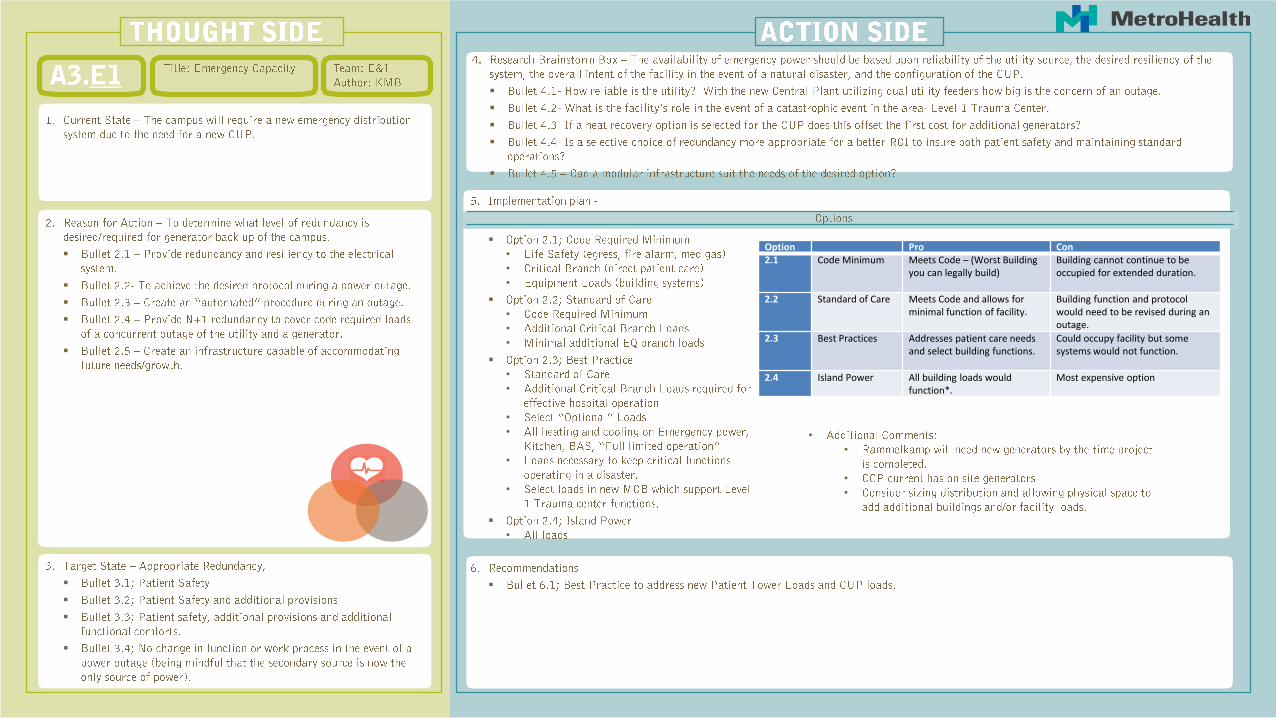
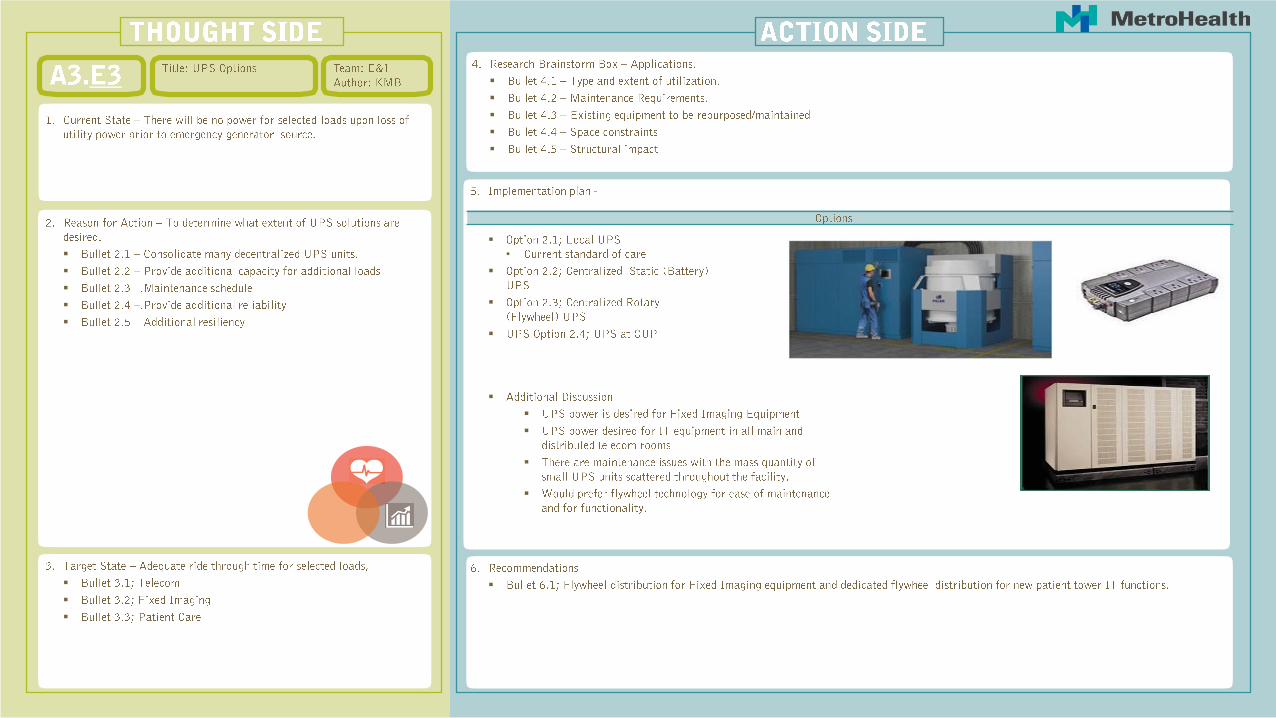
Option Pro Con
2.1 Code Minimum Meets Code – (Worst Building you can legally build)
Building cannot continue to be occupied for extended duration.
2.2 Standard of Care Meets Code and allows for minimal function of facility.
Building function and protocol would need to be revised during an outage.
2.3 Best Practices Addresses patient care needs and select building functions.
Could occupy facility but some systems would not function.
2.4 Island Power All building loads would function*.
Most expensive option
•
•
•
•
•
•
•
•
•

Energy Supply
Electric
Utility Distribution
Emergency Power
Capacity & Distribution
UPS Demand Response
Mode
Natural Gas
Backup Fuel Storage
Centralized Systems
Sustain operation during utility outages
Redundancy
Backup
10/10/2017 37

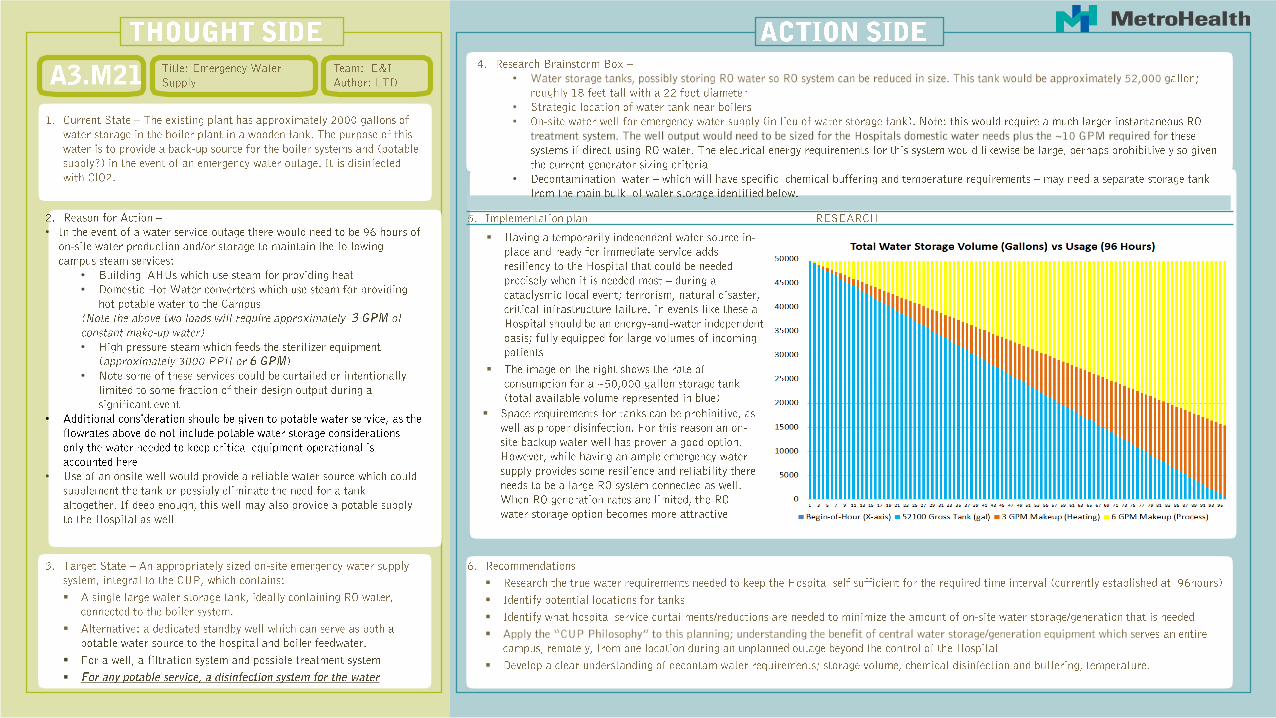
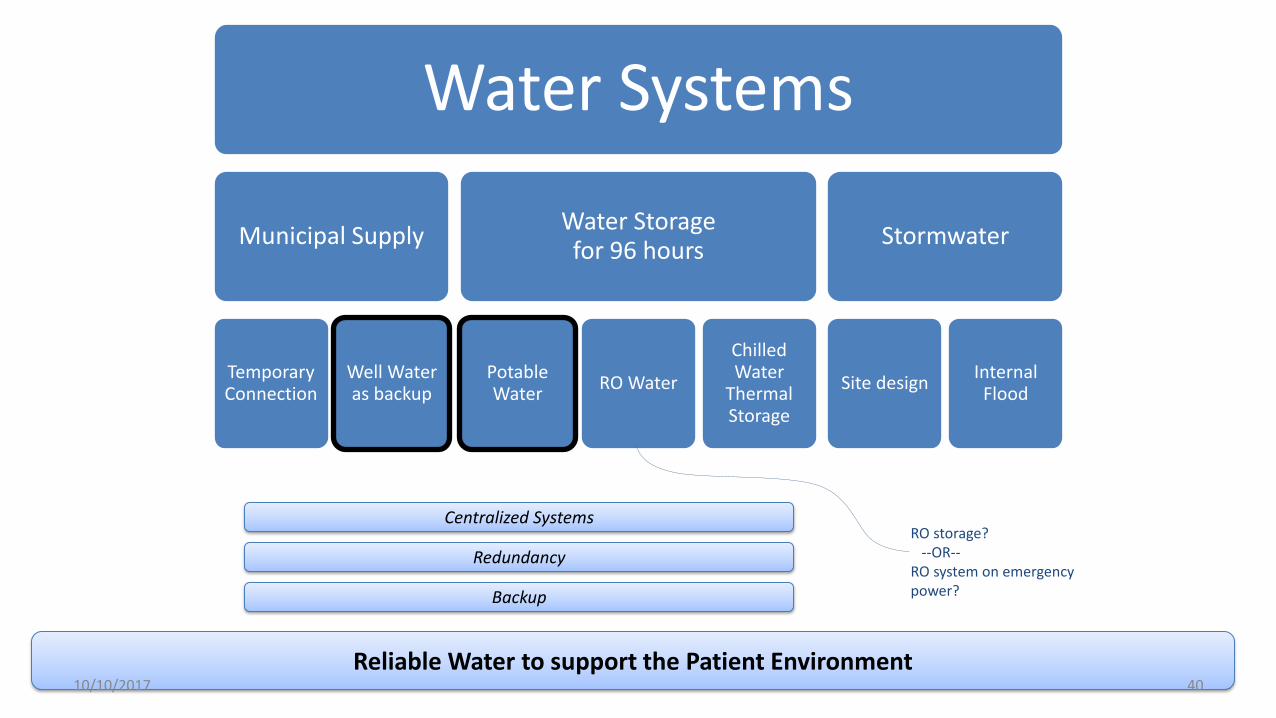
Water Systems
Municipal Supply
Temporary Connection
Well Water as backup
Water Storage for 96 hours
Potable Water
RO Water
Chilled Water
Thermal Storage
Stormwater
Site design Internal
Flood
Centralized Systems
Reliable Water to support the Patient Environment
Redundancy
Backup
10/10/2017 38
RO storage? --OR-- RO system on emergency power?
•
•
•
•
•
•
•
•
•
•
•
•
•
•
•
Water Systems
Municipal Supply
Temporary Connection
Well Water as backup
Water Storage for 96 hours
Potable Water
RO Water
Chilled Water
Thermal Storage
Stormwater
Site design Internal
Flood
Centralized Systems
Reliable Water to support the Patient Environment
Redundancy
Backup
10/10/2017 40
RO storage? --OR-- RO system on emergency power?
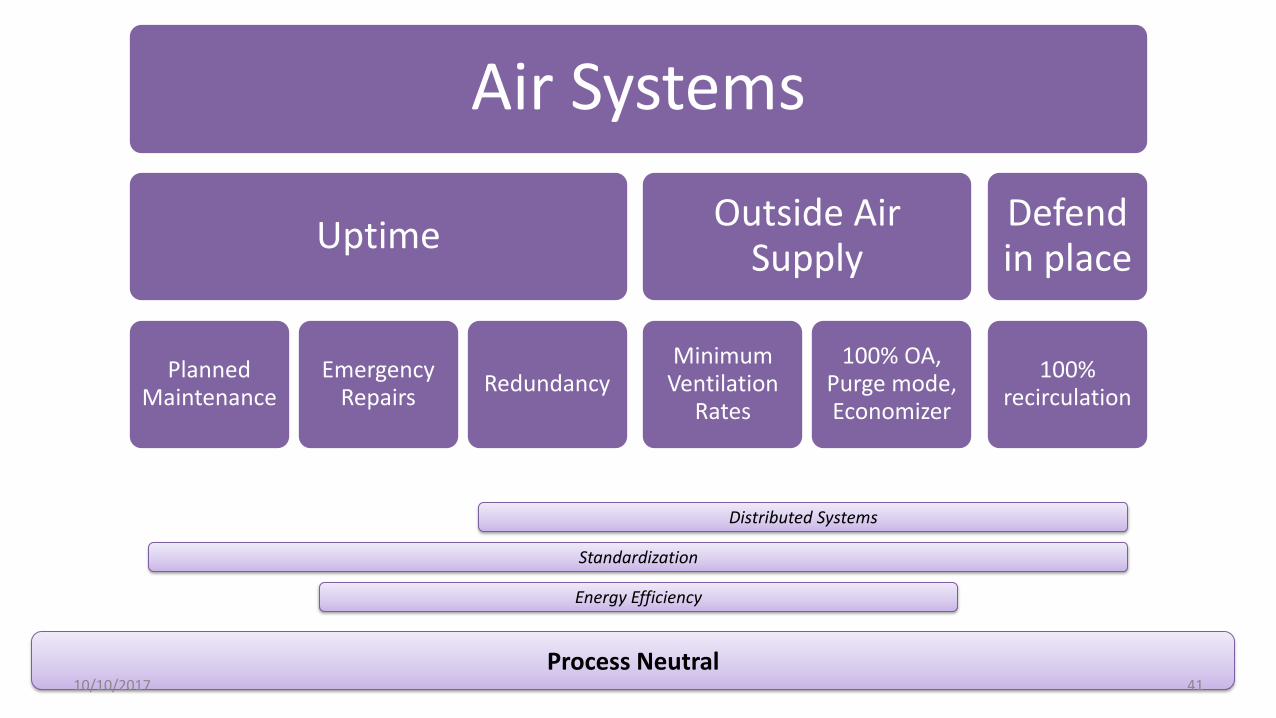
Air Systems
Uptime
Planned Maintenance
Emergency Repairs
Redundancy
Outside Air Supply
Minimum Ventilation
Rates
100% OA, Purge mode, Economizer
Defend in place
100% recirculation
Distributed Systems
Process Neutral
Standardization
Energy Efficiency
10/10/2017 41

Packaged Air Handling Unit located close to area of service
Air capacities up to 20,000 CFM
Maintenance performed indoors
Vertical expansion without equipment relocation
Requires program space with access for outside air and relief air louvers
Redundancy options
Distributed Air Handling Units

ENERGY STAR Target for the Hospital
Baseline: An energy cost budget model shall exceed the baseline performance rating of
ASHRAE Standard 90.1- 2010 by 30% or in decrements as developed and accepted by the
Owner.
Metrics for Energy in Hospitals:
US National Average: 227 kBTU/sf
Ohio average: 253 kBTU/sf
ENERGY STAR Rating of 75: 219 kBTU/sf
Ohio Energy Code ASHRAE 90.1-2010: 152 kBTU/sf
ASHRAE Advanced Energy Design Guide: 123 kBTU/sf
30% reduction from ASHRAE 90.1-2010: 106 kBTU/sf
8/24/2017 43
19%
227 253
219
152 123 106
US NATIONAL MEDIAN(CBECS 2003 BASELINE)
AVERAGE FACILITY(CBECS 2003 BASELINE)
ENERGY STARRATING = 75
OHIO ENERGY CODE COMPLIANCE METROHEALTH PROJECT-SPECIFICGOAL
30% SAVINGSBEYOND ASHRAE 90.1-2010
Site
EU
I (kB
tu/f
t2)

•
•
•
•
•
•
•
•
•
Short title, content & photo
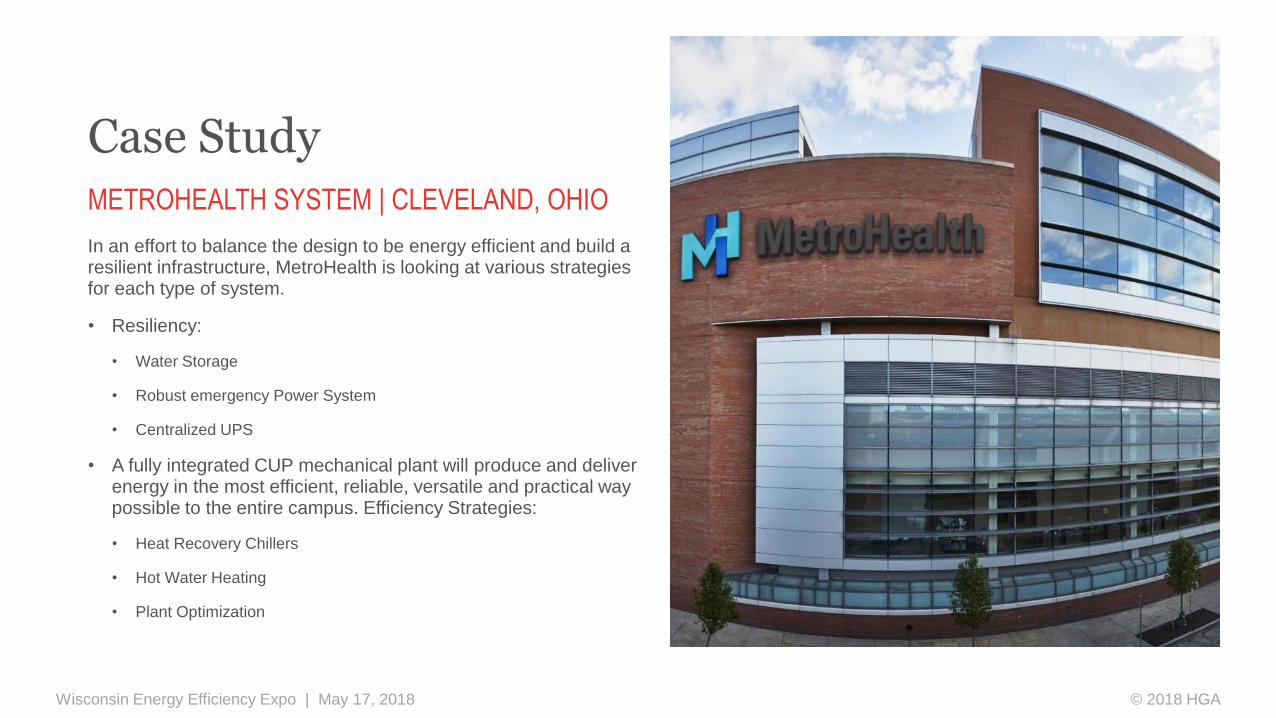
Case Study
In an effort to balance the design to be energy efficient and build a resilient infrastructure, MetroHealth is looking at various strategies for each type of system.
• Resiliency:
• Water Storage
• Robust emergency Power System
• Centralized UPS
• A fully integrated CUP mechanical plant will produce and deliver energy in the most efficient, reliable, versatile and practical way possible to the entire campus. Efficiency Strategies:
• Heat Recovery Chillers
• Hot Water Heating
• Plant Optimization
Wisconsin Energy Efficiency Expo | May 17, 2018
METROHEALTH SYSTEM | CLEVELAND, OHIO
© 2018 HGA
Thank You
Closing Slide - Gray
Rick Hombsch | PE, LEED AP BD+C
414.278.3364 | [email protected]
hga.com